banking, finance, and insurance - census.gov. census bureau, statistical abstract of the united...
TRANSCRIPT
U.S. Census Bureau, Statistical Abstract of the United States: 1999
Banking, Finance, and Insurance 513
Section 16
Banking, Finance, and Insurance
This section presents data on the Nation’sfinances, various types of financial institu-tions, money and credit, securities, and in-surance. The primary sources of these dataare publications of several departments ofthe Federal Government, especially theTreasury Department, and independentagencies such as the Federal Deposit Insur-ance Corporation, the Federal Reserve Sys-tem, and the Securities and Exchange Com-mission. National data on insurance areavailable primarily from private organiza-tions, such as the American Council of LifeInsurance.
Flow of funds—The flow of funds ac-counts of the Federal Reserve System (seeTables 797 to 800) bring together statisticson all of the major forms of financial instru-ments to present an economy-wide view ofasset and liability relationships. In flowform, the accounts relate borrowing andlending to one another and to the nonfi-nancial activities that generate income andproduction. Each claim outstanding is in-cluded simultaneously as an asset of thelender and as a liability of the debtor. Theaccounts also indicate the balance betweenasset totals and liability totals over theeconomy as a whole. Several publicationsof the Board of Governors of the FederalReserve System contain information on theflow of funds accounts: Summary data onflows and outstandings, in the Federal Re-serve Bulletin, Flow of Funds Accounts ofthe United States (quarterly), and AnnualStatistical Digest; and concepts and organi-zation of the accounts, in Guide to the Flowof Funds Accounts (1993). Data are alsoavailable at the Board’s web site<http://www.federalreserve.gov/releases>.
Banking system—Banks in this countryare organized under the laws of both thestates and the Federal Government and areregulated by several bank supervisoryagencies. National banks are supervised bythe Comptroller of the Currency. Reports of
Condition have been collected from na-tional banks since 1863. Summaries ofthese reports are published in theComptroller’s Annual Report, which alsopresents data on the structure of the na-tional banking system.
The Federal Reserve System was estab-lished in 1913 to exercise central bankingfunctions, some of which are shared withthe U.S. Treasury. It includes national banksand such state banks that voluntarily jointhe system. Statements of state bank mem-bers are consolidated by the Board of Gov-ernors of the Federal Reserve System withdata for national banks collected by theComptroller of the Currency into totals forall member banks of the system. Balancesheet data for member banks and othercommercial banks are published quarterlyin the Federal Reserve Bulletin. The FederalDeposit Insurance Corporation (FDIC), es-tablished in 1933, insures each depositorup to $100,000. Major item balance sheetand income data for all commercial banksare published in the FDIC Quarterly Bank-ing Profile. This publication is also avail-able on the Internet at the following ad-dress: <http://www.fdic.gov>. Balancesheet and income data for individual insti-tutions are also available at this site in theInstitution Directory (ID) system.
The FDIC is the primary Federal regulatorof state-chartered banks that are not mem-bers of the Federal Reserve System and ofmost savings banks insured by the Bank In-surance Fund (BIF). The agency also hascertain backup supervisory authority, forsafety and soundness purposes, over state-chartered banks that are members of theFederal Reserve System, national banks,and savings associations.
Savings institutions—Savings institu-tions are primarily involved in credit exten-sion in the form of mortgage loans. Statis-tics on savings institutions are collected by
U.S. Census Bureau, Statistical Abstract of the United States: 1999
514 Banking, Finance, and Insurance
the U.S. Office of Thrift Supervision and theFDIC. The Financial Institutions Reform, Re-covery, and Enforcement Act of 1989(FIRREA) authorized the establishment ofthe Resolution Trust Corporation (RTC)which was responsible for the disposal ofassets from failed savings institutions.FIRREA gave the FDIC the job of managingthe Federal deposit insurance fund for sav-ings institutions (SAIF=Savings AssociationInsurance Fund). Major balance sheet andincome data for all insured savings institu-tions are published in the FDIC QuarterlyBanking Profile.
Credit unions—Federally chartered creditunions are under the supervision of the Na-tional Credit Union Administration. State-chartered credit unions are supervised bythe respective state supervisory authori-ties. The Administration publishes compre-hensive program and statistical informationon all Federal and federally insured statecredit unions in the Annual Report of theNational Credit Union Administration. De-posit insurance (up to $100,000 per ac-count) is provided to members of all Fed-eral and those state credit unions that arefederally-insured by the National CreditUnion Share Insurance Fund which was es-tablished in 1970. Deposit insurance forstate chartered credit unions is also avail-able in some states under private or state-administered insurance programs.
Other credit agencies—Insurance com-panies, finance companies dealing prima-rily in installment sales financing, and per-sonal loan companies represent importantsources of funds for the credit market. Sta-tistics on loans, investments, cash, etc., oflife insurance companies are publishedprincipally by the American Council of LifeInsurance in its Life Insurance Fact Bookand in the Federal Reserve Bulletin. Con-sumer credit data are published currentlyin the Federal Reserve Bulletin.
Government corporations and creditagencies make available credit of speci-fied types or to specified groups of pri-vate borrowers, either by lending directlyor by insuring or guaranteeing loansmade by private lending institutions.
Data on operations of government creditagencies, along with other governmentcorporations, are available in reports ofindividual agencies; data on their debtoutstanding are published in the FederalReserve Bulletin.
Currency—Currency, including coin andpaper money, represents about 42 percentof all media of exchange in the UnitedStates, with most payments made bycheck. All currency is now issued by theFederal Reserve Banks.
Securities—The Securities and ExchangeCommission (SEC) was established in 1934to protect the interests of the public andinvestors against malpractices in the secu-rities and financial markets and to providethe fullest possible disclosure of informa-tion regarding securities to the investingpublic. Statistical data are published in theSEC Annual Report.
Insurance—Insuring companies, which areregulated by the various states or the Dis-trict of Columbia, are classified as eitherlife or property. Companies that underwriteaccident and health insurance only andthose that underwrite accident and healthinsurance in addition to one or more prop-erty lines are included with property insur-ance. Insuring companies, other than thoseclassified as life, are permitted to under-write one or more property lines providedthey are so licensed and have the neces-sary capital or surplus.
There are a number of published sourcesfor statistics on the various classes of in-surance—life, health, fire, marine, and ca-sualty. Organizations representing certainclasses of insurers publish reports forthese classes. Among them are the annualcommercial publishers, such as The Na-tional Underwriter Company whose ArgusChart (annual) contains financial and oper-ating data for individual health and acci-dent insurance companies, including BlueCross and Blue Shield Plans. The AmericanCouncil of Life Insurance publishes statis-tics on life insurance purchases, owner-ship, benefit payments, and assets in itsLife Insurance Fact Book.
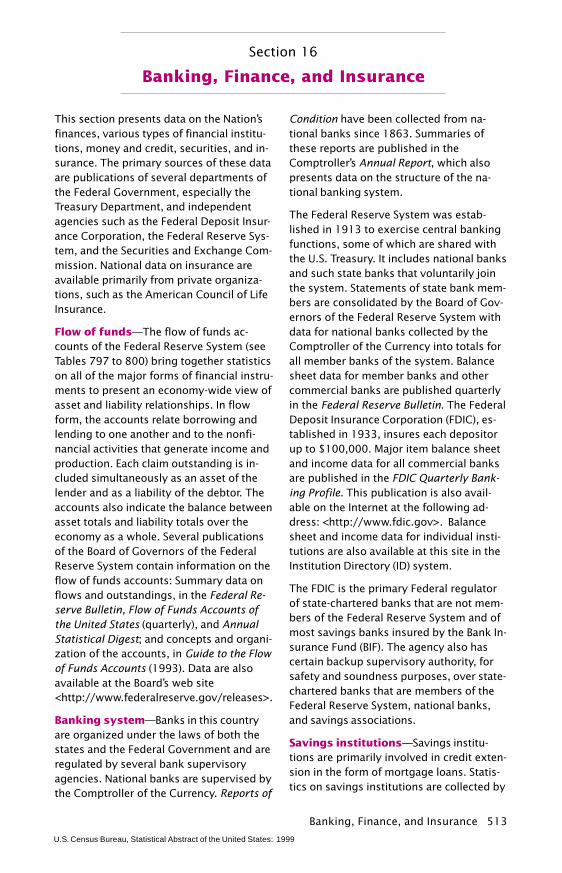
No. 794. Gross Domestic Product in Finance, Insurance, and Real Estate,in Current and Real (1992) Dollars: 1990 to 1996
[In billions of dollars, except percent (1,024.1 represents $1,024,100,000,000). For definition of gross domestic product, seetext, Section 14, Income. Based on 1987 Standard Industrial Classification; see text, Section 17, Business]
IndustryCurrent dollars Chained (1992) dollars 1
1990 1994 1995 1996 1990 1994 1995 1996
Finance, insurance, real estate, total . . . . . 1,024.1 1,267.6 1,361.3 1,448.5 1,109.0 1,196.9 1,231.1 1,258.5Percent of gross domestic product . . . . . . 17.8 18.2 18.7 19.0 18.1 18.1 18.3 18.2
Depository institutions . . . . . . . . . . . . . . . . . . 169.2 207.4 229.6 247.4 214.9 197.0 193.4 192.0Nondepository institutions . . . . . . . . . . . . . . . 21.5 36.1 39.0 49.9 25.6 33.9 32.6 35.4Security and commodity brokers . . . . . . . . . . . 39.7 78.5 79.5 90.0 41.2 83.0 81.9 92.2Insurance carriers. . . . . . . . . . . . . . . . . . . . . 69.3 108.8 126.5 136.6 70.2 91.3 105.1 110.1Insurance agents, brokers, and service . . . . . . 37.1 45.0 47.1 50.4 40.8 41.6 42.1 43.6Real estate . . . . . . . . . . . . . . . . . . . . . . . . . 671.9 802.9 842.7 886.2 706.8 758.3 775.6 793.3
Nonfarm housing services . . . . . . . . . . . . . 492.2 607.3 642.8 673.3 525.6 573.3 587.9 596.8Other real estate. . . . . . . . . . . . . . . . . . . . 179.6 195.6 199.9 212.9 179.8 185.0 187.7 196.6
Holding and other investment offices . . . . . . . . 15.5 -11.1 -3.2 -12.0 12.3 12.9 12.6 12.6
1 See text, Section 14, Income.
Source: U.S. Bureau of Economic Analysis, Survey of Current Business, May 1998.
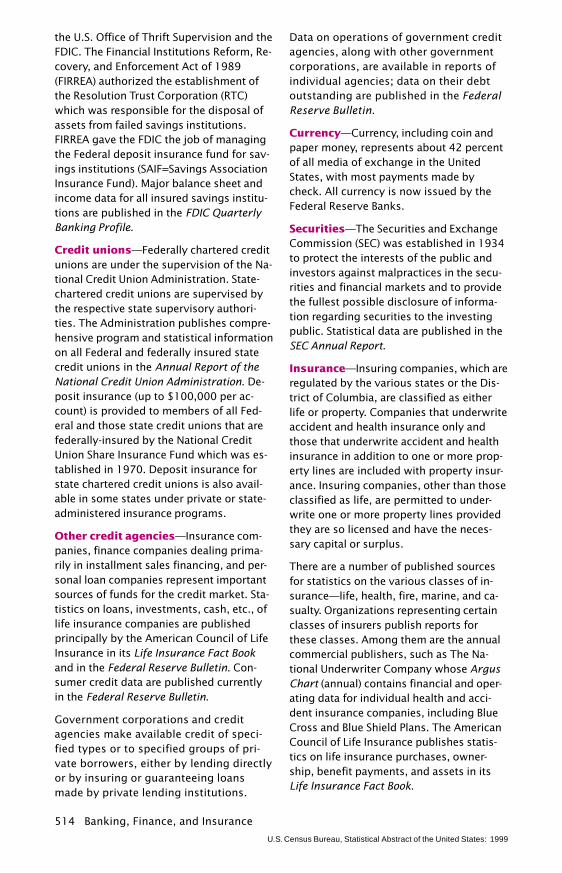
No. 795. Finance, Insurance, and Real Estate Establishments—Number,Revenues, Payroll, and Employees: 1992 and 1997
[Preliminary (586 represents 586,000). Covers only establishments with payroll]
Kind of business1987SIC
code 1
Establishments(1,000)
Revenue(bil. dol.)
Annual payroll(bil. dol.)
Paid employees(1,000)
1992 1997 1992 1997 1992 1997 1992 1997
Finance, insurance, real estate . . (H) 586 (S) 1,832 (S) 212 (S) 6,510 (S)
Depository institutions . . . . . . . . . . . 60 105 110 532 699 57 77 2,100 2,130Nondepository institutions . . . . . . . . . 61 39 52 135 212 15 24 446 589Security and commodity brokers . . . . 62 31 48 109 250 34 67 406 643Insurance carriers . . . . . . . . . . . . . . 63 39 41 796 988 51 66 1,517 1,587Insurance agents, brokers, andservice. . . . . . . . . . . . . . . . . . . . . 64 122 131 52 74 19 26 636 720
Real estate . . . . . . . . . . . . . . . . . . 65 229 254 142 191 26 35 1,231 1,394Holding and other investment offices. . 67 20 (S) 66 (S) 9 (S) 174 (S)
S Figure does not meet publication standards. 1 Standard Industrial Classification; see text, Section 17, Business.
Source: U.S. Census Bureau, 1997 Economic Census, Core Business Statistics Series, Advance, EC97X-CS1.
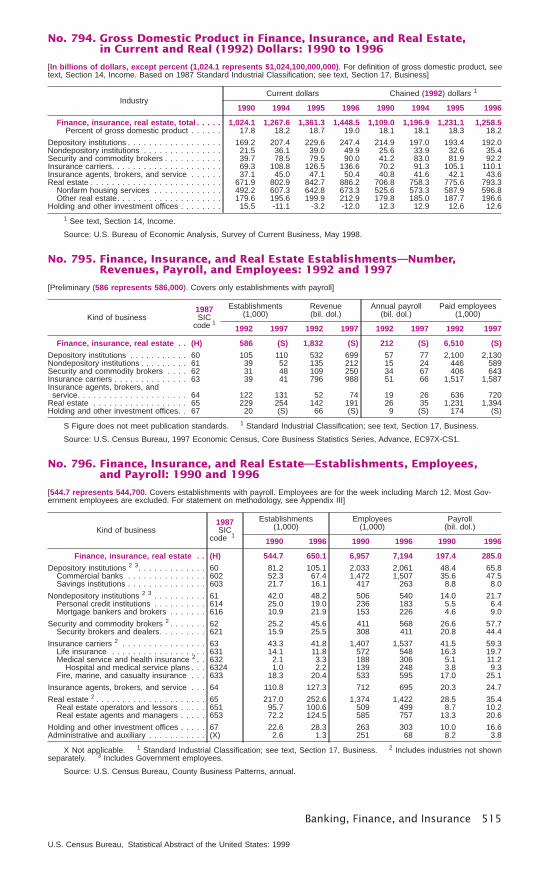
No. 796. Finance, Insurance, and Real Estate—Establishments, Employees,and Payroll: 1990 and 1996
[544.7 represents 544,700. Covers establishments with payroll. Employees are for the week including March 12. Most Gov-ernment employees are excluded. For statement on methodology, see Appendix III]
Kind of business1987SIC
code 1
Establishments(1,000)
Employees(1,000)
Payroll(bil. dol.)
1990 1996 1990 1996 1990 1996
Finance, insurance, real estate . . (H) 544.7 650.1 6,957 7,194 197.4 285.0
Depository institutions 2 3. . . . . . . . . . . . . 60 81.2 105.1 2,033 2,061 48.4 65.8Commercial banks . . . . . . . . . . . . . . . 602 52.3 67.4 1,472 1,507 35.6 47.5Savings institutions . . . . . . . . . . . . . . . 603 21.7 16.1 417 263 8.8 8.0
Nondepository institutions 2 3 . . . . . . . . . . 61 42.0 48.2 506 540 14.0 21.7Personal credit institutions . . . . . . . . . . 614 25.0 19.0 236 183 5.5 6.4Mortgage bankers and brokers . . . . . . . 616 10.9 21.9 153 226 4.6 9.0
Security and commodity brokers 2 . . . . . . . 62 25.2 45.6 411 568 26.6 57.7Security brokers and dealers. . . . . . . . . 621 15.9 25.5 308 411 20.8 44.4
Insurance carriers 2 . . . . . . . . . . . . . . . . 63 43.3 41.8 1,407 1,537 41.5 59.3Life insurance . . . . . . . . . . . . . . . . . . 631 14.1 11.8 572 548 16.3 19.7Medical service and health insurance 2 . . 632 2.1 3.3 188 306 5.1 11.2
Hospital and medical service plans . . . 6324 1.0 2.2 139 248 3.8 9.3Fire, marine, and casualty insurance . . . 633 18.3 20.4 533 595 17.0 25.1
Insurance agents, brokers, and service . . . 64 110.8 127.3 712 695 20.3 24.7
Real estate 2 . . . . . . . . . . . . . . . . . . . . . 65 217.0 252.6 1,374 1,422 28.5 35.4Real estate operators and lessors . . . . . 651 95.7 100.6 509 499 8.7 10.2Real estate agents and managers . . . . . 653 72.2 124.5 585 757 13.3 20.6
Holding and other investment offices . . . . . 67 22.6 28.3 263 303 10.0 16.6Administrative and auxiliary . . . . . . . . . . . (X) 2.6 1.3 251 68 8.2 3.8
X Not applicable. 1 Standard Industrial Classification; see text, Section 17, Business. 2 Includes industries not shownseparately. 3 Includes Government employees.
Source: U.S. Census Bureau, County Business Patterns, annual.
Banking, Finance, and Insurance 515
U.S. Census Bureau, Statistical Abstract of the United States: 1999
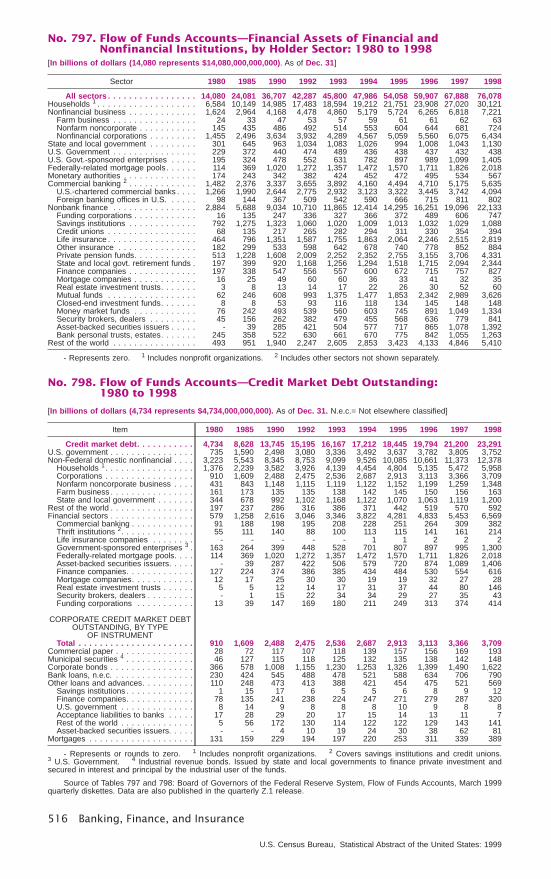
No. 797. Flow of Funds Accounts—Financial Assets of Financial andNonfinancial Institutions, by Holder Sector: 1980 to 1998
[In billions of dollars (14,080 represents $14,080,000,000,000). As of Dec. 31]
Sector 1980 1985 1990 1992 1993 1994 1995 1996 1997 1998
All sectors . . . . . . . . . . . . . . . . . 14,080 24,081 36,707 42,287 45,800 47,986 54,058 59,907 67,888 76,078Households 1 . . . . . . . . . . . . . . . . . . . 6,584 10,149 14,985 17,483 18,594 19,212 21,751 23,908 27,020 30,121Nonfinancial business . . . . . . . . . . . . . 1,624 2,964 4,168 4,478 4,860 5,179 5,724 6,265 6,818 7,221
Farm business . . . . . . . . . . . . . . . . 24 33 47 53 57 59 61 61 62 63Nonfarm noncorporate . . . . . . . . . . . 145 435 486 492 514 553 604 644 681 724Nonfinancial corporations . . . . . . . . . 1,455 2,496 3,634 3,932 4,289 4,567 5,059 5,560 6,075 6,434
State and local government . . . . . . . . . 301 645 963 1,034 1,083 1,026 994 1,008 1,043 1,130U.S. Government . . . . . . . . . . . . . . . . 229 372 440 474 489 436 438 437 432 438U.S. Govt.-sponsored enterprises . . . . . 195 324 478 552 631 782 897 989 1,099 1,405Federally-related mortgage pools . . . . . . 114 369 1,020 1,272 1,357 1,472 1,570 1,711 1,826 2,018Monetary authorities . . . . . . . . . . . . . . 174 243 342 382 424 452 472 495 534 567Commercial banking 2 . . . . . . . . . . . . . 1,482 2,376 3,337 3,655 3,892 4,160 4,494 4,710 5,175 5,635
U.S.-chartered commercial banks . . . . 1,266 1,990 2,644 2,775 2,932 3,123 3,322 3,445 3,742 4,094Foreign banking offices in U.S. . . . . . 98 144 367 509 542 590 666 715 811 802
Nonbank finance . . . . . . . . . . . . . . . . 2,884 5,688 9,034 10,710 11,865 12,414 14,295 16,251 19,096 22,133Funding corporations . . . . . . . . . . . . 16 135 247 336 327 366 372 489 606 747Savings institutions . . . . . . . . . . . . . 792 1,275 1,323 1,060 1,020 1,009 1,013 1,032 1,029 1,088Credit unions . . . . . . . . . . . . . . . . . 68 135 217 265 282 294 311 330 354 394Life insurance . . . . . . . . . . . . . . . . . 464 796 1,351 1,587 1,755 1,863 2,064 2,246 2,515 2,819Other insurance . . . . . . . . . . . . . . . 182 299 533 598 642 678 740 778 852 884Private pension funds. . . . . . . . . . . . 513 1,228 1,608 2,009 2,252 2,352 2,755 3,155 3,706 4,331State and local govt. retirement funds . 197 399 920 1,168 1,256 1,294 1,518 1,715 2,094 2,344Finance companies . . . . . . . . . . . . . 197 338 547 556 557 600 672 715 757 827Mortgage companies . . . . . . . . . . . . 16 25 49 60 60 36 33 41 32 35Real estate investment trusts. . . . . . . 3 8 13 14 17 22 26 30 52 60Mutual funds . . . . . . . . . . . . . . . . . 62 246 608 993 1,375 1,477 1,853 2,342 2,989 3,626Closed-end investment funds. . . . . . . 8 8 53 93 116 118 134 145 148 148Money market funds . . . . . . . . . . . . 76 242 493 539 560 603 745 891 1,049 1,334Security brokers, dealers . . . . . . . . . 45 156 262 382 479 455 568 636 779 841Asset-backed securities issuers . . . . . - 39 285 421 504 577 717 865 1,078 1,392Bank personal trusts, estates. . . . . . . 245 358 522 630 661 670 775 842 1,055 1,263
Rest of the world . . . . . . . . . . . . . . . . 493 951 1,940 2,247 2,605 2,853 3,423 4,133 4,846 5,410
- Represents zero. 1 Includes nonprofit organizations. 2 Includes other sectors not shown separately.
No. 798. Flow of Funds Accounts—Credit Market Debt Outstanding:1980 to 1998
[In billions of dollars (4,734 represents $4,734,000,000,000). As of Dec. 31. N.e.c.= Not elsewhere classified]
Item 1980 1985 1990 1992 1993 1994 1995 1996 1997 1998
Credit market debt. . . . . . . . . . . 4,734 8,628 13,745 15,195 16,167 17,212 18,445 19,794 21,200 23,291U.S. government . . . . . . . . . . . . . . . . 735 1,590 2,498 3,080 3,336 3,492 3,637 3,782 3,805 3,752Non-Federal domestic nonfinancial . . . . 3,223 5,543 8,345 8,753 9,099 9,526 10,085 10,661 11,373 12,378
Households 1. . . . . . . . . . . . . . . . . 1,376 2,239 3,582 3,926 4,139 4,454 4,804 5,135 5,472 5,958Corporations . . . . . . . . . . . . . . . . . 910 1,609 2,488 2,475 2,536 2,687 2,913 3,113 3,366 3,709Nonfarm noncorporate business . . . . 431 843 1,148 1,115 1,119 1,122 1,152 1,199 1,259 1,348Farm business . . . . . . . . . . . . . . . . 161 173 135 135 138 142 145 150 156 163State and local government . . . . . . . 344 678 992 1,102 1,168 1,122 1,070 1,063 1,119 1,200
Rest of the world . . . . . . . . . . . . . . . . 197 237 286 316 386 371 442 519 570 592Financial sectors . . . . . . . . . . . . . . . . 579 1,258 2,616 3,046 3,346 3,822 4,281 4,833 5,453 6,569
Commercial banking . . . . . . . . . . . . 91 188 198 195 208 228 251 264 309 382Thrift institutions 2. . . . . . . . . . . . . . 55 111 140 88 100 113 115 141 161 214Life insurance companies . . . . . . . . - - - - - 1 1 2 2 2Government-sponsored enterprises 3 . 163 264 399 448 528 701 807 897 995 1,300Federally-related mortgage pools. . . . 114 369 1,020 1,272 1,357 1,472 1,570 1,711 1,826 2,018Asset-backed securities issuers. . . . . - 39 287 422 506 579 720 874 1,089 1,406Finance companies. . . . . . . . . . . . . 127 224 374 386 385 434 484 530 554 616Mortgage companies. . . . . . . . . . . . 12 17 25 30 30 19 19 32 27 28Real estate investment trusts . . . . . . 5 5 12 14 17 31 37 44 80 146Security brokers, dealers . . . . . . . . . - 1 15 22 34 34 29 27 35 43Funding corporations . . . . . . . . . . . 13 39 147 169 180 211 249 313 374 414
CORPORATE CREDIT MARKET DEBTOUTSTANDING, BY TYPE
OF INSTRUMENTTotal . . . . . . . . . . . . . . . . . . . . . . 910 1,609 2,488 2,475 2,536 2,687 2,913 3,113 3,366 3,709
Commercial paper . . . . . . . . . . . . . . . 28 72 117 107 118 139 157 156 169 193Municipal securities 4 . . . . . . . . . . . . . 46 127 115 118 125 132 135 138 142 148Corporate bonds . . . . . . . . . . . . . . . . 366 578 1,008 1,155 1,230 1,253 1,326 1,399 1,490 1,622Bank loans, n.e.c. . . . . . . . . . . . . . . . 230 424 545 488 478 521 588 634 706 790Other loans and advances. . . . . . . . . . 110 248 473 413 388 421 454 475 521 569
Savings institutions . . . . . . . . . . . . . 1 15 17 6 5 5 6 8 9 12Finance companies. . . . . . . . . . . . . 78 135 241 238 224 247 271 279 287 320U.S. government . . . . . . . . . . . . . . 8 14 9 8 8 8 10 9 8 8Acceptance liabilities to banks . . . . . 17 28 29 20 17 15 14 13 11 7Rest of the world . . . . . . . . . . . . . . 5 56 172 130 114 122 122 129 143 141Asset-backed securities issuers. . . . . - - 4 10 19 24 30 38 62 81
Mortgages . . . . . . . . . . . . . . . . . . . . 131 159 229 194 197 220 253 311 339 389
- Represents or rounds to zero. 1 Includes nonprofit organizations. 2 Covers savings institutions and credit unions.3 U.S. Government. 4 Industrial revenue bonds. Issued by state and local governments to finance private investment andsecured in interest and principal by the industrial user of the funds.
Source of Tables 797 and 798: Board of Governors of the Federal Reserve System, Flow of Funds Accounts, March 1999quarterly diskettes. Data are also published in the quarterly Z.1 release.
516 Banking, Finance, and Insurance
U.S. Census Bureau, Statistical Abstract of the United States: 1999
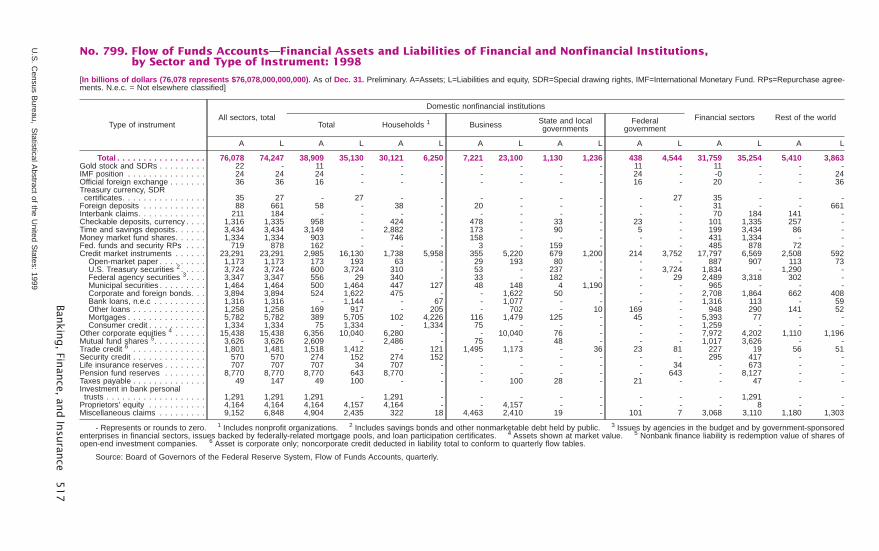
No. 799. Flow of Funds Accounts—Financial Assets and Liabilities of Financial and Nonfinancial Institutions,by Sector and Type of Instrument: 1998
[In billions of dollars (76,078 represents $76,078,000,000,000). As of Dec. 31. Preliminary. A=Assets; L=Liabilities and equity, SDR=Special drawing rights, IMF=International Monetary Fund. RPs=Repurchase agree-ments. N.e.c. = Not elsewhere classified]
Type of instrumentAll sectors, total
Domestic nonfinancial institutionsFinancial sectors Rest of the world
Total Households 1 Business State and localgovernments
Federalgovernment
A L A L A L A L A L A L A L A L
Total . . . . . . . . . . . . . . . . . 76,078 74,247 38,909 35,130 30,121 6,250 7,221 23,100 1,130 1,236 438 4,544 31,759 35,254 5,410 3,863Gold stock and SDRs . . . . . . . . . 22 - 11 - - - - - - - 11 - 11 - - -IMF position . . . . . . . . . . . . . . . 24 24 24 - - - - - - - 24 - -0 - - 24Official foreign exchange . . . . . . . 36 36 16 - - - - - - - 16 - 20 - - 36Treasury currency, SDRcertificates. . . . . . . . . . . . . . . . 35 27 - 27 - - - - - - - 27 35 - - -
Foreign deposits . . . . . . . . . . . . 88 661 58 - 38 - 20 - - - - - 31 - - 661Interbank claims. . . . . . . . . . . . . 211 184 - - - - - - - - - - 70 184 141 -Checkable deposits, currency . . . . 1,316 1,335 958 - 424 - 478 - 33 - 23 - 101 1,335 257 -Time and savings deposits. . . . . . 3,434 3,434 3,149 - 2,882 - 173 - 90 - 5 - 199 3,434 86 -Money market fund shares. . . . . . 1,334 1,334 903 - 746 - 158 - - - - - 431 1,334 - -Fed. funds and security RPs . . . . 719 878 162 - - - 3 - 159 - - - 485 878 72 -Credit market instruments . . . . . . 23,291 23,291 2,985 16,130 1,738 5,958 355 5,220 679 1,200 214 3,752 17,797 6,569 2,508 592
Open-market paper . . . . . . . . . 1,173 1,173 173 193 63 - 29 193 80 - - - 887 907 113 73U.S. Treasury securities 2 . . . . . 3,724 3,724 600 3,724 310 - 53 - 237 - - 3,724 1,834 - 1,290 -Federal agency securities 3. . . . 3,347 3,347 556 29 340 - 33 - 182 - - 29 2,489 3,318 302 -Municipal securities . . . . . . . . . 1,464 1,464 500 1,464 447 127 48 148 4 1,190 - - 965 - - -Corporate and foreign bonds. . . 3,894 3,894 524 1,622 475 - - 1,622 50 - - - 2,708 1,864 662 408Bank loans, n.e.c . . . . . . . . . . 1,316 1,316 - 1,144 - 67 - 1,077 - - - - 1,316 113 - 59Other loans . . . . . . . . . . . . . . 1,258 1,258 169 917 - 205 - 702 - 10 169 - 948 290 141 52Mortgages . . . . . . . . . . . . . . . 5,782 5,782 389 5,705 102 4,226 116 1,479 125 - 45 - 5,393 77 - -Consumer credit . . . . . . . . . . . 1,334 1,334 75 1,334 - 1,334 75 - - - - - 1,259 - - -
Other corporate equities 4 . . . . . . 15,438 15,438 6,356 10,040 6,280 - - 10,040 76 - - - 7,972 4,202 1,110 1,196Mutual fund shares 5. . . . . . . . . . 3,626 3,626 2,609 - 2,486 - 75 - 48 - - - 1,017 3,626 - -Trade credit 6 . . . . . . . . . . . . . . 1,801 1,481 1,518 1,412 - 121 1,495 1,173 - 36 23 81 227 19 56 51Security credit . . . . . . . . . . . . . . 570 570 274 152 274 152 - - - - - - 295 417 - -Life insurance reserves . . . . . . . . 707 707 707 34 707 - - - - - - 34 - 673 - -Pension fund reserves . . . . . . . . 8,770 8,770 8,770 643 8,770 - - - - - - 643 - 8,127 - -Taxes payable . . . . . . . . . . . . . . 49 147 49 100 - - - 100 28 - 21 - - 47 - -Investment in bank personaltrusts . . . . . . . . . . . . . . . . . . . 1,291 1,291 1,291 - 1,291 - - - - - - - - 1,291 - -
Proprietors’ equity . . . . . . . . . . . 4,164 4,164 4,164 4,157 4,164 - - 4,157 - - - - - 8 - -Miscellaneous claims . . . . . . . . . 9,152 6,848 4,904 2,435 322 18 4,463 2,410 19 - 101 7 3,068 3,110 1,180 1,303
- Represents or rounds to zero. 1 Includes nonprofit organizations. 2 Includes savings bonds and other nonmarketable debt held by public. 3 Issues by agencies in the budget and by government-sponsoredenterprises in financial sectors, issues backed by federally-related mortgage pools, and loan participation certificates. 4 Assets shown at market value. 5 Nonbank finance liability is redemption value of shares ofopen-end investment companies. 6 Asset is corporate only; noncorporate credit deducted in liability total to conform to quarterly flow tables.
Source: Board of Governors of the Federal Reserve System, Flow of Funds Accounts, quarterly.
Bankin
g,Fin
ance,
and
Insu
rance
51
7
U.S
.C
ensusB
ureau,S
tatisticalAbstract
ofthe
United
States:
1999
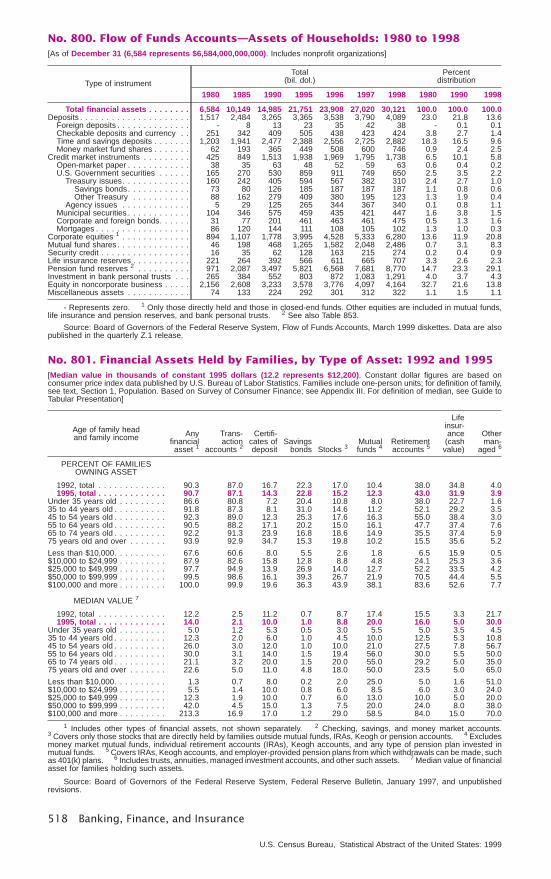
No. 800. Flow of Funds Accounts—Assets of Households: 1980 to 1998[As of December 31 (6,584 represents $6,584,000,000,000). Includes nonprofit organizations]
Type of instrumentTotal
(bil. dol.)Percent
distribution
1980 1985 1990 1995 1996 1997 1998 1980 1990 1998
Total financial assets . . . . . . . . 6,584 10,149 14,985 21,751 23,908 27,020 30,121 100.0 100.0 100.0Deposits . . . . . . . . . . . . . . . . . . . . . 1,517 2,484 3,265 3,365 3,538 3,790 4,089 23.0 21.8 13.6
Foreign deposits . . . . . . . . . . . . . . - 8 13 23 35 42 38 - 0.1 0.1Checkable deposits and currency . . 251 342 409 505 438 423 424 3.8 2.7 1.4Time and savings deposits . . . . . . . 1,203 1,941 2,477 2,388 2,556 2,725 2,882 18.3 16.5 9.6Money market fund shares . . . . . . . 62 193 365 449 508 600 746 0.9 2.4 2.5
Credit market instruments . . . . . . . . . 425 849 1,513 1,938 1,969 1,795 1,738 6.5 10.1 5.8Open-market paper . . . . . . . . . . . . 38 35 63 48 52 59 63 0.6 0.4 0.2U.S. Government securities . . . . . . 165 270 530 859 911 749 650 2.5 3.5 2.2
Treasury issues. . . . . . . . . . . . . 160 242 405 594 567 382 310 2.4 2.7 1.0Savings bonds. . . . . . . . . . . . 73 80 126 185 187 187 187 1.1 0.8 0.6Other Treasury . . . . . . . . . . . 88 162 279 409 380 195 123 1.3 1.9 0.4
Agency issues . . . . . . . . . . . . . 5 29 125 265 344 367 340 0.1 0.8 1.1Municipal securities . . . . . . . . . . . . 104 346 575 459 435 421 447 1.6 3.8 1.5Corporate and foreign bonds. . . . . . 31 77 201 461 463 461 475 0.5 1.3 1.6Mortgages . . . . . . . . . . . . . . . . . . 86 120 144 111 108 105 102 1.3 1.0 0.3
Corporate equities 1 . . . . . . . . . . . . . 894 1,107 1,778 3,995 4,528 5,333 6,280 13.6 11.9 20.8Mutual fund shares. . . . . . . . . . . . . . 46 198 468 1,265 1,582 2,048 2,486 0.7 3.1 8.3Security credit . . . . . . . . . . . . . . . . . 16 35 62 128 163 215 274 0.2 0.4 0.9Life insurance reserves . . . . . . . . . . . 221 264 392 566 611 665 707 3.3 2.6 2.3Pension fund reserves 2 . . . . . . . . . . 971 2,087 3,497 5,821 6,568 7,681 8,770 14.7 23.3 29.1Investment in bank personal trusts . . . 265 384 552 803 872 1,083 1,291 4.0 3.7 4.3Equity in noncorporate business . . . . . 2,156 2,608 3,233 3,578 3,776 4,097 4,164 32.7 21.6 13.8Miscellaneous assets . . . . . . . . . . . . 74 133 224 292 301 312 322 1.1 1.5 1.1
- Represents zero. 1 Only those directly held and those in closed-end funds. Other equities are included in mutual funds,life insurance and pension reserves, and bank personal trusts. 2 See also Table 853.
Source: Board of Governors of the Federal Reserve System, Flow of Funds Accounts, March 1999 diskettes. Data are alsopublished in the quarterly Z.1 release.
No. 801. Financial Assets Held by Families, by Type of Asset: 1992 and 1995[Median value in thousands of constant 1995 dollars (12.2 represents $12,200). Constant dollar figures are based onconsumer price index data published by U.S. Bureau of Labor Statistics. Families include one-person units; for definition of family,see text, Section 1, Population. Based on Survey of Consumer Finance; see Appendix III. For definition of median, see Guide toTabular Presentation]
Age of family headand family income Any
financialasset 1
Trans-action
accounts 2
Certifi-cates ofdeposit
Savingsbonds Stocks 3
Mutualfunds 4
Retirementaccounts 5
Lifeinsur-ance(cashvalue)
Otherman-
aged 6
PERCENT OF FAMILIESOWNING ASSET
1992, total . . . . . . . . . . . . . 90.3 87.0 16.7 22.3 17.0 10.4 38.0 34.8 4.01995, total . . . . . . . . . . . . . 90.7 87.1 14.3 22.8 15.2 12.3 43.0 31.9 3.9
Under 35 years old . . . . . . . . . 86.6 80.8 7.2 20.4 10.8 8.0 38.0 22.7 1.635 to 44 years old . . . . . . . . . . 91.8 87.3 8.1 31.0 14.6 11.2 52.1 29.2 3.545 to 54 years old . . . . . . . . . . 92.3 89.0 12.3 25.3 17.6 16.3 55.0 38.4 3.055 to 64 years old . . . . . . . . . . 90.5 88.2 17.1 20.2 15.0 16.1 47.7 37.4 7.665 to 74 years old . . . . . . . . . . 92.2 91.3 23.9 16.8 18.6 14.9 35.5 37.4 5.975 years old and over . . . . . . . 93.9 92.9 34.7 15.3 19.8 10.2 15.5 35.6 5.2
Less than $10,000. . . . . . . . . . 67.6 60.6 8.0 5.5 2.6 1.8 6.5 15.9 0.5$10,000 to $24,999 . . . . . . . . . 87.9 82.6 15.8 12.8 8.8 4.8 24.1 25.3 3.6$25,000 to $49,999 . . . . . . . . . 97.7 94.9 13.9 26.9 14.0 12.7 52.2 33.5 4.2$50,000 to $99,999 . . . . . . . . . 99.5 98.6 16.1 39.3 26.7 21.9 70.5 44.4 5.5$100,000 and more . . . . . . . . . 100.0 99.9 19.6 36.3 43.9 38.1 83.6 52.6 7.7
MEDIAN VALUE 7
1992, total . . . . . . . . . . . . . 12.2 2.5 11.2 0.7 8.7 17.4 15.5 3.3 21.71995, total . . . . . . . . . . . . . 14.0 2.1 10.0 1.0 8.8 20.0 16.0 5.0 30.0
Under 35 years old . . . . . . . . . 5.0 1.2 5.3 0.5 3.0 5.5 5.0 3.5 4.535 to 44 years old . . . . . . . . . . 12.3 2.0 6.0 1.0 4.5 10.0 12.5 5.3 10.845 to 54 years old . . . . . . . . . . 26.0 3.0 12.0 1.0 10.0 21.0 27.5 7.8 56.755 to 64 years old . . . . . . . . . . 30.0 3.1 14.0 1.5 19.4 56.0 30.0 5.5 50.065 to 74 years old . . . . . . . . . . 21.1 3.2 20.0 1.5 20.0 55.0 29.2 5.0 35.075 years old and over . . . . . . . 22.6 5.0 11.0 4.8 18.0 50.0 23.5 5.0 65.0
Less than $10,000. . . . . . . . . . 1.3 0.7 8.0 0.2 2.0 25.0 5.0 1.6 51.0$10,000 to $24,999 . . . . . . . . . 5.5 1.4 10.0 0.8 6.0 8.5 6.0 3.0 24.0$25,000 to $49,999 . . . . . . . . . 12.3 1.9 10.0 0.7 6.0 13.0 10.0 5.0 20.0$50,000 to $99,999 . . . . . . . . . 42.0 4.5 15.0 1.3 7.5 20.0 24.0 8.0 38.0$100,000 and more . . . . . . . . . 213.3 16.9 17.0 1.2 29.0 58.5 84.0 15.0 70.0
1 Includes other types of financial assets, not shown separately. 2 Checking, savings, and money market accounts.3 Covers only those stocks that are directly held by families outside mutual funds, IRAs, Keogh or pension accounts. 4 Excludesmoney market mutual funds, individual retirement accounts (IRAs), Keogh accounts, and any type of pension plan invested inmutual funds. 5 Covers IRAs, Keogh accounts, and employer-provided pension plans from which withdrawals can be made, suchas 401(k) plans. 6 Includes trusts, annuities, managed investment accounts, and other such assets. 7 Median value of financialasset for families holding such assets.
Source: Board of Governors of the Federal Reserve System, Federal Reserve Bulletin, January 1997, and unpublishedrevisions.
518 Banking, Finance, and Insurance
U.S. Census Bureau, Statistical Abstract of the United States: 1999
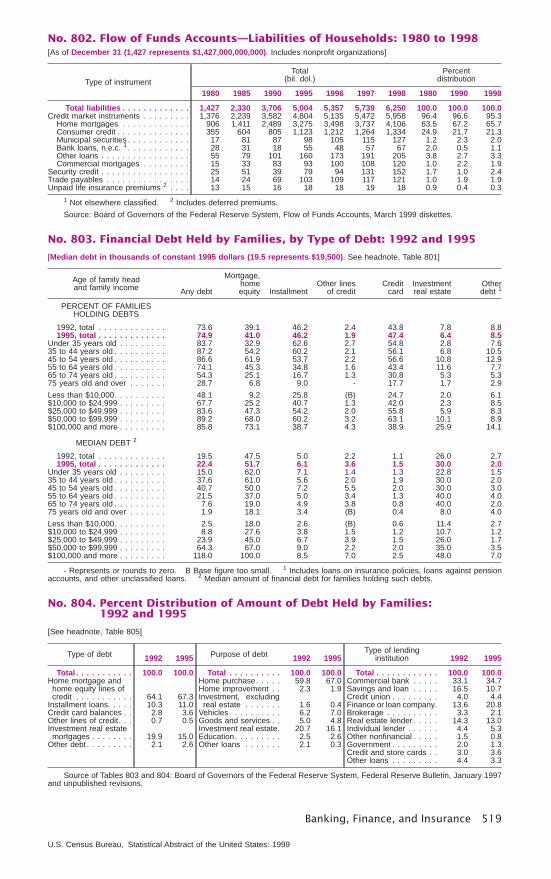
No. 802. Flow of Funds Accounts—Liabilities of Households: 1980 to 1998[As of December 31 (1,427 represents $1,427,000,000,000). Includes nonprofit organizations]
Type of instrumentTotal
(bil. dol.)Percent
distribution
1980 1985 1990 1995 1996 1997 1998 1980 1990 1998
Total liabilities . . . . . . . . . . . . . 1,427 2,330 3,706 5,004 5,357 5,739 6,250 100.0 100.0 100.0Credit market instruments . . . . . . . . . 1,376 2,239 3,582 4,804 5,135 5,472 5,958 96.4 96.6 95.3
Home mortgages . . . . . . . . . . . . . 906 1,411 2,489 3,275 3,498 3,737 4,106 63.5 67.2 65.7Consumer credit . . . . . . . . . . . . . . 355 604 805 1,123 1,212 1,264 1,334 24.9 21.7 21.3Municipal securities . . . . . . . . . . . . 17 81 87 98 105 115 127 1.2 2.3 2.0Bank loans, n.e.c. 1 . . . . . . . . . . . . 28 31 18 55 48 57 67 2.0 0.5 1.1Other loans . . . . . . . . . . . . . . . . . 55 79 101 160 173 191 205 3.8 2.7 3.3Commercial mortgages . . . . . . . . . 15 33 83 93 100 108 120 1.0 2.2 1.9
Security credit . . . . . . . . . . . . . . . . . 25 51 39 79 94 131 152 1.7 1.0 2.4Trade payables . . . . . . . . . . . . . . . . 14 24 69 103 109 117 121 1.0 1.9 1.9Unpaid life insurance premiums 2 . . . . 13 15 16 18 18 19 18 0.9 0.4 0.3
1 Not elsewhere classified. 2 Includes deferred premiums.
Source: Board of Governors of the Federal Reserve System, Flow of Funds Accounts, March 1999 diskettes.
No. 803. Financial Debt Held by Families, by Type of Debt: 1992 and 1995
[Median debt in thousands of constant 1995 dollars (19.5 represents $19,500). See headnote, Table 801]
Age of family headand family income Any debt
Mortgage,homeequity Installment
Other linesof credit
Creditcard
Investmentreal estate
Otherdebt 1
PERCENT OF FAMILIESHOLDING DEBTS
1992, total . . . . . . . . . . . . . 73.6 39.1 46.2 2.4 43.8 7.8 8.81995, total . . . . . . . . . . . . . 74.9 41.0 46.2 1.9 47.4 6.4 8.5
Under 35 years old . . . . . . . . . 83.7 32.9 62.6 2.7 54.8 2.8 7.635 to 44 years old . . . . . . . . . . 87.2 54.2 60.2 2.1 56.1 6.8 10.545 to 54 years old . . . . . . . . . . 86.6 61.9 53.7 2.2 56.6 10.8 12.955 to 64 years old . . . . . . . . . . 74.1 45.3 34.8 1.6 43.4 11.6 7.765 to 74 years old . . . . . . . . . . 54.3 25.1 16.7 1.3 30.8 5.3 5.375 years old and over . . . . . . . 28.7 6.8 9.0 - 17.7 1.7 2.9
Less than $10,000. . . . . . . . . . 48.1 9.2 25.8 (B) 24.7 2.0 6.1$10,000 to $24,999 . . . . . . . . . 67.7 25.2 40.7 1.3 42.0 2.3 8.5$25,000 to $49,999 . . . . . . . . . 83.6 47.3 54.2 2.0 55.8 5.9 8.3$50,000 to $99,999 . . . . . . . . . 89.2 68.0 60.2 3.2 63.1 10.1 8.9$100,000 and more . . . . . . . . . 85.8 73.1 38.7 4.3 38.9 25.9 14.1
MEDIAN DEBT 2
1992, total . . . . . . . . . . . . . 19.5 47.5 5.0 2.2 1.1 26.0 2.71995, total . . . . . . . . . . . . . 22.4 51.7 6.1 3.6 1.5 30.0 2.0
Under 35 years old . . . . . . . . . 15.0 62.0 7.1 1.4 1.3 22.8 1.535 to 44 years old . . . . . . . . . . 37.6 61.0 5.6 2.0 1.9 30.0 2.045 to 54 years old . . . . . . . . . . 40.7 50.0 7.2 5.5 2.0 30.0 3.055 to 64 years old . . . . . . . . . . 21.5 37.0 5.0 3.4 1.3 40.0 4.065 to 74 years old . . . . . . . . . . 7.6 19.0 4.9 3.8 0.8 40.0 2.075 years old and over . . . . . . . 1.9 18.1 3.4 (B) 0.4 8.0 4.0
Less than $10,000. . . . . . . . . . 2.5 18.0 2.6 (B) 0.6 11.4 2.7$10,000 to $24,999 . . . . . . . . . 8.8 27.6 3.8 1.5 1.2 10.7 1.2$25,000 to $49,999 . . . . . . . . . 23.9 45.0 6.7 3.9 1.5 26.0 1.7$50,000 to $99,999 . . . . . . . . . 64.3 67.0 9.0 2.2 2.0 35.0 3.5$100,000 and more . . . . . . . . . 118.0 100.0 8.5 7.0 2.5 48.0 7.0
- Represents or rounds to zero. B Base figure too small. 1 Includes loans on insurance policies, loans against pensionaccounts, and other unclassified loans. 2 Median amount of financial debt for families holding such debts.
No. 804. Percent Distribution of Amount of Debt Held by Families:1992 and 1995
[See headnote, Table 805]
Type of debt 1992 1995 Purpose of debt 1992 1995Type of lending
institution 1992 1995
Total . . . . . . . . . . . 100.0 100.0 Total . . . . . . . . . . 100.0 100.0 Total . . . . . . . . . . . . 100.0 100.0Home mortgage and Home purchase. . . . . 59.8 67.0 Commercial bank . . . . . 33.1 34.7home equity lines of Home improvement . . 2.3 1.9 Savings and loan . . . . . 16.5 10.7credit . . . . . . . . . . . 64.1 67.3 Investment, excluding Credit union . . . . . . . . . 4.0 4.4
Installment loans. . . . . 10.3 11.0 real estate . . . . . . . 1.6 0.4 Finance or loan company. 13.6 20.8Credit card balances . . 2.8 3.6 Vehicles . . . . . . . . . . 6.2 7.0 Brokerage . . . . . . . . . . 3.3 2.1Other lines of credit. . . 0.7 0.5 Goods and services . . 5.0 4.8 Real estate lender . . . . . 14.3 13.0Investment real estate Investment real estate. 20.7 16.1 Individual lender . . . . . . 4.4 5.3mortgages . . . . . . . . 19.9 15.0 Education. . . . . . . . . 2.5 2.6 Other nonfinancial . . . . . 1.5 0.8
Other debt . . . . . . . . . 2.1 2.6 Other loans . . . . . . . 2.1 0.3 Government . . . . . . . . . 2.0 1.3Credit and store cards . . 3.0 3.6Other loans . . . . . . . . . 4.4 3.3
Source of Tables 803 and 804: Board of Governors of the Federal Reserve System, Federal Reserve Bulletin, January 1997and unpublished revisions.
Banking, Finance, and Insurance 519
U.S. Census Bureau, Statistical Abstract of the United States: 1999
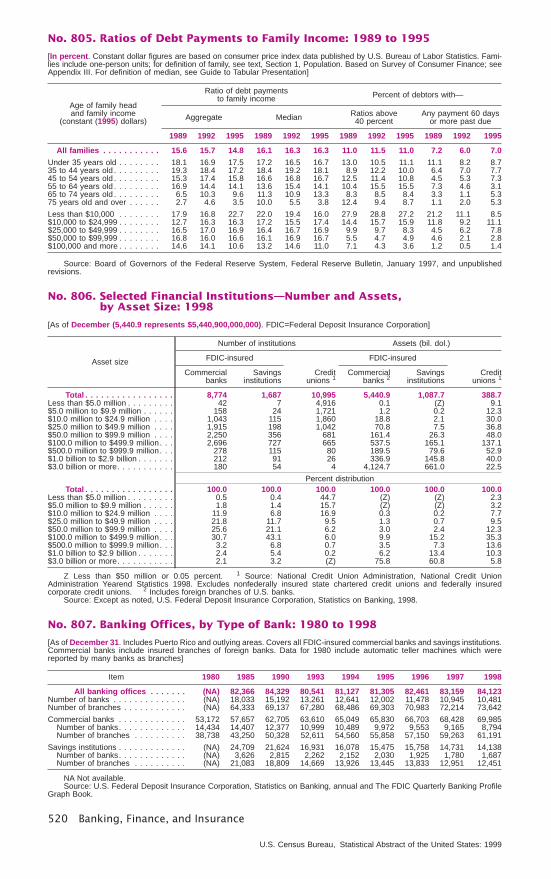
No. 805. Ratios of Debt Payments to Family Income: 1989 to 1995
[In percent. Constant dollar figures are based on consumer price index data published by U.S. Bureau of Labor Statistics. Fami-lies include one-person units; for definition of family, see text, Section 1, Population. Based on Survey of Consumer Finance; seeAppendix III. For definition of median, see Guide to Tabular Presentation]
Age of family headand family income
(constant (1995) dollars)
Ratio of debt paymentsto family income Percent of debtors with—
Aggregate Median Ratios above40 percent
Any payment 60 daysor more past due
1989 1992 1995 1989 1992 1995 1989 1992 1995 1989 1992 1995
All families . . . . . . . . . . . 15.6 15.7 14.8 16.1 16.3 16.3 11.0 11.5 11.0 7.2 6.0 7.0
Under 35 years old . . . . . . . . 18.1 16.9 17.5 17.2 16.5 16.7 13.0 10.5 11.1 11.1 8.2 8.735 to 44 years old . . . . . . . . . 19.3 18.4 17.2 18.4 19.2 18.1 8.9 12.2 10.0 6.4 7.0 7.745 to 54 years old . . . . . . . . . 15.3 17.4 15.8 16.6 16.8 16.7 12.5 11.4 10.8 4.5 5.3 7.355 to 64 years old . . . . . . . . . 16.9 14.4 14.1 13.6 15.4 14.1 10.4 15.5 15.5 7.3 4.6 3.165 to 74 years old . . . . . . . . . 6.5 10.3 9.6 11.3 10.9 13.3 8.3 8.5 8.4 3.3 1.1 5.375 years old and over . . . . . . 2.7 4.6 3.5 10.0 5.5 3.8 12.4 9.4 8.7 1.1 2.0 5.3
Less than $10,000 . . . . . . . . 17.9 16.8 22.7 22.0 19.4 16.0 27.9 28.8 27.2 21.2 11.1 8.5$10,000 to $24,999 . . . . . . . . 12.7 16.3 16.3 17.2 15.5 17.4 14.4 15.7 15.9 11.8 9.2 11.1$25,000 to $49,999 . . . . . . . . 16.5 17.0 16.9 16.4 16.7 16.9 9.9 9.7 8.3 4.5 6.2 7.8$50,000 to $99,999 . . . . . . . . 16.8 16.0 16.6 16.1 16.9 16.7 5.5 4.7 4.9 4.6 2.1 2.8$100,000 and more . . . . . . . . 14.6 14.1 10.6 13.2 14.6 11.0 7.1 4.3 3.6 1.2 0.5 1.4
Source: Board of Governors of the Federal Reserve System, Federal Reserve Bulletin, January 1997, and unpublishedrevisions.
No. 806. Selected Financial Institutions—Number and Assets,by Asset Size: 1998
[As of December (5,440.9 represents $5,440,900,000,000). FDIC=Federal Deposit Insurance Corporation]
Asset size
Number of institutions Assets (bil. dol.)
FDIC-insured
Creditunions 1
FDIC-insured
Creditunions 1
Commercialbanks
Savingsinstitutions
Commercialbanks 2
Savingsinstitutions
Total . . . . . . . . . . . . . . . . . 8,774 1,687 10,995 5,440.9 1,087.7 388.7Less than $5.0 million . . . . . . . . . 42 7 4,916 0.1 (Z) 9.1$5.0 million to $9.9 million . . . . . . 158 24 1,721 1.2 0.2 12.3$10.0 million to $24.9 million . . . . 1,043 115 1,860 18.8 2.1 30.0$25.0 million to $49.9 million . . . . 1,915 198 1,042 70.8 7.5 36.8$50.0 million to $99.9 million . . . . 2,250 356 681 161.4 26.3 48.0$100.0 million to $499.9 million . . . 2,696 727 665 537.5 165.1 137.1$500.0 million to $999.9 million . . . 278 115 80 189.5 79.6 52.9$1.0 billion to $2.9 billion . . . . . . . 212 91 26 336.9 145.8 40.0$3.0 billion or more. . . . . . . . . . . 180 54 4 4,124.7 661.0 22.5
Percent distributionTotal . . . . . . . . . . . . . . . . . 100.0 100.0 100.0 100.0 100.0 100.0
Less than $5.0 million . . . . . . . . . 0.5 0.4 44.7 (Z) (Z) 2.3$5.0 million to $9.9 million . . . . . . 1.8 1.4 15.7 (Z) (Z) 3.2$10.0 million to $24.9 million . . . . 11.9 6.8 16.9 0.3 0.2 7.7$25.0 million to $49.9 million . . . . 21.8 11.7 9.5 1.3 0.7 9.5$50.0 million to $99.9 million . . . . 25.6 21.1 6.2 3.0 2.4 12.3$100.0 million to $499.9 million . . . 30.7 43.1 6.0 9.9 15.2 35.3$500.0 million to $999.9 million . . . 3.2 6.8 0.7 3.5 7.3 13.6$1.0 billion to $2.9 billion . . . . . . . 2.4 5.4 0.2 6.2 13.4 10.3$3.0 billion or more. . . . . . . . . . . 2.1 3.2 (Z) 75.8 60.8 5.8
Z Less than $50 million or 0.05 percent. 1 Source: National Credit Union Administration, National Credit UnionAdministration Yearend Statistics 1998. Excludes nonfederally insured state chartered credit unions and federally insuredcorporate credit unions. 2 Includes foreign branches of U.S. banks.
Source: Except as noted, U.S. Federal Deposit Insurance Corporation, Statistics on Banking, 1998.
No. 807. Banking Offices, by Type of Bank: 1980 to 1998
[As of December 31. Includes Puerto Rico and outlying areas. Covers all FDIC-insured commercial banks and savings institutions.Commercial banks include insured branches of foreign banks. Data for 1980 include automatic teller machines which werereported by many banks as branches]
Item 1980 1985 1990 1993 1994 1995 1996 1997 1998
All banking offices . . . . . . . (NA) 82,366 84,329 80,541 81,127 81,305 82,461 83,159 84,123Number of banks . . . . . . . . . . . . . . (NA) 18,033 15,192 13,261 12,641 12,002 11,478 10,945 10,481Number of branches . . . . . . . . . . . . (NA) 64,333 69,137 67,280 68,486 69,303 70,983 72,214 73,642
Commercial banks . . . . . . . . . . . . . 53,172 57,657 62,705 63,610 65,049 65,830 66,703 68,428 69,985Number of banks. . . . . . . . . . . . . 14,434 14,407 12,377 10,999 10,489 9,972 9,553 9,165 8,794Number of branches . . . . . . . . . . 38,738 43,250 50,328 52,611 54,560 55,858 57,150 59,263 61,191
Savings institutions . . . . . . . . . . . . . (NA) 24,709 21,624 16,931 16,078 15,475 15,758 14,731 14,138Number of banks. . . . . . . . . . . . . (NA) 3,626 2,815 2,262 2,152 2,030 1,925 1,780 1,687Number of branches . . . . . . . . . . (NA) 21,083 18,809 14,669 13,926 13,445 13,833 12,951 12,451
NA Not available.Source: U.S. Federal Deposit Insurance Corporation, Statistics on Banking, annual and The FDIC Quarterly Banking Profile
Graph Book.
520 Banking, Finance, and Insurance
U.S. Census Bureau, Statistical Abstract of the United States: 1999
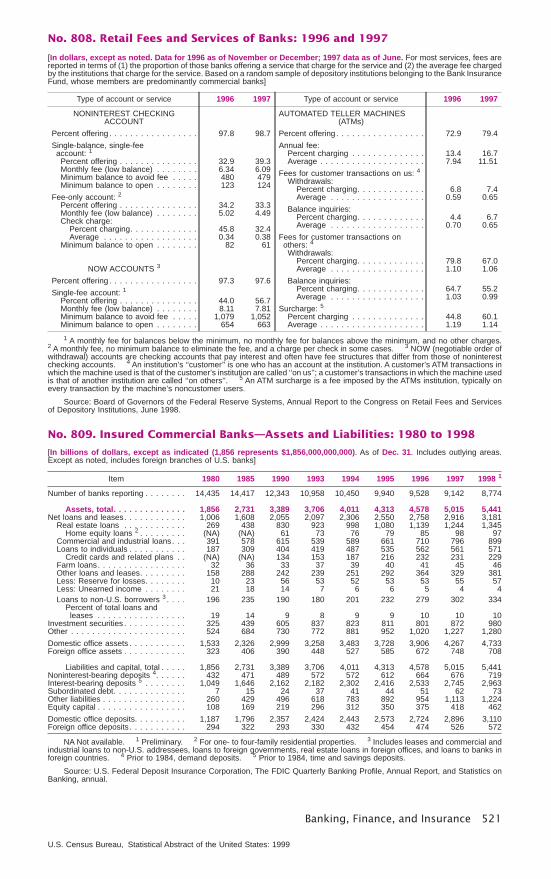
No. 808. Retail Fees and Services of Banks: 1996 and 1997
[In dollars, except as noted. Data for 1996 as of November or December; 1997 data as of June. For most services, fees arereported in terms of (1) the proportion of those banks offering a service that charge for the service and (2) the average fee chargedby the institutions that charge for the service. Based on a random sample of depository institutions belonging to the Bank InsuranceFund, whose members are predominantly commercial banks]
Type of account or service 1996 1997
NONINTEREST CHECKINGACCOUNT
Percent offering . . . . . . . . . . . . . . . . . 97.8 98.7
Single-balance, single-feeaccount: 1
Percent offering . . . . . . . . . . . . . . . 32.9 39.3Monthly fee (low balance) . . . . . . . . 6.34 6.09Minimum balance to avoid fee . . . . . 480 479Minimum balance to open . . . . . . . . 123 124
Fee-only account: 2
Percent offering . . . . . . . . . . . . . . . 34.2 33.3Monthly fee (low balance) . . . . . . . . 5.02 4.49Check charge:
Percent charging. . . . . . . . . . . . . 45.8 32.4Average . . . . . . . . . . . . . . . . . . 0.34 0.38
Minimum balance to open . . . . . . . . 82 61
NOW ACCOUNTS 3
Percent offering . . . . . . . . . . . . . . . . . 97.3 97.6
Single-fee account: 1
Percent offering . . . . . . . . . . . . . . . 44.0 56.7Monthly fee (low balance) . . . . . . . . 8.11 7.81Minimum balance to avoid fee . . . . . 1,079 1,052Minimum balance to open . . . . . . . . 654 663
Type of account or service 1996 1997
AUTOMATED TELLER MACHINES(ATMs)
Percent offering . . . . . . . . . . . . . . . . . 72.9 79.4
Annual fee:Percent charging . . . . . . . . . . . . . . 13.4 16.7Average . . . . . . . . . . . . . . . . . . . . 7.94 11.51
Fees for customer transactions on us: 4
Withdrawals:Percent charging. . . . . . . . . . . . . 6.8 7.4Average . . . . . . . . . . . . . . . . . . 0.59 0.65
Balance inquiries:Percent charging. . . . . . . . . . . . . 4.4 6.7Average . . . . . . . . . . . . . . . . . . 0.70 0.65
Fees for customer transactions onothers: 4
Withdrawals:Percent charging. . . . . . . . . . . . . 79.8 67.0Average . . . . . . . . . . . . . . . . . . 1.10 1.06
Balance inquiries:Percent charging. . . . . . . . . . . . . 64.7 55.2Average . . . . . . . . . . . . . . . . . . 1.03 0.99
Surcharge: 5
Percent charging . . . . . . . . . . . . . . 44.8 60.1Average . . . . . . . . . . . . . . . . . . . . 1.19 1.14
1 A monthly fee for balances below the minimum, no monthly fee for balances above the minimum, and no other charges.2 A monthly fee, no minimum balance to eliminate the fee, and a charge per check in some cases. 3 NOW (negotiable order ofwithdrawal) accounts are checking accounts that pay interest and often have fee structures that differ from those of noninterestchecking accounts. 4 An institution’s ‘‘customer’’ is one who has an account at the institution. A customer’s ATM transactions inwhich the machine used is that of the customer’s institution are called ‘‘on us’’; a customer’s transactions in which the machine usedis that of another institution are called ‘‘on others’’. 5 An ATM surcharge is a fee imposed by the ATMs institution, typically onevery transaction by the machine’s noncustomer users.
Source: Board of Governors of the Federal Reserve Systems, Annual Report to the Congress on Retail Fees and Servicesof Depository Institutions, June 1998.
No. 809. Insured Commercial Banks—Assets and Liabilities: 1980 to 1998
[In billions of dollars, except as indicated (1,856 represents $1,856,000,000,000). As of Dec. 31. Includes outlying areas.Except as noted, includes foreign branches of U.S. banks]
Item 1980 1985 1990 1993 1994 1995 1996 1997 1998 1
Number of banks reporting . . . . . . . . 14,435 14,417 12,343 10,958 10,450 9,940 9,528 9,142 8,774
Assets, total. . . . . . . . . . . . . . 1,856 2,731 3,389 3,706 4,011 4,313 4,578 5,015 5,441Net loans and leases. . . . . . . . . . . . 1,006 1,608 2,055 2,097 2,306 2,550 2,758 2,916 3,181
Real estate loans . . . . . . . . . . . . 269 438 830 923 998 1,080 1,139 1,244 1,345Home equity loans 2 . . . . . . . . . (NA) (NA) 61 73 76 79 85 98 97
Commercial and industrial loans. . . 391 578 615 539 589 661 710 796 899Loans to individuals . . . . . . . . . . . 187 309 404 419 487 535 562 561 571
Credit cards and related plans . . (NA) (NA) 134 153 187 216 232 231 229Farm loans. . . . . . . . . . . . . . . . . 32 36 33 37 39 40 41 45 46Other loans and leases. . . . . . . . . 158 288 242 239 251 292 364 329 381Less: Reserve for losses. . . . . . . . 10 23 56 53 52 53 53 55 57Less: Unearned income . . . . . . . . 21 18 14 7 6 6 5 4 4Loans to non-U.S. borrowers 3 . . . . 196 235 190 180 201 232 279 302 334
Percent of total loans andleases . . . . . . . . . . . . . . . . . 19 14 9 8 9 9 10 10 10
Investment securities . . . . . . . . . . . . 325 439 605 837 823 811 801 872 980Other . . . . . . . . . . . . . . . . . . . . . . 524 684 730 772 881 952 1,020 1,227 1,280
Domestic office assets . . . . . . . . . . . 1,533 2,326 2,999 3,258 3,483 3,728 3,906 4,267 4,733Foreign office assets . . . . . . . . . . . . 323 406 390 448 527 585 672 748 708
Liabilities and capital, total . . . . . 1,856 2,731 3,389 3,706 4,011 4,313 4,578 5,015 5,441Noninterest-bearing deposits 4. . . . . . 432 471 489 572 572 612 664 676 719Interest-bearing deposits 5 . . . . . . . . 1,049 1,646 2,162 2,182 2,302 2,416 2,533 2,745 2,963Subordinated debt. . . . . . . . . . . . . . 7 15 24 37 41 44 51 62 73Other liabilities . . . . . . . . . . . . . . . . 260 429 496 618 783 892 954 1,113 1,224Equity capital . . . . . . . . . . . . . . . . . 108 169 219 296 312 350 375 418 462
Domestic office deposits. . . . . . . . . . 1,187 1,796 2,357 2,424 2,443 2,573 2,724 2,896 3,110Foreign office deposits . . . . . . . . . . . 294 322 293 330 432 454 474 526 572
NA Not available. 1 Preliminary. 2 For one- to four-family residential properties. 3 Includes leases and commercial andindustrial loans to non-U.S. addressees, loans to foreign governments, real estate loans in foreign offices, and loans to banks inforeign countries. 4 Prior to 1984, demand deposits. 5 Prior to 1984, time and savings deposits.
Source: U.S. Federal Deposit Insurance Corporation, The FDIC Quarterly Banking Profile, Annual Report, and Statistics onBanking, annual.
Banking, Finance, and Insurance 521
U.S. Census Bureau, Statistical Abstract of the United States: 1999
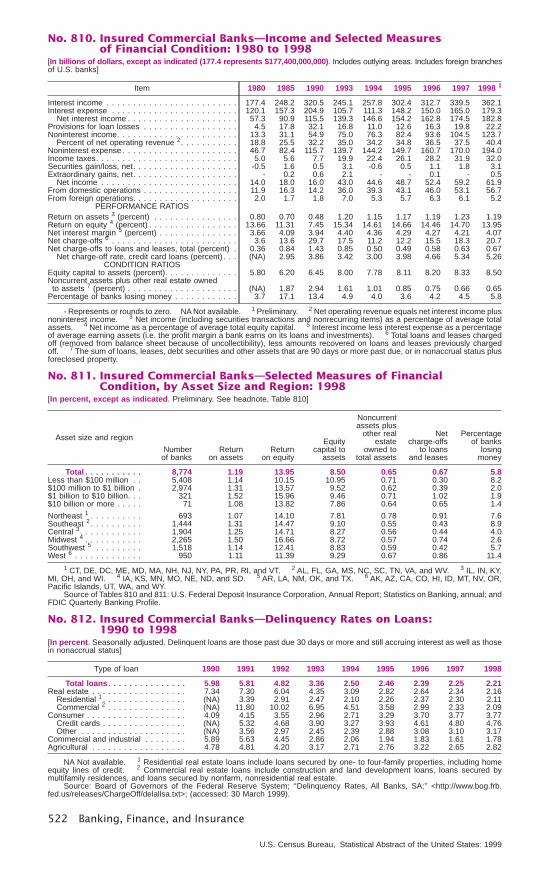
No. 810. Insured Commercial Banks—Income and Selected Measuresof Financial Condition: 1980 to 1998
[In billions of dollars, except as indicated (177.4 represents $177,400,000,000). Includes outlying areas. Includes foreign branchesof U.S. banks]
Item 1980 1985 1990 1993 1994 1995 1996 1997 1998 1
Interest income . . . . . . . . . . . . . . . . . . . . . . . . . 177.4 248.2 320.5 245.1 257.8 302.4 312.7 339.5 362.1Interest expense . . . . . . . . . . . . . . . . . . . . . . . . 120.1 157.3 204.9 105.7 111.3 148.2 150.0 165.0 179.3
Net interest income . . . . . . . . . . . . . . . . . . . . . 57.3 90.9 115.5 139.3 146.6 154.2 162.8 174.5 182.8Provisions for loan losses . . . . . . . . . . . . . . . . . . 4.5 17.8 32.1 16.8 11.0 12.6 16.3 19.8 22.2Noninterest income. . . . . . . . . . . . . . . . . . . . . . . 13.3 31.1 54.9 75.0 76.3 82.4 93.6 104.5 123.7
Percent of net operating revenue 2. . . . . . . . . . . 18.8 25.5 32.2 35.0 34.2 34.8 36.5 37.5 40.4Noninterest expense . . . . . . . . . . . . . . . . . . . . . . 46.7 82.4 115.7 139.7 144.2 149.7 160.7 170.0 194.0Income taxes. . . . . . . . . . . . . . . . . . . . . . . . . . . 5.0 5.6 7.7 19.9 22.4 26.1 28.2 31.9 32.0Securities gain/loss, net. . . . . . . . . . . . . . . . . . . . -0.5 1.6 0.5 3.1 -0.6 0.5 1.1 1.8 3.1Extraordinary gains, net. . . . . . . . . . . . . . . . . . . . - 0.2 0.6 2.1 - - 0.1 - 0.5
Net income . . . . . . . . . . . . . . . . . . . . . . . . . . 14.0 18.0 16.0 43.0 44.6 48.7 52.4 59.2 61.9From domestic operations . . . . . . . . . . . . . . . . . . 11.9 16.3 14.2 36.0 39.3 43.1 46.0 53.1 56.7From foreign operations. . . . . . . . . . . . . . . . . . . . 2.0 1.7 1.8 7.0 5.3 5.7 6.3 6.1 5.2
PERFORMANCE RATIOSReturn on assets 3 (percent) . . . . . . . . . . . . . . . . 0.80 0.70 0.48 1.20 1.15 1.17 1.19 1.23 1.19Return on equity 4 (percent) . . . . . . . . . . . . . . . . . 13.66 11.31 7.45 15.34 14.61 14.66 14.46 14.70 13.95Net interest margin 5 (percent) . . . . . . . . . . . . . . . 3.66 4.09 3.94 4.40 4.36 4.29 4.27 4.21 4.07Net charge-offs 6 . . . . . . . . . . . . . . . . . . . . . . . . 3.6 13.6 29.7 17.5 11.2 12.2 15.5 18.3 20.7Net charge-offs to loans and leases, total (percent) . 0.36 0.84 1.43 0.85 0.50 0.49 0.58 0.63 0.67
Net charge-off rate, credit card loans (percent) . . . (NA) 2.95 3.86 3.42 3.00 3.98 4.66 5.34 5.26CONDITION RATIOS
Equity capital to assets (percent). . . . . . . . . . . . . . 5.80 6.20 6.45 8.00 7.78 8.11 8.20 8.33 8.50Noncurrent assets plus other real estate ownedto assets 7 (percent) . . . . . . . . . . . . . . . . . . . . . (NA) 1.87 2.94 1.61 1.01 0.85 0.75 0.66 0.65
Percentage of banks losing money . . . . . . . . . . . . 3.7 17.1 13.4 4.9 4.0 3.6 4.2 4.5 5.8
- Represents or rounds to zero. NA Not available. 1 Preliminary. 2 Net operating revenue equals net interest income plusnoninterest income. 3 Net income (including securities transactions and nonrecurring items) as a percentage of average totalassets. 4 Net income as a percentage of average total equity capital. 5 Interest income less interest expense as a percentageof average earning assets (i.e. the profit margin a bank earns on its loans and investments). 6 Total loans and leases chargedoff (removed from balance sheet because of uncollectibility), less amounts recovered on loans and leases previously chargedoff. 7 The sum of loans, leases, debt securities and other assets that are 90 days or more past due, or in nonaccrual status plusforeclosed property.
No. 811. Insured Commercial Banks—Selected Measures of FinancialCondition, by Asset Size and Region: 1998
[In percent, except as indicated. Preliminary. See headnote, Table 810]
Asset size and region
Numberof banks
Returnon assets
Returnon equity
Equitycapital to
assets
Noncurrentassets plus
other realestate
owned tototal assets
Netcharge-offs
to loansand leases
Percentageof banks
losingmoney
Total . . . . . . . . . . . 8,774 1.19 13.95 8.50 0.65 0.67 5.8Less than $100 million . . 5,408 1.14 10.15 10.95 0.71 0.30 8.2$100 million to $1 billion . 2,974 1.31 13.57 9.52 0.62 0.39 2.0$1 billion to $10 billion. . . 321 1.52 15.96 9.46 0.71 1.02 1.9$10 billion or more . . . . . 71 1.08 13.82 7.86 0.64 0.65 1.4
Northeast 1 . . . . . . . . . . 693 1.07 14.10 7.81 0.78 0.91 7.6Southeast 2 . . . . . . . . . . 1,444 1.31 14.47 9.10 0.55 0.43 8.9Central 3. . . . . . . . . . . . 1,904 1.25 14.71 8.27 0.56 0.44 4.0Midwest 4 . . . . . . . . . . . 2,265 1.50 16.66 8.72 0.57 0.74 2.6Southwest 5 . . . . . . . . . 1,518 1.14 12.41 8.83 0.59 0.42 5.7West 6 . . . . . . . . . . . . . 950 1.11 11.39 9.29 0.67 0.86 11.4
1 CT, DE, DC, ME, MD, MA, NH, NJ, NY, PA, PR, RI, and VT. 2 AL, FL, GA, MS, NC, SC, TN, VA, and WV. 3 IL, IN, KY,MI, OH, and WI. 4 IA, KS, MN, MO, NE, ND, and SD. 5 AR, LA, NM, OK, and TX. 6 AK, AZ, CA, CO, HI, ID, MT, NV, OR,Pacific Islands, UT, WA, and WY.
Source of Tables 810 and 811: U.S. Federal Deposit Insurance Corporation, Annual Report; Statistics on Banking, annual; andFDIC Quarterly Banking Profile.
No. 812. Insured Commercial Banks—Delinquency Rates on Loans:1990 to 1998
[In percent. Seasonally adjusted. Delinquent loans are those past due 30 days or more and still accruing interest as well as thosein nonaccrual status]
Type of loan 1990 1991 1992 1993 1994 1995 1996 1997 1998
Total loans. . . . . . . . . . . . . . . 5.98 5.81 4.82 3.36 2.50 2.46 2.39 2.25 2.21Real estate . . . . . . . . . . . . . . . . . . 7.34 7.30 6.04 4.35 3.09 2.82 2.64 2.34 2.16
Residential 1 . . . . . . . . . . . . . . . . (NA) 3.39 2.91 2.47 2.10 2.26 2.37 2.30 2.11Commercial 2 . . . . . . . . . . . . . . . (NA) 11.80 10.02 6.95 4.51 3.58 2.99 2.33 2.09
Consumer . . . . . . . . . . . . . . . . . . . 4.09 4.15 3.55 2.96 2.71 3.29 3.70 3.77 3.77Credit cards . . . . . . . . . . . . . . . . (NA) 5.32 4.68 3.90 3.27 3.93 4.61 4.80 4.76Other . . . . . . . . . . . . . . . . . . . . (NA) 3.56 2.97 2.45 2.39 2.88 3.08 3.10 3.17
Commercial and industrial . . . . . . . . 5.89 5.63 4.45 2.86 2.06 1.94 1.83 1.61 1.78Agricultural . . . . . . . . . . . . . . . . . . 4.78 4.81 4.20 3.17 2.71 2.76 3.22 2.65 2.82
NA Not available. 1 Residential real estate loans include loans secured by one- to four-family properties, including homeequity lines of credit. 2 Commercial real estate loans include construction and land development loans, loans secured bymultifamily residences, and loans secured by nonfarm, nonresidential real estate.
Source: Board of Governors of the Federal Reserve System; ‘‘Delinquency Rates, All Banks, SA;’’ <http://www.bog.frb.fed.us/releases/ChargeOff/delallsa.txt>; (accessed: 30 March 1999).
522 Banking, Finance, and Insurance
U.S. Census Bureau, Statistical Abstract of the United States: 1999

No. 813. U.S. Banking Offices of Foreign Banks—Summary: 1980 to 1997
[In billions of dollars, except as indicated (201 represents $201,000,000,000). As of December. Covers agencies, branches,subsidiary commercial banks, and New York State investment companies]
Item1980 1985 1990 1993 1994 1995 1996 1997
Share 1
1980 1990 1995 1997
Assets . . . . . . . . . . . . . . . . 201 441 791 856 944 984 989 1,120 11.9 21.4 21.7 21.2Loans, total . . . . . . . . . . . . . 121 247 398 380 419 461 460 493 13.4 18.0 17.3 16.1
Business . . . . . . . . . . . . . 60 109 193 196 216 249 264 281 18.2 30.8 35.1 33.2Deposits . . . . . . . . . . . . . . . 80 237 384 466 523 523 527 592 6.6 14.5 17.6 17.6
1 Percent of ‘‘domestically owned’’ commercial banks plus U.S. offices of foreign banks.Source: Board of Governors of the Federal Reserve System, unpublished data.
No. 814. Foreign Lending by U.S. Banks, by Type of Borrowerand Country: 1998
[In millions of dollars (367,397 represents $367,397,000,000). As of December. Covers 108 U.S. banking organizations whichdo nearly all of the foreign lending in the country. Data represent claims on foreign residents and institutions held at all domesticand foreign offices of covered banks. Data cover only cross-border and nonlocal currency lending. These result from a U.S. bank’soffice in one country lending to residents of another country or lending in a currency other than that of the borrower’s country.Excludes local currency loans and other claims and local currency liabilities held by banks’ foreign offices on residents of thecountry in which the office was located (e.g. Deutsche mark loans to German residents booked at the German branch of thereporting U.S. bank). Criteria for country selection is $4.5 billion or more]
CountryTotal Bank Public
Privatenon-bank
Total 1 . . . . . . . . . 367,397 111,651 109,827 145,920
Argentina . . . . . . . . . 11,602 2,170 2,846 6,586Australia. . . . . . . . . . 5,246 1,294 1,143 2,809Belgium . . . . . . . . . . 5,738 2,358 1,451 1,929Brazil. . . . . . . . . . . . 13,295 3,978 2,879 6,438Canada . . . . . . . . . . 12,180 3,218 2,389 6,573Cayman Islands. . . . . 15,497 6,123 184 9,190France. . . . . . . . . . . 21,125 9,650 6,274 5,201Germany . . . . . . . . . 31,358 9,976 16,684 4,698Hong Kong . . . . . . . . 4,825 2,215 18 2,592
CountryTotal Bank Public
Privatenon-bank
Italy. . . . . . . . . . . . . 17,835 3,859 12,016 1,960Japan . . . . . . . . . . . 34,012 4,924 25,514 3,574Korea, South . . . . . . 6,859 3,703 1,446 1,710Mexico. . . . . . . . . . . 19,457 1,429 7,836 10,192Netherlands . . . . . . . 13,176 4,930 2,414 5,832Netherlands Antilles . . 5,178 164 45 4,969Spain . . . . . . . . . . . 5,353 1,732 1,507 2,114Sweden . . . . . . . . . . 4,931 1,190 2,124 1,617Switzerland. . . . . . . . 7,507 3,023 1,335 3,149Turkey . . . . . . . . . . . 4,541 1,939 942 1,660United Kingdom. . . . . 38,123 19,018 1,015 18,090
1 Includes other countries, not shown separately.
Source: Board of Governors of the Federal Reserve System, Federal Financial Institutions Examination Council, statisticalrelease.
No. 815. Insured Commercial Banks, by State and Other Area: 1998
[In billions of dollars, except number of banks (5,440.9 represents $5,440,900,000,000). As of December 31. Includes foreignbranches of U.S. banks]
State Number Assets Deposits
Total . . . . . . . . . . . . 8,774 5,440.9 3,681.5United States. . . . . . . . 8,756 5,398.4 3,655.1
Alabama . . . . . . . . . . . . . 160 140.9 101.8Alaska . . . . . . . . . . . . . . 6 5.1 3.8Arizona . . . . . . . . . . . . . . 43 42.3 25.1Arkansas. . . . . . . . . . . . . 202 25.1 21.5California. . . . . . . . . . . . . 336 516.0 398.9Colorado . . . . . . . . . . . . . 195 36.1 31.3Connecticut . . . . . . . . . . . 28 6.5 5.1Delaware. . . . . . . . . . . . . 34 131.3 54.2District of Columbia. . . . . . 7 1.3 1.0Florida . . . . . . . . . . . . . . 250 81.2 62.5Georgia . . . . . . . . . . . . . 349 76.6 47.3Hawaii . . . . . . . . . . . . . . 12 24.2 16.6Idaho . . . . . . . . . . . . . . . 17 1.8 1.6Illinois . . . . . . . . . . . . . . . 745 297.3 207.6Indiana . . . . . . . . . . . . . . 169 73.4 54.5Iowa. . . . . . . . . . . . . . . . 443 46.6 38.0Kansas . . . . . . . . . . . . . . 393 34.0 28.9Kentucky. . . . . . . . . . . . . 261 52.3 39.9Louisiana . . . . . . . . . . . . 150 49.0 39.5Maine . . . . . . . . . . . . . . . 17 5.0 4.0Maryland. . . . . . . . . . . . . 80 44.6 33.5Massachusetts . . . . . . . . . 44 137.5 94.5Michigan . . . . . . . . . . . . . 165 117.2 87.0Minnesota . . . . . . . . . . . . 514 147.8 103.7Mississippi. . . . . . . . . . . . 96 26.9 21.6Missouri . . . . . . . . . . . . . 382 79.6 62.0Montana . . . . . . . . . . . . . 89 9.9 8.2
State Number Assets Deposits
Nebraska . . . . . . . . . . . . 315 28.0 23.0Nevada. . . . . . . . . . . . . . 26 27.5 8.8New Hampshire . . . . . . . . 19 16.1 11.1New Jersey . . . . . . . . . . . 72 96.9 74.2New Mexico. . . . . . . . . . . 58 15.0 11.4New York . . . . . . . . . . . . 153 1,143.7 677.5North Carolina . . . . . . . . . 67 665.7 414.5North Dakota . . . . . . . . . . 114 10.8 8.1Ohio. . . . . . . . . . . . . . . . 220 267.4 170.4Oklahoma . . . . . . . . . . . . 309 35.6 28.7Oregon . . . . . . . . . . . . . . 42 6.3 5.3Pennsylvania . . . . . . . . . . 197 198.4 137.0Rhode Island . . . . . . . . . . 7 90.5 56.6South Carolina . . . . . . . . . 77 19.0 15.6South Dakota. . . . . . . . . . 104 29.7 11.7Tennessee. . . . . . . . . . . . 204 102.5 76.4Texas . . . . . . . . . . . . . . . 799 179.9 149.2Utah. . . . . . . . . . . . . . . . 50 45.2 22.9Vermont . . . . . . . . . . . . . 21 7.6 6.4Virginia . . . . . . . . . . . . . . 152 75.0 52.0Washington . . . . . . . . . . . 78 12.7 10.6West Virginia . . . . . . . . . . 89 23.6 18.8Wisconsin . . . . . . . . . . . . 344 81.7 62.2Wyoming. . . . . . . . . . . . . 52 10.1 9.1
American Samoa. . . . . . 1 0.1 (Z)Puerto Rico . . . . . . . . . 12 41.5 25.6Guam . . . . . . . . . . . . . 2 0.8 0.7Pacific Islands. . . . . . . . 1 (Z) (Z)Virgin Islands . . . . . . . . 2 0.1 0.1
Z Less than $50 million.
Source: U.S. Federal Deposit Insurance Corporation, Statistics on Banking, annual.
Banking, Finance, and Insurance 523
U.S. Census Bureau, Statistical Abstract of the United States: 1999
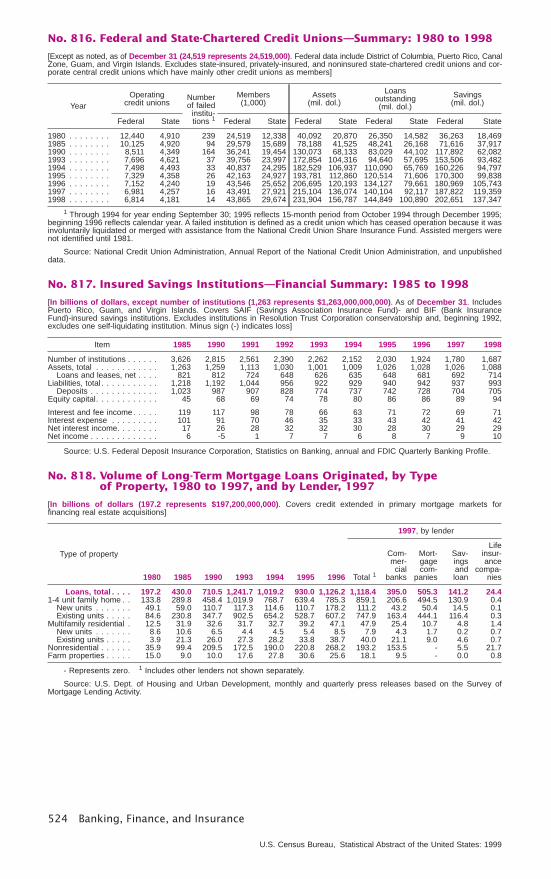
No. 816. Federal and State-Chartered Credit Unions—Summary: 1980 to 1998
[Except as noted, as of December 31 (24,519 represents 24,519,000). Federal data include District of Columbia, Puerto Rico, CanalZone, Guam, and Virgin Islands. Excludes state-insured, privately-insured, and noninsured state-chartered credit unions and cor-porate central credit unions which have mainly other credit unions as members]
YearOperating
credit unionsNumberof failed
institu-tions 1
Members(1,000)
Assets(mil. dol.)
Loansoutstanding(mil. dol.)
Savings(mil. dol.)
Federal State Federal State Federal State Federal State Federal State
1980 . . . . . . . . 12,440 4,910 239 24,519 12,338 40,092 20,870 26,350 14,582 36,263 18,4691985 . . . . . . . . 10,125 4,920 94 29,579 15,689 78,188 41,525 48,241 26,168 71,616 37,9171990 . . . . . . . . 8,511 4,349 164 36,241 19,454 130,073 68,133 83,029 44,102 117,892 62,0821993 . . . . . . . . 7,696 4,621 37 39,756 23,997 172,854 104,316 94,640 57,695 153,506 93,4821994 . . . . . . . . 7,498 4,493 33 40,837 24,295 182,529 106,937 110,090 65,769 160,226 94,7971995 . . . . . . . . 7,329 4,358 26 42,163 24,927 193,781 112,860 120,514 71,606 170,300 99,8381996 . . . . . . . . 7,152 4,240 19 43,546 25,652 206,695 120,193 134,127 79,661 180,969 105,7431997 . . . . . . . . 6,981 4,257 16 43,491 27,921 215,104 136,074 140,104 92,117 187,822 119,3591998 . . . . . . . . 6,814 4,181 14 43,865 29,674 231,904 156,787 144,849 100,890 202,651 137,347
1 Through 1994 for year ending September 30; 1995 reflects 15-month period from October 1994 through December 1995;beginning 1996 reflects calendar year. A failed institution is defined as a credit union which has ceased operation because it wasinvoluntarily liquidated or merged with assistance from the National Credit Union Share Insurance Fund. Assisted mergers werenot identified until 1981.
Source: National Credit Union Administration, Annual Report of the National Credit Union Administration, and unpublisheddata.
No. 817. Insured Savings Institutions—Financial Summary: 1985 to 1998
[In billions of dollars, except number of institutions (1,263 represents $1,263,000,000,000). As of December 31. IncludesPuerto Rico, Guam, and Virgin Islands. Covers SAIF (Savings Association Insurance Fund)- and BIF (Bank InsuranceFund)-insured savings institutions. Excludes institutions in Resolution Trust Corporation conservatorship and, beginning 1992,excludes one self-liquidating institution. Minus sign (-) indicates loss]
Item 1985 1990 1991 1992 1993 1994 1995 1996 1997 1998
Number of institutions . . . . . . 3,626 2,815 2,561 2,390 2,262 2,152 2,030 1,924 1,780 1,687Assets, total . . . . . . . . . . . . 1,263 1,259 1,113 1,030 1,001 1,009 1,026 1,028 1,026 1,088
Loans and leases, net . . . . 821 812 724 648 626 635 648 681 692 714Liabilities, total . . . . . . . . . . . 1,218 1,192 1,044 956 922 929 940 942 937 993
Deposits . . . . . . . . . . . . . 1,023 987 907 828 774 737 742 728 704 705Equity capital. . . . . . . . . . . . 45 68 69 74 78 80 86 86 89 94
Interest and fee income. . . . . 119 117 98 78 66 63 71 72 69 71Interest expense . . . . . . . . . 101 91 70 46 35 33 43 42 41 42Net interest income. . . . . . . . 17 26 28 32 32 30 28 30 29 29Net income . . . . . . . . . . . . . 6 -5 1 7 7 6 8 7 9 10
Source: U.S. Federal Deposit Insurance Corporation, Statistics on Banking, annual and FDIC Quarterly Banking Profile.
No. 818. Volume of Long-Term Mortgage Loans Originated, by Typeof Property, 1980 to 1997, and by Lender, 1997
[In billions of dollars (197.2 represents $197,200,000,000). Covers credit extended in primary mortgage markets forfinancing real estate acquisitions]
Type of property
1980 1985 1990 1993 1994 1995 1996
1997, by lender
Total 1
Com-mer-cial
banks
Mort-gagecom-
panies
Sav-ingsandloan
Lifeinsur-ance
compa-nies
Loans, total . . . . 197.2 430.0 710.5 1,241.7 1,019.2 930.0 1,126.2 1,118.4 395.0 505.3 141.2 24.41-4 unit family home . . 133.8 289.8 458.4 1,019.9 768.7 639.4 785.3 859.1 206.6 494.5 130.9 0.4
New units . . . . . . . 49.1 59.0 110.7 117.3 114.6 110.7 178.2 111.2 43.2 50.4 14.5 0.1Existing units . . . . . 84.6 230.8 347.7 902.5 654.2 528.7 607.2 747.9 163.4 444.1 116.4 0.3
Multifamily residential . 12.5 31.9 32.6 31.7 32.7 39.2 47.1 47.9 25.4 10.7 4.8 1.4New units . . . . . . . 8.6 10.6 6.5 4.4 4.5 5.4 8.5 7.9 4.3 1.7 0.2 0.7Existing units . . . . . 3.9 21.3 26.0 27.3 28.2 33.8 38.7 40.0 21.1 9.0 4.6 0.7
Nonresidential . . . . . . 35.9 99.4 209.5 172.5 190.0 220.8 268.2 193.2 153.5 - 5.5 21.7Farm properties . . . . . 15.0 9.0 10.0 17.6 27.8 30.6 25.6 18.1 9.5 - 0.0 0.8
- Represents zero. 1 Includes other lenders not shown separately.
Source: U.S. Dept. of Housing and Urban Development, monthly and quarterly press releases based on the Survey ofMortgage Lending Activity.
524 Banking, Finance, and Insurance
U.S. Census Bureau, Statistical Abstract of the United States: 1999
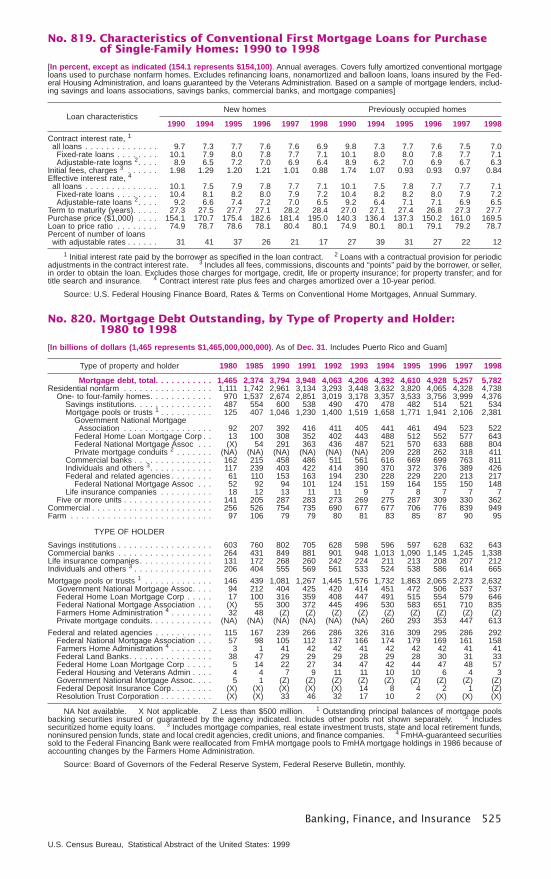
No. 819. Characteristics of Conventional First Mortgage Loans for Purchaseof Single-Family Homes: 1990 to 1998
[In percent, except as indicated (154.1 represents $154,100). Annual averages. Covers fully amortized conventional mortgageloans used to purchase nonfarm homes. Excludes refinancing loans, nonamortized and balloon loans, loans insured by the Fed-eral Housing Administration, and loans guaranteed by the Veterans Administration. Based on a sample of mortgage lenders, includ-ing savings and loans associations, savings banks, commercial banks, and mortgage companies]
Loan characteristicsNew homes Previously occupied homes
1990 1994 1995 1996 1997 1998 1990 1994 1995 1996 1997 1998
Contract interest rate, 1
all loans . . . . . . . . . . . . . . 9.7 7.3 7.7 7.6 7.6 6.9 9.8 7.3 7.7 7.6 7.5 7.0Fixed-rate loans . . . . . . . . 10.1 7.9 8.0 7.8 7.7 7.1 10.1 8.0 8.0 7.8 7.7 7.1Adjustable-rate loans 2. . . . 8.9 6.5 7.2 7.0 6.9 6.4 8.9 6.2 7.0 6.9 6.7 6.3
Initial fees, charges 3 . . . . . . 1.98 1.29 1.20 1.21 1.01 0.88 1.74 1.07 0.93 0.93 0.97 0.84Effective interest rate, 4
all loans . . . . . . . . . . . . . . 10.1 7.5 7.9 7.8 7.7 7.1 10.1 7.5 7.8 7.7 7.7 7.1Fixed-rate loans . . . . . . . . 10.4 8.1 8.2 8.0 7.9 7.2 10.4 8.2 8.2 8.0 7.9 7.2Adjustable-rate loans 2. . . . 9.2 6.6 7.4 7.2 7.0 6.5 9.2 6.4 7.1 7.1 6.9 6.5
Term to maturity (years). . . . . 27.3 27.5 27.7 27.1 28.2 28.4 27.0 27.1 27.4 26.8 27.3 27.7Purchase price ($1,000) . . . . 154.1 170.7 175.4 182.6 181.4 195.0 140.3 136.4 137.3 150.2 161.0 169.5Loan to price ratio . . . . . . . . 74.9 78.7 78.6 78.1 80.4 80.1 74.9 80.1 80.1 79.1 79.2 78.7Percent of number of loanswith adjustable rates . . . . . . 31 41 37 26 21 17 27 39 31 27 22 12
1 Initial interest rate paid by the borrower as specified in the loan contract. 2 Loans with a contractual provision for periodicadjustments in the contract interest rate. 3 Includes all fees, commissions, discounts and ‘‘points’’ paid by the borrower, or seller,in order to obtain the loan. Excludes those charges for mortgage, credit, life or property insurance; for property transfer; and fortitle search and insurance. 4 Contract interest rate plus fees and charges amortized over a 10-year period.
Source: U.S. Federal Housing Finance Board, Rates & Terms on Conventional Home Mortgages, Annual Summary.
No. 820. Mortgage Debt Outstanding, by Type of Property and Holder:1980 to 1998
[In billions of dollars (1,465 represents $1,465,000,000,000). As of Dec. 31. Includes Puerto Rico and Guam]
Type of property and holder 1980 1985 1990 1991 1992 1993 1994 1995 1996 1997 1998
Mortgage debt, total. . . . . . . . . . . 1,465 2,374 3,794 3,948 4,063 4,206 4,392 4,610 4,928 5,257 5,782Residential nonfarm . . . . . . . . . . . . . . . . . 1,111 1,742 2,961 3,134 3,293 3,448 3,632 3,820 4,065 4,328 4,738
One- to four-family homes. . . . . . . . . . . . 970 1,537 2,674 2,851 3,019 3,178 3,357 3,533 3,756 3,999 4,376Savings institutions. . . . . . . . . . . . . . . 487 554 600 538 490 470 478 482 514 521 534Mortgage pools or trusts 1 . . . . . . . . . . 125 407 1,046 1,230 1,400 1,519 1,658 1,771 1,941 2,106 2,381
Government National MortgageAssociation . . . . . . . . . . . . . . . . . 92 207 392 416 411 405 441 461 494 523 522
Federal Home Loan Mortgage Corp . . 13 100 308 352 402 443 488 512 552 577 643Federal National Mortgage Assoc . . . (X) 54 291 363 436 487 521 570 633 688 804Private mortgage conduits 2 . . . . . . . (NA) (NA) (NA) (NA) (NA) (NA) 209 228 262 318 411
Commercial banks . . . . . . . . . . . . . . . 162 215 458 486 511 561 616 669 699 763 811Individuals and others 3. . . . . . . . . . . . 117 239 403 422 414 390 370 372 376 389 426Federal and related agencies . . . . . . . . 61 110 153 163 194 230 228 229 220 213 217
Federal National Mortgage Assoc . . . 52 92 94 101 124 151 159 164 155 150 148Life insurance companies . . . . . . . . . . 18 12 13 11 11 9 7 8 7 7 7
Five or more units . . . . . . . . . . . . . . . . . 141 205 287 283 273 269 275 287 309 330 362Commercial . . . . . . . . . . . . . . . . . . . . . . . 256 526 754 735 690 677 677 706 776 839 949Farm . . . . . . . . . . . . . . . . . . . . . . . . . . . 97 106 79 79 80 81 83 85 87 90 95
TYPE OF HOLDER
Savings institutions . . . . . . . . . . . . . . . . . . 603 760 802 705 628 598 596 597 628 632 643Commercial banks . . . . . . . . . . . . . . . . . . 264 431 849 881 901 948 1,013 1,090 1,145 1,245 1,338Life insurance companies. . . . . . . . . . . . . . 131 172 268 260 242 224 211 213 208 207 212Individuals and others 3 . . . . . . . . . . . . . . . 206 404 555 569 561 533 524 538 586 614 665
Mortgage pools or trusts 1 . . . . . . . . . . . . . 146 439 1,081 1,267 1,445 1,576 1,732 1,863 2,065 2,273 2,632Government National Mortgage Assoc. . . . 94 212 404 425 420 414 451 472 506 537 537Federal Home Loan Mortgage Corp . . . . . 17 100 316 359 408 447 491 515 554 579 646Federal National Mortgage Association . . . (X) 55 300 372 445 496 530 583 651 710 835Farmers Home Administration 4 . . . . . . . . 32 48 (Z) (Z) (Z) (Z) (Z) (Z) (Z) (Z) (Z)Private mortgage conduits. . . . . . . . . . . . (NA) (NA) (NA) (NA) (NA) (NA) 260 293 353 447 613
Federal and related agencies . . . . . . . . . . . 115 167 239 266 286 326 316 309 295 286 292Federal National Mortgage Association . . . 57 98 105 112 137 166 174 179 169 161 158Farmers Home Administration 4 . . . . . . . . 3 1 41 42 42 41 42 42 42 41 41Federal Land Banks. . . . . . . . . . . . . . . . 38 47 29 29 29 28 29 28 30 31 33Federal Home Loan Mortgage Corp . . . . . 5 14 22 27 34 47 42 44 47 48 57Federal Housing and Veterans Admin . . . . 4 4 7 9 11 11 10 10 6 4 3Government National Mortgage Assoc. . . . 5 1 (Z) (Z) (Z) (Z) (Z) (Z) (Z) (Z) (Z)Federal Deposit Insurance Corp. . . . . . . . (X) (X) (X) (X) (X) 14 8 4 2 1 (Z)Resolution Trust Corporation . . . . . . . . . . (X) (X) 33 46 32 17 10 2 (X) (X) (X)
NA Not available. X Not applicable. Z Less than $500 million. 1 Outstanding principal balances of mortgage poolsbacking securities insured or guaranteed by the agency indicated. Includes other pools not shown separately. 2 Includessecuritized home equity loans. 3 Includes mortgage companies, real estate investment trusts, state and local retirement funds,noninsured pension funds, state and local credit agencies, credit unions, and finance companies. 4 FmHA-guaranteed securitiessold to the Federal Financing Bank were reallocated from FmHA mortgage pools to FmHA mortgage holdings in 1986 because ofaccounting changes by the Farmers Home Administration.
Source: Board of Governors of the Federal Reserve System, Federal Reserve Bulletin, monthly.
Banking, Finance, and Insurance 525
U.S. Census Bureau, Statistical Abstract of the United States: 1999
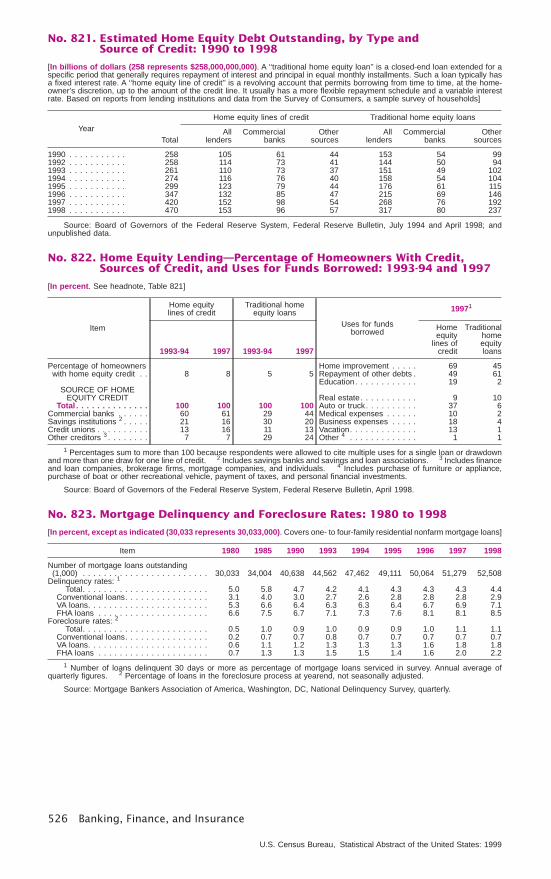
No. 821. Estimated Home Equity Debt Outstanding, by Type andSource of Credit: 1990 to 1998
[In billions of dollars (258 represents $258,000,000,000). A ‘‘traditional home equity loan’’ is a closed-end loan extended for aspecific period that generally requires repayment of interest and principal in equal monthly installments. Such a loan typically hasa fixed interest rate. A ‘‘home equity line of credit’’ is a revolving account that permits borrowing from time to time, at the home-owner’s discretion, up to the amount of the credit line. It usually has a more flexible repayment schedule and a variable interestrate. Based on reports from lending institutions and data from the Survey of Consumers, a sample survey of households]
YearTotal
Home equity lines of credit Traditional home equity loans
Alllenders
Commercialbanks
Othersources
Alllenders
Commercialbanks
Othersources
1990 . . . . . . . . . . . 258 105 61 44 153 54 991992 . . . . . . . . . . . 258 114 73 41 144 50 941993 . . . . . . . . . . . 261 110 73 37 151 49 1021994 . . . . . . . . . . . 274 116 76 40 158 54 1041995 . . . . . . . . . . . 299 123 79 44 176 61 1151996 . . . . . . . . . . . 347 132 85 47 215 69 1461997 . . . . . . . . . . . 420 152 98 54 268 76 1921998 . . . . . . . . . . . 470 153 96 57 317 80 237
Source: Board of Governors of the Federal Reserve System, Federal Reserve Bulletin, July 1994 and April 1998; andunpublished data.
No. 822. Home Equity Lending—Percentage of Homeowners With Credit,Sources of Credit, and Uses for Funds Borrowed: 1993-94 and 1997
[In percent. See headnote, Table 821]
Item
Home equitylines of credit
Traditional homeequity loans
Uses for fundsborrowed
19971
1993-94 1997 1993-94 1997
Homeequity
lines ofcredit
Traditionalhomeequityloans
Percentage of homeowners Home improvement . . . . . 69 45with home equity credit . . 8 8 5 5 Repayment of other debts . 49 61
Education. . . . . . . . . . . . 19 2SOURCE OF HOME
EQUITY CREDIT Real estate. . . . . . . . . . . 9 10Total . . . . . . . . . . . . . . 100 100 100 100 Auto or truck. . . . . . . . . . 37 6
Commercial banks . . . . . . 60 61 29 44 Medical expenses . . . . . . 10 2Savings institutions 2 . . . . . 21 16 30 20 Business expenses . . . . . 18 4Credit unions . . . . . . . . . . 13 16 11 13 Vacation. . . . . . . . . . . . . 13 1Other creditors 3 . . . . . . . . 7 7 29 24 Other 4 . . . . . . . . . . . . . 1 1
1 Percentages sum to more than 100 because respondents were allowed to cite multiple uses for a single loan or drawdownand more than one draw for one line of credit. 2 Includes savings banks and savings and loan associations. 3 Includes financeand loan companies, brokerage firms, mortgage companies, and individuals. 4 Includes purchase of furniture or appliance,purchase of boat or other recreational vehicle, payment of taxes, and personal financial investments.
Source: Board of Governors of the Federal Reserve System, Federal Reserve Bulletin, April 1998.
No. 823. Mortgage Delinquency and Foreclosure Rates: 1980 to 1998
[In percent, except as indicated (30,033 represents 30,033,000). Covers one- to four-family residential nonfarm mortgage loans]
Item 1980 1985 1990 1993 1994 1995 1996 1997 1998
Number of mortgage loans outstanding(1,000) . . . . . . . . . . . . . . . . . . . . . . . . 30,033 34,004 40,638 44,562 47,462 49,111 50,064 51,279 52,508
Delinquency rates: 1
Total. . . . . . . . . . . . . . . . . . . . . . . . 5.0 5.8 4.7 4.2 4.1 4.3 4.3 4.3 4.4Conventional loans. . . . . . . . . . . . . . . . 3.1 4.0 3.0 2.7 2.6 2.8 2.8 2.8 2.9VA loans. . . . . . . . . . . . . . . . . . . . . . . 5.3 6.6 6.4 6.3 6.3 6.4 6.7 6.9 7.1FHA loans . . . . . . . . . . . . . . . . . . . . . 6.6 7.5 6.7 7.1 7.3 7.6 8.1 8.1 8.5
Foreclosure rates: 2
Total. . . . . . . . . . . . . . . . . . . . . . . . 0.5 1.0 0.9 1.0 0.9 0.9 1.0 1.1 1.1Conventional loans. . . . . . . . . . . . . . . . 0.2 0.7 0.7 0.8 0.7 0.7 0.7 0.7 0.7VA loans. . . . . . . . . . . . . . . . . . . . . . . 0.6 1.1 1.2 1.3 1.3 1.3 1.6 1.8 1.8FHA loans . . . . . . . . . . . . . . . . . . . . . 0.7 1.3 1.3 1.5 1.5 1.4 1.6 2.0 2.2
1 Number of loans delinquent 30 days or more as percentage of mortgage loans serviced in survey. Annual average ofquarterly figures. 2 Percentage of loans in the foreclosure process at yearend, not seasonally adjusted.
Source: Mortgage Bankers Association of America, Washington, DC, National Delinquency Survey, quarterly.
526 Banking, Finance, and Insurance
U.S. Census Bureau, Statistical Abstract of the United States: 1999
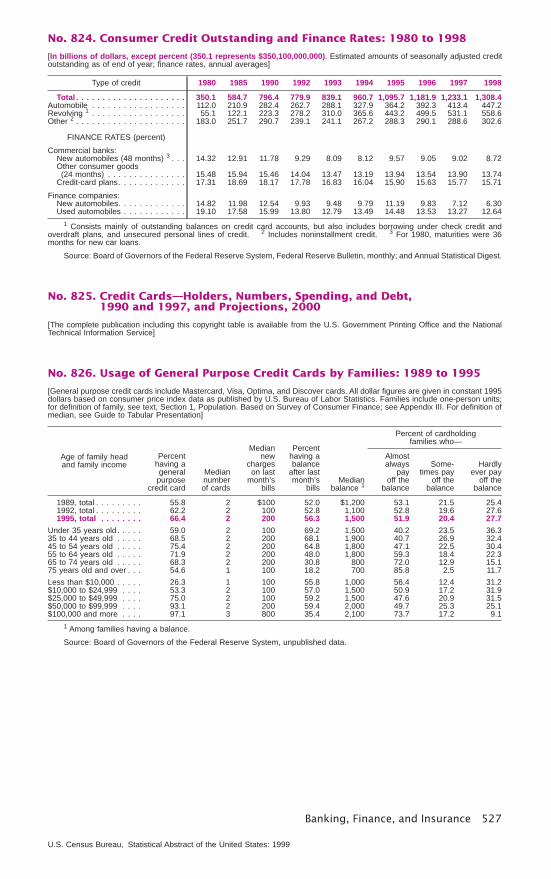
No. 824. Consumer Credit Outstanding and Finance Rates: 1980 to 1998
[In billions of dollars, except percent (350.1 represents $350,100,000,000). Estimated amounts of seasonally adjusted creditoutstanding as of end of year; finance rates, annual averages]
Type of credit 1980 1985 1990 1992 1993 1994 1995 1996 1997 1998
Total . . . . . . . . . . . . . . . . . . . . . 350.1 584.7 796.4 779.9 839.1 960.7 1,095.7 1,181.9 1,233.1 1,308.4Automobile . . . . . . . . . . . . . . . . . . 112.0 210.9 282.4 262.7 288.1 327.9 364.2 392.3 413.4 447.2Revolving 1 . . . . . . . . . . . . . . . . . . 55.1 122.1 223.3 278.2 310.0 365.6 443.2 499.5 531.1 558.6Other 2 . . . . . . . . . . . . . . . . . . . . . 183.0 251.7 290.7 239.1 241.1 267.2 288.3 290.1 288.6 302.6
FINANCE RATES (percent)
Commercial banks:New automobiles (48 months) 3 . . . 14.32 12.91 11.78 9.29 8.09 8.12 9.57 9.05 9.02 8.72Other consumer goods(24 months) . . . . . . . . . . . . . . . 15.48 15.94 15.46 14.04 13.47 13.19 13.94 13.54 13.90 13.74
Credit-card plans. . . . . . . . . . . . . 17.31 18.69 18.17 17.78 16.83 16.04 15.90 15.63 15.77 15.71
Finance companies:New automobiles. . . . . . . . . . . . . 14.82 11.98 12.54 9.93 9.48 9.79 11.19 9.83 7.12 6.30Used automobiles . . . . . . . . . . . . 19.10 17.58 15.99 13.80 12.79 13.49 14.48 13.53 13.27 12.64
1 Consists mainly of outstanding balances on credit card accounts, but also includes borrowing under check credit andoverdraft plans, and unsecured personal lines of credit. 2 Includes noninstallment credit. 3 For 1980, maturities were 36months for new car loans.
Source: Board of Governors of the Federal Reserve System, Federal Reserve Bulletin, monthly; and Annual Statistical Digest.
No. 825. Credit Cards—Holders, Numbers, Spending, and Debt,1990 and 1997, and Projections, 2000
[The complete publication including this copyright table is available from the U.S. Government Printing Office and the NationalTechnical Information Service]
No. 826. Usage of General Purpose Credit Cards by Families: 1989 to 1995
[General purpose credit cards include Mastercard, Visa, Optima, and Discover cards. All dollar figures are given in constant 1995dollars based on consumer price index data as published by U.S. Bureau of Labor Statistics. Families include one-person units;for definition of family, see text, Section 1, Population. Based on Survey of Consumer Finance; see Appendix III. For definition ofmedian, see Guide to Tabular Presentation]
Age of family headand family income
Percenthaving ageneral
purposecredit card
Mediannumberof cards
Mediannew
chargeson last
month’sbills
Percenthaving abalance
after lastmonth’s
billsMedian
balance 1
Percent of cardholdingfamilies who—
Almostalways
payoff the
balance
Some-times pay
off thebalance
Hardlyever pay
off thebalance
1989, total . . . . . . . . . 55.8 2 $100 52.0 $1,200 53.1 21.5 25.41992, total . . . . . . . . . 62.2 2 100 52.8 1,100 52.8 19.6 27.61995, total . . . . . . . . 66.4 2 200 56.3 1,500 51.9 20.4 27.7
Under 35 years old . . . . . 59.0 2 100 69.2 1,500 40.2 23.5 36.335 to 44 years old . . . . . 68.5 2 200 68.1 1,900 40.7 26.9 32.445 to 54 years old . . . . . 75.4 2 200 64.8 1,800 47.1 22.5 30.455 to 64 years old . . . . . 71.9 2 200 48.0 1,800 59.3 18.4 22.365 to 74 years old . . . . . 68.3 2 200 30.8 800 72.0 12.9 15.175 years old and over . . . 54.6 1 100 18.2 700 85.8 2.5 11.7
Less than $10,000 . . . . . 26.3 1 100 55.8 1,000 56.4 12.4 31.2$10,000 to $24,999 . . . . 53.3 2 100 57.0 1,500 50.9 17.2 31.9$25,000 to $49,999 . . . . 75.0 2 100 59.2 1,500 47.6 20.9 31.5$50,000 to $99,999 . . . . 93.1 2 200 59.4 2,000 49.7 25.3 25.1$100,000 and more . . . . 97.1 3 800 35.4 2,100 73.7 17.2 9.1
1 Among families having a balance.
Source: Board of Governors of the Federal Reserve System, unpublished data.
Banking, Finance, and Insurance 527
U.S. Census Bureau, Statistical Abstract of the United States: 1999
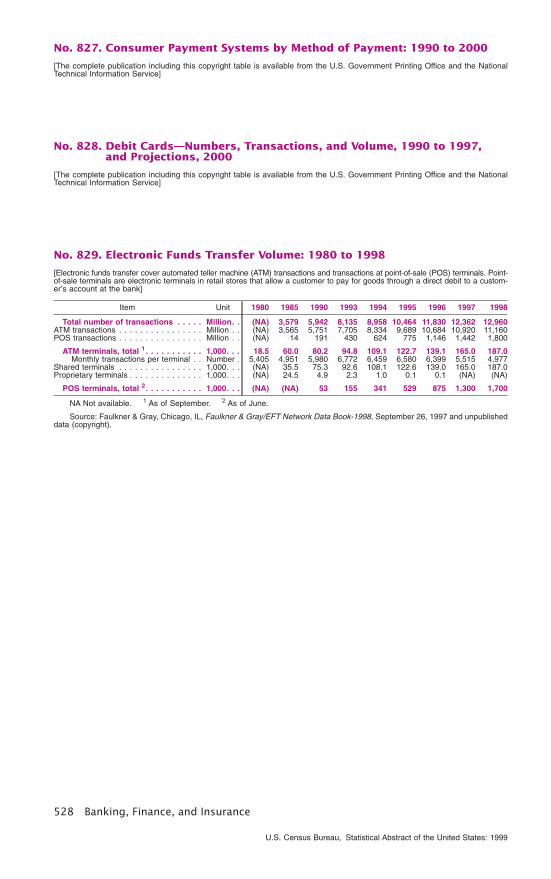
No. 827. Consumer Payment Systems by Method of Payment: 1990 to 2000
[The complete publication including this copyright table is available from the U.S. Government Printing Office and the NationalTechnical Information Service]
No. 828. Debit Cards—Numbers, Transactions, and Volume, 1990 to 1997,and Projections, 2000
[The complete publication including this copyright table is available from the U.S. Government Printing Office and the NationalTechnical Information Service]
No. 829. Electronic Funds Transfer Volume: 1980 to 1998
[Electronic funds transfer cover automated teller machine (ATM) transactions and transactions at point-of-sale (POS) terminals. Point-of-sale terminals are electronic terminals in retail stores that allow a customer to pay for goods through a direct debit to a custom-er’s account at the bank]
Item Unit 1980 1985 1990 1993 1994 1995 1996 1997 1998
Total number of transactions . . . . . Million. . (NA) 3,579 5,942 8,135 8,958 10,464 11,830 12,362 12,960ATM transactions . . . . . . . . . . . . . . . . Million . . (NA) 3,565 5,751 7,705 8,334 9,689 10,684 10,920 11,160POS transactions . . . . . . . . . . . . . . . . Million . . (NA) 14 191 430 624 775 1,146 1,442 1,800
ATM terminals, total 1 . . . . . . . . . . . 1,000. . . 18.5 60.0 80.2 94.8 109.1 122.7 139.1 165.0 187.0Monthly transactions per terminal . . Number . 5,405 4,951 5,980 6,772 6,459 6,580 6,399 5,515 4,977
Shared terminals . . . . . . . . . . . . . . . . 1,000. . . (NA) 35.5 75.3 92.6 108.1 122.6 139.0 165.0 187.0Proprietary terminals . . . . . . . . . . . . . . 1,000. . . (NA) 24.5 4.9 2.3 1.0 0.1 0.1 (NA) (NA)
POS terminals, total 2. . . . . . . . . . . 1,000. . . (NA) (NA) 53 155 341 529 875 1,300 1,700
NA Not available. 1 As of September. 2 As of June.
Source: Faulkner & Gray, Chicago, IL, Faulkner & Gray/EFT Network Data Book-1998, September 26, 1997 and unpublisheddata (copyright).
528 Banking, Finance, and Insurance
U.S. Census Bureau, Statistical Abstract of the United States: 1999
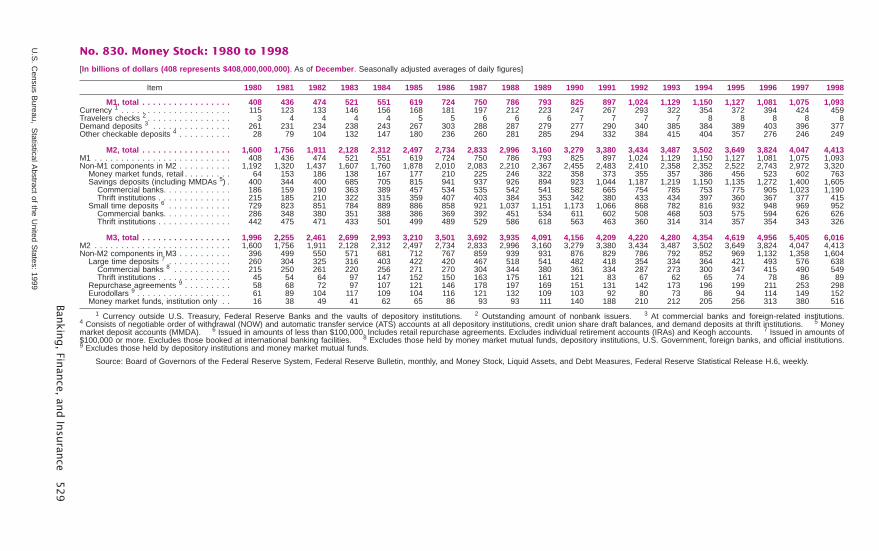
No. 830. Money Stock: 1980 to 1998
[In billions of dollars (408 represents $408,000,000,000). As of December. Seasonally adjusted averages of daily figures]
Item 1980 1981 1982 1983 1984 1985 1986 1987 1988 1989 1990 1991 1992 1993 1994 1995 1996 1997 1998
M1, total . . . . . . . . . . . . . . . . . 408 436 474 521 551 619 724 750 786 793 825 897 1,024 1,129 1,150 1,127 1,081 1,075 1,093Currency 1 . . . . . . . . . . . . . . . . . . . . . 115 123 133 146 156 168 181 197 212 223 247 267 293 322 354 372 394 424 459Travelers checks 2 . . . . . . . . . . . . . . . . 3 4 4 4 4 5 5 6 6 6 7 7 7 7 8 8 8 8 8Demand deposits 3 . . . . . . . . . . . . . . . 261 231 234 238 243 267 303 288 287 279 277 290 340 385 384 389 403 396 377Other checkable deposits 4 . . . . . . . . . . 28 79 104 132 147 180 236 260 281 285 294 332 384 415 404 357 276 246 249
M2, total . . . . . . . . . . . . . . . . . 1,600 1,756 1,911 2,128 2,312 2,497 2,734 2,833 2,996 3,160 3,279 3,380 3,434 3,487 3,502 3,649 3,824 4,047 4,413M1 . . . . . . . . . . . . . . . . . . . . . . . . . . 408 436 474 521 551 619 724 750 786 793 825 897 1,024 1,129 1,150 1,127 1,081 1,075 1,093Non-M1 components in M2 . . . . . . . . . . 1,192 1,320 1,437 1,607 1,760 1,878 2,010 2,083 2,210 2,367 2,455 2,483 2,410 2,358 2,352 2,522 2,743 2,972 3,320
Money market funds, retail . . . . . . . . . 64 153 186 138 167 177 210 225 246 322 358 373 355 357 386 456 523 602 763Savings deposits (including MMDAs 5) . 400 344 400 685 705 815 941 937 926 894 923 1,044 1,187 1,219 1,150 1,135 1,272 1,400 1,605
Commercial banks. . . . . . . . . . . . . 186 159 190 363 389 457 534 535 542 541 582 665 754 785 753 775 905 1,023 1,190Thrift institutions . . . . . . . . . . . . . . 215 185 210 322 315 359 407 403 384 353 342 380 433 434 397 360 367 377 415
Small time deposits 6 . . . . . . . . . . . . 729 823 851 784 889 886 858 921 1,037 1,151 1,173 1,066 868 782 816 932 948 969 952Commercial banks. . . . . . . . . . . . . 286 348 380 351 388 386 369 392 451 534 611 602 508 468 503 575 594 626 626Thrift institutions . . . . . . . . . . . . . . 442 475 471 433 501 499 489 529 586 618 563 463 360 314 314 357 354 343 326
M3, total . . . . . . . . . . . . . . . . . 1,996 2,255 2,461 2,699 2,993 3,210 3,501 3,692 3,935 4,091 4,156 4,209 4,220 4,280 4,354 4,619 4,956 5,405 6,016M2 . . . . . . . . . . . . . . . . . . . . . . . . . . 1,600 1,756 1,911 2,128 2,312 2,497 2,734 2,833 2,996 3,160 3,279 3,380 3,434 3,487 3,502 3,649 3,824 4,047 4,413Non-M2 components in M3 . . . . . . . . . . 396 499 550 571 681 712 767 859 939 931 876 829 786 792 852 969 1,132 1,358 1,604
Large time deposits 7 . . . . . . . . . . . . 260 304 325 316 403 422 420 467 518 541 482 418 354 334 364 421 493 576 638Commercial banks 8 . . . . . . . . . . . 215 250 261 220 256 271 270 304 344 380 361 334 287 273 300 347 415 490 549Thrift institutions . . . . . . . . . . . . . . 45 54 64 97 147 152 150 163 175 161 121 83 67 62 65 74 78 86 89
Repurchase agreements 9 . . . . . . . . . 58 68 72 97 107 121 146 178 197 169 151 131 142 173 196 199 211 253 298Eurodollars 9 . . . . . . . . . . . . . . . . . . 61 89 104 117 109 104 116 121 132 109 103 92 80 73 86 94 114 149 152Money market funds, institution only . . 16 38 49 41 62 65 86 93 93 111 140 188 210 212 205 256 313 380 516
1 Currency outside U.S. Treasury, Federal Reserve Banks and the vaults of depository institutions. 2 Outstanding amount of nonbank issuers. 3 At commercial banks and foreign-related institutions.4 Consists of negotiable order of withdrawal (NOW) and automatic transfer service (ATS) accounts at all depository institutions, credit union share draft balances, and demand deposits at thrift institutions. 5 Moneymarket deposit accounts (MMDA). 6 Issued in amounts of less than $100,000. Includes retail repurchase agreements. Excludes individual retirement accounts (IRAs) and Keogh accounts. 7 Issued in amounts of$100,000 or more. Excludes those booked at international banking facilities. 8 Excludes those held by money market mutual funds, depository institutions, U.S. Government, foreign banks, and official institutions.9 Excludes those held by depository institutions and money market mutual funds.
Source: Board of Governors of the Federal Reserve System, Federal Reserve Bulletin, monthly, and Money Stock, Liquid Assets, and Debt Measures, Federal Reserve Statistical Release H.6, weekly.
Bankin
g,Fin
ance,
and
Insu
rance
52
9
U.S
.C
ensusB
ureau,S
tatisticalAbstract
ofthe
United
States:
1999
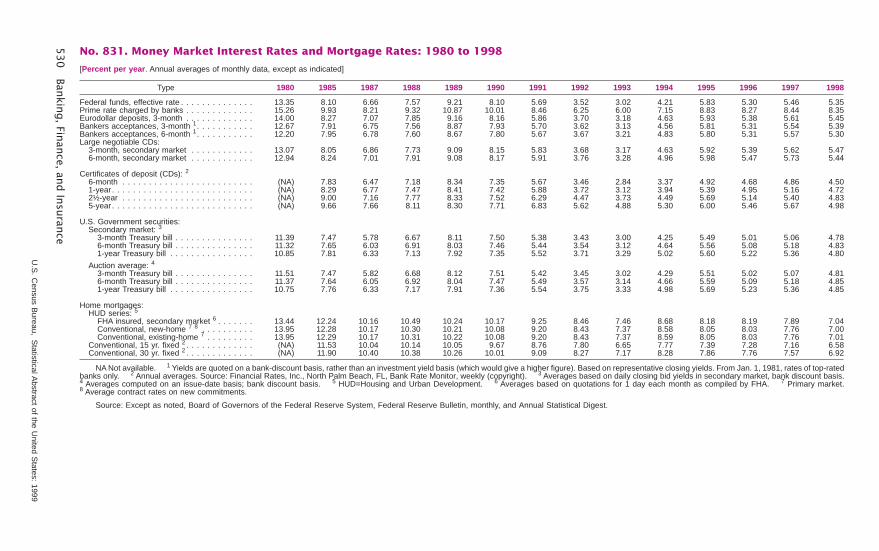
No. 831. Money Market Interest Rates and Mortgage Rates: 1980 to 1998
[Percent per year. Annual averages of monthly data, except as indicated]
Type 1980 1985 1987 1988 1989 1990 1991 1992 1993 1994 1995 1996 1997 1998
Federal funds, effective rate . . . . . . . . . . . . . . 13.35 8.10 6.66 7.57 9.21 8.10 5.69 3.52 3.02 4.21 5.83 5.30 5.46 5.35Prime rate charged by banks . . . . . . . . . . . . . 15.26 9.93 8.21 9.32 10.87 10.01 8.46 6.25 6.00 7.15 8.83 8.27 8.44 8.35Eurodollar deposits, 3-month . . . . . . . . . . . . . 14.00 8.27 7.07 7.85 9.16 8.16 5.86 3.70 3.18 4.63 5.93 5.38 5.61 5.45Bankers acceptances, 3-month 1. . . . . . . . . . . 12.67 7.91 6.75 7.56 8.87 7.93 5.70 3.62 3.13 4.56 5.81 5.31 5.54 5.39Bankers acceptances, 6-month 1. . . . . . . . . . . 12.20 7.95 6.78 7.60 8.67 7.80 5.67 3.67 3.21 4.83 5.80 5.31 5.57 5.30Large negotiable CDs:
3-month, secondary market . . . . . . . . . . . . 13.07 8.05 6.86 7.73 9.09 8.15 5.83 3.68 3.17 4.63 5.92 5.39 5.62 5.476-month, secondary market . . . . . . . . . . . . 12.94 8.24 7.01 7.91 9.08 8.17 5.91 3.76 3.28 4.96 5.98 5.47 5.73 5.44
Certificates of deposit (CDs): 2
6-month . . . . . . . . . . . . . . . . . . . . . . . . . (NA) 7.83 6.47 7.18 8.34 7.35 5.67 3.46 2.84 3.37 4.92 4.68 4.86 4.501-year . . . . . . . . . . . . . . . . . . . . . . . . . . . (NA) 8.29 6.77 7.47 8.41 7.42 5.88 3.72 3.12 3.94 5.39 4.95 5.16 4.722½-year . . . . . . . . . . . . . . . . . . . . . . . . . (NA) 9.00 7.16 7.77 8.33 7.52 6.29 4.47 3.73 4.49 5.69 5.14 5.40 4.835-year . . . . . . . . . . . . . . . . . . . . . . . . . . . (NA) 9.66 7.66 8.11 8.30 7.71 6.83 5.62 4.88 5.30 6.00 5.46 5.67 4.98
U.S. Government securities:Secondary market: 3
3-month Treasury bill . . . . . . . . . . . . . . . 11.39 7.47 5.78 6.67 8.11 7.50 5.38 3.43 3.00 4.25 5.49 5.01 5.06 4.786-month Treasury bill . . . . . . . . . . . . . . . 11.32 7.65 6.03 6.91 8.03 7.46 5.44 3.54 3.12 4.64 5.56 5.08 5.18 4.831-year Treasury bill . . . . . . . . . . . . . . . . 10.85 7.81 6.33 7.13 7.92 7.35 5.52 3.71 3.29 5.02 5.60 5.22 5.36 4.80
Auction average: 4
3-month Treasury bill . . . . . . . . . . . . . . . 11.51 7.47 5.82 6.68 8.12 7.51 5.42 3.45 3.02 4.29 5.51 5.02 5.07 4.816-month Treasury bill . . . . . . . . . . . . . . . 11.37 7.64 6.05 6.92 8.04 7.47 5.49 3.57 3.14 4.66 5.59 5.09 5.18 4.851-year Treasury bill . . . . . . . . . . . . . . . . 10.75 7.76 6.33 7.17 7.91 7.36 5.54 3.75 3.33 4.98 5.69 5.23 5.36 4.85
Home mortgages:HUD series: 5
FHA insured, secondary market 6 . . . . . . . 13.44 12.24 10.16 10.49 10.24 10.17 9.25 8.46 7.46 8.68 8.18 8.19 7.89 7.04Conventional, new-home 7 8 . . . . . . . . . . 13.95 12.28 10.17 10.30 10.21 10.08 9.20 8.43 7.37 8.58 8.05 8.03 7.76 7.00Conventional, existing-home 7 . . . . . . . . . 13.95 12.29 10.17 10.31 10.22 10.08 9.20 8.43 7.37 8.59 8.05 8.03 7.76 7.01
Conventional, 15 yr. fixed 2 . . . . . . . . . . . . . (NA) 11.53 10.04 10.14 10.05 9.67 8.76 7.80 6.65 7.77 7.39 7.28 7.16 6.58Conventional, 30 yr. fixed 2 . . . . . . . . . . . . . (NA) 11.90 10.40 10.38 10.26 10.01 9.09 8.27 7.17 8.28 7.86 7.76 7.57 6.92
NA Not available. 1 Yields are quoted on a bank-discount basis, rather than an investment yield basis (which would give a higher figure). Based on representative closing yields. From Jan. 1, 1981, rates of top-ratedbanks only. 2 Annual averages. Source: Financial Rates, Inc., North Palm Beach, FL, Bank Rate Monitor, weekly (copyright). 3 Averages based on daily closing bid yields in secondary market, bank discount basis.4 Averages computed on an issue-date basis; bank discount basis. 5 HUD=Housing and Urban Development. 6 Averages based on quotations for 1 day each month as compiled by FHA. 7 Primary market.8 Average contract rates on new commitments.
Source: Except as noted, Board of Governors of the Federal Reserve System, Federal Reserve Bulletin, monthly, and Annual Statistical Digest.
53
0Ban
king,Fin
ance,
and
Insu
rance
U.S
.C
ensusB
ureau,S
tatisticalAbstract
ofthe
United
States:
1999
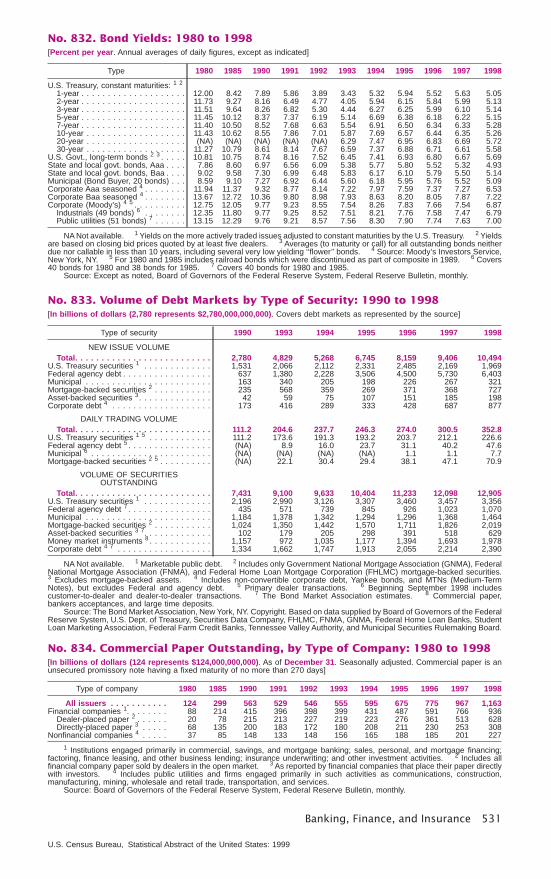
No. 832. Bond Yields: 1980 to 1998[Percent per year. Annual averages of daily figures, except as indicated]
Type 1980 1985 1990 1991 1992 1993 1994 1995 1996 1997 1998
U.S. Treasury, constant maturities: 1 2
1-year . . . . . . . . . . . . . . . . . . . . 12.00 8.42 7.89 5.86 3.89 3.43 5.32 5.94 5.52 5.63 5.052-year . . . . . . . . . . . . . . . . . . . . 11.73 9.27 8.16 6.49 4.77 4.05 5.94 6.15 5.84 5.99 5.133-year . . . . . . . . . . . . . . . . . . . . 11.51 9.64 8.26 6.82 5.30 4.44 6.27 6.25 5.99 6.10 5.145-year . . . . . . . . . . . . . . . . . . . . 11.45 10.12 8.37 7.37 6.19 5.14 6.69 6.38 6.18 6.22 5.157-year . . . . . . . . . . . . . . . . . . . . 11.40 10.50 8.52 7.68 6.63 5.54 6.91 6.50 6.34 6.33 5.2810-year . . . . . . . . . . . . . . . . . . . 11.43 10.62 8.55 7.86 7.01 5.87 7.69 6.57 6.44 6.35 5.2620-year . . . . . . . . . . . . . . . . . . . (NA) (NA) (NA) (NA) (NA) 6.29 7.47 6.95 6.83 6.69 5.7230-year . . . . . . . . . . . . . . . . . . . 11.27 10.79 8.61 8.14 7.67 6.59 7.37 6.88 6.71 6.61 5.58
U.S. Govt., long-term bonds 2 3 . . . . . 10.81 10.75 8.74 8.16 7.52 6.45 7.41 6.93 6.80 6.67 5.69State and local govt. bonds, Aaa . . . . 7.86 8.60 6.97 6.56 6.09 5.38 5.77 5.80 5.52 5.32 4.93State and local govt. bonds, Baa . . . . 9.02 9.58 7.30 6.99 6.48 5.83 6.17 6.10 5.79 5.50 5.14Municipal (Bond Buyer, 20 bonds) . . . 8.59 9.10 7.27 6.92 6.44 5.60 6.18 5.95 5.76 5.52 5.09Corporate Aaa seasoned 4 . . . . . . . . 11.94 11.37 9.32 8.77 8.14 7.22 7.97 7.59 7.37 7.27 6.53Corporate Baa seasoned 4 . . . . . . . . 13.67 12.72 10.36 9.80 8.98 7.93 8.63 8.20 8.05 7.87 7.22Corporate (Moody’s) 4 5 . . . . . . . . . . 12.75 12.05 9.77 9.23 8.55 7.54 8.26 7.83 7.66 7.54 6.87
Industrials (49 bonds) 6 . . . . . . . . 12.35 11.80 9.77 9.25 8.52 7.51 8.21 7.76 7.58 7.47 6.79Public utilities (51 bonds) 7 . . . . . . 13.15 12.29 9.76 9.21 8.57 7.56 8.30 7.90 7.74 7.63 7.00
NA Not available. 1 Yields on the more actively traded issues adjusted to constant maturities by the U.S. Treasury. 2 Yieldsare based on closing bid prices quoted by at least five dealers. 3 Averages (to maturity or call) for all outstanding bonds neitherdue nor callable in less than 10 years, including several very low yielding ‘‘flower’’ bonds. 4 Source: Moody’s Investors Service,New York, NY. 5 For 1980 and 1985 includes railroad bonds which were discontinued as part of composite in 1989. 6 Covers40 bonds for 1980 and 38 bonds for 1985. 7 Covers 40 bonds for 1980 and 1985.
Source: Except as noted, Board of Governors of the Federal Reserve System, Federal Reserve Bulletin, monthly.
No. 833. Volume of Debt Markets by Type of Security: 1990 to 1998[In billions of dollars (2,780 represents $2,780,000,000,000). Covers debt markets as represented by the source]
Type of security 1990 1993 1994 1995 1996 1997 1998
NEW ISSUE VOLUMETotal. . . . . . . . . . . . . . . . . . . . . . . . . . 2,780 4,829 5,268 6,745 8,159 9,406 10,494
U.S. Treasury securities 1 . . . . . . . . . . . . . 1,531 2,066 2,112 2,331 2,485 2,169 1,969Federal agency debt . . . . . . . . . . . . . . . . . 637 1,380 2,228 3,506 4,500 5,730 6,403Municipal . . . . . . . . . . . . . . . . . . . . . . . . 163 340 205 198 226 267 321Mortgage-backed securities 2 . . . . . . . . . . . 235 568 359 269 371 368 727Asset-backed securities 3. . . . . . . . . . . . . . 42 59 75 107 151 185 198Corporate debt 4 . . . . . . . . . . . . . . . . . . . 173 416 289 333 428 687 877
DAILY TRADING VOLUMETotal. . . . . . . . . . . . . . . . . . . . . . . . . . 111.2 204.6 237.7 246.3 274.0 300.5 352.8
U.S. Treasury securities 1 5 . . . . . . . . . . . . 111.2 173.6 191.3 193.2 203.7 212.1 226.6Federal agency debt 5 . . . . . . . . . . . . . . . . (NA) 8.9 16.0 23.7 31.1 40.2 47.6Municipal 6 . . . . . . . . . . . . . . . . . . . . . . . (NA) (NA) (NA) (NA) 1.1 1.1 7.7Mortgage-backed securities 2 5 . . . . . . . . . . (NA) 22.1 30.4 29.4 38.1 47.1 70.9
VOLUME OF SECURITIESOUTSTANDING
Total. . . . . . . . . . . . . . . . . . . . . . . . . . 7,431 9,100 9,633 10,404 11,233 12,098 12,905U.S. Treasury securities 1 . . . . . . . . . . . . . 2,196 2,990 3,126 3,307 3,460 3,457 3,356Federal agency debt 7 . . . . . . . . . . . . . . . . 435 571 739 845 926 1,023 1,070Municipal . . . . . . . . . . . . . . . . . . . . . . . . 1,184 1,378 1,342 1,294 1,296 1,368 1,464Mortgage-backed securities 2 . . . . . . . . . . . 1,024 1,350 1,442 1,570 1,711 1,826 2,019Asset-backed securities 3 7. . . . . . . . . . . . . 102 179 205 298 391 518 629Money market instruments 8 . . . . . . . . . . . . 1,157 972 1,035 1,177 1,394 1,693 1,978Corporate debt 4 7 . . . . . . . . . . . . . . . . . . 1,334 1,662 1,747 1,913 2,055 2,214 2,390
NA Not available. 1 Marketable public debt. 2 Includes only Government National Mortgage Association (GNMA), FederalNational Mortgage Association (FNMA), and Federal Home Loan Mortgage Corporation (FHLMC) mortgage-backed securities.3 Excludes mortgage-backed assets. 4 Includes non-convertible corporate debt, Yankee bonds, and MTNs (Medium-TermNotes), but excludes Federal and agency debt. 5 Primary dealer transactions. 6 Beginning September 1998 includescustomer-to-dealer and dealer-to-dealer transactions. 7 The Bond Market Association estimates. 8 Commercial paper,bankers acceptances, and large time deposits.
Source: The Bond Market Association, New York, NY. Copyright. Based on data supplied by Board of Governors of the FederalReserve System, U.S. Dept. of Treasury, Securities Data Company, FHLMC, FNMA, GNMA, Federal Home Loan Banks, StudentLoan Marketing Association, Federal Farm Credit Banks, Tennessee Valley Authority, and Municipal Securities Rulemaking Board.
No. 834. Commercial Paper Outstanding, by Type of Company: 1980 to 1998[In billions of dollars (124 represents $124,000,000,000). As of December 31. Seasonally adjusted. Commercial paper is anunsecured promissory note having a fixed maturity of no more than 270 days]
Type of company 1980 1985 1990 1991 1992 1993 1994 1995 1996 1997 1998
All issuers . . . . . . . . . . . 124 299 563 529 546 555 595 675 775 967 1,163Financial companies 1. . . . . . . . 88 214 415 396 398 399 431 487 591 766 936
Dealer-placed paper 2 . . . . . . 20 78 215 213 227 219 223 276 361 513 628Directly-placed paper 3 . . . . . 68 135 200 183 172 180 208 211 230 253 308
Nonfinancial companies 4 . . . . . 37 85 148 133 148 156 165 188 185 201 227
1 Institutions engaged primarily in commercial, savings, and mortgage banking; sales, personal, and mortgage financing;factoring, finance leasing, and other business lending; insurance underwriting; and other investment activities. 2 Includes allfinancial company paper sold by dealers in the open market. 3 As reported by financial companies that place their paper directlywith investors. 4 Includes public utilities and firms engaged primarily in such activities as communications, construction,manufacturing, mining, wholesale and retail trade, transportation, and services.
Source: Board of Governors of the Federal Reserve System, Federal Reserve Bulletin, monthly.
Banking, Finance, and Insurance 531
U.S. Census Bureau, Statistical Abstract of the United States: 1999
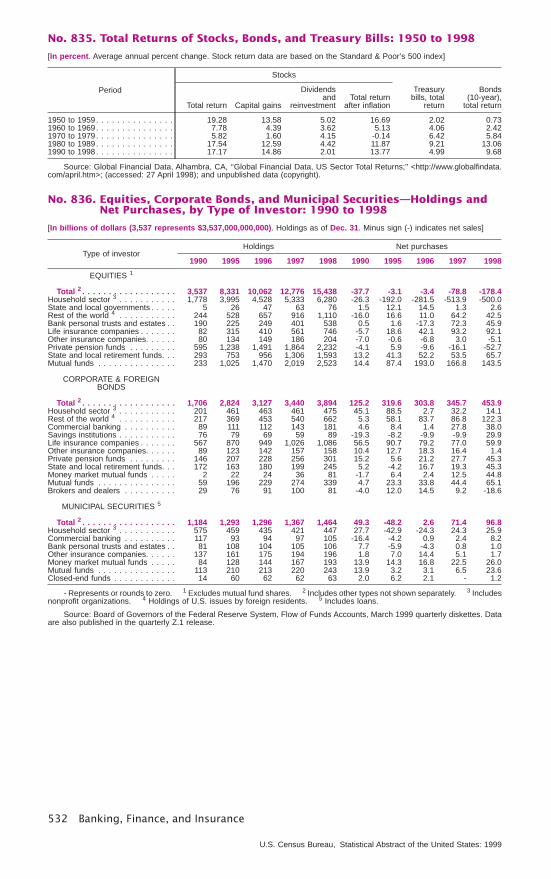
No. 835. Total Returns of Stocks, Bonds, and Treasury Bills: 1950 to 1998
[In percent. Average annual percent change. Stock return data are based on the Standard & Poor’s 500 index]
Period
Stocks
Treasurybills, total
return
Bonds(10-year),
total returnTotal return Capital gains
Dividendsand
reinvestmentTotal return
after inflation
1950 to 1959. . . . . . . . . . . . . . . 19.28 13.58 5.02 16.69 2.02 0.731960 to 1969. . . . . . . . . . . . . . . 7.78 4.39 3.62 5.13 4.06 2.421970 to 1979. . . . . . . . . . . . . . . 5.82 1.60 4.15 -0.14 6.42 5.841980 to 1989. . . . . . . . . . . . . . . 17.54 12.59 4.42 11.87 9.21 13.061990 to 1998. . . . . . . . . . . . . . . 17.17 14.86 2.01 13.77 4.99 9.68
Source: Global Financial Data, Alhambra, CA, ‘‘Global Financial Data, US Sector Total Returns;’’ <http://www.globalfindata.com/april.htm>; (accessed: 27 April 1998); and unpublished data (copyright).
No. 836. Equities, Corporate Bonds, and Municipal Securities—Holdings andNet Purchases, by Type of Investor: 1990 to 1998
[In billions of dollars (3,537 represents $3,537,000,000,000). Holdings as of Dec. 31. Minus sign (-) indicates net sales]
Type of investorHoldings Net purchases
1990 1995 1996 1997 1998 1990 1995 1996 1997 1998
EQUITIES 1
Total 2 . . . . . . . . . . . . . . . . . . 3,537 8,331 10,062 12,776 15,438 -37.7 -3.1 -3.4 -78.8 -178.4Household sector 3 . . . . . . . . . . . 1,778 3,995 4,528 5,333 6,280 -26.3 -192.0 -281.5 -513.9 -500.0State and local governments . . . . . 5 26 47 63 76 1.5 12.1 14.5 1.3 2.6Rest of the world 4 . . . . . . . . . . . 244 528 657 916 1,110 -16.0 16.6 11.0 64.2 42.5Bank personal trusts and estates . . 190 225 249 401 538 0.5 1.6 -17.3 72.3 45.9Life insurance companies . . . . . . . 82 315 410 561 746 -5.7 18.6 42.1 93.2 92.1Other insurance companies. . . . . . 80 134 149 186 204 -7.0 -0.6 -6.8 3.0 -5.1Private pension funds . . . . . . . . . 595 1,238 1,491 1,864 2,232 -4.1 5.9 -9.6 -16.1 -52.7State and local retirement funds. . . 293 753 956 1,306 1,593 13.2 41.3 52.2 53.5 65.7Mutual funds . . . . . . . . . . . . . . . 233 1,025 1,470 2,019 2,523 14.4 87.4 193.0 166.8 143.5
CORPORATE & FOREIGNBONDS
Total 2 . . . . . . . . . . . . . . . . . . 1,706 2,824 3,127 3,440 3,894 125.2 319.6 303.8 345.7 453.9Household sector 3 . . . . . . . . . . . 201 461 463 461 475 45.1 88.5 2.7 32.2 14.1Rest of the world 4 . . . . . . . . . . . 217 369 453 540 662 5.3 58.1 83.7 86.8 122.3Commercial banking . . . . . . . . . . 89 111 112 143 181 4.6 8.4 1.4 27.8 38.0Savings institutions . . . . . . . . . . . 76 79 69 59 89 -19.3 -8.2 -9.9 -9.9 29.9Life insurance companies . . . . . . . 567 870 949 1,026 1,086 56.5 90.7 79.2 77.0 59.9Other insurance companies. . . . . . 89 123 142 157 158 10.4 12.7 18.3 16.4 1.4Private pension funds . . . . . . . . . 146 207 228 256 301 15.2 5.6 21.2 27.7 45.3State and local retirement funds. . . 172 163 180 199 245 5.2 -4.2 16.7 19.3 45.3Money market mutual funds . . . . . 2 22 24 36 81 -1.7 6.4 2.4 12.5 44.8Mutual funds . . . . . . . . . . . . . . . 59 196 229 274 339 4.7 23.3 33.8 44.4 65.1Brokers and dealers . . . . . . . . . . 29 76 91 100 81 -4.0 12.0 14.5 9.2 -18.6
MUNICIPAL SECURITIES 5
Total 2 . . . . . . . . . . . . . . . . . . 1,184 1,293 1,296 1,367 1,464 49.3 -48.2 2.6 71.4 96.8Household sector 3 . . . . . . . . . . . 575 459 435 421 447 27.7 -42.9 -24.3 24.3 25.9Commercial banking . . . . . . . . . . 117 93 94 97 105 -16.4 -4.2 0.9 2.4 8.2Bank personal trusts and estates . . 81 108 104 105 106 7.7 -5.9 -4.3 0.8 1.0Other insurance companies. . . . . . 137 161 175 194 196 1.8 7.0 14.4 5.1 1.7Money market mutual funds . . . . . 84 128 144 167 193 13.9 14.3 16.8 22.5 26.0Mutual funds . . . . . . . . . . . . . . . 113 210 213 220 243 13.9 3.2 3.1 6.5 23.6Closed-end funds . . . . . . . . . . . . 14 60 62 62 63 2.0 6.2 2.1 - 1.2
- Represents or rounds to zero. 1 Excludes mutual fund shares. 2 Includes other types not shown separately. 3 Includesnonprofit organizations. 4 Holdings of U.S. issues by foreign residents. 5 Includes loans.
Source: Board of Governors of the Federal Reserve System, Flow of Funds Accounts, March 1999 quarterly diskettes. Dataare also published in the quarterly Z.1 release.
532 Banking, Finance, and Insurance
U.S. Census Bureau, Statistical Abstract of the United States: 1999
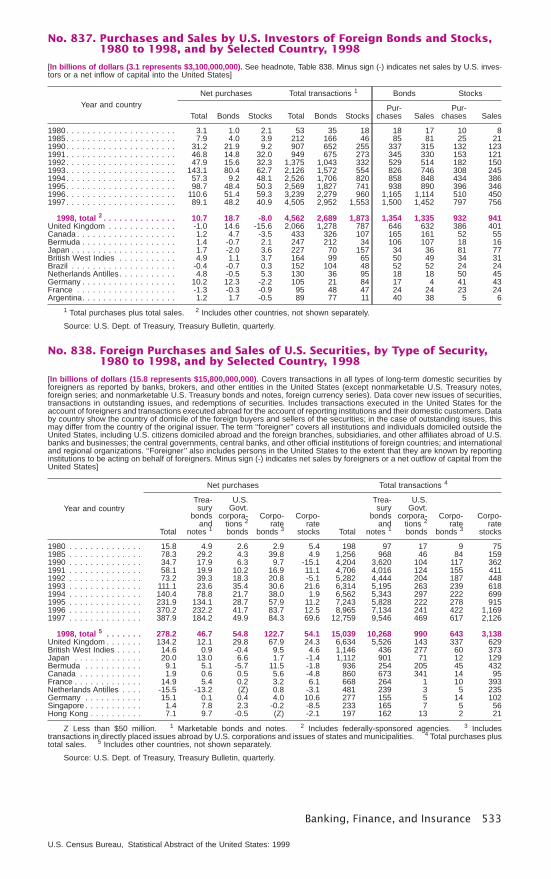
No. 837. Purchases and Sales by U.S. Investors of Foreign Bonds and Stocks,1980 to 1998, and by Selected Country, 1998
[In billions of dollars (3.1 represents $3,100,000,000). See headnote, Table 838. Minus sign (-) indicates net sales by U.S. inves-tors or a net inflow of capital into the United States]
Year and countryNet purchases Total transactions 1 Bonds Stocks
Total Bonds Stocks Total Bonds StocksPur-
chases SalesPur-
chases Sales
1980. . . . . . . . . . . . . . . . . . . . . 3.1 1.0 2.1 53 35 18 18 17 10 81985. . . . . . . . . . . . . . . . . . . . . 7.9 4.0 3.9 212 166 46 85 81 25 211990. . . . . . . . . . . . . . . . . . . . . 31.2 21.9 9.2 907 652 255 337 315 132 1231991. . . . . . . . . . . . . . . . . . . . . 46.8 14.8 32.0 949 675 273 345 330 153 1211992. . . . . . . . . . . . . . . . . . . . . 47.9 15.6 32.3 1,375 1,043 332 529 514 182 1501993. . . . . . . . . . . . . . . . . . . . . 143.1 80.4 62.7 2,126 1,572 554 826 746 308 2451994. . . . . . . . . . . . . . . . . . . . . 57.3 9.2 48.1 2,526 1,706 820 858 848 434 3861995. . . . . . . . . . . . . . . . . . . . . 98.7 48.4 50.3 2,569 1,827 741 938 890 396 3461996. . . . . . . . . . . . . . . . . . . . . 110.6 51.4 59.3 3,239 2,279 960 1,165 1,114 510 4501997. . . . . . . . . . . . . . . . . . . . . 89.1 48.2 40.9 4,505 2,952 1,553 1,500 1,452 797 756
1998, total 2 . . . . . . . . . . . . . . 10.7 18.7 -8.0 4,562 2,689 1,873 1,354 1,335 932 941United Kingdom . . . . . . . . . . . . . -1.0 14.6 -15.6 2,066 1,278 787 646 632 386 401Canada . . . . . . . . . . . . . . . . . . . 1.2 4.7 -3.5 433 326 107 165 161 52 55Bermuda . . . . . . . . . . . . . . . . . . 1.4 -0.7 2.1 247 212 34 106 107 18 16Japan . . . . . . . . . . . . . . . . . . . . 1.7 -2.0 3.6 227 70 157 34 36 81 77British West Indies . . . . . . . . . . . 4.9 1.1 3.7 164 99 65 50 49 34 31Brazil . . . . . . . . . . . . . . . . . . . . -0.4 -0.7 0.3 152 104 48 52 52 24 24Netherlands Antilles . . . . . . . . . . . 4.8 -0.5 5.3 130 36 95 18 18 50 45Germany . . . . . . . . . . . . . . . . . . 10.2 12.3 -2.2 105 21 84 17 4 41 43France . . . . . . . . . . . . . . . . . . . -1.3 -0.3 -0.9 95 48 47 24 24 23 24Argentina. . . . . . . . . . . . . . . . . . 1.2 1.7 -0.5 89 77 11 40 38 5 6
1 Total purchases plus total sales. 2 Includes other countries, not shown separately.
Source: U.S. Dept. of Treasury, Treasury Bulletin, quarterly.
No. 838. Foreign Purchases and Sales of U.S. Securities, by Type of Security,1980 to 1998, and by Selected Country, 1998
[In billions of dollars (15.8 represents $15,800,000,000). Covers transactions in all types of long-term domestic securities byforeigners as reported by banks, brokers, and other entities in the United States (except nonmarketable U.S. Treasury notes,foreign series; and nonmarketable U.S. Treasury bonds and notes, foreign currency series). Data cover new issues of securities,transactions in outstanding issues, and redemptions of securities. Includes transactions executed in the United States for theaccount of foreigners and transactions executed abroad for the account of reporting institutions and their domestic customers. Databy country show the country of domicile of the foreign buyers and sellers of the securities; in the case of outstanding issues, thismay differ from the country of the original issuer. The term ‘‘foreigner’’ covers all institutions and individuals domiciled outside theUnited States, including U.S. citizens domiciled abroad and the foreign branches, subsidiaries, and other affiliates abroad of U.S.banks and businesses; the central governments, central banks, and other official institutions of foreign countries; and internationaland regional organizations. ‘‘Foreigner’’ also includes persons in the United States to the extent that they are known by reportinginstitutions to be acting on behalf of foreigners. Minus sign (-) indicates net sales by foreigners or a net outflow of capital from theUnited States]
Year and country
Net purchases Total transactions 4
Total
Trea-sury
bondsand
notes 1
U.S.Govt.
corpora-tions 2
bonds
Corpo-rate
bonds 3
Corpo-rate
stocks Total
Trea-sury
bondsand
notes 1
U.S.Govt.
corpora-tions 2
bonds
Corpo-rate
bonds 3
Corpo-rate
stocks
1980 . . . . . . . . . . . . . . 15.8 4.9 2.6 2.9 5.4 198 97 17 9 751985 . . . . . . . . . . . . . . 78.3 29.2 4.3 39.8 4.9 1,256 968 46 84 1591990 . . . . . . . . . . . . . . 34.7 17.9 6.3 9.7 -15.1 4,204 3,620 104 117 3621991 . . . . . . . . . . . . . . 58.1 19.9 10.2 16.9 11.1 4,706 4,016 124 155 4111992 . . . . . . . . . . . . . . 73.2 39.3 18.3 20.8 -5.1 5,282 4,444 204 187 4481993 . . . . . . . . . . . . . . 111.1 23.6 35.4 30.6 21.6 6,314 5,195 263 239 6181994 . . . . . . . . . . . . . . 140.4 78.8 21.7 38.0 1.9 6,562 5,343 297 222 6991995 . . . . . . . . . . . . . . 231.9 134.1 28.7 57.9 11.2 7,243 5,828 222 278 9151996 . . . . . . . . . . . . . . 370.2 232.2 41.7 83.7 12.5 8,965 7,134 241 422 1,1691997 . . . . . . . . . . . . . . 387.9 184.2 49.9 84.3 69.6 12,759 9,546 469 617 2,126
1998, total 5 . . . . . . . 278.2 46.7 54.8 122.7 54.1 15,039 10,268 990 643 3,138United Kingdom . . . . . . . 134.2 12.1 29.8 67.9 24.3 6,634 5,526 143 337 629British West Indies . . . . . 14.6 0.9 -0.4 9.5 4.6 1,146 436 277 60 373Japan . . . . . . . . . . . . . 20.0 13.0 6.6 1.7 -1.4 1,112 901 71 12 129Bermuda . . . . . . . . . . . 9.1 5.1 -5.7 11.5 -1.8 936 254 205 45 432Canada . . . . . . . . . . . . 1.9 0.6 0.5 5.6 -4.8 860 673 341 14 95France . . . . . . . . . . . . . 14.9 5.4 0.2 3.2 6.1 668 264 1 10 393Netherlands Antilles . . . . -15.5 -13.2 (Z) 0.8 -3.1 481 239 3 5 235Germany . . . . . . . . . . . 15.1 0.1 0.4 4.0 10.6 277 155 5 14 102Singapore . . . . . . . . . . . 1.4 7.8 2.3 -0.2 -8.5 233 165 7 5 56Hong Kong . . . . . . . . . . 7.1 9.7 -0.5 (Z) -2.1 197 162 13 2 21
Z Less than $50 million. 1 Marketable bonds and notes. 2 Includes federally-sponsored agencies. 3 Includestransactions in directly placed issues abroad by U.S. corporations and issues of states and municipalities. 4 Total purchases plustotal sales. 5 Includes other countries, not shown separately.
Source: U.S. Dept. of Treasury, Treasury Bulletin, quarterly.
Banking, Finance, and Insurance 533
U.S. Census Bureau, Statistical Abstract of the United States: 1999
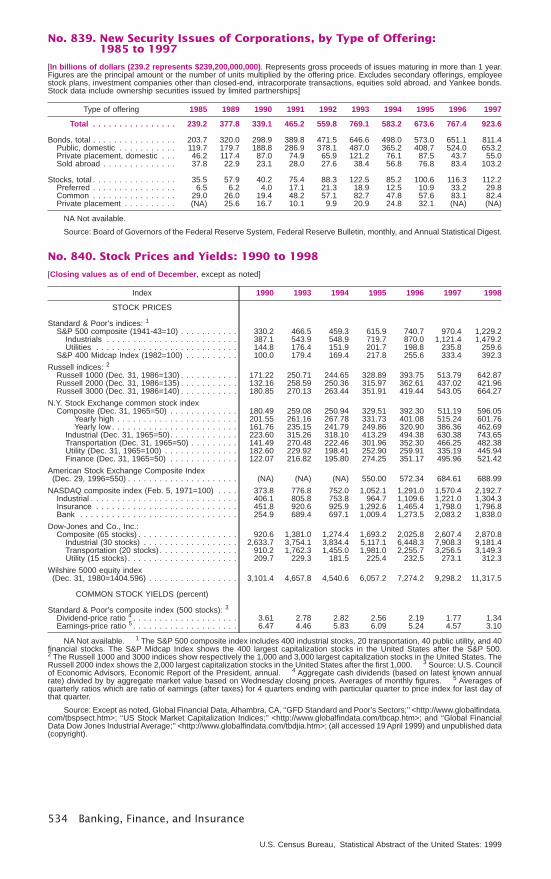
No. 839. New Security Issues of Corporations, by Type of Offering:1985 to 1997
[In billions of dollars (239.2 represents $239,200,000,000). Represents gross proceeds of issues maturing in more than 1 year.Figures are the principal amount or the number of units multiplied by the offering price. Excludes secondary offerings, employeestock plans, investment companies other than closed-end, intracorporate transactions, equities sold abroad, and Yankee bonds.Stock data include ownership securities issued by limited partnerships]
Type of offering 1985 1989 1990 1991 1992 1993 1994 1995 1996 1997
Total . . . . . . . . . . . . . . . . 239.2 377.8 339.1 465.2 559.8 769.1 583.2 673.6 767.4 923.6
Bonds, total . . . . . . . . . . . . . . . . 203.7 320.0 298.9 389.8 471.5 646.6 498.0 573.0 651.1 811.4Public, domestic . . . . . . . . . . . 119.7 179.7 188.8 286.9 378.1 487.0 365.2 408.7 524.0 653.2Private placement, domestic . . . 46.2 117.4 87.0 74.9 65.9 121.2 76.1 87.5 43.7 55.0Sold abroad . . . . . . . . . . . . . . 37.8 22.9 23.1 28.0 27.6 38.4 56.8 76.8 83.4 103.2
Stocks, total . . . . . . . . . . . . . . . . 35.5 57.9 40.2 75.4 88.3 122.5 85.2 100.6 116.3 112.2Preferred . . . . . . . . . . . . . . . . 6.5 6.2 4.0 17.1 21.3 18.9 12.5 10.9 33.2 29.8Common . . . . . . . . . . . . . . . . 29.0 26.0 19.4 48.2 57.1 82.7 47.8 57.6 83.1 82.4Private placement . . . . . . . . . . (NA) 25.6 16.7 10.1 9.9 20.9 24.8 32.1 (NA) (NA)
NA Not available.
Source: Board of Governors of the Federal Reserve System, Federal Reserve Bulletin, monthly, and Annual Statistical Digest.
No. 840. Stock Prices and Yields: 1990 to 1998
[Closing values as of end of December, except as noted]
Index 1990 1993 1994 1995 1996 1997 1998
STOCK PRICES
Standard & Poor’s indices: 1
S&P 500 composite (1941-43=10) . . . . . . . . . . . 330.2 466.5 459.3 615.9 740.7 970.4 1,229.2Industrials . . . . . . . . . . . . . . . . . . . . . . . . . 387.1 543.9 548.9 719.7 870.0 1,121.4 1,479.2Utilities . . . . . . . . . . . . . . . . . . . . . . . . . . . 144.8 176.4 151.9 201.7 198.8 235.8 259.6
S&P 400 Midcap Index (1982=100) . . . . . . . . . . 100.0 179.4 169.4 217.8 255.6 333.4 392.3
Russell indices: 2
Russell 1000 (Dec. 31, 1986=130) . . . . . . . . . . . 171.22 250.71 244.65 328.89 393.75 513.79 642.87Russell 2000 (Dec. 31, 1986=135) . . . . . . . . . . . 132.16 258.59 250.36 315.97 362.61 437.02 421.96Russell 3000 (Dec. 31, 1986=140) . . . . . . . . . . . 180.85 270.13 263.44 351.91 419.44 543.05 664.27
N.Y. Stock Exchange common stock indexComposite (Dec. 31, 1965=50) . . . . . . . . . . . . . 180.49 259.08 250.94 329.51 392.30 511.19 596.05
Yearly high . . . . . . . . . . . . . . . . . . . . . . . 201.55 261.16 267.78 331.73 401.08 515.24 601.76Yearly low . . . . . . . . . . . . . . . . . . . . . . . . 161.76 235.15 241.79 249.86 320.90 386.36 462.69
Industrial (Dec. 31, 1965=50). . . . . . . . . . . . . 223.60 315.26 318.10 413.29 494.38 630.38 743.65Transportation (Dec. 31, 1965=50) . . . . . . . . . 141.49 270.48 222.46 301.96 352.30 466.25 482.38Utility (Dec. 31, 1965=100) . . . . . . . . . . . . . . 182.60 229.92 198.41 252.90 259.91 335.19 445.94Finance (Dec. 31, 1965=50) . . . . . . . . . . . . . 122.07 216.82 195.80 274.25 351.17 495.96 521.42
American Stock Exchange Composite Index(Dec. 29, 1996=550) . . . . . . . . . . . . . . . . . . . . . (NA) (NA) (NA) 550.00 572.34 684.61 688.99
NASDAQ composite index (Feb. 5, 1971=100) . . . . 373.8 776.8 752.0 1,052.1 1,291.0 1,570.4 2,192.7Industrial . . . . . . . . . . . . . . . . . . . . . . . . . . . . 406.1 805.8 753.8 964.7 1,109.6 1,221.0 1,304.3Insurance . . . . . . . . . . . . . . . . . . . . . . . . . . . 451.8 920.6 925.9 1,292.6 1,465.4 1,798.0 1,796.8Bank . . . . . . . . . . . . . . . . . . . . . . . . . . . . . . 254.9 689.4 697.1 1,009.4 1,273.5 2,083.2 1,838.0
Dow-Jones and Co., Inc.:Composite (65 stocks) . . . . . . . . . . . . . . . . . . . 920.6 1,381.0 1,274.4 1,693.2 2,025.8 2,607.4 2,870.8
Industrial (30 stocks) . . . . . . . . . . . . . . . . . . 2,633.7 3,754.1 3,834.4 5,117.1 6,448.3 7,908.3 9,181.4Transportation (20 stocks) . . . . . . . . . . . . . . . 910.2 1,762.3 1,455.0 1,981.0 2,255.7 3,256.5 3,149.3Utility (15 stocks) . . . . . . . . . . . . . . . . . . . . . 209.7 229.3 181.5 225.4 232.5 273.1 312.3
Wilshire 5000 equity index(Dec. 31, 1980=1404.596) . . . . . . . . . . . . . . . . . 3,101.4 4,657.8 4,540.6 6,057.2 7,274.2 9,298.2 11,317.5
COMMON STOCK YIELDS (percent)
Standard & Poor’s composite index (500 stocks): 3
Dividend-price ratio 4 . . . . . . . . . . . . . . . . . . . . 3.61 2.78 2.82 2.56 2.19 1.77 1.34Earnings-price ratio 5 . . . . . . . . . . . . . . . . . . . . 6.47 4.46 5.83 6.09 5.24 4.57 3.10
NA Not available. 1 The S&P 500 composite index includes 400 industrial stocks, 20 transportation, 40 public utility, and 40financial stocks. The S&P Midcap Index shows the 400 largest capitalization stocks in the United States after the S&P 500.2 The Russell 1000 and 3000 indices show respectively the 1,000 and 3,000 largest capitalization stocks in the United States. TheRussell 2000 index shows the 2,000 largest capitalization stocks in the United States after the first 1,000. 3 Source: U.S. Councilof Economic Advisors, Economic Report of the President, annual. 4 Aggregate cash dividends (based on latest known annualrate) divided by by aggregate market value based on Wednesday closing prices. Averages of monthly figures. 5 Averages ofquarterly ratios which are ratio of earnings (after taxes) for 4 quarters ending with particular quarter to price index for last day ofthat quarter.
Source: Except as noted, Global Financial Data, Alhambra, CA, ‘‘GFD Standard and Poor’s Sectors;’’ <http://www.globalfindata.com/tbspsect.htm>; ‘‘US Stock Market Capitalization Indices;’’ <http://www.globalfindata.com/tbcap.htm>; and ‘‘Global FinancialData Dow Jones Industrial Average;’’ <http://www.globalfindata.com/tbdjia.htm>; (all accessed 19 April 1999) and unpublished data(copyright).
534 Banking, Finance, and Insurance
U.S. Census Bureau, Statistical Abstract of the United States: 1999
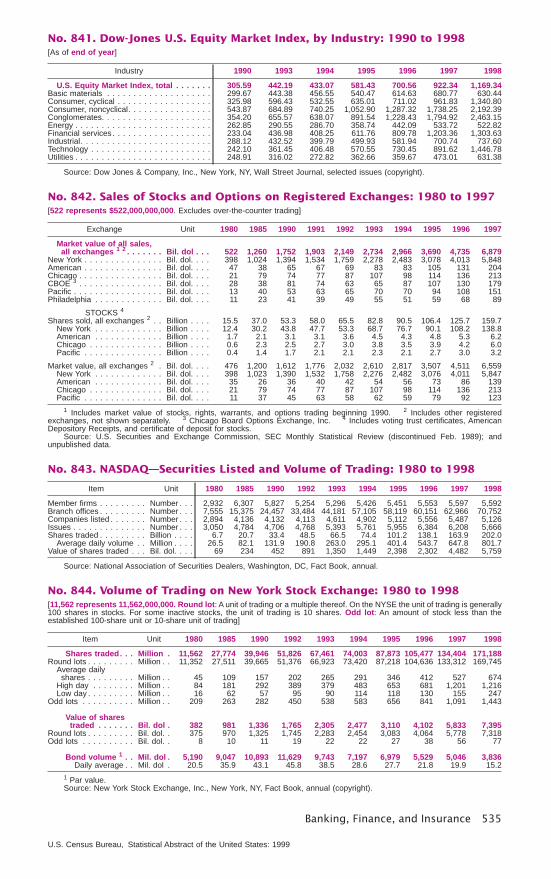
No. 841. Dow-Jones U.S. Equity Market Index, by Industry: 1990 to 1998[As of end of year]
Industry 1990 1993 1994 1995 1996 1997 1998
U.S. Equity Market Index, total . . . . . . . 305.59 442.19 433.07 581.43 700.56 922.34 1,169.34Basic materials . . . . . . . . . . . . . . . . . . . . 299.67 443.38 456.55 540.47 614.63 680.77 630.44Consumer, cyclical . . . . . . . . . . . . . . . . . . 325.98 596.43 532.55 635.01 711.02 961.83 1,340.80Consumer, noncyclical. . . . . . . . . . . . . . . . 543.87 684.89 740.25 1,052.90 1,287.32 1,738.25 2,192.39Conglomerates. . . . . . . . . . . . . . . . . . . . . 354.20 655.57 638.07 891.54 1,228.43 1,794.92 2,463.15Energy . . . . . . . . . . . . . . . . . . . . . . . . . . 262.85 290.55 286.70 358.74 442.09 533.72 522.82Financial services . . . . . . . . . . . . . . . . . . . 233.04 436.98 408.25 611.76 809.78 1,203.36 1,303.63Industrial. . . . . . . . . . . . . . . . . . . . . . . . . 288.12 432.52 399.79 499.93 581.94 700.74 737.60Technology . . . . . . . . . . . . . . . . . . . . . . . 242.10 361.45 406.48 570.55 730.45 891.62 1,446.78Utilities . . . . . . . . . . . . . . . . . . . . . . . . . . 248.91 316.02 272.82 362.66 359.67 473.01 631.38
Source: Dow Jones & Company, Inc., New York, NY, Wall Street Journal, selected issues (copyright).
No. 842. Sales of Stocks and Options on Registered Exchanges: 1980 to 1997[522 represents $522,000,000,000. Excludes over-the-counter trading]
Exchange Unit 1980 1985 1990 1991 1992 1993 1994 1995 1996 1997
Market value of all sales,all exchanges 1 2 . . . . . . . Bil. dol . . . 522 1,260 1,752 1,903 2,149 2,734 2,966 3,690 4,735 6,879
New York . . . . . . . . . . . . . . . Bil. dol. . . . 398 1,024 1,394 1,534 1,759 2,278 2,483 3,078 4,013 5,848American . . . . . . . . . . . . . . . Bil. dol. . . . 47 38 65 67 69 83 83 105 131 204Chicago . . . . . . . . . . . . . . . . Bil. dol. . . . 21 79 74 77 87 107 98 114 136 213CBOE 3 . . . . . . . . . . . . . . . . Bil. dol. . . . 28 38 81 74 63 65 87 107 130 179Pacific . . . . . . . . . . . . . . . . . Bil. dol. . . . 13 40 53 63 65 70 70 94 108 151Philadelphia . . . . . . . . . . . . . Bil. dol. . . . 11 23 41 39 49 55 51 59 68 89
STOCKS 4
Shares sold, all exchanges 2 . . Billion . . . . 15.5 37.0 53.3 58.0 65.5 82.8 90.5 106.4 125.7 159.7New York . . . . . . . . . . . . . Billion . . . . 12.4 30.2 43.8 47.7 53.3 68.7 76.7 90.1 108.2 138.8American . . . . . . . . . . . . . Billion . . . . 1.7 2.1 3.1 3.1 3.6 4.5 4.3 4.8 5.3 6.2Chicago . . . . . . . . . . . . . . Billion . . . . 0.6 2.3 2.5 2.7 3.0 3.8 3.5 3.9 4.2 6.0Pacific . . . . . . . . . . . . . . . Billion . . . . 0.4 1.4 1.7 2.1 2.1 2.3 2.1 2.7 3.0 3.2
Market value, all exchanges 2 . Bil. dol. . . . 476 1,200 1,612 1,776 2,032 2,610 2,817 3,507 4,511 6,559New York . . . . . . . . . . . . . Bil. dol. . . . 398 1,023 1,390 1,532 1,758 2,276 2,482 3,076 4,011 5,847American . . . . . . . . . . . . . Bil. dol. . . . 35 26 36 40 42 54 56 73 86 139Chicago . . . . . . . . . . . . . . Bil. dol. . . . 21 79 74 77 87 107 98 114 136 213Pacific . . . . . . . . . . . . . . . Bil. dol. . . . 11 37 45 63 58 62 59 79 92 123
1 Includes market value of stocks, rights, warrants, and options trading beginning 1990. 2 Includes other registeredexchanges, not shown separately. 3 Chicago Board Options Exchange, Inc. 4 Includes voting trust certificates, AmericanDepository Receipts, and certificate of deposit for stocks.
Source: U.S. Securities and Exchange Commission, SEC Monthly Statistical Review (discontinued Feb. 1989); andunpublished data.
No. 843. NASDAQ—Securities Listed and Volume of Trading: 1980 to 1998
Item Unit 1980 1985 1990 1992 1993 1994 1995 1996 1997 1998
Member firms . . . . . . . . . Number . . . 2,932 6,307 5,827 5,254 5,296 5,426 5,451 5,553 5,597 5,592Branch offices . . . . . . . . . Number . . . 7,555 15,375 24,457 33,484 44,181 57,105 58,119 60,151 62,966 70,752Companies listed . . . . . . . Number . . . 2,894 4,136 4,132 4,113 4,611 4,902 5,112 5,556 5,487 5,126Issues . . . . . . . . . . . . . . Number . . . 3,050 4,784 4,706 4,768 5,393 5,761 5,955 6,384 6,208 5,666Shares traded . . . . . . . . . Billion . . . . 6.7 20.7 33.4 48.5 66.5 74.4 101.2 138.1 163.9 202.0
Average daily volume . . Million . . . . 26.5 82.1 131.9 190.8 263.0 295.1 401.4 543.7 647.8 801.7Value of shares traded . . . Bil. dol. . . . 69 234 452 891 1,350 1,449 2,398 2,302 4,482 5,759
Source: National Association of Securities Dealers, Washington, DC, Fact Book, annual.
No. 844. Volume of Trading on New York Stock Exchange: 1980 to 1998[11,562 represents 11,562,000,000. Round lot: A unit of trading or a multiple thereof. On the NYSE the unit of trading is generally100 shares in stocks. For some inactive stocks, the unit of trading is 10 shares. Odd lot: An amount of stock less than theestablished 100-share unit or 10-share unit of trading]
Item Unit 1980 1985 1990 1992 1993 1994 1995 1996 1997 1998
Shares traded. . . Million . 11,562 27,774 39,946 51,826 67,461 74,003 87,873 105,477 134,404 171,188Round lots . . . . . . . . . Million . . 11,352 27,511 39,665 51,376 66,923 73,420 87,218 104,636 133,312 169,745
Average dailyshares . . . . . . . . . Million . . 45 109 157 202 265 291 346 412 527 674
High day . . . . . . . . Million . . 84 181 292 389 379 483 653 681 1,201 1,216Low day . . . . . . . . . Million . . 16 62 57 95 90 114 118 130 155 247
Odd lots . . . . . . . . . . Million . . 209 263 282 450 538 583 656 841 1,091 1,443
Value of sharestraded . . . . . . . Bil. dol . 382 981 1,336 1,765 2,305 2,477 3,110 4,102 5,833 7,395
Round lots . . . . . . . . . Bil. dol. . 375 970 1,325 1,745 2,283 2,454 3,083 4,064 5,778 7,318Odd lots . . . . . . . . . . Bil. dol. . 8 10 11 19 22 22 27 38 56 77
Bond volume 1 . . Mil. dol . 5,190 9,047 10,893 11,629 9,743 7,197 6,979 5,529 5,046 3,836Daily average . . Mil. dol . 20.5 35.9 43.1 45.8 38.5 28.6 27.7 21.8 19.9 15.2
1 Par value.Source: New York Stock Exchange, Inc., New York, NY, Fact Book, annual (copyright).
Banking, Finance, and Insurance 535
U.S. Census Bureau, Statistical Abstract of the United States: 1999
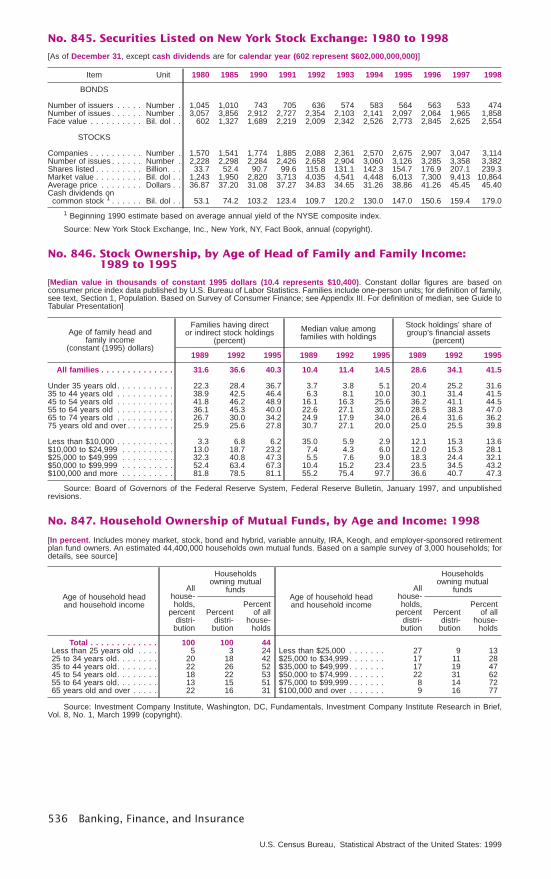
No. 845. Securities Listed on New York Stock Exchange: 1980 to 1998
[As of December 31, except cash dividends are for calendar year (602 represent $602,000,000,000)]
Item Unit 1980 1985 1990 1991 1992 1993 1994 1995 1996 1997 1998
BONDS
Number of issuers . . . . . Number . 1,045 1,010 743 705 636 574 583 564 563 533 474Number of issues . . . . . . Number . 3,057 3,856 2,912 2,727 2,354 2,103 2,141 2,097 2,064 1,965 1,858Face value . . . . . . . . . . Bil. dol . . 602 1,327 1,689 2,219 2,009 2,342 2,526 2,773 2,845 2,625 2,554
STOCKS
Companies . . . . . . . . . . Number . 1,570 1,541 1,774 1,885 2,088 2,361 2,570 2,675 2,907 3,047 3,114Number of issues . . . . . . Number . 2,228 2,298 2,284 2,426 2,658 2,904 3,060 3,126 3,285 3,358 3,382Shares listed . . . . . . . . . Billion. . . 33.7 52.4 90.7 99.6 115.8 131.1 142.3 154.7 176.9 207.1 239.3Market value . . . . . . . . . Bil. dol . . 1,243 1,950 2,820 3,713 4,035 4,541 4,448 6,013 7,300 9,413 10,864Average price . . . . . . . . Dollars . . 36.87 37.20 31.08 37.27 34.83 34.65 31.26 38.86 41.26 45.45 45.40Cash dividends oncommon stock 1 . . . . . . Bil. dol . . 53.1 74.2 103.2 123.4 109.7 120.2 130.0 147.0 150.6 159.4 179.0
1 Beginning 1990 estimate based on average annual yield of the NYSE composite index.
Source: New York Stock Exchange, Inc., New York, NY, Fact Book, annual (copyright).
No. 846. Stock Ownership, by Age of Head of Family and Family Income:1989 to 1995
[Median value in thousands of constant 1995 dollars (10.4 represents $10,400). Constant dollar figures are based onconsumer price index data published by U.S. Bureau of Labor Statistics. Families include one-person units; for definition of family,see text, Section 1, Population. Based on Survey of Consumer Finance; see Appendix III. For definition of median, see Guide toTabular Presentation]
Age of family head andfamily income
(constant (1995) dollars)
Families having director indirect stock holdings
(percent)
Median value amongfamilies with holdings
Stock holdings’ share ofgroup’s financial assets
(percent)
1989 1992 1995 1989 1992 1995 1989 1992 1995
All families . . . . . . . . . . . . . . 31.6 36.6 40.3 10.4 11.4 14.5 28.6 34.1 41.5
Under 35 years old . . . . . . . . . . . 22.3 28.4 36.7 3.7 3.8 5.1 20.4 25.2 31.635 to 44 years old . . . . . . . . . . . 38.9 42.5 46.4 6.3 8.1 10.0 30.1 31.4 41.545 to 54 years old . . . . . . . . . . . 41.8 46.2 48.9 16.1 16.3 25.6 36.2 41.1 44.555 to 64 years old . . . . . . . . . . . 36.1 45.3 40.0 22.6 27.1 30.0 28.5 38.3 47.065 to 74 years old . . . . . . . . . . . 26.7 30.0 34.2 24.9 17.9 34.0 26.4 31.6 36.275 years old and over . . . . . . . . . 25.9 25.6 27.8 30.7 27.1 20.0 25.0 25.5 39.8
Less than $10,000 . . . . . . . . . . . 3.3 6.8 6.2 35.0 5.9 2.9 12.1 15.3 13.6$10,000 to $24,999 . . . . . . . . . . 13.0 18.7 23.2 7.4 4.3 6.0 12.0 15.3 28.1$25,000 to $49,999 . . . . . . . . . . 32.3 40.8 47.3 5.5 7.6 9.0 18.3 24.4 32.1$50,000 to $99,999 . . . . . . . . . . 52.4 63.4 67.3 10.4 15.2 23.4 23.5 34.5 43.2$100,000 and more . . . . . . . . . . 81.8 78.5 81.1 55.2 75.4 97.7 36.6 40.7 47.3
Source: Board of Governors of the Federal Reserve System, Federal Reserve Bulletin, January 1997, and unpublishedrevisions.
No. 847. Household Ownership of Mutual Funds, by Age and Income: 1998
[In percent. Includes money market, stock, bond and hybrid, variable annuity, IRA, Keogh, and employer-sponsored retirementplan fund owners. An estimated 44,400,000 households own mutual funds. Based on a sample survey of 3,000 households; fordetails, see source]
Age of household headand household income
Allhouse-holds,
percentdistri-
bution
Householdsowning mutual
funds
Percentdistri-
bution
Percentof all
house-holds
Total . . . . . . . . . . . . . 100 100 44Less than 25 years old . . . . 5 3 2425 to 34 years old. . . . . . . . 20 18 4235 to 44 years old. . . . . . . . 22 26 5245 to 54 years old. . . . . . . . 18 22 5355 to 64 years old. . . . . . . . 13 15 5165 years old and over . . . . . 22 16 31
Age of household headand household income
Allhouse-holds,
percentdistri-
bution
Householdsowning mutual
funds
Percentdistri-
bution
Percentof all
house-holds
Less than $25,000 . . . . . . . 27 9 13$25,000 to $34,999 . . . . . . . 17 11 28$35,000 to $49,999 . . . . . . . 17 19 47$50,000 to $74,999 . . . . . . . 22 31 62$75,000 to $99,999 . . . . . . . 8 14 72$100,000 and over . . . . . . . 9 16 77
Source: Investment Company Institute, Washington, DC, Fundamentals, Investment Company Institute Research in Brief,Vol. 8, No. 1, March 1999 (copyright).
536 Banking, Finance, and Insurance
U.S. Census Bureau, Statistical Abstract of the United States: 1999
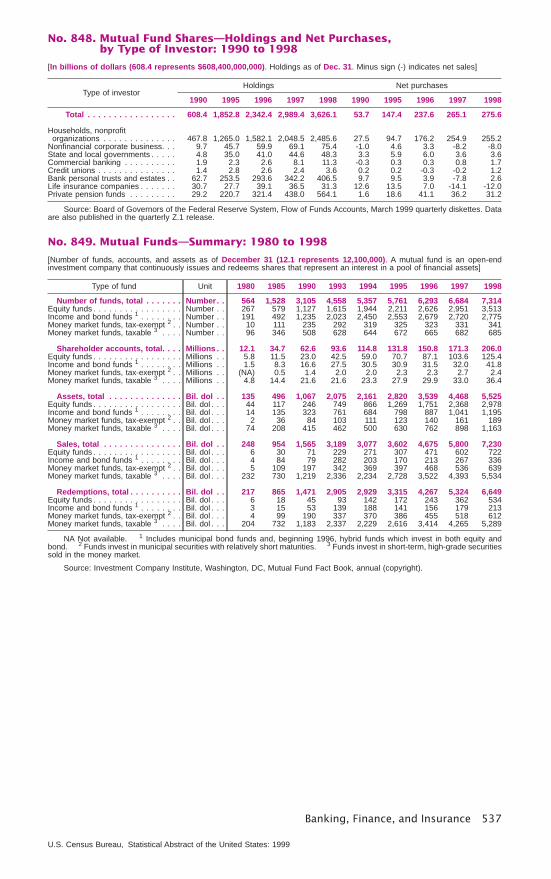
No. 848. Mutual Fund Shares—Holdings and Net Purchases,by Type of Investor: 1990 to 1998
[In billions of dollars (608.4 represents $608,400,000,000). Holdings as of Dec. 31. Minus sign (-) indicates net sales]
Type of investorHoldings Net purchases
1990 1995 1996 1997 1998 1990 1995 1996 1997 1998
Total . . . . . . . . . . . . . . . . . 608.4 1,852.8 2,342.4 2,989.4 3,626.1 53.7 147.4 237.6 265.1 275.6
Households, nonprofitorganizations . . . . . . . . . . . . . . 467.8 1,265.0 1,582.1 2,048.5 2,485.6 27.5 94.7 176.2 254.9 255.2
Nonfinancial corporate business. . . 9.7 45.7 59.9 69.1 75.4 -1.0 4.6 3.3 -8.2 -8.0State and local governments . . . . . 4.8 35.0 41.0 44.6 48.3 3.3 5.9 6.0 3.6 3.6Commercial banking . . . . . . . . . . 1.9 2.3 2.6 8.1 11.3 -0.3 0.3 0.3 0.8 1.7Credit unions . . . . . . . . . . . . . . . 1.4 2.8 2.6 2.4 3.6 0.2 0.2 -0.3 -0.2 1.2Bank personal trusts and estates . . 62.7 253.5 293.6 342.2 406.5 9.7 9.5 3.9 -7.8 2.6Life insurance companies . . . . . . . 30.7 27.7 39.1 36.5 31.3 12.6 13.5 7.0 -14.1 -12.0Private pension funds . . . . . . . . . 29.2 220.7 321.4 438.0 564.1 1.6 18.6 41.1 36.2 31.2
Source: Board of Governors of the Federal Reserve System, Flow of Funds Accounts, March 1999 quarterly diskettes. Dataare also published in the quarterly Z.1 release.
No. 849. Mutual Funds—Summary: 1980 to 1998
[Number of funds, accounts, and assets as of December 31 (12.1 represents 12,100,000). A mutual fund is an open-endinvestment company that continuously issues and redeems shares that represent an interest in a pool of financial assets]
Type of fund Unit 1980 1985 1990 1993 1994 1995 1996 1997 1998
Number of funds, total . . . . . . . Number. . 564 1,528 3,105 4,558 5,357 5,761 6,293 6,684 7,314Equity funds . . . . . . . . . . . . . . . . . Number . . 267 579 1,127 1,615 1,944 2,211 2,626 2,951 3,513Income and bond funds 1 . . . . . . . . Number . . 191 492 1,235 2,023 2,450 2,553 2,679 2,720 2,775Money market funds, tax-exempt 2 . . Number . . 10 111 235 292 319 325 323 331 341Money market funds, taxable 3 . . . . Number . . 96 346 508 628 644 672 665 682 685
Shareholder accounts, total. . . . Millions . . 12.1 34.7 62.6 93.6 114.8 131.8 150.8 171.3 206.0Equity funds . . . . . . . . . . . . . . . . . Millions . . 5.8 11.5 23.0 42.5 59.0 70.7 87.1 103.6 125.4Income and bond funds 1 . . . . . . . . Millions . . 1.5 8.3 16.6 27.5 30.5 30.9 31.5 32.0 41.8Money market funds, tax-exempt 2 . . Millions . . (NA) 0.5 1.4 2.0 2.0 2.3 2.3 2.7 2.4Money market funds, taxable 3 . . . . Millions . . 4.8 14.4 21.6 21.6 23.3 27.9 29.9 33.0 36.4
Assets, total . . . . . . . . . . . . . . Bil. dol . . 135 496 1,067 2,075 2,161 2,820 3,539 4,468 5,525Equity funds . . . . . . . . . . . . . . . . . Bil. dol . . . 44 117 246 749 866 1,269 1,751 2,368 2,978Income and bond funds 1 . . . . . . . . Bil. dol . . . 14 135 323 761 684 798 887 1,041 1,195Money market funds, tax-exempt 2 . . Bil. dol . . . 2 36 84 103 111 123 140 161 189Money market funds, taxable 3 . . . . Bil. dol . . . 74 208 415 462 500 630 762 898 1,163
Sales, total . . . . . . . . . . . . . . . Bil. dol . . 248 954 1,565 3,189 3,077 3,602 4,675 5,800 7,230Equity funds . . . . . . . . . . . . . . . . . Bil. dol . . . 6 30 71 229 271 307 471 602 722Income and bond funds 1 . . . . . . . . Bil. dol . . . 4 84 79 282 203 170 213 267 336Money market funds, tax-exempt 2 . . Bil. dol . . . 5 109 197 342 369 397 468 536 639Money market funds, taxable 3 . . . . Bil. dol . . . 232 730 1,219 2,336 2,234 2,728 3,522 4,393 5,534
Redemptions, total . . . . . . . . . . Bil. dol . . 217 865 1,471 2,905 2,929 3,315 4,267 5,324 6,649Equity funds . . . . . . . . . . . . . . . . . Bil. dol . . . 6 18 45 93 142 172 243 362 534Income and bond funds 1 . . . . . . . . Bil. dol . . . 3 15 53 139 188 141 156 179 213Money market funds, tax-exempt 2 . . Bil. dol . . . 4 99 190 337 370 386 455 518 612Money market funds, taxable 3 . . . . Bil. dol . . . 204 732 1,183 2,337 2,229 2,616 3,414 4,265 5,289
NA Not available. 1 Includes municipal bond funds and, beginning 1996, hybrid funds which invest in both equity andbond. 2 Funds invest in municipal securities with relatively short maturities. 3 Funds invest in short-term, high-grade securitiessold in the money market.
Source: Investment Company Institute, Washington, DC, Mutual Fund Fact Book, annual (copyright).
Banking, Finance, and Insurance 537
U.S. Census Bureau, Statistical Abstract of the United States: 1999
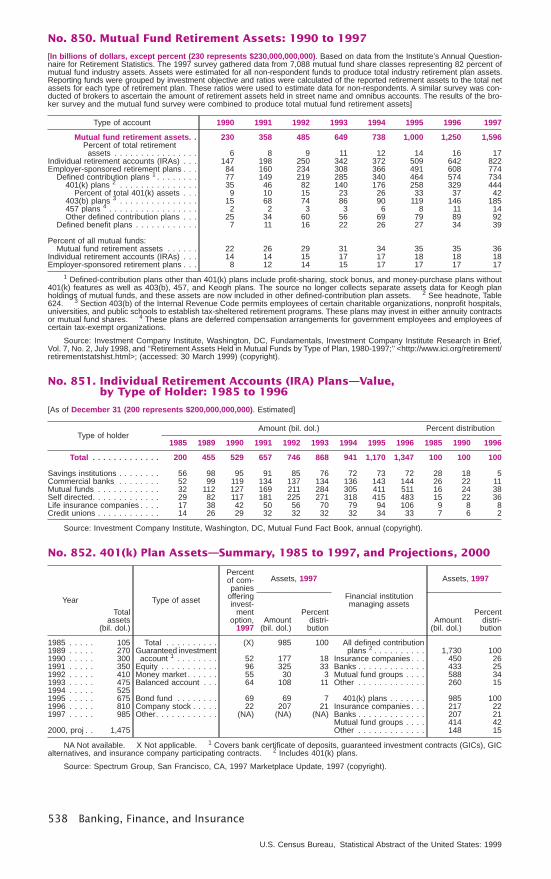
No. 850. Mutual Fund Retirement Assets: 1990 to 1997
[In billions of dollars, except percent (230 represents $230,000,000,000). Based on data from the Institute’s Annual Question-naire for Retirement Statistics. The 1997 survey gathered data from 7,088 mutual fund share classes representing 82 percent ofmutual fund industry assets. Assets were estimated for all non-respondent funds to produce total industry retirement plan assets.Reporting funds were grouped by investment objective and ratios were calculated of the reported retirement assets to the total netassets for each type of retirement plan. These ratios were used to estimate data for non-respondents. A similar survey was con-ducted of brokers to ascertain the amount of retirement assets held in street name and omnibus accounts. The results of the bro-ker survey and the mutual fund survey were combined to produce total mutual fund retirement assets]
Type of account 1990 1991 1992 1993 1994 1995 1996 1997
Mutual fund retirement assets. . 230 358 485 649 738 1,000 1,250 1,596Percent of total retirementassets . . . . . . . . . . . . . . . . 6 8 9 11 12 14 16 17
Individual retirement accounts (IRAs) . . . 147 198 250 342 372 509 642 822Employer-sponsored retirement plans . . . 84 160 234 308 366 491 608 774
Defined contribution plans 1 . . . . . . . . 77 149 219 285 340 464 574 734401(k) plans 2 . . . . . . . . . . . . . . . 35 46 82 140 176 258 329 444
Percent of total 401(k) assets . . . 9 10 15 23 26 33 37 42403(b) plans 3 . . . . . . . . . . . . . . . 15 68 74 86 90 119 146 185457 plans 4 . . . . . . . . . . . . . . . . . 2 2 3 3 6 8 11 14Other defined contribution plans . . . 25 34 60 56 69 79 89 92
Defined benefit plans . . . . . . . . . . . . 7 11 16 22 26 27 34 39
Percent of all mutual funds:Mutual fund retirement assets . . . . . . 22 26 29 31 34 35 35 36
Individual retirement accounts (IRAs) . . . 14 14 15 17 17 18 18 18Employer-sponsored retirement plans . . . 8 12 14 15 17 17 17 17
1 Defined-contribution plans other than 401(k) plans include profit-sharing, stock bonus, and money-purchase plans without401(k) features as well as 403(b), 457, and Keogh plans. The source no longer collects separate assets data for Keogh planholdings of mutual funds, and these assets are now included in other defined-contribution plan assets. 2 See headnote, Table624. 3 Section 403(b) of the Internal Revenue Code permits employees of certain charitable organizations, nonprofit hospitals,universities, and public schools to establish tax-sheltered retirement programs. These plans may invest in either annuity contractsor mutual fund shares. 4 These plans are deferred compensation arrangements for government employees and employees ofcertain tax-exempt organizations.
Source: Investment Company Institute, Washington, DC, Fundamentals, Investment Company Institute Research in Brief,Vol. 7, No. 2, July 1998, and ‘‘Retirement Assets Held in Mutual Funds by Type of Plan, 1980-1997;’’ <http://www.ici.org/retirement/retirementstatshist.html>; (accessed: 30 March 1999) (copyright).
No. 851. Individual Retirement Accounts (IRA) Plans—Value,by Type of Holder: 1985 to 1996
[As of December 31 (200 represents $200,000,000,000). Estimated]
Type of holderAmount (bil. dol.) Percent distribution
1985 1989 1990 1991 1992 1993 1994 1995 1996 1985 1990 1996
Total . . . . . . . . . . . . . 200 455 529 657 746 868 941 1,170 1,347 100 100 100
Savings institutions . . . . . . . . 56 98 95 91 85 76 72 73 72 28 18 5Commercial banks . . . . . . . . 52 99 119 134 137 134 136 143 144 26 22 11Mutual funds . . . . . . . . . . . . 32 112 127 169 211 284 305 411 511 16 24 38Self directed. . . . . . . . . . . . . 29 82 117 181 225 271 318 415 483 15 22 36Life insurance companies . . . . 17 38 42 50 56 70 79 94 106 9 8 8Credit unions . . . . . . . . . . . . 14 26 29 32 32 32 32 34 33 7 6 2
Source: Investment Company Institute, Washington, DC, Mutual Fund Fact Book, annual (copyright).
No. 852. 401(k) Plan Assets—Summary, 1985 to 1997, and Projections, 2000
Year
Totalassets
(bil. dol.)
Type of asset
Percentof com-panies
offeringinvest-
mentoption,
1997
Assets, 1997
Financial institutionmanaging assets
Assets, 1997
Amount(bil. dol.)
Percentdistri-
butionAmount
(bil. dol.)
Percentdistri-
bution
1985 . . . . . 105 Total . . . . . . . . . . (X) 985 100 All defined contribution1989 . . . . . 270 Guaranteed investment plans 2 . . . . . . . . . . 1,730 1001990 . . . . . 300 account 1 . . . . . . . . 52 177 18 Insurance companies . . . 450 261991 . . . . . 350 Equity . . . . . . . . . . . 96 325 33 Banks . . . . . . . . . . . . . 433 251992 . . . . . 410 Money market . . . . . . 55 30 3 Mutual fund groups . . . . 588 341993 . . . . . 475 Balanced account . . . 64 108 11 Other . . . . . . . . . . . . . 260 151994 . . . . . 5251995 . . . . . 675 Bond fund . . . . . . . . 69 69 7 401(k) plans . . . . . . . 985 1001996 . . . . . 810 Company stock . . . . . 22 207 21 Insurance companies . . . 217 221997 . . . . . 985 Other. . . . . . . . . . . . (NA) (NA) (NA) Banks . . . . . . . . . . . . . 207 21
Mutual fund groups . . . . 414 422000, proj . . 1,475 Other . . . . . . . . . . . . . 148 15
NA Not available. X Not applicable. 1 Covers bank certificate of deposits, guaranteed investment contracts (GICs), GICalternatives, and insurance company participating contracts. 2 Includes 401(k) plans.
Source: Spectrum Group, San Francisco, CA, 1997 Marketplace Update, 1997 (copyright).
538 Banking, Finance, and Insurance
U.S. Census Bureau, Statistical Abstract of the United States: 1999
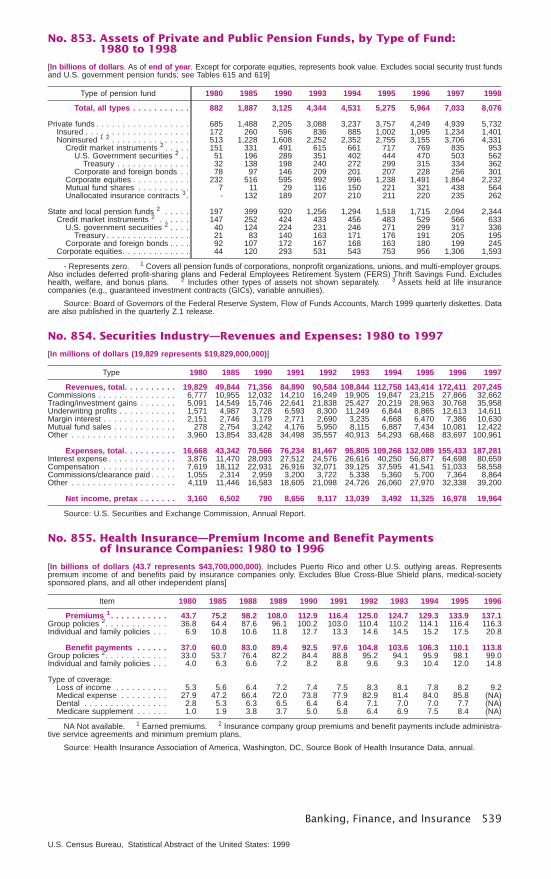
No. 853. Assets of Private and Public Pension Funds, by Type of Fund:1980 to 1998
[In billions of dollars. As of end of year. Except for corporate equities, represents book value. Excludes social security trust fundsand U.S. government pension funds; see Tables 615 and 619]
Type of pension fund 1980 1985 1990 1993 1994 1995 1996 1997 1998
Total, all types . . . . . . . . . . . 882 1,887 3,125 4,344 4,531 5,275 5,964 7,033 8,076
Private funds . . . . . . . . . . . . . . . . . . 685 1,488 2,205 3,088 3,237 3,757 4,249 4,939 5,732Insured . . . . . . . . . . . . . . . . . . . . 172 260 596 836 885 1,002 1,095 1,234 1,401Noninsured 1 2 . . . . . . . . . . . . . . . 513 1,228 1,608 2,252 2,352 2,755 3,155 3,706 4,331
Credit market instruments 2 . . . . . 151 331 491 615 661 717 769 835 953U.S. Government securities 2 . . 51 196 289 351 402 444 470 503 562
Treasury . . . . . . . . . . . . . . 32 138 198 240 272 299 315 334 362Corporate and foreign bonds . . 78 97 146 209 201 207 228 256 301
Corporate equities . . . . . . . . . . . 232 516 595 992 996 1,238 1,491 1,864 2,232Mutual fund shares . . . . . . . . . . 7 11 29 116 150 221 321 438 564Unallocated insurance contracts 3. - 132 189 207 210 211 220 235 262
State and local pension funds 2 . . . . . 197 399 920 1,256 1,294 1,518 1,715 2,094 2,344Credit market instruments 2 . . . . . . 147 252 424 433 456 483 529 566 633
U.S. government securities 2 . . . . 40 124 224 231 246 271 299 317 336Treasury . . . . . . . . . . . . . . . . 21 83 140 163 171 176 191 205 195
Corporate and foreign bonds . . . . 92 107 172 167 168 163 180 199 245Corporate equities. . . . . . . . . . . . . 44 120 293 531 543 753 956 1,306 1,593
- Represents zero. 1 Covers all pension funds of corporations, nonprofit organizations, unions, and multi-employer groups.Also includes deferred profit-sharing plans and Federal Employees Retirement System (FERS) Thrift Savings Fund. Excludeshealth, welfare, and bonus plans. 2 Includes other types of assets not shown separately. 3 Assets held at life insurancecompanies (e.g., guaranteed investment contracts (GICs), variable annuities).
Source: Board of Governors of the Federal Reserve System, Flow of Funds Accounts, March 1999 quarterly diskettes. Dataare also published in the quarterly Z.1 release.
No. 854. Securities Industry—Revenues and Expenses: 1980 to 1997
[In millions of dollars (19,829 represents $19,829,000,000)]
Type 1980 1985 1990 1991 1992 1993 1994 1995 1996 1997
Revenues, total. . . . . . . . . . 19,829 49,844 71,356 84,890 90,584 108,844 112,758 143,414 172,411 207,245Commissions . . . . . . . . . . . . . . . 6,777 10,955 12,032 14,210 16,249 19,905 19,847 23,215 27,866 32,662Trading/investment gains . . . . . . . 5,091 14,549 15,746 22,641 21,838 25,427 20,219 28,963 30,768 35,958Underwriting profits . . . . . . . . . . . 1,571 4,987 3,728 6,593 8,300 11,249 6,844 8,865 12,613 14,611Margin interest . . . . . . . . . . . . . . 2,151 2,746 3,179 2,771 2,690 3,235 4,668 6,470 7,386 10,630Mutual fund sales . . . . . . . . . . . . 278 2,754 3,242 4,176 5,950 8,115 6,887 7,434 10,081 12,422Other . . . . . . . . . . . . . . . . . . . . 3,960 13,854 33,428 34,498 35,557 40,913 54,293 68,468 83,697 100,961
Expenses, total. . . . . . . . . . 16,668 43,342 70,566 76,234 81,467 95,805 109,266 132,089 155,433 187,281Interest expense . . . . . . . . . . . . . 3,876 11,470 28,093 27,512 24,576 26,616 40,250 56,877 64,698 80,659Compensation . . . . . . . . . . . . . . 7,619 18,112 22,931 26,916 32,071 39,125 37,595 41,541 51,033 58,558Commissions/clearance paid . . . . . 1,055 2,314 2,959 3,200 3,722 5,338 5,360 5,700 7,364 8,864Other . . . . . . . . . . . . . . . . . . . . 4,119 11,446 16,583 18,605 21,098 24,726 26,060 27,970 32,338 39,200
Net income, pretax . . . . . . . 3,160 6,502 790 8,656 9,117 13,039 3,492 11,325 16,978 19,964
Source: U.S. Securities and Exchange Commission, Annual Report.
No. 855. Health Insurance—Premium Income and Benefit Paymentsof Insurance Companies: 1980 to 1996
[In billions of dollars (43.7 represents $43,700,000,000). Includes Puerto Rico and other U.S. outlying areas. Representspremium income of and benefits paid by insurance companies only. Excludes Blue Cross-Blue Shield plans, medical-societysponsored plans, and all other independent plans]
Item 1980 1985 1988 1989 1990 1991 1992 1993 1994 1995 1996
Premiums 1. . . . . . . . . . . 43.7 75.2 98.2 108.0 112.9 116.4 125.0 124.7 129.3 133.9 137.1Group policies 2. . . . . . . . . . . . 36.8 64.4 87.6 96.1 100.2 103.0 110.4 110.2 114.1 116.4 116.3Individual and family policies . . . 6.9 10.8 10.6 11.8 12.7 13.3 14.6 14.5 15.2 17.5 20.8
Benefit payments . . . . . . 37.0 60.0 83.0 89.4 92.5 97.6 104.8 103.6 106.3 110.1 113.8Group policies 2. . . . . . . . . . . . 33.0 53.7 76.4 82.2 84.4 88.8 95.2 94.1 95.9 98.1 99.0Individual and family policies . . . 4.0 6.3 6.6 7.2 8.2 8.8 9.6 9.3 10.4 12.0 14.8
Type of coverage:Loss of income . . . . . . . . . . 5.3 5.6 6.4 7.2 7.4 7.5 8.3 8.1 7.8 8.2 9.2Medical expense . . . . . . . . . 27.9 47.2 66.4 72.0 73.8 77.9 82.9 81.4 84.0 85.8 (NA)Dental . . . . . . . . . . . . . . . . 2.8 5.3 6.3 6.5 6.4 6.4 7.1 7.0 7.0 7.7 (NA)Medicare supplement . . . . . . 1.0 1.9 3.8 3.7 5.0 5.8 6.4 6.9 7.5 8.4 (NA)
NA Not available. 1 Earned premiums. 2 Insurance company group premiums and benefit payments include administra-tive service agreements and minimum premium plans.
Source: Health Insurance Association of America, Washington, DC, Source Book of Health Insurance Data, annual.
Banking, Finance, and Insurance 539
U.S. Census Bureau, Statistical Abstract of the United States: 1999
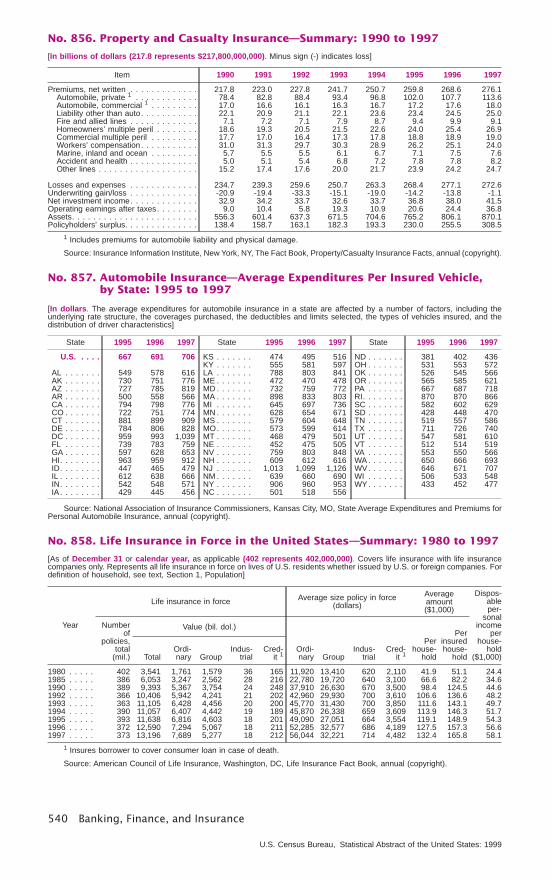
No. 856. Property and Casualty Insurance—Summary: 1990 to 1997
[In billions of dollars (217.8 represents $217,800,000,000). Minus sign (-) indicates loss]
Item 1990 1991 1992 1993 1994 1995 1996 1997
Premiums, net written . . . . . . . . . . . . . 217.8 223.0 227.8 241.7 250.7 259.8 268.6 276.1Automobile, private 1 . . . . . . . . . . . . 78.4 82.8 88.4 93.4 96.8 102.0 107.7 113.6Automobile, commercial 1 . . . . . . . . . 17.0 16.6 16.1 16.3 16.7 17.2 17.6 18.0Liability other than auto. . . . . . . . . . . 22.1 20.9 21.1 22.1 23.6 23.4 24.5 25.0Fire and allied lines . . . . . . . . . . . . . 7.1 7.2 7.1 7.9 8.7 9.4 9.9 9.1Homeowners’ multiple peril . . . . . . . . 18.6 19.3 20.5 21.5 22.6 24.0 25.4 26.9Commercial multiple peril . . . . . . . . . 17.7 17.0 16.4 17.3 17.8 18.8 18.9 19.0Workers’ compensation . . . . . . . . . . . 31.0 31.3 29.7 30.3 28.9 26.2 25.1 24.0Marine, inland and ocean . . . . . . . . . 5.7 5.5 5.5 6.1 6.7 7.1 7.5 7.6Accident and health . . . . . . . . . . . . . 5.0 5.1 5.4 6.8 7.2 7.8 7.8 8.2Other lines . . . . . . . . . . . . . . . . . . . 15.2 17.4 17.6 20.0 21.7 23.9 24.2 24.7
Losses and expenses . . . . . . . . . . . . . 234.7 239.3 259.6 250.7 263.3 268.4 277.1 272.6Underwriting gain/loss . . . . . . . . . . . . . -20.9 -19.4 -33.3 -15.1 -19.0 -14.2 -13.8 -1.1Net investment income. . . . . . . . . . . . . 32.9 34.2 33.7 32.6 33.7 36.8 38.0 41.5Operating earnings after taxes. . . . . . . . 9.0 10.4 5.8 19.3 10.9 20.6 24.4 36.8Assets. . . . . . . . . . . . . . . . . . . . . . . . 556.3 601.4 637.3 671.5 704.6 765.2 806.1 870.1Policyholders’ surplus. . . . . . . . . . . . . . 138.4 158.7 163.1 182.3 193.3 230.0 255.5 308.5
1 Includes premiums for automobile liability and physical damage.
Source: Insurance Information Institute, New York, NY, The Fact Book, Property/Casualty Insurance Facts, annual (copyright).
No. 857. Automobile Insurance—Average Expenditures Per Insured Vehicle,by State: 1995 to 1997
[In dollars. The average expenditures for automobile insurance in a state are affected by a number of factors, including theunderlying rate structure, the coverages purchased, the deductibles and limits selected, the types of vehicles insured, and thedistribution of driver characteristics]
State 1995 1996 1997
U.S. . . . . 667 691 706
AL . . . . . . . 549 578 616AK . . . . . . . 730 751 776AZ . . . . . . . 727 785 819AR . . . . . . . 500 558 566CA . . . . . . . 794 798 776CO . . . . . . . 722 751 774CT . . . . . . . 881 899 909DE . . . . . . . 784 806 828DC . . . . . . . 959 993 1,039FL . . . . . . . 739 783 759GA . . . . . . . 597 628 653HI. . . . . . . . 963 959 912ID. . . . . . . . 447 465 479IL . . . . . . . . 612 638 666IN. . . . . . . . 542 548 571IA. . . . . . . . 429 445 456
State 1995 1996 1997
KS . . . . . . . 474 495 516KY . . . . . . . 555 581 597LA . . . . . . . 788 803 841ME . . . . . . . 472 470 478MD . . . . . . . 732 759 772MA . . . . . . . 898 833 803MI . . . . . . . 645 697 736MN . . . . . . . 628 654 671MS . . . . . . . 579 604 648MO. . . . . . . 573 599 614MT . . . . . . . 468 479 501NE . . . . . . . 452 475 505NV . . . . . . . 759 803 848NH . . . . . . . 609 612 616NJ . . . . . . . 1,013 1,099 1,126NM . . . . . . . 639 660 690NY . . . . . . . 906 960 953NC . . . . . . . 501 518 556
State 1995 1996 1997
ND . . . . . . . 381 402 436OH . . . . . . . 531 553 572OK . . . . . . . 526 545 566OR . . . . . . . 565 585 621PA . . . . . . . 667 687 718RI. . . . . . . . 870 870 866SC . . . . . . . 582 602 629SD . . . . . . . 428 448 470TN . . . . . . . 519 557 586TX . . . . . . . 711 726 740UT . . . . . . . 547 581 610VT . . . . . . . 512 514 519VA . . . . . . . 553 550 566WA . . . . . . . 650 666 693WV. . . . . . . 646 671 707WI . . . . . . . 506 533 548WY. . . . . . . 433 452 477
Source: National Association of Insurance Commissioners, Kansas City, MO, State Average Expenditures and Premiums forPersonal Automobile Insurance, annual (copyright).
No. 858. Life Insurance in Force in the United States—Summary: 1980 to 1997
[As of December 31 or calendar year, as applicable (402 represents 402,000,000). Covers life insurance with life insurancecompanies only. Represents all life insurance in force on lives of U.S. residents whether issued by U.S. or foreign companies. Fordefinition of household, see text, Section 1, Population]
Year
Life insurance in force Average size policy in force(dollars)
Averageamount($1,000)
Dispos-ableper-
sonalincome
perhouse-
hold($1,000)
Numberof
policies,total
(mil.)
Value (bil. dol.)
Ordi-nary Group
Indus-trial
Cred-it 1
Perhouse-
hold
Perinsuredhouse-
holdTotalOrdi-nary Group
Indus-trial
Cred-it 1
1980 . . . . . 402 3,541 1,761 1,579 36 165 11,920 13,410 620 2,110 41.9 51.1 24.41985 . . . . . 386 6,053 3,247 2,562 28 216 22,780 19,720 640 3,100 66.6 82.2 34.61990 . . . . . 389 9,393 5,367 3,754 24 248 37,910 26,630 670 3,500 98.4 124.5 44.61992 . . . . . 366 10,406 5,942 4,241 21 202 42,960 29,930 700 3,610 106.6 136.6 48.21993 . . . . . 363 11,105 6,428 4,456 20 200 45,770 31,430 700 3,850 111.6 143.1 49.71994 . . . . . 390 11,057 6,407 4,442 19 189 45,870 26,338 659 3,609 113.9 146.3 51.71995 . . . . . 393 11,638 6,816 4,603 18 201 49,090 27,051 664 3,554 119.1 148.9 54.31996 . . . . . 372 12,590 7,294 5,067 18 211 52,285 32,577 686 4,189 127.5 157.3 56.61997 . . . . . 373 13,196 7,689 5,277 18 212 56,044 32,221 714 4,482 132.4 165.8 58.1
1 Insures borrower to cover consumer loan in case of death.
Source: American Council of Life Insurance, Washington, DC, Life Insurance Fact Book, annual (copyright).
540 Banking, Finance, and Insurance
U.S. Census Bureau, Statistical Abstract of the United States: 1999
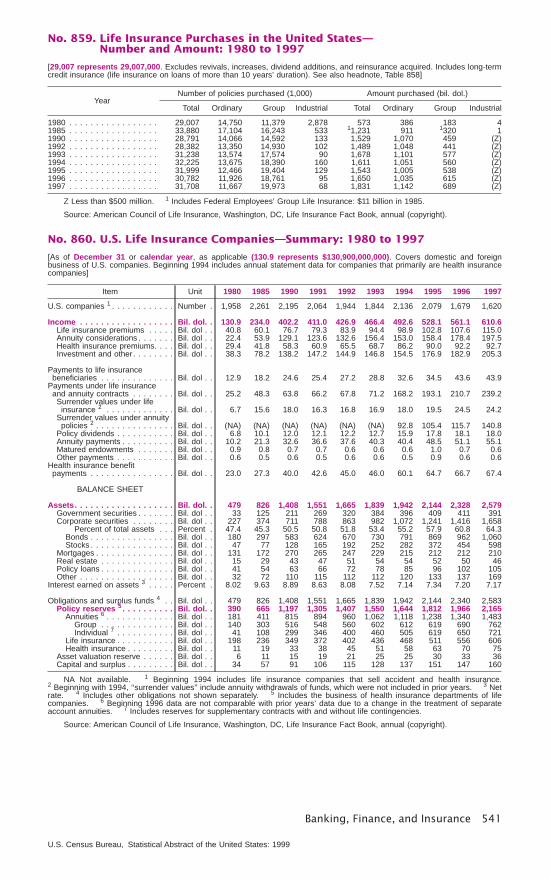
No. 859. Life Insurance Purchases in the United States—Number and Amount: 1980 to 1997
[29,007 represents 29,007,000. Excludes revivals, increases, dividend additions, and reinsurance acquired. Includes long-termcredit insurance (life insurance on loans of more than 10 years’ duration). See also headnote, Table 858]
YearNumber of policies purchased (1,000) Amount purchased (bil. dol.)
Total Ordinary Group Industrial Total Ordinary Group Industrial
1980 . . . . . . . . . . . . . . . . . 29,007 14,750 11,379 2,878 573 386 183 41985 . . . . . . . . . . . . . . . . . 33,880 17,104 16,243 533 11,231 911 1320 11990 . . . . . . . . . . . . . . . . . 28,791 14,066 14,592 133 1,529 1,070 459 (Z)1992 . . . . . . . . . . . . . . . . . 28,382 13,350 14,930 102 1,489 1,048 441 (Z)1993 . . . . . . . . . . . . . . . . . 31,238 13,574 17,574 90 1,678 1,101 577 (Z)1994 . . . . . . . . . . . . . . . . . 32,225 13,675 18,390 160 1,611 1,051 560 (Z)1995 . . . . . . . . . . . . . . . . . 31,999 12,466 19,404 129 1,543 1,005 538 (Z)1996 . . . . . . . . . . . . . . . . . 30,782 11,926 18,761 95 1,650 1,035 615 (Z)1997 . . . . . . . . . . . . . . . . . 31,708 11,667 19,973 68 1,831 1,142 689 (Z)
Z Less than $500 million. 1 Includes Federal Employees’ Group Life Insurance: $11 billion in 1985.
Source: American Council of Life Insurance, Washington, DC, Life Insurance Fact Book, annual (copyright).
No. 860. U.S. Life Insurance Companies—Summary: 1980 to 1997
[As of December 31 or calendar year, as applicable (130.9 represents $130,900,000,000). Covers domestic and foreignbusiness of U.S. companies. Beginning 1994 includes annual statement data for companies that primarily are health insurancecompanies]
Item Unit 1980 1985 1990 1991 1992 1993 1994 1995 1996 1997
U.S. companies 1 . . . . . . . . . . . . Number . 1,958 2,261 2,195 2,064 1,944 1,844 2,136 2,079 1,679 1,620
Income . . . . . . . . . . . . . . . . . . Bil. dol. . 130.9 234.0 402.2 411.0 426.9 466.4 492.6 528.1 561.1 610.6Life insurance premiums . . . . . Bil. dol . . 40.8 60.1 76.7 79.3 83.9 94.4 98.9 102.8 107.6 115.0Annuity considerations . . . . . . . Bil. dol . . 22.4 53.9 129.1 123.6 132.6 156.4 153.0 158.4 178.4 197.5Health insurance premiums. . . . Bil. dol . . 29.4 41.8 58.3 60.9 65.5 68.7 86.2 90.0 92.2 92.7Investment and other . . . . . . . . Bil. dol . . 38.3 78.2 138.2 147.2 144.9 146.8 154.5 176.9 182.9 205.3
Payments to life insurancebeneficiaries . . . . . . . . . . . . . . Bil. dol . . 12.9 18.2 24.6 25.4 27.2 28.8 32.6 34.5 43.6 43.9
Payments under life insuranceand annuity contracts . . . . . . . . Bil. dol . . 25.2 48.3 63.8 66.2 67.8 71.2 168.2 193.1 210.7 239.2Surrender values under lifeinsurance 2 . . . . . . . . . . . . . Bil. dol . . 6.7 15.6 18.0 16.3 16.8 16.9 18.0 19.5 24.5 24.2
Surrender values under annuitypolicies 2 . . . . . . . . . . . . . . . Bil. dol . . (NA) (NA) (NA) (NA) (NA) (NA) 92.8 105.4 115.7 140.8
Policy dividends . . . . . . . . . . . Bil. dol . . 6.8 10.1 12.0 12.1 12.2 12.7 15.9 17.8 18.1 18.0Annuity payments . . . . . . . . . . Bil. dol . . 10.2 21.3 32.6 36.6 37.6 40.3 40.4 48.5 51.1 55.1Matured endowments . . . . . . . Bil. dol . . 0.9 0.8 0.7 0.7 0.6 0.6 0.6 1.0 0.7 0.6Other payments . . . . . . . . . . . Bil. dol . . 0.6 0.5 0.6 0.5 0.6 0.6 0.5 0.9 0.6 0.6
Health insurance benefitpayments . . . . . . . . . . . . . . . . Bil. dol . . 23.0 27.3 40.0 42.6 45.0 46.0 60.1 64.7 66.7 67.4
BALANCE SHEET
Assets. . . . . . . . . . . . . . . . . . . Bil. dol. . 479 826 1,408 1,551 1,665 1,839 1,942 2,144 2,328 2,579Government securities . . . . . . . Bil. dol . . 33 125 211 269 320 384 396 409 411 391Corporate securities . . . . . . . . Bil. dol . . 227 374 711 788 863 982 1,072 1,241 1,416 1,658
Percent of total assets . . . Percent . 47.4 45.3 50.5 50.8 51.8 53.4 55.2 57.9 60.8 64.3Bonds . . . . . . . . . . . . . . . . Bil. dol . . 180 297 583 624 670 730 791 869 962 1,060Stocks . . . . . . . . . . . . . . . . Bil. dol . . 47 77 128 165 192 252 282 372 454 598
Mortgages . . . . . . . . . . . . . . . Bil. dol . . 131 172 270 265 247 229 215 212 212 210Real estate . . . . . . . . . . . . . . Bil. dol . . 15 29 43 47 51 54 54 52 50 46Policy loans . . . . . . . . . . . . . . Bil. dol . . 41 54 63 66 72 78 85 96 102 105Other . . . . . . . . . . . . . . . . . . Bil. dol . . 32 72 110 115 112 112 120 133 137 169
Interest earned on assets 3 . . . . . Percent . 8.02 9.63 8.89 8.63 8.08 7.52 7.14 7.34 7.20 7.17
Obligations and surplus funds 4 . . Bil. dol . . 479 826 1,408 1,551 1,665 1,839 1,942 2,144 2,340 2,583Policy reserves 5 . . . . . . . . . . Bil. dol. . 390 665 1,197 1,305 1,407 1,550 1,644 1,812 1,966 2,165
Annuities 6 . . . . . . . . . . . . . Bil. dol . . 181 411 815 894 960 1,062 1,118 1,238 1,340 1,483Group . . . . . . . . . . . . . . Bil. dol . . 140 303 516 548 560 602 612 619 690 762Individual 7 . . . . . . . . . . . Bil. dol . . 41 108 299 346 400 460 505 619 650 721
Life insurance . . . . . . . . . . . Bil. dol . . 198 236 349 372 402 436 468 511 556 606Health insurance . . . . . . . . . Bil. dol . . 11 19 33 38 45 51 58 63 70 75
Asset valuation reserve . . . . . . Bil. dol . . 6 11 15 19 21 25 25 30 33 36Capital and surplus . . . . . . . . . Bil. dol . . 34 57 91 106 115 128 137 151 147 160
NA Not available. 1 Beginning 1994 includes life insurance companies that sell accident and health insurance.2 Beginning with 1994, ‘‘surrender values’’ include annuity withdrawals of funds, which were not included in prior years. 3 Netrate. 4 Includes other obligations not shown separately. 5 Includes the business of health insurance departments of lifecompanies. 6 Beginning 1996 data are not comparable with prior years’ data due to a change in the treatment of separateaccount annuities. 7 Includes reserves for supplementary contracts with and without life contingencies.
Source: American Council of Life Insurance, Washington, DC, Life Insurance Fact Book, annual (copyright).
Banking, Finance, and Insurance 541
U.S. Census Bureau, Statistical Abstract of the United States: 1999