banking in sub-saharan africa - eib.org · chapter 5: meeting africa’s longterm housing finance...
TRANSCRIPT

Banking in sub-Saharan Africa Recent Trends and
Digital Financial Inclusion


Banking in sub-Saharan Africa:
Recent Trends and Digital Financial Inclusion
November 2016

Banking in sub-Saharan Africa: Recent Trends and Digital Financial Inclusion About the Report At its third edition, this report provides an analysis of recent development in the SSA banking sector and specific structural topics of relevance. It combines in house research with contribution from leading market experts from commercial banks operating in the region, IFIs and other institutions. About the Economics Department of the EIB The mission of the EIB Economics Department is to provide economic analyses and studies to support the Bank in its operations and in the definition of its positioning, strategy and policy. The Department, a team of 30 economists, is headed by Debora Revoltella, Director of Economics. Main contributors to this year’s report Economic Editor: Jean-Philippe Stijns, under the supervision of Debora Revoltella, Director of the Economics Department
Introduction: Jean-Philippe Stijns
Chapter 1: African Banking Groups: Jean-Philippe Stijns and Adeline Pelletier, with Box 1.1 prepared by Rodolfo Maino, Senior Economist at the African Department of the International Monetary Fund
Chapter 2: Banking in East Africa: Jared Osoro, Director, Kenya Bankers Association Centre for Research on Financial Markets and Policy, and Habil Olaka, Chief Executive Officer, Kenya Bankers Association
Chapter 3: Banking in Southern Africa: Stuart Theobald, Chairman, Intellidex
Chapter 4: Developing the banking sector in West Africa and Central Africa: Jad Benhamdane, Senior Sectoral Analyst, Amine El Kourchi, Strategic Analyst, and Said Hidane, Informational Monitoring, BMCE Bank of Africa
Chapter 5: Meeting Africa’s Long-Term Housing Finance Needs: Issa Faye, Division Manager, Development Research Division (EDRE.1), Development Research Department, African Development Bank (AfDB), and Zekebweliwai Geh, Research Department, African Development Bank (AfDB)
Chapter 6: Long-term financing in sub-Saharan Africa: Raffaele Della Croce, Lead Manager, Long Term Investment Project, OECD, Michael Fuchs, Financial Sector Advisor and consultant to Deutsche Gesellschaft für Internationale Zusammenarbeit GmbH (GIZ), Sector and Global Programs Department, Makaio Witte, Advisor, Financial Sector Development, Deutsche Gesellschaft für Internationale Zusammenarbeit GmbH (GIZ), Sector and Global Programs Department
Chapter 7: The EIB in sub-Saharan Africa: Barbara Marchitto, Tim Bending, Nina Fenton, Claudio Cali
Editorial, Linguistic and Statistical Support Marc Bello, Head of Graphic Design and Production, Communication Department, European Investment Bank Claude Colomer, Senior Translator-Reviser, Head of French Unit, European Investment Bank Morgan Ferriter, Senior Translator-Reviser, English Unit, European Investment Bank Nathalie Gilson, Senior Operational Assistant, European Investment Bank Polyxeni Kanelliadou, PhD, Assistant, European Investment Bank Céline Micard, Administrative Assistant, Linguistic Services, European Investment Bank Published by the European Investment Bank. Disclaimer:
The views expressed in this publication are those of the authors and do not necessarily reflect the position of the EIB.

Banking in sub-Saharan Africa: Recent Trends and Digital Financial Inclusion
© European Investment Bank, November 2016
PREFACE
In most sub-Saharan Africa (SSA) countries, following a prolonged spell of sustained growth, a sharp decline in commodity prices has combined with difficult domestic political and economic conditions. Only a few of the region’s non-resource exporters have been immune, continuing to expand at a robust pace, benefiting from low oil prices and enjoying healthy private consumption and investment growth rates. Overall, growth in SSA slumped to 3.4% in 2015 with a further slowdown to 1.4% projected by the IMF for 2016. The external environment, particularly for commodity exporters, remains challenging.
Unsurprisingly, slowing economic activity has impacted banking soundness indicators, which have shown some signs of weakening: non-performing loans (NPLs) are on the rise in several SSA markets; portfolio concentration risks remains generally high, with bank lending activities typically focused on a few key sectors and a limited number of large corporates; exposure to government and state-owned enterprises has increased in some countries. On a positive note, SSA banks are still well-capitalised and profitability, albeit softening, remains at comfortable levels.
Against the background of a rapidly evolving context for the SSA banking industry, the Economics Department of the European Investment Bank (EIB) has coordinated this volume, which combines in-house expertise on the region with contributions from leading experts from the local financial sector and from international financial institutions and research centres. The study aims to provide an overview of structural development and recent market trends in the region. It outlines some of the key challenges and opportunities that lie ahead. It also presents the results of the second edition of the EIB Survey of Pan-African Banks, a unique survey targeting the largest multi-country players in SSA, as well as containing more detailed structural analysis on long-term housing financing and long-term investment. As such, the report sets the basis for optimising the EIB’s initiatives in SSA.
The EIB is the bank of the European Union and the world’s largest multilateral borrower and lender. The Bank is a key provider of both long-term financing and expertise, supporting investments that foster EU policy objectives, inside and outside the EU. In sub-Saharan Africa, EIB’s engagement is geared towards promoting local private sector development, social and economic infrastructure, regional integration and mitigation of/adaptation to climate change. In 2015, the Bank provided loans totalling EUR 971 million in SSA.
Debora Revoltella Director
Economics Department

©European Investment Bank, November 2016

Banking in sub-Saharan Africa: Recent Trends and Digital Financial Inclusion
© European Investment Bank, November 2016
CONTENTS
Introduction .............................................................................................................. 5
1. African Banking Groups: Recent Trends and Strategic Issues ............................ 9
ADELINE PELLETIER, JEAN-PHILIPPE STIJNS
2. Banking in East Africa : The Experience of Digital Financial Services ............... 49
JARED OSORO, HABIL OLAKA
3. Banking in Southern Africa ............................................................................... 67
STUART THEOBALD
4. Development of the Banking Sector in West Africa and Central Africa in an Era of Financial Digitalisation.................................................................................. 85
JAD BENHAMDANE, AMINE EL KOURCHI, SAID HIDANE
5. Meeting Africa’s Long-Term Housing Finance Needs: A Journey of a Thousand Miles?.............................................................................................................. 117
ISSA FAYE, ZEKEBWELIWAI GEH
6. Long-Term Financing in sub-Saharan Africa ................................................... 143
RAFFAELE DELLA CROCE, MICHAEL FUCHS, MAKAIO WITTE
7. The EIB in sub-Saharan Africa ......................................................................... 165
TIM BENDING, CLAUDIO CALI, NINA FENTON, BARBARA MARCHITTO


Banking in sub-Saharan Africa: Recent Trends and Digital Financial Inclusion
© European Investment Bank, November 2016 5
Introduction
This study comes at a time when most SSA economies have slowed significantly, after a decade of robust rates of growth. Spillovers to the banking sectors are increasingly noticeable in some markets, mostly through the rising rates of NPLs observed. Banking groups are adjusting their overall strategy in the face of a challenging environment characterised by tighter funding conditions, slower lending growth and rising competition for deposits and easily bankable clients. The 2016 edition of the EIB survey of banking groups operating in SSA shows that e-banking and mobile banking remain areas of intense technological deployment.
For this third edition of EIB’s study of banking sectors in SSA, the sections devoted to banking sector development in each sub-region have been complemented with a fresh look at digital financing services and the conditions necessary for them to blossom and increase financial inclusion. The overarching conclusion of the authors is that while digital financial services have great potential across the region, the regulatory framework and market conditions are such that expectations about concrete changes differ remarkably across markets. In addition, the study delves into two cross-cutting structural themes: housing financing and long-term investment. The authors highlight some low-hanging fruit and potential opportunities to run ahead of the advent of deeper and more liquid capital markets across SSA. However, the full exploitation of housing and long-term investment opportunities will be contingent on sustained and ambitious efforts to create and develop the necessary public institutions and improve corporate practices.
More specifically, in the first chapter, Adeline Pelletier and Jean-Philippe Stijns examine the recent trends in the SSA banking sectors, relying on information both from banks’ financial statements and a survey of selected large banking groups operating in the region. Banking groups are still in the process of optimising their network of subsidiaries across the region but they appear to be in “wait and see” mode for the most part. From a longer-term perspective, expansion is still the norm in terms of strategic orientation. However, most banks have recently maintained a constant medium-term exposure to SSA and expect to keep the same approach going forward. A minority of groups, however, are experiencing and/or contemplating a reduction in their medium-term exposure. On the bright side, a growing proportion of banking groups are focusing on SMEs and retail clients, with internet banking technology and mobile banking technology areas of intense deployment and, in terms of the need for technical assistance, IT and credit risk management are the highest priorities.
In Chapter 2, Jared Osoro and Habil Olaka illustrate the development of digital financial services in Kenya and the rest of the East African Community. They point out the critical role that the regulator and the existence of a dominant market actor have played in the success of mobile payment/money in Kenya. While the country’s achievement in mobile money has provided impetus for replication of the model across East Africa and even wider SSA, the success of such replication has been modest so far. They caution that without an appropriate

6 © European Investment Bank, November 2016
regulatory environment and supportive market structure, mobile payments will not necessarily follow the trend of regional expansion of banks in East Africa.
In Chapter 3, Stuart Theobald observes that the banking industry in the Southern African Development Community (SADC) has been affected by the sharp decline in commodity prices, causing an increase in non-performing loans in most markets and tighter liquidity conditions. In Southern Africa, many markets are dominated by foreign-owned banks which are now looking to dispose of their interests. The author concludes that reform efforts such as improving capital adequacy, risk management and product transparency remain important.
In Chapter 4, Jad Benhamdane, Amine El Kourchi and Said Hidane reason that the challenges of financial inclusion in West Africa and Central Africa continue to be of vital importance given that their banking penetration rates are among the lowest in the world. The countries of the CFA franc monetary zone fare particularly badly. They conclude that the promotion of digitalised services in these areas, which generally have high levels of mobile penetration, is the key initiative for improving access to banking services. However, they point out that the regulatory framework is more favourable in West Africa than in Central Africa.
In Chapter 5, Issa Faye and Zekebweliwai Geh argue that the lack of access to long-term funds is a major constraint to the development of housing finance. Attracting long-term capital into Africa’s property market could look like “a journey of a thousand miles” as it requires the efficient functioning of many interrelated components. Nonetheless, alternative long-term capital sources such as private equity for affordable housing development, real estate investment trusts, mortgage-covered bonds and mortgage refinancing companies are promising emerging institutions and instruments that should be tapped to fill the continent’s long-term housing finance gap.
In Chapter 6, Raffaele Della Croce, Michael Fuchs and Makaio Witte stress that the provision of long-term finance for productive investment is crucial to sustaining growth and diversifying economic activity in SSA. However, in order to respond to the challenges SSA is facing, it is necessary to broaden the options available locally for long-term finance and increase as well as diversify the investor base. Development finance institutions (DFIs) continue to play a crucial role in promoting long-term finance. In the authors’ view, a stronger shift from direct and indirect investments to the provision of guarantee and credit enhancement instruments would more effectively leverage public funding as a means to mobilise private capital.
In Chapter 7, Tim Bending, Claudio Cali, Nina Fenton and Barbara Marchitto offer an overview of EIB’s operations in SSA, where the Bank’s engagement is geared towards promoting local private sector development, social and economic infrastructure, regional integration and mitigation of/adaptation to climate change. Over more than 50 years, since the launch of its activities in SSA in 1963, the Bank has supported 1 100 projects in 47 countries totalling over EUR 17 billion of funding. In 2015 alone, the Bank provided loans totalling EUR 971 million in SSA.

Banking in sub-Saharan Africa: Recent Trends and Digital Financial Inclusion
© European Investment Bank, November 2016 7
Development partners, and IFIs in particular, continue to have a key role to play in ensuring that improvements in financial inclusion and access to finance for SMEs are sustained throughout challenging macroeconomic circumstances. Banking groups are carrying out important adaptation efforts through sustained investment in IT, risk management and digital financial services. Indeed, as banking groups prodded by competition forces make the strategic choice of serving more actively the SME segment, the need to put in place first-class risk management processes has become inescapable.
Regulatory standards will also need to evolve in order to bring SSA banks into closer alignment with Basel principles and best practices across the board. Supervisory authorities remain short of capacity and expertise in many markets, limiting their ability to conduct on-site visits, and constraining the credibility and impact of their control functions. Resolution and deposit guarantee mechanisms also deserve an upgrade in several markets.
To sum up, a rich reform agenda will need to be pursued on several fronts for trust to be resilient in times of market stress. Implementing reforms, investing in financial infrastructure and strengthening risk management, monitoring capacity and IT systems would go a long way to enhance the resilience of the SSA banking industry, and thereby strengthen its ability to finance development in SSA.

8 © European Investment Bank, November 2016

Banking in sub-Saharan Africa: Recent Trends and Digital Financial Inclusion
© European Investment Bank, November 2016 9
1. African Banking Groups: Recent Trends and Strategic Issues
ADELINE PELLETIER1 AND JEAN-PHILIPPE STIJNS2, 3 Executive summary
• In this chapter we examine the recent trends in the banking sector in sub-Saharan Africa based on information from banks’ financial statements and from a unique survey of selected large banking groups operating in the region.
• While foreign affiliates of regional African banking groups already outnumber foreign affiliates of both global and emerging banking groups operating in SSA (including South African banking groups), global banking groups4 still account for the largest share of assets in sub-Saharan Africa’s banking industry. The foreign affiliates of global banking groups have long benefited from scale effects while African banking groups are beginning to reap such benefits.
• According to financial statements, African banking groups exhibit lower profitability compared to other banks operating in SSA, but the difference is narrowing over time. Lower profitability largely stems from the lower quality of their portfolio and lower, albeit improving, operational efficiency. Moreover, the quality of the loan book seems to be poorer for the foreign affiliates of African banking groups than for the affiliates of global and emerging banking groups. Indeed, African banking groups are known to be somewhat more exposed to the SME segment, which exhibits higher default risk than large corporates.
• Based on the EIB survey, banking groups in SSA are still in the process of expanding their footprint in countries with large market potential. However, whilst in the 2015 edition of the EIB survey all banks in the sample planned to expand in SSA in the long term, this year only two thirds of banking groups still plan to do so on a long-term basis. Accordingly, most banks have maintained a constant medium-term exposure to SSA during the last twelve months. Some groups are even experiencing and/or contemplating a reduction in their medium-term exposure.
• A large majority of banking groups are focusing on deposit funding. At least half of the banking groups plan to raise some forms of long-term funding. Banking groups in the sample report increasing deposit market shares.
1 Lecturer, Institute of Management Studies, Goldsmiths, University of London; Research Associate, London School of Economics. 2 Senior Economist, European Investment Bank. 3 The authors gratefully acknowledge that this chapter has benefited from feedback from EIB colleagues. However, the views expressed here are those of the authors and do not necessarily reflect those of the European Investment Bank. All remaining errors remain the authors’. 4 Global banking groups are defined as banking groups operating in sub-Saharan Africa that originate from developed economies; regional African are banking groups from sub-Saharan Africa (ex-South Africa); and emerging banking groups are from emerging economies (India, South Africa, etc.).

10 © European Investment Bank, November 2016
• A growing share of banking groups has a long-term and significant focus on SMEs and retail clients. Correspondingly, internet banking technology and mobile banking technology are areas where the highest share of banking groups in SSA are either fully deployed or in deployment. Similarly, in terms of the need for technical assistance, IT is reported as the highest priority followed by credit risk management. All banking groups in SSA perceive demand for loans in local currency to be sustained and plan to raise funds in local currency. Most banking groups in SSA consider portfolio guarantees to be either important or very important. However, two thirds of banking groups in SSA consider their portfolio guarantee needs as only partially met.
• All banking groups operating in SSA consider themselves as compliant with Basel I standards. Less than half of banking groups consider themselves compliant with Basel II, with the rest working towards compliance. One banking group in five in SSA is compliant with Basel III.
1.1. Introduction
This chapter takes a close look at trends and strategic issues affecting banking groups with a significant footprint in SSA. This introduction discusses the macroeconomic context characterising SSA economies, as it affects directly the landscape of banking groups operating across the region. This section also takes stock of the level of financial development of the banking and financial sectors in SSA. The second section discusses the diverse features of regional SSA banking groups and of global and emerging banking operating in SSA. It also reports on the results from the analysis of a sample of 573 commercial banks operating in SSA obtained using the BankScope database. The third section examines the responses to the second edition of the EIB survey of banking groups operating in SSA, focusing on the factors affecting the performance of the surveyed banking groups and how these groups are adjusting their strategies accordingly. The fourth section provides a conclusion. An appendix documents the questionnaire underpinning the EIB survey in detail.
1.1.A. MACROECONOMIC CONTEXT
Over the last decade, SSA as a whole has been experiencing high annual economic growth rates, in the range of 5-7% on average and with a rapidly expanding middle class. Robust growth was made possible by economic reforms, coupled with a favourable external environment, including high commodity prices and ample capital inflows.
However, an unsupportive global environment and a sustained slump in commodity prices have combined in some countries with difficult domestic political and economic conditions, including civil war, terrorism, and drought. As a result, growth slumped to 3.4% in 2015, the lowest level in some 15 years, down from 5.1% in 2014. It is projected by the IMF (2016b) to slow down further to 1.4% in 2016 before rebounding sluggishly to 2.9% in 2017. The external environment, particularly for commodity exporters, remains challenging. By contrast, several of the region’s non-resource exporters are expected to continue to expand

Banking in sub-Saharan Africa: Recent Trends and Digital Financial Inclusion
© European Investment Bank, November 2016 11
at a very robust pace of more than 5% in 2016, benefiting from low oil prices and enjoying healthy private consumption and investment growth rates.
1.1.B. FINANCIAL SECTOR OVERVIEW
The overall depth and financial sophistication of SSA financial sectors remain generally low, even controlling for per capita income levels. Financial sectors in SSA are usually small, underdeveloped, and dominated by a highly concentrated banking industry. Given the low level of development of stock and bond markets in SSA, banks play a crucial intermediation role and represent the main source of external capital for companies. Table 1.1 below illustrates the small size of stock markets in SSA, with the notable exception of South Africa (Johannesburg Stock Exchange). However, portfolio concentration risks tend to be high, with bank lending activities often focused on a few key sectors – manufacturing, trade, real estate and construction in particular – and a limited number of large corporate clients. Microenterprises are relatively well covered by MFIs, with SMEs representing the “missing middle” (see Pelletier, 2014, for instance).
Table 1.1.: Stock Markets in SSA
Country
Market Capitalisation
in 2012
Market Capitalisation in 09/2013
Number of Listings
In USD billions
South Africa 998.3 970.5 388
Namibia 144.2 136.9 34
Nigeria 57.8 114.2 190
Botswana 53.0 54.1 37
Ghana 30.5 28.2 34
Kenya 15.9 20.6 61
Tanzania 8.4 14.8 7
Malawi 10.6 13 14
BVRM* 8.1 10.5 72
Zambia 9.4 10.2 22
Mauritius 7.1 8.5 91
Uganda 5.9 8.3 15
Zimbabwe 4.0 5.4 69
Rwanda 1.7 1.9 4
Sudan 2.2 1.8 59
Mozambique 1.0 1 3
Cape Verde 0.1 0.6 4
Cameroon 0.4 0.2 6
Sierra Leone 0.0 0 2
Source: ACM insight data Note: * BVRM serves Benin, Burkina Faso, Côte d’Ivoire, Guinea-Bissau, Mali, Niger, Senegal and Togo.

12 © European Investment Bank, November 2016
Regulatory frameworks are not always in line with international best practices and they may prove volatile at times, inducing uncertainty within the banking community and with international investors. Moreover, central banks may be subject to political influence affecting the conduct of monetary policy and their supervisory functions.
Table 1.2.: Financial Soundness Indicators in selected SSA Banking Markets
Capital-
Asset
Ratio
Non-
Performing
Loans
Return
on Equity
Return
on Assets
Botswana 18.90% 14.94% 4.73% 0.53%
Burundi 21.55% 12.41% 13.04% 2.08%
Ghana 16.18% 23.80% 22.86% 4.87%
Guinea 17.22% 16.08% 22.88% 2.40%
Kenya 18.81% 16.01% 27.70% 4.23%
Mauritius 18.68% 18.71% 13.14% 1.38%
Namibia 15.31% 2.39% 31.45% 3.30%
Nigeria 15.65% 24.25% 20.22% 2.66%
Rwanda 24.14% 15.10% 14.02% 2.64%
South Africa 14.53% 19.75% 21.00% 1.53%
Uganda 21.75% 11.78% 22.28% 3.69%
Source: Financial Soundness Indicators. Figures averaged over Q1, Q2 and Q3 of 2016 where FSI data are available at the time of writing. Countries selected based on data availability. Notes: NPLs are net of provisions. Capital-Asset Ratios are calculated as the ratio of regulatory capital to risk-weighted assets.
Banks have, for the most part, been resilient to the effects of the global financial crisis on the back of limited integration with global financial markets, little exposure to risk from direct financial linkages and heavy reliance on domestic deposits. Capitalisation levels remain quite comfortable and banks are generally liquid and profitable. However, non-performing loans (NPLs) have reached significant levels in 2016 in several SSA markets (Table 1.2).

Banking in sub-Saharan Africa: Recent Trends and Digital Financial Inclusion
© European Investment Bank, November 2016 13
Figure 1.1.: Interest Rate Spread (Percentage – 2000-2014)
Note: the interest spread is the difference between the interest rate charged by banks on loans to private sector customers and the interest rate paid by commercial or similar banks for demand, time, or savings deposits. The median, second and fourth quartile are reported across SSA countries for which data is available (between 23 and 34 countries depending on the year). A similar pattern is observed if a constant panel of 22 countries is considered over the period 2000-2014. Source: World Bank Indicators
Interest margins across the region are generally high although they have been trending down since 2000 (Figure 1.1). SSA banking sectors have also been deepening quite rapidly, especially in recent years, and this trend is affecting all SSA countries with very few exceptions, resulting in improved access to finance and financial services, although from a very low base. These general trends notwithstanding, there is considerable diversity across SSA countries with respect to the depth and financial sophistication of their banking sectors.

14 © European Investment Bank, November 2016
Figure 1.2.: Credit to the Private Sector (as a Share of GDP – 2015)
Source: World Bank FINDEX Note: median and SSA quartile statistics computed across countries with data available for 2015. OECD members, Upper-Middle Income Countries (UMICs), Lower-Middle Income Countries (LMICs), and Low Income Countries (LICs) figures refer to the average for the corresponding income categories at global level.
A limited number of relatively developed banking sectors contrasts with a high proportion of shallow banking sectors (Figure 1.2). SSA counts a few countries with world-class financial sectors: South Africa reports a ratio of credit to the private sector as a share of GDP above 150%, higher than the average of OECD member countries; this ratio is above 100% for Mauritius (although that is still below the average for Upper-Middle Income Countries, UMICs, to which it belongs5). Cape Verde and Namibia are above the average for Lower-Middle Income Countries (LMICs), with credit to the private sector as a share of GDP above 40%. A few countries around the third quartile of the distribution – Togo, Mozambique, Kenya, Botswana, Senegal and Djibouti – have a ratio of private credit to GDP that is higher than 30%. Beyond, there is a long tail of shallower banking sectors, with median credit to the private sector around 20%, only marginally higher than the global average for Low Income Countries (LICs), and the first quartile of the distribution stands below 15%.
5 For FY 2015, the World Bank defines as low-income economies those with a GNI per capita, calculated using the World Bank Atlas method, of USD 1 025 or less in 2015; lower-middle income and upper-middle income economies are those with a GNI per capita of more than USD 1 026 but less than USD 4 035. Upper-middle income economies are those with a GNI per capita between USD 4 036 and USD 12 475.

Banking in sub-Saharan Africa: Recent Trends and Digital Financial Inclusion
© European Investment Bank, November 2016 15
Figure 1.3.: Credit to the Private Sector by Groups of Countries (2000-2015)
Source: World Bank FINDEX Note: median and quartile statistics computed across countries with data available for 2015. Lower-Middle Income Countries (LMICs) and Low Income Countries (LICs) figures refer to the average for the corresponding income categories at global level.
Financial depth, measured as credit to the private sector as a share of GDP, has been steadily increasing since the late 1990s/early 2000s (Figure 1.3). This trend is noticeable even for the 1st quartile of sub-Saharan countries, i.e. the least developed banking sectors in SSA. These countries reached in 2015 a level of credit to the private sector corresponding to 14% of GDP, albeit off a very low starting point, just above 5%, back at the turn of the century. At the other extreme of the distribution, a pronounced upward trend can be observed for the more developed SSA banking sectors (3rd quartile).
Despite more than a decade and a half of financial deepening in nearly all SSA countries, banks in SSA still have a remarkably long way to go (EIB, 2015). According to the IMF (2016a), progress in financial deepening has been lagging in several countries in SSA, in that it stands below the level consistent with its structural characteristics. Accordingly, there is ample room for banking sector deepening both at the top of the distribution and at the bottom. On one side, a growing number of countries should eventually join the league of South Africa, Mauritius, Cape Verde and Namibia and catch up. Indeed, the 3rd quartile still has a large gap to close to be at par with LMICs. On the other side, countries clustered around the 1st quartile still have around 5% of financial deepening to close to catch up with the global average for LICs, where the median SSA banking sector stands.

16 © European Investment Bank, November 2016
Table 1.3.: Ratio of Bank Non-performing Loans to Total Gross Loans
2010 2011 2012 2013 2014 2015
Burundi 9.4% 7.4% 8.2% 9.9% 10.9% 17.9%
Cameroon 10.1% 11.5% 11.6% 10.3% 9.7% 10.5%
Comoros 1.0% 1.1% 1.5% 1.2% 2.5% 2.8%
Djibouti 8.3% 9.4% 11.4% 14.5% 18.0% 22.1%
Ghana 17.6% 14.2% 13.2% 12.0% 11.3% 14.7%
Kenya 6.3% 4.4% 4.6% 5.1% 5.5% 6.0%
Lesotho 3.0% 2.1% 2.5% 3.7% 4.1% 3.9%
Mauritius 2.8% 2.8% 3.6% 4.2% 4.9% 7.0%
Mozambique 1.9% 2.6% 3.2% 2.3% 3.2% 4.3%
Namibia 2.0% 1.5% 1.3% 1.3% 1.5% 1.6%
Nigeria 20.1% 5.8% 3.7% 3.4% 3.0% 5.3%
DRC 1.0% 1.1% 1.5% 1.2% 2.5% 4.6%
Rwanda 11.3% 8.2% 6.0% 7.0% 5.2% 5.8%
Seychelles 5.5% 8.1% 9.0% 9.2% 8.0% 7.5%
Sierra Leone 15.6% 15.1% 14.7% 22.4% 33.4% 31.7%
South Africa 5.8% 4.7% 4.0% 3.6% 3.2% 3.1%
Swaziland 7.8% 7.5% 9.7% 6.8% 4.3% 7.5%
Tanzania 7.8% 5.4% 6.4% 5.1% 6.6% 6.3%
Uganda 1.9% 2.0% 4.1% 5.8% 4.0% 5.1%
Source: World Development Indicators. Note: all SSA countries with a complete time series for NPLs over 2010-2015 are shown.
Moreover, in several SSA countries, private credit growth has slowed recently, especially when compared with the rapid credit growth rates observed between 2010 and 2013 and favoured by rising commodity prices and buoyant financing conditions (IMF 2016a). On the back of a quasi-generalised slowdown in SSA economies, NPLs are clearly on the rise in some countries of the region (Table 1.3).
Despite notable progress, governance, regulation and supervision issues continue to hold back the development of a large number of SSA banking sectors. Against this backdrop,

Banking in sub-Saharan Africa: Recent Trends and Digital Financial Inclusion
© European Investment Bank, November 2016 17
global banks have staged a partial retreat from SSA or have put a break on their expansion plans in SSA markets since the onset of the financial crisis (Beck et al., ibid.) due to new prudential and compliance constraints imposed by home supervisors. Cross-border banks based and operating in SSA, often referred to as Pan-African Banks (PABs), have filled up the void left by global banks in the region and have therefore been attracting a lot of attention in SSA. The term pan-African banks is used when grouping together banks operating across several SSA markets, based in any SSA country, including South Africa. Section 1.2 deals with the rise of these PABs, otherwise referred to as regional African banks. Later in section 1.2, Pan-African Banks (PABs) will be referred to as either African MNB or Emerging MNB if their HQs are based in South Africa in order to identify differentiating characteristics.
1.2. The Rise of Regional African Banks
The impressive regional expansion of SSA banking groups has been accompanied by financial innovations such as the rapid diffusion of mobile banking, especially in East Africa with M-Pesa (see Box 1.1), and regulatory changes, notably the steady increase in minimum capital requirements imposed on banks by the regulator in many countries. One compelling example is the case of Nigeria where banking reforms spurred regional expansion of local banks. The country introduced banking reforms in 2005 including a more than tenfold increase in the minimum capital requirement for banks from NGN 2 billion to NGN 25 billion (approximately USD 190 million). Compliance with this new rule was mainly achieved through mergers and acquisitions. The resulting consolidated banks were found to be significantly more efficient and slightly more profitable, with lower levels of NPLs (Cook, 2011). This led to larger, more efficient, banks, which then embarked on an expansion process throughout West Africa following the consolidation wave in their home country.
Box 1.1.: SSA: Digital Services and Financial Inclusion by Rodolfo Maino, Senior Economist at the African Department
of the International Monetary Fund.
Digital financial services are contributing to financial development and financial inclusion in SSA. The rapid spread of systems such as M-Pesa in Kenya and other countries in SSA has helped reduce transaction costs and facilitate personal transactions, while contributing to the surge of financial intermediation services. With less need for cash for transactions, more economic agents are able to send and monitor financial market signals, contributing to financial development. The environment for monetary policy improves as a result.
SSA leads the way in the adoption of mobile banking. In rural populations, traditional bank intermediaries do not reach sparsely populated areas and the cost of their services is frequently prohibitive for low-income households and small businesses. The recent surge in mobile money observed in many SSA countries has been facilitated by low transaction costs, growing innovations, and strong growth in mobile phone subscriptions. In 2014, the share of the population holding mobile bank accounts reached 11% in SSA, the highest in the world (Figure 1.B1).

18 © European Investment Bank, November 2016
Figure 1.B1. Mobile Phone Subscriptions in 1999-2014
Source: World Bank, World Development Indicators.
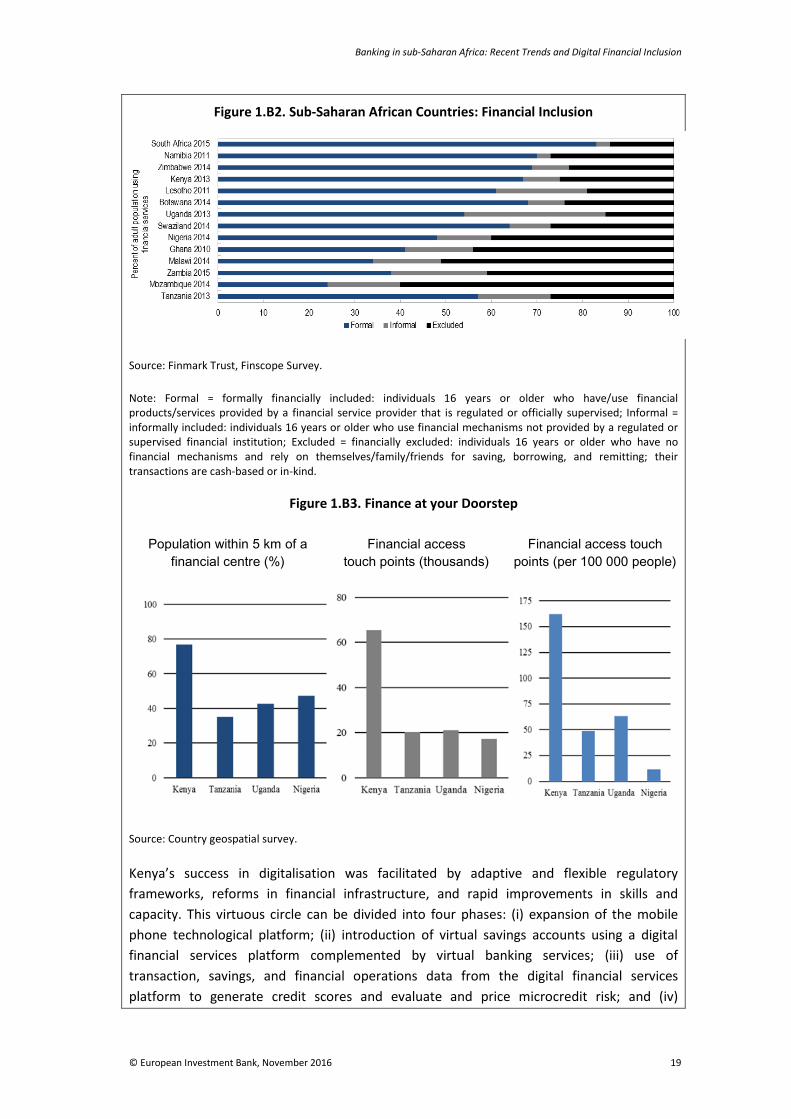
Access to financial services in SSA has increased steadily in recent years (IMF, 2016a). Today, there is less need to travel long distances to access financial services. The development of mobile payment systems has helped to integrate large sections of the population into the financial system, especially in East Africa (Figure 1.B2). The significant increase in the share of the included population is best exemplified by the case of Rwanda where 89% of the population had some kind of financial access in 2016, up from 75% four years earlier. The digital revolution has allowed people to make financial transactions and money transfers from their mobile phones. Lower costs have left them with more disposable income, and they now have a secure way to store cash, even those working in the informal economy. The expansion of the activities of savings and credit cooperatives also contributed towards greater financial inclusion. The successful experience of East Africa provides a useful model that could be adapted by other countries in the region. An important lesson from East Africa is the need to have a flexible enabling regulatory environment while taking into account supervisory challenges.
Kenya’s story sheds light on steps to undertake a digital revolution in a country. Kenya still enjoys the advantages of an early start in pushing the frontier of financial inclusion through digital financial services. Also, in Kenya, a much larger share of the population is within five kilometres of a “financial access touch point” and had many more such touch points per person than was the case in other countries in the region (Figure 1.B3); in less than 10 years the use of mobile phone-based money has grown from zero to more than 75% as a share of the adult population, and the insurance sector has expanded, targeting Kenya’s emerging middle class.
Banking in sub-Saharan Africa: Recent Trends and Digital Financial Inclusion
© European Investment Bank, November 2016 19
Figure 1.B2. Sub-Saharan African Countries: Financial Inclusion
Source: Finmark Trust, Finscope Survey.
Note: Formal = formally financially included: individuals 16 years or older who have/use financial products/services provided by a financial service provider that is regulated or officially supervised; Informal = informally included: individuals 16 years or older who use financial mechanisms not provided by a regulated or supervised financial institution; Excluded = financially excluded: individuals 16 years or older who have no financial mechanisms and rely on themselves/family/friends for saving, borrowing, and remitting; their transactions are cash-based or in-kind.
Figure 1.B3. Finance at your Doorstep
Population within 5 km of a financial centre (%)
Financial access touch points (thousands)
Financial access touch points (per 100 000 people)
Source: Country geospatial survey.
Kenya’s success in digitalisation was facilitated by adaptive and flexible regulatory frameworks, reforms in financial infrastructure, and rapid improvements in skills and capacity. This virtuous circle can be divided into four phases: (i) expansion of the mobile phone technological platform; (ii) introduction of virtual savings accounts using a digital financial services platform complemented by virtual banking services; (iii) use of transaction, savings, and financial operations data from the digital financial services platform to generate credit scores and evaluate and price microcredit risk; and (iv)

20 © European Investment Bank, November 2016
expansion of digital financial services for cross-border payments and international remittances. To achieve these impressive results, banks have worked closely with telecommunications companies, allowing them a bigger market share vis-à-vis other emerging markets.
Financial inclusion has opened the door for potentially game-changing opportunities: innovative pension plan support and government-targeted social protection, expansion of regional payment systems within regional blocks, enforcement of policies to stop money laundering and the financing of terrorism, and a better environment for forward-looking monetary policy to replace years of financial repression and reactive policies.
Financial inclusion makes saving easier and enables accumulation and diversification of assets, boosting economic activity in the process.
Notwithstanding the progress achieved in financial inclusion, a lot remains to be done. As the economies of SSA countries continue to grow, the demand for financial services for people and business will keep pace. Moreover, recent policy decisions could cloud the central bank’s monetary policy signals and affect loanable funds. In August 2016, Kenya’s President signed the country’s Banking Bill Amendment into law, limiting the rate that commercial banks can charge for loans and prescribing how much interest banks could pay on deposits. The controls could blur the signals that emanate from interest rate decisions, undermine efforts to keep inflation within the government’s target range, and prevent the interest rate from playing its role to effectively allocate savings and investment resources.
As a result of banking reforms and technological changes, the banking environment has progressively become more competitive. SSA is the developing region of the world with the largest proportion of foreign-owned banks (Claessens and van Horen, 2012). Low-scale and weak competition in many SSA markets has opened the way for SSA banks to operate across borders and compete with local banks. The emergence of these regional African banks with a clear pan-African ambition has modified the banking landscape and fostered competition and innovation. Regional African banking groups are headquartered in a variety of countries and some enjoy a significant presence in a large number of countries. They span large banking markets like Angola, Kenya, Morocco, Nigeria and South Africa but also several smaller ones. The largest one, Ecobank Transnational from Togo, has operations in more than 30 countries across SSA.
African banks started their internationalisation in SSA around the mid-1980s. South African banks, such as Absa and Standard Bank, started their regional expansion after the end of apartheid two decades ago (Beck et al., 2011). More recently, the largest banking groups in South Africa have also started to invest outside the region, setting up branches or subsidiaries in developed countries and in other emerging countries: Standard Bank has operations in Asia, the US and Europe and has made important acquisitions in Argentina and Turkey. In comparison, the presence of foreign banks from developed countries (Barclays, Standard Chartered, etc.) in SSA is often much older, having started during the colonial period.

Banking in sub-Saharan Africa: Recent Trends and Digital Financial Inclusion
© European Investment Bank, November 2016 21
To the extent that regional African banks are better able to operate in SSA markets, and in particular to cater for low-income populations, the expansion of this group of banks is bound to alleviate local credit constraints. Such banks operating across country borders are expected to achieve economies of scale by leveraging group-wide functions and transferring know-how and locally adapted banking skills. They have the potential to offer higher-quality, lower-cost banking services and to widen financial intermediation to unserved SMEs and individuals.
Most of the foreign banks have expanded throughout SSA in the form of subsidiaries. As Beck et al. (2011) point out, setting up a subsidiary involves higher costs than a branch, but it is also easier for the supervisor to have oversight as a subsidiary is organised and regulated according to the laws of the host country (Casu, Girardone and Molyneux, 2006). The often complex, not very transparent, ownership structures of African banking groups spanning several regulatory environments and legal traditions add to the supervisor’s misgivings when it comes to allowing foreign banks to set up branches in their home market (European Investment Bank, 2015).
Figure 1.4.: Commercial Banks Operating in sub-Saharan Africa.
Source: Authors’ calculations, based on BankScope data.
Three groups of foreign banks competing in the region can be distinguished: foreign affiliates of global banks from developed countries (henceforth, Global MNB6); foreign affiliates of banks from emerging countries, in which we can include the foreign affiliates of banks from
6 This group includes the following countries: Belgium, Switzerland, Germany, France, Great Britain, Greece, Luxembourg, Netherlands, Portugal, USA.
Domestic banks 50%
Foreign affiliates of African MNB
23%
Foreign affiliates of Global MNB
17%
Foreign affiliates of Emerging
MNB 10%
Foreign-owned banks 50%

22 © European Investment Bank, November 2016
South Africa (henceforth, Emerging MNB7); foreign affiliates of regional African banks (multinational banks from Africa) (henceforth, African MNB8). As explained in section 1.1, the term pan-African banks is used when grouping together banks operating across several SSA markets, based in an SSA country, including South Africa. In order to examine the ownership of banks in Africa9, a sample of 573 commercial banks operating in SSA was obtained using the BankScope database: 50% of the banks in the sample are domestic banks, and 50% are foreign-owned. Of those 50% of groups that are foreign-owned banks, 23% are foreign affiliates of African MNB, 17% are foreign affiliates of Global MNB and 10% are foreign affiliates of Emerging MNB (as illustrated in Figure 1.4).
Global, and to a lesser extent, emerging MNB, operate at a higher scale on average than African MNB in terms of equity, funding, profit and loan book. While foreign affiliates of African MNBs outnumber foreign affiliates of both global and emerging MNBs, global and emerging MNB still dominate African MNB in terms of assets. The African subsidiaries of Global MNB are the largest by assets (average total assets of EUR 2.48 billion over the period 2006-2015), followed by the domestic banks (EUR 2.4 billion on average), the foreign affiliates of the Emerging MNB (EUR 478 million on average) and the foreign affiliates of the African MNB (EUR 286 million on average). While their importance has been diminishing in recent years, global MNB still have the largest share of assets in African banking sectors. This difference in scale is translated into important differences in terms of the outstanding volume of loans and deposits and short-term funding on the balance sheet of banks. The volume of deposits and short-term funding of Global MNB and domestic banks is much higher than those of the foreign affiliates of both African MNB and Emerging MNB (on average, EUR 2 billion for Global MNB versus EUR 243 million for the foreign affiliates of African MNB and EUR 366 million for the foreign affiliates of Emerging MNB over the 2006-2015 period). In comparison, the volume of deposits and short-term funding stood at EUR 1.8 billion on average for domestic banks in sub-Saharan Africa over the period.
7 This group includes the following countries; United Arab Emirates, Bahrain, China, India, Lebanon, Malaysia, Pakistan, Taiwan, South Africa. 8 This group includes the following countries: Burkina Faso, Botswana, Cameroon, Egypt, Gabon, Gambia, Kenya, Libya, Morocco, Mauritius, Malawi, Namibia, Nigeria, Senegal, Togo, Zambia. 9 To determine the origin of a banking group, the Global Ultimate Owner indicator of BankScope database is used. This database has been updated using the same definition by relying on the banks’ websites when the information is missing in BankScope. A company is a Global Ultimate Owner (GUO) if it controls at least 50.01% of the entity and has no identified shareholders or if its shareholder’s percentages are not known. For banks which have a dispersed ownership and for which there is no ultimate owner controlling at least 50.01% of the company, the country of origin of the bank is determined by aggregating the shares of the owners by country of origin and attributing bank ownership based on the nationality of the owners with the highest total percentage of shares. To reduce the diversity of the sample, all investment banks, Islamic banks, micro-finance institutions, private banks, real estate and mortgage banks, and development banks have been excluded given that they operate in different market segments than those of commercial banks.

Banking in sub-Saharan Africa: Recent Trends and Digital Financial Inclusion
© European Investment Bank, November 2016 23
Figure 1.5.: The Scale of African Banks
A. Average Equity (EUR millions)
B. Average Deposits and Short-term Funding (EUR millions)
C. Average Profit before Tax (EUR millions)
D. Average Loan Book (EUR millions)
Source: Authors’ calculations, based on BankScope data.
The larger size of the foreign affiliates of Global MNB (than that of African and Emerging MNB) is also reflected in the higher volume of loans (Figure 1.5.D). While the volume of loans on the balance sheet of banks is EUR 1.6 billion on average for the foreign affiliates of Global MNB and EUR 1.3 billion on average for domestic banks in SSA, it is only EUR 138 million for the foreign affiliates of African MNB and EUR 217 million for the foreign affiliates of Emerging MNB. Both foreign affiliates of Global MNB and domestic banks exhibit much higher levels of equity capital (Figure 1.5.A). That said, all banks are well capitalised with a high tier 1 ratio, in particular the foreign affiliates of African MNB, with a tier 1 ratio of 26% on average over the 2006-2015 period against 23% for Emerging MNB, 19% for Global MNB and 20% for domestic banks.

24 © European Investment Bank, November 2016
Figure 1.6.: Intermediation and Efficiency of African Banks
A. Average Cost-to-Income Ratio (%)
B. Average Net Loans to Deposits and Short-term Funding (%)
C. Return on Average Equity (%)
D. Impaired Loans to Gross Loans (%)
Source: Authors’ calculations, based on BankScope data.
Remarkably, domestic banks lend more actively than African MNB and Global MNB (Figure 1.6.B). They have a loans-to-deposits ratio of 76% on average over the 2006-2015 period, while the foreign affiliates of African MNB and Global MNB have very similar loans-to-deposits ratios, closer to 60%. African MNB exhibit lower profitability, with ROAE of 7% on average over the 2006-2015 period, much lower than that of the other banks (15% for domestic banks and 18% and 17% respectively for the foreign affiliates of Global MNB and Emerging MNB). This is related to the lower quality of their portfolio (Figure 1.6.D) and lower operational efficiency (Figure 1.6.A). That said, there has been a remarkable improvement on this front: ROAE has increased from an average of 2% over the period 2006-2010 to an average of 12% in the following five years. In particular, although cost income ratios were very high in the mid- to late-2000s (circa 100%), they have decreased and are getting closer to those of the other banks (77% on average over the 2011-2015 period, against 65% for domestic banks and 64% for the foreign affiliates of Global MNB).
The foreign affiliates of Global MNB have long benefited from scale effects while African MNB are only beginning to reap such benefits. Global MNB are relying on their group for IT and risk infrastructure, which explains their higher operational efficiency. It is conjectured that the sharp improvement in the cost-income ratio of the affiliates of African MNB can be

Banking in sub-Saharan Africa: Recent Trends and Digital Financial Inclusion
© European Investment Bank, November 2016 25
related to both an increase in their net income (Figure 1.6.c) and a decrease in their operating cost. Having expanded their operations across Africa much later than the Global MNB, African MNB had to incur significant investments (software, etc.) that have only recently been amortised and they have begun to reap the benefits of increased scale. Likewise, African MNB are bringing their operating model closer in line with that of Global and Emerging MNB as they grow in scale.
The quality of the portfolio of loans seems to be lower for the foreign affiliates of African MNB and domestic banks than for the affiliates of Global MNB and Emerging MNB but the difference is narrowing over time (Figure 1.6.d). Domestic banks and African MNB are slightly more exposed to the SME segment, which exhibits higher default risk (Pelletier, 2014). Yet, foreign affiliates of Global MNB have seen the ratio of impaired loans to gross loans increase over the last decade, in line with their increasing exposure to the SME segment driven by increasing competition in the large corporates segment. Indeed, new entrants have to reach out to clients hitherto left unbanked by established players. In turn, rising competition is forcing established players to get out of their comfort zone in order to maintain their growth rate and profitability.
1.3. Analysis of Survey of Banking Groups in SSA
This section discusses the results of the second edition of the EIB’s survey of African banking groups10. A first pilot edition of the survey was launched in 2015, based on a bank lending survey designed in the context of Central, Eastern and South-Eastern Europe (EIB 2013 and 2014). The second and current edition of the survey was conducted during summer 2016. The survey has been expanded in two ways. First, the sample of banking groups that accepted our invitation to participate in the survey has grown from 10 to 15 banks, and it now includes some global banks with a wide footprint in sub-Saharan Africa. Second, the set of questions administered to banking groups has been expanded from 10 to 20 questions, covering an enhanced set of strategic issues, including demand and supply of local currency loans and technological deployment. The full questionnaire is presented in the Appendix. With 15 major banking groups operating in SSA, the ambition of the second edition of this survey is to offer an instructive monograph of African banking groups with the aim of informing private, public and official sector actors in ‘real time’.
The group of targeted banking groups for this second edition of the survey comprises major pan-African Banks (PABs), including South African groups (belonging to the so-called ’emerging banks’ category in Section 1.2), first tier sub-regional banks and global banks operating in SSA.11 No claim is made that the 2016 extended sample of African banking groups is exhaustive or even statistically representative. However, with the inclusion of
10 Outstanding IT support from Tomasz Olejnik is gratefully acknowledged. The diligent help of our Global Partners/Financial Sector Division and of colleagues based in our Dakar, Pretoria and Nairobi regional offices is also gratefully acknowledged. Remaining errors or shortcomings are the authors’ sole responsibility. 11 The survey is administered by the European Investment Bank, under a confidentiality agreement with the individual participating banks. It is addressed to senior officials of the banks involved. African banking groups are surveyed at the group level, leaving it to the group to collect information from its subsidiaries. The inclusion of a specific bank in the survey does not in any way represent a statement about business preference or compliance with EIB policies.

26 © European Investment Bank, November 2016
some key global banks and of some first-tier (sub-)regional banks that make a noteworthy contribution to banking sector deepening and competition, efforts have been made to generate a snapshot of significant banking groups operating in SSA. These banking groups (and their African subsidiaries) represented on average around a third of total assets in SSA (including South Africa) over the 2006-2015 period.
There has been turnover in the sample of banks in this survey but, upon analysis, it is not a concern and a comparison of banks’ answers between the two surveys is still meaningful. Two out of the ten African banking groups that responded to our survey in 2015 did not respond to the survey in 2016 while seven new banking groups have joined the sample. In addition, while the 2015 sample focused exclusively on domestic banking groups, the 2016 sample has been enlarged to include two global (European) banking groups with a significant footprint in SSA. In this respect, while the sample’s diversity has been enhanced, the increased heterogeneity of banking groups in the sample has to be taken into in consideration. Generally speaking, sample turnover is not driving the changes observed between 2015 and 2016. Indeed, similar changes are generated by including in the analysis only banking groups present in both editions of the survey. Where relevant, mention will be made about where results differ, at least to some extent, between domestic, emerging (South African) and global banking groups.12
The remainder of the section is organised as follows: section 1.3.B provides an overview of the current footprint of banking groups covered by the survey; section 1.3.C takes stock of banking groups’ strategic positioning in SSA in terms of countries, market segment, product and technological deployment; section 1.3.D links these strategic considerations with the market and funding conditions as perceived by banking groups, both at group and subsidiary level. 1.3.E and 1.3.F focus on market conditions, reliance on various types of funding at group and subsidiary level, and funding conditions. 1.3.G discusses the reported needs of banking groups in terms of local and foreign currency, portfolio guarantees and technical assistance needs vs. their availability. 1.3.H closes by commenting on the stage of compliance with Basel regulations that banking groups report in SSA.
12 The EIB does not generally differentiate between South African banking groups and other sub-Saharan African banking groups. In this section, this distinction will be made where it is relevant and as a further robustness check on the general observations made about sub-Saharan African banks.

Banking in sub-Saharan Africa: Recent Trends and Digital Financial Inclusion
© European Investment Bank, November 2016 27
1.3.A. A TREND TOWARDS CONSOLIDATION IN SSA
Figure 1.7.: Current and Prospective Positioning of PABs in SSA
a. Current positioning
b. Perceived market potential
c. Strategic positioning
Source: 2016 EIB survey of banking groups in SSA Note: Panel A corresponds to Question 1.a, Panel B to Question 1.b and Panel C to Question 1.c (see Appendix)
The footprint of banking groups in SSA is such that large parts of Western and of Central and Eastern Africa are covered by three or more PABs though Central Africa is somewhat less densely populated by PABs (Figure 1.7.a). There are only five countries where no banking group in our sample is active with at least a subsidiary or a branch. Kenya and Tanzania are covered by as many as seven banking groups, Côte d’Ivoire, Ghana and Rwanda by six.
Banking groups in SSA are still in the process of optimising their footprint to align it with self-reported perceived market potential. Angola, Côte d’Ivoire, Nigeria, South Africa and Zambia top the list in terms of market potential. Botswana, Mauritius and Senegal follow. Côte d’Ivoire, Kenya and Rwanda are the main countries where most (in net terms) banking groups active in SSA plan to increase their presence. Tanzania, Ghana and Senegal are next. Not surprisingly, there is a relatively high correlation (77%) between where banking groups see potential and where they plan to increase or decrease their presence (Figure 6.1.c).
1 bank2 banks3 banks4 banks5 banks6 banks

28 © European Investment Bank, November 2016
Figure 1.8.: Current and Prospective Positioning of PABs in SSA
a. Long-term strategic approach (beyond 12 months)
b. Short-term strategic approach
Source: 2016 EIB survey of banking groups in SSA. Note: Panel A refers to Question 4.a; panel B refers to Question 16 (see Appendix) Question 4: “Longer-term strategic approach (beyond 12 months): Looking at operations in sub-Saharan Africa, your group intends to….” Question 16: “In SSA, how are you/how do you plan to expand(ing) mainly?”
Nonetheless, this relatively dynamic picture hides an inflection in the aggressiveness with which banking groups are planning to expand in SSA. While in the 2015 edition of the survey, all banks in the sample planned to expand in SSA in the long term, in this edition only two thirds of banking groups plan to do so (Figure 1.8.a). The other third, mostly regional banks, plan to maintain their operations constant. In other words, no banking group in the sample is planning to reduce its footprint in SSA on the long-term horizon yet.
In contrast, in the short term, there is a growing trend towards either stalled expansion or even consolidation. Looking back to the last twelve months and forward to the coming twelve months, there is a growing proportion of banking groups reporting an intention to consolidate their footprint, 7% vs. 21% (Figure 1.8.b). The share of banks that had either no plan to expand or are consolidating was 21% during the last 12 months; looking forward to the next 12 months, this share grows to 28%. The trend towards consolidation is most notable amongst African banking groups.

Banking in sub-Saharan Africa: Recent Trends and Digital Financial Inclusion
© European Investment Bank, November 2016 29
Figure 1.9.: Group Total Medium-Term Exposure in SSA
Source: 2016 EIB survey of banking groups in SSA Note: Question 5 (see Appendix): “Group total medium-term exposure to sub-Saharan Africa: Concerning cross-border operations to SSA countries, your group has/intends to…”
Less than one banking group in three has increased its total exposure during the last twelve months and only one in four intends to do so during the coming twelve months. Individual responses indicate that some groups are even experiencing and/or contemplating reducing their medium-term exposure. The trend towards slower or stalled expansion is confirmed when breaking down the various ways in which banking groups may consider expanding in the medium term (Figure 1.9). This diminished appetite for expansion translates into exposure to subsidiaries by either debt or capital, direct cross-border lending as well as expansion financed by other financial institutions but booked on the group’s balance sheet. In contrast, in the 2015 edition of the survey, half of the banks were reporting an increase in their medium-term exposure across SSA. This comes as little surprise on the back of the deteriorating growth prospects at the macroeconomic level.

30 © European Investment Bank, November 2016
1.3.B. A GROWING MARKET FOCUS ON THE SME SEGMENT
Figure 1.10.: Long-Term (Beyond 12 Months) Strategic Focus of PABs in SSA
a. Market Segment Focus b. New Product/Service Focus
Source: 2016 EIB survey of banking groups in SSA Note: Panel A corresponds to Question 4.b, Panel B corresponds to Question 4.c (see Appendix). Question 4: “Longer-term strategic approach (beyond 12 months): Looking at operations in sub-Saharan Africa, your group intends to…”
The above-mentioned change in the short-term strategic approach is accompanied by a qualitative shift in the long-term strategic focus of banking groups in SSA, both in terms of market segment and new products and services (Figure 1.10a). With respect to market segment focus, a growing share of banking groups are reporting a long-term and significant focus on SMEs (58%, up from 40%). Notably, these are all regional banking groups. For the first time in this survey, one regional banking group reports having a long-term focus on retail clients, while their reported long-term focus was on SMEs in 2015. This increased focus on retail clients and SMEs has naturally come at the expense of a diminished focus on large local and multinational companies.
Altogether, nearly two thirds of the surveyed banking groups currently have a strategic focus on retail clients or SMEs in SSA vs. a third with a focus on corporates. This is a significant break from, in fact a near-reversal of, the survey results in 2015 and past anecdotal evidence. In the last edition of the survey, 60% of banking groups focused on corporates, 40% on SMEs, none on retail clients. Changes in long-term strategic focus in terms of product and services are consistent with the shift towards SMEs and retail clients (Figure 1.10.b). E-banking services are reported as a focus by a growing share of banking groups. Notably, this focus concerns half of the banking groups in the sample in 2016 vs. only a

Banking in sub-Saharan Africa: Recent Trends and Digital Financial Inclusion
© European Investment Bank, November 2016 31
quarter back in 2015. Mobile banking services continue to remain the focus of around one banking group in three in SSA, also in line with the increased focus on retail clients.
1.3.C. IMPORTANT TECHNOLOGICAL EFFORTS IN E-BANKING AND MOBILE BANKING
Figure 1.11.: Technological Deployment Status
Source: 2016 EIB survey of banking groups in SSA Note: Question 19 (see Appendix): “Where does your group stand …”
The state of technological deployment across banking groups in SSA is consistent with their long-term strategic focus (Figure 1.11). Internet banking technology and mobile banking technology is where the highest share of banking groups in SSA are either fully deployed or in deployment (86%). This highlights the importance given by banking groups to servicing SMEs, reaching out to retail clients and to cost-effective ways of collecting deposits. Next comes general IT infrastructure (79%). Typically, reaching out to new clients is more costly. It is sensible that banking groups invest in technology to attract depositors, to serve them efficiently, and ultimately to control costs. FinTech – in particular, the use of financial technology to facilitate banks’ lending activities – still appears to be a new technology, especially in SSA: 57% of banking groups in SSA are either only planning its deployment or do not consider it a priority. Indeed, FinTech generally presupposes a fair amount of IT infrastructure before it can be deployed and survey results probably reveal a degree of sequencing of banking technology rather than a lack of interest in FinTech per se.
32 © European Investment Bank, November 2016
In terms of need for technical assistance, IT is reported as the highest priority by 43% of banking groups. Next comes credit risk management with 36%. This coincides with the view that banks are operating in the face of rising competition and reaching out to new retail and SME customers. Lending technology is not yet a significant priority (only 7% of the banks consider it a high priority), in line with the relatively premature stage of development of FinTech illustrated by Figure 1.11.
1.3.D. MARKET CONDITIONS
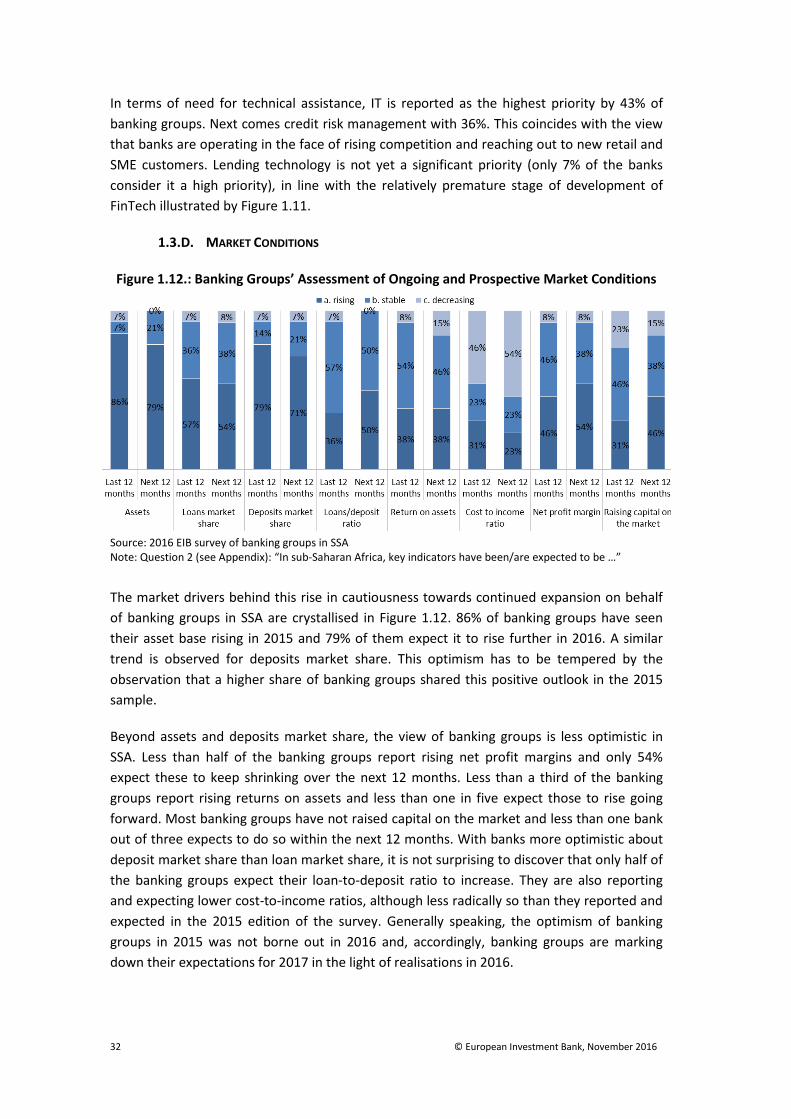
Figure 1.12.: Banking Groups’ Assessment of Ongoing and Prospective Market Conditions
Source: 2016 EIB survey of banking groups in SSA Note: Question 2 (see Appendix): “In sub-Saharan Africa, key indicators have been/are expected to be …”
The market drivers behind this rise in cautiousness towards continued expansion on behalf of banking groups in SSA are crystallised in Figure 1.12. 86% of banking groups have seen their asset base rising in 2015 and 79% of them expect it to rise further in 2016. A similar trend is observed for deposits market share. This optimism has to be tempered by the observation that a higher share of banking groups shared this positive outlook in the 2015 sample.
Beyond assets and deposits market share, the view of banking groups is less optimistic in SSA. Less than half of the banking groups report rising net profit margins and only 54% expect these to keep shrinking over the next 12 months. Less than a third of the banking groups report rising returns on assets and less than one in five expect those to rise going forward. Most banking groups have not raised capital on the market and less than one bank out of three expects to do so within the next 12 months. With banks more optimistic about deposit market share than loan market share, it is not surprising to discover that only half of the banking groups expect their loan-to-deposit ratio to increase. They are also reporting and expecting lower cost-to-income ratios, although less radically so than they reported and expected in the 2015 edition of the survey. Generally speaking, the optimism of banking groups in 2015 was not borne out in 2016 and, accordingly, banking groups are marking down their expectations for 2017 in the light of realisations in 2016.

Banking in sub-Saharan Africa: Recent Trends and Digital Financial Inclusion
© European Investment Bank, November 2016 33
1.3.E. BANKS’ RELIANCE ON DEPOSIT FUNDING IS EXPECTED TO RISE
Figure 1.13.: Group Access to Funding in SSA
Source: 2016 EIB survey of banking groups in SSA Note: Question 3 (see Appendix): “In sub-Saharan Africa, group's access to funding...”
New trends have also emerged concerning group access to funding (Figure 1.13). Less than two baking groups out of three report that total funding is rising and expect it to rise during the next twelve months. The nature of funding relied on and expected to be tapped is also evolving. Most banks are increasing their reliance on deposit funding and some forms of long-term funding. Fewer in net terms see and expect their reliance on other types of funding to increase.
34 © European Investment Bank, November 2016
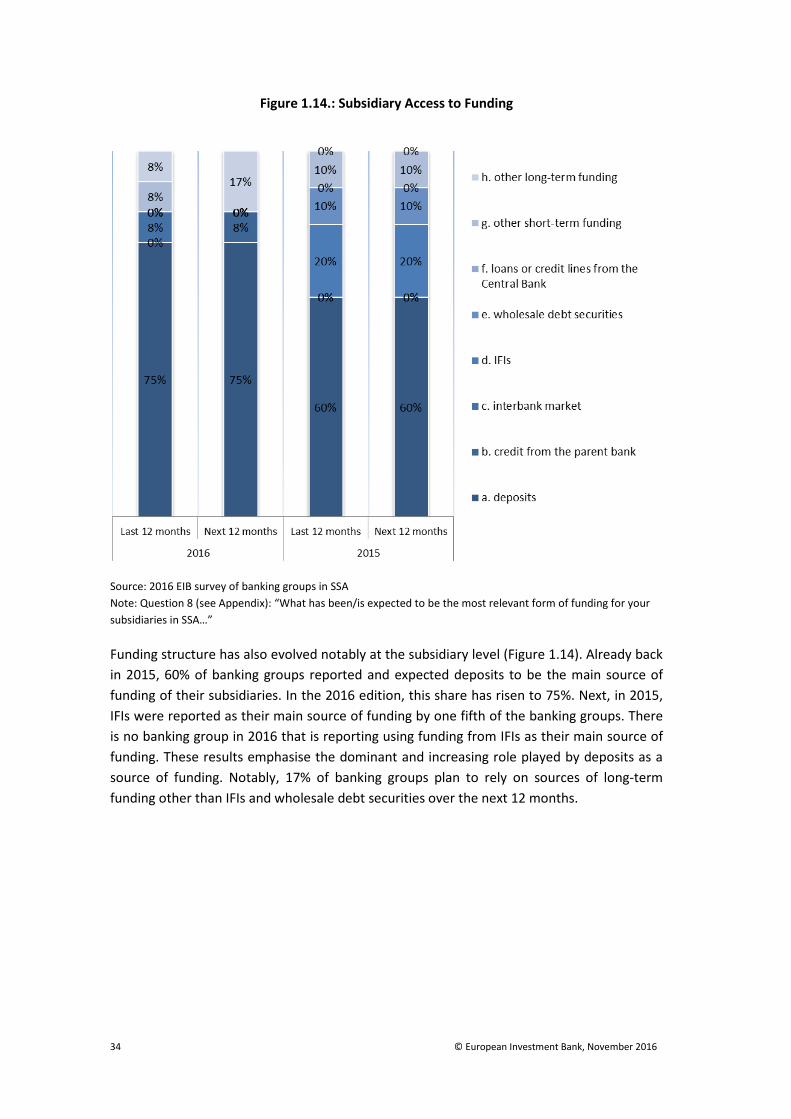
Figure 1.14.: Subsidiary Access to Funding
Source: 2016 EIB survey of banking groups in SSA Note: Question 8 (see Appendix): “What has been/is expected to be the most relevant form of funding for your subsidiaries in SSA…”
Funding structure has also evolved notably at the subsidiary level (Figure 1.14). Already back in 2015, 60% of banking groups reported and expected deposits to be the main source of funding of their subsidiaries. In the 2016 edition, this share has risen to 75%. Next, in 2015, IFIs were reported as their main source of funding by one fifth of the banking groups. There is no banking group in 2016 that is reporting using funding from IFIs as their main source of funding. These results emphasise the dominant and increasing role played by deposits as a source of funding. Notably, 17% of banking groups plan to rely on sources of long-term funding other than IFIs and wholesale debt securities over the next 12 months.

Banking in sub-Saharan Africa: Recent Trends and Digital Financial Inclusion
© European Investment Bank, November 2016 35
Figure 1.15.: Trends in Funding Conditions at Subsidiary Level (Percentage of banking reporting an improvement)
Source: 2016 EIB survey of banking groups in SSA Note: Question 9 (see Appendix): “Funding conditions in your own subsidiaries in sub-Saharan Africa have been/are expected to be…” Overall relates to overall market conditions, mixing pricing, maturity and all other relevant issues.
The increased dependence on deposit funding goes along with deteriorating funding conditions in general (overall) for more than one out of 5 banking groups, and particularly in terms of pricing (Figure 1.15). In net terms, banking groups are reporting that funding has become more onerous and only one third are expecting it to become more attractive within the next 12 months. Less than half of banking groups reports maturities on offer to have improved during the last 12 months. Looking forward to the next 12 months, banking groups are somewhat more optimistic, with 62% of them expecting a general improvement in funding conditions and half of them expecting an improvement in the tenor of the funding they can access. This relatively benign outlook should not hide the fact that banking groups are generally less optimistic with respect to funding conditions in the 2016 sample than in the 2015 sample. Restricting the sample to banking groups common to both editions of the survey does not alter these observations.

36 © European Investment Bank, November 2016
Figure 1.16.: Long-Term (Beyond 12 Months) Strategic Focus of PABs in SSA
a. Plans to raise Regulatory Funds or other Long-Term Financing during the next 12
months
b. Bond issuance and plans to issue bonds
Source: 2016 EIB survey of banking groups in SSA Note: Panel A corresponds to Question 14, Panel B corresponds to Question 15 (see Appendix). Question 14: “Do you plan to raise regulatory funds or other long-term financing…”; Question, 15: “Have you/do you plan to issue(d) bonds?”
Despite some headwinds, survey answers indicate that at least half of the banking groups plan to raise regulatory funds or other forms of long-term funding (Figure 1.16.a). In contrast, less than a third of banking groups have issued bonds over the last 12 months and less than a quarter of the banking groups plan to issue bonds during the next 12 months (Figure 1.16.b).

Banking in sub-Saharan Africa: Recent Trends and Digital Financial Inclusion
© European Investment Bank, November 2016 37
1.3.F. TRENDS AND NEEDS RELATED TO FINANCIAL INTERMEDIATION
Figure 1.17: Local Currency and Foreign Exchange Funding and Lending
a. Plans to raise fund b. Perceived demand for loans
Source: 2016 EIB survey of banking groups in SSA Note: Question 11 (see Appendix). Question 11 | In SSA, in which currency do you plan to raise funds/perceive demand for loans in…
All banking groups in SSA perceive demand for loans in local currency to be sustained (Figure 1.17). Accordingly, a large majority of them plan to match this demand with funding in local currency. Next in terms of perceived demand for loans come loans in USD, which banking groups also intend to match with USD funding (54%). Lending and funding in EUR, and even to a greater extent in other foreign currencies, are in contrast considered low priorities by banking groups13.
13 Given the presence in the sample of banking groups active in the CFA franc zones, one hypothesis is that these banking groups typically prefer to fund themselves in CFAF rather than to pass through the EUR. This is somewhat of a puzzle, though not a surprise based on anecdotal evidence, given the credible peg of the CFAF franc to the EUR, especially over the time frame implied by typical funding maturities of banks. Another hypothesis, not necessarily excluding the previous one, is that most transactions in the CFAF zones are carried out in local currency, whereas in other regions the USD tends to play a more important role alongside the local currency.

38 © European Investment Bank, November 2016
Figure 1.18.: Demand and Supply Conditions for Portfolio Guarantees in SSA
a. Degree to which Portfolio Guarantee Needs are met
b. Perceived Degree of Importance of Portfolio Guarantees for SME
lending
Source: 2016 EIB survey of banking groups in SSA Note: Panel A corresponds to Question 12, Panel B corresponds to Question 13 (see Appendix). Question 12 | With respect to the development of your SME lending business, do you consider your portfolio guarantee needs … Question 13 | With respect to the development of your SME lending business, do you consider portfolio guarantee products…
Amongst banking groups in SSA, five out of six consider portfolio guarantees to be either important or very important (Figure 1.18.b). When it comes to needs, all banking groups in SSA consider them either met or partially met (Figure 1.18.a). Banking groups consider themselves as served by the market, typically by IFIs, but not fully. At this level, portfolio guarantees seem to represent partially unfinished business in the face of strong demand.

Banking in sub-Saharan Africa: Recent Trends and Digital Financial Inclusion
© European Investment Bank, November 2016 39
1.3.G. COMPLIANCE WITH BASEL I ACHIEVED, WORKING TOWARDS BASEL II (III) COMPLIANCE
Figure 1.19.: State of Basel Standard Compliance
Source: 2016 EIB survey of banking groups in SSA Note: Question 20 (see Appendix). Question 20 | Do you consider your banking group to be…
The state of compliance of banking groups with respect to Basel standards is in flux (Figure 1.19). All banking groups consider themselves to be compliant with Basel I, although there is a perception that single exposure limits are not always respected. With respect to Basel II standards, 46% of banking groups consider themselves compliant, with the rest reporting that they are working towards compliance. The picture changes further when it comes to compliance with Basel III standards: around one banking group in five is compliant while another one in five simply does not consider Basel III a priority. Upon inspection, it is Global and Emerging (South African) banks that report Basel III compliance. It is not surprising that no regional banking groups report being compliant with Basel III. Not every feature of Basel III is considered to be equally relevant in the context of a typical SSA banking sector. However, a selective approach driven by local regulators may be warranted as elements of Basel III are highly relevant. For instance, the liquidity coverage ratio is a feature of Basel III, and liquidity has revealed itself to be potentially vital in a SSA context. Similarly, the greater degree of transparency and disclosure imposed by Basel III would probably go a long way in bringing down funding costs for regional banking groups. Indeed, the complex and often opaque structure of ownership between African banking groups and their subsidiaries (IMF, 2016c) adds to the challenge of supervision by national and regional authorities. It also intensifies the difficulties associated with the assessment of African banking groups’ compliance with international standards and of their creditworthiness. Adopting simpler ownership structures and more transparent disclosure of consolidated accounts and of risk exposures and procedures would therefore help to strengthen market trust in the soundness of African banking groups and, accordingly, would help to ease their access to capital markets and to other sources of long-term financing.

40 © European Investment Bank, November 2016
1.4. Conclusion
This study comes at a time when most SSA economies have slowed significantly. Spillovers to the financial sectors are increasingly noticeable. Financial development has been on the rise in SSA since the early 1990s, with an acceleration in the early 2000s (IMF, 2006c) However, the pace of growth has slowed recently. This is especially evident in contrast with the rapid growth in rates of credit to the private sector between 2010 and 2013 (IMF, 2016b). Moreover, despite more than a decade and a half of financial deepening in nearly all SSA countries, banking sectors in SSA still have a remarkably long way to go. Banking groups surveyed in this chapter reckon that their footprint still aligns only imperfectly with perceived market potential and with their strategic priorities. Correspondingly, two thirds of banking groups in SSA still plan to spread further across the region on a long-term basis.
However, in the shorter term, the picture is less enthusiastic and more complex. Although banks expect the situation to improve somewhat over the next twelve months, access to funding has been more challenging during the last year than banking groups had expected. Accordingly, a majority of banking groups have not increased their total exposure in SSA during the last year and do not intend to do so during the coming year. A few banking groups are actually planning to retrench to some degree.
Banking groups are adjusting their overall strategy in the face of a challenging environment characterised by tighter funding conditions, slower lending growth and rising competition for deposits and easily bankable clients. A majority of banking groups are relying significantly on deposit funding. From a financial inclusion perspective, there is some good news: a growing share of banking groups is reporting to have a long-term and significant focus on SMEs and retail clients. Consequently, IT and credit risk management are reported as top priorities in terms of the need for technical assistance while internet banking technology and mobile banking technology are where the highest share of banking groups in SSA report being either fully deployed or in deployment.
Development partners, IFIs in particular, have a key role to play in ensuring that the rising importance of financial inclusion and access to finance for SMEs are sustained throughout challenging macroeconomic circumstances. Long-term refinancing will have its usual role to play but needs don’t stop there. All banking groups in SSA perceive demand for loans in local currency to be sustained, which is encouraging since local currency loans are typically geared towards domestically-oriented SMEs that are expected to create local jobs. Most banking groups in SSA consider portfolio guarantees to be either important or very important. However, two thirds of banking groups in SSA consider their portfolio guarantee needs as only partially met. Providing portfolio guarantees and local currency refinancing are therefore, more than ever, key instruments with which IFIs can accompany banking groups’ efforts to reach out to a wider range of SMEs in SSA.
In terms of the need for technical assistance, IT is reported as the highest priority followed by credit risk management. Moreover, while all banking groups operating in SSA consider themselves as compliant with Basel I standards, less than half consider themselves compliant with Basel II, with the rest working towards compliance. As competition forces

Banking in sub-Saharan Africa: Recent Trends and Digital Financial Inclusion
© European Investment Bank, November 2016 41
most banking groups increasingly out of their comfort zone and into SME lending, the need to put in place first-class risk management processes has become unescapable. In fact, with the coming of age of FinTech in SSA, risk management could become as much of a tool to originate new credit as an ex-post control function. Consequently, risk management departments will need to be scaled to their task and properly equipped with the IT they require.
Heavy reliance on deposit financing also comes with its share of social responsibility for banking groups and their supervising authorities, obviously, but for investors as well. In markets where clients are either relatively new to banking services or have returned after one or more traumatic experiences with them, no banking sector can afford to scare off depositors. Strengthened risk management practices and enhanced corporate transparency have therefore become public goods key to the continued deepening of SSA banking sectors and broadening of access to finance. Banking groups able to win the highest level of trust from depositors, regulators and investors will gain a decisive competitive advantage. Where sector consolidation is in order, such competitive advantage is bound to decide which banking groups are able to keep growing and to make a lasting contribution to the development of SSA economies.

42 © European Investment Bank, November 2016
References
Beck, Thorsten, Samuel Maimbo, Issa Faye, and Thouraya Triki. 2011. Financing Africa: Through the crisis and beyond. Washington DC: World Bank.
Claessens and Van Horen, Foreign banks: Trends, impact and financial stability. Technical report, IMF, 2012.
Cook, L. (2011) “Were the Nigerian Banking Reforms of 2005 A Success ... And for the Poor?” NBER Working Paper No. 16890.
European Investment Bank. CESEE Banking Lending Survey. Various issues: H2-2014, H1-2014, H2-2013
European Investment Bank (2013), Banking in sub-Saharan Africa – Challenges and Opportunities, Luxembourg.
European Investment Bank (2015), Recent Trends in Banking in sub-Saharan Africa – From Financing to Investment, Luxembourg.
IMF (2016a), “Financial Development and Sustainable Growth” in Regional Economic Outlook, April 2016, Washington DC: pp. 51-78.
IMF (2016b), World Economic Outlook, October 2016, Washington DC.
IMF (2016c), Financial Development in Sub-Saharan Africa Promoting Inclusive and Sustainable Growth, Montfort Mlachila et al., Washington DC.
Pelletier, Adeline (2016) “Financial Performance of Foreign Banks in Developing Countries: Evidence from Sub-Saharan African Banking Markets”. Making Finance Work for Africa. Working Paper Series. Issue 3. July 2016.

Banking in sub-Saharan Africa: Recent Trends and Digital Financial Inclusion
© European Investment Bank, November 2016 43
Appendix 1: The Survey Questionnaire, 2016 Extended Edition
Q1 | What is your bank's positioning in each country14…
… current positioning
… perceived market potential
… strategic positioning
1 Angola 2 Benin
… 49 Zimbabwe
In Q1, for current positioning, the following answers are possible: a. active with subsidiary or branch – with significant market share (among top three market players); b. active with subsidiary or branch – with medium market share; c. active with subsidiary or branch – with niche market presence; d. active with representative office; e. inactive. The corresponding map illustrates the sum of African banking groups reporting answers a-c for a specific country. For perceived market potential, the following answers are possible: a. low; b. medium; c. high. The corresponding map illustrates the weighted sum of the answers of African banking groups for a specific country with a weight of one for answer a, two for answer b, and three for answer c. For strategic positioning, the following answers are possible: a. increase presence with new acquisition; b. increase presence with new capital provided by parent company/reinvested earnings; c. increase presence with new funding from parent company; d. increase presence via cross-border lending activity; e. remain stable; f. decrease presence via reduced cross-border lending activities; g. decrease presence with lower funding from parent company; h. decrease presence by selling assets/subsidiaries. The corresponding map illustrates the net sum of the answers of African banking groups for a specific country with a weight of +1 for answers a-d, zero for answer e, and -1 for answers f-g. Q2 | In sub-Saharan Africa, key indicators have been/are expected to be …
LAST 12 months NEXT 12 months
Assets Loans market share Deposits market share Loans/deposits ratio Return on assets Cost-to-income ratio Net profit margin Raising capital on the market
14 The full list of countries covered by the survey is: Angola, Benin, Botswana, Burkina Faso, Burundi, Cameroon, Cape Verde, Central African Republic, Chad, Comoros, Côte d'Ivoire, Democratic Republic of the Congo, Djibouti, Equatorial Guinea, Eritrea, Ethiopia, Gabon, Gambia, Ghana, Guinea, Guinea-Bissau, Kenya, Lesotho, Liberia, Madagascar, Malawi, Mali, Mauritania, Mauritius, Mozambique, Namibia, Niger, Nigeria, Republic of the Congo, Rwanda, São Tomé and Príncipe, Senegal, Seychelles, Sierra Leone, Somalia, South Africa, South Sudan, Sudan, Swaziland, Tanzania, Togo, Uganda, Zambia, Zimbabwe.

44 © European Investment Bank, November 2016
Q3 | In sub-Saharan Africa, your group's access to funding...
…How has it changed over the LAST twelve
…How do you expect it to change
Total Deposits Interbank market IFIs Wholesale debt securities Loans or credit lines
Short-term funding Long-term funding
For each variable in Q2 and Q3, the following answers are possible: a. rising; b. stable; c. decreasing. The corresponding figures illustrate the net sum of the answers of all African banking groups with a weight of +1 for answer a, 0 for answer b, and -1 for answer c. Q4 | Longer-term strategic approach (beyond 12 months): Looking at operations in sub-Saharan Africa, your group intends to…
Overall Market segment focus New product/services focus
For Q4, overall, the following answers are possible: a. expand operations overall; b. maintain the same level of operations overall; c. scale down operations overall. The corresponding figure illustrates the net sum of the answers of all African banking groups with a weight of +1 for answer a, 0 for answer b, and -1 for answer c. The following answers are possible with respect to market segment focus: a. by focusing on large multinationals; b. by focusing on large local companies; c. by focusing on SMEs; d. by focusing on retail clients. The corresponding figure illustrates the breakdown of the percentages of answers following in each category. As for new product and services focus, the following answers are possible: a. by rolling out mobile banking; b. by rolling out mortgage financing; c. by rolling out consumer credit/credit cards; d. by rolling out leasing products; e. by rolling out e-banking services; f. none of the above/other. The corresponding figure illustrates the breakdown of the percentages of answers following in each category.

Banking in sub-Saharan Africa: Recent Trends and Digital Financial Inclusion
© European Investment Bank, November 2016 45
Q5 | Group total medium-term exposure to sub-Saharan Africa: Concerning cross-border operations to SSA countries, your group has/intends to…
LAST 12 months
NEXT 12 months
Total exposure
Exposure to subsidiaries – intra-group debt funding
Exposure to subsidiaries – capital
Direct cross-border lending booked on the balance sheet of the parent company
Funding to banks and other financial institutions (e.g. MFIs) not part of the group, booked on the BS of the parent
For Q5, the following answers are possible: a. expand(ed) exposure; b. maintain(ed) the same level of exposure; c. reduce(d) exposure. The corresponding figure illustrates the net sum of the answers of all African banking groups with a weight of +1 for answer a, 0 for answer b, and -1 for answer c. Q6 | Profitability of operations in SSA region: the contribution of activities in SSA in total ROA of the Group has/is expected to…
LAST 12 months NEXT 12 months
For Q6, the following answers are possible: a. increase(d); b. be(en) stable; c. decrease(d). The corresponding figure illustrates the net sum of the answers of all African banking groups with a weight of +1 for answer a, 0 for answer b, and -1 for answer c. Q7 | Compared to the overall group and corrected for the cost of risk, profitability of operations in SSA region: ROA of your SSA operations has been/is expected to be …
LAST 12 months NEXT 12 months
For Q7, the following answers were possible: a. lower; b. equal; c. higher. The corresponding figure illustrates the net sum of the answers of all African banking groups with a weight of +1 for answer a, 0 for answer b, and -1 for answer c. Q8 | What has been/is expected to be the most relevant form of funding for your subsidiaries in SSA…
LAST 12 months NEXT 12 months
For Q8, the following answers are possible: a. deposits; b. credit from the parent bank; c. interbank market; d. IFIs; e. wholesale debt securities; f. loans or credit lines from the Central Bank; g. other short-term funding; h. other long-term funding. The corresponding figure illustrates the breakdown of the percentages of answers following in each category.

46 © European Investment Bank, November 2016
Q9 | Funding conditions in your own subsidiaries in sub-Saharan Africa have been/are expected to be…
LAST 12 months NEXT 12 months
Overall Pricing Maturity
For Q9, the following answers were possible: a. improving; b. deteriorating; c. stable. The corresponding figure illustrates the net sum of the answers of all African banking groups with a weight of +1 for answer a, 0 for answer b, and -1 for answer c. Q10 | What share of your operations in SSA lie outside your base country…
...assets ...revenues
For Q10, the following answers are possible: a. below 10%; b. 10-25%; c. 25-50%; d. 50-75%; e. above 75%. The corresponding figure illustrates the breakdown of the percentages of answers following in each category. Q11 | In SSA, in which currency do you...
… plan to raise funds … perceive demand for
Local currency USD EUR Other foreign currency (specify currencies below)
Specify different currencies if applicable:
For Q11, the following answers are possible: a. certainly; b. probably; c. perhaps; d. probably not. The corresponding figure illustrates the weighted sum of the answers of all African banking groups with a weight of +1 for answer a, +0.6 for answer b, +0.3 for answer c and 0 for answer d. Q12 | With respect to the development of your SME lending business, do you consider your portfolio guarantee needs …
... to be
For Q12, the following answers are possible: a. met; b. partially met; c. largely met; d. irrelevant. The corresponding figure illustrates the weighted sum of the answers of all African banking groups with a weight of +1 for answer a, +0.6 for answer b, +0.3 for answer c and 0 for answer d.

Banking in sub-Saharan Africa: Recent Trends and Digital Financial Inclusion
© European Investment Bank, November 2016 47
Q13 | With respect to the development of your SME lending business, do you consider portfolio guarantee products …
... as
For Q13, the following answers are possible: a. very important; b. important; c. somewhat important; d. irrelevant. The corresponding figure illustrates the weighted sum of the answers of all African banking groups with a weight of +1 for answer a, +0.6 for answer b, +0.3 for answer c and 0 for answer d. Q14 | Do you plan to raise regulatory funds or other long-term financing …
... during next 12 months?
For Q14, the following answers are possible: a. certainly; b. probably; c. perhaps; d. probably not. The corresponding figure illustrates the weighted sum of the answers of all African banking groups with a weight of +1 for answer a, +0.6 for answer b, +0.3 for answer c and 0 for answer d. Q15 | Have you/do you plan to issue(d) bonds?
LAST 12 months NEXT 12 months
For Q15, the following answers are possible: a. yes; b. no. The corresponding figure illustrates the net sum of the answers of all African banking groups with a weight of +1 for answer a, and -1 for answer b. Q16 | In SSA, how are you/how do you plan to expand(ing) mainly?
LAST 12 months NEXT 12 months
For Q16, the following answers are possible: a. organically; b. acquisitions; c. greenfield/brownfield investment; d. no plan to expand; e. consolidating. The corresponding figure illustrates the breakdown of the percentages of answers following in each category. Q17 | If you have/plan to expand via greenfield investment, is it because …
... you think it’s
Specify other reason if applicable:
For Q17, the following answers are possible: a. cheaper; b. faster; c. other reason (please specify). The corresponding figure illustrates the breakdown of the percentages of answers following in each category.

48 © European Investment Bank, November 2016
Q18 | What are your main medium-term technical assistance (TA) needs …
... seen from HQ level?
Specify other needs if applicable:
For Q18, the following answers are possible: a. marketing; b. IT; c. operational risk management; d. credit risk management; e. lending technology; f. other (please specify). The corresponding figure illustrates the breakdown of the percentages of answers following in each category. Q19 | Where does your group stand …
… with respect to:
a. investing in general IT infrastructure? b. deploying internet banking technology? c. deploying mobile banking technology? d. deploying FinTech to streamline credit decisions?
For Q19, the following answers are possible: a. fully deployed; b. in deployment; c. planning development; d. not an immediate priority. The corresponding figure illustrates the breakdown of the percentages of answers following in each category. Q20 | Do you consider your banking group …
… to be:
Basel I Basel II Basel III
For Q20, the following answers are possible: a. compliant; b. working towards compliant; c. not an immediate priority. The corresponding figure illustrates the breakdown of the percentages of answers following in each category.

Banking in sub-Saharan Africa: Recent Trends and Digital Financial Inclusion
© European Investment Bank, November 2016 49
2. Banking in East Africa: The Experience of Digital Financial Services
JARED OSORO1 AND HABIL OLAKA2
Executive summary
• Just as Kenya is the largest economy in East Africa, its banking industry is a leader in the region insofar as providing credit towards supporting the economy’s growth aspirations is concerned. One area where such leadership has been evident is in digital financial services.
• The leadership in digital financial services has attracted global attention with the region being recognised as a trailblazer in mobile money. The novelty of mobile money has largely been characterised as a technological innovation although technology is more of an enabler that supports the underlying innovative business model.
• At the centre of the rapidly growing mobile money business is a regulatory environment that is equally innovative and dynamic. The role of the regulator was therefore critical in the success of mobile payment/money in Kenya.
• A critical contributor to the success of mobile payment and mobile money has been the fact that the key promoter is a dominant market player. In markets where such dominance is not prevalent, the success of replicability has been limited.
• Kenya’s achievement in mobile money has provided impetus for expectations of replication of the model across East Africa and even wider Africa. The success of such replication has been modest.
• Even the expectation that mobile payments will ride on the rail of regional expansion of banks in East Africa is far from being realised given that unique local regulatory challenges in the respective economies are a binding constraint.
1 Director, Kenya Bankers Association Centre for Research on Financial Markets and Policy© 2 Chief Executive Officer, Kenya Bankers Association

50 © European Investment Bank, November 2016
2.1. Introduction
The five East African countries constituting the East African Community (EAC3) – Burundi, Kenya, Rwanda, Tanzania and Uganda – share the common characteristic of being developing economies. Nonetheless, their respective economic status as represented by the evolution of nominal gross domestic product (GDP), real GDP growth, per capita income, gross savings and investment depicts a sense of diversity.
As Table 2.1 shows, Burundi, which is the smallest of the five EAC economies, has experienced an erratic and feeble performance in terms of real output growth. The Rwandan economy, ranked fourth in terms of nominal GDP, has been consistent in achieving positive real growth output performance. Tanzania, the second largest economy in the EAC block, has similarly sustained strong real output performance. Real GDP growth for Kenya – the largest economy in the EAC region – and Uganda – the third largest – has been fairly strong, although its trend has been erratic.
3 South Sudan was admitted as the sixth member of the EAC in April 2016 so is not part of this analysis.

Banking in sub-Saharan Africa: Recent Trends and Digital Financial Inclusion
© European Investment Bank, November 2016 51
Table 2.1.: Selected Economic Indicators of the East African Economy
2009 2010 2011 2012 2013 2014 2015 Burundi Real GDP growth (%) 3.8 5.1 4.0 4.4 4.5 4.7 -4.1 Nominal GDP
(USD billions) 1.8 2.0 2.2 2.3 2.5 2.9 2.9
Per capita GDP (USD) 217 243 261 266 283 315 306 Total investment
(% of GDP) 14.2 15.1 14.7 14.3 14.9 15.5 10.6
Gross national savings (% of GDP)
16.9 3.7 1.0 -3.7 -4.2 -2.9 -4.4
Kenya Real GDP growth (%) 3.3 8.4 6.1 4.6 5.7 5.3 5.6 Nominal GDP
(USD billions) 37.0 40.0 42.0 50.4 54.9 60.9 61.4
Per capita GDP (USD) 982 1 039 1 062 1 239 1 314 1 417 1 388 Total investment
(% of GDP) 19.3 20.7 21.7 21.5 20.1 21.4 22.5
Gross national savings (% of GDP)
14.9 14.8 12.5 13.1 11.2 11.0 14.4
Rwanda Real GDP growth (%) 6.3 7.3 7.8 8.8 4.7 7.0 6.9 Nominal GDP
(USD billions) 5.3 5.7 6.4 7.2 7.5 7.9 8.3
Per capita GDP (USD) 547 570 628 688 700 717 732 Total investment
(% of GDP) 23.6 23.2 23.5 25.9 26.5 26.1 25.0
Gross national savings (% of GDP)
16.4 17.8 16.4 14.7 19.1 14.6 11.2
Tanzania Real GDP growth (%) 5.4 6.4 7.9 5.1 7.3 7.0 7.0 Nominal GDP
(USD billions) 28.6 31.1 33.6 39.1 44.4 48.1 44.9
Per capita GDP (USD) 684 726 765 870 969 1029 942 Total investment
(% of GDP) 25.1 27.3 33.2 28.5 30.3 31.0 31.3
Gross national savings (% of GDP)
18.3 21.2 21.6 19.3 14.9 21.7 22.6
Uganda Real GDP growth (%) 8.1 7.7 6.8 2.6 4.0 4.9 5.0 Nominal GDP
(USD billions) 18.6 20.2 21.1 24.6 25.6 27.5 24.7
Per capita GDP (USD) 565 594 601 678 681 711 620 Total investment
(% of GDP) 27.6 26.0 29.5 29.5 27.8 26.4 26.5
Gross national savings (% of GDP)
21.2 18.0 19.5 22.7 20.8 16.8 17.7
Source: IMF World Economic Outlook Database, April 2016
The development aspirations of the EAC region are entwined with the evolution of the financial sector in the respective economies, particularly the banking industry which is the dominant segment of the financial sector. The extent of reliance on external resources to

52 © European Investment Bank, November 2016
finance domestic investments in each of the five economies is reflected in the difference between the levels of gross domestic savings and total investments. Such reliance largely reflects the relative depth of each economy’s banking industry, as illustrated by the level of both total credit and credit to the private sector as a proportion of total income (Table 2.2). Domestic credit provided by the financial sector includes all credit to various sectors on a gross basis, with the exception of credit to the central government, which is net. The Kenyan financial system is ahead of the others in the EAC as evidenced not only by the size of its banking industry but also by the corresponding market players’ foray into and leadership in digital financial services within the sub-region.
Table 2.2.: Domestic Credit (% of GDP)
2010 2011 2012 2013 2014 2015 Domestic credit provided by financial sector (% of GDP)
Burundi 25.1 26.4 24.8 22.6 23.4 28.5 Kenya 41.1 41.7 42.2 42.9 44.3 45.2 Rwanda* - - - - - - Tanzania 15.5 17.2 18.0 18.2 20.2 22.8 Uganda 14.6 16.1 13.8 14.2 16.8 17.9 Domestic credit to private sector (% of GDP) Burundi 16.9 18.9 17.8 16.3 15.4 14.3 Kenya 27.2 30.6 29.5 31.7 34.2 34.9 Rwanda* - - - - - - Tanzania 11.9 12.6 13.0 12.9 13.8 15.4 Uganda 13.3 15.4 13.7 13.5 14.4 15.2
Domestic savings gap Burundi 11.4 13.7 18.0 19.1 18.4 15.1 Kenya 5.9 9.1 8.4 8.9 10.4 8.2 Rwanda 5.4 7.2 11.3 7.4 11.5 13.8 Tanzania 6.0 11.6 9.2 15.4 9.3 8.7 Uganda 8.0 10.0 6.8 7.1 9.5 8.9
Source: World Bank, World Development Indicators; IMF World Economic Outlook database; *Figures for Rwanda are not available.
Regulatory regime harmonisation within the EAC is driven by the Monetary Affairs Committee (MAC) of the EAC – a committee of the governors of each respective EAC partner’s central bank tasked with ensuring full integration of the region’s financial system. The MAC has developed a convergence criterion concerning the harmonisation of central banks’ legal and prudential supervisory rules and practices. Correspondingly, market outcomes observed in the recent past reveal some notable convergence among the banking industry players in East Africa (Table 2.3).

Banking in sub-Saharan Africa: Recent Trends and Digital Financial Inclusion
© European Investment Bank, November 2016 53
Table 2.3.: Selected Market Characteristics
2010 2011 2012 2013 2014 2015 Bank capital to assets ratio (%)
Burundi 11.7 13.2 14.3 14.5 13.4 13.5 Kenya 13.6 13.3 13.6 14.3 14.2 14.4 Rwanda 11.4 14.5 23.9 20.0 13.7 14.1 Tanzania 10.3 10.0 10.1 10.6 10.3 10.8 Uganda 11.3 12.8 12.7 12.4 13.0 13.0
Bank non-performing loans to total gross loans (%) Burundi 9.4 7.4 8.2 9.9 10.9 17.9 Kenya 6.3 4.4 4.6 5.0 5.5 6.0 Rwanda 11.3 8.2 6.0 7.0 5.2 5.8 Tanzania 7.8 5.4 6.4 5.1 6.6 6.3 Uganda 1.9 2.0 4.1 5.8 4.0 5.1
Risk premium on lending (lending rate minus treasury bill rate, %) Burundi* - - - - - - Kenya 10.8 6.3 7.1 8.4 7.6 5.2 Rwanda 9.5 10.0 6.7 7.4 12.7 13.3 Tanzania 10.7 8.6 2.8 3.5 4.2 7.3 Uganda 15.2 7.2 10.6 13.3 11.3 6.8
Source: World Bank, World Development Indicators; Figures for Burundi are not available.
The market evolution in recent years has seen technological innovation move to the core of the banking industry’s market dynamics. This has been evident in the development of digital platforms, especially mobile money, for delivery of banking services. In the next section, we examine the market and regulatory developments underlying the thriving mobile payment space in Kenya with a view to assessing its replicability across the East African region.
2.2. Mobile Money
Two of the East African Community economies of Kenya and Tanzania, particularly the former, have attracted global attention as trailblazers in mobile money. The celebrated success story is that of Safaricom, a Kenyan telecommunications company associated with the Vodafone Group, which in 2007 launched a phone-based payment scheme called M-Pesa. In less than a decade, close to three quarters of Kenya’s adult population, which is estimated at 22 million, have opted to use M-Pesa for money transfer.
Meanwhile, however, the success of mobile money has evolved into partnerships between mobile network operators (MNOs) and financial institutions – especially banks – that have enabled the mobilisation of savings and provision of loans, both facilitated by mobile technology. Indeed, whereas mobile money has largely been characterised as a technological innovation, it has actually been more of an enabler supporting an innovative banking model. This innovative business model arose in a context of two economies where
54 © European Investment Bank, November 2016
only one in four people has a bank account while eight in ten have access to a mobile phone4.
The fact that mobile money has been widely acclaimed around the world owes its success to its noticeable contribution to financial inclusion. A question that is therefore of crucial interest to us is: why has the success of mobile money in Kenya not been easily replicated to the same extent across East Africa? The key to answering this question is that the strides allowed by mobile money in the area of financial inclusion in Kenya should partly be attributed to the synergetic partnerships between banks and MNOs. This section illustrates the rich institutional arrangement underlying the mobile money business model.
2.2.A. THE STRUCTURE OF THE PIONEERING MOBILE MONEY MODEL
The mobile payment model as pioneered by M-Pesa entails a four-level institutional arrangement – namely the customer, the MNO agent, a trustee and a commercial bank. To understand how the model works, take the example of a customer seeking to undertake a basic payment transaction. The customer makes a cash deposit at an MNO agent in return for an e-float, a virtual deposit in a mobile wallet, upon showing appropriate identification documents. Within one minute the customer receives a confirmation text message that the e-float has been deposited. The customer can either exchange the e-float for cash at a future date or transfer the e-float to another phone. The e-float can then be encashed with an MNO agent.
At the core of this model is a mechanism of ensuring that customers’ funds are safeguarded. Accordingly, the e-float is backed in its entirety by deposits held at commercial banks and the interest earned is not for the benefit of a given MNO thereby obviating the need for MNOs to be regulated as commercial banks in Kenya. The funds held in trust are not fungible with those of the service providers and are therefore safe from claim in the event of an MNO becoming insolvent.
The technological novelty, which is only part of the innovative model, is simply the provision of access to handsets to households as well as the development of a transaction platform. The other important part of the model entails the design of a liquidity management tool to service the web of agents and their customers. The key is that the actual liquidity is provided by the banks’ cash management systems. Figure 2.1 provides a simplified illustration of the business model.
4 The Economist, 9 May 2015.

Banking in sub-Saharan Africa: Recent Trends and Digital Financial Inclusion
© European Investment Bank, November 2016 55
Figure 2.1.: Mobile Payment Business Model
Source: Authors
The success of the outlined basic business model in Kenya has been phenomenal. Since the introduction of M-Pesa in 2007, the number of agents grew from about 400 to 132 000 by June 2015; the number of customers similarly increased from about 21 000 to 26 million for the corresponding period (Figure 2.2). The increase in the number of agents and customers inevitably saw a rise in the number and value of transactions from a low of 22 000 and KES 64 million respectively in May 2007 to 90 000 000 and KES 228 billion respectively by June 2015 (Figure 2.2).
The success of mobile finance arose from its pioneering payment component but what is critically important is that it generated a platform that allowed intermediation – savings mobilisation and credit provision – to thrive. Safaricom had a dominant market position, with a market share estimated at over 70%. This is what enabled the development of the ecosystem illustrated in Figure 2.1. Indeed, it has been challenging to replicate the Kenyan experience in countries that are not characterised by the level of dominance that Safaricom enjoyed in the case of Kenya.
•Customer •Agent
•Trustee •Bank
Provides custody for pooled trust
accounts
Assures safety of customer funds
Seeks secure and competitive payment system,
Acts for the MNOs to enable
payment

56 © European Investment Bank, November 2016
Figure 2.2.: Agents and Customer Evolution
Source: National Payment Statistics, Central Bank of Kenya
The exponential growth in the volume of mobile payments gave the necessary scale for the birth of innovative solutions on the corresponding platform of institutional collaboration. Among the first innovations was the introduction of bill payment and bulk payment services, which enabled banks to use the mobile platform to facilitate loan disbursement and repayment. This was followed by the launch of card-less Automated Teller Machine (ATM) withdrawals. This innovation allows M-Pesa customers to access cash from a network of automated mobile money agents, called PesaPoint. There have been myriad other innovative mobile payment solutions. These range from enabling rural households to use M-Pesa to pay for clean drinking water5 to a collaboration between a farm input producer, Safaricom and an insurance company to enable farmers to pay insurance premiums by M-Pesa.
However it is the collaboration between MNOs and banks that has attracted most attention. This collaboration initially led to money transfer services and subsequently to savings mobilisation and even to credit provision. It began in 2010 with a collaborative arrangement between Equity Bank – one of Kenya’s top banks – and Safaricom. They launched a product named M-Kesho that allowed the bank’s customers to pair their bank accounts with their M-Pesa accounts and to transfer money between these accounts at their convenience.
5 See Mwangi, P.G, (2011) ”M-PESA in partnership with Grundfos for rural water provision”, thinkm-pesa.com, June. [http://www.thinkm-pesa.com/]
0
5
10
15
20
25
30
0
20,000
40,000
60,000
80,000
100,000
120,000
140,000
03/2
007
06/2
007
09/2
007
12/2
007
03/2
008
06/2
008
09/2
008
12/2
008
03/2
009
06/2
009
09/2
009
12/2
009
03/2
010
06/2
010
09/2
010
12/2
010
03/2
011
06/2
011
09/2
011
12/2
011
03/2
012
06/2
012
09/2
012
12/2
012
03/2
013
06/2
013
09/2
013
12/2
013
03/2
014
06/2
014
09/2
014
12/2
014
03/2
015
06/2
015
Agents Customer(Millions)

Banking in sub-Saharan Africa: Recent Trends and Digital Financial Inclusion
© European Investment Bank, November 2016 57
By 2012 however, this collaboration ran into challenges occasioned by disputes relating to profit-sharing among the partners, causing it to eventually stall6. Fortunately, M-Kesho gave way to an ever better concept that emerged from collaboration between Commercial Bank of Africa (CBA) – another commercial bank in Kenya – and Safaricom. The outcome, known as M-Shwari, is considered as an improvement upon M-Kesho in three respects.
• First, while for M-Kesho customers were required to fill out the account opening forms at the premises of Equity Bank, whether in branches or with agents, with M-Shwari customers are able to open an account electronically and remotely.
• Secondly, the activation of the account opened is seamless. The Know-Your-Customer (KYC) as undertaken by the MNO is used by the bank, with the latter only verifying its accuracy. As a result, an M-Shwari account can be opened virtually in real time. In contrast, with M-Kesho, each account requires a new KYC, meaning that it takes two days to open an account.
• Lastly, it takes only 30 days as from the M-Shwari customer’s initial deposit for credit eligibility to be determined based on a score derived from mobile usage whereas it takes six months for a M-Kesho customer to be eligible for credit.
According to CBA data, deposits amounting to KES 1.35 billion have been mobilised since the launch of M-Shwari while the bank has disbursed loans worth KES 24 billion. The success of M-Shwari has inspired other banks to partner with Safaricom to issue similar products. For instance, Kenya Commercial Bank – the largest bank in Kenya by assets – has launched a product called M-Benki whose characteristics are closely aligned to those of M-Shwari7. Even in instances where banks are neither able to mobilise deposits nor provide credit on a mobile platform, nearly all of them have interfaced their systems with those of MNOs to enable their respective customers to access their accounts for the purpose of making withdrawals and deposits.
2.3. The Regulatory Regime
In Kenya, regulation of MNOs is the responsibility of the Communications Authority of Kenya (CAK). The framework for regulating the communications sector in Kenya is provided for by the Kenya Communications Act (No. 2 of 1998) as amended by the Kenya Communications (Amendment) Act, 2009. It is clear that payments, which are a financial service, are not within the regulatory purview of the CAK. It is on that basis that Safaricom, Vodafone and CBA applied to the Central Bank of Kenya (CBK) to authorise M-Pesa.
The delicate balance for the CBK was to decide on the two extremes of either declining the application on account of a non-banking institution having no legal basis to operate payment services or adopt a “learn-by-doing” regulatory attitude as a basis for allowing the regulatory environment mature with the business. The Central Bank of Kenya Act provided a window for the CBK’s leaning towards the latter choice, specifically the provision that the central bank has the prerogative to “formulate and implement such policies as best promote the
6 See Ngigi, G. (2012), “M-Kesho growth stalls over hitch on profit sharing”, Business Daily, 25 March. [http://www.businessdailyafrica.com/M-Kesho-growth-stalls-over-hitch-on-profit-sharing--/-/539552/1373474/-/8e1xlj/-/index.html ] 7 See https://ke.kcbbankgroup.com/about/media/news/detail/kcb-launches-m-benki/

58 © European Investment Bank, November 2016
establishment, regulation and supervision of an efficient and effective clearing and settlement system”.
The evaluation of the Safaricom-CBA-Vodafone application was to subject the proposal to a test of the compatibility of the product design with existing laws, especially the Banking Act. In essence the CBK had to be satisfied that Safaricom does not engage in any form of financial intermediation, which under the Banking Act is restricted to banks. Further, the CBK had to obtain the assurance of the M-Pesa promoters that there were adequate measures to ensure the system was secure and adequately incorporated anti-money laundering/countering the financing of terrorism measures.
There was a compelling case for a legal regime to support the advances already made in mobile money. This was realised in the National Payment Systems (NPS) Act (2011) and subsequently the National Treasury NPS regulations in 2014. The NPS regulations have enabled the streamlining of governance and business models whereby mobile money business has to be undertaken by a legal entity separate from the MNO. It also allowed non-exclusivity in mobile money distribution whereby an agent can work with multiple service providers, it promoted interoperability between providers and it strengthened customer protection measures.
The innovative and dynamic regulatory approach to mobile payments in Kenya necessitated that all parties be comfortable with the system’s safety and reliability. The CBK’s letter of non-objection that allowed M-Pesa to commence in 2007 was not definitive insofar as providing that comfort was concerned. The National Treasury – then Ministry of Finance – undertook an audit in 2008 with a view to allaying the concern that M-Pesa featured a series of inherent risks which could cause heavy losses for users. The audit findings released in January 2009 provided the necessary comfort that the product was in no way a potential source of losses to users on account of inherent risks.
2.4. Replication Across Borders Versus Promoting Cross-Border Flows
The success of M-Pesa in Kenya has not just provided impetus for expectations of replication across East Africa or even wider Africa, but also highlighted the need for establishing whether mobile money provides a viable proposition for money transfer amongst households dealing in local currency or small businesses doing cross-border transactions.
Replicating across borders may not require any form of integration if the regulatory environment is adequate. However, cross-border flows necessitate some form of policy coordination. In East Africa, expectations are naturally that the EAC integration framework is a sound platform for cross-border mobile payments. The EAC integration roadmap provides a basis for expectations on cross-border payments. As table 2.4 shows, intra-EAC trade is increasing, albeit in favour of Kenya.

Banking in sub-Saharan Africa: Recent Trends and Digital Financial Inclusion
© European Investment Bank, November 2016 59
Table 2.4.: Kenya's Trade with the Rest of the East African Community (USD millions)
2005 2006 2007 2008 2009 2010 2011 Uganda Export 564.9 385.7 498.5 611.2 596.6 657.6 855.2
Import 18.5 13.9 88.8 75.5 57.1 116.4 116.4 Balance 546.4 371.8 409.7 535.8 539.5 541.2 738.8
Tanzania Export 264.1 253.6 331.5 422.4 388.2 419.2 470.0 Import 41.0 62.6 99.2 105.0 100.8 133.1 176.4 Balance 223.1 191.0 232.3 317.4 287.4 286.0 293.6
Rwanda Export 96.3 66.1 86.2 129.4 123.0 133.0 152.6 Import 1.5 2.9 1.3 0.4 3.1 5.4 4.8 Balance 94.8 63.2 84.9 129.1 119.9 127.5 147.9
Burundi Export 34.0 35.4 29.4 30.3 59.3 68.9 66.5 Import 0.4 1.2 2.2 1.5 1.2 1.8 5.3 Balance 33.6 34.2 27.2 28.8 58.1 67.1 61.2
Total EAC Export 974.3 735.8 952.2 1 213.4 1 167.2 1 278.7 1 544.4 Import 61.5 84.1 191.6 182.0 162.2 256.8 302.9 Balance 912.8 651.6 760.6 1 031.4 1 005.1 1 021.8 1 241.5
Source: EAC Secretariat
The direction of trade illustrated by Table 2.4 is accompanied by cross-border financial flows. Typically, trade flows captured in formal statistics are often associated with payments through the banking system. On that basis, the prioritisation of payments underpinned by trade or indeed intra-regional investments is typified by the promotion of the so-called East African Payment System (EAPS), which runs on the Real-Time Gross Settlement (RTGS) system of the region’s central banks. Mobile money is inadvertently peripheral.
Mobile payments are disenfranchised from formal trade settlement given the scope and size of payment. Therefore, the trends, volumes and values of informal cross-border trade (ICBT) are difficult to establish. Indeed, ICBT has generally been regarded as illegal commercialisation of cross-border activities8. However, they have the potential to be the ideal mode of payment for small-size and informal cross-border trade. Further, ICBT has substantial food security and income creation benefits especially for low-income but entrepreneurial households9. Mobile payments can be considered a natural conduit given that the value of goods traded is compatible with the M-Pesa cap of KES 70 000 (equivalent to USD 700).
8 Afrika, J-G, K. and Ajumbo, G. (2012). 9 ICBT in East Africa constitutes the trade of unprocessed foodstuffs, non-food stuffs and livestock, low-quality manufactured and processed goods, low-quality goods from Asia, contraband, counterfeits and substandard goods; and the value of such goods ranges from USD 50 – USD 1 000 per annum (Afrika and Ajumbo, ibid.),

60 © European Investment Bank, November 2016
Table 2.5.: Value of ICBT between Uganda and its Neighbours (USD millions)
Exports Imports 2006 2009 2010 2006 2009 2010 Kenya 96.88 102.76 94.06 63.88 43.25 37.53 Rwanda 25.04 34.93 32.69 0.7 1.98 1.47 Tanzania 21.52 60.93 53.69 4.26 5.64 5.07
Source: Afrika and Ajumbo (2012)
Further, the anticipation that regional mobile payments will thrive because of the successes registered at the national level is bolstered by, but not necessarily predicated on, two assumptions that need validation. One is the assumption that Kenya’s evidently successful model, from both a market and regulatory perspective, can serve as a template for the other economies in the region. The other is the assumption that the business case of regional mobile payments is at least as strong as the local business case to begin with.
Kenya’s bold “learn-by-doing” process of introducing mobile money in response to the regulatory dilemma earlier noted seems to have been the approach taken in much of East Africa, especially by Tanzania and Rwanda, and to a limited extent Uganda. If the template is proven to be transposable, then the outcome ought to reflect that. However, as Figure 2.3 shows, Kenya still remains way ahead of Tanzania and Uganda – two economies whose mobile money trends are consistently moving in the right direction while Rwanda and Burundi’s mobile payments are still nascent, with their respective ratios of mobile money to output being less than 4.1%. Further, in a cross-border context, risks are potentially higher while benefits are less likely to be immediate.

Banking in sub-Saharan Africa: Recent Trends and Digital Financial Inclusion
© European Investment Bank, November 2016 61
Figure 2.3.: Mobile Financial Transactions (% of GDP)
Source: Ngendakuroyo, F. (2014)
Within the EAC and in wider Africa, Safaricom has partnered with mobile phone service provider MTN in a venture that will enable its 19.5 million M-Pesa users to send and receive money from 19 African countries10. This follows the signing of an agreement between Vodafone Group and MTN Group allowing their customers across their markets in Africa and beyond to conduct business using the mobile money transfer platform. M-Pesa, a franchise now available in nine African countries, will also help MTN users access the world market through its 250 000 agents, thereby enabling real-time transactions from sender to receiver at a much lower cost.
The collaboration between the region’s two biggest mobile money operators is meant to enable convenient and affordable international remittances between M-Pesa customers in Kenya, Tanzania, the Democratic Republic of Congo and Mozambique, and MTN Mobile Money customers in Uganda, Rwanda and Zambia. However, given the challenges mobile money is facing from a regulatory standpoint, the move seems only aspirational.
The most notable regulatory challenge is the May 2015 court declaration in Uganda that the mobile money business operated by the five major telecommunications companies in Uganda is illegal. In the Kenyan case the collaborative regulatory arrangement between the 10 http://www.africareview.com/News/Safaricom-spreads-M-Pesa-services-to-19-African-countries/-/979180/2694602/-/i30wc5/-/index.html
0
10
20
30
40
50
60
Burundi Kenya Rwanda Tanzania Uganda
2009 2010 2011 2012

62 © European Investment Bank, November 2016
CBK and the CAK enabled the seamless rollout of mobile money. This shows that the challenges at individual country level have the obvious consequence of impeding cross-border payments. While the EAC region – except Burundi – is ahead of Sub-Saharan Africa in terms of the influence of mobile money on access to finance, Kenya is still significantly ahead of the pack (Figure 2.4). This speaks to the prioritisation of enhancing local impact before placing emphasis on extending mobile payments across borders.
Figure 2.4.: Account Ownership (% of Population aged 15+)
Source: World Bank, Global Findex Database
2.4.A. CROSS-BORDER EXPANSION OF BANKS AS A POTENTIAL VEHICLE FOR CROSS-BORDER
MOBILE MONEY
The model depicted in Figure 2.1 and the evolution of mobile payment into the collaborative arrangement that promotes intermediation without infringing on the legal requirements speaks to the extent to which MNOs and banks are interlinked. This evolution is far from complete from a cross-border perspective. There are expectations that cross-border mobile money, at least in the context of the EAC economies, will depend on the regional expansion of banks originating from Kenya.
The East African Community integration initiative aspires to create a single market in terms of both intra-regional investment and of being seen as a single investment destination. It is anticipated that the EAC framework will not only ensure a seamless flow of investments
0 10 20 30 40 50 60 70 80
Sub-Saharan Africa
Burundi
Kenya
Rwanda
Tanzania
Uganda
Account (2014) Mobile Account (2014)
Account at a Financial Institution (2014) Accounts (2011)

Banking in sub-Saharan Africa: Recent Trends and Digital Financial Inclusion
© European Investment Bank, November 2016 63
between the five economies but also encourage external investments in a particular economy as a springboard into the rest of the region.
The cross-border expansion of financial market players domiciled in East Africa is visible, particularly over the past two decades. Studies undertaken in an attempt to understand the motivation of the regional expansion of financial sector players in East Africa have basically focused on what drives the cross-border expansion of Kenya-domiciled banks into the rest of the East African region.
As much of the expansion of financial institutions in the East African region has happened over the last two decades, it is a reasonable assumption that this is a response to the EAC agenda. The plausibility of this assumption could be largely ascribed to the fact that the EAC Partner States’ economies individually, and even collectively, exhibit small open economy characteristics. Therefore the EAC integration roadmap presents the promise of a bigger regional economy, with economies of scale arising from cross-border expansion.
To some extent though, this assumption hinges on the fact that a number of non-financial institution small and medium-sized enterprises (SMEs) as well as large corporates are expanding across the region, which could imply that if such enterprises are responding to the opportunities that the EAC integration agenda offers, then in turn the banks that seek to serve them across the region are in effect doing so as a response to the integration initiative.
There is thus a need to ensure that the regional financial system is integrated at the level of the EAC, now that market players have demonstrated the desire to cross geographical boundaries in pursuit of opportunities. We could therefore be seeing a reverse sequencing, where efforts to have an integrated financial system in East Africa are essentially responding to the market players’ initiative to venture across borders. Even then we could argue that such efforts are predicated on the desire for improved efficiency, hence the move to achieve optimal financial and economic benefits from the expansion.
The same argument can be stretched to mobile payments as facilitated by banks. However, there is no apparent agenda yet of adopting a unified regulatory framework that could obviate incidences such as the declaration of this crucial service as being illegal in one market while in another the same service is thriving. Hence, even though banks and MNOs will have a thriving collaboration that supports mobile payments, the lack of clarity as to whether the financial sector is truly integrated in the region and the differences in the regulatory environment that extend from mere nuances to fundamental disparities will continue to hamper cross-border mobile payments in East Africa.
2.5. Conclusion
Financial markets – in particular the banking industry, which has seen aggressive cross-border investment from Kenya – seem to be forging ahead of the EAC integration process. Mobile money is clearly not following this trend given the unique regulatory requirements. The challenge that remains is to bring the official attitudes towards the integration process in line with market realities when it comes to ensuring true integration of the financial markets generally and payments in particular. That cross-border mobile money is at best

64 © European Investment Bank, November 2016
limited, informal and therefore unregulated points to a lost opportunity given that mobile money has proven to be a cost-effective, convenient and safe means of payment that can propel increased cross-border payments on the back of greater small-scale trade.
The financial sector generally, and the banking industry in particular, has embraced mobile banking through strategic partnership with MNOs. However, cross-border mobile money has not thrived as it has at individual national levels even against the background of a fast-tracked EAC integration agenda. The market is ahead of the regulator with the latter being more risk averse to the extent of constraining trade and investment opportunity especially amongst small businesses.
Furthermore, mobile money is far from being considered central within the regional payment systems promotion agenda. This can be seen from the sequencing of the regionalisation of the payment system starting with Real-Time Gross Settlement (RTGS) – targeting large payments – before looking in depth at retail payments. There needs to be a deliberate pursuit of an optimal cross-border mobile payment system that is complementary to the large payments system under RTGS.
In conclusion, the regulatory regime is reactive rather than proactive in respect of the developments in the mobile payment space as the economies in the region are still grappling with the national dynamics. Granted, the regulation of mobile payments involves more than one regulator (entailing central banks that do not regulate MNOs and MNO regulators that do not regulate banks). Nonetheless there are synergies between banks and MNOs in the respective economies’ national payment frameworks. An exploration on how such synergies will be realised at regional level is critical and timely.

Banking in sub-Saharan Africa: Recent Trends and Digital Financial Inclusion
© European Investment Bank, November 2016 65
References
AfDB (2014), “Regional Integration for Inclusive Growth”, African Development Report 2014.
Afrika, J-G, K. and Ajumbo, G. (2012), “Informal Cross-Border Trade in Africa: Implications and Policy Recommendations”, Africa Economic Brief, African Development Bank, Volume 3. Issue 10. November
Kaimenyi, M.S and Ndun’gu, N.S., (2009), “Expanding the Financial Services Frontier: Lessons from Mobile Phone Banking in Kenya”, Brookings
Mbiti. I and Weil, D.N., (2011), “Mobile Banking: The Impact of M-Pesa in Kenya”, NBER Working Paper Series, Working Paper 17129, June.
Ngendakuroyo, F. (2014), “Mobile and Agency Banking in East Africa: A diagnostic Analysis”, EAC Secretariat Research Paper (April) and Policy Brief (September).
Olaka, H and Osoro, J. (2015), “Banking in East Africa – formal integration following cross-border expansion” in Recent Trends in Banking in Sub-Saharan Africa: From Financing to Investment, European Investment Bank, Luxembourg, July.
Ondiege P. (2010), “Mobile Banking in Africa: Taking the Bank to the People”, Africa Economic Brief, African Development Bank, Volume 1. Issue 8. December.

66 © European Investment Bank, November 2016

Banking in sub-Saharan Africa: Recent Trends and Digital Financial Inclusion
© European Investment Bank, November 2016 67
3. Banking in Southern Africa
STUART THEOBALD1 2 Executive summary
• The banking industry in the Southern African Development Community3 has been affected by the impacts of weak commodity prices, causing an increase in non-performing loans in most markets and far tighter liquidity conditions.
• Changing regulations affecting international and regional banking groups are also
making an important impact on the strategies of banks in the region. Many markets are dominated by foreign-owned banks which are now looking to dispose of their interests. Regulators are developing new ways of thinking about the systemic impact of shareholders given the paucity of capital-rich global groups with an appetite for banks in Africa.
• Changing technology in the financial sector has had a dramatic impact on
consumer banking in the region, particularly through mobile money services. So far there has been limited expansion of financial services beyond payment services, but some mobile operators and other non-banks are offering small loans and savings services. In most respects, this is not disruptive innovation so much as finding solutions to capacity and infrastructure constraints on traditional forms of financial services.
• In most markets, regulators have been increasingly active in driving anti-money
laundering regulations in line with global standards. In some cases this is seen as critical to the banking sector’s standing in the international community and to maintain correspondent banking relationships. Other reform efforts such as improving capital adequacy, risk management and product transparency remain important.
3.1. Introduction
Southern Africa’s banks, like most of the continent’s, have had to contend with strong economic headwinds driven mainly by the decline in commodity prices over the past two years. Several of the 15-member Southern African Development Community countries depend on mineral exports for much of their hard currency receipts and tax funding. The fall in commodity prices has led to far weaker currencies while interest rates and inflation have increased. Government finances have been severely challenged. In several cases, domestic
1 Chairman, Intellidex. 2 The views expressed in this document are those of the author. 3 The 15 SADC member states are Angola, Botswana, Democratic Republic of Congo, Lesotho, Madagascar, Malawi, Mauritius, Mozambique, Namibia, Seychelles, South Africa, Swaziland, Tanzania, Zambia, Zimbabwe.

68 © European Investment Bank, November 2016
financial systems have had to fund government deficits, crowding out private sector lending. In short, it has been a difficult two years for the development of the region’s banking sector.
Another important theme has been the loss of interest by global banking groups in maintaining African banking networks. This is motivated by global capital rules, particularly for those groups designated as systemically important financial institutions. More stringent capital rules regarding the treatment of foreign subsidiaries have made it inefficient to run multinational banking networks. Several SADC markets are dominated by global groups which are perceived as important to the systemic stability of those markets. The consequences for those markets are still unfolding. So far Barclays has been the most prominent group to officially announce it will reduce its exposure to the continent, but others are also thought to be readying to follow suit.
It is likely that African networks will remain intact, with new shareholders at the holding company level, but even then regulation is becoming increasingly difficult for cross-border banks within the continent. Barclays’ African network is held through a separate entity publicly listed in Johannesburg, making it relatively simple for the UK-based plc to exit its interest. Other global groups will be more likely to sell their banks in individual markets, such as Angola where Portuguese banks and other investors are trying to exit. For regulators, the challenge is to facilitate a process that will ensure strong owners in a world in which capital-rich shareholders have little incentive to own banks.
The region includes both the most developed banking markets on the continent and the least. South Africa dominates with over 75% of all of the banking assets in SADC, while Mauritius offers a sophisticated smaller market, attracting several regional financial firms to establish head offices in the island nation4. At the other extreme, markets such as the Democratic Republic of Congo and Madagascar have extremely underdeveloped banking sectors with almost no domestic financing capacity. For these markets the challenges are structural, requiring significant regulatory and legislative development to enable growth of banking systems.
4 Intellidex calculations, BankScope (Bureau van Dijk)

Banking in sub-Saharan Africa: Recent Trends and Digital Financial Inclusion
© European Investment Bank, November 2016 69
Table 3.1.: SADC Banking Industry Selected Statistics
Domestic credit to the private sector
(% of GDP)
Total assets (USD millions)
% of regional total assets
Angola 27.2 97 611.71 8.97% Botswana 33.9 18 450.46 1.69% DRC 6.7 4 934.67 0.45% Lesotho n/a 1 940.19 0.18% Madagascar 13.0 3 844.43 0.35% Mauritius 104.3 52 713.00 4.84% Malawi n/a 3 192.43 0.29% Mozambique 35.4 14 091.60 1.29% Namibia 53.5 18 338.29 1.68% Seychelles 23.9 1 952.08 0.18% Swaziland 20.4 2 138.82 0.20% Tanzania 15.4 21 056.16 1.93% South Africa 150.0 819 954.31 75.31% Zambia 19.6 12 728.65 1.17% Zimbabwe 25.0 15 844.79 1.46%
Sources: World Bank, BankScope (Bureau van Dijk), International Monetary Fund, Intellidex calculations Note: figures are for the most recent year available, which was usually 2015
3.2. Fintech Developments
Like the rest of Africa, Southern Africa has seen strong innovation, particularly on the back of the growth of cellular telephony. Mobile phone penetration is close to 100% in many markets, totally changing ordinary people’s access to communications – people who have been long frustrated by the dearth of landline infrastructure. Financial innovation has embraced this channel in several ways, particularly in transactional services. In many markets, remittances from family members working abroad or in local urban centres are the key sources of cash. Cellphone-based transfer systems have drastically reduced the cost and inconvenience of sending money home. Some have embraced more sophisticated cellphone banking, including maintaining accounts and conducting transactions using phones equipped with mobile wallets. In some markets this has leapfrogged the credit card stage, with consumers now used to phone-based transactions having never developed the habit of paying with cards, let alone with cheques. Botswana, Tanzania and Zimbabwe have been the most active in mobile money development in the region, with Tanzania having adopted Kenya’s wildly successful M-Pesa, which in some respects has evolved into the most sophisticated fintech market on the continent.
Such fintech evolution has also helped with core banking infrastructure in several markets. MFS Africa, for example, was developed to switch payments between mobile network providers and banks, effectively becoming a regional switching service that had not previously been available. Such development is taking place outside of the formal banking

70 © European Investment Bank, November 2016
sector, though such fintech groups will increasingly become the “new normal” and form core parts of future financial sectors.
African start-ups have been bought by international banks in order to integrate such technology into their core capabilities. A good example is Johannesburg-based Tyme, a developer of cellphone-based payment systems and wallets, which was bought by the Commonwealth Bank of Australia, to expand its operations in India, China and Vietnam.
However the impact of fintech has so far not extended much beyond these transactional services. In particular, access to credit has not seen significant innovation in markets where banking credit is almost non-existent. Indeed, in many such markets it is non-bank financial institutions, particularly those providing small unsecured loans, which are changing the scenario for domestic borrowers, though usually through old-fashioned branch networks. Weak legal systems often make the recovery of security nearly impossible, so unsecured lending has become dominant. Interest rates are often very high and reports of abuse, such as holding borrowers’ bank cards and identity documents, are common.
High interest rates even from large formal banks are also a big deterrent to growth in private sector credit extension. For many banks, government paper pays a good yield while deposits can be accessed cheaply. There is little reason to take on the risk of private sector lending when margins are substantial for taking almost no risk. However, among the non-bank mobile operators themselves, there has been more innovation. In Tanzania, for instance, mobile operator Vodacom now offers small loans while competitor Tigo pays a form of interest to clients who save in their mobile wallets.

Banking in sub-Saharan Africa: Recent Trends and Digital Financial Inclusion
© European Investment Bank, November 2016 71
Table 3.2.: Mobile Subscriptions Compared to Fixed Broadband Subscriptions
Fixed broadband subscriptions
(per 100 people)
Mobile cellular subscriptions
(per 100 people)
Angola 0.4 63.5 Botswana 1.6 167.3 Congo, Dem. Rep. 0.0 53.5 Lesotho 0.1 85.0 Madagascar 0.1 41.2 Malawi 0.1 33.5 Mauritius 14.6 132.2 Mozambique 0.1 69.8 Namibia 1.8 113.8 Seychelles 12.7 162.2 South Africa 3.2 149.2 Sub-Saharan Africa 0.4 71.0 Swaziland 0.4 72.3 Tanzania 0.2 62.8 Zambia 0.1 67.3 Zimbabwe 1.0 80.8
Source: World Bank Note: 2014 data
Fintech has the potential to crack some of the difficult problems facing SADC financial markets but, apart from the impact on remittances, this has not yet borne fruit. Areas where fintech could have a big impact are the identification of clients and the use of phones to geolocate clients in markets where land records and street addresses are not available. There are some signs that working capital for SMEs could be facilitated using phones as entrepreneurs manage all of their transactions through phone-based systems and generate good records of cash flow patterns. Farmers, also, could get working capital support while phone-based apps could link them directly to buyers with whom they can lock in future prices, eliminating risk and the long chain of middlemen who normally straddle the small farming value chain. Others are finding ways to offer more efficient savings and insurance products.
Africa’s many entrepreneurs may well figure out other ways to use the growth in access to communications to overcome other barriers to accessing financial services. Fintech can find ways around barriers that currently exist to banking services, such as limited credit bureau records, branch infrastructure and points of sale devices. The data that accumulate through phone-based transactions could lead to new ways of understanding client risk profiles that could facilitate credit access.
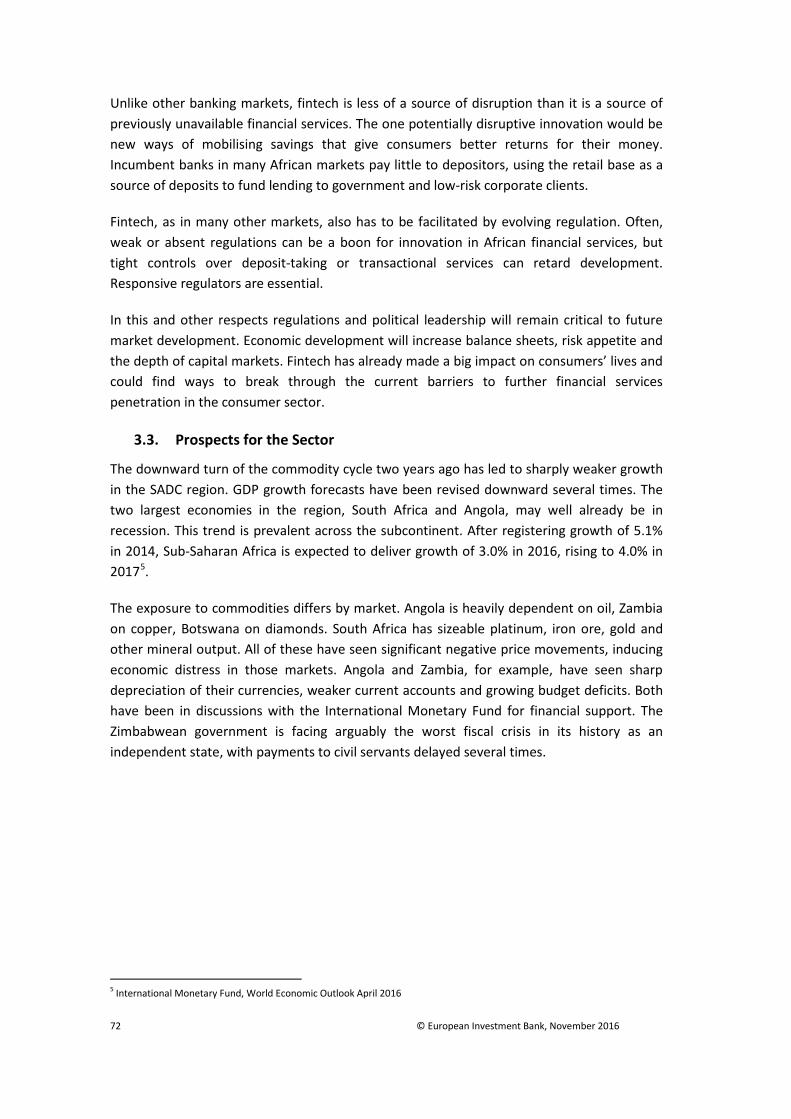
72 © European Investment Bank, November 2016
Unlike other banking markets, fintech is less of a source of disruption than it is a source of previously unavailable financial services. The one potentially disruptive innovation would be new ways of mobilising savings that give consumers better returns for their money. Incumbent banks in many African markets pay little to depositors, using the retail base as a source of deposits to fund lending to government and low-risk corporate clients.
Fintech, as in many other markets, also has to be facilitated by evolving regulation. Often, weak or absent regulations can be a boon for innovation in African financial services, but tight controls over deposit-taking or transactional services can retard development. Responsive regulators are essential.
In this and other respects regulations and political leadership will remain critical to future market development. Economic development will increase balance sheets, risk appetite and the depth of capital markets. Fintech has already made a big impact on consumers’ lives and could find ways to break through the current barriers to further financial services penetration in the consumer sector.
3.3. Prospects for the Sector
The downward turn of the commodity cycle two years ago has led to sharply weaker growth in the SADC region. GDP growth forecasts have been revised downward several times. The two largest economies in the region, South Africa and Angola, may well already be in recession. This trend is prevalent across the subcontinent. After registering growth of 5.1% in 2014, Sub-Saharan Africa is expected to deliver growth of 3.0% in 2016, rising to 4.0% in 20175.
The exposure to commodities differs by market. Angola is heavily dependent on oil, Zambia on copper, Botswana on diamonds. South Africa has sizeable platinum, iron ore, gold and other mineral output. All of these have seen significant negative price movements, inducing economic distress in those markets. Angola and Zambia, for example, have seen sharp depreciation of their currencies, weaker current accounts and growing budget deficits. Both have been in discussions with the International Monetary Fund for financial support. The Zimbabwean government is facing arguably the worst fiscal crisis in its history as an independent state, with payments to civil servants delayed several times.
5 International Monetary Fund, World Economic Outlook April 2016

Banking in sub-Saharan Africa: Recent Trends and Digital Financial Inclusion
© European Investment Bank, November 2016 73
Figure 3.1.: Selected Commodity Prices
Source: Inet BFA Note: Based to 100 at the start
There have been several consequences for the banking sector. First, many banks have large exposures to new projects in development, particularly new oil developments in Angola and Tanzania, which are not viable at current prices. While most of the exposures to the largest investments are held by global banks, it has been a development priority to include the domestic financial sectors in such projects. This is particularly a risk for the regional banking groups. Provisions have had to be made as a result, damaging banking returns. Second, the strain on government finances has often resulted in increased dependency on domestic funding, with available liquidity diverted to government borrowing. That has crowded out lending to the private sector. Third, in commodity-exposed markets several major employers in the mining sector have responded by scaling back operations, leaving thousands of workers redundant. Particularly in the case of South Africa where consumer lending is most developed, that has put strain on household budgets and further damaged banks’ credit performance. Fourth, several large mining groups have found themselves overleveraged in the weak price environment, triggering urgent equity fund raising, such as by Lonmin, a platinum producer in South Africa, in order to avoid defaulting to the banks. Other miners have scaled back borrowing while suspending capital expenditure projects.
Commodity prices now appear to have bottomed out with some having recovered tentatively this year. The resources sector is generally much more efficient than it was two years ago, having focused on cost-reduction programmes. Capital expenditure has been directed to operations which are lowest on the cost curve. This positions the resources
20
30
40
50
60
70
80
90
100
110
120
Jan-
12
Apr-
12
Jul-1
2
Oct
-12
Jan-
13
Apr-
13
Jul-1
3
Oct
-13
Jan-
14
Apr-
14
Jul-1
4
Oct
-14
Jan-
15
Apr-
15
Jul-1
5
Oct
-15
Jan-
16
Apr-
16
Jul-1
6
Brent crude Copper Gold Platinum

74 © European Investment Bank, November 2016
sector well for a rebound in profitability as prices recover. Angola has paused its discussions with the IMF as oil revenues have slowly recovered. Zambia, however, is likely to have an IMF programme in place by the end of the year.
Table 3.3.: Key Banking and Economic Statistics*
GDP at market prices
(constant 2010
USD billions)
GDP growth
(annual %)
Gross domestic
savings (% of GDP)
Interest rate spread (lending
rate minus deposit rate; %)
Year 2015 2014 2015 2014 2015 Angola 104 4.8 3.0 22.3 13.6 Botswana 16 3.2 -0.3 37.7 5.4 Congo, Dem. Rep. 30 9.0 6.9 14.3 15.7 Lesotho 0 3.6 n/a n/a 8.3 Madagascar 10 3.1 3.0 10.1 45.0 Malawi 9 5.7 3.0 6.5 32.8 Mauritius 12 3.6 3.5 11.5 2.4 Mozambique 14 7.4 6.3 1.0 6.3 Namibia 15 6.3 5.7 12.1 4.6 Seychelles 1 3.3 3.5 22.2 9.2 South Africa 416 1.5 1.3 18.5 3.3 Sub-Saharan Africa
1 654 4.6 3.0 18.3 n/a
Swaziland 4 2.5 1.7 n/a 6.8 Tanzania 44 7.0 7.0 20.6 6.2 Zambia 26 5.0 3.2 n/a 4.3 Zimbabwe 13 3.8 1.1 -12.2 n/a
Source: World Bank
Short-term banking sector developments depend on the relief that higher commodity prices would bring. If the recent improvement is sustained, both corporate and retail customers would see improvements to their debt service capability. But the main benefit would be a repair in government finances as revenue returns from mining-related taxes recover and foreign exchange is generated. That should allow interest rates to come down and improve liquidity in the banking sectors, stimulating more private sector borrowing. The development of Africa’s consumer sector would resume with a return to growth of the middle class.
In smaller markets such as Malawi, Zambia and Mozambique, efforts could then resume in developing domestic capital markets. While those three markets, and most of the rest of the region with the notable exception of Angola, now have stock exchanges, these suffer from a lack of liquidity. Only South Africa’s Johannesburg Stock Exchange has sufficient volumes of trade for genuine price discovery. Mauritius and Namibia are the next largest but have not even 1% of the JSE’s volumes. Given the limited investor interest, the cost of equity is high and few companies have attempted to use the equity markets for funding.

Banking in sub-Saharan Africa: Recent Trends and Digital Financial Inclusion
© European Investment Bank, November 2016 75
Generally, the regulatory infrastructure that has been established is good, but the necessary reforms to the savings industry have not been undertaken, particularly the promotion of formal retirement savings. In most markets only employees of multinationals, civil servants and the largest domestic formal companies systematically contribute to retirement savings. The stock exchanges have also recently seen plummeting foreign interest as a result of weaker economic prospects and falling currencies. Outside of South Africa, corporate bond issuance is almost non-existent, despite regulatory efforts to open capital markets for them. Consequently, banks tend to rely on deposits and wholesale funding, with domestic capital markets ill-equipped to provide much equity or debt.
From a regional perspective, SADC member countries have been working towards greater co-operation in regulatory oversight through the Committee of Central Bank Governors in SADC. The momentum towards better integration of financial systems may weaken somewhat given the slowdown in development of regional banks.
3.4. Country Comments
The remainder of this chapter briefly surveys developments in key markets of the region.
3.4.1. ANGOLA
The country has been severely affected by the rapid decline of oil prices. That has driven a shortage of hard currency which has hampered a financial sector that is substantially dollarised. Inflation has risen along with the weakness in the domestic currency and has recently accelerated to over 35%6. The banks have had to contend with a far more rigorous regulatory environment that has driven increased capital levels and sharply stricter anti-money laundering regulations. Angola has been criticised internationally for weak anti-money laundering standards which has already led to some international banks cutting their correspondent relationships, worsening the dollar shortage. Only two Angolan banks have USD commercial banking relationships.
The European Central Bank has also instructed European banks to reduce exposure to Angola, which has directly affected several Portuguese banks. The ECB’s move came after the collapse of Banco Espirito Santo, Portugal’s second-biggest bank, which owned 55% of an Angolan subsidiary. When the European bank collapsed, Angola’s central bank took the bank into curatorship along with a EUR 3.3bn credit line. The credit was initially thought by the Portuguese central bank to be recoverable.
However, the Angolan bank was recapitalised, leading to a dilution of the Portuguese interests to insignificance and the credit line has had to be written off amid some diplomatic tension. Angolan exposure has since been seen as a serious risk to the Portuguese banking sector and a few banks are trying to secure sales of their Angolan interests.
6 Banco Nacional de Angola http://www.bna.ao/default.aspx

76 © European Investment Bank, November 2016
Figure 3.2.: Angolan USD Exchange Rate and Domestic Inflation
Sources: Angola Department of Finance, Bloomberg
With around 20 banks in operation in the country, there has also been a need to consolidate in a market with total assets of about USD 100 billion. The consolidation effort has so far resulted in one big merger, that of Banco Millennium Angola and Banco Privado Atlantico, finalised in May, to create the second-largest privately held bank. Non-performing loans vary widely between the banks, but those that have reported recently show NPLs of 3% to 4% of their books. Asset growth has remained strong despite the difficult conditions, with most banks reporting 30% and higher year-on-year growth. That asset growth has likely helped to keep NPLs lower as a proportion of the total book, so the impact of economic conditions is not yet clear.
Angola had turned to the IMF for support following a collapse in government revenue on the back of the oil price decline. The IMF support may have come with a reform programme to help develop the Angolan banking sector. However in June the talks were terminated. Angola has been able to raise substantial funding from Chinese and Korean lenders though it will take sustained improvement in oil prices for the country to be able to continue avoiding an IMF package.
3.4.2. BOTSWANA
Botswana has one of the region’s best developed and regulated banking sectors and capital markets. It is dominated by foreign-controlled banks, particularly South Africa’s First National Bank and Standard Bank, and UK banks Barclays and Standard Chartered, which make up four of the five biggest banks in the country and hold 90% of the industry’s assets.
0
5
10
15
20
25
30
35
8090
100110120130140150160170180
Jan-
15
Feb-
15
Mar
-15
Apr-
15
May
-15
Jun-
15
Jul-1
5
Aug-
15
Sep-
15
Oct
-15
Nov
-15
Dec-
15
Jan-
16
Feb-
16
Mar
-16
Apr-
16
May
-16
Jun-
16
Jul-1
6
Official exchange rate (LHS) Inflation rate (RHS)

Banking in sub-Saharan Africa: Recent Trends and Digital Financial Inclusion
© European Investment Bank, November 2016 77
The sector has suffered along with the rest of the economy in the face of sharply weaker diamond prices, with real GDP shrinking by 0.3% in 20157. That is expected to recover this year to 3.7% growth. Apart from weaker diamond prices the market has suffered from a drought, leading to water shortages and an electricity shortage (with much electricity generation dependent on water availability).
The banking sector has seen an uptick in non-performing loans with NPLs at 3.9% of lending books in 2015 and an accompanying fall in profitability driven by sharply reduced interest margins. Nevertheless, Botswana’s banks remained profitable with an average return on equity of 13.3% in 2015, down from 19.1% in 20148.
Botswana has seen reasonably high penetration of mobile phone payment services with 21% of the adult population having used a mobile money account in the past year, according to the World Bank’s 2014 Findex study. This has largely been driven by established banks providing mobile channels for clients.
3.4.3. MAURITIUS
After South Africa, Mauritius has the most sophisticated banking industry in the region. Its population has the highest level of financial inclusion on several measures including home lending. The island’s economy is driven by its services sector including financial services, technology and tourism, as well as manufacturing and construction activity. As a commodity importer, the price cycle has had the opposite effect on it compared with the rest of the region, though weak international conditions have an indirect negative impact on trade and services consumption. Overall in 2015 GDP growth was reported at 3.5% with 3.9% forecast for 20169, with further growth constrained by the negative global business cycle, of which weaker commodity prices are also a consequence.
The banking sector has remained stable throughout the period with consumer and corporate lending volumes staying constant, though the non-performing loan ratio grew sharply to 13% of total loans at the end of 2015 from 5.9% a year earlier.
The Mauritian financial sector is split between domestic banks and foreign-owned banks, many of which operate from Mauritius’s offshore financial centre, with the assets of the industry divided evenly between them. Return on equity for the sector was 12.1% as at the end of 2015, a strong performance relative to the rest of the region, though sharply down on the 20% plus levels achieved a few years earlier10. The sector has significant cross-border exposures, particularly to India, making the risk dynamic for Mauritius unique. The banks are strongly capitalised with an average capital adequacy ratio of 16.5% at the end of 2014.
Mauritius has a comprehensive development plan aimed to position the country as a high income economy by 2025. The government is implementing a comprehensive programme to 7 Bank of Botswana, Bank Supervision Annual Report 2015 8 Bank of Botswana 9 Statistics Mauritius, National Accounts Estimates, June 2016 10 Bank of Mauritius, Monetary Policy and Financial Stability Report, May 2016

78 © European Investment Bank, November 2016
diversify the economy and improve its global competitiveness. Financial services are a key part of that, with Mauritius’s status as an offshore financial centre set to grow alongside the growth of trade in services in general. The financial sector is broadly construed with regulation that is open-minded about non-banks entering financial services. Mauritius therefore presents itself as an ideal market to launch regional fintech businesses. It has no exchange control and a variety of attractive tax incentives for financial services companies. This has occasionally raised questions about Mauritius’s status as a tax haven, particularly by India, which receives a significant volume of inward investment from the island nation from entities that choose to base themselves there. The tax advantage for doing so, however, was largely eliminated by a new treaty signed earlier this year which may negatively impact Mauritius as a location for financial services intermediaries servicing India. From a SADC perspective, however, Mauritius is a full member enjoying all of the rights that come with it.
3.4.4. SOUTH AFRICA
With over three quarters of the SADC region’s banking assets, South Africa dominates the sub-region’s banking industry. Its banks are all highly active in the rest of the continent and look set to maintain that activity despite the increasing regulatory burden faced by regional banks. The continent’s two biggest banking networks, Standard Bank and Barclays, are both run from Johannesburg. The planned exit of Barclays plc from its African subsidiary will leave Barclays Africa as a standalone African banking network listed and run from Johannesburg.
Domestic conditions, however, have been difficult. South Africa has been negatively affected by the commodity price slump while political moves with a direct impact on the financial policy environment have been very negative. The country narrowly averted the loss of its investment grade rating in June, but could face a downgrade come December. Electricity shortages for several years have been relieved but largely thanks to a fall in demand. GDP growth is expected to be around 0% this year and unemployment has risen to record levels. Certain large corporate exposures, particularly platinum producer Lonmin and cement producer PPC, have had to be restructured and recapitalised in order to protect bank exposures. So far those have been successful.
Despite this, bank profitability has so far remained robust, with return on equity at the end of 2015 of 17.1%, a multi-year high11. Profitability has been supported by steadily increasing net interest margins as the banks have aggressively repriced risk since the global financial crisis severely damaged banks’ credit performance. Following severe losses in 2009, particularly in home lending, competitive pressures abated and banks all increased the margins they charged over their prime rates. Impairments have also been on a downward trend over the past few years as banks have aggressively worked the highest risk clients off their books, though at the time of writing, the latest results from the banks were showing that this trend is reversing.
11 South African Reserve Bank, Bank Supervision Annual Report 2015

Banking in sub-Saharan Africa: Recent Trends and Digital Financial Inclusion
© European Investment Bank, November 2016 79
The sector has faced several anti-money laundering enforcement actions including large fines levied by the South African Reserve Bank on many of the major local and foreign banks over the last few years. This has driven an aggressive compliance effort at all the banks that has led to accounts of several prominent individuals and companies being closed. The efforts look set to secure South Africa’s reputation for the high regulatory quality of its banking system.
Another major development for the sector has been the successful restructuring of African Bank which collapsed in 2014 following very large impairments to its personal unsecured loan books. A bad bank/good bank structure was created and came to fruition in early 2016, with a new African Bank now in commercial operation. Bond holders were required to take a 10% haircut and subordinated debt holders significantly more, while the government has guaranteed the liabilities linked to the bad book left behind. The resolution on the whole has successfully protected creditors to the bank.
While South Africa’s banks are highly active in the rest of the continent, domestic economic performance remains the critical driver for the banks. A commodity price recovery would be highly positive, as would several promised structural reforms from the government that will unlock potential in mining and tourism development. Should the government deliver, the prospects would look reasonably good for the banks. As it stands, the uptick in non-performing loans indicates that the difficult economic environment is translating into client distress. Should the economy not recover, bank profitability is sure to drift lower.
3.4.5. TANZANIA
Tanzania has a large, fragmented banking market with 34 full-service banks and 12 community banks operating, with the four largest banks holding 50% of assets. The Bank of Tanzania has been making an effort to drive the sector towards consolidation by requiring higher capital ratios, but few transactions have taken place. The central bank has also put significant pressure on banks to improve transparency and anti-money laundering processes.
Tanzania has the highest penetration of mobile money services in the SADC region, thanks primarily to neighbouring Kenya where the highly successful M-Pesa money transfer service was developed. Some 34% of adult Tanzanians used a mobile service to transfer money in the previous 12 months according to a 2014 World Bank study,12 the second highest after Kenya in Africa. More recent figures suggest about 60% of adults have a mobile money account while just 15% have a bank account. This positions Tanzania among the most active mobile money markets in the world.
In some respects, Tanzania has overtaken Kenya in the depth of mobile financial services that are now available in the market. It has been particularly successful because payments can be made across multiple networks, so the market is not reliant on a single standard like M-Pesa. It has also gone further in offering loan and savings products over mobile. The largest network operator, South Africa’s Vodacom, brought M-Pesa into the country and has 12 World Bank Findex study, 2014

80 © European Investment Bank, November 2016
now introduced M-Pawa for smaller loans, saying Tanzanians have borrowed USD 19.5 million through the small loans13. Tanzanians can also save in their mobile money accounts and receive a form of interest from mobile operator Tigo (though it is described as a “profit distribution” so as to not fall under banking regulations), which has also recently launched a lending service with loans of an average size of USD 514. This has the potential to shift the way credit works in the country, with banks having so far had a limited impact, particularly in the consumer sector.
Private sector credit extension is only 15.4% though formal banks have traditionally relied on the retail sector for deposits, which could be disrupted by the development of fintech. Consumer lending has increasingly been undertaken by licensed unsecured lenders, for whom the mobile operators may pose a threat. The country illustrates just how a banking market can leapfrog payment stages – few banking clients have ever held a credit card or cheque book and most likely never will, while almost everyone has at least seen mobile payments in action.
Generally, the difficult commodity market has had an impact on Tanzania, forcing it to tighten monetary conditions to defend the currency. Interest rates shot up and liquidity was drained from the banking sector by doubling statutory reserve requirements to 10%. However, most recent government figures show reasonable growth in money supply while the government has largely avoided drawing funding from the private sector. The banking sector remains profitable and GDP growth, while down from highs of over 10% a few years ago, was still 7% last year. While the sector still needs to build banks of sufficient scale to be able to take on large ticket financing, it remains a vibrant and profitable market place.
3.4.6. ZAMBIA
Zambia’s banking market is small but active and well regulated. It is dominated by foreign-owned majors and has remained profitable despite a rapid deterioration in economic conditions since 2015. Because of low copper prices, the main mineral resource, the government’s budget deficit worsened substantially during the year. That was compounded by a major electricity shortage leading to rolling blackouts. Zambia has successfully conducted three Eurobond issues over the last four years, though the weaker economy caused yields on the Eurobonds to spike. The government has begun discussions with the IMF to secure a funding package which could be in place by the end of the year. At the time of writing, once the August election is behind it, the government is expected to have scope for unpopular fiscal decisions including ending subsidies on fuel and electricity.
The worsening fiscal outlook drove a major fall in the value of the currency, which has worsened the government’s balance sheet given USD 4 billion of hard currency liabilities linked to the Eurobonds. The exchange rate depreciation triggered inflation in the partly dollarised economy, which led the central bank to significantly tighten monetary conditions, increasing interest rates and statutory reserve ratios. The government tapped the domestic 13 http://www.ft.com/cms/s/0/0e8b56ee-41ca-11e6-9b66-0712b3873ae1.html#axzz4HDXDkfMx 14 http://www.bizcommunity.com/Article/196/751/142394.html

Banking in sub-Saharan Africa: Recent Trends and Digital Financial Inclusion
© European Investment Bank, November 2016 81
financial sector for funding at yields close to 28%. The banking sector, which obtains low-cost funding from a wide consumer deposit base, has been able to generate strong local currency returns, but developments in the banking system to improve consumer lending have stalled as a result.
Figure 3.3.: Zambian Inflation, Exchange Rate and Treasury Bill Yields
Sources: Zambia Central Statistical Office, Bank of Zambia, Bloomberg
The IMF programme will relieve liquidity conditions and may be accompanied by other efforts to promote private sector development. GDP growth was 5% last year and is expected to decline to 2.7% this year. The power crisis is abating as new projects come on stream and copper prices have recovered slightly. New copper operations are due to open that will be profitable even at current prices. As such, conditions in Zambia are expected to be far better as from next year.
3.4.7. Zimbabwe
Zimbabwe’s long-suffering banking sector has taken a turn for the worse. In recent months the government’s financial position has been close to collapse, with civil servant and even armed forces salaries paid late. This is due to a massive shortage of hard currency in the country which ‘de facto’ dollarised in 2009 following the collapse of its own currency.
The currency shortage is in part due to weak commodity markets but also a massive drought that constrained what little commercial agriculture that remains. Both the private sector and the government struggle to raise any finance from abroad, with the state in arrears on USD 1.8bn of loans from the International Monetary Fund, the World Bank and the African Development Bank. The government has attempted to re-engage the IMF with the hope of securing some form of rescue deal, but this has not yet resulted in an agreement.
0
2
4
6
8
10
12
14
0
5
10
15
20
25
30
Jan-
15
Feb-
15
Mar
-15
Apr-
15
May
-15
Jun-
15
Jul-1
5
Aug-
15
Sep-
15
Oct
-15
Nov
-15
Dec-
15
Jan-
16
Feb-
16
Mar
-16
Apr-
16
May
-16
Jun-
16
Jul-1
6
Inflation rate (LHS) 91 day treasury bill yield (LHS)Exchange rate USD (RHS)

82 © European Investment Bank, November 2016
The government has faced widespread and organised protests after civil servant salaries were paid late earlier this year. There is virtually no employment outside of the civil service, with millions reliant on millions more working outside the country to send back remittances.
For several years the banking sector has been told it has to “indigenise”, which means transfer majority ownership to Zimbabweans. Most of the banks in the country are foreign-owned. The policy was clarified earlier in 2016 and banks are no longer officially facing the threat of having to transfer majority ownership, though certain ministers have privately continued to insist that indigenisation of the banks must go ahead. Given that the biggest challenge facing the country is a shortage of foreign currency, the foreign ownership of the banks is one of very few international linkages Zimbabwe still has.
Most of the foreign parent banks have effectively valued their Zimbabwean subsidiaries at zero and deconsolidated them. They retain nominal ownership based on the view that eventually Zimbabwe will have to turn the corner. With the government now facing the biggest crisis ever, that corner may come soon.

Banking in sub-Saharan Africa: Recent Trends and Digital Financial Inclusion
© European Investment Bank, November 2016 83
References
Global Findex (2014). World Bank. Available at: http://www.worldbank.org/en/programs/globalfindex. World Bank, Washington DC
BankScope – Bureau van Dijk (2015). Available at: https://bankscope.bvdinfo.com/version-2015420/home.serv?product=scope2006. Bureau van Dijk, London
Global Findex (2014). World Bank. Available at: http://www.worldbank.org/en/programs/globalfindex. World Bank, Washington DC
Bank of Botswana. Bank Supervision Annual Report 2015. Available at: http://www.bankofbotswana.bw/assets/uploaded/Banking%20Supervision%20Annual%20Report%202015.pdf. Bank of Botswana, Gabarone.
Bank of Mauritius, Monetary Policy and Financial Stability Report, May 2016. Available at: https://www.bom.mu/sites/default/files/bom_apr16.pdf. Bank of Mauritius, Port Louis.
South African Reserve Bank. Bank Supervision Annual Report 2015. Available at http://www.resbank.co.za/Lists/News%20and%20Publications/Attachments/7309/01%20BankSupAR2015.pdf. SA Reserve Bank, Pretoria.
Financial Times. Tanzania’s fintech and mobile money transform business practice. 13 July 2016. Available at https://www.ft.com/content/0e8b56ee-41ca-11e6-9b66-0712b3873ae1#axzz4HDXDkfMx. Financial Times, London
Finextra. Tigo Tanzania launches 'nano lending' scheme. 17 March 2016. Available at https://www.finextra.com/pressarticle/63613/tigo-tanzania-launches-nano-lending-scheme. Finextra, London.

84 © European Investment Bank, November 2016

Banking in sub-Saharan Africa: Recent Trends and Digital Financial Inclusion
© European Investment Bank, November 2016 85
4. Development of the Banking Sector in West Africa and Central Africa in an Era of Financial Digitalisation
JAD BENHAMDANE, AMINE EL KOURCHI, SAID HIDANE 1
Executive summary
• The activity of the banking system of the West African Economic and Monetary Union (WAEMU) continues to be positive, marked in 2014 by growth in resources and an increase in bank assets, including a 15% rise in customer loans. Furthermore, changes to the legal framework and the strengthening of banking supervision requested by the Central Bank of West African States (BCEAO) will help to form the basis of a modern system, tailored to the new challenges facing the region.
• With a slight increase in gross customer loans (+8%), the banking sector of the Central African Economic and Monetary Community (CEMAC) continues to be driven by oil price fluctuations. At end-March 2015, against the backdrop of a decline in energy revenues, the loss ratio rose by 2% in one year to 11.9%. Diversification of risk and increased banking penetration are the next challenges facing the banking sector in the region.
• The challenges of financial inclusion in West Africa and Central Africa continue to be of vital importance given that their banking penetration rates are among the lowest in the world, particularly in the CFA franc monetary zone. Currently, the promotion of digitalised services – for transferring, withdrawing and depositing money and making loan applications – in these areas with high levels of mobile penetration is the key initiative for improving access to banking services. It should be noted, however, that the regulatory framework is more favourable in West Africa.
1 Institute of Africa - BMCE Bank of Africa

86 © European Investment Bank, November 2016
4.1. Analysis of Recent Trends in the Banking Sector in West Africa
4.1.1. MACROECONOMIC BACKGROUND: SUSTAINED GROWTH
4.1.1.A. A POLITICAL TURNING POINT TO ADDRESS THE CHALLENGES RELATING TO
TERRORISM
In 2015, the political landscape in West Africa was marked by a number of major events. In March the election in Nigeria was peaceful and was won by the opposition candidate, M. Buhari. He has made combating terrorism in the north of the country the number one priority during his mandate and convinced Niger, Chad and Cameroon of the need to safeguard security in the region.
Later in the year, the presidential elections in Togo and Côte d’Ivoire also went off peacefully. The presidential elections in Guinea and Burkina Faso played out differently, however, and were the scene of protests.
4.1.1.B. ECONOMIC DEVELOPMENT: WAEMU ON THE UP WHILST ECOWAS
STAGNATED
West Africa remains the second most dynamic region in sub-Saharan Africa after East Africa, with a rate of expansion of just over 4% in 2015 compared to nearly 6% in 2014. The rate of GDP growth was therefore above average compared to the rest of the continent (3% in 2015 and 3.4% in 2014).
Furthermore, inflation has remained at a moderate level – around 1% in 2015 – thanks to an improvement in the terms of trade. With reference to BCEAO’s key interest rate – which has remained at 2.5% since September 2013 – the monetary policy of the WAEMU countries has remained accommodative.
With economic growth of 7% in 2015, the WAEMU2 zone leads the way as the economic engine of West Africa. Its eight member countries have thus shown their ability to continue their economic integration whilst advancing the process of diversifying and enhancing the business climate. For its part, ECOWAS3 – the Economic Community of West African States – recorded a lower rate of economic growth, estimated at 3.2% in 2015, which was heavily impacted by the drop in oil prices.
2 Member countries of WAEMU: Benin, Burkina Faso, Côte d’Ivoire, Guinea-Bissau, Mali, Niger, Senegal, Togo. 3 Member countries of ECOWAS: Benin, Burkina Faso, Cape Verde, Côte d’Ivoire, Gambia, Ghana, Guinea, Guinea-Bissau, Liberia, Mali, Niger, Nigeria, Senegal, Sierra Leone, Togo.

Banking in sub-Saharan Africa: Recent Trends and Digital Financial Inclusion
© European Investment Bank, November 2016 87
Figure 4.1.: GDP Growth in West Africa (as a %)
Source: IMF
Disparities within West Africa itself show that there are different levels of development. With its population of 179 million, Nigeria has a bigger GDP than the sum of the GDPs of the other countries in the region. Meanwhile, Côte d’Ivoire had the best performance in West Africa in terms of economic growth in 2015.
-2%
0%
2%
4%
6%
8%
10%
12%
2004
-200
8
2009
2010
2011
2012
2013
2014
2015
e
2016
p
2017
p
ECOWAS WAEMU Côte d'Ivoire Nigeria

88 © European Investment Bank, November 2016
Table 4.1.: West Africa Indicators in 2015 (selected countries)
Population (in millions)
Real GDP (in USD billions)
GDP PPP per capita (USD)
Benin 11 8.5 2 113
Burkina Faso 18 11 1 723
Côte d’Ivoire 24 31.2 3 316
Ghana 27 36 4 266
Guinea-Bissau 2 1 1 508
Guinea 12 6.7 1 214
Mali 16 13 2 199
Niger 18 7.1 1 080
Nigeria 179 490 6 108
Senegal 15 13.7 2 451
Togo 7.3 4.2 1 483
Source: IMF
4.1.1.C. DECLINE IN RAW MATERIAL PRICES: MIXED IMPACT ON THE PUBLIC ACCOUNTS
DEPENDING ON THE COUNTRY
The sustained drop in the price of raw materials and oil since mid-2014 has had a mixed impact on West African countries. Overall, the WAEMU countries were able to reduce their energy bill and improve their export revenue, with cocoa and peanut prices remaining buoyant. The budgetary situation of Nigeria – and to a lesser extent, Ghana – deteriorated as oil revenue decreased. Overall, the region's current trade account fell from 0.7% of GDP in 2013 to a deficit of -3.7% in 2015.

Banking in sub-Saharan Africa: Recent Trends and Digital Financial Inclusion
© European Investment Bank, November 2016 89
Figure 4.2.: Public Accounts within ECOWAS (as a % of GDP)
Source: Economic Community of West African States (ECOWAS)
4.1.2. KEY BANKING SECTOR TRENDS WITHIN WAEMU: GRADUAL INTEGRATION OF NEW
TECHNOLOGIES FOR SUSTAINED BUSINESS GROWTH
4.1.2.A. A SECTOR BASED AROUND FIVE BANKING PLAYERS
The number of credit institutions has been growing constantly, reaching 132 at end-2014 compared to 127 in 2013; Côte d’Ivoire was the country that had the most (25). The economic environment has been conducive to the internal expansion of the banking network, which now numbers 2 306 branches, offices and points of sale, with a total of 2 571 ATMs in the eight member countries.
In terms of business, there are 26 banking groups active in WAEMU which together hold nearly 86% of all assets and aggregate net profit. Ecobank (15.3% of total assets) and BMCE BOA (11.9%) are the leading groups, followed by Société Générale (9.4%), ABI (9.4%) and Attijariwafa Bank (7.7%), which points to the successful strategy of pan-African banks – primarily Moroccan in origin – in the region. At 31 December 2014, the Attijariwafa Bank Group posted a pre-tax profit of USD 629 million, followed by Ecobank (USD 395 million) and Banque Centrale Populaire (USD 359 million).
3%
-4,1%
8.4
28.1
20.2
-10
-5
0
5
10
15
20
25
30
2004
-200
8
2009
2010
2011
2012
2013
2014
2015
2016
2017
Budget balance (% of GDP) Current balance (% of GDP) Public debt (% of GDP)

90 © European Investment Bank, November 2016
Table 4.2.: Leading Banking Groups in WAEMU at End-2014
Number of branches Market share Counters ATMs*
Ecobank 8 15.3% 259 547
BMCE BOA 8 11.9% 213 248
Société Générale 4 9.4% 144 210
Atlantic Business International (ABI) 7
9.4%
183 190
Attijariwafa Bank 7 7.7% 244 235
BNP Paribas 4 4.9% 99 160
Diamond Bank 4 3.9% 38 38
Oragroup 10 3.7% 71 65
United Bank for Africa (UBA) 4
3 63 88
Source: WAEMU Banking Commission Note: * Automated teller machines
4.1.2.B. BALANCE SHEET ANALYSIS: INCREASED BANKING PENETRATION RATES LINKED
TO GROWTH IN RESOURCES AND ASSETS
Despite WAEMU's banking activity being one of the least dynamic in sub-Saharan Africa, it has continued to grow over the years. Of the 132 banks in the zone, 121 came under the umbrella of WAEMU’s financial analysis. The aggregate balance sheet total increased by over 18% in 2014 compared to 2013. These banks’ total assets amounted to CFAF 23.734 trillion (USD 43.9 billion4) in 2014. This trend was very prominent in Mali (+27.7%), Côte d’Ivoire (+21.6%) and Niger (+17.8%).
Net bank assets grew by more than 19% in 2014 to CFAF 19.76 trillion (USD 36.5 billion). Outstanding loans to bank customers accounted for more than 65% of this item and grew by over 15% to CFAF 12.905 trillion (USD 23.8 billion). All business sectors in the WAEMU zone benefited from the increase in lending, especially the mining, energy and tertiary sectors, while retail, catering and hotel-related business accounted for more than 30% of total commitments in 2014.
4 According to the exchange rate applicable at 31/12/2014, CFAF 1 = USD 0.0018.

Banking in sub-Saharan Africa: Recent Trends and Digital Financial Inclusion
© European Investment Bank, November 2016 91
Aggregate revenue grew by 16% to CFAF 18.924 trillion (USD 35 billion) in 2014. Accounting for over 83% of the total, customer deposits amounted to CFAF 15.885 trillion (USD 29.4 billion) in 2014.
Figure 4.3.: WAEMU – Bank Penetration
Source: WAEMU Banking Commission
4.1.2.C. STRUCTURAL BALANCE SOUGHT IN TERMS OF APPLICATION AND SOURCE OF
FUNDS
BCEAO – the Central Bank of West African States – has not changed its key interest rates since 2013. The minimum bid rate for tender operations in respect of liquidity injections is thus fixed at 2.5% whilst the interest rate for the marginal lending window is 3.5%. At the same time, and owing to the regulatory requirements of the Central Bank – with the standard required for the ratio for the coverage of medium and long-term application of funds by long-term sources of funds fixed at 50% – short-term loans continue to account for the lion's share of outstanding loans. However, the increase of the share of medium-term loans from 34% in 2009 to 37% in 2014 suggests a bigger role for banking intermediation and greater support for the productive sectors of the region’s economies. The structure of sources of funds shows that the breakdown between demand deposits and term deposits is balanced.
35%
49%
26%
33%
20%
27%
0%
10%
20%
30%
40%
50%
60%
2009 2010 2011 2012 2013 2014e
Assets/GDP Deposits/GDP Loans/GDP

92 © European Investment Bank, November 2016
Figure 4.4.: WAEMU – Structure of Lending to the Economy
Structure of lending in 2009
Structure of lending in 2014
Source: WAEMU Banking Commission
4.1.2.D. ANALYSIS OF RESULTS: BANKING SECTOR MORE PROFITABLE
In 2014, NBI (net banking income) totalled CFAF 1.35 trillion (USD 2.4 billion) compared to CFAF 1.201 trillion (USD 2.2 billion) in 2013, chiefly driven by the rise in customer loans. As a result, operating profit increased by more than 21% over the same period. Net profit on banking activity in WAEMU amounted to CFAF 270 billion (USD 500 million) in 2014, up 43% compared to the previous year.
WAEMU's banking sector thus generated a return on equity (ROE) after tax of some 12.8% in 2014 versus 10.1% in 2013. This positive trend was mainly driven by the region's strong economic growth combined with the rise in customer loans and the fact that overheads increased at a slower pace (+8.7% compared to 2013 according to the Bank of France). The downward trend observed between 2011 and 2012 was attributable to measures implemented by the banks to restructure non-performing loans.
54% 34%
4% 8%
Short-term loans Medium-term loansLong-term loans Other
52% 37%
4% 7%
Short-term loans Medium-term loansLong-term loans Other
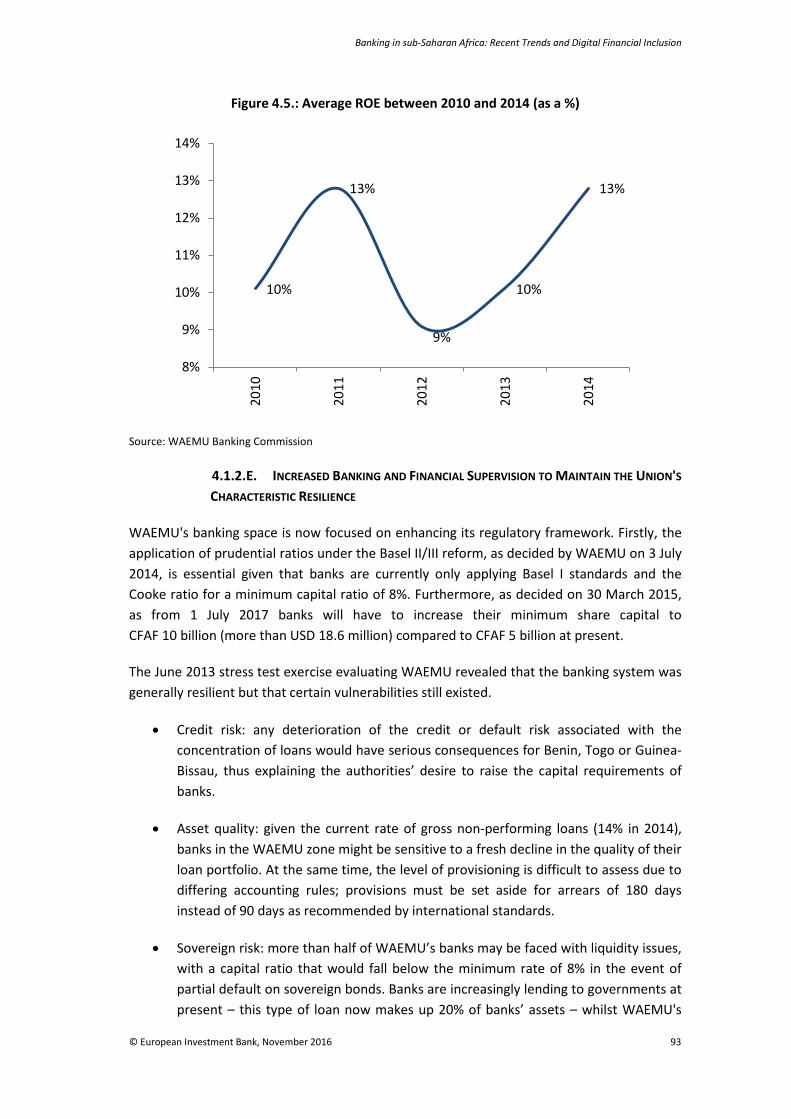
Banking in sub-Saharan Africa: Recent Trends and Digital Financial Inclusion
© European Investment Bank, November 2016 93
Figure 4.5.: Average ROE between 2010 and 2014 (as a %)
Source: WAEMU Banking Commission
4.1.2.E. INCREASED BANKING AND FINANCIAL SUPERVISION TO MAINTAIN THE UNION'S
CHARACTERISTIC RESILIENCE
WAEMU's banking space is now focused on enhancing its regulatory framework. Firstly, the application of prudential ratios under the Basel II/III reform, as decided by WAEMU on 3 July 2014, is essential given that banks are currently only applying Basel I standards and the Cooke ratio for a minimum capital ratio of 8%. Furthermore, as decided on 30 March 2015, as from 1 July 2017 banks will have to increase their minimum share capital to CFAF 10 billion (more than USD 18.6 million) compared to CFAF 5 billion at present.
The June 2013 stress test exercise evaluating WAEMU revealed that the banking system was generally resilient but that certain vulnerabilities still existed.
• Credit risk: any deterioration of the credit or default risk associated with the concentration of loans would have serious consequences for Benin, Togo or Guinea-Bissau, thus explaining the authorities’ desire to raise the capital requirements of banks.
• Asset quality: given the current rate of gross non-performing loans (14% in 2014), banks in the WAEMU zone might be sensitive to a fresh decline in the quality of their loan portfolio. At the same time, the level of provisioning is difficult to assess due to differing accounting rules; provisions must be set aside for arrears of 180 days instead of 90 days as recommended by international standards.
• Sovereign risk: more than half of WAEMU’s banks may be faced with liquidity issues, with a capital ratio that would fall below the minimum rate of 8% in the event of partial default on sovereign bonds. Banks are increasingly lending to governments at present – this type of loan now makes up 20% of banks’ assets – whilst WAEMU's
10%
13%
9%
10%
13%
8%
9%
10%
11%
12%
13%
14%
2010
2011
2012
2013
2014

94 © European Investment Bank, November 2016
injections of short-term liquidity are rising, accounting for 9% of liabilities according to the Central Bank's report. Furthermore, the average volume of interbank operations remains relatively low, representing around 6% of the average amount of WAEMU's injections of liquidity.
• The money market was expected to receive a boost with the November 2014 launch of the West African Monetary Union's Automated Securities and Liquidity Management System (SAGETIL-UMOA). Developed especially to increase the purchase and sale of government securities on the secondary market, it will help to ease the pressure on banks’ balance sheets. Treasury bills – amounting to CFAF 1.4667 trillion in 2014, i.e. 48% of gross issuances of government securities – are mostly purchased by commercial banks, which hold them until maturity.
4.1.2.F. A CHALLENGE LINKED TO FINANCIAL INCLUSION
Overall, WAEMU countries are lagging behind in terms of basic banking infrastructure and points of access to banking services (low density of ATMs, not enough branches). Consequently, according to the Bank of France the proportion of adults that have a bank account with a formal institution remains low (12.6%).
The financial authorities, with the support of the Central Bank, are adding to the number of initiatives aimed at increasing this figure: on the demand side with lower bank charges and greater consumer protection and on the supply side via support for the development of new technologies.
Figure 4.6.: Banking Penetration Rates Worldwide in 2014 (as a %)
Source: Bank of France
0%
20%
40%
60%
80%
100%
WAE
MU
Mid
dle
East
Sub-
Saha
ran
Afric
a
Sout
h As
ia
Latin
Am
eric
a
Euro
pe &
Cen
tral
Asia
East
Asia
OEC
D

Banking in sub-Saharan Africa: Recent Trends and Digital Financial Inclusion
© European Investment Bank, November 2016 95
4.1.2.G. AN AREA CONDUCIVE TO THE DEVELOPMENT OF NEW TECHNOLOGIES
Following its rollout in Senegal and Côte d’Ivoire in 2009 and thanks to a high mobile telephony penetration rate across the West Africa region – around 44% in 2014 according to the African Development Bank – mobile banking provides a genuine opportunity to increase banking penetration rates among financially excluded populations.
To promote these innovations, BCEAO has authorised the bank model of electronic money issuance within WAEMU and the non-bank model of electronic money institutions (EMIs)5 – Orange Money, Tigo Cash, etc.
Accordingly, the issuance of electronic money has been a huge success since 2010. Currently, two major categories of financial services are deployed via this channel, accounting for daily transactions worth CFAF 10.3 billion (nearly USD 19 million) in 2014 alone:
• Paper money – deposits, withdrawals, etc.;
• Services using electronic money – phone credits, paying bills, making transfers.
Figure 4.7.: WAEMU – Mobile Financial Services in Value Terms (in CFAF billions)
Source: BCEAO
According to the World Bank, in 2014 over 24% of adults in Côte d’Ivoire and 11.6% in Mali had a mobile money account, compared to an average of 2% worldwide. BCEAO also
5 According to BCEAO, “an electronic money institution is an enterprise or any other legal entity authorised to issue means of payment in the form of electronic money and whose activities are limited to issuing electronic money, making electronic money available to the public and managing electronic money”.
809 640
27 15 61 161 70
1663 1435
69 45 231 335
50 0
400
800
1200
1600
2000
Cash
dep
osits
Cash
with
draw
als
Call
time
Mon
ey tr
ansf
ers
Paym
ents
Savi
ngs
Oth
er
2013 2014

96 © European Investment Bank, November 2016
estimates the number of users in WAEMU countries at over 20 million, of whom 70% are essentially located in Côte d’Ivoire, which along with Burkina Faso and Mali accounted for more than 91% of the total value of transactions in WAEMU in 2014.
Figure 4.8.: Breakdown of the Volume of Mobile Banking Transactions in WAEMU
Source: BCEAO
4.1.2.H. MANY PLAYERS ARE EXPERIENCING GROWTH IN MOBILE BANKING
Partnerships between telephone operators and banks are now the norm on the market, with financial institutions having a better knowledge of what is at stake financially. This is the case, in particular, for the region’s most popular service – Orange Money – which counts over 35% of all subscribers following its partnership with BNP Paribas in Côte d’Ivoire, Mali and Senegal and with Bank of Africa in Niger.
Meanwhile, on launching in Mali in October 2014, money transfer company LemonWay formed a partnership with BIM (Banque Internationale du Mali) which has been hugely successful. Right now, the temptation for banks is to move into this sector by acquiring technological enterprises as there is currently a lack of adequate regulations and/or supervision for these services.
These partnerships would initially be an opportunity to strengthen financial integration. Effectively, only banks currently have the financial capacity to overcome the obstacles holding back the development of mobile banking in the sub-region – high cost of minor transactions, limited diversification of services offered, interoperability issues, rising number of payment arrears, etc. – and to continue to invest in a market that is still in its infancy.
Côte d'Ivoire 53%
Burkina Faso 13%
Benin 1%
Togo 0%
Senegal 7%
Niger 6%
Mali 20%
Guinea-Bissau 0%

Banking in sub-Saharan Africa: Recent Trends and Digital Financial Inclusion
© European Investment Bank, November 2016 97
Figure 4.9.: Number of Mobile Financial Services Players
Source: BCEAO
THE OUTLOOK FOR INCREASED DIGITALISATION OF FINANCIAL SERVICES IS BRIGHT
The favourable trend in terms of the legal framework (increased supervision by BCEAO, market flexibility, transition towards the Basel II/III Accords, increased number of government digital programmes) basically suggests that there will be:
• an improvement in banks’ solvency;
• a gradual increase in the number of banks;
• an increase in banking activity and lending to the economy. The rate of non-performing loans may remain constant, however, due to the limited diversification of the economies of the countries in the region;
• an increase in banking penetration rates thanks to the rapid expansion of new technologies.
Speaking of which, digitalisation appears to be a key factor in the growth of the banking sector across the continent – an African mobile payments market that is expected to reach a value of USD 1.5 billion in 20196. In addition to this, there would be other sources of revenue as the uses for mobile banking are set to become more sophisticated via, inter alia, the development of multi-sectoral insurance, savings and especially real-time credit products.
To this end, FinTech companies7, which initially thought that they would replace the conventional banking model, are now positioned as partners – in Africa at least – via bank
6 According to the figures provided by Boston Consulting Group. 7 FinTechs are innovative start-ups that use technology to offer alternative solutions to financial and banking services. Spearheading this trend, groups such as Google, Apple, Facebook and Amazon – GAFA – are targeting Africa with the aim of moving in on the traditional territory of banks.
3
8
5
26
1
0 5 10 15 20 25 30
Electronic money institutions
Banks/operators
Microfinance institutions
2014
2013

98 © European Investment Bank, November 2016
disintermediation, which can take a number of forms – financing activities, virtual currencies, payment systems, credit, savings, etc.
Among other innovations, the solutions using social networks dominated by the continuing innovation of Google, Apple, Facebook and Amazon (GAFA), using contactless technologies (Near Field Communication (NFC), Near Sound Data Transfer (NSDT)) or offering virtual agents for better support, continue to be sources of opportunity for Western Africa where the legal framework is less stringent.
Ultimately, the region is seeing a strengthening of partnerships between banks and telecommunications operators giving rise to additional competitive advantages, as well as an increase in the number of banking intermediary licences granted to new entrants and other FinTech companies.
4.1.3. NIGERIA: A STRATEGY INVOLVING THE FINANCIAL INCLUSION OF OUTLYING
COMMUNITIES TO OFFSET LOSSES LINKED TO THE OIL SECTOR
4.1.3.A. BANKING SECTOR: NON-PERFORMING LOANS RISING ONCE AGAIN
The Nigerian economy is currently faced with a number of major challenges. As a leading oil power, it is more than ever confronted with a decrease in oil prices, reduced budgetary room for manoeuvre, a deterioration in the terms of trade – with the naira and the country’s monetary reserves falling – and a security crisis in the north of the country. Furthermore, lending to the federal government is rising hand in hand with the deterioration of the situation. Against this backdrop, the “2015 FGN Budget: Transition Budget” was launched with the aim of increasing non-oil revenue and streamlining public expenditure.

Banking in sub-Saharan Africa: Recent Trends and Digital Financial Inclusion
© European Investment Bank, November 2016 99
Figure 4.10.: Lending to the Economy (in NGN billions)
Source: Central Bank of Nigeria (CBN)
Another effect of the fall in hydrocarbon prices was that the rate of non-performing loans rose from 3% in 2014 to 5% in 2015. The oil and gas sector, the main activity financed by Nigeria’s banking sector, accounted for USD 17.2 billion or 25% of total lending at end-2015.
Figure 4.11.: Breakdown of Outstanding Loans to the Industrial and Agricultural Sectors in 2014-2015 (% of total lending)
Source: CBN
Loan financing of the private sector is low. Accounting for nearly 20% of GDP, it nevertheless represents the lion's share of commercial banks’ business. Combined with the low
-2,000
-1,000
-
1,000
2,000
3,000
4,000
-
5,000
10,000
15,000
20,000
25,000
Dec. 2013 Jan. 2014 Dec. 2014 Jan. 2015 Dec. 2015
in N
GN b
illio
ns
in N
GN b
illio
ns
Outstanding loans to the private sectorNet domestic creditOutstanding loans to the federal government
Agriculture 4%
3%
Manufacturing 13%
13%
Hydrocarbons 24%
26%
Electricity 3%
4% 3%
5%
0%
5%
10%
15%
20%
25%
30%
2014 2015
Non-performing loans

100 © European Investment Bank, November 2016
percentage of deposits, this illustrates the limited participation of commercial banks in financing economic activity, with the hydrocarbons sector being chiefly funded by external sources.
4.1.3.B. NEW TECHNOLOGIES, A VEHICLE OF FINANCIAL INCLUSION IN NIGERIA
Following the banking crisis in 2009 which caused banks’ solvency to deteriorate – the ratio of regulatory capital to risk-weighted assets fell from 20% in 2008 to 1% in 2010 – the recapitalisation of Nigeria's banks enabled the banking sector to restore a certain level of solvency, albeit centred around five players.
Furthermore, whilst the ratio of deposits to GDP remains low at 14%, access to banking services is improving in qualitative terms with greater inclusion of outlying communities.
Figure 4.12.: Private Sector Lending and Deposits (as a % of GDP)
Source: CBN Note: *The data for 2015 are an estimate and present an incomplete series. The drop in lending in rural areas may therefore be lower than expected.
Furthermore, whilst the ratio of deposits to GDP remains low at 14%, access to banking services is improving in qualitative terms with greater inclusion of outlying communities.
Indeed, mindful of the importance of new technologies and their role in developing financial inclusion, CBN is starting to benefit from the Nigerian population's high level of access to mobile phones – with teledensity of 106% in 2016. In response to the 2020 National Strategy
37%
20%
29%
14%
0%
5%
10%
15%
20%
25%
30%
35%
40%
2009
2010
2011
2012
2013
2014
2015
e*
Loans (rural areas) Deposits (rural areas)
Loans (total) Deposits (total)

Banking in sub-Saharan Africa: Recent Trends and Digital Financial Inclusion
© European Investment Bank, November 2016 101
for Financial Inclusion, the first “e-wallets”8 initiative for farmers was rolled out, serving to provide methods of bank payment to rural populations.
In quantitative terms, in order to assess the progress achieved, according to the latest Enhancing Financial Innovation & Access (EFINA) analysis 52% of Nigeria’s population was either excluded from the banking system in 2015 or had access via informal networks, compared to more than 63% in 2010.
Figure 4.13.: Access to the Financial Sector (% of total)
2010
2015
Source: EFINA
4.1.4. GHANA: TOWARDS RAPID EXPANSION OF NEW TECHNOLOGIES TO OFFSET THE
UNCERTAINTIES OF THE FINANCIAL SECTOR
4.1.4.A. GHANA'S BANKING SECTOR: EASING OF LENDING CONDITIONS
Ghana’s banking sector is being affected by the current international economic climate, which is undermining the country's economic performance: large currency depreciation, ongoing energy crisis, aggravation of macroeconomic imbalances and poor performance of the oil sector. The rate of GDP growth was 3.5% in 2015 compared to 4% in 2014 and 7.3% in 2013, with government debt increasing.
The regulatory role played by BoG – Bank of Ghana – appears vital. The key interest rate has risen – from 18% at the beginning of 2015 to 26% at present – at a time when the Ghanaian cedi has shed nearly 51% of its value against the US dollar since 2013 and with average inflation in 2015 standing at 17%.
8 The concept of “e-wallets” is based on access to a digital platform that is accessible via mobile phone, so enabling users to carry out a variety of purchase and sale transactions remotely.
Formal financial
sector 30%
Formal access
6% Informal access 18%
Excluded from the financial system
46%
Formal financial sector 36%
Formal access 12%
Informal access 12%
Excluded from the financial system
40%

102 © European Investment Bank, November 2016
Against that backdrop, the banking sector is facing stagnant lending volumes and profitability and an increase in non-performing loans.
More specifically, over the period from January 2013 to September 2015, and taking into account a non-performing loans ratio of 11% in 2014, the banks were very prudent overall with total lending of GHS 28 billion (nearly USD 7.4 billion).
Since June 2015, however, the situation has eased somewhat. Encouraged by a brighter economic and budgetary outlook and monetary stabilisation – exchange rate and inflation – the banking sector has reduced rates for the riskiest investments and limited collateral requirements although there has not been any real growth in lending as yet. On the other hand, deposits have continued to grow to more than GHS 35 billion (nearly USD 9.3 billion).
Table 4.3.: Simplified Balance Sheet of Ghana’s Banking Sector
In USD millions (exchange rate: GHS 1 = USD 0.266)
Sep. 2013 Sep. 2014 Sep. 2015
Total assets 9 014 12 710 15 210
Foreign assets 866 1 306 1 312
Domestic assets 8 147 11 404 13 898
Capital expenditure 2 598 2 817 2 954
Advances (gross) 4 201 6 327 7 635
Other assets 347 484 760
Fixed assets 233 350 516
Total liabilities 9 014 12 710 15 210
Total deposits 5 600 7 451 9 383
In foreign currency 1 525 2 472 3 032
Total borrowings 1 412 2 418 2 499
Foreign liabilities 909 1 669 1 167
Domestic liabilities 6 830 9 199 11 715
Other liabilities 732 1 002 1 037
Paid-up capital 589 690 766
Funds to shareholders 1 270 1 805 2 291
Source: BoG
4.1.4.B. USING NEW TECHNOLOGIES TO DIVERSIFY THE CUSTOMER BASE
Although still higher than in 2010, the profitability of Ghana's banking sector fell over the last year. The sector is trying to add to its customer base, which has been affected by competition from telephony operators and microfinance institutions. Consequently,

Banking in sub-Saharan Africa: Recent Trends and Digital Financial Inclusion
© European Investment Bank, November 2016 103
partnership operations and acquisitions have taken place, as illustrated by the purchase of the microfinance operator ProCredit Ghana by Fidelity Bank in 2014.
Figure 4.14.: Profitability Indicators of Ghana's Banking Sector (as a %)
Source: BoG
At the same time, the country's relatively developed financial education and high mobile phone penetration – over 4 million mobile phone accounts in 2014 – also provide opportunities for the adoption of digitalisation and new technologies in banking services.
4.2. Key Banking Sector Trends in Central Africa
4.2.1. MACROECONOMIC CONTEXT: GROWTH LOWER AGAINST THE BACKDROP OF A FALL IN
PUBLIC INVESTMENT
CEMAC's rate of growth fell to 1.6% in 2015 compared to 4.9% in 2014 according to the IMF, a lacklustre performance attributable to the decrease in public investment and the fall in oil production. Consequently, and for the first time in the past ten years, the region's money supply decreased and lending to the economy fell.
2015's budgetary and current deficits increased to 6% and 9% of GDP respectively owing to the 32% drop in oil export revenue.
In 2016, the rate of economic growth in the region is set to be 1.9% whilst the economy is expected to become more dynamic as from 2017 with annual growth of 3.5% until 2021 thanks in particular to anticipated fiscal consolidation. This improvement remains dependent
16% 9% 7%
49% 50%
14% 19%
4% 5%
20% 27%
0%
10%
20%
30%
40%
50%
60%
Sep. 2010 Sep. 2011 Sep. 2012 Sep. 2013 Sep. 2014 Sep. 2015
Gross yield Average interest margin to total assets
Average interest margin to gross income Profitability ratio
ROA before tax ROE after tax

104 © European Investment Bank, November 2016
on two factors: stabilisation of the security situation in the Lake Chad Basin and the recovery of oil prices.
4.2.2. OVERVIEW OF THE BANKING SECTOR
4.2.2.A. A DIVERSE AND HIGHLY CONCENTRATED BANKING LANDSCAPE
At end-June 2014, CEMAC's banking system comprised around 50 active banks – 13 in Cameroon, four in the Central African Republic, ten in Congo, ten in Gabon, five in Equatorial Guinea and eight in Chad. Commercial banks, and in some countries large microfinance institutions, dominate the CEMAC zone’s financial sector with 90% of total assets.
The region’s banking landscape remains diverse and highly concentrated: the three leading banks in each country account for more than 70% of assets. In parallel, foreign banks manage almost half of all assets. At the same time, public banks have considerably expanded in the CEMAC zone9, particularly in Equatorial Guinea and Cameroon, increasing from two in 2006 to 11 in 2014 and accounting for nearly 11% of assets in the sector that year compared to 3.6% in 2005.
Furthermore, the region’s financial depth has improved substantially in recent years. CEMAC's banking assets, including microfinance assets, accounted for around 27% of the zone's GDP at end-June 2014, compared to 15.7% in 2004.
9 There are also very large government stakes in the region’s banks, particularly in Equatorial Guinea (a direct or indirect stake in the capital of all of the country's banks), Cameroon (stakes in six banks), Gabon, the Republic of the Congo (five banks) and Chad (four).

Banking in sub-Saharan Africa: Recent Trends and Digital Financial Inclusion
© European Investment Bank, November 2016 105
Table 4.4.: Structure of the Banking System in the CEMAC Zone at End-June 2014
Banks Number of institutions
Total assets (in EUR billions)
Percentage of total financial sector assets
As a %
of GDP
Banks 50 18.0 90 24
Private 39 16.1 81 22 Public 11 1.9 10 2 Domestic 18 8.2 41 11 Foreign 32 9.8 49 13 Cameroon 13 6.0 30 8 Central African Republic
4 0.3 1 0
Chad 8 1.4 7 2 Congo 10 3.1 15 4 Equatorial Guinea 5 3.1 16 4 Gabon 10 4.2 21 6 NBFI10 8 0.8 4 1 MFIs11 777 1.2 6.2 2
Sources: COBAC (Central African Banking Commission), IMF
4.2.2.B. IMPROVING BALANCE SHEET SITUATION
According to the latest statistics issued by the Central African Banking Commission (COBAC)12, the aggregate balance sheet totals of the CEMAC zone's banks amounted to CFAF 12.571 trillion (USD 21.12 billion) at end-March 2015, up 8.62% compared to the figure at end-March 2014.
Similarly, deposits collected were 6.5% higher than the previous year, totalling CFAF 9.944 trillion (USD 16.7 billion), i.e. 79.1% of the balance sheet total. Deposits improved in all countries except Gabon where they fell by CFAF 188 billion (-8.32%).
In keeping with the same trend, gross lending totalled CFAF 7.528 trillion (USD 12.6 billion), up 8.07% compared to March 2014. This upturn was driven, in particular, by the performances of the Cameroon and Chad banking sectors.
Against this backdrop, lending to the private sector as a percentage of GDP, estimated at 10%, continued to grow but is still low compared to the average on the continent (almost 23%) or the average on cross-border and emerging markets (over 35%). Thus, despite lending volume having grown since the middle of the first decade of the millennium, lending
10 Non-Banking Financial Institutions. 11 Microfinance Institutions; Figures at end-September 2013. 12 Introductory statement of the Governor of BEAC and COBAC Chairman on the margins of the 7th annual meeting between the COBAC Chairman and the management of CEMAC credit institutions, Douala, 3 July 2015.

106 © European Investment Bank, November 2016
by banks remains very selective in the region due, in particular, to the concentration of lending to a limited number of sectors and customers13.
Lastly, it should be noted that most loans are being granted in the short and medium term at a time when demand deposits account for the lion’s share of bank resources. At the same time, the ratio of loans to deposits also increased, from 57% in 2010 to 67% in 2013 – which is still very low, reflecting the zone’s structural weaknesses in terms of intermediated financing.
4.2.2.C. BANKS’ EXPOSURE TO THE PUBLIC AND OIL SECTORS IS STILL HIGH
The apparent quality of the CEMAC banks’ portfolio has deteriorated somewhat. Non-performing loans amounted to CFAF 894 billion (USD 1.5 billion) at end-March 2015 compared to CFAF 696 billion one year earlier, accounting for 11.9% and 10% of gross lending respectively.
Against this backdrop, and faced with the current fiscal pressures, the banks’ direct and indirect liabilities vis-à-vis the public sector may constitute a source of risk for the zone's banking sector. In 2015, IMF testing indicated that a 15% rise in non-performing loans, combined with a 25% drop in bank deposits, would be sufficient to make more than half of banks non-compliant with the regulations.
4.2.2.D. THE PRUDENTIAL ASPECT OF THE BANKING SYSTEM COULD BE IMPROVED
According to COBAC, only 24 banks in the CEMAC zone have sufficient net capital to comply with all prudential norms applicable to such capital. The norm concerning minimum capital is the requirement that most banks are deemed to be breaching.
According to the regulator, this situation is attributable to the increase at end-June 2014 of the amount of minimum share capital to CFAF 10 billion for each bank and to CFAF 2 billion for financial institutions.
In response, COBAC invited the management of banks in the COBAC zone to take appropriate measures to bring their establishments back into compliance with the regulations on a sustainable basis in order to safeguard the stability of the region's banking system.
4.2.2.E. PROFITABILITY ERODED BY THE ECONOMIC CLIMATE
After plummeting in 2009, the CEMAC banking sector’s profitability has gradually recovered to levels close to those observed in 2004-05. In 2013, the average return on equity (ROE) even increased to 19.3% compared to 16.9% in 2005.
13 According to the IMF (Evaluation report on the stability of CEMAC's financial system, 2 July 2015), the concentration of assets in the public and hydrocarbons sectors is a source of risk both for CEMAC's financial sector and for the economies of the countries in the region.

Banking in sub-Saharan Africa: Recent Trends and Digital Financial Inclusion
© European Investment Bank, November 2016 107
Nevertheless, the economic downturn sparked by the fall in raw material prices, accompanied by a liquidity squeeze, is likely to impact credit quality to a greater degree and thus weigh heavily on banks’ profitability in the CEMAC zone.
Already in 2015, the aggregate net profit of banks declared as being established in the CEMAC zone fell substantially by 13.4% to CFAF 124.6 billion in comparison with 2014.
4.2.2.F. CHANGES IN LIQUIDITY DEPENDENT ON FLUCTUATIONS IN OIL REVENUE
The banking sector in the CEMAC zone has for a long time been awash with liquidity due, in particular, to demand deposits and government revenue generated by oil wealth. However, the contraction of this revenue has forced governments in the region to turn to bank financing to correct budgetary imbalances14 and to reduce their bank deposits with the BEAC. Loans granted by the banking system to governments in the region accounted for 7.7% of total lending to the economy at end-2014.
Figure 4.15.: Lending to the Economy in the CEMAC Zone (in CFAF billions), of which the Percentage Extended to Governments, 2010-2014
Sources: BEAC, Bank of France
Furthermore, and in order to support economic activity in the countries in the region, since the beginning of the millennium BEAC has continued to revise downwards its key interest rate, the interest rate for tender operations: in July 2015 it was 2.45% compared to 6.3% in 2002.
14 Between the second quarter of 2015 and the second quarter of 2016, the budget deficit of all CEMAC Member States grew from 3.5% to 7.9% of GDP, thus doubling in the space of a year.
3 542.0 4 465.2
5 047.0
6 340.7 6 828.4
7.6% 7.4%
8.3%
6.4%
7.7%
0.06
0.065
0.07
0.075
0.08
0.085
0
2000
4000
6000
8000
2010 2011 2012 2013 2014
Total lending to the economy Lending to governments (as a %)

108 © European Investment Bank, November 2016
Figure 4.16.: BEAC's Interest Rate for Tender Operations, 2002-2015 (as a %)
Sources: BEAC, Bank of France
Against this backdrop, credit institutions in the zone were exposed to the double blow of liquidity impacted by fluctuations in oil revenue and banks in difficulty. In response, BEAC was forced to reduce by 50% the coefficients of these banks’ reserve requirements, which hovered between CFAF 500 billion and 600 billion.
4.2.2.G. ACCESS TO FINANCING IN THE REGION REMAINS UNDERDEVELOPED
The Central African region has one of the world's lowest proportions of adults with a bank account in a formal financial institution, 11.8% in 201415, some distance from the average in sub-Saharan Africa (34%). A number of obstacles continue to prevent people from accessing affordable financial services, including in particular the economies’ lack of diversification, the fragility and lack of income and distance from financial institutions16.
Access to financial services in the region differs from country to country, however. Gabon has a relatively high account penetration rate (33%) whereas Cameroon's and Chad's financial penetration rate is only 12%.
15 A Bank of France estimate in its CFA Franc Zone Annual Report 2014 16 In sub-Saharan Africa, distance from financial institutions is the second most common reason, mentioned by 27% of people without a bank account.
6.3 6 5.75 5.5 5.25 5.5
4.75 4.5 4.25
4 3.5 3.25 2.95
2.45
18/1
2/20
02
02/1
2/20
03
20/0
1/20
05
16/0
9/20
05
11/1
2/20
06
03/0
7/20
08
18/1
2/20
08
26/0
3/20
09
02/0
7/20
09
29/0
7/20
10
22/0
7/20
13
31/1
0/20
13
08/0
7/20
14
09/0
7/20
15

Banking in sub-Saharan Africa: Recent Trends and Digital Financial Inclusion
© European Investment Bank, November 2016 109
Figure 4.17.: Bank Account Penetration Rate in Central African Countries (as a %) – 2014
Source: World Bank
4.2.2.H. MOBILE TECHNOLOGY AS A POWERFUL DRIVER OF FINANCIAL INCLUSION IN
THE REGION
According to the World Bank17, mobile technology could significantly boost financial inclusion in sub-Saharan Africa. Especially as over 12% of adults in the region have a mobile phone bank account compared to just 2% worldwide.
In Central Africa, the development of mobile banking is more limited in comparison with other regions in the continent such as East Africa, particularly due to the regulation that forbade credit institutions from issuing electronic money, until 2015 at least. As a result, the rate of penetration of mobile phone bank accounts in countries in the region is still low.
Figure 4.18.: Penetration of Mobile Phone Bank Accounts in Central Africa18 (as a %) – 2014
Source: World Bank
17 World Bank press release: Massive Drop in Number of Unbanked, says New Report, (2014 Findex), 15 April 2015. 18 In particular, the countries covered by the World Bank review.
33
17 17.5
12 12
Gabon Republic ofCongo
DRC Cameroon Chad
9.2
6.6 5.8
2 1.8
DRC Gabon Chad Republic ofCongo
Cameroon

110 © European Investment Bank, November 2016
Having said that, as seen across the continent, CEMAC countries have also skipped the fixed internet stage and massively embraced mobile internet. In the long term this presents considerable opportunities for FinTech companies subject, of course, to swifter and bolder regulatory developments and providing offers become more diversified and the technology can be used across borders.
4.2.3. CAMEROON – THE BANKING SITUATION IS SATISFACTORY OVERALL DESPITE THE
INCREASE IN NON-PERFORMING LOANS
4.2.3.A. A BANKING SYSTEM DOMINATED BY PAN-AFRICAN BANKS
Cameroon's banking system is the biggest in the CEMAC zone with around 15 commercial banks, of which nine are subsidiaries of foreign groups. More pan-African banks are now active in the country, including the Nigerian bank Union Bank of Africa (UBA), Ecobank, Banque Atlantique, the Gabonese bank BGFI Bank and the Moroccan bank Attijariwafa Bank–Société Commerciale de Banque Cameroun.
Overall, the sector has been dominated since March 2011 by Afriland First Bank, which is majority-owned by local investors and has around a 20% market share in Cameroon. Furthermore, the Group recently closed its CFAF 15 billion bond issue, designed to support its current plans to expand across the continent.
Faced with difficulties in accessing credit, since July 2015 Cameroon SMEs have had a dedicated SME bank, BCPME – Banque Camerounaise pour les PME. Despite having to deal with certain constraints when it launched – delays with both the injection of public funds and the installation of an automatic processing system – BCPME managed in three months to register 1 000 customer accounts and record mostly demand deposits worth CFAF 2 billion19. It also released almost CFAF 500 million in its maiden loans to around 50 SMEs20.
4.2.3.B. SOUND FUNDAMENTALS DESPITE THE CURRENT ECONOMIC CLIMATE
After recording a 17.5% increase in 2013, the Cameroon banking system’s balance sheet total grew by only 9.2% in 2014, with slower growth in lending (down from 21% to 11.6%) and deposits (down from 15.4% to 8.8%).
In 2015, particularly thanks to strong domestic demand linked to the rise in investment, lending to the economy grew by 17.6% according to the IMF. The proportion of lending to the private sector as a ratio of overall lending is 90%.
19 According to Agnès Ndoumbè Epse Mandeng, Managing Director of BCPME, www.investiraucameroun.com, 4 November 2015. 20 “La Banque camerounaise des PME débloque 500 millions FCFA pour ses premiers crédits aux entreprises”. www.investiraucameroun.com, 18 February 2016.

Banking in sub-Saharan Africa: Recent Trends and Digital Financial Inclusion
© European Investment Bank, November 2016 111
The most recent review by the IMF in 2015 confirmed the solidity and generally healthy condition of banks in Cameroon in spite of an increase in non-performing loans21 from 10.2% in June 2014 to 13.1% one year later.
The Cameroon banking system's credit risk is expected to be reduced thanks, in particular, to the slight improvement in the financial situation of the country's only oil refinery SONARA22; however, the problem concerning three small banks in difficulty has yet to be resolved23.
Table 4.5.: Key Indicators of the Cameroon Banking Sector
2012 2013 2014 AAGR* 12-14 Lending to the economy (in USD billions) 2.71 3.87 3.87 19.6% Private sector deposits (in USD billions) 3.90 4.52 4.92 12.3% Equity (in USD billions) 0.40 0.54 0.59 22.2% Balance sheet total (in USD billions) 5.50 6.46 7.05 13.2% Net operating ratio (as a %) 58.9 57.9 54.7 - Net margin ratio (profit/NBI) (as a %) 11.3 38.3 12.3 - Return on assets (as a %) 0.6 1.5 0.8 - Return on equity (as a %) 25 42.7 21.8 -
Sources: COBAC, IMF Note: (*)AAGR = Average annual growth rate
4.2.3.C. FINANCIAL INCLUSION HAS ROOM FOR IMPROVEMENT
The banking penetration rate in Cameroon remains low (12%) due in particular to the concentration of banking networks in urban and suburban areas and the high cost of banking services with respect to people's earnings.
Microfinance in Cameroon, which officially accounts for 15% of lending by the country's financial sector, is helping to improve the country’s banking penetration rate through the establishment of microfinance institutions (418 at end-2015), including in rural areas.
Against this backdrop, the IMF has encouraged the authorities to promote financial inclusion, specifically by extending the banking network to rural areas and developing mobile financial services. Along these lines, in 2011 the Cameroon Government launched the Guaranteed Minimum Banking Service, designed to provide users with minimum banking services free of charge.
21 The country’s authorities attributed this increase to more rigorous risk management. 22 SONARA had to borrow from local banks to finance its modernisation programme (over USD 200 billion). However, these loans are becoming more and more difficult to pay back because of cash flow problems. 23 According to the IMF, the Cameroon authorities are continuing to examine the different options to help these banks and are trying, in particular, to reach a compromise with their shareholders.

112 © European Investment Bank, November 2016
However, the application of this measure has so far met with a lukewarm response from the country’s banks24. Gabon's National Credit Committee claims that this measure has led to losses for a number of banks, in particular BICEC, NFC-Bank, Banque Atlantique, Société Générale de Banques au Cameroun, Ecobank and Afriland First Bank.
4.2.4. GABON'S BANKING SECTOR FACING NEW CONSTRAINTS
4.2.4.A. A VERY CONCENTRATED SECTOR
Gabon's banking system comprises ten banks, of which five are local banks and five are subsidiaries of foreign groups. The main banks operating in the country are Banque Gabonaise de Développement (BGD), Banque de l’Habitat du Gabon (BHG), Banque Internationale pour le Commerce et l’Industrie du Gabon (BICIG), BGFI Bank Gabon, Citibank, Ecobank Gabon, Orabank Gabon (formerly Financial Bank Gabon), UBA Gabon, Union Gabonaise de Banque (UGB) and POSTBANK which began operating in 2014.
Overall, the sector remains highly concentrated, with three banks (BGFI, BICIG and UGB) holding nearly 75% of total assets. BGFI Bank's local subsidiary alone has a market share of over 50% in both deposits and lending but also in terms of participation in the financing of large infrastructure projects, so confirming its leadership in a market that is relatively open to competition.
4.2.4.B. AN ACTIVITY FACED WITH MULTIPLE CHALLENGES
Gabon’s banking sector, which has long been sustained by the oil business, has been affected by a difficult economic environment resulting from the fall in Brent prices25. Despite a slight increase in customer deposits (+2.5%) and gross customer loans26 (+1.2%), driven in particular by the rise in lending to the government (+43.6%), the balance sheet total contracted by 2.6% at end-2014.
The country’s banking system is also facing a number of other challenges, led by the recent deterioration in the quality of the loan portfolio. In 2014, the ratio of non-performing loans to gross loans was 8.1% versus 4.8% in 2013. In addition, outstanding loans to the private sector, which accounted for 75.3% of total lending, fell by 1.2%.
24 According to a review conducted by the Cameroon Consumers Association in 2012, this measure was not observed by all of the country's banks. 25 According to the IMF, Gabon's financial system is very sensitive to macroeconomic shocks, especially those affecting the oil sector.
26 The financial system's ratio of gross lending to customer deposits was 83.5% in 2014, i.e. substantially higher than the figure for the CEMAC zone (72.4%).

Banking in sub-Saharan Africa: Recent Trends and Digital Financial Inclusion
© European Investment Bank, November 2016 113
Table 4.6.: Key Indicators of Gabon's Banking Sector
2012 2013 2014 AAGR* 12-14 Lending to the economy (in USD billions) 1.84 2.32 2.05 5.3% Private sector deposits (in USD billions) 3.03 3.15 3.11 1.4% Equity (in USD billions) 0.43 0.48 0.47 4.5% Balance sheet total (in USD billions) 4.38 4.52 4.40 0.3% Net operating ratio (as a %) 52.7 56.9 58 - Net margin ratio (profit/NBI) (as a %) 20.9 21.6 16.4 - Return on assets (as a %) 23.3 19.6 21.5 - Return on equity (as a %) 1.9 1.6 1.7 -
Sources: COBAC, IMF Note: (*)AAGR = Average annual growth rate
4.2.4.C. GREATER FINANCIAL INCLUSION
Stimulated by the arrival of new financial institutions and new banking services such as mobile banking, Gabon's financial inclusion has improved significantly in recent years. The country's rate of financial inclusion was 33% in 2014, the highest rate in CEMAC and similar to the rates in the rest of sub-Saharan Africa (34%).
In 2014, the Gabon public authorities’ decision to require public sector officials, students, pensioners and non-permanent employees to open accounts in local banks contributed hugely to the progress made recently in the country in terms of financial inclusion.
Despite these advances, access to financial services remains concentrated in a few urban areas and the strengthening of the sector as measured by the ratios of both deposits and lending to GDP could be improved.

114 © European Investment Bank, November 2016
References:
African Development Bank. Le système bancaire en Afrique : principaux faits et défis [The banking system in Africa: key facts and challenges], Volume 6, Number 5, 2015
African Development Bank. Observatoire de l’Afrique de l’Ouest [Analysis of West Africa], April 2015
Central Bank of West African States. Annual Report, 2014
Central Bank of West African States. Annual Report, 2013
Central Bank of West African States. Annual Report of the Banking Commission, 2014
Central Bank of West African States. Annual Report of the Banking Commission, 2013
Bank of Central African States (BEAC). Monetary Policy Committee: Press release, April 2016.
Introductory statement of the Governor of BEAC and COBAC Chairman on the margins of the 7th annual meeting between the COBAC Chairman and the management of CEMAC credit institutions, Douala, 3 July 2015
Bank of France. CFA franc zone – Annual Report, 2014
Bank of France. Annual report on the CFA franc zone, monetary policy and aggregates in Africa's issuing zones: The challenges of financial inclusion in the CFA franc zone, 2014.
Bank of France. Analysis of the economic and financial situation in African countries. The CFA franc zone: analysis of the economic and financial situation in the WAEMU zone, 2014
Bank of France. CFA franc zone – Annual Report: economic monographs of Cameroon and Gabon, 2014
Bank of France. Annual report on the CFA franc zone, monetary policy and aggregates in Africa's issuing zones. Excess bank liquidity in CEMAC countries, 2014
Bank of Ghana. Financial Stability Report, November 2015
Central Bank of Nigeria. Financial inclusion in Nigeria: issues and challenges, August 2013
Enhancing Financial Innovation & Access. Enhancing financial inclusion in Nigeria, Quarterly Review, April-June 2016
“Finance for All: Financial Inclusion in Central Africa”. Regional conference hosted by BEAC and the IMF, Brazzaville (Congo), 23 March 2015

Banking in sub-Saharan Africa: Recent Trends and Digital Financial Inclusion
© European Investment Bank, November 2016 115
IMF-Cameroon. 2015 Article IV Consultation, March 2016
IMF-Gabon. 2015 Article IV Consultation, March 2016
IMF. World Economic Outlook, April 2016
IMF. Central African Economic and Monetary Community (CEMAC). Financial System Stability Assessment, April 2016
IMF. Ghana, 2014 Article IV Consultation - Staff Report; Press Release; and Statement by the Executive Director for Ghana, 30 May 2014
BGFI Bank Group. Annual Report 2015, Analysis of performance
World Bank Group press release: Massive Drop in Number of Unbanked, says New Report, (2014 Findex), 15 April 2015.
World Bank Group. The Little Data Book on Financial Inclusion, 2015
World Bank Group. The Global Findex Database 2014

116 © European Investment Bank, November 2016

Banking in sub-Saharan Africa: Recent Trends and Digital Financial Inclusion
© European Investment Bank, November 2016 117
5. Meeting Africa’s Long-Term Housing Finance Needs: A Journey of a Thousand Miles?
ISSA FAYE AND ZEKEBWELIWAI GEH1,2
Executive summary
• Africa faces a continent-wide affordable housing deficit of around 51 million units, according to a conservative estimate based on conservative assumptions, with 16 countries having a deficit greater than 1 million units.3 The surging demand for affordable housing, fuelled by the rapid urbanisation process and demographic growth, has effectively driven up prices and pushed decent housing out of reach for the majority of those in need.
• Lack of access to long-term funds is a major constraint to the development of housing finance4 in particular, and the housing market in general. Banks across the continent are reluctant to provide housing loans due to the real and perceived sector risks, as well as the maturity mismatch between their short-term deposits and the long-term nature of housing loans. The lack of secondary markets and adequate financing instruments makes it challenging to meet the financing needs for housing.
• Attracting long-term capital into Africa’s property market could look like a journey of a thousand miles as it requires the efficient functioning of many interrelated components: a favourable macroeconomic environment, enabling legal and regulatory frameworks, formal land titling to enhance security of tenure, enforcement of property rights and long-term contractual maturities, and well-functioning capital markets, among others. However, if we do not take that first step, the journey will always remain one of a thousand miles.
• Financial deepening and broadening initiatives underway have strong potential to
accelerate Africa’s quest to close its housing finance gap. Alternative long-term capital sources such as private equity for affordable housing development, real estate investment trusts, mortgage covered bonds and mortgage refinancing companies are promising emerging institutions and instruments that should be tapped to plug the continent’s long-term housing finance gap.
1 Research Department, African Development Bank (AfDB). 2 The views expressed are those of the authors and do not necessarily reflect the views of the AfDB. This paper draws heavily on the analysis contained in the “Housing Market Dynamics in Africa” manuscript, forthcoming, January 2017. 3 See Housing Market Dynamics in Africa, forthcoming, January 2017. 4 For the purpose of this paper, we define housing finance as a loan from a bank or another financial institution to purchase a house or land or to construct a house. In a nutshell, our definition of housing finance looks at the entire housing value chain.

118 © European Investment Bank, November 2016
5.1. Introduction
Africa’s population and cities are experiencing substantial growth. By 2060, the continent will be home to an estimated 2.4 billion people5. Over the next 15 years, African cities are expected to house 219 million people. This translates to at least 40 000 new urban residents every day6. Moreover, Africa’s affordable housing deficit is conservatively estimated at 51 million housing units. Few people will disagree with the fact that the continent is on the brink of a housing crisis. Addressing the affordable housing backlog will require at least USD 2 trillion over 10 years.
The housing sector has a widespread impact on the economy. The sector can be a driver of sustainable and inclusive growth due to its multiplier effect on the broader economy in terms of job creation, taxes, income generation and GDP contribution. In Morocco, for example, the housing sector contributed 6.6% of GDP in 2014, while contributing about 9% to job creation. In Ethiopia, the housing sector created 534 000 new jobs from 2005 to 2014, following the launch of the government’s Integrated Housing Development Programme.
Our ongoing analysis shows that where families lack decent housing, health outcomes are poorer, children fare less well in school and tend to drop out earlier, unemployment and underemployment rates are higher, and financial inclusion is lower.
Harnessing Africa’s demographic boom and the potential of the housing sector presents both an opportunity and a challenge for Africa’s housing market development. The opportunity emerges, on the demand side, from the vast swathes of urban households in pressing need of affordable housing, which creates new markets for financial service providers and real estate developers. However, the low and irregular income stream of many African families poses a constraint to financial service providers. On the supply side, inexistent and underdeveloped housing finance markets remain a major constraint as highlighted by the lack of equity for developers, and the inadequate instruments tailored to the development of housing finance.
The lack of secondary mortgage markets: few mortgage refinancing facilities (operational only in the WAEMU7 region, Tanzania, Nigeria, Algeria and Egypt) and shallow capital markets including bond markets (highly driven by treasury bills) further compound the problem of inadequate financing for housing. Most importantly, there is the tendency to overlook the fact that housing development is synonymous with large and long-term investments that require long-term financing. In many African countries, the lack of long-term funding is a reflection of the failure to tap into the contractual savings industry – pension funds, insurance companies, sovereign wealth funds, and so on. As a consequence, long-term assets, such as mortgage loans, are predominantly financed using short-term liabilities, such as deposits. This results in maturity mismatches, which inherently creates
5 See Faye et al, (2017) 6 Majale et al, 2011. 7 The West African Economic and Monetary Union (WAEMU) member countries are Benin, Burkina Faso, Côte d’Ivoire, Guinea-Bissau, Mali, Niger, Senegal and Togo.

Banking in sub-Saharan Africa: Recent Trends and Digital Financial Inclusion
© European Investment Bank, November 2016 119
liquidity and interest rate risks in the housing market. Nonetheless, there is room for financial innovations geared towards deepening and broadening the housing finance market and increasing households’ access to housing finance products8.
While this paper examines the major constraints inhibiting Africa’s housing finance market development and acknowledges the long-term perspective of lengthening maturities in the housing finance market, it also discusses potential institutions and innovative solutions that could help accelerate change and phase out the dearth of long-term finance needed to address the continent’s housing crisis. It is structured as follows: section 5.2 provides a brief overview of Africa’s housing finance market, section 5.3 discusses the major challenges facing the sector, while section 5.4 examines emerging solutions that could be explored to attract long-term financing into Africa’s housing finance sector. Section 5.5 provides the way forward for public and private sector stakeholders, as well as development partners.
5.2. An Overview of Africa’s Housing Finance Market
Africa’s housing finance market has steadily grown over the past decade. Nevertheless, this growth has been from an extremely low base. With the exception of Morocco, Namibia, South Africa and Tunisia, the depth of the housing finance market as measured by the residential mortgage-debt-to-GDP-ratio is still very shallow (Figure 5.1.). The mortgage-debt-to-GDP ratio is 5.5% in Africa, compared to 9% in the Middle East, 23% in the East Asia and Pacific Region, 44% in Europe and 63% in North America. The penetration of housing finance among households similarly reveals generally low patterns in Africa. In 2014, a meagre 5.2% of African households took out a loan to purchase a home9. In the West African Economic and Monetary Union (WAEMU), for example, just 15 328 housing loans were approved in 2013 to serve an urban population of 36.3 million people10. Moreover, housing loan tenors are extremely short, which implies higher annual payments for debt principal.
8 Ibid 9 Demigurc-Kunt et al, 2015. 10 BCEAO, 2014.
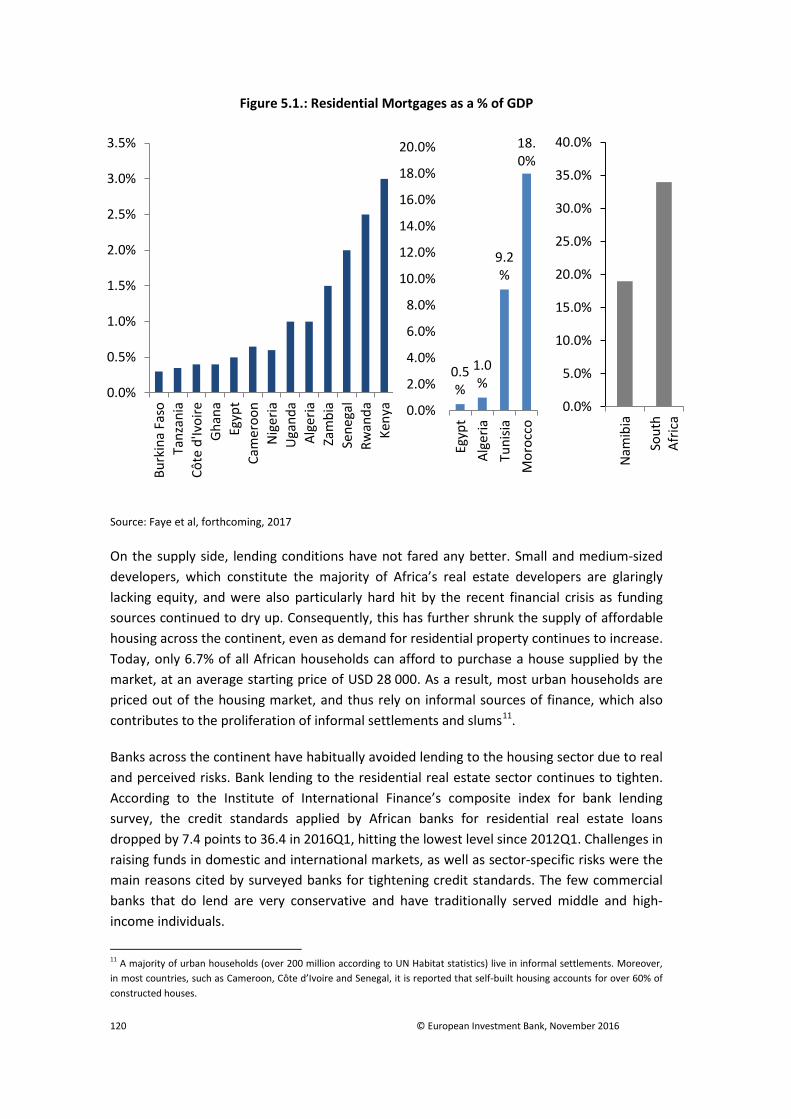
120 © European Investment Bank, November 2016
Figure 5.1.: Residential Mortgages as a % of GDP
Source: Faye et al, forthcoming, 2017
On the supply side, lending conditions have not fared any better. Small and medium-sized developers, which constitute the majority of Africa’s real estate developers are glaringly lacking equity, and were also particularly hard hit by the recent financial crisis as funding sources continued to dry up. Consequently, this has further shrunk the supply of affordable housing across the continent, even as demand for residential property continues to increase. Today, only 6.7% of all African households can afford to purchase a house supplied by the market, at an average starting price of USD 28 000. As a result, most urban households are priced out of the housing market, and thus rely on informal sources of finance, which also contributes to the proliferation of informal settlements and slums11.
Banks across the continent have habitually avoided lending to the housing sector due to real and perceived risks. Bank lending to the residential real estate sector continues to tighten. According to the Institute of International Finance’s composite index for bank lending survey, the credit standards applied by African banks for residential real estate loans dropped by 7.4 points to 36.4 in 2016Q1, hitting the lowest level since 2012Q1. Challenges in raising funds in domestic and international markets, as well as sector-specific risks were the main reasons cited by surveyed banks for tightening credit standards. The few commercial banks that do lend are very conservative and have traditionally served middle and high-income individuals.
11 A majority of urban households (over 200 million according to UN Habitat statistics) live in informal settlements. Moreover, in most countries, such as Cameroon, Côte d’Ivoire and Senegal, it is reported that self-built housing accounts for over 60% of constructed houses.
0.0%
0.5%
1.0%
1.5%
2.0%
2.5%
3.0%
3.5%Bu
rkin
a Fa
soTa
nzan
iaCô
te d
'Ivoi
reGh
ana
Egyp
tCa
mer
oon
Nig
eria
Uga
nda
Alge
riaZa
mbi
aSe
nega
lRw
anda
Keny
a0.5%
1.0%
9.2%
18.0%
0.0%
2.0%
4.0%
6.0%
8.0%
10.0%
12.0%
14.0%
16.0%
18.0%
20.0%
Egyp
tAl
geria
Tuni
siaM
oroc
co
0.0%
5.0%
10.0%
15.0%
20.0%
25.0%
30.0%
35.0%
40.0%
Nam
ibia
Sout
hAf
rica

Banking in sub-Saharan Africa: Recent Trends and Digital Financial Inclusion
© European Investment Bank, November 2016 121
Low-income households who constitute over 50% of the population are regularly shunned. In fact, in most African economies, the housing finance market is segmented based on income levels, with the high- and upper middle-income groups being served by the market. The gap market consists of moderate-income households who, despite their willingness to pay for a home, struggle to find sources of formal housing finance. Low-income households, including those at the bottom of the pyramid which often have irregular income streams, are excluded from formal housing finance markets, and thus rely on informal sources of finance or government social programmes, if there are any. Indeed, high interest rates, low or irregular household income, and most importantly, the lack of access to long-term funds are reasons cited by commercial banks as major housing finance constraints. This is exacerbated by new developments in the global financial market.
Following the financial crisis and the economic downturn recently experienced in Europe and the US, it is evident that the era of progressively cheap money is dwindling. Hence, African governments and lenders will need to place greater emphasis on domestic resource mobilisation by tapping into local sources of long-term finance such as the contractual savings industry12. This includes insurance companies, pension funds and sovereign wealth funds (SWFs), which by their nature are the holders of long-term savings in African economies and are a vital source of long-term resources. Between 2009 and 2014, assets under management (AUM) by African SWFs grew by about 34%, from USD 121 billion in 2009 to USD 162 billion in 2014.13 In 2013, pension funds in just 10 sub-Saharan African countries held over USD 379 billion in AUM14. It should be noted that over 97% of these pension assets are concentrated in South Africa, Nigeria, Namibia, Kenya and Botswana. Nonetheless, pension funds across Africa are growing at a remarkable pace. Between 2008 and 2015, for instance, the Nigerian pension industry grew more than threefold from USD 7 billion to USD 27 billion. A recent study by the consultancy PwC projects that the continent’s pension industry will grow to reach USD 1 098 billion by 2020. On the other hand, the AUM of African insurance companies in 2012 totalled an estimated USD 273 billion, with projections to grow to over USD 378 billion by 2018, equivalent to a 37% increase15. Having the right institutions and economic conditions is vital to ensure that the savings of African economies are effectively and efficiently channelled to finance large ticket investments such as housing development. In this light, more efforts are needed to advance enabling policies and build strong institutions.
5.3. Critical Housing Finance Challenges 16
In what follows, we highlight three critical issues that explain the main impediments to accessing long-term finance needed for housing in Africa: macroeconomic volatility, underdeveloped capital markets, and weak institutional and regulatory frameworks.
12 Ibid 13 For more information, see a working paper by Faye et al., forthcoming, 2016. 14 Making Finance Work For Africa, The Commonwealth Secretariat, and EMPEA 2014. 15 Riscura. http://www.riscura.com/brightafrica/african-insurance-premiums/ accessed on July 19, 2016. 16 Ibid

122 © European Investment Bank, November 2016
5.3.1. MACROECONOMIC VOLATILITY
Strong macroeconomic fundamentals and political stability are crucial for attracting long-term capital. The literature shows a negative relationship between inflation and financial market developments17. High inflation raises doubts about future interest rates and prices. The uncertainty on the real value of future nominal payments in turn discourages long-term financing. The situation in countries such as Zambia and Zimbabwe provides an illustrative example of the impact of macroeconomic instability on interest rates, access to long-term finance and financial market development. In Zambia, for instance, it is clear that the macroeconomic situation has contributed to a situation wherein “mortgage finance is expensive while interest rates are high and range between 14- 17%. Mortgage lenders still face difficulties in terms of accessing wholesale finance, short maturities on available funds, inadequately matched funding for long-term credit, potential losses due to high default rates, high transaction costs, deposit requirements of 10 to 20% and relatively short loan repayment terms of 2-10 years. There is a large cash economy in which 50% of sales are cash sales.”18
In a nutshell, higher inflation rates imply a higher real interest rate, which increases the cost of borrowing. This could discourage borrowers and lenders from entering into long-term contracts and participating in the formal market. Macroeconomic stability is a key component of building sustainable housing finance markets and attracting the requisite long-term finance. In many African countries, the macroeconomic environment has been relatively stable as inflation eases to single digits in recent years (Figure 5.2).
Figure 5.2.: Inflation in Africa, 2003-17
Source: African Development Bank Note: (e) estimates; (p) projections
17 See for example Mozes (1995), Boyd et al (2001) and Rousseau and Wachtel (2002). 18 See CAHF’s Housing Finance in Africa Yearbook 2016.
0
2
4
6
8
10
12
2003
2004
2005
2006
2007
2008
2009
2010
2011
2012
2013
2014
2015
(e)
2016
(p)
2017
(p)
Median Inflation Average Inflation

Banking in sub-Saharan Africa: Recent Trends and Digital Financial Inclusion
© European Investment Bank, November 2016 123
While that trend is encouraging and could contribute in boosting growth in the continent’s finance markets, African governments should not rest on their laurels given that some countries are facing growing inflationary pressures that could jeopardize the development of housing finance. In the past two years, inflationary pressures have been particularly high in commodity-exporting countries on the back of depreciating currencies. In Nigeria, for example, the weak naira has contributed to a rising inflation rate recorded at 16.5% year-on-year in June 2016, which is the highest on record in over a decade19. Many other countries have had to deal with rising inflation including South Sudan, Malawi, Sudan, Egypt, Angola, among others (Table 5.1).
Table 5.1.: The 10 African Countries with the Highest Inflation Rate (as of July 2016)
Current Rate Lowest Rate Highest Rate Period South Sudan 295 -14 295 2008-2016 Angola 29.23 6.89 241.08 2001-2016 Central Africa Republic
25.58 -10.67 51.73 1981-2014
Zambia 21 6 22.9 2005-2016 Malawi 21.5 6.3 37.9 2001-2016 Ghana 18.9 18.7 63 1998-2016 Mozambique 18.27 1.05 18.27 2009-2016 Nigeria 15.6 -2.49 47.56 1996-2016 Eritrea 12.5 -1.38 34.7 1993-2015 Egypt 12.3 -4.2 35.10 1958-2016
Source: Trading Economics
Moreover, high inflation rates discourage investors including the institutional savings industry from engaging in long-term finance for housing and also dampen demand for affordable housing. Double-digit mortgage rates in many African countries today are a partial reflection of rising inflation. Mortgage lenders in Kenya, Nigeria, Tanzania and many other countries identify high real interest rates as a major obstacle to mortgage market development efforts20. It is therefore important that African governments and central banks continue to sustain the positive macroeconomic performance achieved over the last decade, including better management of inflation and interest rate volatility, as well as other disruptive economic, social and political factors.
5.3.2. UNDERDEVELOPED CAPITAL MARKETS
Opportunities abound for building Africa’s capital markets given their nascent stage of development. Besides a small handful of financial centres in Casablanca, Johannesburg, Nairobi and Lagos, most capital markets across the continent are very small, illiquid and inefficient (Figure 5.3).
19 Nigeria Bureau of Statistics, 2016. 20 Based on information from central bank surveys and supervision reports.

124 © European Investment Bank, November 2016
Narrow capital markets limit the potential of many countries to access long-term finance. Though there has been a growing trend of countries tapping international capital markets, local financial markets remain underdeveloped. The African Eurobond market, as evidenced by the oversubscription of Eurobond issues, can be a potential source of long-term finance that could be used for housing and infrastructure development in Africa (Table 5.2).
Table 5.2.: Eurobonds Issued in Selected Countries (2011-2015)
Amount Issued (USD m.)
Coupon (%)
Issue Year
Maturity Spread at Issuance
Ratings at Issuance*
Nigeria 500 6.75 28/01/2011 10 years 307 BB-
Senegal 500 8.75 13/05/2011 10 years 596 B+ (S&P)
Namibia 500 5.50 03/11/2011 10 years 336 BBB-
Zambia 750 5.38 20/09/2012 10 years 384 B+
Morocco 1 000 4.25 05/12/2012 10 years 275 BBB-
Morocco 500 5.5% 05/12/2012 30 years 290 BB-
Rwanda 400 6.63 02/05/2013 10 years 499 B
Nigeria 500 5.13 12/07/2013 5 years 381 BB-
Nigeria 500 6.38 12/07/2013 10 years 393 BB-
Ghana 1 000 7.88 07/08/2013 10 years 540 B
Ghana 1 000 7.88 07/08/2013 10 years 540 B
Zambia 1 000 8.50 14/04/2014 10 years 593 B
Ghana 1 000 8.13 11/09/2014 12 years 572 B
Kenya 1 500 6.88 24/06/2014 10 years 418 B+
Kenya 500 5.88 24/06/2014 5 years 410 B+
Côte
d’Ivoire
750 5.38 16/07/2014 10 years 309 B
Senegal 500 6.25 30/07/2014 10 years 379 B+ (S&P)
Ethiopia 1 000 6.63 04/12/2014 10 years 453 B (S&P)
Tunisia 1 000 5.75 26/01/2015 10 years -- BB-
Côte d’Ivoire 1 000 6.38 24/02/2015 12 years -- B
Sources: IIF, Moody’s. Note: *Fitch Ratings
However, evidence has shown that this may not be the case during challenging times such as the global financial crisis21. As the international community eases up on its bond-buying programme, known as quantitative easing, its impact would reverberate across the continent. Rising interest rates in international markets and weakening local currencies relative to the dollar would probably expand the risk premiums on African issuers, thereby increasing the cost of borrowing for African sovereigns. Hence, in the near future, this
21 Beck et al, 2011.

Banking in sub-Saharan Africa: Recent Trends and Digital Financial Inclusion
© European Investment Bank, November 2016 125
method of funding may be less attractive. Supporting the development of local capital markets, particularly bond markets, is therefore imperative for sustainable and affordable long-term financing in Africa. However, such efforts should adopt a long-term perspective given that the necessary conditions for developing well-functioning capital markets cannot be met in the short term.
Figure 5.3.: Underdeveloped Capital Markets in Africa*
Source: World Bank Note: Latest data available
39
250
64
74
183
316
78
16,824
7,993
1,203
1,969
8,194
6,672
43,539
10 1000
Côte d'Ivoire
Egypt
Kenya
Morocco
Nigeria
South Africa
Tunisia
East Asia & Pacific
Europe & Central Asia
Latin America & Caribbean
Middle East & North Africa
North America
South Asia
World
Listed domestic companies
2
5
3
3
1
75
2
242
47
15
29
218
33
99
0 50 100 150 200
Côte d'Ivoire
Egypt
Kenya
Morocco
Nigeria
South Africa
Tunisia
East Asia & Pacific
Europe & Central Asia
Latin America & Caribbean
Middle East & North Africa
North America
South Asia
World
Market Liquidity (values of shares traded as % ofGDP)
39
16
36
46
10
235
24
103
53
34
58
137
71
170
0 50 100 150 200 250
Côte d'Ivoire
Egypt
Kenya
Morocco
Nigeria
South Africa
Tunisia
East Asia & Pacific
Europe & Central Asia
Latin America & Caribbean
Middle East & North Africa
North America
South Asia
World
Market Capitalization (as % of GDP)

126 © European Investment Bank, November 2016
Even though local currency debt securities in Africa increased from USD 11 billion in 2005 to USD 30 billion in 2014, the local debt market remains shallow compared to other emerging economies. Government securities across the continent tend to dominate domestic debt markets. In sub-Saharan Africa, government bonds account for over 75% of the domestic bond market capitalisation, which effectively crowds out private issuers. Moreover, institutional investors such as pension funds and insurance companies prefer investing in short-term government maturities, which are less risky. In Nigeria, for instance, 80% of pension funds are invested in short to medium-term securities22. This further impairs the development of long-term maturities.
With the exception of local debt markets such as South Africa, Morocco, Egypt and Nigeria, liquidity in African markets is low. Moreover, non-active and inexistent secondary markets in many countries make it challenging to raise affordable long-term debt in domestic markets. As a consequence, many investors adopt a buy-and-hold strategy. Such a strategy is not appealing to some fund managers who are not interested in investing in housing assets without safe exit options. Paraphrasing Beck et al (2011), it is important to note that the lack of liquidity in the market relates partly to the fact that it is a requirement for corporate bonds to be traded on exchanges. This together with the one-off nature of corporate bond issuances and the small size of issues causes significant liquidity problems and makes it difficult to raise long-term financing.
It is clear that the current legal and regulatory environment for capital markets is not conducive to attracting investors. Thus, it is important to put in place the necessary conditions for corporate bond markets to thrive and attract private capital. This will be challenging, as it requires transformational policy measures and actions which won’t happen overnight as effective and well-functioning capital market developments will take time to materialise. Some incentive mechanisms and policy options governments can adopt to attract investors include fiscal incentives such as phasing out double taxation for companies listed on several stock exchanges, revising listing requirements including cost and governance issues related to transparency and protection for investors, promoting regulatory frameworks that enable institutional investors to revise their investment strategy and exclusion lists in order to ensure housing is part of the eligible asset class for investments, as well as the need to improve the efficiency of trading and communication systems. Moreover, in order to attract long-term financing for housing, there is a need to adopt a long-term perspective wherein efforts are made to standardise mortgage underwriting practices and procedures, which are key for developing secondary mortgage markets. In order to create the necessary scale for liquid capital, it is also critical to promote regional stock exchanges and allow for cross-listing23. In the meantime, alternative solutions geared towards stimulating liquidity in the housing markets should be explored.
22 Miller, 2014. 23 Ibid

Banking in sub-Saharan Africa: Recent Trends and Digital Financial Inclusion
© European Investment Bank, November 2016 127
5.3.3. WEAK INSTITUTIONAL AND REGULATORY FRAMEWORKS
Credit maturities are longer in countries that have strong institutions and uphold the rule of law24. Consumer, creditor and property rights protection, strong corporate governance, the existence of collateral and bankruptcy laws, and most importantly, the enforcement of these laws and other long-term contractual commitments are vital for increasing access to long-term financing. In most African countries today, the lack of supportive institutional and regulatory frameworks continues to impede the growth of long-term finance and housing finance. The lack of clarity, combined with regulatory restrictions, presents a challenge for institutional investors such as pension funds and insurance companies to actively provide long-term financing. It is well documented that the investment guidelines for pension funds in Africa, if any, are weak and often contain restrictive requirements in terms of eligible asset class or exposure to foreign assets25. For example, in Kenya, Rwanda and Uganda, pension funds are not permitted to invest in housing development companies26. In many other countries, investment limits on foreign assets and domestic securities shut the door to long-term investments and prompts a majority of institutional funds to invest in short-term government securities. Moreover, African pension funds often face capacity constraints to implement these restrictive investment guidelines. In fact, governments through national social security companies manage most African pension funds. As such, they may not have attracted talented fund managers from the private sector and end up using civil servants who may not have the required skills and capacities to understand and efficiently implement the investment guidelines, including making the right investment decisions on foreign assets.
Land governance systems and regulation also remain very weak. The multiplicity and co-existence of dual land tenure regimes (customary and statutory land rights), high transaction costs, and poor land governance and management systems are characteristic of land markets in Africa. Today, just an estimated 10% of land in Africa is formally registered to individuals as freehold property, although wide variations exist across regions and even within countries. Overlapping and conflicting land tenure systems continue to undermine the use of land as collateral in accessing housing finance. Hence, there is a need for sweeping land reforms geared towards providing tenure security. In so doing, governments need to improve land rights delivery, including land formalisation and making land available to buyers or allottees at scale. Most importantly, resolving contradictions between customary and statutory tenure is vital for strengthening land governance. In this respect, it is noted that traditional systems of land delivery are now generally being integrated into a statutory land market structure.
Formal land titles are a necessary precondition for delivering large-scale housing provisions.27 Formal land titles confer legal proof of ownership, which is exclusive and transferable, and thereby strengthens tenure security. As such, they constitute a major asset that the poor could leverage to access housing finance, for instance. Besides, while the 24 See Tasić and Valev (2008), and Giannetti (2003). 25 Ibid 26 AMCHUD, 2014. 27 See Faye et al (2017) for more discussion on land tenure regimes.

128 © European Investment Bank, November 2016
argument that there exist alternatives to formal land titles that are cheaper and easier to implement may be valid, it remains that as far as leveraging housing finance is concerned, the market tends to favour formal land titling as the solution. In other words, reforming the land formalisation process is necessary in attracting long-term private capital. Still, it is worth noting that however perfect or efficient a land titling system is, it may not help channel long-term financing to housing if the legal frameworks in place are not enforced to protect property rights.
Financial sector infrastructure, including credit bureau databases that contain both positive and negative information, is inexistent in many countries. As a result, lenders and investors lack basic credit information on households and firms to effectively price and manage risks. In fact, the lack of adequate credit information systems adds to the market uncertainty and increases the perceived risk related to housing finance transactions. It is important to note that the underwriting processes currently used by the conventional banking sector prevent many qualified borrowers employed in the informal economy (where the majority in need of housing is located) from accessing housing finance. Therefore, the lack of or limited capacity of the conventional banking sector coupled with weak credit information systems is a huge bottleneck to the flow of financing to the housing sector. Credit bureaus and collateral registries have been shown to foster the use of long-term finance by firms28. Building the necessary financial infrastructure is thus vital for deepening the continent’s financial sector and increasing access to long-term finance.
It is also important to note that in order to provide long-term financing in a sustainable manner, good corporate governance systems including sound risk management frameworks, as well as responsible and adaptive lending methods are expected from both investors and financial institutions. This is a challenge as it requires a lot of transformative measures to be put in place. For instance, housing finance providers are expected to strengthen their risk management framework and put in place the necessary safeguards to mitigate risks. This includes adapting underwriting standards that contain know-your-customer rules, independent checks of stated household income, prioritising lending to existing customers that have a positive loan repayment track record, lowering loan-to-value and debt-to-income limits, adopting flexible loan repayment plans, and so on. Moreover, exploring alternative loan guarantee options that may be less stringent for borrowers, including offering equitable mortgages whereby the title certificate is kept by the lender; considering promissory mortgage liens; liens on pension fund accounts, within limits; personal guarantees; pledged savings; and salary payroll deductions are other options to consider. It is also critical that institutional investors such as insurance companies and pension funds have appropriate risk management systems in place, focusing on risk-based supervision approaches and including appropriate provision for oversight and supervision. Verifying the effectiveness of these systems should be the focus of national regulatory and supervisory institutions whose capacity ought to be reinforced.
28 See Love, Martinez Peria, and Singh (2013) and Martinez Peria and Singh (2014).

Banking in sub-Saharan Africa: Recent Trends and Digital Financial Inclusion
© European Investment Bank, November 2016 129
It is obvious from the aforementioned discussion that reforming and building institutions as well as putting in place the appropriate legal and regulatory frameworks are key to lengthening credit maturities and fostering access to long-term finance. Nonetheless, achieving such a goal would require sustained efforts over the long run.
5.4. Emerging Housing Finance Solutions in Africa
It is evident that significant challenges prevent borrowers and lenders from accessing long-term finance for housing as highlighted in the preceding section. Removing these barriers to long-term finance will require sustainable reforms over the long term. No matter how difficult and long this journey may be for many countries and stakeholders, it remains very promising in the sense that the long-term nature provides room for innovating and scaling up new and emerging solutions. In this light, it is noted that many countries and regional institutions have started implementing initiatives to reform and develop their housing finance systems, including building secondary mortgage markets. The ensuing sub-sections will discuss some emerging solutions geared towards increasing access to long-term financing for the housing sector.
5.4.1. POTENTIAL SOLUTIONS FROM THE BOND MARKET
Even though the bond market is still in its infancy (see Figure 5.4), some efforts are being made across the continent to mobilise long-term financing for housing development through domestic and international bond markets. In a few countries such as Kenya and Morocco, governments, property developers and primary mortgage lenders are beginning to look to the bond market for financing housing-related projects. This includes local governments issuing municipality bonds to finance housing related-infrastructure; property developers raising private capital through housing development bonds for their projects; and mortgage lenders raising long-term financing through asset-backed securities such as mortgage covered bonds. The discussion that follows provides an overview of the efforts made in these areas in Africa.

130 © European Investment Bank, November 2016
Figure 5.4.: African Bond Market (as a % of GDP)
Source: African Market Initiative Notes: * CONSUMAF (cumulative issues 2007-2001) **CREPMEF (market capitalisation)
Local governments can issue municipal bonds to finance capital-intensive projects such as infrastructure development projects including roads, water and sanitation, housing, and so on. However, this funding instrument remains a rarity in Africa, with only the cities of Johannesburg and Lagos having ever issued this type of bond. The city of Dakar’s attempt to issue a municipal bond in 2015 provides useful lessons on what it takes to raise funds in the capital market. Actually, for municipalities or cities across the continent looking to fund their rapid urbanisation and infrastructure needs, they will need to have a strong balance sheet, strengthen their creditworthiness as well as their fiscal and financial management processes, and put in place the policy and regulatory frameworks needed to support the development of municipal bonds including sound governance systems, among others. In many countries where decentralisation remains weak, having the full support of the central government is vital for issuing municipal bonds.
In Kenya, property developers and financial institutions such as Shelter Afrique have issued housing development bonds to finance real estate projects across the continent. Between 2005 and 2014, Shelter Afrique successfully issued five bonds in amounts ranging between USD 5.2 million and USD 51.6 million with tenors of up to five years. Housing Finance, Kenya’s leading mortgage lender, has also successfully raised long-term financing for housing through the bond market, all of which were oversubscribed. However, not all housing bond issues have been successful. Home Afrika, the sole listed property developer in Kenya’s unsuccessful launch should serve as an example to institutions eager to float housing bonds in the market. An effective corporate governance system and a strong balance sheet are some of the minimum hurdles developers and financial institutions will need to clear before issuing housing bonds.
0%
10%
20%
30%
40%
50%
60%
CEM
AC*
WAE
MU
**
Ango
la
Bots
wan
a
Zam
bia
Nig
eria
Tanz
ania
Nam
ibia
Uga
nda
Gha
na
Keny
a
Sout
h Af
rica
Mor
occo

Banking in sub-Saharan Africa: Recent Trends and Digital Financial Inclusion
© European Investment Bank, November 2016 131
Mortgage securities, such as mortgage covered bonds (MCB), are another example of capital market funding for housing, which has proven successful in Europe and other emerging countries such as Chile, the Czech Republic and Hungary29. A mortgage covered bond is a debt instrument secured against a pool of mortgages wherein the investor has a priority claim on the collateral, underlying assets and its proceeds in the event the issuer goes bankrupt. The low risk feature of this asset and its attractive risk-adjusted returns have permitted MCB lenders to raise funds in the market at lower borrowing cost. This has enabled covered bond lenders to offer more long-term loans for housing30. MCBs could be a new and attractive funding tool for countries with a fairly developed financial market. Even though this funding instrument has not yet been used in the continent, countries such as Morocco and South Africa are currently working to establish mortgage covered bond systems. It is important to note that prerequisites for implementing MCBs include the existence of a comprehensive financial infrastructure and a strong safeguard system with a solid financial supervisory framework, especially in the banking sector.
5.4.2. MORTGAGE LIQUIDITY FACILITIES
Given the small size of mortgage markets across the continent and the lack of secondary mortgage markets, mortgage liquidity facilities have emerged as a growing source of long-term capital for primary mortgage lenders. A mortgage liquidity facility (MLF) is a refinancing company that provides long-term financing to mortgage lenders. Using their mortgage assets as collateral for loans from a centralised bond issuer (in this case a mortgage refinancing company) banks can access long-term funding from MLFs at competitive rates to offer more housing loans. As an intermediary between capital market investors and mortgage lenders, MLFs primarily raise funds through bond issuances under better rates and conditions than mortgage lenders might be able to, if acting alone. Today, these facilities are operational in Egypt, Nigeria, Tanzania and the West Africa Economic and Monetary Union (WAEMU) as shown in Box 5.1.
Box 5.1.: Caisse Régionale de Refinancement Hypothécaire-UEMOA – Promoting a Regional Mortgage Market
The West Africa regional mortgage refinance fund, known in French as Caisse Régionale de Refinancement Hypothécaire-UEMOA (CRRH-UEMOA) was created in 2012 with the West African Development Bank, ECOWAS Bank for Investment and Development, Shelter Afrique, and 48 regional commercial banks as shareholders. As of June 2014, CRRH-UEMOA’s capital stood at CFAF 5.632 billion (USD 9.63 million). As of February 2014, CRRH-UEMOA had mobilised CFAF 51.9 billion (USD 88.85 million) through the issuance of 10-year tax-free bonds for the benefit of 23 commercial banks in seven WAEMU countries, at an average rate of 6%. Bond proceeds will be used to refinance fixed-rate mortgages up to CFAF 100 million (USD 171 176). The impact of CRRH-UEMOA is
29 See Chiquier and Lea, 2009. 30 Avesani et al, 2007.
132 © European Investment Bank, November 2016
already visible as longer maturity loans – with a tenor of 15-20 years, and lower interest rates – are now being offered in a number of countries. On the basis of its mandate to deepen regional financial markets and contribute to standardising mortgage loan portfolios, documentation, and risk management, CRRH-UEMOA plans to gradually extend the maturity of future bond issuance in order to strengthen its capacity to finance low- and moderate-income housing. The listing of CRRH-UEMOA securities in the regional stock market (BRVM) serves a dual purpose of increasing the liquidity of its bonds and debt securities while deepening regional financial markets. Source: Faye et al, forthcoming, 2017
Besides being an important source of long-term affordable finance, liquidity facilities also have several benefits such as developing bond markets, promoting competition and making housing loans more affordable. In Tanzania, for instance, the establishment of the Tanzania Mortgage Refinance Company (TMRC) in 2010 has been critical in promoting the growth of mortgage finance. As of March 2016, TMRC has catalysed the entry of 24 new banks into the mortgage financing market, increased the mortgage repayment period from the maximum of 7 years that banks offered in the past to 20 years today. Financing offered by TMRC to its 12 member banks accounted for USD 20.5 million or 12% of the outstanding mortgage debt (USD 171 million) in the market as at March 2016. As illustrated, TMRC’s activities continue to increase competition and expand the housing finance market in Tanzania.
MLFs have a vital role to play in Africa’s burgeoning mortgage market as they provide a stepping stone for secondary mortgage market development. By leveraging capital market funding to increase liquidity in the mortgage market, MLFs are an important instrument in addressing the maturity mismatch between the liabilities and assets of primary mortgage lenders. Given the catalytic role of MLFs in building local capital markets and narrowing the long-term finance gap, it is essential for national governments and the development finance community to support the growth of this instrument in the near term. This support could include the technical assistance for designing enabling policies and regulatory frameworks, building the requisite financial and risk management infrastructure, and the provision of concessionary funding to these facilities.
5.4.3. LEVERAGING PATIENT CAPITAL FOR HOUSING THROUGH PRIVATE EQUITY FUNDS
As discussed above, institutional investors in Africa, particularly pension funds and insurance companies, continue to grow considerably as an important source of long-term capital. The increasing size of assets managed by African institutional investors such as pension funds, SWFs and insurance companies are a reflection of ongoing reforms and improvements made in several countries to support the development of the institutional investor industry. This includes a rapidly changing demographic, improving regulatory environment, and a more stable macroeconomic environment.
As the portfolios of these institutional investors continue to increase, these fund managers will need to strengthen their capacities and acquire the necessary skills that will enable them
Banking in sub-Saharan Africa: Recent Trends and Digital Financial Inclusion
© European Investment Bank, November 2016 133
to efficiently select alternative asset classes to diversify their portfolio in order to spread risks, while also generating strong returns. Long-term investments such as housing development and the private equity model – with a typical fund cycle of 7-10 years – fit the long-term horizon of pension and insurance plans as well as SWFs.
Private equity (PE) is a viable asset class for institutional investors looking to diversify their portfolio. Enabling regulatory reforms in countries such as Botswana, Kenya, Namibia and Nigeria have facilitated the participation of local institutional investors such as pension funds in private equity and housing. The indicative amounts related to AUM in the institutional savings industry on the continent, mentioned above (section 5.2), are very informative as to the amount of money that could be mobilised and invested through private equity funds. Focusing on pension funds alone, it is reported from Preqin data that 173 pension funds are currently targeting investments in African-focused private equity firms. However, only 13 of these funds are African pension funds. This suggests that efforts are needed to cause African pension funds to play a vital role in developing the continent’s private equity market in particular, and the capital market in general. To put things in perspective, it is important to note that conservative estimates show that African pension funds currently have over USD 29 billion available to invest in private equity (Table 5.3)31. If these funds were fully mobilised for private equity investment in Africa, it would more than double the size of the continent’s private equity industry today.
31 Ibid

134 © European Investment Bank, November 2016
Table 5.3.: Assets under Management and Available for Private Equity in Select Countries
Country AUM (USD millions)
Allocation to PE (%)
Available for PE (USD millions)
Botswana 6 000 2.5% 150 Ghana 2 600 unclear 130 Kenya 7 280 10% 728
Namibia 9 960 1.75%-3.5% 348 Nigeria 25 000 5% 1 250 Rwanda 482 10% 48 South Africa 322 000 10% 32 000 Tanzania 3 100 5% 155 Uganda 1 500 unclear 75 Zambia 1 800 unclear 90 Total 379 240 34 974
Source: MFW4A
Private Equity and Affordable Housing
Private equity continues to play an important role in improving access to long-term finance for African enterprises, especially small and medium-sized enterprises (SMEs). In 2015, African PE firms raised USD 4.3 billion; bringing the total amount raised by African PE funds to USD 16.2 billion between 2010 and 2015. As the appetite for African-focused PE funds increases, investment activity across the continent has also been on the rise. The total value of reported PE deals reached USD 2.5 billion in 2015. Given that most African countries have poorly developed capital markets, PE provides an attractive alternative, and an important source of patient capital, for the continent’s housing market. Besides providing businesses with long-term risk capital, PE finance may also come with many benefits to an economy – job creation, an increased tax base, private sector development, and improved developmental outcomes.
Affordable housing programmes present a massive opportunity for the private and public sector to partner to create platforms that enable citizens to get a foothold on the property ladder. Notwithstanding the attractive investment opportunities (with forecasted returns of up to 20%) for affordable housing investments across Africa,32 this has historically been an overlooked asset class. Real estate accounted for just 3% of PE transactions by value in Africa, with commercial real estate accounting for the bulk of these transactions over the period 2007-2014. In October 2014 for instance, Preqin’s real estate online service showed that just eight African-focused real estate funds are being raised, with a combined target size of USD 1.8 billion. This is in sharp contrast to the 58 Asian-focused real estate funds targeting a combined USD 17.5 billion in the same period.
32 Projections from an African focused affordable housing fund.

Banking in sub-Saharan Africa: Recent Trends and Digital Financial Inclusion
© European Investment Bank, November 2016 135
In Africa, few PE firms are dedicated to financing affordable housing projects. Phatisa’s Pan African Housing Fund and Old Mutual’s Housing Impact Fund South are some examples of real estate funds primarily targeting the low and middle-income housing market segment in Africa. The successfully exited South Africa Workforce Housing Fund (SAWHF) managed by International Housing Solutions (IHS) provides an illustrative example of how a PE fund can support the provision of low-income housing in Africa. As of December 2014, the SAWHF fund had fully committed ZAR 1.9 billion (USD 157 million) for the development of over 28 000 housing units in South Africa for low and middle-income families. This will contribute to reducing South Africa’s housing deficit, estimated at 2.1 million housing units. IHS has also provided business opportunities for the finance sector in South Africa by attracting ZAR 2.8 billion (USD 232 million) of project debt financing for its investments. Through its investments, IHS has supported the growth of mortgages at the affordable income level, with over 50% of its housing units sold to households that obtained a mortgage loan. In terms of development outcomes, IHS’s affordable housing programme has created an estimated 97 045 job opportunities (both direct and indirect).
Tapping into the institutional savings industry and channelling the mobilised long-term resources through investments in private equity firms active in the housing sector could be pivotal for financing affordable housing at scale across Africa as well as reducing the continent’s housing deficit. In so doing, enabling policies, legal and regulatory reforms, capacity development of stakeholders and improving access to reliable data are key to unlocking long-term PE capital for affordable housing in Africa.
5.4.4. REAL ESTATE INVESTMENT TRUSTS
A real estate investment trust (REIT) is an investment vehicle designed to channel equity capital into large-scale real estate projects. REITS were first established in the United States (US) to pool capital from several small investors into large housing projects. To date, about four African countries out of 34 countries globally have adopted REITs to channel capital into their real estate market. A common feature of REITs worldwide is their tax-neutral structure. Typically, the profits generated by REITs are passed on to shareholders who are responsible for paying taxes - usually at a lower tax base. REITs also provide more liquidity than direct investments since they can be traded on stock exchanges, in contrast to buying and selling property directly, which often entails higher transaction costs. The increased return and reduced risks through diversification are an added advantage of REITs as these companies can invest in different countries and various real estate projects – commercial, residential, rental and industrial (Box 5.2).
Box 5.2.: Expanding the Supply of Affordable Housing Through REITs
In 2013, US non-profit organisations joined together to establish an affordable housing REIT, called the Housing Partnership Equity Trust (HPET). Today the partnership counts 12 NGOs as members. In addition to the Community Development Trust (CDT), this is the second REIT in the US focusing on the affordable housing market. Since its creation, HPET has raised over USD 100 million from private and non-profit investors, including Morgan Stanley, Citigroup, Prudential Financial, the Catherine T. MacArthur Foundation and the Ford Foundation. HPET

136 © European Investment Bank, November 2016
plans to raise USD 500 million primarily from institutional investors such as insurance companies and pension funds. Driven by its socially oriented mission to preserve and expand the affordable rental stock, HPET provides long-term low-cost equity to its member NGOs to acquire affordable rental units for low- and modest-income households. It targets apartment buildings with 100 to 150 units costing between USD 5 million and USD 10 million. As of February 2015, HPET’s total portfolio stood at 1 500 affordable homes. HPET provides investors with an option for balanced financial risks and stable returns with strong social impact. As a result of its target market segment, HPET enjoys special tax treatment. It is exempt from corporate taxes, so long as it distributes 90% of its taxable income to shareholders as dividends. Armed with such financial benefits, HPET is better equipped to compete with deep-pocketed investors, most of whom concentrate on the high-end real estate market.
Source: Authors based on public documents
As of May 2016, over 200 REITs are traded on the US stock exchanges, with a market capitalisation of almost USD 1 trillion33. The economic contributions of REITs cannot be overlooked. In 2014, for instance, an EY (formerly Ernst & Young) study showed that US REITs invested USD 55.9 billion in new construction and capital expenditure to maintain existing property, which supported 366 000 full-time equivalent (FTE) construction jobs34. Moreover, these companies also contributed an estimated 1.8 million FTE jobs and USD 107.5 billion of labour income, according to the report. In the European Union, residential property holdings by investors totalled EUR 172 billion in 2015, an increase of more than 50% since 2011, according to the European Public Real Estate Association. Despite the success and continuous growth of REITs and residential property markets in North America, Europe and other regions, the expansion of REITs in Africa has been slow (Table 5.4). Recent initiatives such as the IFC-CITIC USD 300 million investment platform to develop affordable housing projects with 2 000-8 000 units should make it possible to build a residential portfolio that can yield risk-adjusted returns of at least 6%.
33 National Association of Real Estate Investment Trusts. https://www.reit.com/investing/reit-basics/reit-financial-benefits/reits-and-liquidity accessed on 19 July 2016. 34 EY 2016.

Banking in sub-Saharan Africa: Recent Trends and Digital Financial Inclusion
© European Investment Bank, November 2016 137
Table 5.4.: REITs in Africa
First REIT regulation date Number of REIT(s) registered Ghana 1994 1 Nigeria 2007 2 South Africa 2013 30+ Tanzania 2014 1 Kenya 2013 0 Uganda First draft out 0
Source: Knight Frank
Weak corporate governance, small and poorly developed housing markets and the lack of enabling legislative frameworks are some reasons for the slow growth of REITs in Africa. In Nigeria, for example, REITs cannot acquire properties in other countries. Additionally, the leverage cap of 15% compared to 30-35% in developed and other emerging markets dampens the expansion of REITs in Nigeria.
Ideally, REITs could help channel the much-needed institutional capital into Africa’s property markets by serving as a conduit for the institutional saving industry (e.g. insurance companies, SWFs and pension funds) to invest in housing. The introduction of REIT legislation by national governments is a first step in attracting private capital into local real estate markets. Strengthening the housing delivery value chain, adopting and implementing policies that increase transparency, building the property and land valuation appraisal industry, protecting tenant and landlord rights and enforcing contractual agreements are crucial in reducing transactions’ costs and risks, and expanding the REIT industry as well.
5.5. The Way Forward
In this paper we acknowledged that the lack of long-term financing is a serious problem that undermines the development of the housing sector. Adequately tackling this challenge requires a long-term perspective with sustained efforts from various stakeholders. More specifically, putting in place all the pieces required for a well-functioning capital market may seem to be the journey of a thousand miles. However, this journey is full of promise as it paves the way for designing innovative solutions that have the potential to accelerate Africa’s journey in closing the long-term housing finance gap. In other words, in the near term, the sole focus should not be in building capital markets, which we know takes time to materialise. This should be done in parallel to strengthening the underlying fundamentals and requirements needed for innovative and alternative solutions for capital markets to thrive. Few countries in Africa have taken the necessary first steps in this long and challenging journey to attract long-term capital into the residential real estate market –designing a sector-wide strategy and a comprehensive housing development plan that tackles bottlenecks across the housing value chain: housing finance land markets, housing infrastructure and the construction industry. As elucidated above, developing an enabling policy environment and establishing the right institutions including adequate legal and regulatory frameworks are crucial for building sustainable and well-functioning housing

138 © European Investment Bank, November 2016
finance markets. However, doing so will require the joint and collaborative effort of public and private sector stakeholders, as well as support from development partners.
A non-exhaustive list of actions governments across the continent could undertake to build the housing finance market so as to attract long-term private capital should include: maintaining the good macroeconomic management performance recorded over the last decade so as to ensure a stable inflation environment and moderate interest rate levels; designing and implementing sound policy and regulatory reforms including strong and streamlined land governance and registration systems with the aim of ensuring tenure security and enhancing the possibility to use land as collateral for housing finance transactions; designing rental, mortgage and foreclosure laws and most importantly a strong legal framework that makes property rights enforceable; building and strengthening the capacity of institutions involved in the housing sector such as banks and related ministries (housing, finance, urban development, social affairs, and so on); and deepening and broadening financial systems, including the promotion of non-bank financial institutions such as capital markets, institutional investors and private equity funds by implementing policy and regulatory measures that facilitate the establishment and progressive development of these institutions. These would include measures geared towards strengthening the financial infrastructure such as facilitating the establishment of credit information systems, improving corporate governance and investor protection laws to safeguard the system, as well as promoting the shift from manual trading systems to modern electronic systems and real-time settlement systems.
The private sector as a key partner of governments on the continent should be at the forefront of designing innovative financial products and institutions that have the potential to attract new and alternative sources of capital into the real estate market. In so doing, the private sector needs to spearhead financial innovation while ensuring the quality of underlying assets is guaranteed. These innovative financial products and institutions should be geared towards solving issues such as the lack of equity for developers, low mortgage penetration rates, as well as the inadequacy of financial instruments. This would include adopting flexible but prudent underwriting procedures and processes using alternative securities and guarantees, developing credit enhancement instruments to de-risk housing finance transactions, increasing transparency and responsible lending behaviour. Moreover, this would include promoting instruments such as MCBs that could jump-start and accelerate the development of secondary mortgage markets and build an asset class that attracts long-term capital while at the same time deepening domestic capital markets. The private sector, through institutional investors should also foster and implement the necessary reform changes, as well as design appropriate investment guidelines that enable them to invest the huge patient capital available to them in vehicles such as private equity and REITs. Part of these funds could be channelled to respond to the glaring need for developer equity finance. What’s more, these vehicles could also be designed to address the technical capacity constraints faced by developers. Doing so would help to build up a local developer class with the required capacities and expertise to deliver large housing development projects across the continent. Some of these developers could be dedicated to serving the low-end housing market.

Banking in sub-Saharan Africa: Recent Trends and Digital Financial Inclusion
© European Investment Bank, November 2016 139
In their quest to support the development of Africa’s long-term housing finance market, development partners, such as the African Development Bank, the European Investment Bank, the World Bank Group and other sister development finance institutions should support public and private initiatives that address housing market failures and inefficiencies. This would include supporting governments in designing and implementing enabling policies and programmes geared towards developing housing finance solutions, facilitating the development of secondary mortgage markets, as well as initiatives geared towards strengthening current capital markets and providing funding to financial intermediaries (such as REITS and residential real estate private equity funds), among others.

140 © European Investment Bank, November 2016
References
Ashiagbor, David and Olivier Vidal. 2016. Pension Funds in Botswana, Kenya, Namibia and Nigeria: New Avenues for Funding Private Equity
Beck, Thorsten, Samuel Maimbo, Issa Faye, and Thouraya Triki. 2011. Financing Africa: Through the crisis and beyond. Washington DC: World Bank.
Boyd, John H., Ross Levine, and Bruce D. Smith. 2001. The impact of inflation on financial sector performance. Journal of Monetary Economics 47, no. 2: 221-248.
Chiquier, Loic; Lea, Michael. 2009. Housing Finance Policy in Emerging Markets. World Bank. © World Bank. https://openknowledge.worldbank.org/handle/10986/2641 License: CC BY 3.0 IGO.
Center for Affordable Housing Finance. Housing Finance in Africa Yearbook 2015 (6th Edition)
EY (Ernest & Young). March 2016. Economic contribution of REITS in the United States.
Faye, Issa, El-hadj Bah and Zekebweliwai Geh. Forthcoming 2017. Housing Market Dynamics in Africa. Palgrave Macmillan
Faye, Issa, Qingwei Meng, Mouna Ben Dhaou and Thouraya Triki. Forthcoming 2016. Sovereign Wealth Funds and Natural Resource Management in Africa
Giannetti, Mariassunta. 2003. Do better institutions mitigate agency problems? Evidence from corporate finance choices. Journal of Financial and Quantitative Analysis 38, no. 1: 185-212.
Hassler, Olivier; Walley, Simon. 2012. Mortgage Liquidity Facilities. World Bank, Washington, DC. World Bank. https://openknowledge.worldbank.org/handle/10986/18372 License: CC BY 3.0 IGO.”
Love, Inessa and Martinez Peria, Maria Soledad and Singh, Sandeep, Collateral Registries for Movable Assets: Does Their Introduction Spur Firms' Access to Bank Finance? (June 1, 2013). World Bank Policy Research Working Paper No. 6477. Available at SSRN: http://ssrn.com/abstract=2278093
Majale, M., Tipple, G., French, M. & Sietchiping, R. (2011). Affordable Land and Housing in Africa. Vol 3
Making Finance Work For Africa, The Commonwealth, and EMPEA (2014), Pension Funds and Private Equity: Unlocking Africa’s Potential
Martinez Peria, Maria Soledad; Singh, Sandeep. 2014. The impact of credit information sharing reforms on firm financing? Policy Research working paper; no. WPS 7013. Washington, DC: World Bank Group.

Banking in sub-Saharan Africa: Recent Trends and Digital Financial Inclusion
© European Investment Bank, November 2016 141
http://documents.worldbank.org/curated/en/2014/08/20141619/impact-credit-information-sharing-reforms-firm-financing
Miller, Matthew. 2014. The Hot New Africa Investment Trend: Pension Funds. http://www.institutionalinvestor.com/article/3354639/investors-pensions/the-hot-new-africa-investment-trend-pension-funds.html
Moss, V., 2003, Preview of Housing Finance Systems in Four Different African Countries: South Africa, Nigeria, Ghana and Tanzania. International Union for Housing Finance, London
Mozes, Dan. 1995. Long-term finance in inflationary economies: high inflation creates punishing repayment schedules. Public policy for the private sector; FPD Note no. 35. Washington, D.C.: The World Bank. http://documents.worldbank.org/curated/en/1995/02/697669/long-term-finance-inflationary-economies-high-inflation-creates-punishing-repayment-schedules
National Association of Real Estate Investment Trusts. https://www.reit.com/investing/reit-basics/reit-financial-benefits/reits-and-liquidity accessed on July 19, 2016
PwC 2015. Africa Asset Management 2020. http://www.amafrica2020.com/amafrica2020/docs/am-africa-2020.pdf
Renzo G. Avesani, Elina Ribakova, and Antonio Garcia Pascual, 2007. "The Use of Mortgage Covered Bonds," IMF Working Papers 07/20, International Monetary Fund.
Rousseau, Peter L. and Paul Wachtel. 2002. Inflation thresholds and the finance-growth nexus. Journal of International Money and Finance 21, no. 6: 777-793.
Tasić, Nikola and Valev, Neven. 2008. "The Maturity Structure of Bank Credit: Determinants and Effects on Economic Growth," Working papers 13, National Bank of Serbia.

142 © European Investment Bank, November 2016

Banking in sub-Saharan Africa: Recent Trends and Digital Financial Inclusion
© European Investment Bank, November 2016 143
6. Long-Term Financing in sub-Saharan Africa
RAFFAELE DELLA CROCE1, MICHAEL FUCHS2 AND MAKAIO WITTE3
Executive summary • The provision of long-term finance for productive investment is crucial to
sustaining growth and diversifying economic activity in Sub-Saharan Africa (SSA). Compared to financial inclusion and the provision of short-term funding in Africa, progress in promoting long-term finance has so far been rather limited.
• Even in the medium term the traditional capital-market based asset allocation
mechanism is unlikely to contribute significantly towards filling the long-term investment and financing needs of smaller economies in SSA. Although potentially an attractive option, efforts to use regional markets to harvest economies of scale have not yielded the expected results to date.
• In order to respond to the needs SSA is facing, it is necessary to broaden the
options available locally for long-term finance and increase as well as diversify the investor base. Diverse financing instruments are needed to adequately serve different types of businesses and their different financing needs along the business life cycle.
• Making a dent in filling the long-term financing gap is unlikely to take place on
listed, formal markets (outside a few more developed SSA countries), but rather through unlisted instruments and alternative sources of finance, e.g. project bonds for infrastructure projects or, given the right incentives, through private equity for SMEs.
• A lot remains to be done in strengthening the underlying financial
infrastructure for long-term finance, whether the local legal, regulatory and judicial frameworks, the capacity to prepare projects for external funding, or the ability to maintain a stable macroeconomic environment that reduces the risks associated with long-term commitments.
• Effectively leveraging private sector capital in SSA faces several challenges. A
number of innovations, including tailoring the role of donors and MDBs; use of risk mitigation instruments and alternative financial instruments to crowd in investors are explored in the SSA context.
1 Lead Manager, Long-Term Investment Project, OECD. 2 Financial Sector Advisor and consultant to Deutsche Gesellschaft für Internationale Zusammenarbeit GmbH (GIZ), Sector and Global Programs Department. 3 Advisor, Financial Sector Development, Deutsche Gesellschaft für Internationale Zusammenarbeit GmbH (GIZ), Sector and Global Programs Department.

144 © European Investment Bank, November 2016
• Development finance institutions (DFIs) continue to play a vital role in promoting long-term finance. A stronger shift from direct and indirect investments to the provision of guarantee and credit enhancement instruments would more effectively leverage public funding as a means to mobilise private capital. A reformed approach to local DFIs, whereby the role of government finance is refocused on addressing market failures and catalysing the private sector, and is carefully targeted and monitored, could yield significant potential gains.
6.1. Why does Sub-Saharan Africa Need Long-Term Finance?
While the emphasis of policymakers in SSA and the donor community during the past decade has predominantly been on enhancing financial inclusion, there is a growing realisation that this is only one side of the coin. As much as inclusion is important in reaching the marginalised or informal economy, and in providing short-term loans as working capital for firms, term financing is needed to support growth of productive activities in key economic sectors4. In many countries in SSA long-term finance is also crucial to reducing reliance on exploitation of natural resource wealth. Long-term investment, particularly foreign direct investment, is currently concentrated in industries related to natural resource exploitation with little diversification into other sectors.
Longer-term investments support growth by reducing costs, e.g. for transport and communication, increasing productivity and competitiveness, and thus creating jobs. The lack of or poor quality of infrastructure in SSA is a key driver of the high costs of doing business and a severe impediment to higher sustained levels of economic diversification and growth. According to the United Nations Economic Commission for Africa, the continent’s infrastructure deficit lowers Africa’s per capita economic growth by 2% a year and firm productivity by 40%5. Greater investment in housing could be a major driver of local employment, but housing finance is only at a nascent stage in most SSA countries. Most SMEs are potentially important drivers of growth and employment, but remain small partly because they can only access short-term and often high-cost informal funding to finance their investment needs.
The limited penetration of SSA markets for long-term finance is of particular concern given the huge long-term investment needs of economies south of the Sahara. On the one hand, the investment needs relate to fulfilling SSA’s infrastructure needs in transport, electricity generation, transmission and distribution, telecommunications,
4 In this report, short-term financing is defined as any source of funding with a maturity of one year or less, while long-term financing refers to funding with maturities beyond one year. However, the notion of long-term varies between sectors and types of investment: While investing in a firm’s capital stock may require maturities of only a few years, large infrastructure projects may be in the range of 10-30 years. 5 UNECA, 2012, Economic Report on Africa 2012.

Banking in sub-Saharan Africa: Recent Trends and Digital Financial Inclusion
© European Investment Bank, November 2016 145
water and sewerage etc. On the other hand, they relate to providing corporations with investment- and risk-capital which is particularly difficult to access for micro, small and medium-sized enterprises (MSMEs) at a reasonable cost. By some estimates, the SSA’s infrastructure financing gap exceeds USD 30 billion per year6 and the financing gap for formal MSMEs (excluding informal businesses) amounts to USD 70-90 billion per year7. Finally, the market for mortgage finance in SSA continues to be extremely shallow, underscoring the need to ease current funding constraints on the construction and housing sectors. A recent cross-country study of gaps in the provision of mortgage finance finds that monetary stability, the efficiency of the contractual and information frameworks as well as development of long-term funding are strongly associated with mortgage market development8.
Altogether the definition and measurement of such ‘gaps’ leaves important questions unanswered and requires further analysis, not only because they are dependent on a number of economy-specific parameters (such as the relative size and degree of formality of economic sectors, and the availability of public and private funding) on which reliable data for most SSA countries is currently scarce, but also because their size is ‘dynamic’ as both demand and supply are dependent on a number of factors. For example, the maturity and end-user affordability of the funding provided has an impact on the stated investment demand of firms and households, while the supply of financing is partly determined by the quality of information about potential borrowers, and by the availability of alternative investment options, such as high-yielding low-risk government bonds.
SSA does not stand alone with challenges relating to finding sufficient funding sources for its long-term investment needs. Policy interventions in this area are common in other developing regions and in advanced countries where infrastructure investment and funding the green transition are of concern9. However, as discussed in the next section, the funding gaps in SSA are considerably larger in relative terms, i.e. the existing level of long-term funding measured in relation to any gauge of economic activity is much smaller than elsewhere.
6.2. What is currently the Status of Market Development for Long-Term Financing in Sub-Saharan Africa?
The largest and most important segment across financial sectors in SSA is the banking system. While not necessarily an ideal source of intermediation for long-term finance, given the maturity transformation of short-term liabilities and consequent risks and regulatory constraints, banking systems in most developing countries constitute the
6 Ibid. 7 IFC, 2013, Closing the Credit Gap for Formal and Informal Micro, Small, and Medium Enterprises. 8 Badev, A., T. Beck, L Vado and S. Walley, 2014, Housing Finance Across Countries: New Data and Analysis, World Bank Policy Research Paper 6756, January 2014. 9 See, for example, OECD, 2015, Fostering Investment in Infrastructure, produced by the OECD for the G20 Development Working Group or European Commission, Communication on Long-Term Financing of the European Economy, COM(2014) 168 final.

146 © European Investment Bank, November 2016
largest source of long-term funding for firms, households and governments. Notwithstanding banks’ relatively significant role in providing term finance, their primary focus across SSA is on short and medium-term lending products. This bias towards the short term owes itself to a number of factors including the short-term nature of their liabilities and the risks associated with making longer-term commitments given high political and economic uncertainty, issues relating to contract enforcement, and alternative safer sources of earnings (such as investment in government securities).
In turn, domestic capital markets in SSA – outside of South Africa – are still very small. There are some emerging hubs, such as Nairobi and Lagos, but many of the new exchanges established during the past 15 years are struggling due to limited issuance activity and secondary markets are hampered by investors’ buy-and-hold strategy. To a large extent market viability is determined by scale, so regionalisation might offer better prospects. However, governments often associate establishing local markets with preventing the export of local savings and with attracting employment in the financial sector or simply with prestige. Altogether there has been limited progress in developing markets for long-term finance on the continent. When abstracting from South Africa the depth of equity markets in SSA falls far short of the capitalisation and liquidity of equity markets in other regions such as Latin America.
A similar profile is illustrated by the limited numbers of issuances of equity, bonds and syndicated loans in SSA compared to other regions (Table 6.1). The availability of mortgage finance is also relatively low as are the size of the portfolios administered by institutional investors, such as insurance companies. Recent reforms in several SSA countries have created private pension systems that are rapidly accumulating assets under management. The Nigerian pension industry grew from USD 7 billion in 2008 to USD 25 billion in 2013; total assets under management in 10 African countries in 2015 reached close to USD 380 billion, with South African pension funds managing a commanding share of 85% of these assets (USD 322 billion)10. However, the pension fund industry only intermediates a fraction of assets under management into productive long-term investments due to risk aversion, prudential norms, such as minimum rating requirements or limits on cross-border investment, the lack of project analysis skills, and the limited number of investible projects.
As a consequence of the lack of funding – whether for the enterprise, infrastructure or housing sectors – that is originated on the listed security markets, long-term finance in SSA is largely provided outside listed or formal markets. Corporate bond markets are underdeveloped leaving larger enterprises to rely on banks to satisfy their longer-term financing needs, often with shorter maturities than their investment profiles warrant. Small enterprises are largely dependent on informal sources of longer-term finance, such as that provided by friends and family. As
10 Ashiagbor, David et al., 2014, Pension Funds and Private Equity: Unlocking Africa’s Potential.

Banking in sub-Saharan Africa: Recent Trends and Digital Financial Inclusion
© European Investment Bank, November 2016 147
evidenced by enterprise surveys the lack of access to patient investment capital is among the most important growth constraints for SMEs in SSA.
Local funding opportunities for infrastructure projects are similarly constrained. Funding of infrastructure projects largely relies on government funding (from fiscal revenues and government debt issuance both domestically and abroad), donors and foreign direct investment. Private participation in infrastructure investment is hampered by the poor quality of local legal and regulatory environments, weak project preparation capacity, and underdeveloped or untested public/private partnership arrangements. These challenges are compounded by weaknesses in institutional and funding arrangements, including for the setting up of special purpose vehicles, the process of issuance of project bonds and as regards arranging private placements and syndications, all of which would normally be precursors to or accompany the process of issuing listed securities. These themes are explored further in the following sections.
Table 6.1.: Average Number of Issuers per Year (2004-2013) Average Number of Issuers per Year
Syndicated
Bonds Loans Equity
United States 1031 2934 1199
China 276 118 357
India 160 147 225
Africa 12 30 57
Australia & New Zealand 144 189 957
High-income Asia 498 1748 877
Eastern Europe & Central Asia 108 160 133
Emerging Asia 168 117 315
Latin America & Caribbean 234 110 99
Middle East 28 78 84
Western Europe 753 1131 999
Source: Cortina, Juan Jose, Tatiana Didier, and Sergio Schmukler, 2015. “How Long is the Financing in Corporate Bond and Syndicated Loan Markets?” Working Paper (World Bank). Note: This table reports the average number of issues per year in bond, syndicated loan, and equity markets. The sample period is 2004-2013.

148 © European Investment Bank, November 2016
6.3. How to make a dent in closing the Financing Gap?
In view of the large financing needs and the availability of pools of capital internationally and in some local markets in SSA the question arises as to why so little progress has been made in the past to close the gap. This section reviews a number of ‘traditional’ approaches that have been applied with varying degrees of success and presents some novel ways of working towards improving the provision of long-term finance in Africa.
6.3.1. ESTABLISHING REGIONAL CAPITAL MARKETS
Local capital markets play an important complementary role to the banking system in providing term finance in developed financial systems and increasingly play a similar role in emerging market economies (EMEs). African capital markets have grown quite rapidly in recent years, albeit starting from a very low base. Nonetheless, outside a few financial centres with significant growth potential, capital markets are likely to remain narrow, illiquid and inefficient. This outcome is largely the result of the limited potential scale that can be achieved by smaller capital markets in Africa.
The absence of deep and liquid local capital markets and suitable local investment vehicles, such as specialised investment funds, that might provide adequate diversification opportunities for local institutional investors suggests that the traditional capital-market based asset allocation mechanism is unlikely to contribute significantly towards filling the long-term investment and financing needs of individual smaller economies in SSA in the medium term.
Aiming to overcome the constraints of small scale, African governments have been working towards establishing regional exchanges and enhancing the capacity of regional markets for longer-term securities11. Regional solutions have been sponsored, for example, among the five member states of the East African Community (EAC) and the eight member states of the West African Economic and Monetary Union (WAEMU), but the level of commitment and the outcomes have so far been rather tame. Fears remain that regional integration – rather than benefiting smaller markets by providing more diversified and cheaper sources of funding – will result in funds being ‘diverted’ to the advantage of larger markets outside the domestic market. Altogether, careful consideration needs to be given to whether it is worthwhile for low-income countries to invest in ‘on-shoring’ the rather specific and technical service functions associated with capital market intermediation. Can the associated benefits compensate for the costs – both in terms of the commitment of scarce, highly-qualified local personnel and the investment needed to build the required legal/institutional capacity?
11 For a more detailed discussion of recent developments and prospects, see FSDA Working Paper – Funding the Frontier: Developing Capital Markets for Growth in Sub-Saharan Africa, October, 2013. The 2013 East African Community Financial Sector Assessment technical note on capital markets also provides a useful reality check as regards the prospects for smaller, local capital markets and their integration.

Banking in sub-Saharan Africa: Recent Trends and Digital Financial Inclusion
© European Investment Bank, November 2016 149
6.3.2. DEVELOPING PROJECT PIPELINES
As indicated above, rather than the availability of funding, the binding constraint often lies closer to the investment side. Especially in the infrastructure sector an important constraint has proven to be building a pipeline of investible projects which could form the basis of corporate bond issuances and be suitable for pension funds to invest in. There is a dearth of well-structured, viable projects, inadequate availability of project structuring skills among local sponsors, and lack of confidence in the ability, willingness and commitment of governments to fulfil their contractual obligations12.
Support provided by the international donor community seeks to address these constraints and build the pipeline of projects through interventions in three different areas. On the supply side, the preparation of projects can be supported by standardising contracts and bidding procedures, by setting up dedicated project feasibility funds and contingent liability frameworks and by assisting commercial financial institutions and local DFIs in designing appropriate financial instruments, such as bonds, funds and credit enhancement instruments. On the demand side, it is important to establish a stable set of investment rules, build capacity for investors and regulators and work towards improving the conditions for foreign investors (e.g. tax regime, foreign exchange hedging). Finally on the meso and macro level, programmes aim to strengthen the market architecture, infrastructure and regulations. Examples include building a government bond yield curve as a reference for pricing; developing credit ratings; and introducing market regulations regarding the issuance process, securitisation, SPVs, etc. as further discussed in section 6.4.
The long-term impact and sustainability of such donor interventions crucially depend on the level to which local structures (institutions, rules and regulations) and capacity in the public and private sector (e.g. project developers) can be built up locally. Clearly programmes of the breadth outlined above require coordinated, concerted and sustained effort over several years, and one of the major challenges facing the development of longer-term finance in Africa is commitment to legal and regulatory reforms as well as capacity building.
The development and financing of successful pilot projects can be conducive in strengthening the institutional infrastructure both as regards project preparation and with a view to strengthening the facilitating legal and regulatory framework. DFIs therefore play an important role, be it through direct investments, by crowding in private investment or – in more advanced SSA markets – by assisting the issuance of corporate bonds to promote the corporate bond market.
12 For discussion regarding developing investment opportunities for Nigerian pension funds, see World Bank Note: Financing Options for Infrastructure PPP in Nigeria, January 2013.

150 © European Investment Bank, November 2016
6.3.3. TAPPING LOCAL AND INTERNATIONAL BOND MARKETS
Governments in SSA have increasingly turned to tapping local and international bond markets in the past decade. They have sought to increase the availability of long-term funding, mostly for infrastructure investment, both through domestic issuances of longer-term government securities and through borrowing in foreign currency on the Eurobond market. Increased domestic borrowing could have the important positive side effect of extending the domestic yield curve, but all too often such borrowing – whether domestic or foreign – has resulted in increasing the government’s revenue sources with little measurable impact on investment and the resulting quality of local infrastructure. The lack of a stronger association between the available funding and infrastructure investments is worrisome, particularly given the risks assumed by the government in borrowing abroad and the incentives provided to local investors13.
Until 2006 the only issuer of foreign-denominated bonds in SSA was South Africa. Between 2007 and 2015 countries ranging from Seychelles to DRC and Nigeria issued Eurobonds in excess of USD 24 billion (see Figure 6.1. below). External borrowing brings with it exchange rate exposures that are often ill-matched to the longer-term activities being funded domestically. Domestic investments, for example in infrastructure projects, provide little natural hedging against FOREX exposures, other than in those particular circumstances where foreign currency is invested in activities that generate foreign currency revenues. Thus, while recent foreign-currency borrowing through the issuance of Eurobonds pursued by a number of African sovereigns appeared to provide access to low-cost funding as regards interest rate cost, given the recent appreciation of the USD, such borrowing is already turning out to be a risky and in retrospect very expensive way of augmenting the envelope for financing of domestic investment programmes. Aside from the associated risks, the earmarking of these funds has been weak, and there is no guarantee that such funds are used for investment purposes. Indeed, given the perennial challenges faced by African governments in implementing their capital budgets, it is more than likely that such funds are in part diverted to current expenditures.
Overall, governments should consider foreign borrowing with extreme caution, and efforts should be undertaken to deepen local sources of funding.
13 In Kenya, for example, investors in so-called infrastructure bonds were both provided with tax relief and allowed to use the bonds as collateral. For further discussion regarding the limited impact of such financing on the quality of infrastructure, see IMF Regional Economic Outlook, Sub-Saharan Africa, October, 2014.

Banking in sub-Saharan Africa: Recent Trends and Digital Financial Inclusion
© European Investment Bank, November 2016 151
Figure 6.1.: Eurobond Issuances in Africa 2007-2015
USD billions
Source: Deutsche Bank Research Briefing Nov. 2015: Eurobonds in Africa: Will the Boom Continue?
6.3.4. DIVERSIFYING FINANCING INSTRUMENTS FOR LONG-TERM INVESTMENTS
A more diverse set of financing instruments than is currently deployed in most countries in SSA is needed to adequately serve the different types of businesses and their different financing needs along the business life cycle. Private capital takes many forms, and each class of investor (corporate, institutional investor, domestic or foreign) will point to different reasons for underinvestment in developing countries. Domestic investors may lack sufficient investment opportunities, or may find themselves constrained by the underdevelopment of local capital markets14. Foreign investors may start with a set of geographies where they are comfortable operating, based on determinants such as the investment environment, respect for the rule of law and tradition of respecting foreign capital.
As governments seek greater levels of private finance in infrastructure and SMEs, efforts are underway to better identify the role of governments and DFIs in catalysing private sector capital. The ultimate aim is to broaden the financing options available for long-term finance and increase as well as diversify the investor base.
6.3.4.1. DIVERSIFYING FINANCING INSTRUMENTS FOR INFRASTRUCTURE15
Leveraging Development Finance Solutions
To a large extent long-term funding of infrastructure in SSA is provided circumventing the intermediation process altogether – e.g. as long-term financing funded by
14 An illustrative classic case on African markets is change of ownership in the case of inter-generational transfer of larger family-owned businesses, where the opportunities for IPOs are constrained, often resulting in considerable loss of value. 15 Drawing from OECD research completed in the report Infrastructure Financing Instruments and Incentives, delivered to the G20 in September 2015, and the G20/OECD Support Note on Diversification of Financial Instruments for Infrastructure accompanying the G20/OECD Guidance note endorsed by G20 leaders in September 2016 in Hangzhou, China.
Côte d’Ivoire

152 © European Investment Bank, November 2016
governments, donors or in the form of foreign direct investment. Such direct funding tends to be of relatively significant size in SSA economies compared to the funds intermediated by local financial markets. Therefore developing funding mechanisms and institutional capacity that leverages these external sources of funds may well be important in enhancing the supply of long-term finance. It may also be a precursor to deepening local markets for term finance, whether this takes the form of private placements, syndicated loans or issuance of securities on these local markets as they evolve. This agenda seems particularly important, as the availability of concessionary funding is under pressure due to budget constraints in donor countries. The challenge facing policymakers is to turn this process into a virtuous cycle, gradually leveraging greater funding contributions from the private sector, as illustrated in Figure 6.2.
Given the role of the government as a source of funding and in developing the local legal, regulatory and institutional environment, it is worth revisiting the role of development finance as a catalyst in filling long-term financing gaps. A reformed approach, whereby the role of government finance is confined to catalysing the private sector, and is carefully targeted and monitored, could yield significant potential gains16. The difficulty arises in exercising a flexible mandate whereby governments contribute to the provision of services and functions that generate value added, but also withdraw as soon as private sector provision becomes viable.
Involving the private sector in the governance, and if possible ownership, of such new development finance initiatives will therefore be crucial so as to avoid situations where their mandates could be diluted due to untoward government interference or the lifetime of such initiatives is extended beyond their usefulness. The performance of these initiatives is to be measured according to their ability to sustainably catalyse service delivery by the private sector. They can perform an important function as ‘first-movers’, in providing demonstration effects, or in galvanising otherwise risk-averse investors. Importantly they will harness the involvement of the private sector as an interested investor and the sponsor of broader sector-wide institutional reforms17.
16 The World Bank’s Global Financial Development Report 2013 notes three essential design features relating to the institutional design of state banks that are essential to their performance: (a) a clear and sustainable mandate so they complement rather than substitute private efforts in the credit markets; (b) an adequate risk management system to guarantee financial sustainability of the institution; and (c) sound corporate governance. 17 For further discussion, see de la Torre, A., J. Gozzi and S. Schmukler, 2007, Innovative Experiences in Access to Finance: Market Friendly Roles for the Visible Hand?, World Bank Working Paper, August 2007. See also the Project Appraisal Document for Nigeria Development Finance Project, World Bank, September 2014.
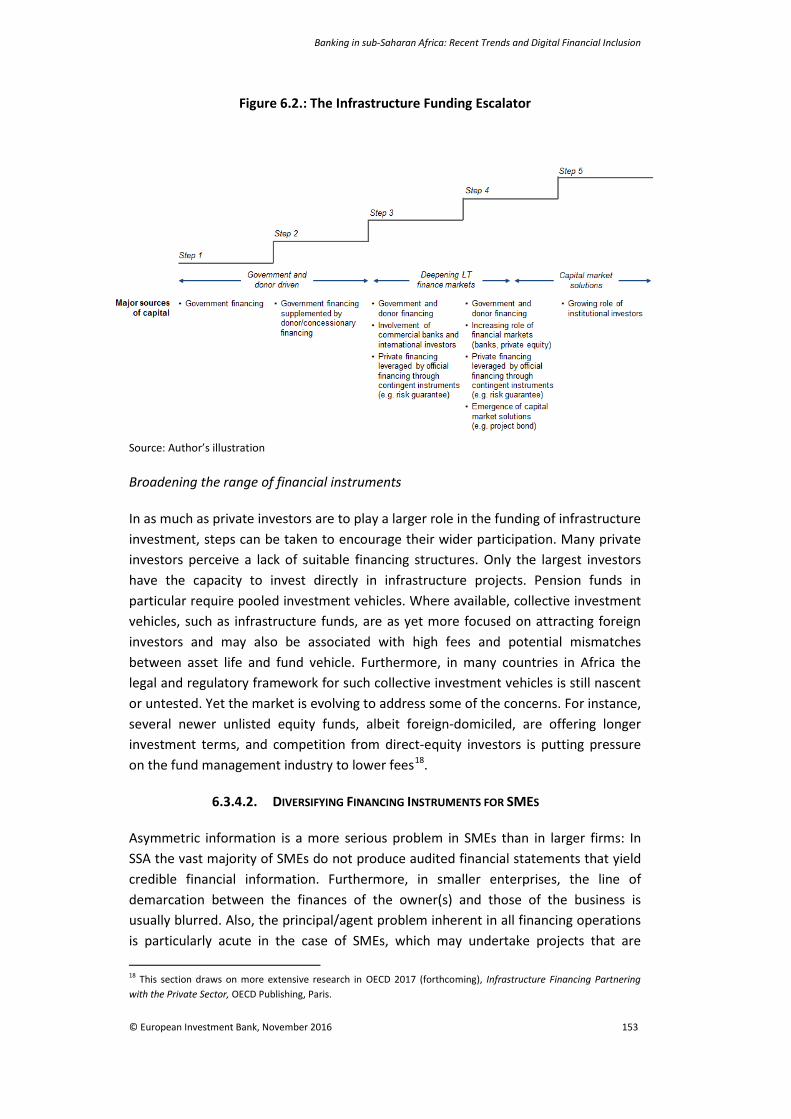
Banking in sub-Saharan Africa: Recent Trends and Digital Financial Inclusion
© European Investment Bank, November 2016 153
Figure 6.2.: The Infrastructure Funding Escalator
Source: Author’s illustration
Broadening the range of financial instruments
In as much as private investors are to play a larger role in the funding of infrastructure investment, steps can be taken to encourage their wider participation. Many private investors perceive a lack of suitable financing structures. Only the largest investors have the capacity to invest directly in infrastructure projects. Pension funds in particular require pooled investment vehicles. Where available, collective investment vehicles, such as infrastructure funds, are as yet more focused on attracting foreign investors and may also be associated with high fees and potential mismatches between asset life and fund vehicle. Furthermore, in many countries in Africa the legal and regulatory framework for such collective investment vehicles is still nascent or untested. Yet the market is evolving to address some of the concerns. For instance, several newer unlisted equity funds, albeit foreign-domiciled, are offering longer investment terms, and competition from direct-equity investors is putting pressure on the fund management industry to lower fees18.
6.3.4.2. DIVERSIFYING FINANCING INSTRUMENTS FOR SMES
Asymmetric information is a more serious problem in SMEs than in larger firms: In SSA the vast majority of SMEs do not produce audited financial statements that yield credible financial information. Furthermore, in smaller enterprises, the line of demarcation between the finances of the owner(s) and those of the business is usually blurred. Also, the principal/agent problem inherent in all financing operations is particularly acute in the case of SMEs, which may undertake projects that are 18 This section draws on more extensive research in OECD 2017 (forthcoming), Infrastructure Financing Partnering with the Private Sector, OECD Publishing, Paris.

154 © European Investment Bank, November 2016
deemed excessively risky by the lender. Against this backdrop, the lack of credit history, which is particularly acute in SSA, and collateral19 often results in severe credit constraints for SMEs.
In SSA, rather than seeking funding on formal markets SMEs may obtain funding provided by family and friends, although this is unlikely to be sufficient in size and maturity to satisfy their investment needs. Nonetheless, among policymakers the tendency has been to focus on the establishment of formal banking markets. When it comes to capital markets, policy implementation has often been focused on formal markets, and has not actively sought to promote the provision of a continuum of informal and formal/private and public financing vehicles.
Figure 6.3.: The Corporate Funding Escalator
Source: Author’s illustration
While bank financing will continue to be crucial for the SME sector, a more diversified set of options for SME financing can be envisaged to support long-term investment in SSA and reduce the vulnerability of SMEs to changes in credit markets. Figure 6.3 illustrates how various sources of finance – ranging from funds provided by family and friends and venture capital at one end of the spectrum to private equity and listed instruments at the other end – progressively become more available at various stages of market development.
Moving up each step on the funding escalator is predicated on a reduction of information asymmetry and agency costs, as formality in the provision of capital rises, enabling larger levels of capital to be intermediated on financial markets. Thus there is a correlation between the steps on the escalator and the progression from market opacity to greater transparency. At earlier stages of development with little private sector involvement in infrastructure finance and where enterprises largely rely on informal sources of finance (family or friends) and banks, very little information is
19 In SSA collateral requirements often exceed the value of the loan, indicating problems with the liquidation of the collateral due to the limited and very lengthy enforceability of financial contracts.

Banking in sub-Saharan Africa: Recent Trends and Digital Financial Inclusion
© European Investment Bank, November 2016 155
available as to the risks assumed by those providing funding or the nature and size of the finance provided.
In practice the list of instruments that can suit the risk appetite of institutional investors in EMEs is constrained by institutional, regulatory and practical hurdles. Importantly, the number of SMEs eligible as the basis for market-based third-party funding is typically limited due to weaknesses in the financial infrastructure (such as the absence of a well-developed credit information industry) combined with opacity as to the finances and business plans of potential SME borrowers, as well as a lack of collateral. This suggests that the development of private equity investment in SMEs may be a more viable option in SSA, provided that funds could be made available to defray the costs of assessing many smaller enterprises and monitoring their performance. It can be expected that the larger and more sophisticated institutional investors in SSA will have an appetite for this type of investment – and there are some experiences in this regard. As institutional investors become more sophisticated, their appetite for equity investment tends to grow20.
6.4. Catalysing Private Financial Resources
Essentially, long-term funding provision by the private sector depends on an acceptable risk-return profile. While returns on infrastructure investments or investments in African corporates may be attractive, they compete with high-yielding government bonds with the latter often crowding out the former. Apart from the high interest rates on government paper the level of risk is perceived to be elevated in most African countries, including commercial, technological, and particularly regulatory and political risk. For investors to be willing to take these risks, adequate de-risking instruments are required as are enforceable long-term contractual commitments which in turn rely on respect for the rule of law.
Going beyond the procurement processes associated with delivery on government contracts, which in themselves can pose challenges, long-term commitments in the fields of infrastructure and SMEs depend on a rather sophisticated set of legal, regulatory and institutional frameworks that are often only partially implemented in SSA. Among these are property and collateral registries, reliable accounting and reporting procedures, tested and reliable foreclosure mechanisms, proven regulatory frameworks supported by reliable judicial processes, etc. The longer the term of contracts and the larger the funding commitments, the more important such ‘basic’ institutional and legal infrastructure becomes. The legal and regulatory challenges
20 See OECD, 2015, New Approaches to SME and Entrepreneurship Financing: Broadening the Range of Instruments, OECD Publishing, Paris. See also Iota Kaousar Nassr and Gert Wehinger, 2016, “Opportunities and limitations of public equity markets for SMEs", OECD Journal: Financial Market Trends, Vol. 2015/1.

156 © European Investment Bank, November 2016
alluded to here have often been all too clearly demonstrated when governments have embarked on public-private partnerships21.
Thus, while governments and donors realise that public funds are insufficient to meet the huge long-term financing needs, effectively leveraging the private sector capital has in the past often been hampered by investors’ lack of trust in the domestic institutional environment and the implied risks. In addition, the private sector’s reluctance may reflect risks emanating from potential macroeconomic instability that could well raise uncertainty associated with (re-)financing costs.
How can these obstacles be circumvented or addressed? The following sections review strategies including a new role for donors and MDBs, the use of risk mitigation instruments, and alternative financial instruments to crowd in investors.
6.4.1. RISK-SHARING INSTRUMENTS
Several governments have been active in facilitating private sector involvement in the financing of infrastructure and SMEs, through the promotion of risk-sharing instruments. In many SSA countries, governments are not in a position to provide these instruments themselves, given they entail contingent fiscal liabilities that are complex to manage. Here financial institutions and MDBs may have a key role to play.
In infrastructure, direct loans (sometimes syndicated) and loan guarantees have been the key mechanisms used by development banks to support financing. However, currently new ways are being explored to expand the use of capital markets. For example, Colombia recently constituted a development bank specialising in infrastructure, Financiera de Desarrollo Nacional (FDN). FDN intends to use different types of risk-sharing mechanisms to support infrastructure projects, including partial guarantees. Insurance could be another way of managing certain types of commercial and political risks.
Many EMEs have experience with guarantee programmes to encourage bank lending to SMEs. In some cases these guarantees are provided directly by the government, while in others they have been provided by public financial institutions, such as Corfo in Chile or Nafin in Mexico. For the larger EMEs, where a robust pipeline of “high quality” loans might exist, the challenge and opportunity lies in further leveraging those programmes to increase the availability of funding to SMEs via capital markets, for example by linking guarantee programmes to securitisation structures or even to SME bond issuances. This secondary market funding is the financing model envisaged by the recently-established Development Bank of Nigeria, which as a wholesale-only
21 Recent efforts by World Bank projects to support the implementation of PPP projects in countries such as Ghana and Nigeria bear witness to the challenges and complexities associated with overcoming the institutional, regulatory and legal hurdles referred to here.

Banking in sub-Saharan Africa: Recent Trends and Digital Financial Inclusion
© European Investment Bank, November 2016 157
lender intends to leverage donor funding with local bond issuance to be used for providing financial institutions with both credit lines and partial credit guarantees22.
An innovative new structure in this context being developed by the European Investment Bank and aiming to increase private sector involvement in the African energy sector is the African Energy Guarantee Facility. The facility will be structured as a mezzanine portfolio guarantee providing access to risk mitigation and credit enhancement solutions for private sector reinsurance providers. While the reinsurer will retain a portfolio first-loss tranche, the facility would guarantee a tranche of the portfolio above the first loss. Losses in excess of the guaranteed tranche will be borne by the reinsurance company. The facility will be an open architecture framework of insurance and reinsurance agreements, offering political and credit risk insurance for investors, lenders and other stakeholders in energy projects in North Africa and SSA. The proposed structure is designed to reduce economic and regulatory capital consumption for the reinsurance company. This will unlock additional risk bearing capacity dedicated to energy projects in Africa, which would otherwise not be available.
6.4.2. ROLE OF DONORS AND MDBS
Beyond being a significant source of long-term capital in low income countries, donor funds and MDBs have an instrumental role to play in supporting SSA governments. Their support ranges from technical assistance in preparing projects to providing advice, offering risk-sharing mechanisms, helping to structure and underwrite instruments and even serving a catalytic role with their participation in strategic transactions.
More often than not, donor funds are used to directly finance capital projects, e.g. through lending or equity investments or indirectly through credit lines for on-lending through local financial institutions. Given the gap between needs and means and the hesitancy of the private sector in significantly stepping up its investments, consideration should be given as to how donor funds could be leveraged so as to more effectively ‘crowd in’ private equity and lending through contingent funding instruments such as credit enhancements. In this regard, MDBs already have programmes in place to support EMEs’ efforts to develop their local securities markets. These programmes range from providing advisory services to participating as guarantors or even investors in specific transactions or instruments that could have a catalytic effect in the market.
Some projects that are clearly and unequivocally commercially viable will be able to attract private sector finance in the market. This could involve local issuance of project (private placement) bonds, corporate bonds, and pooled financing structures – which would contribute towards reducing FOREX exposure and deepening local 22 See “Nigeria Development Finance Study: Lessons from international experience in designing the Development Bank of Nigeria”, World Bank, September, 2016.

158 © European Investment Bank, November 2016
intermediation capacity. However, for other socially desirable and economically transformative projects where the rate of return may be insufficient to compensate private sector investors for the level and/or nature of risk, various risk mitigation techniques and incentives may be employed to manage risks and/or enhance returns so as to crowd in private capital23.
It is increasingly clear that MDBs can leverage the role they play by increasing the role of private debt and equity markets. An important component of the G20 infrastructure agenda for 2016 is to encourage MDBs to increase investment through joint actions, including by catalysing private resources. Several proposals have been made in the context of the G20 Investment and Infrastructure Working Group to optimise the use of existing MDB resources and thus enhance the volume and quality of lending available for development.
Measures proposed to optimise the capital side of MDBs' balance sheets include higher leverage while maintaining the AAA rating, mainstreaming concessional lending windows or making portfolios of assets available to outside investors. For example, an MDB could finance the initial development of an infrastructure project, and once the project was nearing completion, could sell the project debt, and possible equity, to private investors. MDBs would assume risk during the most challenging stages of project preparation and would then exit the project through a securitisation. More robust secondary market securitisation would enable MDBs to exit their infrastructure investments faster and free up capital for deployment in new projects, while allowing institutional investors to participate when the project is operational and has a more tolerable risk level.
This capital-side balance sheet optimisation could be complemented by asset-side measures, whereby MDBs re-orientate parts of their operations from traditional loans to risk-sharing instruments such as credit enhancement and guarantee instruments. These can be particularly effective in middle income and lower middle income countries, which currently absorb significant MDB financing. For example, in the infrastructure sector, such instruments could provide credit enhancement for project loans and bonds, guarantees covering offtake agreements in (renewable) energy projects, local currency swaps and targeted loan guarantees (e.g. covering the construction and ramp-up period of projects).
6.4.3. INSTRUMENTS FOR THE FINANCING OF INFRASTRUCTURE RELEVANT FOR SSA
This section provides an overview of debt and equity instruments that could potentially play a larger role in filling SSA’s infrastructure financing gap going forward. The focus was chosen as most of the innovation in recent years has taken place in the infrastructure space. After the financial crisis there has also been significant innovation in the type of instruments and mechanisms used by institutional investors 23 Any government intervention to these ends may, however, generate unintended consequences, such as moral hazard and market distortions, which should be addressed ex ante in policy design to the extent possible.

Banking in sub-Saharan Africa: Recent Trends and Digital Financial Inclusion
© European Investment Bank, November 2016 159
to provide financing to SMEs, notably through SME bond, loan and credit funds. These funds are collective investment schemes pooling together SME-related assets, such as loans and receivables, and offer a participation in the returns of the fund to the investors. Interest in these funds is growing, but their adoption is still at the early stages in advanced economies (AEs) and they are of very limited relevance to SSA.
Debt instruments for the financing of infrastructure
Infrastructure debt funds are collective investment schemes with infrastructure loans or bonds as underlying assets. The funds (i) buy existing loans made by banks to infrastructure project companies, (ii) make new loans to these companies or participate in syndications of loans along with banks, and/or (iii) buy bonds issued by these companies. Given their underlying assets, investors receive as income the flows stemming from the loans and/or bonds (minus fees and operating costs). They are usually structured as closed-end funds, unlisted and placed through private offerings, exclusively to qualified buyers, mainly institutional investors.
Interest for these types of funds is growing; however, globally their share of the asset management industry is still very small. Most of these funds currently invest in infrastructure in AEs; however, the number of funds targeting infrastructure in emerging markets is also growing. In practice many of these funds aim at providing exposure in EMEs’ infrastructure assets to foreign institutional investors. In addition, a few examples exist of “domestic” infrastructure debt funds in EMEs, i.e. funds constituted in EMEs to attract domestic institutional investors. Examples can be found in India, Peru and South Africa, while Colombia is currently exploring the constitution of such type of funds.
Project bonds can be used as an alternative debt funding instrument for infrastructure projects complementing traditional bank financing. Project bonds can be listed or unlisted and proceeds can be used for both greenfield and brownfield projects. They are attractive as they allow companies/developers to access additional sources of capital and reduce all-in funding costs compared to bank lending. Project bonds also help align the needs of domestic and foreign institutional investors by providing long-term and stable cash flows while tending to produce lower defaults and higher recovery rates of infrastructure assets. From the perspective of financial market development, project bonds have the potential to evolve into an asset class and contribute to deepening fixed income markets.
In SSA, the project bond market is still nascent. In 2013 South Africa saw the first listing of an investment-grade rated infrastructure project bond listed on the Johannesburg Stock Exchange. The bond is held entirely by institutional investors and its proceeds were used to finance the construction of a large concentrated photovoltaic plant.
Nigeria and Kenya have also started using project bonds as a means to finance their large infrastructure gaps and tap private sector expertise. In Nigeria corporate bonds

160 © European Investment Bank, November 2016
are tax exempt while in Kenya specific exemptions apply to infrastructure bonds. Corporates in the telecoms sector have been active issuers in both markets, and in Kenya parastatals such as KenGen have issued infrastructure bonds. Major challenges relate to incomplete or untested regulatory and tariff frameworks and to ensuring that public borrowing, high inflation and high interest rates do not crowd out issuance by the corporate sector – i.e. that the macroeconomic situation is stable enough to provide investors with a stable real return over the lengthy lifetimes associated with infrastructure investment24.
Looking forward, the use of project bonds in Africa as an alternative funding mechanism holds potential for those countries with relatively more developed capital markets, while many other countries will need to deepen sovereign and multilateral bond issuance as a precursor to the issuance of corporate and project bonds. Another important challenge relates to building experience in structuring complex, long-term project financing.
Box 6.1.: Project Bonds for the Financing of Infrastructure in Emerging Markets
In recent years a number of emerging markets ranging from Brazil, Mexico and Peru to Russia, Kenya, Nigeria and South Africa have made their first experiences in issuing project bonds.
In Chile, infrastructure bonds were successfully used to mobilise domestic institutional investors for infrastructure finance, particularly for toll roads. The first infrastructure bond in Chile, and in all of Latin America, was issued in 1998, followed by many others, amounting to an average of USD 1 billion a year during the period 1996-2001. The common model was to issue project bonds with a full wrap guarantee from monoline insurers. However, when monoline insurers faced severe downgrading during the 2008 financial crisis these infrastructure bonds were automatically downgraded to the new rating of the monoline insurers, thus losing their AAA rating. This caused serious disruption to the market as pension funds could no longer invest in these lower-rated assets. The demise of monoline insurers triggered the need to develop alternative models of project bonds. Recent project bond issuances in Brazil and Mexico involved support through a form of partial guarantee scheme to bring down the risk for investors with monoline insurers’ full wrap no longer being an option.
Peru has developed a form of quasi-sovereign bonds contributing to the financing of a number of large-scale infrastructure projects, such as toll roads and water treatment facilities. The strong appetite for the securitised instruments can be explained by the fact that the Peruvian government would honour them independently from the performance of the underlying project, even if it was never concluded. This is why the quasi-sovereign bond model is currently under review due to the high contingent
24 See Cedric Mbeng Mezui and Bim Hundal, 2013, Structured Finance: Conditions for Infrastructure Project Bonds in African Markets, African Development Bank, 2013.
Banking in sub-Saharan Africa: Recent Trends and Digital Financial Inclusion
© European Investment Bank, November 2016 161
liabilities it entails for the government. In Costa Rica and El Salvador, public entities and the government itself have issued project bonds in hard currency, via special purpose vehicles. The bonds were placed in the local markets among institutional investors from the region. Source: Fiona Stewart, Pension Funds and Capital Markets: Portfolios and Returns (World Bank, 2016, forthcoming)
Equity Instruments for the Financing of Infrastructure
Infrastructure funds represent a potentially important segment of the unlisted equity market. Governments should review the ability of funds to access infrastructure assets in the local market, including the suitability of greenfield assets for existing business models, and also the local laws that govern such vehicles. This could include the formation of secondary markets for asset transactions and recycling of capital. This will be particularly important where the regulation of local pension funds constrains their ability to invest in PE funds domiciled offshore.
The global infrastructure fund management industry is growing as the number of funds in the markets increases along with total assets under management. There is some evidence that investment managers are responding to investor demands to lengthen fund terms with long-term investment objectives, and to better align fee structures with the underlying economics of the assets. These are important trends to survey when reviewing unlisted infrastructure equity fund markets (see examples in Box 6.2.).
Box 6.2.: Selected Examples of Equity Instruments for the Financing of Infrastructure
Listed Vehicles In Mexico, the regulator CONSAR has deregulated investment restrictions gradually as alternative investments have been created for pension funds. In July 2009 significant regulatory changes were made to create a new type of securities known as CKDs (Certificados de Capital de Desarrollo), which are traded on the Mexican Stock Exchange. As the principal sources of capital for these instruments are the Mexican mandatory pension funds25, part of these regulatory changes involved amending these funds’ investment rules to allow for the possibility of making investments in private equity, real estate and infrastructure projects through CKDs, structured vehicles. Such investments were also encouraged by providing tax exemptions26.
CKDs are designed to enhance projects in the fields of infrastructure (highways, airports, ports, railways, water, electricity, etc.); real estate; mining; SMEs; technology development; and private capital. The most active sector in CKD listing since 2009 has been real estate, amounting to almost 30% of the total. CKDs are registered on the stock exchange, which fosters market discipline and transparency. To ensure that
25 Sociedades de Inversión Especializadas en Fondos para el Retiro 26 Groenewold 2012, Mexico: Institutional Private Equity Emerges, IFLR 2010.

162 © European Investment Bank, November 2016
these financial products are consistent with the best interests of members, investors, beneficiaries and other stakeholders, the National Banking and Securities Commission has established specific regulation regarding the issuance of CKDs, including shareholders’ rights and responsibilities. In addition, the Commission has developed monitoring and surveillance processes in accordance with best international practices.27 Unlisted Vehicles In Namibia, similar structures have been created to allow for and indeed encourage the investment of pension funds in domestic, unlisted assets. The Pension Funds Act was amended in 2014, with Regulation 28 now requiring pension funds and insurance companies to reserve between 1.75% and 3.5% for locally unlisted investments. Regulation 29 supports institutional investors by creating Special Purpose Vehicles that enable them to comply with this requirement. These SPVs must have an independent Board or Trustees with fiduciary duty towards the SPV and its investors. The Board must appoint fund managers licensed to manage unlisted investments. The SPVs can invest in debt or equity according to their own objectives. Most so far have invested in real estate and SME debt. Fees average around 2-3% AUM – which is a high PE-style cost, but the regulator, NAMFISA, sees the overall impact on pension funds’ costs as limited since these instruments will only form a small overall percentage of the total portfolio. Source: Fiona Stewart, 2016 (forthcoming), Pension Funds and Capital Markets: Portfolios and Returns (The World Bank,)
6.5. Conclusion
As the demand for investment continues to rise with economic growth, trade, urbanisation and growing expectations for improved quality of life, many SSA countries are likely to continue to struggle in addressing their long-term funding needs. Key priorities for SSA countries will be to strengthen the process of project preparation and create financial systems that can provide the finance needed for project implementation, especially for infrastructure and SMEs.
Given the diversity of countries in SSA, a wide range of policies and sources of finance are to be considered, and their appropriateness will depend on factors such as the depth of the local institutional investor base, the level of domestic savings and foreign reserve buffers, the sustainability of external debt and the degree of exchange rate flexibility. Finally, the quality of the domestic legal and judicial framework, and the strength of governance and institutions, will play a key role in how successfully financial resources will contribute towards making growth inclusive and sustainable.
Domestic resource mobilisation allows countries to move towards financial autonomy and reinforces their ownership of public policy. However, African countries still face
27 OECD, 2014, Annex to the Report on Effective Approaches to Support Implementation of the G20/OECD High-Level Principles on Long-Term Investment Financing by Institutional Investors, OECD Publishing, Paris.

Banking in sub-Saharan Africa: Recent Trends and Digital Financial Inclusion
© European Investment Bank, November 2016 163
formidable challenges in raising more and better taxes, mostly as a result of economic structure and the prevalence of the informal sector.
Local investors – banks, pension funds, insurance companies and mutual funds – offer a number of potential advantages, if they can be tapped. International experience in countries such as Mexico and Chile suggests that institutional investors, in particular pension funds, can be instrumental to the growth of the corporate bond market, and, in turn, to the provision of investment finance. Large, foreign institutional investors are another possible source of financing. Foreign private equity, sovereign wealth and pension funds in search of higher returns and diversification are increasingly looking at emerging markets.
Official providers of development finance, such as MDBs, also have a critical role to play in helping to scale up investment financing, and in crowding in private capital in developing countries. This could be encouraged by allocating a substantially larger share of MDBs’ balance sheets to risk mitigation products rather than to direct lending, thereby ‘leveraging’ available capital and potentially attracting greater private sector participation.
As countries are at different levels of development, they face different challenges and stand to benefit in learning from different experiences. Adoption of innovative funding instruments – whether by the private market (as for example in Latin America) or by MDBs – can provide a variety of useful lessons for countries in SSA. A bottom-up approach to testing different instruments for specific transaction types is advisable so as to reveal how best specific projects stand to benefit from experiences already tried and tested elsewhere.

164 © European Investment Bank, November 2016

Banking in sub-Saharan Africa: Recent Trends and Digital Financial Inclusion
© European Investment Bank, November 2016 165
7. The EIB in sub-Saharan Africa
TIM BENDING, CLAUDIO CALI, NINA FENTON AND BARBARA MARCHITTO1
The EIB is the bank of the European Union and the world’s largest multilateral borrower and lender. The Bank is a key provider of both long-term financing and expertise, supporting investments that foster EU policy objectives, inside and outside the EU. In sub-Saharan Africa (SSA), EIB’s engagement is geared towards promoting local private sector development, social and economic infrastructure, regional integration and mitigation of/adaptation to climate change. In 2015, the Bank provided loans totalling EUR 971 million in SSA.
Overview
Over more than 50 years, since the launch of its activities in SSA in 1963, the Bank has supported 1 100 projects in 47 countries totalling over EUR 17 billion of funding. EIB investment aims at contributing to economic and social development while ensuring environmental sustainability. Special emphasis is placed on unlocking the potential of the private sector – including micro, small and medium enterprises (MSMEs) – as an engine of job creation and sustainable, inclusive growth. In this context, increasing the soundness, efficiency and depth of financial sectors – including helping banks contribute to allocating resources to productive investment – lies at the heart of that effort.
Since 2000, the Bank’s activities in SSA have been governed by the Cotonou Agreement, which is the main framework for the EU’s relations with partner countries in the African, Pacific and Caribbean (ACP) regions. The Cotonou Agreement has endowed the EIB with:
• EUR 3 637 million under the Investment Facility (IF) – a risk-bearing revolving fund managed by the Bank, with reflows re-invested in new projects2. This includes the additional EUR 500 million approved in 2013, which in 2014 was used to establish the Impact Financing Envelope (IFE) as a special facility;
• EUR 1 221 million for technical assistance and interest subsidies; • EUR 6 200 million from the Bank’s own resources benefiting from a comprehensive
guarantee from the EU Member States.
The Bank operates in a wide range of economic sectors and supports investment by private and commercially-run public sector entities, including infrastructure projects that are vital to bolster private sector development and create a thriving business environment, particularly for MSMEs. The main goals of EIB’s operations in SSA are to support poverty reduction, sustainable development, climate action and the progressive integration of the region into
1 Statistical assistance was provided by Tomasz Olejnik and Rafal Banaszek. Comments from Heike Ruettgers and Robert Schofield are gratefully acknowledged. 2 Since 2000 a total amount of EUR 4 424 million has been invested under the IF.

166 © European Investment Bank, November 2016
the world economy3. The Bank is fully committed to contributing to the achievement of the Sustainable Development Goals (SDGs) and its engagement towards promoting inclusive and sustainable growth in SSA – as well as in other Partner Countries – is to be viewed in the context of the post-2015 Development Agenda.
Alongside its standard senior loan product, the EIB invests via credit guarantees, equity, junior loans and subordinated loans4. The Bank also backs regional private equity funds – including funds investing in local enterprises, ranging from microbusinesses to midcaps – and it can provide subordinated bank capital to banks in the region. Funding in much-needed local currency – which effectively provides financial intermediaries and their borrowers with insurance against foreign exchange risk – is also available to a number of SSA countries that have demonstrated a track record of macroeconomic stability.
The Bank also actively contributes to knowledge transfer and technical assistance (TA) to enhance project design, preparation and implementation. TA has indeed become an increasingly important tool for the Bank to assist promoters, national authorities and financial intermediaries in SSA. Since 2000 approximately 124 TA projects have been approved in African, Caribbean and Pacific countries, worth a total of EUR 142 million.
Overall, the EIB has provided more than EUR 11.8 billion of finance in 36 SSA countries over the past 16 years, making it one of the biggest multilateral lenders in the region. This effort would not have been possible without close cooperation with the European Commission and with leading private and public sector business partners, including domestic and regional banks.
Figure 7.1.: EIB funding in SSA by sector (%, 2000-Sept 2016)
Source: EIB 3 The ACP-EU Partnership Agreement under the Cotonou Agreement does not cover activities in the Republic of South Africa (RSA), which are instead governed by the EU-South Africa Trade, Cooperation and Development Agreement. The EIB has been active in RSA since 1994. Priorities for RSA are similar to those for the ACP countries. 4 In South Africa the Bank’s product offering is limited to senior loans.
40%
25%
11%
11%
8%6%
Financial sector & Creditlines
Energy
Water & Sewerage
Industry & Agriculture
Transport
Other

Banking in sub-Saharan Africa: Recent Trends and Digital Financial Inclusion
© European Investment Bank, November 2016 167
The Bank constantly explores innovative ways to address the challenges affecting the region. The Impact Financing Envelope (IFE) focuses on higher-risk private sector projects and aims for a superior development impact with the overarching objective of poverty reduction. The envelope targets, in particular, high impact sectors and financial intermediaries in ACP countries where the IF has had limited outreach so far. Providing finance in a way that is focused on addressing social and environmental challenges typically means having to manage increased exposure to operating and macroeconomic risks. The IFE allows EIB to accept a higher risk, or lower risk-adjusted return, than would be acceptable under the IF. This enables EIB to serve sectors such as agriculture, and to lend in fragile and conflict-affected countries. The provision of long-term, affordable finance, often in local currency and accompanied by technical assistance, to these sectors and countries can pay large dividends in terms of development results, while at the same time being financially sustainable.
EIB adopts a portfolio approach to the IFE in order to strike the right balance between risks and return, selecting four instruments: social impact funds, loans to financial intermediaries, credit enhancement tools and direct investments. Twelve investments have been approved to date. These have been distributed across all four instruments and have included a diverse range of high impact investments such as: a financing facility to extend funding for small-scale agriculture and agri-business opportunities, targeting smallholder farmers; direct investment in telecoms network connectivity in unserved, remote areas of Cameroon and the Democratic Republic of Congo; support to two social impact equity funds, expected to equip early stage companies that have a high potential with capital and mentoring, enabling them to generate employment and provide affordable and quality products and services to the Bottom of the Pyramid (BoP); a capital injection into Access Bank Liberia, aiming to demonstrate the viability of business opportunities during post-Ebola recovery; and direct investment in a project providing irrigation and establishing an integrated agri-industry supply chain in an area of Senegal characterised by erratic rainfall and high poverty rates. Based on preliminary estimates of expected results, the IFE is expected to reach at least 6 million direct and the same number of indirect beneficiaries. Around 59% of direct beneficiaries are expected to belong to the BoP5.
Investing in sub-Saharan Africa
The EIB invests in financial sector development and is actively engaged in enhancing access to finance for private enterprises in SSA providing liquidity and funding capacity building. Poor access to credit, and to financial services in general, is a severe constraint on growth in many SSA countries. Domestic credit to the private sector amounts to less than 24% of GDP in SSA compared to close to 50% in South Asia and Latin America6. Out of 40 million
5 Responding to the clear appetite for investments under the IFE from its clients and the initial indications of success in achieving both financial success and development results, EIB has recently stepped up its efforts by approving adjustments to the IFE that will extend the capacity of the envelope by EUR 300 million. The additional funds will be used to help ACP countries, particularly in SSA and in fragile or conflict-affected situations, to reap the benefits and deal with the challenges deriving from irregular migration and forced displacement. 6 IFC Enterprise Finance Gap Database.

168 © European Investment Bank, November 2016
enterprises in SSA, 55% are either underserved (8%) or not served at all (47%) by the financial sector; only 9% of firms have access to a bank loan7. The situation is especially challenging for SMEs and micro-enterprises.
The EIB supports financial sector development and access to finance both by providing financing directly to corporates and through intermediated credit lines covering a wide range of sectors, from manufacturing to agriculture. Local intermediaries are typically relied on to channel funding to clients that would be too small for the EIB to reach directly. Many EIB credit lines are indeed designed to reach SMEs, but the Bank has also used intermediaries in the region to reach smaller-scale projects in sectors such as infrastructure, climate mitigation and social housing. The Bank also supports operations that are directly linked to extending the availability and quality of financial services in the region, for instance financing of branch network extensions or investments in new technology. Since 2000, EIB credit lines and funding for regional or domestic banks and other financial institutions in SSA have totalled EUR 4.7 billion.
Along with the provision of liquidity to SSA financial sectors, the EIB has become increasingly active in the financing of technical assistance (TA) activities with a view not only to maximising the effectiveness of the Bank’s operations but also to build/strengthen capacity locally. TA programmes are typically directed at financial intermediaries, including banks and microfinance institutions, in order to address existing weaknesses – for instance in the areas of risk management and monitoring – and strengthen their ability to cater for micro and small enterprises. More recently, regional TA programmes in East and Southern Africa have been designed to reach out to the entrepreneurs receiving EIB financing to enhance their capacity to present projects that are effectively bankable. Overall 40 TA projects in support of financial sector operations have been approved since 2000, worth approximately EUR 43 million.
BOX 7.1.: FOCUS ON PROJECTS
A capital injection for Africa’s health sector
Improving health services is a key priority for most African countries. With only 11% of the world’s population, SSA accounts for half of the world’s maternal deaths and deaths of children under five. Investing in African health systems not only contributes to saving lives but also strengthens the foundations for economic development; it is essential for achieving the objectives of national poverty reduction strategies and the Sustainable Development Goals (SDGs).
The private sector plays an important role in African health systems, not only in running hospitals and clinics but also in providing health insurance, manufacturing and distributing healthcare products, and supporting industries such as education and ICT services. But raising the capital necessary for expansion to reach larger populations is not easy for the African healthcare sector, with limited interest from private investors.
7 IFC Enterprise Finance Gap Database.

Banking in sub-Saharan Africa: Recent Trends and Digital Financial Inclusion
© European Investment Bank, November 2016 169
The EIB’s EUR 22 million participation in the Investment Fund for Health in Africa (IFHA) 2 fund is targeted at this gap. The fund will provide equity funding to an expected 15 companies seeking capital to provide or improve healthcare services. Results monitoring is expected to demonstrate how the project has contributed to development of the sector. For example, it is expected that over 50 clinics will be created or acquired and developed, that approximately 6 000 jobs will be created over the life of the Fund, a large proportion of them for women, and that the training and qualifications of healthcare personnel will considerably improve. The EIB’s early investment in the Fund will also have an important demonstration effect, helping to attract funding from investors who do not currently view African healthcare as a financially attractive sector.
Improving access to water in Ethiopian towns
In Ethiopia, only 67% of the population has access to safe drinking water and only 39% has access to adequate sanitation services. The existing infrastructure also suffers from being in poor technical condition and inadequate maintenance. In response, the EIB will contribute EUR 40 million to a EUR 94 million fund to finance projects to build or rehabilitate water treatment plants, reservoirs and raw storage facilities in small and medium-sized towns across Ethiopia. These projects are expected to connect 65 000 additional households to the water network and provide access to safe drinking water for a further 120 000 households, reducing the prevalence of waterborne diseases. People collecting water outside the house – often children – spend an average of two hours per day on this task. As a result of the project, they will be able to devote this time to other activities, including education.
The EIB will also provide a EUR 1.9 million grant to fund technical assistance to support the promoter in appraising, funding and monitoring the projects. This will improve institutional capacity and ensure technical quality and compliance with social and environmental standards.
Connecting Angolans to the web
In the face of falling oil prices, economic diversification leading to reduced dependence on oil is considered a top priority for Angola. Infrastructure investment, including in telecommunications, is vital to achieve this. Access to broadband connectivity can lead to increased productivity across the entire economy by allowing better flows of information. A connected environment is more favourable to private sector development, and more attractive to international investors.
In this context, the EIB will finance EUR 20 million of a EUR 47 million investment by TVCABO, a multimedia service provider, to install or expand broadband networks in seven cities across the country. A total of 83 400 additional homes will be passed by fibre networks capable of providing ultra-high speed broadband services, with 45 300 new connections and nearly 25 000 new fibre lines activated. Expanded access to broadband connectivity will contribute to the development of the Angolan broadband market: increased volumes will lead to reduced prices for international connectivity, and increased competition through the expansion of TVCABO is expected to exert downward pressure on retail prices.
Rural Impulse Fund I – Extending access to rural microfinance
In 2007 the EIB invested EUR 3 million in Rural Impulse Fund (RIF), a Microfinance Investment Vehicle managed by Incofin. Since then, the fund has been able to provide long-term capital to 47 microfinance institutions across 27 countries, including six in SSA.
For example, RIF 1 has supported the growth of KWFT Microfinance Bank since 2008 by providing it with the funding needed to grow its portfolio. In 2010 KWFT succeeded in obtaining a deposit-taking license, enabling it to provide clients with savings services. KWFT has also developed new agricultural loan products such as irrigation system loans, as well as environmentally-friendly products like specific loans to set up biogas facilities or purchase solar-powered lamps. Over time KWFT has developed a

170 © European Investment Bank, November 2016
very strong network of branches and outlets throughout Kenya with specific targeting of rural areas whilst at the same time maintaining its traditional focus on credit for women. KWFT now has more than 350 000 clients (almost all women) who borrow the equivalent of USD 1 036 on average.
With a view to addressing long-term structural needs, the EIB is a major provider of infrastructure finance in SSA. Poor roads and insufficient or unreliable electricity supply constitute significant constraints on growth in large parts of the region. Since 2000, the Bank has committed over EUR 5.8 billion to funding infrastructure projects in SSA. The energy sector accounts for the largest share of this effort (about 52%) – reflecting the large needs for investment in electricity generation and distribution in most SSA countries. A special emphasis has been placed on renewable energy sources, as a means of both reducing dependence on expensive imported fossil fuels and contributing to the mitigation of climate change.
Table 7.1.: Aggregated Results of EIB activity in SSA (2013-2015)
Instrument/sector Indicator
SME/midcap credit lines Total loans (EUR m) 998 Total loans # 7 061 Average loan tenor (years) Jobs sustained (total) 171 483
Microfinance institutions (*) Loans to microenterprises (#) 130 991 Loans to microenterprises (EUR m) 301 Jobs sustained in microenterprises 304 301
Microfinance investment vehicles
Total MIV fund size (EUR m) 613 Leverage ratio MFIs supported (#) 94 Loans to final beneficiaries by supported MFIs (#)
2 160 000
Private equity funds Total fund size (EUR m) 1 440 Investee companies (#) 128 Net creation of direct permanent employment
50 500
Energy Generation capacity (MW) 535 New/upgraded substation capacity (MVA)
1 068
New/upgraded power lines (km) 3 049 Households potentially served by new generation
949 200
Households potentially served by new generation from RE
949 200
Annual electricity transported (GWh)
3 730
New households connected 341 800

Banking in sub-Saharan Africa: Recent Trends and Digital Financial Inclusion
© European Investment Bank, November 2016 171
Transport Length of roads built/upgraded (land km)
75
Water & sanitation New/upgraded water treatment capacity, per day (m3)
550 100
New/upgraded water mains/pipes (km)
4 825
New/upgraded domestic water connections
157 859
New/upgraded wastewater treatment capacity (person-eq.)
643 483
New/upgraded sewer/storm pipes (km)
111
Households benefiting from improved water supply
506 350
Households benefiting from improved sanitation services
65 000
Health, education and housing Population accommodated in new housing units
96 000
Telecoms Homes passed by broadband 186 500 Homes connected to broadband 105 500 Household broadband connections activated at completion
56 900
Jobs Employment during operation (full-time equivalent)
2 093
Employment during construction (person-years)
95 021
Source: Results Measurement (ReM) database. Note: (*) Results for Microfinance Institutions refer to the entire 2013 MFI portfolio


Economics DepartmentU [email protected]/economics
Information Desk3 +352 4379-220005 +352 4379-62000U [email protected]
European Investment Bank98-100, boulevard Konrad AdenauerL-2950 Luxembourg3 +352 4379-15 +352 437704www.eib.org
© EIB 12/2016 print: QH-04-16-949-EN-C ISBN 978-92-861-2997-1 doi:10.2867/002264 © EIB GraphicTeamdigital: QH-04-16-949-EN-N ISBN 978-92-861-2995-7 doi:10.2867/52840
The European Investment Bank (EIB)is the European Union’s financing institution
Under its external mandates, the EIB helps to implement the financial pillar of the EU’s foreign policy. It is active mainly in the pre-accession countries of South-East Europe, as well as in the neighbouring countries to the South and East. The Bank also operates in the African, Caribbean and Pacific countries and Asia and Latin America. Its financing activities are aimed at supporting local private sector development, improving social and economic infrastructure and climate change mitigation and adaptation.