bankruptcy law and the cost of banking finance giacomo ... · pdf filebankruptcy law and the...
TRANSCRIPT

Bankruptcy law and the cost of banking
finance
Giacomo rodano, Nicolas Serrano-
Velarde and Emanuele Tarantino
Oxford University Centre for Business Taxation
Said Business School, Park End Street,
Oxford, Ox1 1HP
WP 12/18

Bankruptcy Law and the Cost of Banking
Finance∗
Giacomo Rodano†
Bank of Italy
Nicolas Serrano-Velarde‡
Oxford University
Emanuele Tarantino§
University of Bologna
August 2012
Abstract
Many theories study how firms’ cost of funding depends on reorganization and
liquidation in bankruptcy. However empirical evidence on this subject is scarce due
to the difficulty in interpreting reforms that change different legal instruments at the
same time. We take advantage of the timing of the 2005-2006 Italian bankruptcy law
and combine it with a unique loan-level dataset. We find that the introduction of a
reorganization procedure increased the interest rates on bank loans; the reform that
made the liquidation procedure faster reduced firms’ loan costs; and the presence
of gains from creditor coordination reduced the cost of funding.
JEL classification: G21, G30, G33.
Keywords: Default, Renegotiation, Bankruptcy Code.
∗We thank Steve Bond for invaluable discussions and advice. This paper benefited from comments by John Armour,
Magda Bianco, Raj Chetty, Simone Corso, Mike Devereux, Roberto Felici, Silvia Giacomelli, Nicola Gennaioli, Piero
Gottardi, Luigi Guiso, Giuseppe Ilardi, Steven Ongena, Guido Ruta, Paola Sapienza, Fabiano Schivardi, Enrico Sette,
Joel Shapiro, Andrei Shleifer, Lorenzo Stanghellini, Oren Sussman, David Thesmar, Giorgio Topa, Elu von Thadden, Greg
Udell, Pierre-Olivier Weill, Michelle White, as well as from numerous seminar presentations. Serrano-Velarde greatfully
acknowledges financial support from the ESRC (Grant No RES-060-25-0033). The views expressed are those of the authors
and do not necessarily reflect those of the Bank of Italy.†Bank of Italy, Via Nazionale 91, 00192 Roma, Italy; Phone: +39064792-2745; E-mail: [email protected].‡Oxford University, Centre for Business Taxation, Park End Street, OX1 1HP Oxford, UK; Phone: +44(0)1865288915;
[email protected].§University of Bologna, Piazza Scaravilli 1, 40126 Bologna, Italy; Phone: +390512098885; [email protected].
1

1 Introduction
How does bankruptcy law affect a firm’s cost of funding? Numerous theoretical studies
show that the design of financial contracts depends on the features of the two major
legal instruments in bankruptcy, firm reorganization and firm liquidation.1 In this paper
we disentangle the separate effect that each of these instruments has on firms’ credit
conditions, by taking advantage of the timing of the Italian corporate bankruptcy reform
of 2005-2006.
Reorganization and liquidation procedures can have opposite effects on a firm’s cost
of finance. On the one hand, both liquidation and reorganization attempt to mitigate
creditors’ conflicting positions. Therefore, a structured reorganization procedure (Gertner
and Scharfstein, 1991) and a liquidation phase capable of preserving the value of a firm
when it goes into liquidation (Harris and Raviv, 1990; Hart and Moore, 1994), should
reduce the cost of funding. However, the design of the reorganization phase also needs to
preserve a firm’s repayment incentives, which might be reduced by the prospect of lenient
renegotiation in bankruptcy (Hart and Moore, 1988; Fudenberg and Tirole, 1990).
The 2005-2006 reform of the Italian bankruptcy law for small- and medium-sized
enterprises (henceforth SME) offers an ideal ideal institutional setting within which to test
these theories. First, the reform was prompted by one of the largest corporate scandals
in Europe, the Parmalat scandal, and was not driven by pre-reform trends in SMEs’
performance. Secondly, unlike most reforms of bankruptcy law,2 which simultaneously
modify reorganization and liquidation procedures, the Italian reform consisted of two
separate, consecutive laws. The first law de facto introduced a reorganization procedure
for those firms in distress. The second law significantly speeded up firms’ liquidation
procedures. Differently from the rest of the empirical literature, this timing allows us
to disentangle the effects of each reform on firms’ credit conditions and test predictions
featured in theoretical studies.
We use a unique loan-level dataset covering the universe of bank funding contracts,
to study how the reform of reorganization and liquidation procedures has affected the
costs of funding borne by small- and medium-sized manufacturing firms. This dataset
provides us with detailed, quarterly information on the interest rates that banks charge
to individual borrowers on newly-issued term loans and outstanding credit lines. The
quarterly frequency of the data, as well as our ability to measure the cost of new banking
finance, is crucial to take full advantage of the timeline of the reforms. Finally, since
banking finance accounts for around 80% of the funding of Italy’s SMEs, we effectively
1Among the others, Harris and Raviv (1990), Gertner and Scharfstein (1991), Aghion and Bolton(1992), Berglof and Von Thadden (1994), Dewatripont and Tirole (1994), Gale and Hellwig (1995), VonThadden (1995), Hart and Moore (1998), Von Thadden et al. (2010).
2The most recent examples among OECD countries include Spain in 2004, and France and Brazil in2005. An important earlier example is the U.S. 1978 reform, which changed important features of boththe reorganization and liquidation phases.
2

grasp the true financial costs borne by these firms.
The financing conditions of firms before and after the reforms are likely to be in-
fluenced by unobservable economic factors, thereby rendering any simple comparison of
contractual conditions in the pre- and post-reform regimes misleading. For this reason,
our identification strategy takes advantage of the exogenous policy change by combining
it with a measure of default probability as perceived by the bank’s loan officer. More
specifically, we compare the credit conditions applied to those firms perceived by the loan
officer to be at no risk of default, with the conditions applied to those firms deemed likely
to default. Indeed we provide evidence that the firms at no risk of default and the firms
more likely to default were on similar time trends before the legal changes.
We present three major findings. Our first finding is that the introduction of a re-
organization procedure increased the interest rates on loan-financing for firms by up to
0.2 percentage points, or 20 basis points. The theoretical debate on the effects of reor-
ganization in bankruptcy has highlighted the fact that the introduction of this kind of
procedure may have one of two opposing effects (Tirole, 2006, chapters 2 and 10). The
first potential effect is that of lowering interest payments because of efficiency gains from
improved creditor coordination. In the absence of a clear legal procedure, should each
creditor negotiate with the firm regarding enforcement of their respective claims, strategic
holdout by other debtors may penalize those that reach a deal. As a result, the firm may
inefficiently shut down (Gertner and Scharfstein, 1991). The second is that reorganiza-
tion may exacerbate the debtor’s incentives to behave in an opportunistic way, and thus
increase the ex-ante cost of financing: if the firm has greater value as a going concern than
when in liquidation, banks will be tempted to agree on continuation. Reorganization thus
weakens banks’ commitment to punishment, and lowers entrepreneurs’ incentives to be-
have (see, e.g., Hart and Moore, 1988; Fudenberg and Tirole, 1990). Our results therefore
show that weaker repayment incentives outweigh efficiency gains from improved creditor
coordination.
Our second finding is that the reform of the liquidation procedure has produced a
substantial decrease in the cost of finance (e.g., Harris and Raviv, 1990; Hart and Moore,
1994). Legislation was intended to ensure that liquidation proceeds were distributed
faster, and in a more orderly fashion. This led to creditor expectation of increased liqui-
dation payments in bankruptcy.
Our third finding consists in identifying gains from improved creditor coordination in
bankruptcy (Gertner and Scharfstein, 1991). Borrowing from multiple banks is a pervasive
aspect of firm financing in Italy, with a median of four banks used by each firm. We detect
the importance of coordination gains by analyzing how the impact of the two legislative
reforms varies with the number, and the concentration, of firm-bank relationships. We
show that firms using a large number of banks, or characterized by a low degree of loan
concentration (where gains from creditors coordination are larger), experience a smaller
3

increase in interest rates following the introduction of a reorganization procedure, and a
significantly larger fall in interest rates following reform of the liquidation procedure.
In order to corroborate the validity of our empirical analysis, we extend it in various
directions. Firstly, we show that our findings cannot be accounted for by simultane-
ous changes in firms’ demand conditions or by the cyclical nature of the credit market.
Secondly, we employ an alternative identification strategy that focuses on interest rate
variations among virtually identical firms, perceived to be in different risk categories by
the loan officers of the banks in question, giving us conditions similar to those of a ran-
domized experiment.
The wealth of data in our possession means that in addition to our analysis on inter-
est rates, we also have a number of results showing how the reform affected the cost of
lending contracts in non-price terms. We found out that the use of secured lending in-
creased significantly after both reforms and that the new liquidation procedures triggered
a lengthening of loan maturities. Finally, we also show that the new liquidation proce-
dures reduced firms’ credit constraints and led to an increase in the number of per-firm
bank relationships. All of these outcomes can be interpreted in a way that is in keeping
with the rationale underlying the findings regarding interest rates.
The Italian reorganization procedure introduced by the 2005-2006 reform shares im-
portant analogies with U.S. Chapter 11.3 Moreover, the Italian reforms of the bankruptcy
code also share important features with recent reforms in other OECD countries like
France, Spain and Brazil.4 The unique feature of the Italian experience is therefore not
the content of the reform but its staggered nature which, together with the availability
of detailed loan-level data, provides us with an ideal setting to test existing bankruptcy
theories.
Previous research has analyzed the effects of bankruptcy on companies’ financial and
real decisions from a cross-country perspective,5 e.g., Qian and Strahan (2007), Davydenko
and Franks (2008), Djankov et al. (2008), Acharya and Subramanian (2009), Bae and
Goyal (2009), Acharya et al. (2011). However, by adopting a within-country perspective,
we are able to hold constant other institutional settings that might also have an impact
on the cost of funding. Moreover, our empirical strategy takes advantage of the fact that
3In both procedures, the entrepreneur can open the reorganization phase unilaterally, conditional oncourt approval. Moreover, as in Chapter 11 the entrepreneur can stay in charge of the company whilerenegotiating with creditors. Finally, the decision over the restructuring plan is taken via a creditor voteand the judge can enforce a plan despite the objections of some creditors (cram-down).
4With particular regard to European countries, from early 2000’s the European Commission hassupported a process of bankruptcy codes harmonization aimed at the adoption of bankruptcy codesinspired by U.S. Chapter 11. The presumption of the European Commission was that the harsh approachto failure that characterized bankruptcy codes in Europe would deter risk-taking, experimentation andinnovation.
5A large body of the literature on corporate bankruptcy has also studied the consequences ofbankruptcy-law design, in terms of the direct costs they generate and the associated continuation andliquidation rates (e.g., Weiss, 1990; Franks and Torous, 1994; Stromberg, 2000; Franks and Sussman,2005; Bris et al., 2006; Benmelech and Bergman, 2011).
4

the policy change itself was not related to the economic conditions of Italian SMEs but
due to one of Europe’s biggest corporate governance scandals.
Scott and Smith (1986) show that the 1978 U.S. corporate bankruptcy law reform
raised the cost of funding by introducing several changes in the design of both reorgani-
zation and liquidation procedures.6 The timeline of the Italian bankruptcy law reform,
together with the availability of detailed information on newly issued loans, allows us to
disentangle the impact of each procedure on the cost of debt financing. Moreover, our
results suggest that distinct changes in each procedure can have opposite effects on a
firm’s cost of finance.7 Finally, our findings regarding the impact of reform of liquida-
tion procedures are consistent with the findings in Vig (2011), Assuncao et al. (2012)
and Cerqueiro et al. (2012), all of which study the impact on terms of credit that the
reform of creditor protection has.8 Unlike these studies, we also examine the impact that
increasing debtors’ rights and improving creditor coordination during the reorganization
phase has on the cost of funding.
2 Institutional and Theoretical Framework
The Italian bankruptcy law reform replaced the 1942 Bankruptcy Law by means of two
separate, consecutive items of legislation, namely Legislative Decree no. 35 of 2005,
and Law no. 5 of 2006. The former de facto introduced reorganization procedures into
the Italian system, while the latter significantly modified the functioning of liquidation
procedures. In this section, we first discuss the salient features of the 1942 bankruptcy
system and then present the major changes introduced by the 2005-2006 reform.
2.1 The Italian Bankruptcy Law Pre-Reform Regime
Under the 1942 Italian Bankruptcy Law, an insolvent entrepreneur could try to reach a
settlement with his creditors either by bringing reorganization proceedings (concordato
preventivo) or by reaching an out-of-court agreement (accordo stragiudiziale).9
Both in-court and out-of-court reorganization agreements were subject to important
restrictions inhibiting the implementation of potentially viable agreements. In-court re-
6Hackbarth et al. (2012) furthers the analysis offered by Scott and Smith (1986) by studying theimpact of the 1978 bankruptcy reform on stock returns.
7There are also studies of the effect that the provision of exemptions in personal bankruptcy can haveon loan interest rates (Gropp et al., 1997; Berkowitz and White, 2004).
8More specifically, Vig (2011) analyses the impact of the 2002 Indian bankruptcy reform on the volumeof secured credit, and finds that strengthening creditors’ rights reduces the aggregate demand for securedcredit, because borrowers anticipate a greater liquidation bias in bankruptcy. Assuncao et al. (2012) findthat the 2004 Brazilian reform facilitating the sale of repossessed cars led to improved credit conditions,since it gave rise to the concession of larger loans with lower spreads and longer maturities. Finally,Cerqueiro et al. (2012) show that the 2004 Swedish reform reducing the value of collateral to financialinstitutions led to a significant increase in loan interest rates and to a decrease in the supply of credit.
9The synopsis in this section is based on Stanghellini (2008), chapter 9.
5

organization plans had to feature the full repayment of secured creditors’ claims, together
with at least 40% of unsecured creditors’ claims. A deal reached out-of court between
the creditors and the debtor could subsequently be nullified by the appointed trustee in
bankruptcy (claw-back provision), thereby undermining the execution of the agreement
(Costantini, 2009).
Figure 1 uses data provided by Italian Chambers of Commerce to plot the share
of opened in-court reorganization proceedings in all bankruptcy proceedings (in-court
reorganizations and liquidations) across time. In the early 2000s, only 1% of all new
bankruptcy proceedings involved reorganization, thus highlighting the inefficiency of such
an instrument of negotiation with banks during the pre-reform period.
[Figure 1 Here]
In the pre-reform system, a liquidation proceeding (procedura fallimentare) was di-
rected by a court-appointed trustee under the control of the bankruptcy judge. Creditors
could neither veto the decisions made by the trustee, nor ask for the trustee to be substi-
tuted. The lack of creditor coordination often led to litigation, and made the pre-reform
liquidation procedure a poor instrument to protect creditor interests and preserve the
value of the bankrupt enterprise.
As a consequence, liquidation proceedings were very lengthy affairs. Figure 2 uses data
from Unicredit Bank, one of Italy’s largest retail banks, to plot the distribution of liqui-
dation proceedings according to their duration. The blue bars indicate the distribution
of liquidation proceedings in the pre-reform regime. Figure 2 shows that approximately
95% of liquidation proceedings prior to 2005 lasted for more than 24 months.
[Figure 2 Here]
The reform of the 1942 Italian Bankruptcy Law was prompted by the Parmalat scandal
in December 2003.10 The scandal forced the Italian government to reform the reorgani-
zation procedure for large distressed firms (procedura d’amministrazione straordinaria),
and also triggered the legal changes affecting SMEs (Stanghellini, 2008).11
10Parmalat SpA was a multinational Italian dairy and food corporation. The company collapsed in late2003 with a EU14 billion ($20bn; £13bn) hole in its accounts, in what remains one of Europe’s biggestcorporate bankruptcies.
11More specifically, Italy had already been condemned twice by the E.C. Court of Justice becausethe use of this type of procedure was deemed to constitute an illegal form of state aid. Therefore, thegovernment needed to intervene so as to avoid an infringement of European regulations, and at thesame time to restructure Parmalat. To accomplish both objectives, the existing legislation governingreorganization needed to be reformed. The timeline of the Italian reform can be found in Appendix B
6
2.2 The Reform of Reorganization Procedures – Legislative De-
cree no. 35
At the end of December 2004, a draft copy of Legislative Decree no. 35 was submitted to
the Italian parliament for approval during the first quarter of 2005.12 Legislative Decree
no. 35 only reformed the in-court and out-of-court reorganization procedures, but did not
promote any reform of the liquidation procedure. Unlike under the pre-reform system,
the new procedure abolished any reimbursement requirements for secured and unsecured
creditors. The court ratifies the debtor’s proposal if the majority of creditors (in value)
vote for it, or if the judge believes that even if creditors were to reject the plan, they
will be no worse off as a result of the proposal than they would be under any alternative
provision.13 Finally, Legislative Decree no. 35 strengthened the judicial validity of out-
of-court agreements by limiting the impact of claw-back provisions.14
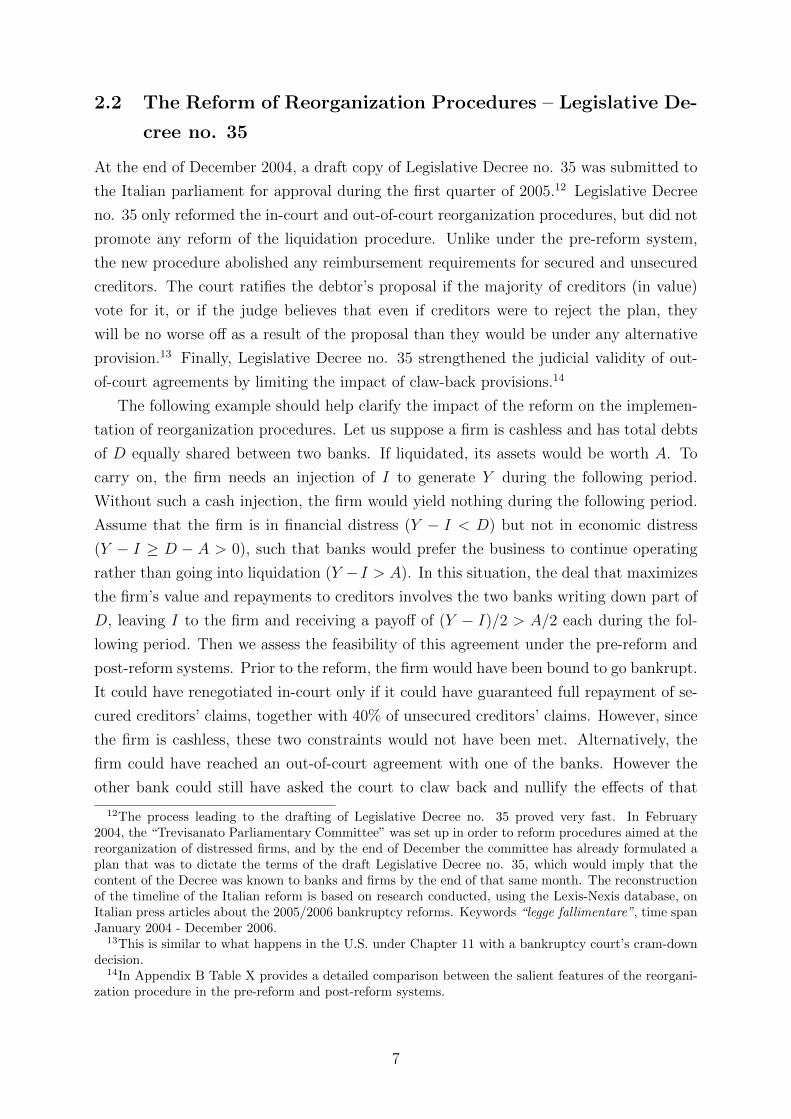
The following example should help clarify the impact of the reform on the implemen-
tation of reorganization procedures. Let us suppose a firm is cashless and has total debts
of D equally shared between two banks. If liquidated, its assets would be worth A. To
carry on, the firm needs an injection of I to generate Y during the following period.
Without such a cash injection, the firm would yield nothing during the following period.
Assume that the firm is in financial distress (Y − I < D) but not in economic distress
(Y − I ≥ D − A > 0), such that banks would prefer the business to continue operating
rather than going into liquidation (Y − I > A). In this situation, the deal that maximizes
the firm’s value and repayments to creditors involves the two banks writing down part of
D, leaving I to the firm and receiving a payoff of (Y − I)/2 > A/2 each during the fol-
lowing period. Then we assess the feasibility of this agreement under the pre-reform and
post-reform systems. Prior to the reform, the firm would have been bound to go bankrupt.
It could have renegotiated in-court only if it could have guaranteed full repayment of se-
cured creditors’ claims, together with 40% of unsecured creditors’ claims. However, since
the firm is cashless, these two constraints would not have been met. Alternatively, the
firm could have reached an out-of-court agreement with one of the banks. However the
other bank could still have asked the court to claw back and nullify the effects of that
12The process leading to the drafting of Legislative Decree no. 35 proved very fast. In February2004, the “Trevisanato Parliamentary Committee” was set up in order to reform procedures aimed at thereorganization of distressed firms, and by the end of December the committee has already formulated aplan that was to dictate the terms of the draft Legislative Decree no. 35, which would imply that thecontent of the Decree was known to banks and firms by the end of that same month. The reconstructionof the timeline of the Italian reform is based on research conducted, using the Lexis-Nexis database, onItalian press articles about the 2005/2006 bankruptcy reforms. Keywords “legge fallimentare”, time spanJanuary 2004 - December 2006.
13This is similar to what happens in the U.S. under Chapter 11 with a bankruptcy court’s cram-downdecision.
14In Appendix B Table X provides a detailed comparison between the salient features of the reorgani-zation procedure in the pre-reform and post-reform systems.
7

transaction.15 Following the reform, no condition is placed on the required reimbursement
of creditors, and the optimal write-down can now be implemented. Moreover, the scope
for claw-back provisions is severely limited for out-of-court agreements. The post-reform
system therefore permits the efficient resolution of a firm’s distress.16
Figure 1 suggests that Legislative Decree no. 35 has had a significant impact on the
use of reorganization procedures. The share of reorganization procedures increased from
approximately 1% of total procedures before 2005, to over 10% of the total number of
procedures opened in 2009.17
2.3 The Reform of Liquidation Procedures – Italian Law no. 5
It was not until May 2005 that the government was mandated to amend the liquidation
procedure, with the declared objective of reducing its duration and improving creditor
coordination. Meanwhile, major stakeholders (e.g., the banks’ association) lobbied fiercely
for a change in the law regulating liquidation, and the new law, Italian Law no. 5, was
enacted on 9 January 2006. Italian Law no. 5 strengthened creditors’ right to control
liquidation procedures, and improved creditor coordination.18
Figure 2 shows that Italian Law no. 5 significantly reduced the time taken by liqui-
dation procedures. Whereas approximately 95% of those liquidation procedures opened
before 2005 (blue bars) lasted for more than 24 months, less than 60% of those opened
after the introduction of Italian Law no. 5 (red bars) lasted for more than 24 months.
15For example, the firm could have agreed out-of-court to a write-off with one bank, in exchange forthe repayment of D/2 in the following period. Under this agreement, the firm could have continuedoperating until the following period, and the second bank would have received a payoff of Y − I −D/2.In the event that Y − I − D/2 < A/2 (that is, if the second bank obtained less than in liquidation) itwould have had the incentive to ask the court for the claw-back of the transaction between the firm andthe negotiating bank.
16In the example it is assumed that out-of-court collective renegotiation is unfeasible or inefficient, dueto, for example, the hold-up problems of individual creditors. This assumption is commonly found intheoretical studies of corporate finance (e.g., Gertner and Scharfstein, 1991; Von Thadden et al., 2010)and is supported by strong empirical evidence (Asquith et al., 1994; Gilson, 1997).
17Also, several items of anecdotal evidence suggest the full compliance of the bankruptcy courts withthe prescriptions contained in the new law. Copies of the decrees concerning the opening of reorganizationprocedures under the post-reform system are available upon request.
18Italian Law no. 5 relegates the court to the role of supervisor of development of the procedure.Moreover, said Italian Law no. 5 establishes that creditors can set up a committee, which may consistof either three or five members, and which must represent all classes of creditors equally. A creditors’committee may request that the trustee in bankruptcy be replaced, it must give its consent to saidtrustee’s actions, and, more importantly, it can veto continuation of a firm’s business if such continuationcould harm creditors’ interests. Finally, the committee may suspend the liquidation phase if it approvesa settlement agreement proposed by the same creditors, the trustee, a third party, or the debtor. InAppendix B, Table XI compares the main features of the liquidation procedure under the pre- andpost-reform systems.
8

2.4 Theoretical Framework
Before turning to an analysis of our empirical strategy, we present the theoretical founda-
tions of our identification strategy, and illustrate our main theoretical predictions. In the
real economy, each firm needs banking capital to finance its business projects.19 Firms
can be of two types, safe or risky : safe firms always succeed, whereas risky firms are more
likely to fail. Therefore, bankruptcy design only affects the value of risky firms. In the
event of failure, and in the absence of an effective reorganization procedure, risky firms
are automatically liquidated. Otherwise, the entrepreneur running a risky firm is entitled
to open a reorganization procedure in the event of failure.
The following are some of the central empirical predictions arising from the theoretical
literature regarding the impact of bankruptcy features on the cost of finance.
Reorganization Procedures Reform of the reorganization procedure has reinforced
entrepreneurs’ right to open a restructuring procedure either in-court or out-of-court,
while staying in control of the firm. There are two views as to the effect on interest rates
of reorganization in bankruptcy.
In the first view, agents negotiate in the absence of agency costs. Following this as-
sumption, it has been shown that the existence of a structured procedure of reorganization
in bankruptcy can spur investment by distressed firms. This is because, in the absence of a
clear renegotiation procedure, conflicts between creditors would be exacerbated (Gertner
and Scharfstein, 1991). This was illustrated in the example given in Section 2.2: if the
continuation value of a risky project is positive following first-period failure, the efficient
decision from the banks’ point of view involves the negotiation of a haircut on respective
claims. This enables the entrepreneur to bring the project to completion and avoid inef-
ficient liquidation. However, in the absence of a structured reorganization procedure, a
problem of strategic holdout may arise. If a single bank negotiates a haircut to enable the
firm to continue, all the others have an incentive to free-ride and preserve the value of their
claims. Therefore, according to this view, the introduction of a renewed reorganization
phase should reduce the interest rate difference between safe and risky firms.
In the second view, the contracting environment is characterized by a problem of
agency costs. This agency problem reduces the value of the income that the risky firms
may pledge to the bank.20 Indeed, studies have shown that in the presence of asymmetric
information, renegotiation impairs the contract’s ability to cope with agency problems
(e.g., Hart and Moore, 1988; Fudenberg and Tirole, 1990). To clarify this point, let us
19One should remember that banking finance represents 80% of Italian firms’ total funding.20For instance, this may be consistent with a model in which the entrepreneur needs to put time and
effort into a risky firm (and this decision is unobservable and unverifiable), otherwise the probability ofthe project succeeding will be lower, and the entrepreneur stands to gain private benefits. Note thatthe pledgeable income in question is the surplus delivered by a project, net of the costs of the allottedinvestment and private benefits (Tirole, 2006).
9

consider a risky firm that fails at the end of the first period, because the entrepreneur has
behaved opportunistically. In these circumstances, the optimal contract would require the
termination of the entrepreneurial project. However, if the firm’s continuation value is
positive, there are rents to be shared via renegotiation. The presence of a reorganization
procedure offers a natural environment in which parties can find an agreement to let the
venture continue. Now, consider the consequences of this outcome during the first-period
contracting stage: the entrepreneur knows that behaving opportunistically does not harm
his chances of completing the project, thus requiring a larger agency rent in order to
implement the project, and reducing the bank’s pledgeable income.
Prediction 1. The introduction of a reorganization procedure can either increase or re-
duce the difference in those interest rates applied to risky and those applied to safe firms.
The outcome depends on whether the gains from creditor coordination offset the costs
caused by the agency problem.
Liquidation Procedure Italian Law no. 5 has considerably improved creditors’ ability
to make coordinated decisions and to control the liquidation phase. We expect that these
changes will result in larger liquidation values (due, for example, to the shorter duration
of procedures). In turn, these will be reflected in a reduced interest rate gap between safe
and risky firms (e.g., Harris and Raviv, 1990; Hart and Moore, 1994).
Prediction 2. The reform of the liquidation procedures should have reduced interest rate
differences between risky and safe firms.
Creditors Coordination Both reforms have improved creditor coordination, and should
therefore result in reduced interest rates if there are greater coordination gains. Indeed,
Gertner and Scharfstein (1991) show that a structured reorganization procedure allows
creditors to coordinate and limit the scope for holdouts, and von Thadden et al. (2010)
show that in the presence of a structured in-court reorganization procedure, strengthening
creditor rights mitigates firms’ hold-up problems, with increasing beneficial effects as the
number of creditors grows. The next prediction is as follows:
Prediction 3. The greater the number of banks a firm deals with, and the lower a firm’s
loan concentration is, the greater should be the reduction in interest rates due to the
reforms.
3 Data
In order to test these implications, we employ a unique loan-level dataset. Our main
data sources for the credit conditions of firms and the characteristics of their loans, are
confidential datasets collected by the Bank of Italy as part of its bank supervision duties:
10

Central Credit Register (Centrale dei Rischi) and Taxia. In addition to this information,
we also have balance sheet data for the universe of Italian companies from the Cerved
database. These data allow us to observe the cost of newly-issued loans and the major
features of funding contracts at the firm-bank level (such as maturities and the presence
of collateral). They also comprise a measure of default probability that reflects the firm’s
rating as perceived by the loan officer of a bank and that allows us to capture the dis-
tinction between “safe” and “risky” firms as featured in the theoretical framework. Our
final dataset is composed by a total of 202,964 distinct manufacturing firms, 1,097 banks
and 361,310 newly issued term loans.
3.1 Data sources
The Central Credit Register In order to comply with Italian banking regulations, all
financial intermediaries operating in Italy (banks, special purpose vehicles, other financial
intermediaries providing credit) have to report financial information, on a monthly basis,
for each borrower whose aggregate exposure exceeds 75,000 Euros. Thus we can use the
central credit register to compute the aggregate financial characteristics of firms. For
each borrower-bank relationship we thus have information on financing levels, granted
and utilized, for three categories of instruments: term loans, revolving credit lines, and
loans backed by account receivables. The information on term loans is supplemented by
other non-price characteristics, such as loan maturity, and the presence, or otherwise, of
real or personal guarantees.21
Taxia Taxia is a subset of the Central Credit Register that covers information on more
than 80 percent of total bank lending in Italy. More specifically, this dataset provides us,
on a quarterly basis, with detailed information on the interest rates that banks charge to
individual borrowers on newly issued term loans and outstanding credit lines. In addition,
the dataset provides information on the maturity and presence of collateral for all newly-
issued term loans. The data collection process of Taxia was heavily revised in 2004. We
therefore have reliable loan-level information starting from the second quarter of 2004.
Cerved Firms’ balance sheets and profit-and-loss accounts come from the Cerved database,
collected by the Cerved Group. These data cover the universe of Italian corporations
(about 800,000 firms) and are used, amongst other things, for the purpose of credit risk
evaluation by banks. One of the unique features of this dataset is that it provides exten-
sive coverage of privately owned SMEs. This is particularly important for our purposes,
since the bankruptcy law reform we are interested in analyzing, applies to this type of
21This dataset has been used by, among others, Detragiache et al. (2000), Sapienza (2002), BonaccorsiDi Patti and Gobbi (2007). Data from credit registers have also been used for other countries (Hertzberget al., 2011; Jimenez et al., 2012).
11

firm. From this dataset, we collect yearly balance-sheet information on assets, revenue,
value added, and other characteristics such as location, date of constitution, and indus-
trial sector. In addition, Cerved data provide an indicator of the default probability of
each firm, which is the Score variable that plays a crucial role in our empirical analysis,
the features of which we will discuss later.
Other Data Sources We supplement these data sources with information provided by
the Invind survey. Invind is a yearly survey run by the Bank of Italy over a representative
sample of manufacturing firms. The survey collects, amongst other things, information
about CEOs’ forecasts of firms’ sales growth, prices, and other qualitative information
such as production capacity and capacity utilization. There are about 1,500 firms in each
cross-section and the representativeness of the survey is ensured by the stratification of
the sample by sector of activity, firm size and region.
Since only SMEs were affected by the policy change, we have omitted data regarding
firms with more than 500 registered employees.22 Further details on data organization and
data cleaning can be found in Appendix A. The final dataset is of a quarterly frequency,
and runs from the second quarter of 2004 to the last quarter of 2007, comprising a total
of 202,964 distinct manufacturing firms and 1,097 banks.
3.2 Variables and Descriptive Statistics
Loan Characteristics Our main dependent variable is the Loan Interest Rate, which
computes the gross annual interest rate for newly-issued term loans, inclusive of partici-
pation fees, loan origination fees, and monthly service charges. This rate is calculated so
that the present value of loan installments equals the present value of payments at loan
origination. We also have information on the following term loan characteristics: Size of
Loan is the granted amount of the issued term loan; Maturity is a set of binary variables
indicating whether the maturity of the newly-issued loans is up to one year, between one
and five years, or more than five years; Guarantee is a set of binary variables indicating
whether the loan has no collateral (Unsecured), only real collateral (Real), only personal
collateral (Personal), both (Real and Personal), or is unmatched (Other). We also com-
pute a price measure for revolving credit lines, Credit Line Interest Rate, as the average
net annual interest rate on the credit line. Granted Credit Lines is the total credit line
the firm was granted by the bank for a given quarter.
Table I presents descriptive statistics regarding interest rates for newly-issued term
loans and for credit lines granted between the second quarter of 2004 and the last quarter
of 2007.
22Firms above this threshold have access to a different set of procedures.
12

[Table I Here]
The average interest rate charged for a loan during the sample period is 5.15%. How-
ever, rates vary substantially across our sample, since in the lowest and highest quartiles
of the distribution, interest rates were 4.06% and 6.03%, respectively. The average loan
in the sample amounted to approximately 383,000 Euros. Yet, our data cover loans as
small as 1,000 Euros, and the loan at the median of the distribution amounted to 120,000
Euros. The lower panels of Table I explore heterogeneity in annual interest rates across
loan characteristics. As in Strahan (1999) and Santos (2011) we find that short-term
loans with less than one-year’s maturity, which constitute around two-thirds of all loans,
are subject to a significantly higher interest rate than medium- or long-term loans. In
addition, we find that loans guaranteed by real securities have significantly lower interest
rates attached to them.
The bottom panel of Table I shows that the average interest rate charged on credit
lines is 9.03%, which is significantly higher than the average rate on loans. Credit lines
are not only associated with larger mean rates, but also with a greater dispersion around
the mean, as measured by the higher standard deviation and the higher inter-quartile
differences. Finally, the average entity of those credit lines granted by banks to firms in
our sample amounts to 123,000 Euros.
Aggregate Financing Variables We use information from the Credit Register to
compute aggregate variables describing the financial structure of firms. Credit Lines/Tot.
Bank Fin. is the total entity of a firm’s credit lines divided by the total amount of bank
financing granted for all loan categories. Advances/Tot. Bank Fin. is a firm’s total loans
backed by account receivables, divided by the total amount of bank financing granted for
all loan categories. Loans/Tot. Bank Fin. is the firm’s total term loans, divided by the
total amount of bank financing granted for all loan categories. The first panel in Table II
describes the financing structure of the firms in the sample.
[Table II Here]
Loan financing accounts for a substantial share of bank financing. Term loans rep-
resent, on average, 37% of a firm’s total bank financing, whereas credit lines represent
on average 14% of total bank financing. Backed loans account for 49% of total bank
financing, and they are mostly used for liquidity purposes. Finally, total bank financing
represents 57% of the book value of a firm’s assets.
Balance Sheet Variables On the basis of our balance sheet data, we compute several
characteristics of the firms in question. We define Age of Firm as the difference between
the current year and the year of the firm’s incorporation. Value Added and Total Assets
13
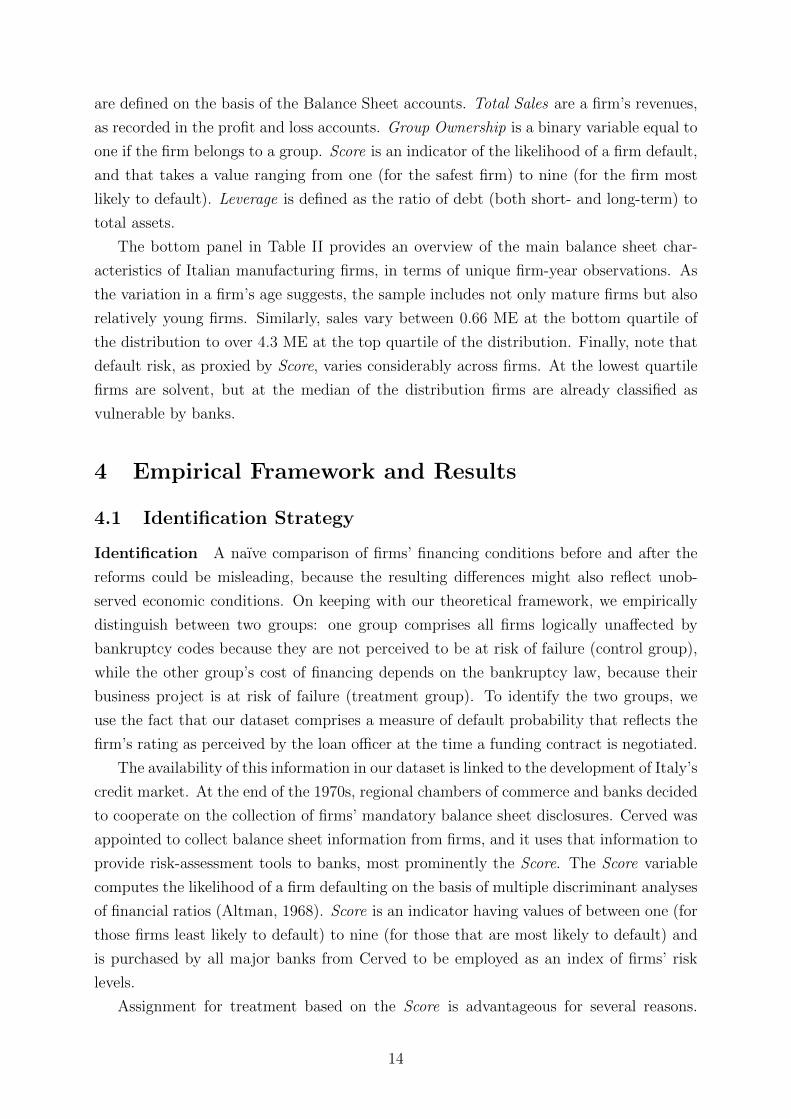
are defined on the basis of the Balance Sheet accounts. Total Sales are a firm’s revenues,
as recorded in the profit and loss accounts. Group Ownership is a binary variable equal to
one if the firm belongs to a group. Score is an indicator of the likelihood of a firm default,
and that takes a value ranging from one (for the safest firm) to nine (for the firm most
likely to default). Leverage is defined as the ratio of debt (both short- and long-term) to
total assets.
The bottom panel in Table II provides an overview of the main balance sheet char-
acteristics of Italian manufacturing firms, in terms of unique firm-year observations. As
the variation in a firm’s age suggests, the sample includes not only mature firms but also
relatively young firms. Similarly, sales vary between 0.66 ME at the bottom quartile of
the distribution to over 4.3 ME at the top quartile of the distribution. Finally, note that
default risk, as proxied by Score, varies considerably across firms. At the lowest quartile
firms are solvent, but at the median of the distribution firms are already classified as
vulnerable by banks.
4 Empirical Framework and Results
4.1 Identification Strategy
Identification A naıve comparison of firms’ financing conditions before and after the
reforms could be misleading, because the resulting differences might also reflect unob-
served economic conditions. On keeping with our theoretical framework, we empirically
distinguish between two groups: one group comprises all firms logically unaffected by
bankruptcy codes because they are not perceived to be at risk of failure (control group),
while the other group’s cost of financing depends on the bankruptcy law, because their
business project is at risk of failure (treatment group). To identify the two groups, we
use the fact that our dataset comprises a measure of default probability that reflects the
firm’s rating as perceived by the loan officer at the time a funding contract is negotiated.
The availability of this information in our dataset is linked to the development of Italy’s
credit market. At the end of the 1970s, regional chambers of commerce and banks decided
to cooperate on the collection of firms’ mandatory balance sheet disclosures. Cerved was
appointed to collect balance sheet information from firms, and it uses that information to
provide risk-assessment tools to banks, most prominently the Score. The Score variable
computes the likelihood of a firm defaulting on the basis of multiple discriminant analyses
of financial ratios (Altman, 1968). Score is an indicator having values of between one (for
those firms least likely to default) to nine (for those that are most likely to default) and
is purchased by all major banks from Cerved to be employed as an index of firms’ risk
levels.
Assignment for treatment based on the Score is advantageous for several reasons.
14
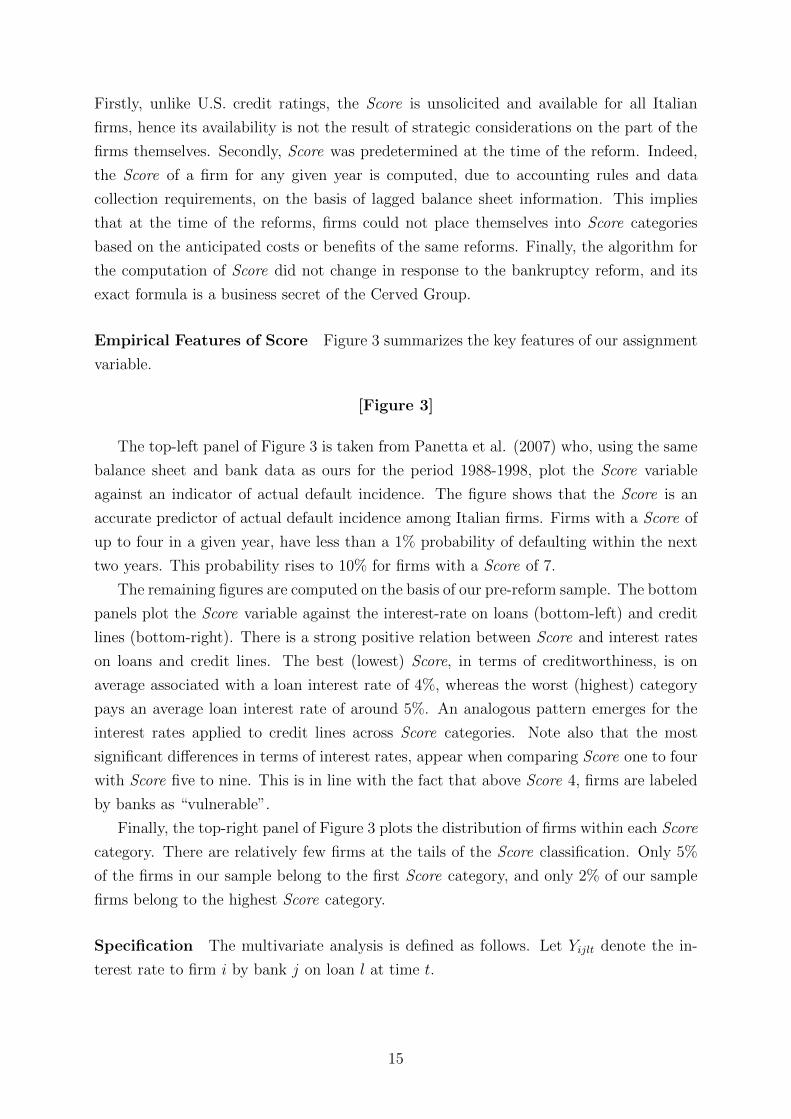
Firstly, unlike U.S. credit ratings, the Score is unsolicited and available for all Italian
firms, hence its availability is not the result of strategic considerations on the part of the
firms themselves. Secondly, Score was predetermined at the time of the reform. Indeed,
the Score of a firm for any given year is computed, due to accounting rules and data
collection requirements, on the basis of lagged balance sheet information. This implies
that at the time of the reforms, firms could not place themselves into Score categories
based on the anticipated costs or benefits of the same reforms. Finally, the algorithm for
the computation of Score did not change in response to the bankruptcy reform, and its
exact formula is a business secret of the Cerved Group.
Empirical Features of Score Figure 3 summarizes the key features of our assignment
variable.
[Figure 3]
The top-left panel of Figure 3 is taken from Panetta et al. (2007) who, using the same
balance sheet and bank data as ours for the period 1988-1998, plot the Score variable
against an indicator of actual default incidence. The figure shows that the Score is an
accurate predictor of actual default incidence among Italian firms. Firms with a Score of
up to four in a given year, have less than a 1% probability of defaulting within the next
two years. This probability rises to 10% for firms with a Score of 7.
The remaining figures are computed on the basis of our pre-reform sample. The bottom
panels plot the Score variable against the interest-rate on loans (bottom-left) and credit
lines (bottom-right). There is a strong positive relation between Score and interest rates
on loans and credit lines. The best (lowest) Score, in terms of creditworthiness, is on
average associated with a loan interest rate of 4%, whereas the worst (highest) category
pays an average loan interest rate of around 5%. An analogous pattern emerges for the
interest rates applied to credit lines across Score categories. Note also that the most
significant differences in terms of interest rates, appear when comparing Score one to four
with Score five to nine. This is in line with the fact that above Score 4, firms are labeled
by banks as “vulnerable”.
Finally, the top-right panel of Figure 3 plots the distribution of firms within each Score
category. There are relatively few firms at the tails of the Score classification. Only 5%
of the firms in our sample belong to the first Score category, and only 2% of our sample
firms belong to the highest Score category.
Specification The multivariate analysis is defined as follows. Let Yijlt denote the in-
terest rate to firm i by bank j on loan l at time t.
15

Yijlt = constant+ αTreatmenti + β (Treatmenti × After Reorganizationt)
+ γ (Treatmenti × Interim Periodt)
+ δ (Treatmenti × After Liquidationt)
+ Xijltκ+ Zitω +Bit−1µ
+ Firm×Bank +Quartert + εijlt
where Treatmenti is a dummy variable equal to one for firms which in 2004 had a Score
of between five and nine, or to 0 otherwise. This classification has two advantages. First,
it mirrors the split of the Score categories at which bankruptcy rates and interest rates
start to increase significantly. Second, it enables the construction of larger treatment and
control groups to limit the influence of extreme observations.
After Reorganization, Interim Period and After Liquidation are time dummies as-
sociated with the thresholds of the reforms. These dummies take a value of 0 prior to the
reform, and of 1 thereafter. The reform of the reorganization procedure was implemented
in the first quarter of 2005, therefore After Reorganization takes a value of 1 from the
first quarter of 2005 onwards. In May 2005 the government was mandated by the par-
liament to reform liquidation procedures, so Interim Period takes a value of 1 starting
from the third quarter of 2005. Finally, the reform of liquidation procedures was enacted
in January 2006, then After Liquidation is equal to 1 from the first quarter of 2006.23
The interaction between the treatment and reform indicators identifies the impact
of each reform on the loan interest rates. Under Prediction 1 the sign of coefficient β is
ambiguous: it would be negative in a setting that emphasizes the presence of coordination
gains (Gertner and Scharfstein, 1991), but positive in one that emphasizes the presence
of agency costs (Hart and Moore, 1988; Fudenberg and Tirole, 1990). Under Prediction
2 the sign of δ is negative: we expect an unambiguous decrease in interest rates following
the reform of liquidation procedures (Harris and Raviv, 1990; Hart and Moore, 1994).
The model also includes wealth of loan and firm characteristics. Xijlt are loan charac-
teristics, such as maturity, collateral, and loan size.24 Zit denotes firm financing character-
istics as constructed from the Central Credit Register. Bit−1 are balance sheet variables
measured in the calendar year prior to the contract. εijlt denotes the error term, clustered
at the firm level. The inclusion of Firm × Bank fixed effects means that we not only
control for firm or bank time-invariant characteristics, but also for match-specific charac-
teristics. Thus we effectively take advantage of the variations in the cost of finance within
23In Appendix B, Figure 6 provides a detailed timeline of the Italian bankruptcy reform process.24The use of this information as control variables is consistent with the empirical studies based on loan
level data (Santos, 2011, Jimenez et al., 2011). However, we acknowledge that non-price dimensions mightsimultaneously change after the reforms. Therefore, we re-estimate our baseline specification excludingloan characteristics, and obtain the same results.
16

the same firm-bank relationship over time.
We first estimate our main specification above and then extend our analysis in two
different ways. Firstly, we consider the impact of the Italian reform on the cost of credit
lines. Although credit lines represent a significantly smaller fraction of total bank financ-
ing than loans do, they offer two advantages from the point of view of our empirical
analysis. To begin with, in our dataset the interest rate on each credit line is observed
continuously over time. Therefore we can track credit lines that straddle the legal reforms
to analyse interest rate variations for the same contract directly before and after the the
reform. Moreover, in a typical credit line contract, banks maintain the right to modify
the pricing terms of the relationship upon occurrence of contract-specified events, such
as legal reforms. This implies that anticipation effects are less likely to matter for this
type of financing. Finally, we extend our analysis by studying the impact of the reform
on other contract dimensions, such as maturity and collateral.
4.2 Price Effects
Differences-In-Differences Plots Before turning to the multivariate analysis, it is
useful to look at naıve differences-in-differences plots. Figure 4 provides a first insight
into changes in those unconditional average interest rates set on newly-issued loans (top
panels) and credit lines (bottom panel) between the second quarter of 2004 and the fourth
quarter of 2007. Vertical lines represent legislative reforms made during the first quarter
of 2005 as a result of Italian Legislative Decree no. 35, and during the first quarter of
2006 as a result of Italian Law no. 5.
[Figure 4]
The left panels of Figure 4 separately plot average interest rates for control firms
(black line, square) and average interest rates for treated firms (red line, triangle). They
show that average interest rates increased for both groups during the sample period. The
right panels of figure 4 plot the difference in average interest rates between the two groups
of firms for each quarter. The fact that the rates for both groups followed similar time
trends before the first reform, seems to validate the common trend assumption embedded
in the DID setting.
When Italian Legislative Decree no. 35 was passed at the beginning of 2005, the differ-
ence in loan and credit line rates increased. Upon the announcement of legal action over
the liquidation procedure, loan rate differences dropped significantly by approximately
ten basis points. This suggests that anticipation effects in the ‘intermediate’ period might
complicate the empirical assessment of the liquidation reform.25 After the actual passing
25For instance, in a press release to ANSA (Italian press agency) in November 2005, the general directorof the Italian Banks Association stated that the approach taken by the government with respect to the
17

of Italian Law no. 5, interest rate differences decreased again to around 45 basis points.
Interestingly, it was precisely at the time that Italian Law no. 5 was passed, that the drop
in credit line differences occurred. This is in keeping with the automatic renegotiation
mechanisms in place for credit lines, which as a result are less subject to anticipation
effects. To better judge the statistical significance of these variations in interest rates, we
turn to multivariate analysis.
Multivariate Analysis Table III estimates the DID specification by OLS, clustering
standard errors at the firm level.26
[Table III]
Prediction 1 and the ensuing discussion, would seem to show that reorganization in
bankruptcy can give rise to a theoretical trade-off. On the one hand, a structured pro-
cedure of reorganization improves creditor coordination (Gertner and Scharfstein, 1991).
On the other hand, in the presence of asymmetric information, renegotiation impairs a
creditor’s ability to cope with a firm’s agency problems (Hart and Moore, 1988; Fuden-
berg and Tirole, 1990). The DID estimates of the impact of the reorganization reform
suggest that the reform raised the cost of loan financing for treated firms compared with
control firms. Estimates in column 1 show that the interest rates applied to affected firms,
compared with unaffected firms, increased by 4.3 basis points in the 6 months following
introduction of the new reorganization procedure. This corresponds to an increase of con-
ditional baseline differences of 17.5%. The implication for Prediction 1 is that the weaker
repayment incentives caused by renegotiation outweigh efficiency gains due to greater
creditor coordination.
According to Prediction 2, the new design of the liquidation procedure will result in
larger liquidation values and, accordingly, in less costly funding (Harris and Raviv, 1990;
Hart and Moore, 1994). In keeping with these insights, we find that the liquidation reform
reduced interest rates differences of affected firms compared to unaffected firms, after
2006. This result leads us to deduce that since the reform of the liquidation procedure,
the distribution of liquidation proceeds in a faster, more orderly fashion. The magnitude
of the coefficient is close to the estimate of the reorganization reform, and suggests that
these effects could empirically wash out when assessing simultaneous reforms.
In keeping with our identification strategy, the interest rate variations are larger (seven
basis points) when comparing control group firms with a subsample of treated firms that
are perceived to be significantly more likely to default (categories 7 to 9). Column 3 shows
that these results are not due to any arbitrary assignment to treatment and control groups,
reform of the liquidation procedure was perfectly acceptable, but that it was still necessary to implementsaid reform as soon as possible.
26In Appendix B, Table XIV shows that price estimates on credit lines are similar to price estimateson loans. Results also hold when considering only those credit lines actually utilized, as in Table XV.
18

by interacting the dummies associated to the legal changes with the Score indicator itself.
Using this approach, the interest rate differences between the lowest and highest Score
indicator, increased by 18 basis points following enactment of Italian Legislative Decree
no. 35.
The regressions in Table III include a number of controls at firm and contractual level.
We do not offer any causal statements regarding their interpretation, but merely note
that their impact, and possible interpretation, is in line with previous empirical studies
(Strahan, 1999; Davydenko and Franks, 2008; Santos, 2011).27
Creditor Coordination Gains According to Prediction 3, firms with a greater num-
ber of banks, and thus a lower degree of loan concentration, should experience a larger
reduction in interest rates following the reforms. This supposition follows from the finding
in Gertner and Scharfstein (1991), according to which a structured reorganization proce-
dure allows creditors to coordinate and limit the scope for holdouts, and Von Thadden
et al. (2010), who show that in the presence of a structured in-court reorganization pro-
cedure strengthening creditor rights generates benefits that increase with the number of
firm creditors. To verify this, we construct two indicators of creditor-coordination prob-
lems. The first is based on the number of banks a firm deals with, and the second is a
Herfindahl index of loan concentration. The use of a Herfindahl index allows us to take
account of the fact that certain banking relations are of negligible importance in terms
of the amounts granted. The indicators were computed for 2004, since after that year
they might have changed as a consequence of the reforms. Table IV re-estimates our DID
specification for subsamples split on the basis of the median of these two indicators.
[Table IV]
The first two columns of Table IV report coefficient estimates when the sample is split
according to the indicator of the number of banks: firms with a number of bank relations
larger than the median in our sample (equal to 4) are deemed to have larger coordination
problems. The benefits of the reforms mainly accrued to firms with a large number of
bank relations. For firms with more than four bank relations, the increase in interest rates
following the introduction of Italian Legislative Decree no. 35 was significantly smaller
than it was for those firms with a low number of bank relations. The decrease in interest
27In Appendix B, Table XII reports a number of robustness checks. Column (1) excludes loan con-trol variables. Column (2) clusters standard errors at bank level. Columns (3) and (4) address issuesconcerning the definition of our assignment variable. Column (3) excludes firms that changed the as-signment group after 2004. Column (4) classifies firms into treatment and control group on the basis oftheir yearly Score indicator, in order to address concerns that the fall in interest rates following ItalianLaw no. 5 might be driven by attrition within the treatment-group sample. Columns (5) to (7) includetime interactions with fixed bank, industry and region effects. Finally, in the same appendix, Table XIIIincludes two measures of a firm’s banking relationships. The first is an indicator of change in the numberof banks the firm deals with, while the second is an indicator of changes in the identity of the firm’sbanks. Results remain unchanged.
19

rates following the liquidation reforms, was significantly larger for the group of firms with
a high number of bank relations. The assumption that the coefficients of both reforms
were equal across sub-samples is rejected, lending support to the idea that the benefits
of both reforms mainly accrued to firms with substantial gains from coordination. This
conclusion is confirmed if loan concentration is used to split the sample.
4.3 Alternative Interpretations: Demand Shocks and Credit
Market Cycles
We interpreted estimates from the DID regression as being the result of successive re-
forms of Italian bankruptcy procedures, which have affected banks’ pricing policy. At
the same time, prices of loan contracts may also have changed due to other factors, such
as unobserved demand shocks or credit market cycles. These can be of importance to
our empirical strategy, because our treatment and control groups are not randomized and
could be differentially affected by either demand shocks or credit cycles. To address both
concerns, we first document the absence of differential demand shocks over the sample
period, and we show that proxying for such shocks in the DID estimates does not affect
the results. We also re-estimate our main specification, controlling for the existence of
credit market cycles during the sample period.
Demand Shocks In order to address the issue of demand shocks, we rely on the infor-
mation contained in the Invind survey of manufacturing firms. Each year the survey asks
the top management of each firm about their year-ahead forecasts of sales growth, prices
and productive capacity.28
To check the robustness of our main results to demand shocks, we embed these forecasts
into our multivariate DID specification. We proceed as follows: for each year, we impute
to each firm in our sample in a particular bin, the average forecast sales, price and capacity
as calculated from the Invind database over the corresponding bin.29 We then re-estimate
28In Appendix B Figure 7 we provide a graphical check of the effect of differential demand shocks ontreatment and control firms. The left panels of the figure separately plot average forecasts for controlfirms (black line, square) and treated firms (red line, triangle). The right panels plot the difference inforecasts between the two groups of firms for each year. The top panels in Figure 7 plot forecasts of salesgrowth. Between 2001 and 2007, the average forecast sales growth for the treatment group firms was6-7%, but only 5% for those firms in the control group. As long as these differences remain constant, theydo not invalidate our DID framework. The right panel shows that during our sample period (2004-2007),differences in sales forecasts were stable at two percentage points. Since demand shocks can also bechanneled through prices, we plot price forecasts for own-production in the middle panel. Differences inprice forecasts seem small in magnitude and statistically not significantly different from zero. The bottompanel plots forecasts of productive capacity for both treatment and control firms. If firms were to differin their forecasted use of productive capacity, we would expect such differences to materialize in higherinvestment and financing needs. However, in terms of their use of productive capacity, both groups offirms seem to display similar trends.
29We use three specifications of bins. The first is constructed by matching a firm’s industry codewith the binary treatment indicator (Sic*TC ), the second by matching a firm’s industry code with Score
20

our baseline loan-interest rate specification. Our results are shown in Table V, where each
column considers a different proxy for the demand shock.
[Table V]
Each set of columns is divided according to the three bins: Sic*TC, Sic*Score, Sic*Size.
Table V documents that demand factors do not confound our estimates of the impact of
the bankruptcy procedure reforms. All estimates of the impact of reorganization and
liquidation remain similar both in terms of magnitude and precision. Only forecasts
on productive capacity seem to impact the loan-financing conditions of firms: a higher
capacity utilization implies higher investment needs, and thus an increases in the price of
the loan contract.
Credit Cycles Another potential threat to the causal interpretation of our results is
the behaviour of international credit markets during the sample period. In this case, the
argument is that during the period leading up to the crash of Lehman Brothers, credit
markets were booming, and riskier firms were able to obtain loans at better interest rates.
The presence of a credit boom could account for the lower interest rate differences after
2006, although it would not be consistent with the hike in interest rate differences after the
introduction of the reorganization procedure. To address this issue, we proceed as follows.
First we construct a proxy for international credit markets cycles. We collect information
on Moody’s corporate bond yields from the Federal Reserve Board30 and compute variable
US BAA/AAA as the difference between yields on US corporate triple A-rated bonds and
Baa-rated bonds. Then, we augment our DID specification by interacting the treatment
group indicator with this proxy. Alternatively, we include a time trend in the Score
variable itself. Results are shown in Table VI.
[Table VI]
In both specifications, the magnitude and statistical significance of our estimates re-
main unchanged. Our proxy for international credit market conditions in column 1 is
negative and not significant. This result is not surprising, since Italian banks were not
involved in the type of financial deals underlying the 2008 financial crisis.31 In addition,
Italy’s housing market did not experience a housing bubble, which could have fueled a
domestic credit boom. Column 2 shows that even time trends in the Score variable do
not alter our price estimates.
(Sic*Score), and the third by matching a firm’s industry code with size dummies (Sic*Size). If we cannotconstruct an average forecast in a given cell, we assign the industry-year average forecast.
30http://www.federalreserve.gov/releases/h15/current/31For instance, no Italian bank received bailout funds from the government during the Lehman crisis.
21
4.4 Alternative Identification Strategies: Exploiting Thresholds
We then take advantage of the fact that credit lines are easier to track empirically across
time, and employ two alternative identification strategies.
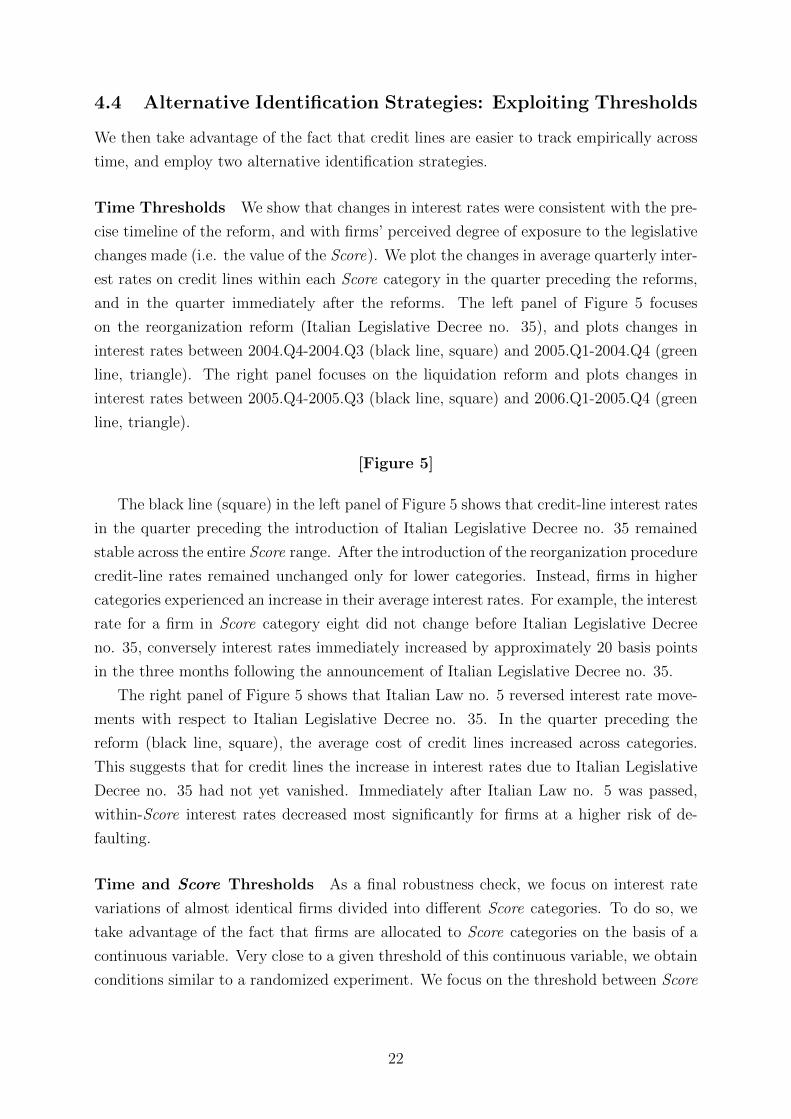
Time Thresholds We show that changes in interest rates were consistent with the pre-
cise timeline of the reform, and with firms’ perceived degree of exposure to the legislative
changes made (i.e. the value of the Score). We plot the changes in average quarterly inter-
est rates on credit lines within each Score category in the quarter preceding the reforms,
and in the quarter immediately after the reforms. The left panel of Figure 5 focuses
on the reorganization reform (Italian Legislative Decree no. 35), and plots changes in
interest rates between 2004.Q4-2004.Q3 (black line, square) and 2005.Q1-2004.Q4 (green
line, triangle). The right panel focuses on the liquidation reform and plots changes in
interest rates between 2005.Q4-2005.Q3 (black line, square) and 2006.Q1-2005.Q4 (green
line, triangle).
[Figure 5]
The black line (square) in the left panel of Figure 5 shows that credit-line interest rates
in the quarter preceding the introduction of Italian Legislative Decree no. 35 remained
stable across the entire Score range. After the introduction of the reorganization procedure
credit-line rates remained unchanged only for lower categories. Instead, firms in higher
categories experienced an increase in their average interest rates. For example, the interest
rate for a firm in Score category eight did not change before Italian Legislative Decree
no. 35, conversely interest rates immediately increased by approximately 20 basis points
in the three months following the announcement of Italian Legislative Decree no. 35.
The right panel of Figure 5 shows that Italian Law no. 5 reversed interest rate move-
ments with respect to Italian Legislative Decree no. 35. In the quarter preceding the
reform (black line, square), the average cost of credit lines increased across categories.
This suggests that for credit lines the increase in interest rates due to Italian Legislative
Decree no. 35 had not yet vanished. Immediately after Italian Law no. 5 was passed,
within-Score interest rates decreased most significantly for firms at a higher risk of de-
faulting.
Time and Score Thresholds As a final robustness check, we focus on interest rate
variations of almost identical firms divided into different Score categories. To do so, we
take advantage of the fact that firms are allocated to Score categories on the basis of a
continuous variable. Very close to a given threshold of this continuous variable, we obtain
conditions similar to a randomized experiment. We focus on the threshold between Score
22

category 6 and 7,32 because a firm in category 6 is classified as “vulnerable”, whereas a
firm in category 7 is classified as “risky”.
To assess the internal validity of this approach, we check that in the area around
the threshold: firms do not manipulate their Score to put themselves into a given Score
category, and firms possess similar characteristics that are logically unaffected by the
threshold. We first document in Figure 8 of Appendix B that, consistent with our ex-
planations on the computation of Score, there is no evidence of self-selection.33 Table
VII then tests whether firms above and below the threshold are balanced in terms of
characteristics logically unaffected by the threshold (Imbens and Lemieux, 2007). The
table presents findings for firms within different windows around the normalized threshold
(±0.15, ±0.2, ±0.25). Pre-assignment characteristics include a firms’ activity code and
location. Other firm characteristics include ownership and financing structures.
[Table VII]
Table VII shows that firms marginally above and below the threshold are roughly
balanced with respect to pre-assignment characteristics. Differences between firms in
terms of pre-assignment characteristics are small and statistically non-significant in most
windows around the threshold. This contrasts with a comparison of the entire range of
firms within Score 6 and 7, as well as with the comparison of the entire range of treatment
and control firms. For example, firms in category 6 are less likely to be operating in the
food sector, but more likely to be operating in a SIC code starting with 2, and more likely
to be localized in Rome or Milan.
Table VIII reports separate OLS estimations of the impact of the bankruptcy reforms
on interest rates, using observations from the quarters around the time the legislative
changes were made, and regarding firms close to the threshold between Score category 6
and 7.
[Table VIII]
The estimates from the threshold regressions show that financing conditions for virtu-
ally identical firms changed upon the introduction of the reorganization procedure. Firms
marginally below the threshold, classified as category 7, experienced an increase in inter-
est rates of approximately 5 to 8 basis points compared with firms marginally above the
threshold, classified as category 6. These estimates are statistically significant and larger
32The support of the continuous variable for Score categories 6 and 7 ranges from 1.5 to -0.6, and thethreshold lies at 0.15. Below the threshold, a firm’s Score is 7. Above the threshold, a firm’s Score is 6.
33In Appendix B Figure 8 plots the empirical distribution of firms around the threshold for categories 6and 7 using size bins of 0.01. The threshold is normalized to 0 and firms in Score category 7 are situatedbelow the dotted line (dark grey bars). The figure shows that self-assignment to categories 6 and 7 seemsunlikely. Indeed, firms not only ignore the methodology to be followed when computing the underlyingcontinuous variable, but they also ignore the thresholds that are selected for each category.
23

in magnitude than the ones from the main specification.34 The estimates relating to the
reform of the liquidation procedure are negative and similar in magnitude to the ones
from the main specification, albeit not statistically significant.
4.5 Non-Price Effects
In addition to our analysis of the impact of the reforms on the interest rate differences,
we also examine the effects on other aspects of loan contracts triggered by the reforms.
[Table IX]
We employ our main DID specification for the analysis of non-price dimensions. The
dependent variable in column (1) of Table IX is Secured Lending, defined as the amount of
real secured lending compared to total financing granted at firm-bank level. The estimates
show that there was a significant - approximately 0.3 percentage point - increase in the
use of secured lending after both legislative reforms. The increase in secured lending that
followed the introduction of reorganization procedures (Italian Legislative Decree no. 35)
can be accounted for quite simply. In the presence of moral hazard, the use of collateral
reduces agency costs and raises pledgeable income (Tirole, 2006, chapter 4). The evidence
of increased interest rate differences after the introduction of Italian Legislative Decree
no. 35, suggests that the reform exacerbated agency problems, and therefore it is natural
to expect a rise in the volume of collateralized lending. At the same time, the increase in
secured lending observed after the introduction of the new liquidation procedures, is in
keeping with the views of Von Thadden et al. (2010), who show that if liquidation values
grow, the total collateral supplied by the enterprise to be seized in bankruptcy, rises.
Column (2) shows details of the change in the maturities of bank financing. Short Term
Lending is defined as the amount of lending with maturity of less than one year, compared
to total financing granted at firm-bank level. The result that Italian Law no. 5 has reduced
short-term lending by 1 percentage point is consistent with the findings of Hart and Moore
(1994) and Shleifer and Vishny (1992). The former show that larger liquidation values
make longer debt contracts feasible. The latter study the trade-off between the benefit
of debt overhang in constraining management, and liquidation costs. Given that higher
liquidation values make long-term contracts more attractive (Benmelech, 2009), Shleifer
and Vishny (1992) predict an increase in debt maturity with liquidation value. This result
confirms the conclusions of Benmelech et al. (2005).
The dependent variable in column (3) is Number of Banks, defined as the total number
of individual banks that grant financing at firm level. The number of firm-bank rela-
tionships significantly increased following the reform of the liquidation procedure. This
34As the idea of a quasi-natural experiment would suggest, introducing or omitting variables does notmodify our conclusions. Moreover, as we introduce firm-bank fixed effects in the specification, we cannotalso include the time invariant running variable. Cross-sectional estimates, including the polynomial inthe running variable, yield very similar estimates (tables available upon request).
24

outcome is again in keeping with the theoretical insights in von Thadden et al. (2010).
The latter show that in the presence of an in-court reorganization procedure and asym-
metric information, strengthening individual creditors’ rights makes contracting with two
creditors more profitable than with a single creditor.35
Column (4) analyses the impact of the legislative reforms on leverage at firm level.
Leverage is defined as the total loans granted by banks to a firm compared to the book
value of the firm’s assets. In a contracting environment a-la-Tirole (2006), chapter 3, with
perfectly inelastic supply and competitive financial markets, the size of a loan depends
on the nature of the business project. In Appendix B, Figure 7, we show that forecasted
demand conditions, that is, the distribution of business projects, did not change discon-
tinuously during our sample period, and thus we expect Italian Legislative Decree no. 35
and Italian Law no. 5 to have no impact on company leverage.
We use the annual Invind Survey to study the effect of the reforms on credit con-
straints. Firms are asked whether they originally wanted more credit at current or higher
interest rates, but were turned down. Following Guiso and Parigi (1999), we classify a
firm as credit-constrained if it requested more credit but failed to obtain such. The sam-
ple in column (5) ranges from 2002 to 2007, and the specification includes controls for
forecast demand. The specification includes fixed firm effects, and thus takes advantage
of the time-variation in credit constraints for the same firm. We show that the share of
credit-constrained firms decreased by 2.7 percentage points after 2004, corresponding to
a 30% reduction in credit constraints.
5 Conclusion
Despite the wealth of theories on how the design of financial contracts depends on the
two instruments in bankruptcy, reorganization and liquidation, there is little evidence on
the subject. The lack of thorough empirical evidence is mostly due to the problem of
disentangling and interpreting reforms that change different legal instruments at one and
the same time. We provide new evidence by using the staggered nature of the Italian
bankruptcy law reform of 2005 and 2006 to examine the impact of legislation on firms’
cost of finance, using a loan-level dataset covering the universe of firm funding contracts.
Our initial finding shows that the negative effects of bankruptcy reorganization on re-
payment incentives outweigh the positive effects of improved creditor coordination. Our
second finding is that the increased firm liquidation values resulting from the new liqui-
dation procedure leads to a significant reduction in the cost of finance. Our third finding
consists in the identification of gains from creditor coordination in bankruptcy.
35In the absence of a structured renegotiation procedure, Bolton and Scharfstein (1996) show that anincrease in liquidation values following the strengthening of creditor rights (as for Italian Law no. 5)would have reduced the number of creditor relationships.
25

These outcomes have important implications not only in terms of their theoretical
relevance, but also because they enable us to understand the distinct consequences of the
design of reorganization and liquidation procedures on the cost of finance. The Italian
reorganization procedure introduced by the 2005-2006 reform shares important analogies
with U.S. Chapter 11: in both, the entrepreneur can unilaterally file for the opening
of the reorganization phase and stay in charge of the company while renegotiating with
creditors. Moreover, the decision over the restructuring plan is taken via a creditor vote
and the judge can enforce a plan despite the objections of some creditors (cram-down).
The Italian reforms of the bankruptcy code also share important features with recent
reforms in other OECD countries, like Brazil. More specifically, the content of the Italian
bankruptcy reform is analogous to the bankruptcy reforms that took place in European
countries like France and Spain.36 Indeed since the early 2000s the European Commission
pushed for the adoption by member states of bankruptcy codes embedding restructuring
procedures analogous to U.S. Chapter 11.
References
[1] Acharya, V., Subramanian, K., 2009, “Bankruptcy Codes and Innovation”, Review
of Financial Studies, 22(12), 4949-4988.
[2] Acharya, V., Sundaram, K., John, K., 2011, “Cross-Country Variations in Capital-
Structures: The Role of Bankruptcy Codes”, Journal of Financial Intermediation,
20(1), 25-54.
[3] Aghion, P., Bolton, P., 1992, “An Incomplete Contracts Approach to Financial Con-
tracting”, Review of Economic Studies, 59(3), 473-494.
[4] Altman, E. I., 1968, “Financial Ratios, Discriminant Analysis and the Prediction of
Corporate Bankruptcy”, Journal of Finance, 23(4), 589-609.
[5] Asquith, P., Gertner, R., Scharfstein, D., 1994, “Anatomy of Financial Distress: An
Examination of Junk Bond Issuers”, Quarterly Journal of Economics, 109(3), 625-
658.
[6] Assuncao, J. J., Benmelech, E., Silva, F. S. S., 2012, “Repossession and Democrati-
zation of Credit”, unpublished manuscript.
[7] Bae, K., Goyal, V. K., 2009, “Creditor Rights Enforcement, and Bank Loans”, Jour-
nal of Finance, 64(2), 823-860.
36Though in these two cases the ensuing reform changed reorganization and liquidation procedures atthe same time.
26

[8] Bank of Italy, 2009, Annual Report.
[9] Benmelech, E., 2009, “Asset Salability and Debt Maturity: Evidence from
Nineteenth-Century American Railroads”, Review of Financial Studies, 22(4), 1545-
1584.
[10] Benmelech, E., Bergman, N. K., 2011, “Bankruptcy and the Collateral Channel”,
Journal of Finance, 66(2), 337-378.
[11] Benmelech, E., Garmaise, M. J., Moskowitz, T. B., 2005, “Do Liquidation Values
Affect Financial Contracts? Evidence from Commercial Loan Contracts and Zoning
Regulation”, Quarterly Journal of Economics, 120(3), 1121-1154.
[12] Berglof, E., Von Thadden, E. L., 1994, “Short-Term Versus Long-Term Interests:
Capital Structure with Multiple Investors”, Quarterly Journal of Economics, 109(4),
1055-1084.
[13] Berkowitz, J., White, M. J., 2004, “Bankruptcy and Small Firms Access to Credit”,
Rand Journal of Economics, 35(1), 69-84.
[14] Bolton, P., Scharfstein, D., 1996, “Optimal Debt Structure and the Number of Cred-
itors”, Journal of Political Economy, 104(1), 1-25.
[15] Bonaccorsi Di Patti, E., Gobbi, G., 2007, “Winners or Losers? The Effects of Banking
Consolidation on Corporate Borrowers”, Journal of Finance, 62(2), 669-695.
[16] Bris, A., Welch, I., Zhou, N., 2006, “The Costs of Bankruptcy: Chapter 7 Liquidation
versus Chapter 11 Reorganization”, Journal of Finance, 61(3), 1253-1303.
[17] Cerqueiro, G., Ongena, S., Roszbach, K., 2012, “Collateralization, Bank Loan Rates
and Monitoring: Evidence from a Natural Experiment”, Working Paper Series 257,
Sveriges Riksbank (Central Bank of Sweden).
[18] Costantini, J., 2009, “Effects of Bankruptcy Procedures on Firm Restructuring:
Evidence from Italy”, unpublished manuscript.
[19] Davydenko, S. A., Franks, J. R., 2008, “Do Bankruptcy Codes Matter? A Study of
Defaults in France, Germany and the UK”, Journal of Finance, 63(2), 565-608.
[20] Detragiache, E., Garella, P., Guiso, L., 2000, “Multiple versus Single Banking Rela-
tionships: Theory and Evidence”, Journal of Finance, 55(3), 1133-1161.
[21] Dewatripont, M., Tirole, J., 1994. “A Theory of Debt and Equity: Diversity of
Securities and Manager-Shareholder Congruence”, Quarterly Journal of Economics,
109(4), 1027-1054.
27

[22] Djankov, S., Hart, O., McLiesh C., Shleifer, A., 2008, “Debt Enforcement around
the World”, Journal of Political Economy, 116(6), 1105-1149.
[23] Franks, J., R., Sussman, O., 2005, “Financial Distress and Bank Restructuring of
Small to Medium Size UK Companies”, Review of Finance, 9, 65-96.
[24] Franks, J., R., Torous, W., 1994, “A Comparison of Financial Restructuring in Dis-
tress Exchanges and Chapter 11 Reorganizations”, Journal of Financial Economics,
35, 349-370.
[25] Fudenberg, D., Tirole, J., 1990, “Moral Hazard and Renegotiation in Agency Con-
tracts”, Econometrica, 58, 1279-1320.
[26] Gale, D., Hellwig, M., 1985, “Incentive-Compatible Debt Contracts: The One Period
Problem”, Review of Economic Studies, 52(4), 647-663.
[27] Gertner, R., Scharfstein, D., 1991, “A Theory of Workouts and the Effects of Reor-
ganizational Law”, Journal of Finance, 46(4), 1189-1222.
[28] Gilson, S., 1997, “Transactions Costs and Capital Structure Choice: Evidence from
Financially Distressed Firms”, Journal of Finance, 52(1), 161-196.
[29] Gropp, R., Scholz, J. K., White, M. J., 1997, “Personal Bankruptcy and Credit
Supply and Demand”, Quarterly Journal of Economics, 112(1), 217-251.
[30] Guiso, L., Parigi, B., 1999, “Investment and Demand Uncertainty”, Quarterly Jour-
nal of Economics, 114(1), 185-227.
[31] Hackbarth, D., Haselmann, R., Schoenherr, D., 2012, “Distress Risk, Stock Returns,
and the 1978 Bankruptcy Reform Act”, unpublished manuscript.
[32] Harris, M., Raviv, A., 1990, “Capital Structure and the Informational Role of Debt”,
Journal of Finance, 45(2), 321-349.
[33] Hart, O., Moore, J., 1988, “Incomplete Contracts and Renegozation”, Econometrica,
56(4), 755-785.
[34] Hart, O., Moore, J., 1994, “A Theory of Debt Based on the Inalienability of Human
Capital”, Quarterly Journal of Economics, 109(4), 841-879.
[35] Hart, O., Moore, J., 1998, “Default And Renegotiation: A Dynamic Model Of Debt”,
Quarterly Journal of Economics, 113(1), 1-41.
[36] Jimenez, G., Ongena, S., Peydro, J.-L., Saurina, J., 2011, “Hazardous Times for
Monetary Policy: What do Twenty-three Million Bank Loans Say About the Effects
of Monetary Policy on Credit Risk-Taking?”, unpublished manuscript.
28

[37] Jimenez, G., Ongena, S., Peydro, J.-L., Saurina, J., 2012, “Credit Supply and Mon-
etary Policy: Identifying the Bank Balance-Sheet Channel with Loan Applications”,
American Economic Review, 102(5), 2301-2326.
[38] Panetta, F., Schivardi F., Shum, M., (2009), “Do Mergers Improve Information?
Evidence from the Loan Market”, Journal of Money, Credit and Banking, 41(4),
673-709.
[39] Hertzberg, A., Liberti, J. M., Paravisini, D., 2011, “Public Information and Coor-
dination: Evidence From a Credit Registry Expansion”, Journal of Finance, 66(2),
379-412.
[40] Qian, J., Strahan, P. E., 2007, “How Law and Institutions Shape Financial Contracts:
The Case of Bank Loans”, Journal of Finance, 62(6), 2803-2834.
[41] Santos, J. A. C., 2011, “Bank Corporate Loan Pricing Following the Subprime Cri-
sis”, Review of Financial Studies, 24(6), 1916-1943.
[42] Sapienza, P., 2002, “The Effects of Banking Mergers on Loan Contracts”, Journal of
Finance, 57(1), 329-367.
[43] Scott, J. A., Smith, T. C., 1986, “The Effect of the Bankruptcy Reform Act of 1978
on Small Business Loan Pricing”, Journal of Financial Economics, 16, 119-140.
[44] Shleifer, A., Vishny, R. W., 1992, “Liquidation Values and Debt Capacity: A Market
Equilibrium Approach”, Journal of Finance, 47(4), 1343-1366.
[45] Strahan, P. E., 1999, “Borrower Risk and the Price and Non-price Terms of Bank
Loans”, Working Paper Series 90, Federal Reserve Board of New York Staff Report.
[46] Stanghellini, L., 2008, Le Crisi di Impresa tra Diritto ed Economia (Il Mulino,
Bologna).
[47] Stromberg, P., 2000, “Conflicts of Interest and Market Illiquidity in Bankruptcy
Auctions: Theory and Test”, Journal of Finance, 55(6), 2641-2692.
[48] Tirole, J., 2006, The Theory of Corporate Finance (Princeton University Press,
Princeton and Oxford).
[49] Vig, V., 2007, “Access to Collateral and Corporate Debt Structure: Evidence from
a Natural Experiment”, unpublished manuscript.
[50] Von Thadden, E. L., 1995, “Long-Term Contracts, Short-Term Investment and Mon-
itoring”, Review of Economic Studies, 62(4), 557-575.
29

[51] Von Thadden, E. L., Berglof, E., Roland, G., 2010, “The Design of Corporate Debt
Structure and Bankruptcy”, Review of Financial Studies, 23(7), 2648-2679.
[52] Weiss, A. L., 1990, “Bankruptcy Resolution. Direct Costs and Violation of Priority
Claims”, Journal of Financial Economics, 27, 285-314.
6 Tables and Figures
Figure 1: Share of Reorganization Procedures in Total Distress Procedures Over Time
Plot of the ratio of the number of opened reorganization procedures (concordato preventivo) to the total number of opened
distress procedures (reorganization and liquidation). Source: Chambers of Commerce.
30

Figure 2: Duration of Liquidation Procedures Before and After Italian Law No. 5 Reform
Plot of the percentage of liquidation procedures closed within X months before and after introduction of the reform under
Italian Law no. 5. Totals reported on top of bars. Source: Unicredit Bank.
Figure 3: Characteristics of the Score Assignment Variable
The top left panel is taken from Panetta et al. (2007) who, using the same balance sheet and bank data for the period
between 1988 to 1998, plot the Score variable against an indicator of default within the next one (circle) and two years
(triangle). The top right panel plots, for our pre-reform sample (2004.Q2-2004.Q4), the share of firms within each Score
category. The bottom panel, computed on the basis of our pre-reform sample (2004.Q2-2004.Q4), plots the Score variable
against the average interest rate on loans (bottom-left) and credit lines (bottom-right).
31

Figure 4: Differences-in-Differences Plot of Interest Rates
The left panels separately plot average interest rates for control firms (black line, square) and average interest rates for
treated firm categories (red line, triangle). The right panel plots the difference in average interest rates between the two
groups of firms for each quarter. Vertical lines represent legislative reforms that were made in the first quarter of 2005
pursuant to Italian Legislative Decree no. 35, and in the first quarter of 2006 pursuant to Italian Law no. 5. The top panels
plot average interest rates for loans, while the bottom panels plot average interest rates for credit lines.
Figure 5: Within Score Variations At Threshold of Reforms
The figure plots changes in average quarterly interest rates on credit lines within each Score category in the quarter preceding
the reforms and the quarter immediately after the reforms. The left panel of Figure 6 focuses on the reorganization reform
(Italian Legislative Decree no. 35) and plots changes in interest rates between 2004.Q4-2004.Q3 (black line, square) and
2005.Q1-2004.Q4 (green line, triangle). The right panel focuses on the liquidation reform and plots changes in interest rates
between 2005.Q4-2005.Q3 (black line, square) and 2006.Q1-2005.Q4 (green line, triangle).
32

Tab
leI:In
terest
RatesonNewly
-issued
Loansand
Credit
Lines
25th
75th
Sta
nd
ard
Var
iab
leM
ean
Per
centi
leM
edia
nP
erce
nti
leD
evia
tion
Min
Max
N
Newly-issued
loans:
all
Loa
nIn
tere
stR
ates
5.15
4.0
65.0
06.0
31.4
30.1
09.4
2361310
Siz
eof
Loa
n38
3.64
50.0
0120.0
0300.0
02078.0
81.0
0750168.4
4361310
Newly-issued
loans:
ratesbymatu
rity
Sh
ort-
Ter
m(<
1Y
ear)
5.24
4.1
05.0
76.2
51.5
30.2
89.4
2235460
Med
ium
-Ter
m(1
-5
Yea
rs)
5.08
4.1
04.9
95.9
31.2
60.1
09.4
285234
Lon
g-T
erm
(>5
Yea
rs)
4.74
3.8
44.6
35.4
91.0
90.4
49.4
040616
Newly-issued
loans:
ratesbyguara
ntee
Un
secu
red
4.79
3.8
04.6
65.5
91.3
30.1
09.4
2151693
Rea
l4.
513.6
34.3
45.2
91.1
00.3
19.2
46944
Per
son
al5.
494.3
85.3
66.4
41.4
50.1
09.4
2170979
Rea
lan
dP
erso
nal
4.92
3.9
44.8
15.7
51.2
20.4
49.3
912684
Oth
er5.
354.2
25.2
16.3
11.5
00.6
99.4
219010
Cre
dit
Lines
Cre
dit
Lin
eIn
tere
stR
ates
9.03
7.2
28.7
510.8
42.6
52.7
922.8
12864748
Gra
nte
dC
red
itL
ine
123.
9420.0
045.8
9100.0
0926.9
70.0
0470000.0
04207552
Pool
edlo
an-l
evel
dat
afo
rth
ep
erio
d20
04.Q
2-20
07.Q
4.
Ob
serv
ati
on
sare
at
the
loan
-qu
art
erle
vel,
an
dm
on
etary
valu
esare
exp
ress
edin
KE
(1,0
00E
uro
s).
Loa
nIn
tere
stR
ate
isgr
oss
annu
al
inte
rest
rate
incl
usi
ve
of
part
icip
ati
on
fees
,lo
an
ori
gin
ati
on
fees
,an
dm
onth
lyse
rvic
ech
arge
s.S
ize
of
Loa
nis
the
gran
ted
amou
nt
ofth
eis
sued
term
loan
.M
atu
rity
isa
set
of
bin
ary
vari
ab
les
ind
icati
ng
wh
eth
erth
em
atu
rity
ofth
en
ewly
-iss
ued
loan
sis
up
to1
year
,b
etw
een
1an
d5
yea
rs,
or
more
than
5ye
ars
.G
uara
nte
eis
ase
tof
bin
ary
vari
ab
les
ind
icati
ng
wh
eth
erth
elo
anh
asn
oco
llat
eral
(Un
secu
red
),on
lyre
al
coll
ate
ral
(Rea
l),
on
lyp
erso
nal
coll
ate
ral
(Per
son
al)
,b
oth
(Rea
lan
dP
erso
nal)
,or
isu
nm
atch
ed(O
ther
).C
redit
Lin
eR
ate
isth
en
etan
nu
al
inte
rest
rate
on
the
cred
itli
ne.
Gra
nte
dC
redit
Lin
eis
the
tota
lcr
edit
lin
eth
efi
rmw
asgr
ante
dby
the
ban
kfo
ra
give
nqu
arte
r.
33

Tab
leII
:Financing
Structure&
BalanceSheetIn
formation
25th
75th
Sta
nd
ard
Var
iab
leM
ean
Per
centi
leM
edia
nP
erce
nti
leD
evia
tion
Min
Max
N
FinancingStructu
reT
erm
Loa
ns
/T
otal
Ban
kF
in.
0.37
0.1
90.3
50.5
20.2
20.0
01.0
0240277
Cre
dit
Lin
es/
Tot
alB
ank
Fin
.0.
140.0
50.1
00.1
90.1
30.0
01.0
0240277
Bac
ked
Loa
ns
/T
otal
Ban
kF
in.
0.49
0.3
30.5
00.6
60.2
20.0
01.0
0240277
Tot
alB
ank
Fin
./
Ass
ets
0.57
0.4
10.5
80.7
40.2
20.1
01.0
0163997
BalanceSheetIn
form
ation
Age
ofF
irm
15.5
46.0
013.0
022.0
012.5
71.0
0147.0
0420083
Sco
re5.
064.0
05.0
07.0
02.0
11.0
09.0
0351428
Lev
erag
e0.
740.6
40.7
80.8
80.1
80.0
01.0
0221788
Tot
alS
ales
5531
.36
660.0
01596.0
04306.0
028095.9
40.0
06398586.0
0351460
Pool
edd
ata
for
the
per
iod
2004
-200
7.O
bse
rvat
ion
sare
at
the
firm
-yea
rle
vel
an
dm
on
etary
valu
esare
exp
ress
edin
KE
(1,0
00
Eu
ros)
.T
erm
Loa
ns/
Tot.
Ban
kF
in.
isth
efirm
s’to
tal
amou
nt
of
term
loan
sgra
nte
ddiv
ided
by
the
tota
lam
ou
nt
of
ban
kfi
nan
cin
ggra
nte
dfo
ral
lca
tego
ries
(Loa
ns,
Cre
dit
Lin
es,
Bac
ked
Loa
ns)
.C
redit
Lin
es/T
ot.
Ban
kF
in.
isfi
rms’
tota
lcr
edit
lin
esgra
nte
d,
div
ided
by
the
tota
lam
ount
ofb
ank
fin
anci
ng
gran
ted
inal
lca
tego
ries
(Loan
s,C
red
itL
ines
,B
ack
edL
oan
s).
Back
edL
oan
s/T
ot.
Ban
kF
in.
isfi
rms’
tota
llo
an
sgr
ante
db
acke
dby
acco
unt
rece
ivab
les
and
div
ided
by
the
tota
lam
ou
nt
of
ban
kfi
nan
cin
ggra
nte
din
all
cate
gori
es(L
oan
s,C
red
itL
ines
,B
acke
dL
oan
s).
Tota
lB
an
kF
in.
/A
sset
sis
firm
s’to
tal
am
ou
nt
of
ban
kfin
an
cin
ggra
nte
d(L
oan
s,C
red
itL
ines
,B
ack
edL
oan
s)d
ivid
edby
tota
las
sets
.A
geof
Fir
mis
defi
ned
asth
ed
iffer
ence
bet
wee
nth
ecu
rren
tye
ar
an
dth
eye
ar
ofin
corp
ora
tion
of
the
firm
.T
ota
lS
ale
sis
firm
s’re
venu
es.
Sco
reis
anin
dic
ator
ofth
eri
skp
rofi
leof
each
firm
com
pu
ted
as
inA
ltm
an
(1968).
Lev
erage
isd
efin
edas
the
rati
oof
deb
t(b
oth
shor
t-an
dlo
ng-t
erm
)ov
erto
tal
asse
tsas
take
nfr
omb
ala
nce
shee
td
ata
.
34

Table III: Impact of the Reforms on Loan Interest Rates
Dependent Variable: Interest Rates on Loans
Binary TC Binary TC Score (1-9)All Firms 1-4 vs 7-9 All Firms
(1) (2) (3)
After Reorganization*Treatment 0.043*** 0.067*** 0.018***(0.016) (0.021) (0.006)
Interim Period*Treatment 0.005 -0.005 -0.000(0.014) (0.017) (0.005)
After Liquidation*Treatment -0.045*** -0.049*** -0.015***(0.014) (0.018) (0.005)
Real Guarantee -0.015 -0.012 -0.015(0.028) (0.034) (0.028)
Personal Guarantee 0.036*** 0.029 0.036***(0.014) (0.018) (0.014)
Personal+Real Guarantees -0.191*** -0.231*** -0.191***(0.025) (0.032) (0.025)
Other Guarantees 0.042*** 0.030* 0.042***(0.013) (0.018) (0.013)
Maturity: 1-5 Years -0.285*** -0.295*** -0.285***(0.012) (0.016) (0.012)
Maturity: >5 Years -0.511*** -0.515*** -0.511***(0.016) (0.021) (0.016)
Log Size of Loan -0.085*** -0.093*** -0.085***(0.003) (0.004) (0.003)
Credit Lines/Tot. Bank Fin. 0.143** 0.154* 0.143**(0.071) (0.090) (0.071)
Loans/Tot. Bank Fin. -0.156*** -0.128*** -0.156***(0.039) (0.048) (0.039)
Log Value Added -0.013 -0.014 -0.013(0.013) (0.017) (0.013)
Leverage 0.481*** 0.458*** 0.478***(0.085) (0.101) (0.086)
Log Total Assets 0.123*** 0.121*** 0.124***(0.027) (0.036) (0.027)
Log Total Sales -0.166*** -0.132*** -0.167***(0.024) (0.029) (0.024)
Age of Firm -0.100 -0.149* -0.095(0.068) (0.079) (0.069)
Group Ownership 0.013 0.056 0.014(0.048) (0.074) (0.049)
Firm*Bank FE Yes Yes YesQuarterly FE Yes Yes Yes
R-squared 0.559 0.552 0.559N 183498 104782 183498
The table reports OLS estimation of the impact of the bankruptcy reforms on loan inter-
est rates. After Reorganization is a binary variable equal to 1 beginning in January 2005
(2005.Q1). Interim Period is a binary variable equal to 1 beginning in June 2005 (2005.Q3).
After Liquidation is a binary variable equal to 1 beginning in January 2006 (2006.Q1). In
columns 1 and 2 Treatment is a binary variable indicating whether the loan was made by a
firm which had a Score of more than 4 in 2004. In column 3 Treatment is the Score indicator
itself (1-9). See Table I and II for the definition of the remaining variables. The omitted
categories are “Unsecured” in the case of Guarantees and “Backed Loans/Tot. Bank Fin.” in
the case of financing structure variables. Robust, firm clustered standard errors are reported
in parentheses. ***, **, * denote significance at the 1, 5 and 10 percent levels, respectively.35
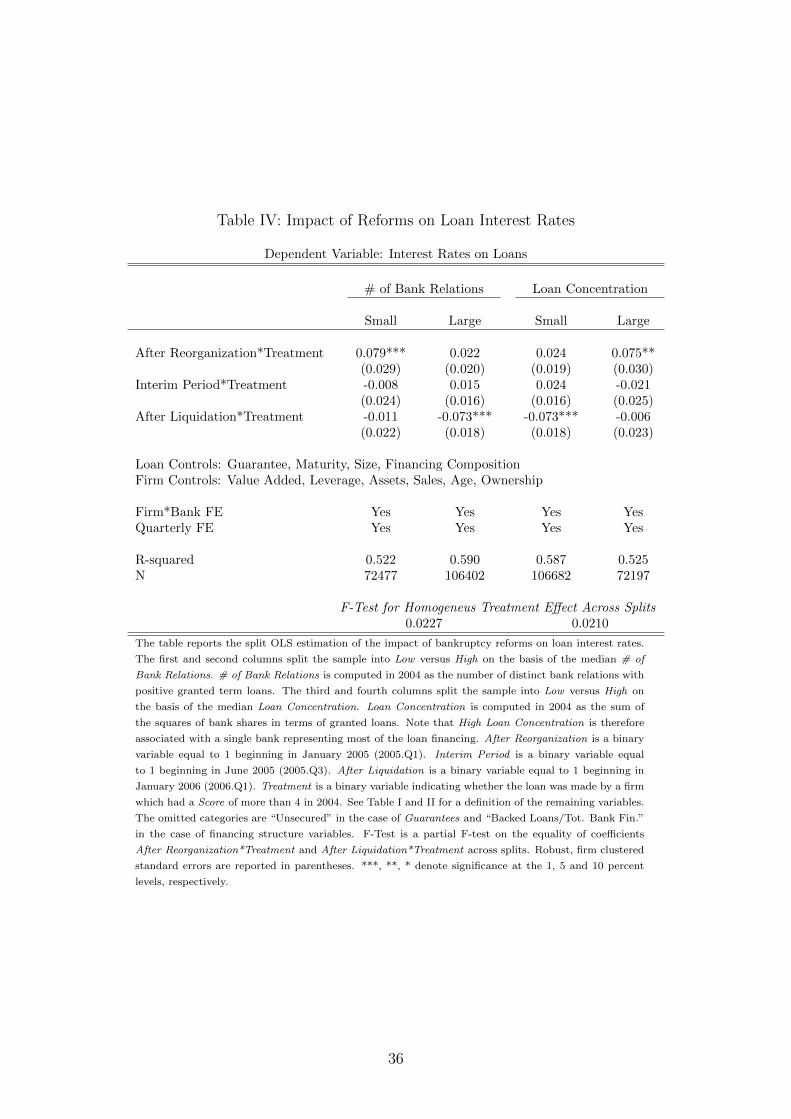
Table IV: Impact of Reforms on Loan Interest Rates
Dependent Variable: Interest Rates on Loans
# of Bank Relations Loan Concentration
Small Large Small Large
After Reorganization*Treatment 0.079*** 0.022 0.024 0.075**(0.029) (0.020) (0.019) (0.030)
Interim Period*Treatment -0.008 0.015 0.024 -0.021(0.024) (0.016) (0.016) (0.025)
After Liquidation*Treatment -0.011 -0.073*** -0.073*** -0.006(0.022) (0.018) (0.018) (0.023)
Loan Controls: Guarantee, Maturity, Size, Financing CompositionFirm Controls: Value Added, Leverage, Assets, Sales, Age, Ownership
Firm*Bank FE Yes Yes Yes YesQuarterly FE Yes Yes Yes Yes
R-squared 0.522 0.590 0.587 0.525N 72477 106402 106682 72197
F-Test for Homogeneus Treatment Effect Across Splits0.0227 0.0210
The table reports the split OLS estimation of the impact of bankruptcy reforms on loan interest rates.
The first and second columns split the sample into Low versus High on the basis of the median # of
Bank Relations. # of Bank Relations is computed in 2004 as the number of distinct bank relations with
positive granted term loans. The third and fourth columns split the sample into Low versus High on
the basis of the median Loan Concentration. Loan Concentration is computed in 2004 as the sum of
the squares of bank shares in terms of granted loans. Note that High Loan Concentration is therefore
associated with a single bank representing most of the loan financing. After Reorganization is a binary
variable equal to 1 beginning in January 2005 (2005.Q1). Interim Period is a binary variable equal
to 1 beginning in June 2005 (2005.Q3). After Liquidation is a binary variable equal to 1 beginning in
January 2006 (2006.Q1). Treatment is a binary variable indicating whether the loan was made by a firm
which had a Score of more than 4 in 2004. See Table I and II for a definition of the remaining variables.
The omitted categories are “Unsecured” in the case of Guarantees and “Backed Loans/Tot. Bank Fin.”
in the case of financing structure variables. F-Test is a partial F-test on the equality of coefficients
After Reorganization*Treatment and After Liquidation*Treatment across splits. Robust, firm clustered
standard errors are reported in parentheses. ***, **, * denote significance at the 1, 5 and 10 percent
levels, respectively.
36
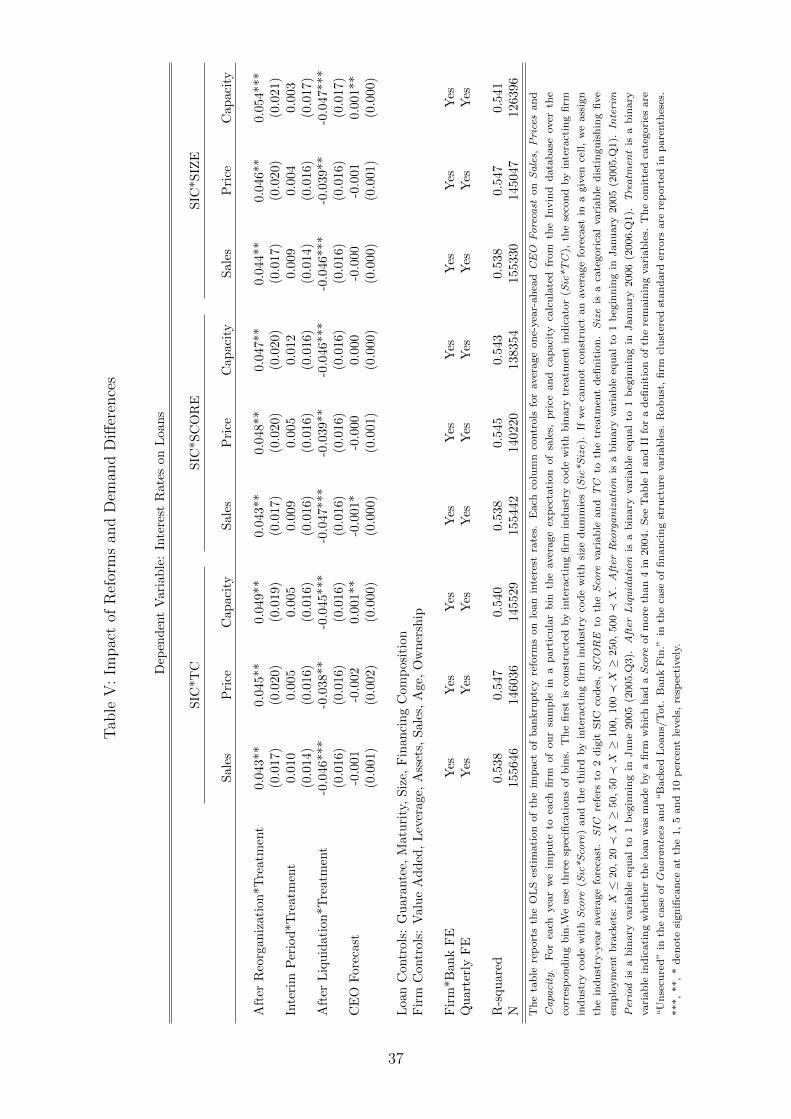
Tab
leV
:Im
pac
tof
Ref
orm
san
dD
eman
dD
iffer
ence
s
Dep
end
ent
Vari
ab
le:
Inte
rest
Rate
son
Loa
ns
SIC
*TC
SIC
*S
CO
RE
SIC
*S
IZE
Sal
esP
rice
Cap
aci
tyS
ale
sP
rice
Cap
aci
tyS
ale
sP
rice
Cap
aci
ty
Aft
erR
eorg
aniz
atio
n*T
reat
men
t0.
043*
*0.
045**
0.0
49**
0.0
43**
0.0
48**
0.0
47**
0.0
44**
0.0
46**
0.0
54***
(0.0
17)
(0.0
20)
(0.0
19)
(0.0
17)
(0.0
20)
(0.0
20)
(0.0
17)
(0.0
20)
(0.0
21)
Inte
rim
Per
iod
*Tre
atm
ent
0.01
00.
005
0.0
05
0.0
09
0.0
05
0.0
12
0.0
09
0.0
04
0.0
03
(0.0
14)
(0.0
16)
(0.0
16)
(0.0
16)
(0.0
16)
(0.0
16)
(0.0
14)
(0.0
16)
(0.0
17)
Aft
erL
iqu
idat
ion
*Tre
atm
ent
-0.0
46**
*-0
.038
**
-0.0
45***
-0.0
47***
-0.0
39**
-0.0
46***
-0.0
46***
-0.0
39**
-0.0
47***
(0.0
16)
(0.0
16)
(0.0
16)
(0.0
16)
(0.0
16)
(0.0
16)
(0.0
16)
(0.0
16)
(0.0
17)
CE
OF
orec
ast
-0.0
01-0
.002
0.0
01**
-0.0
01*
-0.0
00
0.0
00
-0.0
00
-0.0
01
0.0
01**
(0.0
01)
(0.0
02)
(0.0
00)
(0.0
00)
(0.0
01)
(0.0
00)
(0.0
00)
(0.0
01)
(0.0
00)
Loa
nC
ontr
ols:
Gu
aran
tee,
Mat
uri
ty,
Siz
e,F
inan
cin
gC
omp
osi
tion
Fir
mC
ontr
ols:
Val
ue
Ad
ded
,L
ever
age,
Ass
ets,
Sal
es,
Age
,O
wn
ersh
ip
Fir
m*B
ank
FE
Yes
Yes
Yes
Yes
Yes
Yes
Yes
Yes
Yes
Qu
arte
rly
FE
Yes
Yes
Yes
Yes
Yes
Yes
Yes
Yes
Yes
R-s
qu
ared
0.53
80.
547
0.5
40
0.5
38
0.5
45
0.5
43
0.5
38
0.5
47
0.5
41
N15
5646
1460
36
145529
155442
140220
138354
155330
145047
126396
Th
eta
ble
rep
ort
sth
eO
LS
esti
mati
on
of
the
imp
act
of
ban
kru
ptc
yre
form
son
loan
inte
rest
rate
s.E
ach
colu
mn
contr
ols
for
aver
age
on
e-yea
r-ah
ead
CEO
Forecast
on
Sales,
Prices
an
d
Capa
city
.F
or
each
yea
rw
eim
pu
teto
each
firm
of
ou
rsa
mp
lein
ap
art
icu
lar
bin
the
aver
age
exp
ecta
tion
of
sale
s,p
rice
an
dca
paci
tyca
lcu
late
dfr
om
the
Invin
dd
ata
base
over
the
corr
esp
on
din
gb
in.W
eu
seth
ree
spec
ifica
tion
sof
bin
s.T
he
firs
tis
con
stru
cted
by
inte
ract
ing
firm
ind
ust
ryco
de
wit
hb
inary
trea
tmen
tin
dic
ato
r(S
ic*TC
),th
ese
con
dby
inte
ract
ing
firm
ind
ust
ryco
de
wit
hScore
(Sic*Score
)an
dth
eth
ird
by
inte
ract
ing
firm
ind
ust
ryco
de
wit
hsi
zed
um
mie
s(S
ic*Size).
Ifw
eca
nn
ot
con
stru
ctan
aver
age
fore
cast
ina
giv
ence
ll,
we
ass
ign
the
ind
ust
ry-y
ear
aver
age
fore
cast
.SIC
refe
rsto
2d
igit
SIC
cod
es,SCORE
toth
eScore
vari
ab
lean
dTC
toth
etr
eatm
ent
defi
nit
ion
.Size
isa
cate
gori
cal
vari
ab
led
isti
ngu
ish
ing
five
emp
loym
ent
bra
cket
s:X
≤20,
20≺
X≥
50,
50≺
X≥
100,
100≺
X≥
250,
500≺
X.After
Reorganization
isa
bin
ary
vari
ab
leeq
ual
to1
beg
inn
ing
inJanu
ary
2005
(2005.Q
1).
Interim
Period
isa
bin
ary
vari
able
equ
al
to1
beg
inn
ing
inJu
ne
2005
(2005.Q
3).
After
Liquidation
isa
bin
ary
vari
ab
leeq
ual
to1
beg
inn
ing
inJanu
ary
2006
(2006.Q
1).
Treatm
ent
isa
bin
ary
vari
ab
lein
dic
ati
ng
wh
eth
erth
elo
an
was
mad
eby
afi
rmw
hic
hh
ad
aScore
of
more
than
4in
2004.
See
Tab
leI
an
dII
for
ad
efin
itio
nof
the
rem
ain
ing
vari
ab
les.
Th
eom
itte
dca
tegori
esare
“U
nse
cure
d”
inth
eca
seofGuarantees
an
d“B
ack
edL
oan
s/T
ot.
Ban
kF
in.”
inth
eca
seof
fin
an
cin
gst
ruct
ure
vari
ab
les.
Rob
ust
,fi
rmcl
ust
ered
stan
dard
erro
rsare
rep
ort
edin
pare
nth
eses
.
***,
**,
*d
enote
sign
ifica
nce
at
the
1,
5an
d10
per
cent
level
s,re
spec
tivel
y.
37

Table VI: Impact of Reforms and Credit Cycles
Dependent Variable: Interest Rates on Loans
(1) (2)
After Reorganization*Treatment 0.045*** 0.045***(0.017) (0.017)
Interim Period*Treatment 0.010 0.002(0.014) (0.014)
After Liquidation*Treatment -0.045*** -0.049***(0.014) (0.015)
US BAA/AAA*Treatment -0.031(0.036)
Loan Controls: Guarantee, Maturity, Size, Financing CompositionFirm Controls: Value Added, Leverage, Assets, Sales, Age, Ownership
Firm*Bank FE Yes YesQuarterly FE Yes YesTrend*Score No Yes
R-squared 0.559 0.559N 183498 183237
The table reports the OLS estimation of the impact of bankruptcy reforms on
loan interest rates. Column 1 interacts Treatment with a proxy for international
credit market cycles US BAA/AAA. Column 2 interacts the Score indicator (1-9)
with a time trend. After Reorganization is a binary variable equal to 1 begin-
ning in January 2005 (2005.Q1). Interim Period is a binary variable equal to 1
beginning in June 2005 (2005.Q3). After Liquidation is a binary variable equal
to 1 beginning in January 2006 (2006.Q1). Treatment is a binary variable in-
dicating whether the loan was made by a firm with a Score of more than 4 in
2004. US BAA/AAA is the difference between yields on US corporate AAA rated
bonds and Baa rated bonds. Information on corpororate bond yields is taken from
http://www.federalreserve.gov/releases/h15/current/. See Table I and II for a
definition of the remaining variables. The omitted categories are “Unsecured” in the
case of Guarantees and “Backed Loans/Tot. Bank Fin.” in the case of financing
structure variables. Robust, firm clustered standard errors are reported in parenthe-
ses. ***, **, * denote significance at the 1, 5 and 10 percent levels, respectively.
38

Table VII: Balancing Property Test
Windows Around Threshold±.15 ±.2 ±.25 Score 6/7 All T/C
Activity:Food Sector .001 .007 .007 .011*** -.003***SIC Code Starts With 2 -.014 -.01 -.008 -.012* -.075***
Geography:Rome -.001 .007 -.003 -.012*** .003Milan .003 -.004 .005 -.007*** .018***
BG Ownership .000 .000 .001 .005*** .012***
Financing Structure:Long Term Debt .00 -.005 -.007** -.003 -.037***Loan Financing -.001 -.007 -.009* -.019*** .032***Credit Line Financing .002 .003 .005* .007*** .003***Trade Credit Financing -.001 .004 .004* .012*** -.035***
Unique Firms 1904/1733 2481/2331 2816/2785 7169/12452 20652/30703
The table reports differences in firm characteristics in 2004.Q4. The first three columns report differences for
firms marginally above and below the threshold (normalized to 0) for Score categories 6 to 7. The column
Score 6/7 reports differences for all firms in Score categories 6 and 7, and column All T/C for all firms in the
treatment and control categories. Food Sector is a binary variable equal to 1 for a firm with a SIC code of
16(“Manufacture of food products and beverages”). SIC Code Starts With 2 is a binary variable equal to 1 for
a firm with a SIC code starting with 2. Rome and Milan are binary variables equal to 1 for a firm registered
in the cities of Rome or Milan. Long Term Debt is defined as the total amount of loans granted with maturity
more than a year compared to the total amount of loans granted by the bank to the firm. See Table I and
II for a definition of the remaining variables. ***, **, * denote significance at the 1, 5 and 10 percent levels,
respectively.
39

Table VIII: Threshold Estimates
Windows Around Threshold±.15 ±.2 ±.25
Legislative Decree no. 35 0.054** 0.084*** 0.068**(0.024) (0.021) (0.019)
R-squared 0.020 0.020 0.021N 35442 46572 54290
Law no. 5 -0.018 -0.028 -0.027(0.028) (0.024) (0.022)
R-squared 0.001 0.001 0.001N 33954 45806 53852
Controls No No NoFirm*Bank FE Yes Yes YesQuarterly FE Yes Yes Yes
The table reports the OLS estimation of the impact of bankruptcy
reforms on loan interest rates, in the quarters preceding and fol-
lowing the introduction of the legislative reforms, and at the
threshold (normalized to 0) of the continuous Score variable going
from category 6 to 7. Robust, firm clustered standard errors are
reported in parentheses. ***, **, * denote significance at the 1, 5
and 10 percent levels, respectively.
40

Tab
leIX
:Im
pac
tof
Ref
orm
son
Non
-Pri
ceD
imen
sion
s
Sec
ure
dL
end
ing
Sh
ort
Ter
mL
end
ing
Nu
mb
erof
Ban
ks
Lev
erage
Cre
dit
Con
stra
ints
(1)
(2)
(3)
(4)
(5)
Aft
erC
P*T
reat
men
t0.
003*
**-0
.000
-0.0
10
0.0
01
(0.0
01)
(0.0
01)
(0.0
10)
(0.0
01)
Inte
rim
Per
iod
*Tre
atm
ent
0.00
2***
0.0
00
0.0
08
0.0
02***
(0.0
01)
(0.0
01)
(0.0
07)
(0.0
01)
Aft
erF
ailu
re*T
reat
men
t0.
003*
**-0
.008***
0.0
83*
**
0.0
01
(0.0
01)
(0.0
01)
(0.0
11)
(0.0
01)
Aft
er20
04*
Tre
atm
ent
-0.0
27**
(0.0
11)
Fir
mC
ontr
ols
Yes
Yes
Yes
Yes
Yes
Fir
mF
EN
oN
oY
esY
esY
esF
irm
*Ban
kF
EY
esY
esN
oN
oN
oQ
uar
terl
yF
EY
esY
esY
esY
esN
o
R-s
qu
ared
0.00
30.0
04
0.1
210.0
58
0.0
05
N18
6597
01865970
549405
553887
7620
Th
eta
ble
rep
ort
sth
eO
LS
esti
mati
on
of
the
imp
act
of
ban
kru
ptc
yre
form
son
the
non
-pri
ced
imen
sion
sof
firm
s’fi
nan
cin
g.SecuredLen
ding
isd
efin
edas
the
tota
lam
ou
nt
of
loan
sgra
nte
dw
ith
real
secu
riti
esco
mp
are
dto
the
tota
lam
ou
nt
of
loan
sgra
nte
dby
the
ban
kto
the
firm
.Short
Term
Len
ding
isd
efin
ed
as
the
tota
lam
ou
nt
of
loan
sgra
nte
dw
ith
am
atu
rity
of
less
than
1yea
rco
mp
are
dto
the
tota
lam
ou
nt
of
loan
sgra
nte
dby
the
ban
kto
the
firm
.Number
ofBanks
isd
efin
edas
the
nu
mb
erof
ban
ks
afi
rmu
ses.
Leverage
isd
efin
edas
the
rati
oof
afi
rm’s
tota
lb
an
kfi
nan
cin
gco
mp
are
dto
the
book-v
alu
eof
its
ass
ets.
Credit
Constraints
isa
bin
ary
vari
ab
leeq
ual
to1
ifa
firm
requ
este
dm
ore
ban
kfi
nan
cin
g,
bu
tsa
idre
qu
est
was
reje
cted
.T
he
info
rmati
on
onCredit
Constraints
isb
ase
don
the
yea
rly
Invin
dsu
rvey
.T
he
set
of
contr
ol
vari
ab
les
for
colu
mn
5in
clu
des
fore
cast
sof
on
e-yea
r-ah
ead
sale
sgro
wth
.R
ob
ust
,fi
rm
clu
ster
edst
an
dard
erro
rsare
rep
ort
edin
pare
nth
eses
.***,
**,
*d
enote
sign
ifica
nce
at
the
1,
5an
d10
per
cent
level
s,re
spec
tivel
y.
41

A For Online Publication: Data Organisation, Sam-
ple Selection, Definition of Variables
Our analysis focuses on manufacturing firms for the period 2004-2007. We organize our
final sample in several steps.
The first step is to organise the information in the Taxia database. We take informa-
tion on newly-issued term loans (interest rates, loan size, and maturity) from the Taxia
database and we match it with the guarantee information contained in the Central Credit
Register to recover their guarantee status.37 We drop all new loans with an amount
smaller than 1,000 Euro and extreme percentiles of the term loan interest-rate distribu-
tion.38 Then we associate the interest rates on credit lines (between a given bank and
a given firm in a certain period) in the Taxia database with other characteristics of the
firm-bank relationship, such as total amount of credit granted and utilized on the credit
lines in the same period. We drop extreme percentiles of the credit lines interest-rate
distribution. Finally, we drop the first quarter of 2004, since this is the first time data
was collected at the credit-line level and is possibly subject to substantial measurement
error.39
The second step is to harmonize the format of the Credit Register and the credit line
data. We therefore organize the financial information on amounts, loan categories, and
guarantees at the quarterly level. This leaves an unbalanced panel of firm-bank rela-
tions at the quarterly level observed over 15 periods, which are then matched with yearly
balance sheet data. We organize the balance-sheet data before merging them with the
financial information of firms. We drop firms with incomplete balance sheets and profit
and loss accounts, missing Score, with leverage above one or below 0. Since only small-
and medium-sized firms were affected by the policy change we drop firm observations with
more than 500 recorded employees.40 Every year of balance-sheet data is matched with
quarterly credit information. The final dataset is of quarterly frequency, and runs from
37We do so by constructing an algorithm that tries to match a new loan from firm j with bank b inperiod t to the information on the same match in the same time period. The algorithm searches for amatch to the exact amount of the new term loan in the Credit Register by comparing it to the total sizeof utilized and granted loans in a six-month window around period t. If the algorithm doesn’t find anexact match then it searches for matches with first differences of utilized and granted loans in the sametime window around the contract period t. Subsequently, we check the type of loan relationship betweenthe bank and the firm in the Credit Register. Provided all the contracts between the bank and the firmhave the same collateral status, we assume that the new term loan necessarily has the same collateralstatus (otherwise we would observe a distinct entry in the data). If we cannot find a match we create aresidual “unmatched” category that should be interpreted as having a high probability of some kind ofcollateral on the loan. Indeed, in the six-month window around the date of the new loan there is somekind of collateral agreement between the firm and the bank involved.
38For computational reasons, we focus on firms that have at most one loan per quarter with a givenbank. In this way we drop 3% of all newly-issued term loans.
39Results are robust to the inclusion of the first quarter.40Firms above this threshold had access to a different set of procedures that were also reformed during
the same period.
42

the second quarter of 2004 to the last quarter of 2007, for a total of 202,964 firms and
1,097 banks.
Definition of Variables at the Firm-Bank Level All variables are at the quaterly
level.
• Credit Line Interest Rate, as the average net annual interest rate on the credit line;
• Granted Credit Lines is the total credit line the firm was granted by the bank for a
given quarter;
• Guarantee is a set of binary variables indicating whether the newly-issued term loan
has no collateral (Unsecured), only real collateral (Real), only personal collateral
(Personal), both (Real and Personal), or is unmatched (Other);
• Loan Interest Rate: Gross annual interest rate for newly-issued term loans, inclusive
of participation fees, loan origination fees, monthly service charges. This rate is
calculated so that the present value of loan installments equals the present value of
payments;
• Maturity is a set of binary variables indicating whether the maturity of the newly-
issued term loans is up to one year, between one and five years, or more than five
years;
• Secured Lending: Total amount of loans granted with real securities compared to
the total amount of loans granted;
Short Term Lending: Total amount of loans granted with maturity less than a year
compared to the total amount of loans granted by the bank to the firm.
• Size of Loan is the log of granted amount of the newly-issued term loan;
Definition of Variables at the Firm Level Variables denoted by QT are at the
quarterly level, if they are denoted by YR they are at the annual level.
• Advances/Tot. Bank Fin.: Firm’s total loans backed by account receivables, divided
by total bank financing granted in all loan categories, QT;
• After Reorganization: Dummy variable equal to one beginning in January 2005
(2005.Q1), QT;
• After Liquidation: Dummy variable equal to one to 1 beginning in January 2006
(2006.Q1), QT;
43

• Age of Firm: Difference between the current year and year of firm incorporation,
YR;
• CEO Forecast: For each year we impute to each firm of our sample in a particular bin
the average expectation of one-year ahead sales, price and capacity calculated from
the Invind database over the corresponding bin. We use three specifications of bins.
The first is constructed by interacting firm industry code with binary treatment indi-
cator (Sic*TC ), the second by interacting firm industry code with Score (Sic*Score)
and the third by interacting firm industry code with size dummies (Sic*Size). If
we cannot construct an average forecast in a given cell, we assign the industry-year
average forecast. The one-year-ahead forecasts are related to sales growth (Sales),
price changes (Price), and productive capacity utilization (Capacity), YR;
• Credit Constraints: Binary variable equal to one if a firm requested more bank
financing, but said request was rejected, YR;
• Credit Lines/Tot. Bank Fin.: Firm’s total credit lines divided by the total bank
financing granted in all loan categories, QT;
• Food Sector: Binary variable equal to one for a firm with a SIC code of 16 (“Man-
ufacture of food products and beverages”), YR;
• Geography - Rome/Milan: Binary variables equal to one for a firm registered in the
cities of Rome or Milan, YR;
• Group Ownership: Binary variable equal to one if the firm belongs to a business
group, YR;
• Interim Period: Dummy variable equal to one beginning in June 2005 (2005.Q3),
QT;
• Loan Concentration: Sum of the squares of bank shares in terms of granted loans,
QT;
• Loans/Tot. Bank Fin.: Firm’s total amount of term loans, divided by the total
amount of bank financing granted in all loan categories, QT;
• Leverage: is defined as the ratio of debt (both short- and long-term) over total
book-value of assets in the balance sheets, YR. Alternatively we also compute Bank
Leverage as the ratio of bank debt (both short- and long-term) over total book-value
of assets, QT;
• Score: Indicator of the likelihood of a firm default, and that takes a value ranging
from one (for the safest firm) to nine (for the firm most likely to default), YR;
44

• SIC Code Starts With 2: Binary variable equal to one for a firm with a SIC code
starting with 2, YR;
• Total Assets: Log of total assets, YR;
• Total Sales: Log of total sales, YR;
• Treatment: Dummy variable equal to one for firms that, in 2004, have a Score
between five and nine, 0 otherwise, YR;
• US BAA/AAA: Difference between yields on US corporate AAA rated bonds and
Baa rated bonds. Information on corpororate bond yields is taken from http:
//www.federalreserve.gov/releases/h15/current/, QT;
• Value Added: Log of value added, YR;
• # of Bank Relations: Number of distinct bank relations per firm, QT.
B For Online Publication: Additional Tables and Fig-
ures
Figure 6: Timeline of the Reform Process
•Quarters 1 2 3 4 1 2 3 4 1
2004 2005 20061942
BankruptcyAct
6
TrevisanatoCommittee
6
LegislativeDecreeno. 35
6
Governmentmandatedto draft
new law onliquidation
6
Law no. 5
45

Figure 7: Differences-in-Differences Plot of CEO Forecasts
The figure uses information from the Invind survey of manufacturing firms between 2001 and 2007. The left panels separately
plot average forecasts for control firms (black line, square) and treated firm categories (red line, triangle). The right panels
plot the difference in forecasts between the two groups of firms for each year. The top panels plot forecasts of one-year-ahead
sales growth, the middle panels plot forecasts of price changes, while the bottom panels plot forecasts of productive capacity
utilization.
46

Figure 8: Distribution of Firms Around Score Threshold 6 to 7
The figure plots the empirical distribution of the continuous variable underlying Score categories 6 and 7, using bins of 0.01
and firm observations in 2004.Q4. The threshold is normalized to 0. Firms in Score category 7 lie to the left of the dotted
line (dark grey bars), while firms in Score category 6 lie to the right of the dotted line (light grey bars).
47

Table X: Reorganization Procedures—Legal Changes.Reorganization
Pre-reform Post-reform
Prerequisites Any entrepreneur Any entrepreneur
(art. 160) not failed in the last five years
and no bankruptcy fraud
Requirement on Reimbursement of None
content of the - 100% secured creditors
plan (art. 160) - 40% unsecured creditors
Initiator Entrepreneur Entrepreneur
(art. 161) in state of insolvency
Assets’ control Debtor in possession Debtor in possession
(art. 167)
Automatic stay Yes Yes
(art. 167, 168)
Decision process Plan approved if Plan approved if
(art. 177) more than two thirds of more than half of
creditors (in value) vote creditors (in value) vote
in favor in favor
No cram-down Cram-down
Secured creditors can Secured creditors can
vote if they give up vote if they give up
their privilege their privilege
Plan rejected The firm is liquidated The firm is liquidated
(art. 179)
Out-of-court agreements Claw-back on all transactions Limited scope for
(art. 182) from 6 to 12 months claw-back
before the opening of the
procedure
48
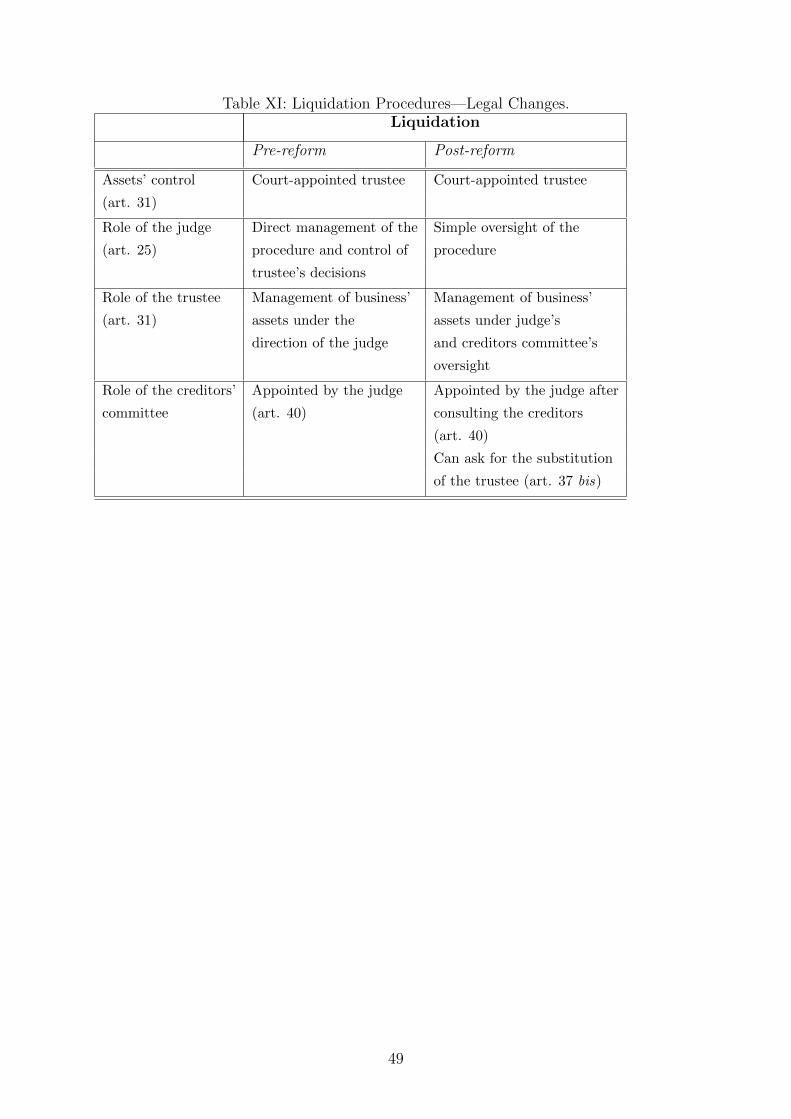
Table XI: Liquidation Procedures—Legal Changes.Liquidation
Pre-reform Post-reform
Assets’ control Court-appointed trustee Court-appointed trustee
(art. 31)
Role of the judge Direct management of the Simple oversight of the
(art. 25) procedure and control of procedure
trustee’s decisions
Role of the trustee Management of business’ Management of business’
(art. 31) assets under the assets under judge’s
direction of the judge and creditors committee’s
oversight
Role of the creditors’ Appointed by the judge Appointed by the judge after
committee (art. 40) consulting the creditors
(art. 40)
Can ask for the substitution
of the trustee (art. 37 bis)
49

Table XII: Alternative Specifications
Dependent Variable: Interest Rates on Loans
No Loan Cluster No No SwitchersControls Bank Level Switchers No Attrition
(1) (2) (3) (4)
After Reorganization*Treatment 0.037** 0.043*** 0.053** 0.055***(0.016) (0.016) (0.021) (0.021)
Interim Period*Treatment 0.001 0.005 0.013 0.008(0.014) (0.015) (0.017) (0.017)
After Liquidation*Treatment -0.040*** -0.045*** -0.050*** -0.045***(0.014) (0.017) (0.017) (0.017)
Loan & Firm Controls Only Firm Yes Yes YesFirm*Bank FE Yes Yes Yes YesQuarterly FE Yes Yes Yes Yes
R-squared 0.538 0.559 0.553 0.551N 187797 183498 137392 142913
Bank*Time SIC3*Time Region*Time LogFE FE FE Specification(5) (6) (7) (8)
After Reorganization*Treatment .035** 0.043*** 0.043*** 0.012***(0.016) (0.017) (0.016) (0.004)
Interim Period*Treatment 0.021 0.004 0.008 -0.001(0.014) (0.014) (0.013) (0.003)
After Liquidation*Treatment -0.040*** -0.046*** -0.044*** -0.033***(0.014) (0.017) (0.014) (0.003)
Loan & Firm Controls Yes Yes Yes YesFirm*Bank FE Yes Yes Yes YesQuarterly FE Yes Yes Yes Yes
R-squared 0.584 0.565 0.571 0.574N 183498 183498 183418 183498
The table reports the OLS estimation of the impact of bankruptcy reforms on loan interest rates. After Re-
organization is a binary variable equal to 1 beginning in January 2005 (2005.Q1). Interim Period is a binary
variable equal to 1 beginning in June 2005 (2005.Q3). After Liquidation is a binary variable equal to 1 beginning
in January 2006 (2006.Q1). In all specifications Treatment is defined as a binary variable indicating whether
the loan was made by a firm which had a Score of more than 4 in 2004. See Table I and II for a definition of
the remaining variables. Robust, firm clustered standard errors are reported in parentheses. ***, **, * denote
significance at the 1, 5 and 10 percent levels, respectively.
50
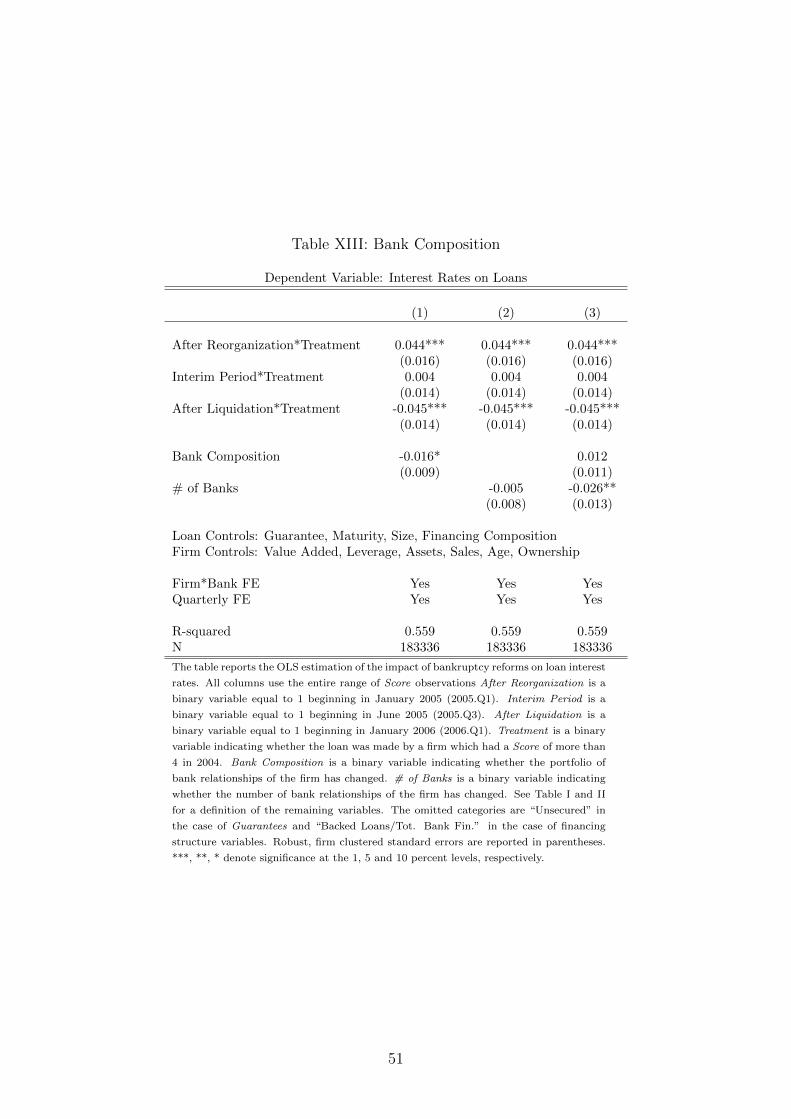
Table XIII: Bank Composition
Dependent Variable: Interest Rates on Loans
(1) (2) (3)
After Reorganization*Treatment 0.044*** 0.044*** 0.044***(0.016) (0.016) (0.016)
Interim Period*Treatment 0.004 0.004 0.004(0.014) (0.014) (0.014)
After Liquidation*Treatment -0.045*** -0.045*** -0.045***(0.014) (0.014) (0.014)
Bank Composition -0.016* 0.012(0.009) (0.011)
# of Banks -0.005 -0.026**(0.008) (0.013)
Loan Controls: Guarantee, Maturity, Size, Financing CompositionFirm Controls: Value Added, Leverage, Assets, Sales, Age, Ownership
Firm*Bank FE Yes Yes YesQuarterly FE Yes Yes Yes
R-squared 0.559 0.559 0.559N 183336 183336 183336
The table reports the OLS estimation of the impact of bankruptcy reforms on loan interest
rates. All columns use the entire range of Score observations After Reorganization is a
binary variable equal to 1 beginning in January 2005 (2005.Q1). Interim Period is a
binary variable equal to 1 beginning in June 2005 (2005.Q3). After Liquidation is a
binary variable equal to 1 beginning in January 2006 (2006.Q1). Treatment is a binary
variable indicating whether the loan was made by a firm which had a Score of more than
4 in 2004. Bank Composition is a binary variable indicating whether the portfolio of
bank relationships of the firm has changed. # of Banks is a binary variable indicating
whether the number of bank relationships of the firm has changed. See Table I and II
for a definition of the remaining variables. The omitted categories are “Unsecured” in
the case of Guarantees and “Backed Loans/Tot. Bank Fin.” in the case of financing
structure variables. Robust, firm clustered standard errors are reported in parentheses.
***, **, * denote significance at the 1, 5 and 10 percent levels, respectively.
51

Table XIV: Impact of Reforms on Credit Lines Interest Rates
Dependent Variable: Interest Rates on Credit Lines
Binary TC Binary TCAll Firms 1-4 vs 7-9
(1) (2)
After Reorganization*Treatment 0.086*** 0.112***(0.012) (0.014)
Interim Period*Treatment 0.019* 0.021*(0.011) (0.012)
After Liquidation*Treatment -0.028** -0.066***(0.012) (0.015)
Log Use of Credit Lines -0.084*** -0.081***(0.002) (0.003)
Log Granted Credit Lines -0.113*** -0.112***(0.002) (0.003)
Credit Lines/Tot. Bank Fin. -0.981*** -0.887***(0.058) (0.069)
Loans/Tot. Bank Fin. -0.285*** -0.248***(0.030) (0.037)
Log Value Added -0.010 0.007(0.011) (0.013)
Leverage 0.891*** 0.811***(0.069) (0.082)
Log Total Assets 0.177*** 0.194***(0.022) (0.027)
Log Total Sales -0.213*** -0.216***(0.018) (0.021)
Age of Firm 0.320*** 0.375***(0.048) (0.059)
Group Ownership 0.040 -0.004(0.079) (0.115)
Firm*Bank FE Yes YesQuarterly FE Yes Yes
R-squared 0.096 0.093N 1558095 965632
The table reports the OLS estimation of the impact of bankruptcy reforms on
credit line interest rates. Column 1 uses the entire range of Score observations.
Column 2 uses the range of Score observations between 1-4 and 7-9. After
Reorganization is a binary variable equal to 1 beginning in January 2005
(2005.Q1). Interim Period is a binary variable equal to 1 beginning in June
2005 (2005.Q3). After Liquidation is a binary variable equal to 1 beginning in
January 2006 (2006.Q1). Treatment is a binary variable indicating whether
the loan was made by a firm which had a Score of more than 4 in 2004.
See Table I and II for a definition of the remaining variables. The omitted
category is “Backed Loans/Tot. Bank Fin.” in the case of financing structure
variables. Robust, firm clustered standard errors are reported in parentheses.
***, **, * denote significance at the 1, 5 and 10 percent levels, respectively.
52

Table XV: Actively Used Credit Lines
Dependent Variable: Interest Rates on Credit Lines
(1) (2)
After Reorganization*Treatment 0.134*** 0.155***(0.016) (0.017)
Interim Period*Treatment 0.028** 0.033**(0.014) (0.015)
After Liquidation*Treatment -0.054*** -0.088***(0.016) (0.018)
Credit Line Controls: Amount Granted and UsedFirm Controls: Value Added, Leverage, Assets, Sales, Age, Ownership
Firm*Bank FE Yes YesQuarterly FE Yes Yes
R-squared 0.118 0.113N 1028693 640208
The table reports the OLS estimation of the impact of bankruptcy reforms on
credit line interest rates for the subsample of firm-bank observations with non-
zero overdraft use. Columns 1 uses the entire range of Score observations and
column 2 uses the range of Score observations between 1-4 and 7-9. After
Reorganization is a binary variable equal to 1 beginning in January 2005
(2005.Q1). Interim Period is a binary variable equal to 1 beginning in June
2005 (2005.Q3). After Liquidation is a binary variable equal to 1 beginning in
January 2006 (2006.Q1). Treatment is a binary variable indicating whether
the loan was made by a firm which had a Score of more than 4 in 2004.
See Table I and II for a definition of the remaining variables. The omitted
category is “Backed Loans/Tot. Bank Fin.” in the case of financing structure
variables. Robust, firm clustered standard errors are reported in parentheses.
***, **, * denote significance at the 1, 5 and 10 percent levels, respectively.
53

Oxford University Centre for Business
Taxation
Working Paper series
WP12/17 Xavier Boutin, Giacinta Cestone, Chiara Fumagalli,
Giovanni Pica and Nicolas Serrano-Velarde The Deep pocket
effect of internal capital markets
WP12/16 Clemens Fuest, Andreas Peichl and Sebastian Siegloch
Which workers bear the burden of corporate taxation and
which firms can pass it on? Micro evidence from Germany
WP12/15 Michael P. Devereux Issues in the Design of Taxes on
Corporate Profit
WP12/14 Alan Auerbach and Michael P. Devereux Consumption
Taxes In An International Setting
WP12/13 Wiji Arulampalam, Michael P. Devereux and Federica
Liberini Taxes and the location of targets
WP12/12 Scott Dyreng, Bradley Lindsey and Jacob Thornock
Exploring the role Delaware plays as a tax haven
WP12/11 Katarzyna Bilicka and Clemens Fuest With which
countries do tax havens share information?
WP12/10 Giorgia Maffini Territoriality, Worldwide Principle,
and Competitiveness of Multinationals: A Firm-level Analysis of
Tax Burdens
WP12/09 Daniel Shaviro The rising tax-electivity of US residency
WP12/08 Edward D Kleinbard Stateless Income
WP12/07 Vilen Lipatov and Alfons Weichenrieder Optimal income
taxation with tax competition
WP12/06 Kevin S Markle A Comparison of the Tax-motivated
Income Shifting of Multinationals in Territorial and
Worldwide Countries
WP12/05 Li Liu Income Taxation and Business Incorporation:
Evidence from the Early Twentieth Century

WP12/04 Shafik Hebous and Vilen Lipatov A Journey from a
Corruption Port to a Tax Haven
WP12/03 Neils Johannesen Strategic line drawing between debt
and equity
WP12/02 Chongyang Chen, Zhonglan Dai, Douglas A.
Shackelford and Harold H. Zhang, Does Financial Constraint
Affect Shareholder Taxes and the Cost of Equity Capital?
WP12/01 Stephen R. Bond and Irem Guceri, Trends in UK BERD
after the Introduction of R&D Tax Credits
WP11/24 Athiphat Muthitacharoen George R. Zodrow
Revisiting the Excise Tax Effects of the Property Tax
WP11/23 Krautheim, Sebastian and Tim Schmidt-Eisenlohr
Wages and International Tax Competition
WP11/22 Haufler, Andreas, Pehr-Johan Nörback and Lars
Persson Entrepreneurial innovation and taxation
WP11/21 Mancini, Raffaele, Paolo M. Panteghini and Maria laura
Parisi Debt-Shifting in Europe
WP11/20 Xing, Jing Does tax structure affect economic growth?
Empirical evidence from OECD countries
WP11/19 Freedman, Judith Responsive regulation, risk and rules:
applying the theory to tax practice
WP11/18 Devereux, Michael P. and Simon Loretz How would EU
corporate tax reform affect US investment in Europe?
WP11/17 Vella, John, Clemens Fuest and Tim Schmidt-Eisenlohr
Response on EU proposal for a Financial Transaction Tax
WP11/16 Loretz, Simon and Socrates Mokkas Evidence for
profit-shifting with tax sensitive capital stocks
WP11/15 Weisenbach, david A. Carbon taxation in the EU:
Expanding EU carbon price
WP11/14 Bauer, Christian, Davies, Ronald B. and Andreas Hauer
Economic Integration and the Optimal Corporate Tax
Structure with Heterogeneous Firms

WP11/13 Englisch, Joachim National Measures to Counter Tax
Avoidance under the Merger Directive
WP11/12 de la Feria, Rita and Clemens Fuest Closer to an
Internal Market? The Economic Effects of EU Tax Jurisprudence
WP11/11 Englisch, Joachim EU Perspective on VAT Exemptions
WP11/10 Riedel, Nadine and Hannah Schildberg-Hörisch
Asymmetric Obligations
WP11/09 Böhm, Tobias and Nadine Riedel On Selection into
Public Civil Service
WP11/08 Auerbach, Alan J. and Michael P. Devereux Consumption
and Cash-Flow Taxes in an International Setting
WP11/07 Becker, Johannes and Clemens Fuest Tax Competition:
M&A versus Greenfield Investment
WP11/06 Riedel, Nadine Taxing Multinationals under Union
Wage Bargaining
WP11/05 Liu, Li and Rosanne Altshuler Measuring the Burden of
the Corporate Income Tax under Imperfect Competition
WP11/04 Becker, Johannes and Clemens Fuest The Taxation of
Foreign Profits - The Old View, the New View, and a Pragmatic
View
WP11/03 Konrad, Kai Search Costs and Corporate Income Tax
Competition
WP11/02 Hellerstein,Walter Comparing the Treatment of
Charities Under Value Added Taxes and Retail Sales Taxes
WP11/01 Dharmapala, Dhammika and Nadine Riedel Earnings
Shocks and Tax-Motivated Income-Shifting: Evidence from
European Multinationals
WP10/23 Schmidt-Eisenlohr, Tim Towards a Theory of Trade
Finance
WP10/22 Freedman, Judith and John Vella HMRC's Management
of the UK Tax System: The Boundaries of Legitimate Discretion

WP10/21 de la Feria, Rita Reverberation of Legal Principles:
Further Thoughts on the Development of an EU Principle of
Prohibition of Abuse of Law
WP10/20 Hauer, Andreas and Frank Stähler Tax competition in a
simple model with heterogeneous firms: How larger markets
reduce profit taxes
WP10/19 Cnossen, Sijbren Improving the VAT Treatment of
Exempt Immovable Property in the European Union
WP10/18 Grubert, Harry and Richard Krever VAT and Financial
Supplies: What should be taxed?
WP10/17 Gendron, Pierre-Pascal VAT Treatment of Public Sector
Bodies: The Canadian Model
WP10/16 Niepmann, Friederike and Tim Schmidt-Eisenlohr Bank
Bailouts, International Linkages and Cooperation
WP10/15 Bond, Stephen and Jing Xing Corporate taxation and
capital accumulation
WP10/14 Lockwood, Ben How should financial intermediation
services be taxed?
WP10/13 Becker, Johannes, Fuest, Clemens and Nadine Riedel
Corporate tax effects on the quality and quantity of FDI
WP10/12 Fuest, Clemens and Nadine Riedel Tax Evasion and Tax
Avoidance in Developing Countries: The Role of International
Profit Shifting
WP10/11 Wildasin, David E. State Corporation Income Taxation:
An Economic Perspective on Nexus
WP10/10 Becker, Johannes and Marco Runkel Corporate tax
regime and international allocation of ownership
WP10/09 Simpson, Helen How do firms' outward FDI strategies
relate to their activity at home? Empirical evidence for the UK
WP10/08 Voget, Johannes, Headquarter Relocations and
International Taxation

WP10/07 Devereux, Michael P. and Simon Loretz Evaluating
Neutrality Properties of Corporate Tax Reforms
WP10/06 Davies, Ronald B. and Lourenço S. Paz, Tarifs Versus VAT
in the Presence of Heterogeneous Firms and an Informal Sector
WP10/05 Finke, Katharina, Heckemeyer, Jost H., Reister Timo and
Christoph Spengel Impact of Tax Rate Cut Cum Base Broadening
Reforms on Heterogeneous Firms - Learning from the German
Tax Reform 2008
WP10/04 Koh, Hyun-Ju and Nadine Riedel Do Governments Tax
Agglomeration Rents?
WP10/03 Dischinger, Matthias and Nadine Riedel The Role of
Headquarters in Multinational Profit Shifting Strategies
WP10/02 Vrijburg, Hendrik and Ruud A. de Mooij Enhanced
Cooperation in an asymmetric model of Tax Competition
WP10/01 Bettendorf, Leon, van der Horst Albert, de Mooij, Ruud
A. and Hendrik
Vrijburg, Corporate tax consolidation and enhanced
cooperation in the European Union
WP09/32 Bettendorf, Leon, Devereux, Michael P., van der Horst,
Albert, Loretz,
Simon and Ruud A. de Mooij Corporate tax harmonization in
the EU
WP09/31 Karkinsky, Tom and Nadine Riedel Corporate Taxation
and the Choice
of Patent Location within Multinational Firms
WP09/30 Becker, Johannes and Clemens Fuest Transfer Pricing
Policy and the
Intensity of Tax Rate Competition