banque de france · banque de france economic report. 2 2. 3 contents monetary policy and financial...
TRANSCRIPT

2015
Banque de FranceEconomic report

2 BANQUE DE FRANCE – RAPPORT ÉCONOMIQUE 2015

3
CON
TEN
TS
MONETARY POLICY AND FINANCIAL STABILITY 4
Summary 6
1 Market and international environment 7
Volatile markets characterised by a few major trends, including lower oil prices, an economic slowdown in emerging countries, particularly China, and expectations of monetary policy decoupling 7Uneven economic growth around the world 13
2 Economic and monetary situation in the euro area and France 19
A mixed growth recovery 19Prices slowed, largely due to the decline in oil prices 23Monetary and financial developments: moderate change in monetary aggregates 28
3 The Eurosystem’s response in terms of monetary policy and financial stability 32
A responsive, multi-faceted monetary policy 32Measures to ensure financial stability, which also play an important role in promoting sustainable growth, particularly in a low interest rate environment 39
4 Measures and reforms needed to consolidate the recovery 43
Measures and reforms in France 43Measures and reforms in the euro area and internationally 51


International environmentEconomic and monetary situation in the euro area and FranceThe Eurosystem’s response in terms of monetary policy and financial stabilityMeasures and reforms needed to consolidate the recovery
Monetary policy and financial stability

6 BANQUE DE FRANCE – ECONOMIC REPORT 2015
Summary
I n addition to being volatile, financial markets reflected several key economic and financial trends in 2015, including lower oil prices, an economic
slowdown in emerging countries, particularly China, and expectations of monetary policy decoupling. At year’s end, with US growth and the labour market in good shape, the Federal Reserve began tightening monetary policy, in a move that it had been talking about for some months.
Euro area growth picked up compared with 2014, notably in France, but the pace remained moderate. Inflation was sharply lower in 2015 than expected at end-2014, particularly in the case of the harmonised index of consumer prices (HICP), chiefly owing to the drop in oil prices. Core inflation did not move much on the whole.
In this setting, the Governing Council of the European Central Bank (ECB) adopted a responsive monetary policy and took a more accommodative stance to counter the risks to the economy posed by very low inflation over a prolonged period. In particular, the Eurosystem’s expanded asset purchase programme, combined with forward guidance on policy rates, helped to prevent inflation and growth from going lower still. However, while monetary policy can do and has done
a lot, it cannot do everything. Other economic policies also have a role to play.
Alongside monetary policy, measures aimed at ensuring financial stability are also important to promoting sustainable growth. Action in this area included continued supervision of microprudential risk, which ensures healthy financing for the economy, and a greater role for macroprudential bodies, which are particularly crucial in a low interest rate environment.
The highly accommodative stance of monetary policy must not cause the necessary reforms to be put off. Rather, this cyclical support for economic activity should facilitate the implementation of measures that will deliver years of beneficial effects. In particular, the fiscal consolidation of recent years needs to be stepped up over time so that the trajectory of France’s government debt can be quickly reversed. Progress was made in 2015 in the structural reforms needed to avoid the threat of weak long-run growth, as well as in steps aimed at deepening the European Union’s economic governance in order to promote strong, balanced growth. These efforts must be pursued.
The following analyses are based on economic data to 8 April 2016.

7
MO
NET
ARY
POLI
CY A
ND
FIN
ANCI
AL S
TABI
LITY
Market and international environment
Volatile markets characterised by a few major trends, including lower oil prices, an economic slowdown in emerging countries, particularly China, and expectations of monetary policy decoupling
Financial market developments in 2015 were heavily influenced by announcements by the major central banks and by the prospects of a gradual decoupling of monetary policies. In the United States, the Federal Reserve began tightening policy at year’s end, raising the fed funds rate on 16 December for the first time since 2006, in a move that market participants had been anticipating for some months. In the euro area, meanwhile, the Eurosystem adopted a more accommodative stance from early 2015 onwards, introducing and later stepping up measures to counter the risk of deflation and support the area’s economy (see the first two sections of Chapter 3 for more details). The Bank of Japan stood pat, keeping monetary policy extremely accommodative throughout the year.
At the same time, signs that the Chinese economy was slowing, which became increasingly perceptible from the summer onwards, made equity and commodity markets more volatile, prompting investors to shift into safer assets such as US Treasuries. The ongoing slide in oil prices, seen as heralding a global growth slowdown, also weighed on financial markets in 2015.
Against this backdrop, capital continued to flow out of emerging economies amid mounting concerns over the Chinese economy and softer commodity prices, but also because of the deteriorating economic and political situation in several countries, including Brazil and Argentina.
Bond markets: purchase programmes by euro area central banks delivered positive effects
In the United States, expectations of higher rates saw the yield curve edge upwards, although yields on sovereign bonds (see Chart 1) rose to
different degrees across maturities, with a 40 basis point (bps) increase for 2-year bonds, 10 bps for the 5-year segment, and 25 bps for 10- to 30-year sovereign bonds. In Japan, the curve steepened slightly as short and intermediate yields fell (by up to 6 bps on the 10-year segment), while the very long end stayed more or less the same (30-year bonds crept up 3 bps).
In the euro area, sovereign yield curves declined sharply at the short end, with 2-year bonds down by between 25 and 50 bps, and also in the intermediary segment (between 5 bps and 45 bps for 5-year bonds), reflecting monetary policy announcements and measures. Overall, long yields climbed by between 10 bps and 30 bps (except in Italy and Portugal, where they fell sharply) from the astonishingly low levels seen in late 2014 and early 2015. Investors had already largely priced in the public sector purchase programme announced by the ECB on 22 January 2015, which prompted a marked decrease in yields and a decline in the euro against the dollar from the second half of 2014.
1

MO
NET
ARY
POLI
CY A
ND
FIN
ANCI
AL S
TABI
LITY
8 BANQUE DE FRANCE – ECONOMIC REPORT 2015
German yields fell by 25 bps on the short end of the curve (up to 2 years) and by 5 bps on the intermediate segment (2 to 5 years), while increasing by 10 bps at the long end (see Chart 1). Sovereign yield curves in countries with similar
profiles, such as Finland, Netherlands, Austria, France and Belgium, reported similar movements.
The economic pick-up and structural reforms lifted some of the pressure
C2 Euro area ten-year sovereign spreads over Bunds(percentage points)
0.0
0.5
1.0
1.5
2.0
Jan.2015
Mar. May July Sep. Nov. Jan.2016
France Austria Belgium Netherlands Spain Italy
Source: Bloomberg.
C1 Ten-year sovereign yields(%)
0.0
0.5
1.0
1.5
2.0
2.5
Jan.2015
Mar. May July Sep. Nov. Jan.2016
France Germany United States United Kingdom Japan
Source: Bloomberg.
in so-called peripheral countries. Italian and Portuguese yields fell across the board (by between 30 bps and 50 bps depending on the maturity), causing the spread over benchmark German 10-year Bunds to narrow by 30-40 bps (see Chart 2). Spanish yields rose slightly at longer maturities (15 bps on the 10-year segment, 5 bps on the 30-year segment) owing to political uncertainty caused by the outcome of the legislative elections on 20 December. The spread over 10-year Bunds widened slightly.
European yields experienced bouts of volatility during the spring (when there was a huge sell-off of German bonds, dubbed the “Bund tantrum”1 in the market literature, which also affected other euro area debt securities) and over the summer, amid stress linked to the renegotiation of Greek debt. Political events then contributed to heightened volatility in the final quarter for sovereign yields in Spain (regional elections in Catalonia, legislative elections) and Portugal (legislative elections).
1 Bund tantrum: on 7 May 2015, after a two-week downturn on the German bond market, the yield on 10-year Bunds abruptly jumped by over 20 bps before falling back to opening levels. There was no specific reason that might have triggered the movement on that day.

9
MO
NET
ARY
POLI
CY A
ND
FIN
ANCI
AL S
TABI
LITY
Foreign exchange market: euro depreciation, dollar and yuan appreciation
Monetary authorities in developed countries and emerging economies alike took major decisions in 2015 in terms of managing their currencies’ exchange rates. Starting with developed countries, on 15 January 2015 the Swiss National Bank (SNB) removed the floor rate for the Swiss franc, which had been pegged at 1.20 against the euro since September 2011. The Swiss franc moved close to parity with the euro after the decision, before fluctuating at around 1.1 thereafter (see Chart 3). On emerging markets, the People’s Bank of China (PBC) unveiled new procedures on 11 August 2015 for calculating the renminbi’s central exchange rate, indicating that the market would play a greater role in guiding the rate, although the currency would only be allowed to move within a range of 2% around the central rate. In addition, the reference basket used to calculate the rate was expanded in December to include China’s main trading partners. As a result, the renminbi lost around 4.7% against the US dollar during the second half of 2015 (see Chart 3). Argentina’s central bank, meanwhile,
said on 17 December that it was lifting most of the restrictions on the foreign exchange market. The Argentine peso depreciated by over 30% against the US dollar on the heels of this news.
The euro depreciated by 8.5% in real terms against the rest of the world’s main currencies in 2015, while the US dollar, yen and sterling appreciated. The euro’s nominal effective exchange rate2 fell by 7.1%, while the dollar rate appreciated by 12%. The euro/dollar exchange rate went from 1.21 in the early part of the year to 1.09 by the end, notably reflecting increased divergence in the two zones’ monetary policies.
Equity markets: markets held steady in industrialised countries, while exchanges in emerging countries underperformed
Stock indices had contrasting fortunes in 2015, with industrialised countries enjoying relative stability while exchanges in emerging countries underperformed and were highly volatile. The main stock indices
C3 Nominal effective exchange rates of the main currencies, 1 January to 31 December 2015(1 January 2015 = 100)
80
90
100
110
130
Jan.2015
Mar. May July Sep. Nov. Jan.2016
Euro Dollar Yen SterlingSwiss franc Emerging currencies
120
Renminbi
Sources: Bloomberg, ECB, Fed, BoE, J.P. Morgan, Barclays.
2 The effective exchange rate of a monetary area is a synthetic measure of exchange rates with its trade partners and competitors. The nominal effective exchange rate (NEER) is calculated using nominal exchange rates, while the real effective exchange rate (REER) factors in price indices for each currency.

MO
NET
ARY
POLI
CY A
ND
FIN
ANCI
AL S
TABI
LITY
10 BANQUE DE FRANCE – ECONOMIC REPORT 2015
Box 1
Market liquidity risk: fact and fiction
Market liquidity may be defined as a measurement of the ability to buy or sell assets quickly on a given market without materially affecting the prices of these assets.
Liquidity conditions were variable in 2015
Instances of significant intraday variations in financial market prices have become more frequent since the start of summer 2015, notably in German sovereign bonds, which are traditionally considered to be extremely liquid safe haven securities. Higher average bid-ask spreads, i.e. calculated on bonds of different maturities, reflect the strain felt by the markets. In Spain for example (see Chart Ca), the main volatility spikes were seen during the “Bund tantrum”, which put pressure on the sovereign yields of peripheral euro area countries in the springtime, and during electoral periods, including the Catalonia referendum at the end of September and legislative elections in late December.
A shift in liquidity from instruments traded on the secondary market to the futures market was also observed during this period (see Chart Cb).
Ca Average bid-ask spreads(in cents)
0
10
20
30
40
70
Jan.2015
Mar. May July Sep. Nov. Jan.2016
France Germany Italy Spain
50
60
Note: The bid-ask spread represents the average spread between bid and ask prices for liquid sovereign bonds of the main European economies.
Cb Bund futures contracts(in millions)
Bund futures OI (left-hand scale)
0
5
10
15
20
30
25
Jan. Feb. Mar. Apr. May June July Aug. Sep. Oct. Nov. Dec.0
4
8
12
16
24
20
Bund futures volume (right-hand scale)
Note: Volume refers to trading volume on the futures market in German 10-year sovereign bonds. Open interest (OI) refers to demand for futures that remained outstanding at the end of each trading session.

11
MO
NET
ARY
POLI
CY A
ND
FIN
ANCI
AL S
TABI
LITY
While direct measures of the price of liquidity through bid-ask spreads do not reveal a marked downturn on core markets, other indicators – order size and market depth, price impact and inventories for example – point to a deterioration that varied across segments and geographical zones (in a phenomenon known as “bifurcation”) and increased the likelihood of bouts of volatility and reduced liquidity.
The main factors behind these episodes of market weakness may be, firstly, a mismatch between the supply of and demand for the intermediation services provided by market makers, and secondly, the variations that these players may display depending on conditions to agree to hold securities on their balance sheets. Other developments may also exacerbate these occasional spells of frailty.
Rise of new players
Exchange traded funds (ETFs) may play a negative role in changes in the liquidity of financial instruments during a crisis. Funds that replicate a market index tend to amplify price fluctuations as managers buy and sell the underlying securities as a function of their changing share of the index’s total capitalisation.
Growth in high frequency trading (HFT) could foster a “liquidity illusion”. While bid-ask spreads have narrowed in many cases owing to lower trading costs and stiffer competition, the liquidity provided by HFT firms could vanish in the event of market stress, since this liquidity is not tied to any explicit or implicit obligation towards exchanges or customers.
Given HFT’s commanding share of certain markets, traditional risks on financial markets (liquidity, price, counterparty) could now develop at a speed that exceeds manual detection and intervention capabilities. Any event that could have a negative impact will be magnified on the markets if it leads to similar reactions by multiple algorithms, whether these are adjustments driven by sensible risk management or merely examples of herd behaviour.
In the face of the rise of HFT and its associated risks, US and European regulators are paying close attention to firms engaging in this business. Europe’s new Markets in Financial Instruments Directive (MiFID 2), which is to be implemented in 2018, aims to restore the balance between the rights and obligations of market participants. To do this, the directive requires HFT activities to be authorised and provides a harmonised European definition for tick size that varies depending on the instruments in question and their liquidity.
in industrialised countries ended the year close to the levels seen on 1 January (Europe’s Euro Stoxx 50 ended the year up 3%; in the
United States, the S&P 500 was stable; in Japan, the Nikkei put on 9% – see Chart 4). Indices in emerging countries underperformed markedly
– the MSCI emerging markets index fell by 17% – reflecting the impact of uncertainties over the economic situation of several countries directly

MO
NET
ARY
POLI
CY A
ND
FIN
ANCI
AL S
TABI
LITY
12 BANQUE DE FRANCE – ECONOMIC REPORT 2015
affected by lower commodity prices, particularly Brazil and Russia, and the expected effect of higher Fed rates on investor behaviour. Volatility was especially high on several emerging stock markets. Chinese markets, where valuations had soared through to June 2015, surrendered around 30% in the space of a few weeks (see Chart 4). This correction was accompanied by spillover that caused a number of other global stock markets to decline steeply.
Commodity markets: prices tumbled across the board
In 2015, the main commodity price indices tumbled owing to the combined effect of cooler global demand, especially from emerging countries, and China above all, and excess supply.
Continuing the decline that began in mid-2014, the price of Brent crude fell by approximately 20% between January and December 2015, sliding from USD 48 to USD 38 a barrel on a monthly average (see Chart 5). Overall, from its peak in June 2014 at USD 112, Brent was down by more than 60% at end-December 2015. It picked up initially between January
and May 2015, hitting a year-long high of USD 65 (monthly average), before dropping again, chiefly owing to the dimmer outlook for global growth, amid dollar appreciation and excess supply, which saw oil
C4 Stock indices in 2015(1 January 2015 = 100)
80
90
100
110
160
Jan.2015
Mar. May July Sep. Nov. Jan.2016
Euro Stoxx 50 S&P 500 NikkeiFootsie MSCI emerging markets
120
CSI 300 (Shanghai Shenzhen)
130
140
150
Sources: Bloomberg, Morgan Stanley.
C5 Brent oil price
30
40
50
60
80
Jan.2015
Mar. May July Sep. Nov. Jan.2016
Brent oil price in dollars Brent oil price in euros
70
Source: Datastream.
inventories build up to exceptional levels (65 days of consumption in December 2015). The prices of other energy commodities also trended downwards in 2015, with the price of natural gas falling by 30% year-on-year

13
MO
NET
ARY
POLI
CY A
ND
FIN
ANCI
AL S
TABI
LITY
in December 2015 according to the London Natural Gas Index. Australian coal gave up 15% over the same period.
In non-precious metals, which are extremely sensitive to global demand, more muted growth expectations in many emerging countries weighed heavily on all markets in 2015. Despite a short-lived uptick between May and July 2015, the global index of metal prices was down approximately 20% year-on-year in December 2015 (see Chart 6). The decline was driven especially by falling nickel, zinc, aluminium and copper prices. Precious metal prices, which tend to behave countercyclically, were relatively stable over the period.
In agricultural commodities, high inventory levels and weaker-than-expected Chinese imports put downside pressure on cereal prices until the midpoint of the year. Towards the end of 2015, bad weather conditions in producer countries, especially the United States, caused this downtrend to break off; in Africa, poor conditions actually pushed cocoa prices up to record levels. Overall, the index of agricultural commodity prices was down by around 10% on a year-on-year basis in December 2015 (see Chart 6).
Uneven economic growth around the world
Emerging countries experienced a pronounced slowdown in 2015
In 2015, growth slowed among emerging countries for the fifth year running, averaging 4.0%, after 4.6% in 2014 (see Chart 7). Performances varied, however, with China undergoing a pronounced economic slowdown (see Box 2), Russia and Brazil in recession, and India and South-East Asia acting as the engines of the global economy. The continued slide in oil prices in 2015 was a drag on the activity, external accounts and government finances of many oil-exporting countries, including Russia and the CIS
nations, Saudi Arabia, Iran, Venezuela and African countries. Cooler growth and expectations of higher US rates triggered capital flight, depreciation for many emerging currencies and increased volatility on emerging financial markets, even as the run-up in debt of recent years, particularly in the private sector, led to heightened balance sheet vulnerabilities and exposure to currency risk.
The Russian economy entered recession in 2015, as GDP contracted by 3.7% after expanding by 0.6% in 2014 (see Chart 7). The economic situation deteriorated severely owing to the continued fall in oil prices and international sanctions linked to the geopolitical conflict with Ukraine. The rouble sustained a substantial depreciation, losing 23%
C6 Metal and agricultural commodity price indices(prices in dollars, 1 January 2015 = 100)
70
80
90
100
120
Jan.2015
Mar. May July Sep. Nov. Jan.2016
Metal prices Agricultural commodity prices
110
Sources: S&P, GSCI.

MO
NET
ARY
POLI
CY A
ND
FIN
ANCI
AL S
TABI
LITY
14 BANQUE DE FRANCE – ECONOMIC REPORT 2015
against the dollar over the space of a year, although it stabilised towards the end of the year as capital flight slowed relative to the period when tensions were at their peak following the introduction of international sanctions. The fiscal situation deteriorated considerably, with the government deficit reaching 3% of GDP as taxes paid by oil-exporting companies plummeted. The sustainability of government finances remains uncertain if weak oil prices persist. A price of USD 40 a barrel would result in a deficit of 4.5% of GDP in 2016. However, government debt remains low, at 19% of GDP. The current account surplus is expected to remain high in 2015, at approximately 5% of GDP, owing to weak domestic demand. Inflation jumped from 7.8% in 2014 to 15.5% in 2015 on an annual average
because of the rouble’s decline, which led to additional imported inflation, whereas domestic pressure remained moderate owing to falling wages.
In Brazil, economic activity nosedived, with a 3.8% contraction in 2015 after 2014’s 0.1% expansion (see Chart 7), reflecting a steep drop in domestic demand against the backdrop of a political crisis. Private consumption and investment were hard hit by fiscal and monetary tightening measures introduced to stave off inflationary pressures. Political scandals (corruption at Petrobras involving many elected officials, start of impeachment proceedings for President Dilma Rousseff) undermined consumer sentiment and the business climate alike. Adding to the political
uncertainty, the consolidated fiscal deficit reached considerable proportions (approximately 10% of GDP), limiting the authorities’ ability to implement countercyclical policies. In this challenging situation, the three main credit rating agencies cut Brazil’s long-term sovereign debt rating. The currency lost around 50% against the dollar over the year under the combined effect of reduced net capital flows (in a trend that affected most emerging countries in the second half of the year) connected with expectations of monetary policy normalisation in the United States, a downturn in the terms of trade due to lower metal and food prices, and gloomier growth prospects.
Bucking the trend in other large emerging countries, India continued to enjoy brisk economic activity, with GDP growth at approximately 7.3% in 2015 (see Chart 7), similar to the 2014 performance. The commodity price correction had a positive impact on India, unlike in most other emerging countries, which are mainly producers rather than consumers. At the same time, the slowing pace of Chinese growth did not affect India much, since China accounts for a mere 5% of the country’s exports. Monetary policy was used to avoid external shocks, as the Reserve Bank of India cut its main policy rate three times in 2015
C7 GDP growth in emerging economies(annual average, %)
-8
-4
0
4
8
16
Brazil Russia India China Total emerging economies
1999 2000 2001 2002 2003 2004 2005 2006 2007 2008 2009 2010 2011 2012 2013 2014 2015
12
Source: IMF.

15
MO
NET
ARY
POLI
CY A
ND
FIN
ANCI
AL S
TABI
LITY
Box 2
The impact of the Chinese slowdown on global growth: effects channelled through international trade are magnified in the event of financial contagion
The Chinese economy is continuing the gradual slowdown that has been underway since 2012. It recorded growth of 6.9% in 2015, after 7.3% in 2014. The slower pace reflects a structural shift, as China’s potential growth has fallen from a pre-crisis level of approximately 10% to around 6.5%.1 The country is in a demographic transition that is causing the working population to shrink, while the slowdown in the reallocation of labour to the manufacturing sector and the growing importance of services are hampering productivity gains. The markets felt that the deceleration in activity in 2015 was more extensive than that reported by the official statistics, which partly explains the turbulence seen on financial markets in summer 2015.
The decline in growth is essentially due to a slowdown in investment, notably in industry and property, which are both sectors plagued by significant excess production capacity. Consumption, meanwhile, appears to be relatively resilient. Thus, despite some disappointing supply-side signals, the Chinese economy looks to be advancing in the rebalancing process, becoming less based on investment and more on consumption. Externally, the macroeconomic imbalances have been largely absorbed since 2007, with the current account surplus diminishing to 2.7% of GDP in 2015, compared with 8.8% in 2007, although the process was interrupted in 2015 as imports contracted by more than exports.
In this setting, China’s policy mix became increasingly accommodative in 2014-2015 in response to the relatively sluggish pace of economic activity. Monetary policy was loosened several times after November 2014, with interest rates cut six times, from 6.0% to 4.35%, and reserve requirements lowered on four occasions. However, monetary conditions eased by less than expected, owing to weak overall inflation (1.5% in 2015). The stimulating impact of monetary policy was also lessened by the already high level of total public and private debt (over 230% of GDP in 2015), notably among businesses and local authorities. Accordingly, stimulus measures were also based on fiscal easing, with the government deficit estimated at approximately 2.7% of GDP in 2015, compared with 1.8% in 2014.
1 See Albert (M.), Jude (C.) and Rebillard (C.) (2015): “The Long Landing Scenario: Rebalancing from Overinvestment and Excessive Credit Growth. Implications for Potential Growth in China”, Banque de France, Working Paper No. 572, October. https://www.banque-france.fr/economie-et-statistiques/la-recherche/documents-de-travail/document/572.htm
by a total of 100 bps, from 7.75% in January to 6.75% at the year’s end. In February, the central bank adopted an inflation target of 4% (±2%), and inflation remained broadly under control over the year, at an annual average of 4.9%, despite spiking in the
last quarter as food prices rebounded. In addition, unlike many emerging currencies, which depreciated in 2015, the rupee held relatively steady against the dollar. A number of financial, fiscal and structural reforms were conducted in 2015 as Mr Modi’s government
began its term in office. The pace of reforms eased off in the summer, however, and the banking sector remains a factor of weakness given the high level of non-performing loans and the low capitalisation levels of the country’s publicly owned banks.
MO
NET
ARY
POLI
CY A
ND
FIN
ANCI
AL S
TABI
LITY
16 BANQUE DE FRANCE – ECONOMIC REPORT 2015
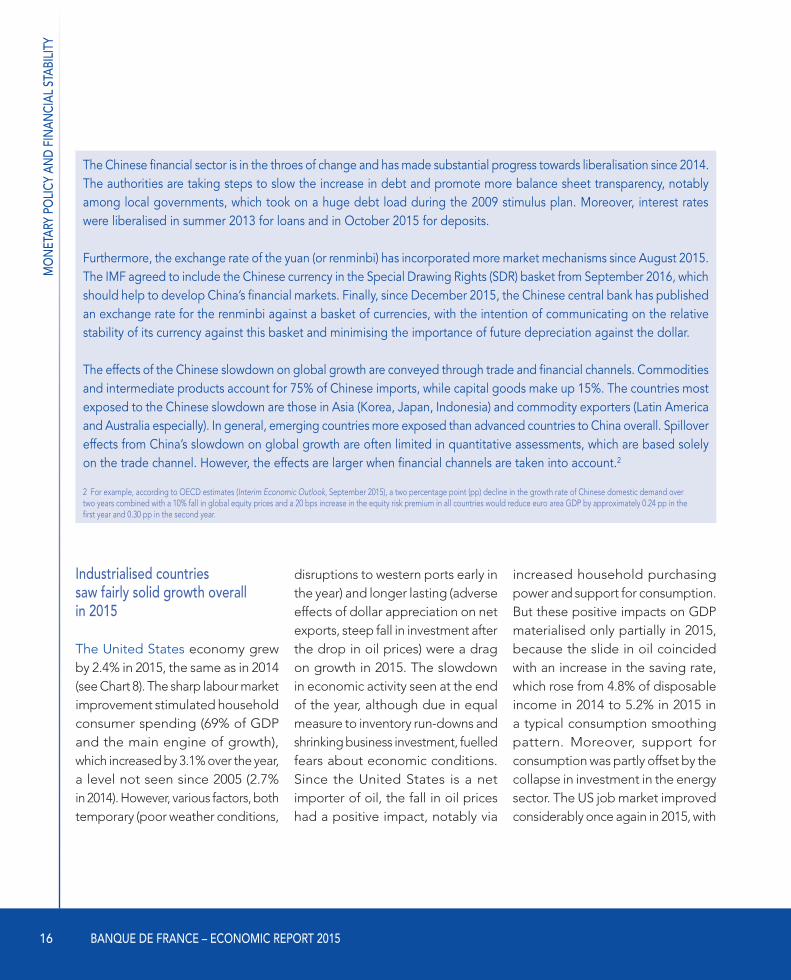
The Chinese financial sector is in the throes of change and has made substantial progress towards liberalisation since 2014. The authorities are taking steps to slow the increase in debt and promote more balance sheet transparency, notably among local governments, which took on a huge debt load during the 2009 stimulus plan. Moreover, interest rates were liberalised in summer 2013 for loans and in October 2015 for deposits.
Furthermore, the exchange rate of the yuan (or renminbi) has incorporated more market mechanisms since August 2015. The IMF agreed to include the Chinese currency in the Special Drawing Rights (SDR) basket from September 2016, which should help to develop China’s financial markets. Finally, since December 2015, the Chinese central bank has published an exchange rate for the renminbi against a basket of currencies, with the intention of communicating on the relative stability of its currency against this basket and minimising the importance of future depreciation against the dollar.
The effects of the Chinese slowdown on global growth are conveyed through trade and financial channels. Commodities and intermediate products account for 75% of Chinese imports, while capital goods make up 15%. The countries most exposed to the Chinese slowdown are those in Asia (Korea, Japan, Indonesia) and commodity exporters (Latin America and Australia especially). In general, emerging countries more exposed than advanced countries to China overall. Spillover effects from China’s slowdown on global growth are often limited in quantitative assessments, which are based solely on the trade channel. However, the effects are larger when financial channels are taken into account.2
2 For example, according to OECD estimates (Interim Economic Outlook, September 2015), a two percentage point (pp) decline in the growth rate of Chinese domestic demand over two years combined with a 10% fall in global equity prices and a 20 bps increase in the equity risk premium in all countries would reduce euro area GDP by approximately 0.24 pp in the first year and 0.30 pp in the second year.
Industrialised countries saw fairly solid growth overall in 2015
The United States economy grew by 2.4% in 2015, the same as in 2014 (see Chart 8). The sharp labour market improvement stimulated household consumer spending (69% of GDP and the main engine of growth), which increased by 3.1% over the year, a level not seen since 2005 (2.7% in 2014). However, various factors, both temporary (poor weather conditions,
disruptions to western ports early in the year) and longer lasting (adverse effects of dollar appreciation on net exports, steep fall in investment after the drop in oil prices) were a drag on growth in 2015. The slowdown in economic activity seen at the end of the year, although due in equal measure to inventory run-downs and shrinking business investment, fuelled fears about economic conditions. Since the United States is a net importer of oil, the fall in oil prices had a positive impact, notably via
increased household purchasing power and support for consumption. But these positive impacts on GDP materialised only partially in 2015, because the slide in oil coincided with an increase in the saving rate, which rose from 4.8% of disposable income in 2014 to 5.2% in 2015 in a typical consumption smoothing pattern. Moreover, support for consumption was partly offset by the collapse in investment in the energy sector. The US job market improved considerably once again in 2015, with

17
MO
NET
ARY
POLI
CY A
ND
FIN
ANCI
AL S
TABI
LITY
net monthly job creations averaging 228,000, compared with approximately 250,000 in 2014 and 185,000 annually since 2010. The unemployment rate fell by six-tenths of a point over the year to 5% in December, close to the estimated structural unemployment rate. The pronounced decline in unemployment was not accompanied by a similarly sharp increase in wages, with nominal hourly wages in the private sector up 2.0% over the year. Broadly speaking, 2015 was a good year for the US housing market. Buoyed by the Federal Reserve’s continued expansionary monetary policy, sales of new and existing homes climbed by 10% and 5% respectively in 2015. Demand for housing also gave a lift to construction (the number of housing starts increased by 10%), and house prices rose by just over
4.6% in 2015 after 6.6% in 2014, according to the nationwide S&P/Case-Shiller index. Conversely, US industrial production slowed sharply in 2015, with growth, though positive at 1.3%, after 3.7% in 2014, reaching its lowest level since 2009. Dollar appreciation – it put on approximately 12% in nominal effective terms in 2015 – eroded the price competitiveness of the United States and explains the relatively weak performance of the US export sector, which was already contending with the effects of muted global demand. The current account deficit was 2.8% of GDP in Q4 2015, while the federal deficit was once again reduced in the 2015 fiscal year, to 2.4% of GDP in 2015 after 2.8% in 2014. According to the Congressional Budget Office (CBO), outstanding federal debt was 73.8%
of GDP, down from 74.0% at the end of the 2014 financial year.
The decline in oil prices, and in energy prices generally, contributed negatively to inflation in 2015. The Consumer Price Index (CPI) inched up by 0.1% over the year after 1.6% in 2014, while the Personal Consumption Expenditure (PCE) index tracked by the Fed rose by only 0.3%, after 1.4% in 2014. Improved domestic conditions notwithstanding, dollar appreciation and the reduced cost of imported goods contained core inflation (excluding food and energy): the core CPI increased by 1.8% over one year after 1.7% in 2014, while the core PCE index rose by 1.3% after 1.5% in 2014. The significant upturn in the job market and the economy’s position in the business cycle prompted the Fed, after preparing the markets at length, to hike policy rates by 25 bps to 0.5% following the December meeting of the Federal Open Market Committee (FOMC), although it stressed that normalisation of monetary policy would take place gradually and depend on the future path of key economic indicators.
In the United Kingdom, economic activity remained solid throughout 2015 despite easing relative to 2014, with
C8 GDP growth(annual average, %)
-6
-4
0
6
United States United Kingdom Japan
2000 2001 2002 2003 2004 2005 2006 2007 2008 2009 2010 2011 2012 2013 2014 2015
-2
2
1999
4
Source: IMF.

MO
NET
ARY
POLI
CY A
ND
FIN
ANCI
AL S
TABI
LITY
18 BANQUE DE FRANCE – ECONOMIC REPORT 2015
GDP growth averaging 2.3% over the year vs. 2.9% the previous year. The services sector was the main driver, while construction and industrial production contributed weakly to the expansion. The labour market continued to recover over 2015. Job creations translated into a swift decline in the unemployment rate, which fell by six-tenths of a point over the year to 5.1% in December. Real wages gradually accelerated, without fuelling inflationary pressures. Activity on the housing market also picked up speed in the second half of the year, with increases in loans and in the number of deals. At the same time, the difference between strong demand and available supply on the housing market continued to drive a sharp run-up in house prices across the country, with an increase of 8.9%, after 8.7% previously, according to the Halifax House Price Index. The ratio of house prices to household disposable income also rose. The goods and services deficit remained sizeable at around 2.0% of GDP in 2015, after approximately 1.9% in 2014. The current account deficit widened slightly in 2015 to 5.2% of GDP, compared with 5.1% in 2014. The government deficit, according to the Maastricht definition, narrowed in 2015 to approximately 4.2% of GDP from 5.6% in 2014. Government debt
totalled 89.2% of GDP in 2015 after 88.6% in 2014.
The CPI recorded zero growth as an annual average in 2015, the lowest level of inflation ever seen in the United Kingdom since the price series was first published. The decline in inflation was chiefly attributable to external factors, including the sharp fall in food and energy prices, coupled with sterling appreciation. However, domestic factors also helped to curb inflation, particularly low unit labour costs owing to the upturn in hourly productivity, even though this trend became less pronounced. In 2015, the Bank of England pursued an accommodative monetary policy, holding the bank rate at 0.5% and keeping GBP 375 billion in assets (essentially Gilts) on its balance sheet.
In Japan, economic activity rebounded moderately in 2015, with real GDP expanding by 0.5% after dipping by 0.1% in 2014. Resilient business investment buoyed growth, with companies generally taking advantage of favourable financing conditions and high profits. Even so, growth was limited by weak consumption, notably due to stagnating household purchasing power, and by the slowdown in exports amid flagging growth in
Asia, especially China. Despite an extremely expansionary monetary policy, featuring quantitative and qualitative easing, and limited fiscal consolidation (the VAT hike slated for 2015 was pushed back to 2017), real GDP posted two quarters of negative growth (Q2 and Q4). Admittedly, structural reforms were introduced in September 2015 as part of the Abenomics 2.0 policy and were chiefly aimed at raising employment and birth rates. But Japan’s weak growth illustrates the difficulties of sustaining a recovery without adequate progress in structural reforms that can raise the level of potential growth, currently estimated at 0.3% by the Bank of Japan. In 2015, Japan’s trade deficit narrowed significantly, contracting from 2.6% to 0.6% of GDP as imports declined sharply, notably owing to lower energy prices. The fiscal balance also improved, although it remains markedly negative at around 5% of nominal GDP. Government debt remains the highest in the OECD at approximately 230% of GDP, even if, as the Finance Ministry says, 91% of this debt is held by residents.
CPI inflation averaged just 0.8% in 2015 (after 2.7% in 2014, chiefly because VAT was hiked from 5% to 8% in April 2014), while core inflation was 0.9%, compared with 0.7% in 2014.

19
MO
NET
ARY
POLI
CY A
ND
FIN
ANCI
AL S
TABI
LITY
Economic and monetary situation in the euro area and France
A mixed growth recovery
Economic activity accelerated in the euro area in 2015: GDP rose by 1.6%, after growing by 0.9% in 2014 and contracting 0.3% in 2013 (see Chart 9). Most euro area countries followed this general trend, notwithstanding national peculiarities. Greece alone posted a negative growth rate in 2015 (–0.2%, after 0.7% in 2014). Of the area’s four main economies, only Germany reported a growth rate in 2015 that was slightly off its performance in 2014 (1.4% vs. 1.6%). Economic activity in Italy increased by 0.8% in 2015, after shrinking by 0.3% in 2014, but, as in France (see opposite), the growth rate remained below that of the euro area as a whole. The Spanish economy continued to expand briskly, with growth of 3.2%.
Household consumer spending and total investment in the euro area increased sharply in 2015, rising by 1.7% and 2.7% respectively, after growing 0.8% and 1.3% in 2014. Government consumption also picked
2up in 2015, with an increase of 1.3%, after 0.8% in 2014. Exports increased markedly (5.0%), but less than imports (5.7%). As a result, external trade made a negative contribution (–0.1 percentage point) to growth in 2015, while the contribution from inventories was zero.
The overall pick-up in euro area activity in 2015 compared with 2014 masked a slightly more vigorous performance going into the year compared with the end: after quarterly growth of 0.6% and 0.4% in
the first two quarters, growth eased to 0.3% in the final two quarters of the year. Industrial production offers a particularly telling example: while it recorded a marked acceleration in 2015, with growth of 1.5%, after 0.9% in 2014, this was chiefly driven by a strong showing at the end of 2014 and in early 2015. In fact, industrial production slowed considerably in the final three quarters of 2015.
In France, growth came out at 1.2% on an annual average basis in 2015, after 0.2% in 2014 (see Table 1).
C9 GDP in volume terms(Q1 2008 = 100)
70
80
90
100
110
Q11999
Q12001
Q12003
Q12005
Q12007
Q12009
France Germany Italy Spain Euro area
75
85
95
105
Q12011
Q12013
Q12015
Q12000
Q12002
Q12004
Q12006
Q12008
Q12010
Q12012
Q12014
Source: Eurostat.

MO
NET
ARY
POLI
CY A
ND
FIN
ANCI
AL S
TABI
LITY
20 BANQUE DE FRANCE – ECONOMIC REPORT 2015
Household consumption increased by 1.4% (after 0.6% in 2014) while that of general government rose by 1.5%, the same as in 2014. Total investment marked time in 2015, after shrinking by 1.2% in 2014. Household investment contracted substantially again, falling by 2.8%, after previously declining 5.3% in 2014, partly for demographic reasons, while general government investment declined by 3.0% after falling 6.9% in 2014, amid a process of fiscal consolidation. These performances were offset by firmer business investment, which
expanded by 2.0% in 2015, the same as in 2014. Although export growth came out at a brisk 6.1% in 2015, after 2.4% in 2014, it was nevertheless overtaken by growth in imports, which reached 6.7%, after 3.9%, such that external trade continued to make a negative growth contribution, at 0.3 pp, compared with a negative 0.5 pp in 2014. This was compensated for by another positive contribution from the change in inventories (0.4 pp).
Growth exhibited an uneven profile over the four quarters, basically
following the stops and starts in household consumption and exports. Spurred by the decline in energy prices, household consumption rose by 0.6% in the first quarter before plateauing in the second quarter and picking up again in the third (0.4%). In the fourth quarter, it was affected by unseasonably warm weather and the 13 November attacks and fell by 0.1%. Exports, meanwhile, advanced briskly in the first part of the year before slowing overall in the second half.
All in all, euro area growth in 2015, at 1.6%, exceeded the 1.0% predicted by the ECB in its December 2014 projection exercise. The better-than-expected growth performance can be attributed to the positive impact of low oil prices and euro depreciation, while global demand was less of a drag than forecast. In France, the extra purchasing power linked to the decline in energy prices prompted households to increase both their consumption and their saving rate; moreover, the euro’s low level paved the way for gains in market share, particularly at the start of 2015, which more than offset the relatively flat global demand directed towards France.
In addition to considering the level of growth over the year, it
T1 French GDP and its components(chain-linked volumes; % quarterly changes and annual averages; data adjusted for seasonal and working day variations)
Q1 2015
Q2 2015
Q3 2015
Q4 2015
2014
2015
GDP 0.6 0.0 0.4 0.3 0.2 1.2Imports 2.2 1.0 1.8 2.4 3.9 6.7Household consumption 0.6 0.0 0.4 -0.1 0.6 1.4GG consumption 0.2 0.3 0.4 0.5 1.5 1.5Total GFCF 0.4 -0.1 0.1 0.7 -1.2 0.0
o/w NFCsa) 0.9 0.5 0.5 1.2 2.0 2.0o/w households -0.5 -1.0 -0.5 -1.0 -5.3 -2.8o/w GGb) 0.0 -0.5 -0.4 1.1 -6.9 -3.0
Exports 1.7 2.0 -0.2 1.1 2.4 6.1Contributions from componentsExternal trade -0.2 0.3 -0.6 -0.4 -0.5 -0.3Household consumption 0.3 0.0 0.2 -0.1 0.3 0.7GG consumption 0.1 0.1 0.1 0.1 0.4 0.4Total GFCF 0.1 0.0 0.0 0.1 -0.3 0.0
o/w NFCsa) 0.1 0.1 0.1 0.2 0.2 0.2o/w households 0.0 -0.1 0.0 -0.1 -0.3 -0.2o/w GGb) 0.0 0.0 0.0 0.0 -0.3 -0.1
Domestic demand excluding inventory 0.5 0.1 0.3 0.2 0.5 1.1Change in inventory 0.3 -0.3 0.7 0.6 0.2 0.4
a) Non-financial companies.b) General government.Source: Insee.

21
MO
NET
ARY
POLI
CY A
ND
FIN
ANCI
AL S
TABI
LITY
Box 3
Market shares of French exports stabilised recently, but results may vary depending on the indicator used
Export performance is a way to gauge an economy’s capacity to respond to global demand for goods and services. Several indicators exist, and the assessment of France’s export performances may vary according to the scope under consideration (goods, services, sum of goods and services) and the comparison basis (world or euro area, for example).
An analysis based on global market shares of goods exports in value terms reveals that France’s position stabilised in 2015. However, this indicator also reflects the arrival of new economies in global trade. Other indicators include exports of services, enabling France’s performances to be compared against the exports of other euro area countries (relative market shares) or demand directed towards France in volume terms.
Total French export volumes can be divided by global demand directed towards France, measured as the sum of global import volumes weighted by the percentage of each country in French exports. This indicator may be used to analyse France’s export growth compared with the import growth of its partners, assuming unchanged geographical specialisation. On a 1999 = 100 base, this indicator suggests that between 2000 and 2010, France’s export market shares tailed off sharply (see Chart Ca): France thus lost market share relative to incoming demand. Market shares then stabilised from 2010 and have increased slightly since 2014, but remain well off the levels seen in 2000, reflecting the fact that emerging economies, and notably China, have opened up to international trade.
Ca French exports of goods and services in volume terms divided by demand directed towards France(Q1 1999 = 100)
75
80
85
90
95
105
Q11999
Q12015
100
Q12000
Q12001
Q12002
Q12003
Q12004
Q12005
Q12006
Q12007
Q12008
Q12009
Q12010
Q12011
Q12012
Q12013
Q12014
Sources: Insee, Eurostat, ECB, Banque de France calculations.
Cb Exports of goods and services in value terms divided by total euro area exports(Q1 1999 = 100)
80
85
90
95
100
120
France Germany Italy Spain
105
110
115
Q11999
Q12015
Q12000
Q12001
Q12002
Q12003
Q12004
Q12005
Q12006
Q12007
Q12008
Q12009
Q12010
Q12011
Q12012
Q12013
Q12014
Sources: Insee, Eurostat, ECB, Banque de France calculations.

MO
NET
ARY
POLI
CY A
ND
FIN
ANCI
AL S
TABI
LITY
22 BANQUE DE FRANCE – ECONOMIC REPORT 2015
The change in France’s market shares can also be analysed by conducting a comparison with other euro area economies, which have relatively similar economic structures and are exposed to the same exchange rate fluctuations and competition from emerging economies. This indicator (relative market shares) can be used to compare France’s export performance against that of its main partners and competitors. The numerator is total French exports in value terms, while the denominator is the sum of total exports in value terms of euro area economies. This indicator also reveals a relative downturn in France’s position in the early 2000s compared with euro area exports. After recovering between 2007 and 2009, France lost share to Germany (see Chart Cb) from 2010 (especially in 2010 and 2014), but at a slower pace than before. The share of French exports in total euro area exports was thus close in 2015 to the level seen in 2008, after a pronounced decline between 1999 and 2007. Since 1999, France and Italy have lost similar amounts of market share in exports of goods and services. However, France’s market shares stabilised at end-2014 and rebounded slightly in 2015, while Italy’s market shares dipped again in 20151 after stabilising in the fourth quarter of 2014.
If only trade in goods in value terms is considered, France has continued to lose market shares in goods exports compared with its European partners since 2010, albeit at a slower pace than before (see Chart Cc). The fact that France ceased to lose export market shares relative to its European partners from 2010 onwards is essentially due to vigorous trade in services, which now account for just over one-quarter of French exports (see Chart Cd).2 Gains in market shares for Spain and Germany, conversely, reflect their performances in goods exports, with Germany also holding up well on the services side. Italy continued to lose market share primarily because of the downturn in its export performances in the services segment.
Cc Exports of goods in value terms divided by total euro area exports(Q1 1999 = 100)
70
75
90
95
100
120
France Germany Italy Spain
105
110
115
Q11999
Q12015
Q12000
Q12001
Q12002
Q12003
Q12004
Q12005
Q12006
Q12007
Q12008
Q12009
Q12010
Q12011
Q12012
Q12013
Q12014
80
85
Sources: Insee, Eurostat, ECB, Banque de France calculations.
Cd Exports of services in value terms divided by total euro area exports(Q1 1999 = 100)
60
70
100
110
120
140
France Germany Italy Spain
130
Q11999
Q12015
Q12000
Q12001
Q12002
Q12003
Q12004
Q12005
Q12006
Q12007
Q12008
Q12009
Q12010
Q12011
Q12012
Q12013
Q12014
80
90
Sources: Insee, Eurostat, ECB, Banque de France calculations.
1 This finding is unchanged when the market share indicator is considered in volume rather than value terms.
2 Note that some statistical changes were made to the preparation of data on trade in services in value terms in 2010. The increase in exports of French services observed since 2010 was accompanied by growth in imports of services. The increased penetration rate of services imports in end demand thus tempers the finding of improved trade competitiveness for French services.

23
MO
NET
ARY
POLI
CY A
ND
FIN
ANCI
AL S
TABI
LITY
is also important to consider the competitiveness of the French economy, notably because of what it tells us about the future. In 2015, the trade deficit in goods (in value terms) narrowed for the fourth year running to reach EUR 45.6 billion, compared with EUR 58.4 billion in 2014 (fob/fob). However, this almost EUR 13 billion reduction in France’s trade deficit was essentially due to the decrease of around EUR 15 billion in the energy deficit (cif/fob). Stripping out energy, the deficit actually increased by EUR 2.4 billion. The services and merchanting surplus amounted to EUR 32 billion, which partly offset the goods deficit. Overall, the goods and services deficit (including merchanting) came to EUR 15.2 billion in 2015, compared with EUR 16.8 billion in 2014. The current account deficit stood at EUR 4.3 billion3 (0.2% of GDP) in 2015, compared with EUR 19.7 billion in 2014 (0.9% of GDP).
France’s share of global trade in goods was approximately 5.5% in value terms in the late 1990s. It shrank for much of the 2000s before stabilising from 2011 onwards, reaching 3.3% in 2015. Adding in services, France’s share of global trade has been fairly stable since 2011 and was 3.5% in 2015 (see Box 3 on France’s share of euro area exports).
The small increase in unit labour costs (ULC, overall economy) in France – they rose by 0.3% in annual average terms in 2015, after 1.5% in 2014 – excluding the impact of the “CICE” (tax credit to support competitiveness and employment), paved the way for a slight improvement in cost-competitiveness relative to the euro area as a whole, where ULC rose by 0.6%. Cost-competitiveness improved especially against Germany, where ULC jumped by 1.8%, and to a lesser extent against Italy (0.5% increase), while Spanish ULC edged up by a smaller amount (0.3%). The gain is even bigger if the CICE is included in labour costs in France. Doing so cuts the ULC growth rate in France by six-tenths of a point in 2015, for an overall decline of 0.3%.
The competitiveness of exports outside the euro area also benefited from euro depreciation against the dollar (12% over one year). In effective terms, the exchange rate depreciated considerably against France’s 38 main trading partners (by 3.9% in 2015, compared with a 1.0% appreciation in 2014). While exports were lifted in France by improved cost-competitiveness, imports were also sustained in 2015, undoubtedly in connection with steps to rebuild goods and energy
inventories. Imports of services were also high, as the increase in the import penetration rate for services observed since 2010 continued in 2015.
Prices slowed, largely due to the decline in oil prices
Euro area inflation continued to head downwards in 2015: the annual average change in the harmonised index of consumer prices (HICP) stood at 0.0%, after 0.4% in 2014 (see Chart 10). Year-on-year, the HICP plunged in January 2015, falling by 0.6% owing to the steep drop in oil prices, before gradually climbing back up over the first half, boosted by the temporary rebound in energy prices. In the second half, euro area inflation settled at around 0.1-0.2%. Supercore inflation, which excludes food and energy, was steady in 2015 at an annual average of 0.8%, the same as in 2014.
The euro area’s weak headline inflation was largely due to the collapse in oil prices. The price of a barrel of Brent crude fell from
3 Provisional data, pending publication by the Banque de France in June of the 2015 annual report on the French balance of payments and international investment position.

MO
NET
ARY
POLI
CY A
ND
FIN
ANCI
AL S
TABI
LITY
24 BANQUE DE FRANCE – ECONOMIC REPORT 2015
C10 Harmonised index of consumer prices(year-on-year, %)
-1
0
1
2
3
5
1999 2001 2003 2005 2007 2009 2015
Total HICP, FranceHICP excluding energy and food, FranceTotal HICP, zone euroHICP excluding energy and food, euro area
4
2011 2013
Source: Eurostat.
EUR 74 on average in 2014 to EUR 47 in 2015. Energy prices plummeted as a result, giving up 6.8% in 2015 on an annual average basis, after falling 1.9% in 2014. Prices for agricultural commodities and metals also fell on average in 2015, accentuating the disinflationary pressures. By contrast, the euro’s depreciation against the dollar and the currencies of the euro area’s main trading partners (its effective exchange rate fell by 7.1% on an annual average basis) helped to support the prices of imports in euros. Accordingly, inflation in the prices of manufactured products, a significant portion of which is imported, increased slightly in 2015, rising by 0.3% in annual average terms, after 0.1% in 2014. Food prices also rose more sharply than in the previous year, putting on 1.0%, after a gain of 0.5% in 2014. Inflation in services was unchanged from 2014 at an annual average of 1.2%.
Inflation as measured by the HICP also diminished in France, coming out at an annual average 0.1%, after 0.6% in 2014. Supercore inflation decreased to 0.6% in 2015 from 1.0% in 2014. Year-on-year, consumer prices in France also fell sharply in January 2015 owing to the fall in oil prices, before rebounding
C11 Overall HICP, HICP excluding energy and food in France, oil price(year-on-year %, oil price in euro)
-0.50
0.00
0.50
1.50
Overall HICP (left-hand scale)HICP excluding energy and food (left-hand scale)Oil price (right-hand scale)
May Sep. Jan.2015
May Sep.
-0.25
0.25
0.75
Jan.2014
1.00
1.25
20
40
60
100
30
50
70
80
90
Sources: Eurostat and ECB.
somewhat during the first half. In December 2015, inflation stood at 0.3% year-on-year according to the HICP.
Mirroring the euro area situation, the decline in inflation in France was chiefly attributable to the fall in oil prices (see Chart 11), coupled with

25
MO
NET
ARY
POLI
CY A
ND
FIN
ANCI
AL S
TABI
LITY
Box 4Different inflation measures provide complementary insights
Inflation is defined as a general increase in the prices of goods and services, not merely in the prices of some products. If inflation is positive, one unit of currency – one euro, say – buys a smaller quantity of goods and services: the value of the currency decreases.
The most commonly used inflation measure is the consumer price index (CPI), which measures the prices of goods and services consumed by households. The index is constructed from a “basket” of products that are representative of the goods and services consumed by households over a given year.1 Each product in the basket has a price that may vary over time. The average increase in the price of the basket is calculated by assigning the different products weights that reflect their importance in total household spending. Each euro area country calculates a CPI covering approximately 700 goods and services based on its own accounting or statistical standards. For the purposes of harmonisation and cross-country comparison, each national statistics office in the euro area also produces a harmonised index of consumer prices based on common standards (HICP).2 The HICP inflation rate shows the change in the total price of the basket, typically from one year to the next or between a given month and the same month in the previous year.
The ECB is responsible for ensuring price stability over the medium term, stability being defined as a one-year increase in the HICP that is less than but close to 2% within the euro area. Since the price stability objective is a medium term goal, it is important not to confuse temporary movements in the HICP attributable to certain volatile components of the basket with a long-lasting change in the general price level. This is notably an issue with energy prices, which follow fluctuations in the oil price. A decline in oil prices automatically translates into a temporary fall in the inflation index. But a change in oil prices may reflect a change in relative prices – a barrel of oil trades against a smaller quantity of other goods and services – while not necessarily influencing the value of the currency.
For this reason, it is common practice to consider more restrictive measures of inflation, sometimes known as underlying inflation, as well. The overall HICP is divided into five sub-indices: energy, processed food, unprocessed food, industrial goods excluding energy, and services. The most widely used measure of core inflation, referred to as “supercore”3 inflation in the Eurosystem, excludes highly volatile energy and processed and unprocessed food components to consider only industrial goods excluding energy, and services. As Chart Ca shows for France, core inflation is less volatile than headline inflation and thus captures medium-term trends. Note however that variations in oil prices may also impact core inflation insofar as they feed into the prices of goods and services whose production requires oil. Moreover, when
1 Everyday products such as food, newspapers and petrol, durable goods such as apparel, computers and washing machines, and services such as hairdressing, insurance and rents.
2 For example, certain countries include imputed rents in the national index, which is not the case for France. Similarly, reimbursement of medicines is included in the HICP, such that non-reimbursement of certain medicines pushes the health component of the HICP up, whereas this measure has a neutral impact in the case of the French CPI.
3 Supercore HICP as contrasted with the core HICP, which is the HICP excluding energy and unprocessed food.

MO
NET
ARY
POLI
CY A
ND
FIN
ANCI
AL S
TABI
LITY
26 BANQUE DE FRANCE – ECONOMIC REPORT 2015
wages are highly sensitive to price changes, a transitional movement in oil prices may lead to a persistent movement in prices owing to the wage-price spiral.
Another measure of inflation is provided by the value added deflator, which captures the prices of all goods and services produced within the national territory. This offers a measure of domestic inflation, whereas the HICP, even in its core form, measures the prices of all goods and services purchased by consumers in France, including imported goods and services. Accordingly, the value added deflator may deviate from the CPI, notably depending on changes in the volumes and prices of imports, exports and investment. Chart Ca shows how inflation tracked by the market value added deflator has been rising since early 2014, even if it remains moderate in contrast with the HICP and core inflation, with the difference stemming partly from the prices of imported goods.
An important question for the conduct of monetary policy is to determine the respective contributions made by imported goods prices and slower domestic economic conditions to the weak level of inflation over the last three years. According to our estimates for France,4 a 1 pp reduction in the output gap, i.e. the difference between actual and potential gross domestic product (GDP), will lead in the medium term to a 0.3 pp reduction in inflation. This coefficient is fairly stable over time even though changes in the output gap seem to be transmitted more swiftly to inflation than they were a few years ago. The statistical decomposition of inflation (Chart Cb) reveals that weak import prices accounted for approximately two-thirds of the low inflation level and the output gap for one-third during the four quarters of 2015.
4 For more information about methodology, see Chatelais (N.), De Gaye (A.) and Kalantzis (Y.) (2015): “Low inflation in the euro area: import prices and domestic slack”, Rue de la Banque No. 6, May. https://www.banque-france.fr/uploads/tx_bdfgrandesdates/RDB_06-en.pdf
Ca Measures of inflation, France(% year-on-year)
-1
0
1
2
3
4
Q11999
Q12001
Q12003
Q12005
Q12007
Q12009
Q12015
HICPSupercore HICPMarket value added deflator
Q12011
Q12013
Sources: Eurostat and Banque de France calculations.
Cb Contributions to inflation, France(HICP: % year-on-year, deviation from mean)
HICP
-3
-2
-1
0
1
2
Q12007
Q12008
Q12009
Q12010
Q12011
Q12012
Q12013
Q12014
Q12015
Contribution from output gapContribution from import pricesContribution from initial conditionsResidual contribution
Sources: Eurostat and Banque de France calculations.
27
MO
NET
ARY
POLI
CY A
ND
FIN
ANCI
AL S
TABI
LITY
flat import prices and below-potential production levels (see Box 4 on inflation measures). Following the steep decline in the price of a barrel of crude, energy prices receded by 4.5% in annual average terms in 2015. Moreover, the decline in energy prices fed into other components of the price index by dragging down the prices of hydrocarbon-heavy goods and services and by cutting costs all the way along the production and distribution chain. The prices of manufactured products also contributed negatively to inflation in France in 2015, notably owing to the decline in production prices, which fell by 2.2% in annual average terms. In addition, the decrease in pharmaceutical product prices, because of measures included in the Social Security Financing Act and the rise of generics, also exerted downward pressure on the prices of manufactured products. Inflation in manufactured product prices ultimately came out at –0.3% on an annual average basis in 2015, after –0.4% in 2014. Service prices also slowed sharply in 2015 in France, rising by just 1.2% in annual average terms, compared with 1.8% in 2014, principally because of the fall in transport prices and muted growth in rents, which are partially inflation-linked, but also because of high
4 The scope of the CPI is slightly different from that of the HICP: the CPI tracks gross prices, while the HICP follows prices net of government reimbursements.
unemployment and lower ULC. By contrast, prices for food products picked up by 0.4%, compared with a rise of 0.1% in 2014.
Inflation as measured by the CPI, which differs slightly from the HICP,4 averaged 0.0% on in 2015, after 0.5% in 2014. The gap between the two measures narrowed.
In the end, inflation in 2015 turned out, both in France and in the euro area, to be quite a bit lower than what the ECB had forecast in the exercise conducted at the end of 2014 (annual average of 0.0% for the euro area, compared with a forecast of 0.7%), largely owing to the unexpected decline in commodity prices. Inflation excluding food and
energy was just a little lower than forecast, at 0.8% instead of 1.0%. These developments were taken into account in the monetary policy response (see Chapter 3, section on “A responsive, multi-faceted monetary policy”).
Nominal wage growth slowed somewhat in 2015 in the low inflation setting. Growth in the basic monthly wage fell from 1.4% in 2014 to 1.3%. In addition, the ramp-up of the CICE tax credit and implementation from 1 January 2015 of the first round of reductions in social security contributions under
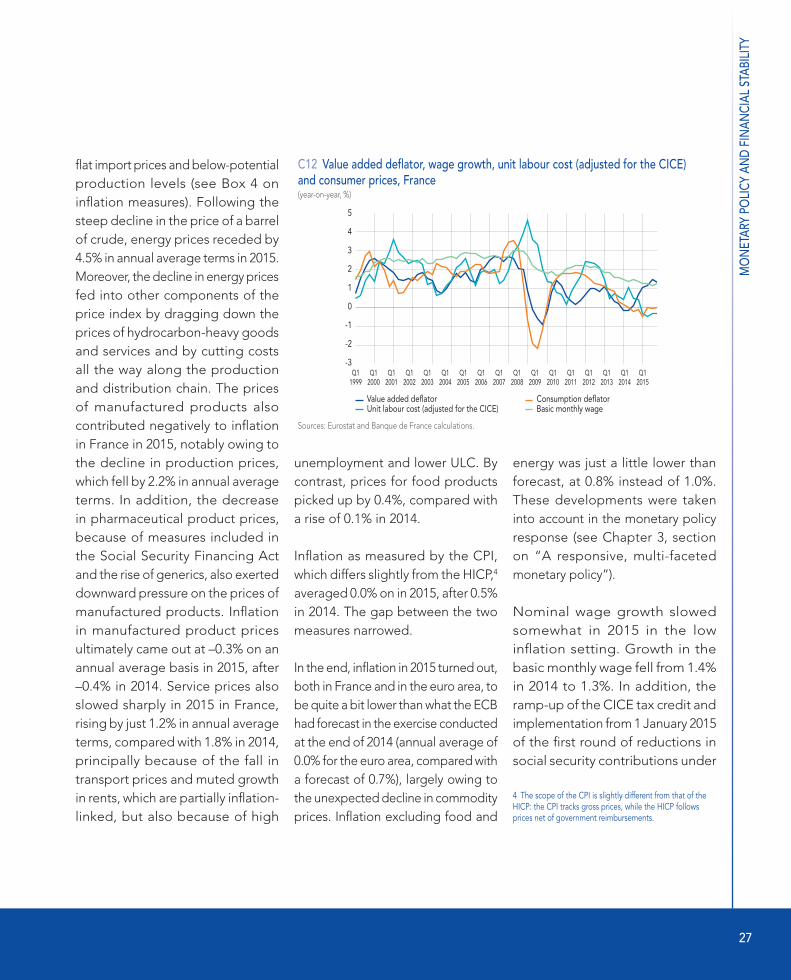
C12 Value added deflator, wage growth, unit labour cost (adjusted for the CICE) and consumer prices, France(year-on-year, %)
-3
-1
1
5
Value added deflatorUnit labour cost (adjusted for the CICE)
Consumption deflator
Q12000
Q12001
Q12002
Q12003
Q12004
Q12005
Q12006
Q12007
Q12008
Q12009
Q12010
Q12011
Q12012
Q12013
Q12014
Q12015
-2
0
2
Q11999
3
4
Basic monthly wage
Sources: Eurostat and Banque de France calculations.

MO
NET
ARY
POLI
CY A
ND
FIN
ANCI
AL S
TABI
LITY
28 BANQUE DE FRANCE – ECONOMIC REPORT 2015
the Responsibility and Solidarity Pact (PRS) slowed the increase in labour costs. Factoring in the CICE and the PRS, unit labour costs fell by an annual average of 0.3% in 2015, after increasing by 0.6% in 2014. In this setting, the increase in the price of value added in the private sector (1.3% in annual average terms, after 0.1% growth in 2014), translated into increased business profit margins. The strong growth in the value added deflator relative to consumer prices led to a fairly unique combination of increased
T2 Monetary aggregates, euro area and France, 2013-2014-2015(outstandings in EUR billions; % growth rate; seasonally adjusted data)
Euro area a) France c)
Outstandings Annual growth rate b) Outstandings Annual growth rate b)
Monetary aggregates (s.a. data) or main monetary assetsc) 2015 2013 2014 2015 2015 2013 2014 2015+ Currency in circulation 1,034 5.3 6.4 6.7+ Overnight deposits 5,570 5.9 8.4 11.6 752 3.4 8.6 14.8= M1 6,604 5.8 8.1 10.8 752 3.4 8.6 14.8+ Other money market deposits 3,608 -1.8 -2.3 -3.5 745 1.5 -0.5 -0.4
o/w: deposits redeemable at notice of up to 3 months 2,161 2.2 0.1 0.6 607 2.2 -1.5 -1.3o/w: deposits with an agreed maturity of up to 2 years 1,447 -6.4 -5.4 -9.0 139 -1.1 3.6 4.0
= M2 10,212 2.5 3.8 5.3 1,498 2.3 3.5 6.7+ Marketable instruments 627 -16.1 4.0 -3.8 337 -14.7 -0.3 -2.0
o/w: money market fund shares/units 479 -10.4 2.6 11.5 254 -13.2 -5.9 3.8o/w: repos 77 -9.2 0.8 -38.2 21 -0.7 -4.6 -28.0o/w: debt securities issued with a maturity of up to 2 years 71 -38.0 18.7 -26.2 61 -24.3 30.0 -11.6
= M3 10,840 1.0 3.8 4.7 1,834 -1.7 2.8 5.0+ Gross monetary liabilities vis-à-vis the rest of the euro area 156 18.6 8.7 -14.8– Gross monetary assets vis-à-vis the rest of the euro area 40 -23.0 -10.0 -7.6French component of euro area M3d) 1,950 0.8 3.6 3.3
a) Transactions of euro area monetary financial institutions (MFIs) with other euro area residents.b) Changes adjusted for reclassifications and other valuations.c) Transactions of resident MFIs with other French residents.d) French resident MFI liabilities maturing in less than two years (excl. currency in circulation) towards the euro area money-holding sector (euro area residents excl. MFIs, central government and CCP) and, by extension, the deposits held by this sector with central government.Sources: Banque de France, ECB.
purchasing power for wage earners and improved business profit margins (see Chart 12).
Monetary and financial developments: moderate change in monetary aggregates
The euro area’s M3 monetary aggregate grew by an annual average of 4.7% in 2015, after 3.8% in 2014 and 1.0% in 2013 (see Table 2). Growth in the
French component of euro area M3 slowed to 3.3% in 2015, from 3.6% in 2014 and 0.8% in 2013. Growth in overnight deposits accelerated in the euro area to 11.6% in 2015, after 8.4% in 2014, as rock-bottom interest rates lowered the opportunity cost of holding these deposits. By contrast, other money market deposits contracted more swiftly, shrinking by 3.5% after a decline of 2.3%, while marketable instruments were down 3.8%, after a 4.0% increase in 2014 and a steep 16.1% decline in 2013.

29
MO
NET
ARY
POLI
CY A
ND
FIN
ANCI
AL S
TABI
LITY
As in the euro area, growth in the French contribution to M3 in 2015 was chiefly driven by overnight deposits, which were up 14.8%, after 8.6% growth in 2014, while total outstandings in passbook savings accounts (included under deposits redeemable at notice of up to three months in European statistics) shrank at a slightly slower rate of 1.3%, after falling 1.5% the previous year. Outstanding money market fund shares/units in France began increasing again, with growth of 3.8%, after a 5.9% decline in 2014.
Credit distribution was brisker in France than in other large euro area countries.
The annual growth rate of loans to non-financial corporations (NFCs) was 4.2% on average in 2015, after 2.3% in 2014 (see Chart 13). The increase concerned cash loans and investment loans, which together account for 92% of lending to French NFCs. Growth in cash loans picked up sharply, rising from 2.3% on average in 2014 to 6.6% in 2015. Meanwhile, growth in investment loans increased to 3.1%, after 2.6% previously. This set France apart from the other main euro area economies, which reported lower growth rates in NFC lending. Lending contracted slightly once
again in Italy (–0.6%, after –2.6% at end-2014) and in Spain (–1.1%, after –6.4%). In Germany, the annual growth rate of NFC loans returned to positive territory in July 2015 and reached 0.8% over 2015 as a whole.
The growth rate of outstanding debt securities issued by French NFCs fell sharply to 3.9% in June 2015, after 10.0% in 2014 and 4.3% in 2013, although the 2014 figure does include a large one-off issue. Market financing
C13 Annual growth rate of lending to NFCs, corrected for securitisation, France(%)
-8
-4
0
10
Loans to NFCs Investment loans Cash loans
Mar.2012
June
-6
-2
2
Dec.2011
4
6
8
Sep. Mar.2013
JuneDec. Sep. Mar.2014
JuneDec. Sep. Mar.2015
JuneDec. Sep. Dec.
Source: Banque de France.
C14 Annual growth rate of NFC debt by instrument, France(%)
-2
2
6
16
Securities Loans Total
0
4
8
10
12
14
Mar.2012
JuneDec.2011
Sep. Mar.2013
JuneDec. Sep. Mar.2014
JuneDec. Sep. Mar.2015
JuneDec. Sep. Dec.
Sources: Banque de France, ECB.

MO
NET
ARY
POLI
CY A
ND
FIN
ANCI
AL S
TABI
LITY
30 BANQUE DE FRANCE – ECONOMIC REPORT 2015
continued to expand at more or less the same pace as bank lending in the second half of 2015, with 4.2% growth for loans at end-2015, and 5.1% for securities. All in all, French NFC debt continued to grow at a sustained pace, increasing by 4.5% in December 2015 after a rise of 5.1% in 2014 (see Chart 14).
The growth rate of lending to households rose in France to 3.8% at end-2015, after 2.2% at end-2014, driven by a bigger increase in home loans in 2015 (4.0% compared with 2.2% at end-2014) and in consumer loans (4.1% growth, up from 2.2%) (see Chart 15). As in past years, France
C15 Annual growth in French household lending(%)
-4
0
8
Home Consumer Total
-2
2
4
6
Mar.2012
JuneDec.2011
Sep. Mar.2013
JuneDec. Sep. Mar.2014
JuneDec. Sep. Mar.2015
JuneDec. Sep. Dec.
Source: Banque de France, ECB.
led the major euro area economies in loans to households, with Germany and Italy reporting smaller rates of
increase (2.8% and 0.8% respectively), while lending continued to contract in Spain (by 2.2%).
Box 5
Financial behaviour of French households: some changes, some consistency in a low interest rate environment
Total financial investment flows by French households came to EUR 104 billion in 2015, sharply up from the EUR 75 billion recorded in 2014. By end-2015, households’ main investments stood at EUR 4.460 trillion.
Amounts placed in overnight deposits and bank investments in the shape of home savings plans continued to increase, while net investments in life insurance contracts remained at a high level, sustained notably by favourable tax treatment. At a time of high macroeconomic and financial uncertainty, households continued to prefer non-unit linked contracts, which accounted for 80% of gross annual flows, although this was nonetheless down on 2014 when they accounted for 85%.
Conversely, households took more money out of savings invested in passbooks and time deposit accounts as the decline in short-term interest rates and, to a lesser extent, the reduced rate paid on Livret A passbooks,1 lowered the opportunity
1 On 1 August 2015, the rate of interest paid on Livret A passbooks was cut to 0.75% from 1% previously.

31
MO
NET
ARY
POLI
CY A
ND
FIN
ANCI
AL S
TABI
LITY
costs of holding cash and overnight deposits, which attracted substantial inflows totalling EUR 38.4 billion in 2015, up from EUR 22.4 billion in 2014. In addition, the high return on home savings plans, despite a half-point decline in February 2015 for new contracts, encouraged more people to switch into these products.2 Meanwhile, French households continued to sell off debt securities, although at a slower rate than in 2014, offloading EUR 3.3 billion in 2015, after EUR 10.5 billion in 2014. In contrast, and unlike in previous years, they started buying CIS securities again, purchasing EUR 3.1 billion, after selling EUR 4.9 billion in 2014 and EUR 8.4 billion in 2013.
Households stepped up their use of debt, following a small decrease in 2014, with net flows of new debt jumping in 2015 to EUR 35.0 billion from EUR 21.5 billion in 2014. Home loans increased sharply in connection with the upturn in deals in the existing homes segment, which rose by 15.7% after contracting by 3.4% in 2014. This recovery is being supported by the low interest rate environment and the slight downturn in prices. At end-2015, total outstanding household debt came to EUR 1.236 trillion.
The household financial saving rate, which corresponds to household gross savings (gross disposable income less final consumer spending) less GFCG – essentially home investments – and other material capital transactions, climbed in 2015 from 6.0% in 2014 to 6.6% in 2015, as the upturn in financial investment flows was accompanied by a slightly smaller increase in household debt.
Ta Financial investments of French households(annual flows in EUR billions unless otherwise specified)
2013 2014 2015Financial investments 73.2 75.0 103.7Overnight deposits and cash 20.9 22.4 38.4Bank investments 11.7 4.3 6.9Livret A, Livret Bleu and LDD passbooks 24.6 -2.5 -8.3Taxable passbooks -10.5 -2.9 0.7Other passbooks -5.2 -4.1 -2.0Home savings plans 9.5 18.2 24.0Time deposit accounts and popular savings plans
-6.7
-4.4
-7.5
Securities 1.7 -1.7 9.4Debt securities -6.5 -10.5 -3.3Listed equities -6.8 5.5 1.4Unlisted equities and other equity interests 23.4 8.2 8.2CIS securities -8.4 -4.9 3.1Life insurance contracts 38.9 50.0 49.0
Debt 22.9 21.5 35.0Source: Banque de France.
2 Additionally, on 1 February 2016, the rate of interest paid on new home savings plans was cut by half a point to 1.5%.

MO
NET
ARY
POLI
CY A
ND
FIN
ANCI
AL S
TABI
LITY
32 BANQUE DE FRANCE – ECONOMIC REPORT 2015
The Eurosystem's response in terms of monetary policy and financial stability
A responsive, multi-faceted monetary policy
There were substantial risks of recession and a prolonged period of low inflation in late 2014. Most indicators of actual or expected inflation were heading downwards under the combined effect of the ongoing slide in oil prices, possible second-round effects on wage formation and economic slack in the euro area.
These developments in actual and expected inflation had the potential to further undermine the already unsupportive economic conditions. Overly low current inflation pushes up the real debt burden for borrowers, while low expected inflation increases, ceteris paribus, the real return on savings products, lessening the incentives for consumption and investment. Moreover, owing to the downside rigidity of nominal wages, labour market adjustments entail more job losses during times of low inflation, because real wages cannot
3always adjust enough. In addition to these negative short and medium-term effects, the lack of a response by the euro area’s monetary authorities could have posed a serious threat to the credibility of the long-term price stability objective and, hence, to the anchoring of private sector inflation expectations.
Accordingly, the ECB reaffirmed its forward guidance. The Governing Council introduced a guidance strategy in July 2013, as it committed itself to keeping policy rates very low for a prolonged period. This type of policy seeks to shape expectations on future policy rates and thus enables a central bank to influence the yield curve even when rates are as low as they can go. Moreover, by undertaking to maintain an accommodative stance for a prolonged period, the central bank encourages medium and long-term ex ante real interest rates to come down. The decline in real rates supports aggregate demand and ultimately should make it possible to reach a trajectory for actual inflation that is consistent with the price stability mandate.
In January 2015, the Governing Council also decided to extend the asset purchase programme introduced in 2014. The original programme, which was intended to improve the transmission of monetary policy by further easing credit conditions in the real economy, concentrated on covered bonds and asset-backed securities.5 The expanded asset purchase programme (EAPP) was opened up to include the sovereign bonds of euro area Member States and securities issued in euro by euro area public agencies and European institutions.6 As detailed in Box 6, the additional quantitative easing measures helped to support activity and prices by lowering long yields, i.e. the external financing cost of companies and households, and, given the movement of the euro, by supporting the prices of imported goods and exports.
5 At end-2015, outstanding transactions carried out under the CBPP3 and ABSPP programmes totalled EUR 143.8 billion and EUR 15.3 billion respectively.
6 European Stability Mechanism (ESM), European Financial Stability Facility (EFSF), European Investment Bank (EIB) for example.

33
MO
NET
ARY
POLI
CY A
ND
FIN
ANCI
AL S
TABI
LITY
Box 6
The Expanded Asset Purchase Programme (EAPP) has had a positive impact on growth and inflation
An asset purchase programme lowers the financing costs of economic agents (i.e. long-term real interest rates) and thus supports inflation and economic activity. Several mechanisms play a part in driving long-term real interest rates downwards.
• Fall in yields on eligible securities. Securities purchases by the central bank lower the yields on directly targeted assets by contributing to a reduction in the net supply of these assets available on the market.
• Decline in yields on other asset classes and bank rates through portfolio reallocations. Purchases of low-risk securities from investors or banks encourage these agents to reinvest the sales proceeds in other financial asset classes, such as corporate bonds, bank bonds or equities. Demand for these other assets increases and consequently so does their price, which is equivalent to a decline in their yield. Higher prices for bank bonds and equities lower refinancing costs, allowing these institutions to offer loans to businesses and households at more attractive rates, which maintains capital spending and consumption.
• Strengthened forward guidance. Purchasing low or very low-yielding long-term assets exposes the central bank to opportunity cost and thus enhances the credibility of the central bank’s commitment not to raise interest rates in the future.
• Indirect effect on the exchange rate. Some of the savings invested in securities purchased by the central bank will be moved into foreign securities. Securities purchases therefore increase demand for foreign currencies (dollar or Swiss franc in the case of the euro area). The resulting currency depreciation may boost exports. Moreover, euro depreciation has a direct impact on inflation through the prices of imported goods and services.
The euro area’s EAPP has had significant impacts. Interest rates started decreasing regularly across the board as soon as the programme was expected in summer 2014, which bolstered the impact of other monetary policy measures taken in June 20141 (see Chart Ca).
Yields on euro area ten-year government bonds decreased by approximately 150 basis points (bps) on average between June 2014 and the start of March 2015 (see Chart Ca), pulling down in their wake interest rates on the borrowings of financial institutions, companies and households. Yields on bank bonds in particular fell by 75 bps on average between
1 Deposit facility rate cut to –0.1% and targeted long-term refinancing operations (TLTROs) launched.

MO
NET
ARY
POLI
CY A
ND
FIN
ANCI
AL S
TABI
LITY
34 BANQUE DE FRANCE – ECONOMIC REPORT 2015
early June 2014 and March 2015.2 A significant portion of these declines was attributable to credit easing measures and the announcement of the asset purchase programme.
Improved financial market conditions were also passed on by the banking system to the real economy. Composite lending rates for non-financial companies in the euro area fell by 70 bps between mid-2014 and end-2015 (see Chart Ca/Bank lending rates). Moreover, it appears that financing conditions improved not only for large caps but also for small and medium-sized companies. Euro area banks additionally reported that business lending terms eased significantly in the fourth quarter of 2015. According to the Bank Lending Survey (BLS) published by the ECB, the generally low level of interest rates contributed to increased demand for loans at end-2015.3
The improved financing conditions had a positive impact on the macroeconomic situation. According to Eurosystem estimates, the measures taken in January 2015 will contribute one percentage point to cumulative real GDP growth in the euro area between 2015 and 2017 (see Chart Cb/GDP growth). Without these measures, forecast inflation would be at least half a point lower in 2016 and one-quarter or one-third of a point lower in 2017 (see Chart Cb/Inflation).
Ca Euro area interest rates(%)
Ten-year sovereign yields Composite bank lending rates for NFCs
0.0
0.5
1.0
1.5
2.0
4.0
Jan.2014
Mar. May
2.5
3.5
August 2014Mario Draghi’s speech
at Jackson Hole
January 2015Programmeannounced
3.0
Sep.July Nov. Jan.2015
Mar. May Sep.July Nov. Jan.2016
2.0
4.0
Jan.2014
Mar. May
2.5
3.5
August 2014Mario Draghi’ speech
at Jackson Hole
January 2015Programmeannounced
3.0
Sep.July Nov. Jan.2015
Mar. May Sep.July Nov. Jan.2016
France Germany Italy Spain Euro area
Note: Ten-year sovereign yields; rate on outstanding bank loans to NFCs.Source: Datastream.
2 Start-up of asset purchase programme.
3 January 2016 BLS published by the ECB. The net balance of banks reporting increased loan demand compared with those reporting decreased demand was 27% in the fourth quarter of 2015, compared with 16% in the previous quarter.

35
MO
NET
ARY
POLI
CY A
ND
FIN
ANCI
AL S
TABI
LITY
Specifically, it was decided under the EAPP to buy public and private sector securities in the amount of EUR 60 billion every month over a period running until September 2016, and in any event at least until a sustainable adjustment was obtained in the path of inflation consistent with the medium-term objective (inflation below but close to 2%). The EAPP was extended in December 2015 by six months to run until end-March 2017 at least. The Eurosystem also said that principal payments on maturing securities would be reinvested for as long as necessary to maintain excess liquidity at a sufficiently high level. At end-2015, outstanding securities purchased by the Eurosystem under the public sector purchasing programme
(PSPP) totalled EUR 433 billion for sovereign bonds and EUR 60 billion for supranational securities respectively.
Technically, the Eurosystem determined the scope of securities that could be purchased by setting the maximum holding at 33% of each issue and restricting purchases to securities whose yields were above the deposit facility rate. Additional eligibility criteria apply to securities issued by countries covered by an EU/IMF assistance programme. The Eurosystem also set up mechanisms to prevent any strain resulting from a shortage of available securities on the markets, including securities lending facilities for market participants. In accordance
with the principle of decentralisation, and as with all monetary policy operations, the EAPP is essentially implemented by the national central banks (NCBs). While the ECB buys sovereign securities from all Member States, plus securities issued by public agencies, up to a maximum of 8% of the programme, the NCBs conduct the rest of the programme covering sovereign and supranational securities, as well as regional and local public securities (to which the programme was extended in December 2015).
Aside from its role as an asset manager within the framework of the ABSPP, which it performs by carrying out ABS purchases on behalf of the Eurosystem, the
Cb GDP growth and inflation in the euro area (Eurosystem projections, December 2015)(% year-on-year)
GDP growth Inflation (HICP)
-6
-4
-3
-2
-1
3
2008 2009 2010
0
2
1
20122011 2013 2014 2015 2016 2017
-5
-1
1
2
3
4
5
2008 2009 2010 20122011 2013 2014 2015 2016 2017
0
Actual and forecast year-on-year changes Average forecast over the year Average forecast over the year excluding January 2015 measures
Sources: Eurostat, Eurosystem forecasts and calculations.

MO
NET
ARY
POLI
CY A
ND
FIN
ANCI
AL S
TABI
LITY
36 BANQUE DE FRANCE – ECONOMIC REPORT 2015
Banque de France is closely involved in implementing the EAPP, first by buying a portion of the sovereign and supranational securities directly on the secondary market, and also by managing the lending facility for securities purchased within the framework of the PSPP. Along with De Nederlandsche Bank and Lietuvos Bankas, the central banks of the Netherlands and Lithuania respectively, the Banque de France also helped to set up a reverse auction system for securities of supranational issuers to boost the Eurosystem’s purchasing capabilities. Now that the system has been fully approved, the Banque de France will continue to conduct these reverse auctions on behalf of the Eurosystem.
Unfavourable economic developments over 2015 made it necessary to recalibrate the ECB’s action to support highly accommodative refinancing conditions suited to the macroeconomic environment, as the small rebound in euro area activity and oil price developments lowered the medium-term inflation outlook once again. Euro area HICP projections produced by the Eurosystem in December 2015 were cut relative to those of September 2015 and reached levels that were judged too low based on the quantitative criterion of price
stability (inflation close to but below 2%). For this reason, the Governing Council decided in December 2015 to recalibrate its monetary policy measures. In addition to the purchase programme measures mentioned above, the interest rate on the deposit facility was lowered by 10 bps to –0.30%, anchoring it firmly in negative territory (see also Box 7), while the interest rate on the main refinancing operations (MROs) was held at the very low level of 0.05% and that of the marginal lending facility remained at 0.30%. The ECB also decided to keep fixed-rate full allotment procedures for MROs and longer-term refinancing operations (LTROs) for as long as necessary and at least until mid-2017. Additionally, as in 2014, monetary policy counterparties benefitted in 2015 from ongoing acceptance of a broad range of assets as collateral for Eurosystem refinancing operations. This will continue at least until September 2018, i.e. when targeted long term refinancing operations (TLTROs) mature.
Furthermore, the TLTROs, which supplement conventional monetary policy measures, i.e. LTROs, continued over the course of 2015. First launched in September 2014 and maturing in September 2018, these operations are intended to
stimulate the distribution of credit to economic agents (lending to NFCs and households excluding home loans). To make these operations more appealing, the Eurosystem eliminated their 10 bps spread over MROs in 2015. Total outstanding loans granted under the four operations carried out in 2015 amounted to EUR 205 billion, on top of the EUR 212 billion already allocated in 2014 to euro area credit institutions during the first two TLTROs. With outstandings of EUR 417 billion, TLTROs accounted by end-2015 for around three-quarters of total outstanding Eurosystem refinancing provided through all credit operations (EUR 559 billion).
All the measures taken mutually strengthen each other to ease financing conditions for the economy and hence to support economic activity and inflation in the euro area. On the one hand, the reduction in the deposit facility rate (very short-term rate) lowers the level of the yield curve, because all rates at longer horizons depend on current short rates. Meanwhile, the forward guidance strategy and quantitative easing measures help to flatten the yield curve. Finally, at given levels of current and expected short rates, asset

37
MO
NET
ARY
POLI
CY A
ND
FIN
ANCI
AL S
TABI
LITY
purchases compress risk premiums and lower all rates out to the most distant maturities. Accordingly, in 2015 the ECB Governing Council demonstrated its commitment to implement a broad range of tools to adjust the stance of its monetary policy as a function of economic conditions, in response to the threat of a protracted period of low inflation.
However, while monetary policy can do and has done a lot, it cannot
do everything. Other economic policies also have a major part to play. The mandate entrusted to monetary policy is to guarantee price stability, which supports activity, but is not enough to ensure long-term prosperity. To reap the full benefits of the Eurosystem’s monetary policy measures, other aspects of economic policy must also be brought to bear to support the euro area’s potential growth. Fiscal policies are important in ensuring sustainable
growth. Moreover, structural reforms, notably on the labour market, make a crucial contribution in helping the euro area economy to get back to its full potential by promoting job and business creation (see Chapter 4). The highly accommodative nature of monetary policy must under no circumstances be seen as a reason to delay the necessary reforms. On the contrary, this short-term support for economic activity should facilitate implementation of these reforms.
Box 7
Negative interest rates: mechanisms and consequences for market participants
Background
Effectively implemented in June 2014, the application of negative interest rates to the deposit facility is one of the measures adopted by the Eurosystem, alongside forward guidance, securities purchase programmes and TLTROs, as part of efforts to ease monetary policy and stave off deflationary risks. The actions by the Eurosystem take place at a time when other central banks, including those of Switzerland, Sweden, Denmark and Japan, have also opted to apply negative interest rate policies.
Implementation
The Eurosystem phased in negative rates for the deposit facility (see Chart Ca), initially cutting the rate to –0.10% in June 2014. At its meeting on 4 September 2014, the ECB Governing Council then decided to lower the rate by a further 10 basis points to –0.20%, before reducing it to –0.30% on 3 December 2015.
Expected effects
The negative rate applied to the deposit facility is one of the ways used by the Eurosystem to fulfil its mandate of keeping inflation below but close to 2%.
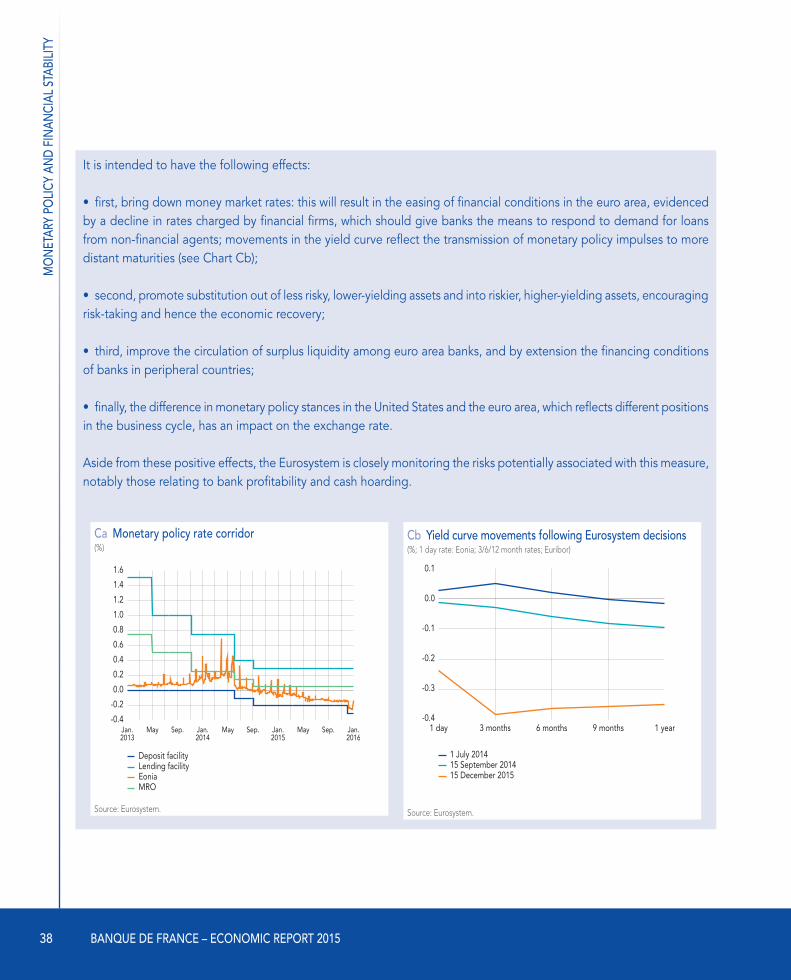
MO
NET
ARY
POLI
CY A
ND
FIN
ANCI
AL S
TABI
LITY
38 BANQUE DE FRANCE – ECONOMIC REPORT 2015
It is intended to have the following effects:
• first, bring down money market rates: this will result in the easing of financial conditions in the euro area, evidenced by a decline in rates charged by financial firms, which should give banks the means to respond to demand for loans from non-financial agents; movements in the yield curve reflect the transmission of monetary policy impulses to more distant maturities (see Chart Cb);
• second, promote substitution out of less risky, lower-yielding assets and into riskier, higher-yielding assets, encouraging risk-taking and hence the economic recovery;
• third, improve the circulation of surplus liquidity among euro area banks, and by extension the financing conditions of banks in peripheral countries;
• finally, the difference in monetary policy stances in the United States and the euro area, which reflects different positions in the business cycle, has an impact on the exchange rate.
Aside from these positive effects, the Eurosystem is closely monitoring the risks potentially associated with this measure, notably those relating to bank profitability and cash hoarding.
Ca Monetary policy rate corridor(%)
-0.4
-0.2
0.0
0.2
0.4
1.6
Jan.2013
May Sep.
Deposit facilityLending facilityEoniaMRO
0.6
1.2
0.8
1.4
1.0
Jan.2014
May Sep. Jan.2015
May Sep. Jan.2016
Source: Eurosystem.
Cb Yield curve movements following Eurosystem decisions(%; 1 day rate: Eonia; 3/6/12 month rates; Euribor)
-0.4
-0.3
-0.2
-0.1
0.0
0.1
1 day 3 months
1 July 201415 September 201415 December 2015
6 months 9 months 1 year
Source: Eurosystem.

39
MO
NET
ARY
POLI
CY A
ND
FIN
ANCI
AL S
TABI
LITY
Measures to ensure financial stability, which also play an important role in promoting sustainable growth, particularly in a low interest rate environment
Prudential supervision: risk monitoring that safeguards financing for the economy
In banking, 2015 marked the first anniversary of the Single Supervisory Mechanism (SSM), which introduced an ECB-led system of harmonised prudential supervision. France’s ACPR is a fully-fledged component of this mechanism, as are the supervisory authorities of other euro area members. The ACPR adjusted its organisation to contribute effectively to the new procedures for supervision of major euro area banks by the joint supervisory teams (JSTs). In a macroeconomic and monetary setting that continued to present many challenges, the ACPR kept a close watch on the risks to the solvency, liquidity and income, i.e. source of future solvency, of French banks.
The ACPR also contributed to the implementation of the new prudential requirements set down by CRR/CRD IV. As part of this, the ACPR named six “other (national) systemically important institutions”7
in 2015 and established the capital buffer rate applicable to them based on their relative systemic importance.8 Meanwhile, French banks continued to progress towards full application of the new solvency and liquidity standards. Banks are also readying themselves for the entry into force of IFRS 99 and the new ratios defined under resolution requirements (MREL, TLAC).10 So far, these major adjustment measures have not prevented French banks from continuing to perform their primary function of financing the economy, as shown, for example, by the continued growth in lending to NFCs at end-2015 (see below, Box 8).
In the insurance sector, the ACPR continued to actively monitor entities’ preparations for the entry into force of Solvency II, notably by repeating a preparatory exercise to gather the information required under the future regime. In this setting, it asked a sample of entities, as part of the Own Risk and Solvency Assessment (ORSA), to measure the impact of the low interest rate environment on
their situation. They will be required to conduct this assessment annually under the new regime. Also in 2015, the ACPR reviewed numerous approval applications from entities, especially for internal models (or requests to use transitional measures, for example). Furthermore, the ACPR paid special attention to adjustments by entities to their business models to accommodate changes in the economic and regulatory environment, such as the entry into effect of the nationwide interprofessional agreement (ANI)11 on extending supplementary health insurance to private sector employees.
In the area of stress testing, the ACPR was involved in 2015 in preparing the exercises organised by the European Banking Authority (EBA) and the European Insurance and Occupational Pensions Authority (EIOPA), which
7 As contrasted with global systemically important institutions identified based on the methodology drawn up by the Financial Stability Board (FSB).
8 For more details, see the list and methodology published on 30 December 2015 in the ACPR’s official register (http://acpr.banque-france.fr/publications/registre-officiel.html).
9 IFRS 9 redefines the models for calculating impairment by overhauling the classification and valuation of financial assets.
10 Minimum requirement for own funds and eligible liabilities for bail in (MREL) and total loss-absorbing capacity (TLAC).
11 A nationwide interprofessional agreement (ANI) was signed on 11 January 2013. The new agreement’s first article provides for the introduction of mandatory company health coverage from 1 January 2016.

MO
NET
ARY
POLI
CY A
ND
FIN
ANCI
AL S
TABI
LITY
40 BANQUE DE FRANCE – ECONOMIC REPORT 2015
will be conducted in 2016. At the same time, the ACPR continued to develop and use its own stress tests12 to refine its analysis of the strengths and vulnerabilities of France’s banking and insurance systems, and identify the consequences in terms of supervisory priorities.
Finally, against the backdrop of two terrorist attacks in France, the ACPR stepped up its supervision of systems to prevent money laundering and terrorist financing, imposing sanctions in several cases.
Financial stability: macroprudential bodies play a more prominent role, particularly in a low interest rate environment
The low interest rate environment acts as a drag on the profitability of banks by reducing their net interest margin and potentially increasing risk-taking, as banks may have an incentive to offset the income decline by boosting volumes, indiscriminately relaxing lending (or renewal) terms and/or seeking without due care to obtain higher returns through exposure to riskier and potentially less liquid assets. Banks also face increased demand to renegotiate
loans in this kind of setting. This type of demand was very high in 2015. In the short term, banks receive penalty payments, which lifts their profitability, but renegotiations have an adverse impact on profits further out. Very low interest rates may also prompt households and businesses to put off debt reduction efforts, making them more vulnerable to future interest rate or income shocks, which could negatively affect banks. In 2015, French banks responded to this environment by adjusting their strategies as they looked for new sources of income (charging for current accounts, strengthening high value added business areas), disposed of non-strategic businesses, cut costs, trimmed headcount and invested in digital technologies.
The low interest rate environment also hurts insurers, particularly life insurers, owing to their long-term commitments. Although life insurers were able to maintain their profitability in 2015, their interest margin remains under pressure because of their guaranteed commitments, even if these are limited on the whole, and the competitive environment, which has forced them to reset overly high contract revaluation rates (belated recognition of the decline in the rate of return on their bond investments).
Asset managers may be affected by the low interest rate environment too. In 2015, there was moderate risk-taking by investors (as funds flowed out of bond and equity funds and into balanced funds) and increased diversification among fund portfolios, notably through exposure to non-euro area residents.
This environment warrants closer supervision of developing systemic risk, with a view to ensuring the stability of the financial system. Accordingly, macroprudential bodies need to step up their role. To this end, they now have new instruments that capture interactions between financial institutions and ensure their resilience, as well as tools to help smooth out financial cycles, whose reversals can have serious repercussions for the real economy.
From an institutional perspective, the Haut conseil de stabilité financière (HCSF – High Council for Financial Stability) is France’s macroprudential authority. It was established by the Act of July 2013 on the Separation and Regulation of Banking Activities to take over from
12 The models developed by the ACPR gave rise in 2015 to a publication in the Débats économiques et financiers collection (https://acpr.banque-france.fr/etudes/debats-economiques-et-financiers.html).

41
MO
NET
ARY
POLI
CY A
ND
FIN
ANCI
AL S
TABI
LITY
the Conseil de régulation financière et du risque systémique (COREFRIS – Council for Financial Regulation and Systemic Risk). In addition to wielding extensive powers to obtain the information needed to discharge its duties, the HCSF has a wide array of macroprudential instruments at its disposal, covering a broad range of participants. Its decisions are legally binding, which enables it to act swiftly and effectively. The Governor of the Banque de France, who is also the president of the ACPR, sits on the HCSF and has considerable powers, as he alone can propose to activate the HCSF’s macroprudential tools. On 30 December 2015, the HCSF issued its first decision on the countercyclical capital buffer (CCyB). This consisted, in accordance with the applicable provisions,13 in setting the CCyB rate for France at 0%. The HCFS also recognised the CCyB rates of Sweden and Norway, which are set at 1.5% and apply to exposures located in those countries. The HSCF acts within the European institutional framework. Its decisions are taken in collaboration with the ECB, the European Systemic Risk Board (ESRB), the European Commission, the EBA, and the macroprudential authorities of other European Union (EU) Member States.
In Europe, the ESRB is in charge of macroprudential supervision of the EU financial system. It is tasked with issuing opinions and recommendations to prevent systemic risk and limit procyclicality at the level of EU member countries. When it became the sole banking supervisor for euro area countries, the ECB was also assigned binding macroprudential powers in relation to a number of instruments listed in CRD IV and CRR (see below).14
In terms of macroprudential policy, the SSM regulation, which came into force in November 2013 and has been operational since November 2014, establishes shared responsibility for these instruments between the national macroprudential authorities that belong to the SSM and the ECB. The HCSF is responsible in France for implementing the instruments provided for in CRD IV and CRR. However, it must notify the ECB of its intention ten business days before taking the decision. The ECB then has five days to make an objection, which the national authority must take into account before making its final decision. For countries taking part in the SSM, the ECB may intervene to impose more stringent macroprudential requirements, working closely with the national authorities and
observing a notification period of ten days before taking its decision. The national authorities have five days to submit their point of view and to make the case for specific national considerations before the ECB takes its final decision.
In France, the law shares responsibility for activating these macroprudential tools between the HSCF, which looks after macroeconomic, cross-sectional instruments, and the ACPR, which deals with instruments entailing an analysis of individual institutions. The two bodies collaborate closely.
The HCSF may take action on:
• the CCyB (CRD IV Articles 130 and 135-140 and Article L631-2-1 of the Monetary and Financial Code), which is defined as a Common Equity Tier 1 surcharge intended to “protect the banking system against potential losses associated with a build-up of cyclical systemic risk, thereby supporting the sustainable provision
13 Article 69 of the executive order of 3 November 2014 on the capital buffers of banking services providers and investment firms other than portfolio management companies.
14 Directive 2013/36/EU on access to the activity of credit institutions and the prudential supervision of credit institutions and investment firms (CRD IV) and Regulation (EU) No. 575/2013 on prudential requirements for credit institutions and investment firms (CRR).

MO
NET
ARY
POLI
CY A
ND
FIN
ANCI
AL S
TABI
LITY
42 BANQUE DE FRANCE – ECONOMIC REPORT 2015
of credit to the real economy throughout the financial cycle”;15
• the systemic risk buffer (CRD IV Articles 133 and 134 and Article L631-2-1 of the Monetary and Financial Code), which is designed to prevent and mitigate long-term non-cyclical systemic or macroprudential risks;
• the flexibility package (CRR Article 458, which is directly applicable under national legislation), which allows for stricter national measures in terms of capital requirements, large exposure requirements, public disclosure requirements, the level of the capital conservation buffer, liquidity requirements, risk weights and exposures in the financial sector; lending requirements may also be set, including loan-to-value ratios for acquired assets, plus loan-to-income and debt service-to-income ratios for borrowers.
The ACPR may set:
• additional capital requirements for systemically important financial institutions, i.e. buffers for global systemically important institutions and other systemically important institutions;
• stricter weightings for exposures secured by residential or commercial property for banks adopting the standardised approach to credit risk;
• higher minimum loss given default values for exposures secured by residential or commercial property for banks using internal models for credit risk;
• additional “cross-sectional” capital requirements under Pillar 2, on top of the basic requirements under Pillar 1.
In 2015, the number of macroprudential decisions in Europe increased
markedly compared with 2014: 121 new measures were recorded (138 including Norway), up 16% on the previous year. Some of these measures were used to continue pre-existing mechanisms but the increase was partly driven by mandatory provisions contained in CRD IV and CRR, notably concerning the establishment of the CCyB and the identification of other systemically important institutions,16 which accounted for 100 or so decisions across 17 countries, including France. Many measures also involved the residential property sector or the systemic risk buffer (CRD IV Article 133).
15 Recommendation ESRB/2014/1, Recommendation A, Principle 1.
16 Other systemically important institutions include national systemically important institutions, as contrasted with global systemically important institutions identified based on the methodology drawn up by the Financial Stability Board (FSB). In France, the ACPR identified other systemically important institutions and determined the associated capital buffer rate: see list published in the ACPR official register on 30 December 2015: http://acpr.banquefrance.fr/fileadmin/user_upload/acp/publications/registre-officiel/20151229_Liste_AEIS.pdf

43
MO
NET
ARY
POLI
CY A
ND
FIN
ANCI
AL S
TABI
LITY
Measures and reforms needed to consolidate the recovery
Measures and reforms in France
Measures to support financing: development of securitisation and other instruments to provide financing for economic agents
The economy is financed through a number of channels, which may be encouraged or revitalised. Securitisation, for example, can support financing by making it possible, within a simple, transparent and standardised framework, to increase financing sources for banks and open up the credit market to non-bank investors. In the wake of the financial crisis, numerous initiatives were carried out to correct problems on the securitisation market exposed by the subprime crisis and then to stimulate issuance. These initiatives seek to do three things: identify prudential treatment that will encourage more effective risk management by holders of asset-backed securities;
4promote efforts to tap into pools of high-quality assets and simple structures; and enhance market transparency. European regulations, notably the Capital Markets Union (CMU) initiative, and rules issued by BIS committees are being drawn up to support these three aspects, notably by making risk analysis more transparent to investors.
At a time when the economic and regulatory environment is prompting changes to bank models, securitisation can help finance the real economy. The new environment may lead banks to scale back some of their investment, corporate and retail activities and could thus affect the financing conditions for EU businesses. In this setting, the positive role played by securitisation in terms of financing the real economy chiefly concerns access to refinancing for small and mid-sized enterprises (SMEs). In the current low interest rate environment, large European companies can finance themselves more cheaply on the markets than
with banks, but SMEs do not have the same access to these markets. Admittedly, the new rules have not curbed credit distribution in France, which remains buoyant, with outstanding loans to French SMEs and micro-enterprises rising by 2.1% and 3.8% respectively in December 2015. Yet the situation is not uniform throughout the euro area. SME financing has continued to be affected by market fragmentation within the euro area since the 2007-2008 crisis, particularly in peripheral countries. Increased credit provision through the revitalisation of sound securitisation in Europe could thus address SME financing needs, with a view to achieving an economic recovery.
Meanwhile, new methods of non-intermediated financing for SMEs are gaining ground, including crowdfunding, which is gradually increasing the amounts raised. The number of crowdfunding platforms specialised in SME lending is on the rise. Going into 2014,

MO
NET
ARY
POLI
CY A
ND
FIN
ANCI
AL S
TABI
LITY
44 BANQUE DE FRANCE – ECONOMIC REPORT 2015
Box 8
The debt carried by French non-financial corporations continues to grow
Methodological note: The debt of non-financial corporations (NFCs) may be measured using macroeconomic data, which facilitate cross-country comparisons, or using firm-level data. Because national and corporate accounts use different conventions, ratios (for debt and so on) are not the same.1 Useful additional insight can be garnered from firm-level data prepared on a consolidated basis because they can be used to distinguish NFCs by size. However they are not available as quickly. This box seeks to characterise the change in NFC debt in the post-crisis period based on both types of data.
The debt of French NFCs is rising more quickly than in other large euro area countries. The NFC debt ratio in France is close to the euro area average, below that of Italy and Spain, but higher than that of Germany (see Chart Ca). In terms of the trend, the increase in the NFC debt ratio since end-2007 in France contrasts with the situation in other large euro area countries, where the ratio has either stayed the same or fallen.
Ca Consolidated NFC debt as a percentage of value added(%)
60
100
120
140
220
Dec.2007
France Germany Italy Spain
160
200
Euro area
180
Dec.2009
Dec.2011
Dec.2013
Dec.2015
80
Source: Banque de France, national accounts data.
Cb Bank and fixed income debt as a percentage of value added, by company size(%)
2007
Overall Mid-tier firms SMEs Large corporationsNational accounts (right-hand scale)
2009 2011 2013 201580
90
100
110
120
130
140
150
160
170
180
50
60
70
80
90
100
110
120
130
140
150
2008 2010 2012 2014
Source: Banque de France, firm accounting data.2
1 For more, see Cahn (C.), Carlino (L.) and Lefilliatre (D.) (2016): “Les entreprises en France en 2014: l’activité marque le pas”, Bulletin de la Banque de France No. 203, January-February. https://www.banque-france.fr/fileadmin/user_upload/banque_de_france/publications/Bulletin-de%20la-Banque-de-France/Bulletin-203-Article-5-Entreprises-en-France-2014.pdf
2 For more, see “La situation des entreprises en 2014, dossier statistiques 1999-2014”. https://www.banque-france.fr/fileadmin/user_upload/banque_de_france/Economie_et_Statistiques/METHODOLOGIE_SITUATION_DES_ENTREPRISES.pdf

45
MO
NET
ARY
POLI
CY A
ND
FIN
ANCI
AL S
TABI
LITY
The increase in the debt carried by French NFCs is essentially attributable to large corporations. The NFC debt ratio rose by around 30 percentage points (pp) of value added between end-2007 and end-2015, with bank loans accounting for 10 pp and debt securities (chiefly bonds) for 20 pp. The debt ratio grew notably among large corporations in 2014 (see Chart Cb), owing to major restructuring efforts.1 Conversely, it fell among SMEs and mid-tier firms. Overall, at the macroeconomic level, debt’s share of value added continued to trend upwards in 2015, but at a slower pace than in 2014.3
However, the ratio of financial debt to shareholders’ equity remained stable among large corporations. Corporate debt can also be measured by the ratio of financial debt to called-up capital. This ratio must be below 100% to guarantee that capital providers will be repaid in the event of liquidation. From this perspective, companies are broadly in control of their debt (see Chart Cc). In terms of the distribution, most companies lie below this critical value in all categories, and ratios have actually been trending downwards among SMEs and mid-tier firms, while remaining steady at large corporations.
With the decline in interest rates, SMEs and mid-tier firms have seen their financial charges go down. This is not the case for all larger corporations, however, since they have stepped up their debt (see Chart Cd).1
3 For more, see Humbertclaude (S.) and Monteil (F.) (2016): “France’s national economic wealth declined by 1.8% in 2014”, Quarterly Selection of Articles 41, Spring 2016. https://www.banque-france.fr/fileadmin/user_upload/banque_de_france/publications/quaterly-selection-of-articles_41_2016-spring_4_economic-wealth.pdf
4 “Financial intermediation services indirectly measured” (FISIM) capture the share of services provided by financial intermediaries that is not billed to customers. The national accounts thus consider a portion of the interest charges on bank loans to companies as intermediate consumption rather than paid interest. The balance of interest shown in Chart Cd is adjusted for this effect to make national accounting data consistent with business accounting data.
Cc Financial debt as a percentage of called-up capital(median ratio, %)
2007
Mid-tier firms SMEs Large corporations
2009 2011 201335
40
45
50
55
60
65
70
75
2008 2010 2012 2014
Note: Financial debt divided by called-up capital, not adjusted for double counting.Source: Banque de France2.
Cd Debt service charge divided by gross operating surplus(%)
2007
Overall Mid-tier firms SMEs Large corporationsNational accounts (right-hand scale)
2009 2011 2013 2015 **2008 2010 2012 20147
9
11
13
15
17
19
21
11
13
15
17
19
21
23
25
Notes: * Balance of interest paid less received before recognition of FISIM,4 divided by gross operating surplus.** For 2015, cumulative flows over four quarters in the third quarter of 2015.Sources: Banque de France,2 Insee.

MO
NET
ARY
POLI
CY A
ND
FIN
ANCI
AL S
TABI
LITY
46 BANQUE DE FRANCE – ECONOMIC REPORT 2015
Unilend was the only operator in this segment. By the end of June 2015, there were no fewer than ten platforms, including Lendopolis, Finsquare, Lendix and Credit.fr. For SMEs, the benefit of this kind of loan lies in the speed with which funds can be obtained, notably in the case of smaller amounts. Observed loan amounts are between EUR 30,000 and EUR 300,000, with maturities ranging from 18 to 48 months. However, the default rate on crowdfunding platforms is higher than that of banks, so interest rates on the platforms are higher, generally between 4% and 9%.
Fiscal consolidation: a key challenge, especially in France
Government finances improved markedly but unevenly across euro area countries.
In 2015, the euro area’s aggregate fiscal position continued to improve according to the latest estimates provided in the European Commission’s winter economic forecast. The euro area general government deficit narrowed fairly sharply to 2.2% of GDP from 2.6% in 2014 (see Chart 16), and the primary
balance improved as well, although to a lesser extent, coming out at 0.2% of GDP after 0.1% in 2014. The structural deficit was estimated at 1.1% of potential GDP in 2015, after 1.0% in 2014. Following the significant fiscal adjustments of recent years, this latest improvement had more to do with brightening economic conditions and low interest rates, while the structural effort, i.e. fiscal policy, was neutral overall in 2015.
All the countries under financial assistance programmes – Cyprus, Spain, Greece, Ireland and Portugal – reported improved government finances with the exception of Greece. GDP growth in Greece was affected in the second half of 2015 by fears over a payment default, paralysis of the Greek banking system
and capital controls, which led to a deterioration in the government finances. Portugal, Ireland and Cyprus, by contrast, again reported significant and encouraging results, and in 2015 hit the target of bringing the government deficit below 3.0% of GDP (after correcting for one-off measures in Portugal’s case). Spain also trimmed its deficit from 5.8% in 2014 to 5.2% of GDP in 2015. To meet European requirements under the excessive deficit procedure, Spain will, however, have to take vigorous steps to meet the goal of a 3% deficit in 2016.
Italy, the Netherlands and Belgium reported government deficits of below 3.0% in 2015. France cut its deficit to 3.5% of GDP in 2015. In February 2015, the European
C16 Government balances(% of GDP)
-12
-10
-8
-6
-4
-2
0
2
2012 → 2015France
2012 → 2015Germany
2012 → 2015Italy
2012 → 2015Spain
2012 → 2015Netherlands
2012 → 2015Euro area
Sources: European Commission for the euro area (EC, 2015 winter forecasts) and national institutes.

47
MO
NET
ARY
POLI
CY A
ND
FIN
ANCI
AL S
TABI
LITY
Commission gave France an additional two years to bring its deficit below 3% of GDP, i.e. 2017 (see below).
Germany was once again the only large country to report a fiscal surplus, which totalled 0.6% of GDP in 2015, after 0.3% in 2014. The German government decided that the fiscal surpluses of 2015 would be partly put towards financing refugee-related costs rather than debt repayment.
The migrant crisis dominated 2015 as over a million people fled the Middle East and Africa and came to Europe, chiefly Germany, Sweden and Austria. Estimates of the impact of the refugee crisis on growth and government finances are highly uncertain at this stage. In the short run, taking in refugees pushes up government spending, which has an automatic impact on growth. Further out, the economic impact will depend on the ability of refugees to integrate into the labour market, contribute to growth and pay taxes.
In France, the government deficit narrowed by five-tenths of a point in 2015 and the government deficit fell to 3.5% of GDP from 4.0% in 2014. The primary deficit shrank to 1.5% of GDP after 1.8%. The structural
deficit was estimated at 2.5% of potential GDP in 2015, after 2.9% in 2014 (Banque de France estimates17 based on available information following Insee’s deficit report on 25 March 2016). This corresponded to an estimated structural effort of four-tenths of a point of GDP, but just two-tenths of a point approximately in terms of the structural primary effort. Moreover, for the first time since 2008, the ratio of taxes and social security contributions to GDP declined (by three-tenths of a percentage point) as did the government spending ratio (by eight-tenths of a point, excluding tax credits).
In terms of tax levies, 2015 featured measures to reduce business taxes and charges with the continued expansion of the tax credit for competitiveness and employment (CICE),18 which saw EUR 16.5 billion in tax credits granted in 2015, after EUR 10 billion in 2014, and the first round of measures under the Responsibility and Solidarity Pact (PRS), which cut social security contributions by EUR 5 billion and solidarity contributions by businesses by EUR 1 billion. However, other levies increased, including pension contributions (by EUR 0.6 billion) and environmental taxes (approximately EUR 2.6 billion).
The growth rate of government spending eased in 2015, with a nominal increase excluding tax credits of 0.9% in 2015, after 1.0% in 2014, compared with an annual average of 3.5% between 2002 and 2012. The control of spending in value terms was aided by inflation of virtually zero and a lower debt service charge. Primary spending, however, with volume measures deflated by the CPI excluding tobacco, increased by 1.1% in 2015, after 0.8% in 2014, compared with 2.0% on average between 1999 and 2013.
Among the short-term initiatives put forward to complete Europe’s Economic and Monetary Union, The Five Presidents’ Report (see below “Measures and reforms in the euro area and internationally”) suggested setting up an advisory European Fiscal Board. The new board would complement the national fiscal councils, with the aim of providing a public and independent economic assessment of overall euro area fiscal policy. This proposal was acted on with the decision by the Commission
17 Using estimated potential growth, as the European Commission does under the excessive deficit procedure.
18 See “Structural reforms implemented in France”, below, for details.

MO
NET
ARY
POLI
CY A
ND
FIN
ANCI
AL S
TABI
LITY
48 BANQUE DE FRANCE – ECONOMIC REPORT 2015
Box 9
The trajectory of France’s government debt needs to be reversed
In 2015, the ratio of overall government debt (central government, social security and local government combined) to GDP in euro area countries fell for the first time since the start of the financial crisis in 2008, reaching 93.5% according to the European Commission’s winter forecasts (see Chart Ca). However, this aggregate trend reflects different trajectories and levels of national government debt.
• In France, the ratio of government debt to GDP continued to rise slightly in 2015, putting on four-tenths of a point to reach 95.7%. Debt also increased as a percentage of GDP in Spain and Italy, where it stood at approximately 99% and over 132% respectively.
• In the Netherlands and Germany, the debt-to-GDP ratio fell in 2015 to approximately 65% and 71% respectively, significantly lower than in the euro area’s other major economies. Although recent in the Netherlands, this trend has been in place for a while in Germany, whose debt ratio decreased by approximately 1.5 percentage points (pp) per year on average from 2011 to 2014.
Since the start of the financial crisis, i.e. on a cumulative basis over the 2007-2015 period, the euro area ratio of government debt to GDP has increased by almost 29 pp (see Chart Cb). About half of the increase is attributable
Ca Ratio of government debt to GDP in the euro area’s five largest economies(% of GDP)
20
40
60
140
France Germany ItalySpain
80
120
Netherlands
100
2000
Euro area
2002 2004 2006 2008 2010 2012 2014
Sources: European Commission, Ameco database; Insee.
Cb Decomposition of cumulative debt over the 2007-2015 period(in percentage points)
-20
-10
0
10
20
70
30
Primary balanceStock-flow adjustment
Snowball effectDelta of debt/GDP ratio
FRA SP ITA GER NL EA
40
50
60
Sources: European Commission, Ameco database; Insee; Banque de France calculations.

49
MO
NET
ARY
POLI
CY A
ND
FIN
ANCI
AL S
TABI
LITY
to a “snowball” effect, i.e. to the fact that the increase in nominal debt outpaced growth in nominal GDP because interest rates charged on debt exceeded the growth rate of economic activity. The change in the primary balance (excluding debt service charges) and the stock-flow adjustment (financial transactions with no counterpart entry in the budget, such as the purchase of financial assets under banking system assistance plans) were responsible for the other half.
Here again, the change in the debt ratio for the whole of the euro area concealed specific national factors.
• France ran a primary deficit each year over the period, whose cumulative total made the largest contribution to the increase in the ratio, i.e. approximately 20 pp of GDP since 2007. The same is true in Spain, where the primary deficit was responsible for government debt increasing by about 40 pp of GDP. These outcomes reflect the effects of automatic stabilisers, stimulus plans, delayed consolidation, notably in France, and, in Spain, the effects of the burst property bubble.
• In Italy, the snowball effect had the biggest impact on the increase in the debt-to-GDP ratio. This was due to the high level of Italian debt going into the crisis (it was already at 100% of GDP in 2007) and to the fact that market refinancing terms for Italian debt deteriorated significantly over several years while growth remained weak. The contribution from the primary balance partly offset the snowball effect, as Italy posted a primary surplus almost every year over the period.
• In the Netherlands, where the overall increase in debt was more moderate, the primary balance was responsible for approximately half of the increase in the debt-to-GDP ratio, while the snowball effect contributed one-third.
• In Germany, steps to recapitalise the banking and financial system through the acquisition of assets recognised in the stock-flow adjustment contributed to the increase in the debt-to-GDP ratio over the period. By contrast, the cumulative primary surplus over 2008-2015 held the increase to just 8 pp of GDP approximately.
Accordingly, it is vital to quickly stabilise and then reduce the ratio of government debt to GDP in France, as has already happened in the euro area as a whole. For this, vigorous efforts to reduce the primary deficit are vital, during a period that offers the opportunity to take advantage of ultra-low interest rates and firmer growth.
on 21 October 2015 (see after) establishing an advisory European Fiscal Board on 1 November 2015. Made up of five independent experts
appointed for three years, it is expected to be up and running by mid-2016. Its role will be to assess fiscal policies within the framework
of the EU’s economic governance and to advise the Commission on the appropriate fiscal stance for the euro area as a whole, as well as

MO
NET
ARY
POLI
CY A
ND
FIN
ANCI
AL S
TABI
LITY
50 BANQUE DE FRANCE – ECONOMIC REPORT 2015
on its role in coordinating with domestic policies. The board will cooperate with the national fiscal councils to promote the spread of best practices and provide ad hoc advice at the Commission President’s request. Its activity will be detailed in an annual report that summarises the advice and assessments provided to the Commission.
Structural reforms implemented in France are necessary to avoid the threat of weak long-term growth. So far, they have had a positive but limited impact
France suffers from weak potential growth, currently estimated by the Banque de France at 1.0% for 2015, 1.1% for 2016 and 1.2% in 2017. The unemployment rate remains high, at 10.0% of the working population in metropolitan France in the fourth quarter of 2015, and 24.0% of people between the ages of 15 and 24 cannot find work. France has also lost ground in cost-competitiveness and non-cost competitiveness over the last two decades.19 Because of this, major measures have been introduced to restore competitiveness, stimulate employment and boost investment.
The CICE tax credit and the PRS pact have lowered labour costs and cut taxes. The CICE is a tax credit amounting to 6% of a company’s gross wage bill, excluding wages that are more than 2.5 times greater than the minimum wage. In 2015, the PRS resulted in a 1.8 pp reduction in family-related employer contributions on wages between 1 and 1.6 times the minimum wage. The second part of the PRS will come into effect on 1 April 2016 and see family-related contributions cut from 5.25% to 3.45% on wages between 1.6 and 3.5 times the minimum wage. In addition, taxes on businesses have been overhauled and reduced: the C3S social security contribution, which is revenue-based, was lowered in 2015. Under the PRS, the C3S will be phased out by 2017, and corporate income tax will be cut to 32% in 2017 and to 28% by 2020. The exceptional additional income tax levied on companies since 2011 is to be phased out in 2016.
The government also wants to create an environment that is supportive of corporate investment, research and development (R&D) and innovation, all of which are key determinants in long-term productivity and growth. A number of infrastructure investment programmes aimed at boosting long-term supply have
been introduced at the European (Juncker plan) and domestic (Grand Paris, France Très Haut Débit) levels. Nurturing entrepreneurship is a priority, and the government has taken several steps to encourage an entrepreneurial attitude, recognise the benefits of investment risk-taking for employment, and help companies to grow, through measures such as competitiveness hubs, additional write-downs on investments, support for firms taking on their first employee and mitigation of threshold effects. Access to financing has to be facilitated, particularly for micro-businesses, while government support for R&D and innovation, especially by smaller companies, needs to remain a priority (tax credits, Bpifrance, Programme d’investissement d’avenir, etc.). Moreover, provisions contained in the Growth, Activity and Equal Economic Opportunities Act have lowered the barriers to entry and restrictions on doing business in certain regulated professions.
In the labour market, the Rebsamen Act and Macron Act have already improved the way that industrial tribunals work, strengthened
19 Bas (M.), Fontagné (L.), Martin (P.) and Mayer (T.) (2015): “À la recherche des parts de marché perdues”, Note du Conseil d’analyse économique, No. 23, May.

51
MO
NET
ARY
POLI
CY A
ND
FIN
ANCI
AL S
TABI
LITY
employer/employee dialogue and mitigated threshold effects. Since 2013, a drive has been underway to cut red tape and legal constraints affecting business activity and citizens’ dealings with government, with a host of steps to simplify procedures and standards, facilitate disclosures and so on. Lastly, territorial reforms introduced in 2014 through three laws (on metropolitan areas, regional boundaries, and the new territorial organisation) helped to rationalise skills and initiatives within local government, even if some administrative redundancies remain to be eliminated.
These measures will assist in lowering labour costs, boosting employment, and stimulating innovation and investment. Yet major structural reforms20 still need to be carried out to reduce the rigidities that hinder the growth of French companies. Labour market functioning has to be improved further on several fronts, from simplifying procedures and integrating young people to improving vocational training and building stronger contractual rights. Efforts as part of the simplification drive to lower the costs generated by rules and red tape are needed but could be bolstered in a number of areas, including taxation, property
and government organisation. If investors and entrepreneurs are to have confidence, it is vital to create a stable macroeconomic, fiscal and financial environment.
Measures and reforms in the euro area and internationally
EU economic governance: deepening measures proposed to support growth
Supporting the Eurosystem’s internal market policy and monetary policy, reforms to the governance arrangements of the Economic and Monetary Union (EMU) are designed to boost growth potential and improve the euro area’s ability to withstand shocks.
In 2015, the EU and its Member States once again showed their ability to adapt. The Commission’s Communication on the Stability and Growth Pact, adopted on 13 January 2015, provided additional guidance on proper usage of the flexibility written into the Pact. Without amendments to the existing rules, flexibility is permitted provided
that Member States introduce structural reforms and encourage investment, or more effectively take account of a potential downturn in their economic environment. Improving the guidance on the room for interpretation allowed under the Pact made it possible to strike a better balance between the constraints of fiscal discipline and economic policy.
Discussions on deepening EMU continued over the course of 2015 based around The Five Presidents’ Report presented in June by Jean-Claude Juncker, President of the Commission, alongside Donald Tusk, President of the European Council, Martin Schulz, President of the European Parliament, Mario Draghi, President of the ECB, and Jeroen Dijsselbloem, President of the Eurogroup. The report proposed consolidating the foundations of EMU by acting on four interdependent fronts: build a more effective economic union; complete the financial union; establish a fiscal
20 Cette (G.), Lopez (J.) and Mairesse (J.) (2014): “Product and labor market regulations, production prices, wages and productivity”, NBER Working Paper, No. 20563, October. This paper shows that bolder reforms could make a substantial contribution to French growth, finding that reducing labour and product market regulations to align with the most lightly regulated countries could generate long-term productivity gains of 6% in France.

MO
NET
ARY
POLI
CY A
ND
FIN
ANCI
AL S
TABI
LITY
52 BANQUE DE FRANCE – ECONOMIC REPORT 2015
union; and consolidate the political union through enhanced democratic accountability and legitimacy.
The report contained a pragmatic roadmap comprising two stages: short-term reforms between 2015 and 2017 based on the existing treaties, followed by a programme of long-term reforms from 2017 to 2025, which might involve revisions to the treaties.
The European Commission then published a “package” on 21 October 2015 aimed at providing concrete measures to get started on stage one. These measures included the decision to create an advisory European Fiscal Board, a recommendation to the Council on the introduction of National Competitiveness Boards and a communication to unify the euro area’s external representation.
The timetable of the European Semester used to coordinate Member States’ economic policies was also amended so that discussions and recommendations for the euro area as a whole are held first, before country-specific discussions.
On 24 November 2015, a legislative proposal by the European Commission signalled the formal launch of the debate over introducing
T3 Roadmap, The Five Presidents’ Report
Economic Union Financial Union Fiscal Union Democratic Accountability
Stage 1 Creation of a euro area system of Competitiveness Authorities
Strengthened implementation of the MIPa)
Greater focus on employment and social performance
Stronger coordination of economic policies within a revamped European Semester
Agree on a common Deposit Insurance Scheme
Improve the effectiveness of the European Stability Mechanism (ESM)
Setting up a bridge financing mechanism for the SRFb)
Launch the Capital Markets Union (CMU)
Reinforce the European Systemic Risk Board (ESRB)
Creation of a new advisory European Fiscal Board
Strengthen parliamentary control as part of the European Semester
Increase the level of cooperation between the European Parliament and national Parliaments
Reinforce the steering of the Eurogroup (reinforcement of presidency and the means at its disposal) and clarify its mandate
Consolidate external representation of the euro area
Integrate the framework introduced by the TSCGc), the Euro Plus Pact, and the Intergovernmental Agreement on the SRF
Stage 2 Formalise and make more binding the convergence process within EMU through a set of commonly agreed benchmarks for convergence that could be given a legal nature
Set up a macroeconomic stabilisation function for the euro area to cushion large shocks. A prospective stabilisation function could build on the European Fund for Strategic Investments (EFSI) as a first step
Integrate ESM governance within the EU treaties, since, under the current intergovernmental structure, governance and decision-making processes are complex and lengthy
Set up a euro area treasury for more collective decision-making on revenue and expenditure policy
a) Macroeconomic imbalance procedure.b) Single Resolution Fund.c) Treaty on Stability, Coordination and Governance.

53
MO
NET
ARY
POLI
CY A
ND
FIN
ANCI
AL S
TABI
LITY
a European Deposit Insurance Guarantee Scheme, which is the third pillar needed to complete the Banking Union (the first two being the Single Supervisory Mechanism and the Single Resolution Mechanism). This common scheme would be established in three stages: i) a reinsurance mechanism through to 2020; ii) a coinsurance mechanism until 2024; and iii) a full European system of deposit guarantees from 2024 onwards. The proposed mechanism seeks to maintain confidence in the event of a crisis by avoiding deposit withdrawals or capital flight, and by breaking the link between sovereign risk and domestic banking risk.
At the same time, the European institutions and Member States worked hard to boost Europe’s potential growth through initiatives such as the Juncker investment plan, which was launched in 2015 and provided funding to 17 French projects over the year, including eight infrastructure and innovation projects and nine SME financing projects. Under the plan, the European fund for strategic investments (EFSI) will generate EUR 315 billion in investment within the EU over three years starting from an initial endowment of EUR 21 billion taken from the
EU budget and a capital allocation from the European Investment Bank (EIB). Another important initiative is the Capital Markets Union (CMU), which seeks to reduce fragmentation in market financing channels. On 30 September 2015, the Commission published a CMU action plan, which includes a legislative package to promote “simple, transparent and standardised” securitisation. In late November 2015, the Commission also proposed a revision to the Prospectus Directive, with amendments to the rules on the prospectuses to be published by companies seeking to raise capital. These initiatives form part of wider efforts to consolidate the financial union and build on banking union projects that were either completed or started in 2015. By promoting the development and diversification of financing sources in Europe, the European partners are endeavouring to ensure that innovation and investment are more effectively funded.
International coordination of economic policies: committing to reforms that will promote growth
After the Washington summit in November 2008, the Group of 20
(G20) emerged as the main forum for international economic and financial cooperation. Turkey took over the G20 presidency from Australia in 2015, with the aim of pursuing its predecessor’s efforts to support the global economic recovery, especially by paying special attention to growth strategies.
The Summit Meeting of G20 Heads of State and Government held in Antalya in November 2015 led to the adoption of an ambitious action plan for growth and jobs based on more consistent, structured and comprehensive national strategies in economic policy and structural reform. The main objective announced in Brisbane in 2014 is to lift the G20’s cumulative GDP growth by at least 2% by 2018 compared with the IMF’s 2013 baseline scenario.
Work on the theme of investment was continued under the Turkish presidency. In particular, national investment strategies and commitments were set out and endorsed at the Antalya summit based on the growth strategies model. An action plan was also defined for multilateral development banks. In addition, the Global Infrastructure Hub introduced by the Australian presidency in 2014 was provided with a business model and became operational in 2015.

MO
NET
ARY
POLI
CY A
ND
FIN
ANCI
AL S
TABI
LITY
54 BANQUE DE FRANCE – ECONOMIC REPORT 2015
In financial regulation, the Turkish Presidency moved ahead with implementation of the reform agenda adopted after the crisis, notably on OTC derivatives, resilience of the financial system and surveillance of new vulnerabilities linked to the financial sector and market finance, paying close attention to identifying and addressing the unintended effects of reforms.
Significant strides were made in tax cooperation with the adoption of the OECD-G20 action plan on preventing base erosion and profit shifting, which is designed to combat unfair tax optimisation practices
among multinational companies and modernise international tax cooperation. In terms of preventing tax evasion, G20 Member States agreed to begin automatically exchanging information by 2018 at the latest.
China took over from Turkey in December 2015 and identified four priorities: i) break a new path for growth and boost long-term potential growth; ii) achieve more robust international trade and investment; iii) ensure more effective and efficient global economic and financial governance; iv) promote inclusive and interconnected development.
The 2010 reforms to IMF governance and quotas came into force after they were ratified by the United States in December 2015. They will double the Fund’s quota resources and rebalance voting rights to better reflect the increasing role of dynamic emerging countries in the global economy. Other subjects relating to the international financial architecture (IFA) were also broached in 2015, including sovereign debt restructuring. The Chinese presidency plans to make headway on these issues by reactivating the G20’s IFA working group, which is co-chaired by France and Korea.

55
TABL
E O
F IL
LUST
RATI
ON
S AN
D BO
XES
Table of illustrations and boxes
Tables
French GDP and its components 20Monetary aggregates, euro area and France, 2013-2014-2015 28Financial investments of French households 31Roadmap, The Five Presidents’ Report 52
Charts
Ten-year sovereign yields 8Euro area ten-year sovereign spreads over Bunds 8Nominal effective exchange rates of the main currencies, 1 January to 31 December 2015 9Average bid-ask spreads 10Bund futures contracts 10Stock indices in 2015 12Brent oil price 12Metal and agricultural commodity price indices 13GDP growth in emerging economies 14GDP growth 17GDP in volume terms 19French exports of goods and services in volume terms divided by demand directed towards France 21Exports of goods and services in value terms divided by total euro area exports 21Exports of goods in value terms divided by total euro area exports 22Exports of services in value terms divided by total euro area exports 22Harmonised index of consumer prices 24Overall HICP, HICP excluding energy and food in France, oil price 24Measures of inflation, France 26Contributions to inflation, France 26

56 BANQUE DE FRANCE – ECONOMIC REPORT 2015
TABL
E O
F IL
LUST
RATI
ON
S AN
D BO
XES
Value added deflator, wage growth, unit labour cost (adjusted for the CICE) and consumer prices, France 27Annual growth rate of lending to NFCs, corrected for securitisation, France 29Annual growth rate of NFC debt by instrument, France 29Annual growth in French household lending 30Euro area interest rates 34GDP growth and inflation in the euro area (Eurosystem projections, December 2015) 35Monetary policy rate corridor 38Yield curve movements following Eurosystem decisions 38Consolidated NFC debt as a percentage of value added 44Bank and fixed income debt as a percentage of value added, by company size 44Financial debt as a percentage of called-up capital 45Debt service charge divided by gross operating surplus 45Government balances 46Ratio of government debt to GDP in the euro area’s five largest economies 48Decomposition of cumulative debt over the 2007-2015 period 48
Boxes
Market liquidity risk: fact and fiction 10The impact of the Chinese slowdown on global growth: effects channelled through international trade are magnified in the event of financial contagion 15Market shares of French exports stabilised recently, but results may vary depending on the indicator used 21Different inflation measures provide complementary insights 25Financial behaviour of French households: some changes, some consistency in a low interest rate environment 30The Expanded Asset Purchase Programme (EAPP) has had a positive impact on growth and inflation 33Negative interest rates: mechanisms and consequences for market participants 37The debt carried by French non-financial corporations continues to grow 44The trajectory of France’s government debt needs to be reversed 48