barbara fakin* and alain de crombrugghe university of ... · subsidies 2.03 24.62 7.96 27.96...
TRANSCRIPT

1
FISCAL ADJUSTMENTS IN TRANSITION ECONOMIES:SOCIAL TRANSFERS AND EFFICIENCY OF PUBLIC SPENDING
Comparative analysis with OECD countries
27/3, 1997
Barbara Fakin* and Alain de CrombruggheUniversity of Namur, Belgium;& *Ministry for Economic Relations and Development, Slovenia.

2
SUMMARY
Despite a dramatic shift away from subsidies in the early years of transition, the countries of
Central Europe still show signs of an unsuccessful fiscal adjustment, insufficient deficit
reduction and loose expenditure policy. Consequently, high social transfers and low efficiency of
government spending remain two main challenges of fiscal adjustments and long-term
sustainability of budgetary policy choices. The cross-country regression analysis shows that the
problems with high social security outlays are largely due to loose eligibility criteria (i.e. to a
large number of early retirees) under current state pay-as-you-go pension systems - and not so
much to old populations or high replacement rates. It is suggested that transition countries
should reach social consensus on the reform of future pension rights. The transition to a funded
pension system could be financed by a combination of : (i) government debt, (ii) privatisation
proceeds, (iii) efficiency gains from lowering and/or restructuring of government expenditure in
favour of infrastructure, retraining and market-oriented tertiary education.
Acknowledgement: This paper was written as the part of a project, Fiscal Reform in Poland Sponsored by theResearch Support Budget of the World bank (RPO 678-96). We benefited from the discussion with Anton Barten,Marek Dabrowski, Robert Deschamps, Alan Gelb, Herbert Glejser, Marvin Jackson, Branko Milanovic, BorisPleskovic, Jeffrey Sachs, Henry Tulkens, seminar participants at CASE (Warsaw), 10th Congress of EuropeanEconomic Association (Prague), Workshop on International Economics at Catholic University of Leuven , andInternational Conference at the 50th Anniversary of Faculty of Economics, University of Ljubljana, Slovenia. Usualinstitutional disclaimer applies.
Barbara Fakin is currently a Belgian Government SSTC Scholar from Slovenia at the University of Namur,Belgium.Alain de Crombrugghe is Professor at University of Namur, Belgium.

3
Contents
1. Introduction
1.1. Comparative budgetary structure: Some statistical facts1.2. Questions1.3. Outline
2. A brief literature review
3. Structural determinants of social transfers3.1. General environment3.2. Early retirement and the generosity of the pension system3.3. Expenditure policy choices
4. Efficiency of public spending
5. Pension reform
6. Conclusions
7. AppendixI. Regression estimatesII. Non-parametric efficiency analysisIII. List of variables and country samples with dummy variables
8. References

4
1. Introduction
Fiscal sector reform is an integral part of medium-term strategies for sustainable growth in the
CEC’s (i.e. Central European Countries). Governments in transition economies face a difficult
task of working both on the quantity and the quality of fiscal adjustments. The quantity of fiscal
adjustment corresponds to a need to contain short-term fiscal imbalances. The quality of fiscal
adjustment requires the “ structural ” fiscal sector reform which will reduce the still
overwhelming role of the state in the CEC’s by reordering expenditure priorities and
reorganising the tax system. The study focuses on the structural, market-oriented fiscal reform
which can be guided by the following traditional principles of government action: Efficiency,
Equity, Macroeconomic stability, taking into account the more specific constraints of feasibility
and sustainability in transition countries.
This paper relies mainly on cross-country comparisons to assess budgetary priorities and burdens.
Reforms should not necessarily imitate the fiscal structure found in the other parts of the world.
Nevertheless, persistent differences should be justified by specific conditions or specific
objectives of the CEC in the people’s and taxpayers’ interests.
5
1.1. Comparative budgetary structure : Some statistical facts
Some stylised facts of comparative budgetary structure (see Table 1a) are as follows :
(1) A very high but somewhat declining share of GDP is redistributed by the general government
in a typical CEC.
(2) For the structure of government revenues (see Table 1a) three facts stand out:
� The reliance on the indirect taxes (including domestic taxes on goods and services or turnover
taxes & international trade taxes) was 'low', but is rising .
��The share of social security contributions in government revenue is already higher than in the
OECD and is expected to rise.
��Reliance on personal income and property taxes is low, but reliance on profit taxes used to be
very high and it declined sharply.
� .
(3) Comparing the structure of expenditures (see Table 1b) reveals four key orientations:
� CEC have reached high level of social security outlays , which amounted for 45% of total
expenditure in 1992. In Asian and Latin American countries ( with lower GDP per capita and
low government spending), social expenditure is only 14% while some of them experience fast
real GDP growth.

6
Table 1a. Regional Breakdown of Economic Performance
Indicator
Regional Unweighed Averages
OECD
1992
Central Europe Asia &Latin America
1992
1988/89without Slovenia
1992
GDP per capita in current$
19489 n.a. 3379 2356 (withoutSingapore)
GovernmentExpenditure in % ofGDP
44.33 54.2 50.8 19.91
GovernmentRevenuein % of GDP
42.6 50.7 47.6 19.77
Inflation Rate 8.14 n.a. 27.73 14.29 (withoutArgentina)
Unemployment Rate 8.50 0.0 11.90 4.67
Direct Taxes in % ofExpenditure
33.65 24.78 20.52 30.56
Indirect Taxes in % ofExpenditure
29.07 29.89 31.10 55.49
Social SecurityContributions in %ofExpenditure
22.99 24.48 33.47 8.63
Borrowing and others in% of Expenditure
14.29 20.85 14.91 5.32
Source: Fakin & de Crombrugghe (1996), p.6.

7
Table 1b. Regional Breakdown of Government Expenditure by Type
Type ofGovernmentExpenditure byFunctionin % of TotalExpenditure
Regional Averages Type ofGovernmentExpenditure byEconomicClassificationin % of TotalExpenditure
OECD Central Europe Asia &
Latin America
1988/89 (*) 1992
SocialSecurityOutlays
34.54 21.16 43.49 13.78 SocialSecurityOutlays
Subsidies 2.03 24.62 7.96 27.96 Subsidies
EconomicServices
10.59 18.90 16.74
Health 12.62 13.20 7.07
Education 12.35 8.58 15.09
Defence 2.54 1.73 11.72
13.61 8.08 13.33(*) 21.94 Wages
6.64 5.62 4.15 17.52 Investment
General PublicServices &Other
25.33 6.14 7.64
43.18 40.52 31.07 18.8 Goods andServices & Other
Source: Fakin & de Crombrugghe (1996), p.7.
Note: (*) Data for Slovenia are non available.

8
�Explicit subsidisation remains above the OECD average but has been reduced significantly.
Under central planning, subsidies complemented taxes as instruments of the plan . Implicit
subsidies (usually not reported) remain widespread. They take the form of tax reductions and in
some cases privileged credits.
�CEC devote a higher share of their expenditure on health than on education. The converse
applies in Asian and Latin American countries, while OECD countries give about the same share
to each (12%). Given the potential contribution of education to growth and even to health, the
priorities of the CEC’s seem awkward.
�Government investment fell quite dramatically under the recent financial pressures on the
budget . This might be seen as a missed opportunity for growth, especially in the field of
infrastructural investment.1
To conclude, the current situation in the CEC, with increased transfers and government wages
may indicate (especially with coalition governments) :
First, unsuccessful fiscal adjustment with insufficient deficit reduction and loose
expenditure policy2,
Second, the preference for care over opportunities3.
1See also de Crombrughe and Lipton (1994).2 Alesina and Perotti (1995).3Opportunities dominate in Asia, where subsidies are actually lower than in Latin America and targeted towardsbusiness development rather than business protection (Rodrik, 1995). See also de Crombrugghe, (1994).

9
1.2. The questions
The dramatic change of macroeconomic policy environment after the beginning of transition in
1989 forced most of transition countries into budgetary retrenchment and structural adjustment.
The analysis in section 1.1. appears to suggest that social transfers and efficiency of
government spending represent two main challenges for the long-term sustainability of
budgetary and policy choices in transition economies.
From the policy perspective the following questions are extremely important. Does « big »
governments in the CEC spend efficiently taxpayers’ money? If the social transfers are « too
high », what are the structural determinants of social transfers (pensions)? How do the size of
the government and the level of social transfers affect intergenerational equity (i.e. equality in
current income)? If CEC are to initiate fiscal adjustment in the field of social spending, which
pension reform strategy should they pursue? And last but not least, how to pay for the cost of the
pension reform?
1.3. The outline
The paper is organised as follows. Section 2 briefly reviews the literature. Section 3 uses
regression estimates to identify the main determinants of taxes and expenditure across countries.
The focus is on the impact of the age structure of population and the retirement policy on social
transfers across countries. In section 4 we discuss the results of non-parametric efficiency
analysis, and possible avenues for budgetary reform and saving. Section 5 provides a policy
recommendation. It stipulates various ways of financing a transition to the multipillar pension

10
system and its implications for the efficiency of public spending. Section 6 concludes. Sample
and variable description are given in appendix.
2. A brief literature review
Although of extreme policy relevance in the periods of structural reforms, changes in the
composition of a government’s budget are usually omitted from standard macroeconomic
analysis. A comprehensive theory of public expenditure is still missing; the existing literature is
mainly empirical. Our paper draws from four strands of this literature. The first is the
comparative analysis of patterns of government expenditure (and taxation ). Heller and Diamond
(1990) observed in developing countries a marked change in expenditure priorities away from
fixed assets and capital transfers toward interest, subsidy and transfer payments. Burgess and
Stern (1993) studied tax structure in developing and industrial economies to uncover patterns of
taxation most suited to different types of countries. Studies of transition countries focus on the
relation between budget balance and budget composition (Transition Report, 1994; Barbone and
Marchetti, 1995; Barbone and Polackova, 1996; Dabrowski, 1995, Fakin and de Crombrugghe,
1996; Sachs, 1995; World Development Report, 1996). They all note a fast expansion in social
welfare expenditure. A second source is the work on fiscal adjustments in OECD countries
especially, the observation by Alesina and Perotti (1995) that countries which did not restructure
the expenditure were less able to maintain fiscal equilibrium. Our third source is the literature on
non-parametric efficiency analysis (Tulkens, 1993), more specifically the cost-efficiency
approach which was applied to the Belgian municipalities by Vanden Eeckaut, Tulkens and
Jamar (1993). Fourth, the policy implications of our empirical analysis can be related to a vast

11
policy-oriented literature4 on: (i) the choice of a tax system (Musgrave & Musgrave, 1984;
Newbery, 1993 & 1995), on the design of a social security system (Feldstein, 1974; Hombug,
1990; Breyer and Stroub, 1993; Averting the Old-Age Crisis, 1994; Gruner, 1995;), and on the
growth-diminishing effect of distortionary taxes and growth-enhancing effect of productive
government services (Barro, 1990 & 1991; Barro and Sala-i-Martin, 1995; Cashin, 1994; de
Long and Summers, 1991; Sachs and Warner, 1996).
3. Structural determinants of social transfers
3.1. General environment
Social transfers have been identified as a major and growing item of total government
expenditure in transition countries. Moreover they appear as a distinctive feature compared to the
other countries. A first step in the analysis is to try to find the structural determinants of social
spending as a part of the overall tax and expenditure policy of a broad sample of countries.
In Table 2, the main components of public revenue and expenditure are regressed on the key
constraints identified in the literature: income per capita (at purchasing power parity) and the old-
age dependency ratio (number of people younger than 65 years). Regional Dummies are added for
Central Europe (Dummy 1), Latin America (Dummy 2) and Western Europe (Dummy 3). The base
year for cross-country regressions is, given the availability and comparability of statistical data, the
year 1992.
4 Detailed discussion of this source would exceed the purpose of our study.

12
The seemingly unrelated regression (SUR) method has been used. It exploits more efficiently the
information contained in the residuals. The SUR estimation (Zellner, 1962) deals with the
unobserved country specific determinants of expenditure across equations which may be the same.
Indeed there is some correlation between the residuals for some countries across single equations.
In addition, we effectively deal with shares of different categories of government spending in GDP.
The following results are relevant to the social security transfers.
(1) Income per capita is a significant determinant of the share of social spending in GDP as of
the shares of total, health and education expenditure in GDP. On the revenue side income per capita
explains weakly the share of social security contributions in GDP. It has a significant positive effect
on direct taxes an a negative one on indirect taxes. 5
(2) The age structure of population, i.e. old-age dependency ratio (DDO is the ratio of working-
age population and the old people), has no significant effect on (total and) social spending once
the « European Effect » (i.e. the oldest populations in the sample) is taken into account. It still has a
marginally significant effect on health expenditure.
It is interesting to note, that another structural variable, the share of population living in cities
turned out to be globally insignificant, while it was itself strongly correlated with GDP per capita
and the Latin American dummy. In addition, the acceptance of inequality could have played a role.
5 The positive relation between income per capita and total spending (EXPGDP is total public expenditure in % ofGDP) is especially significant when purchasing power parity adjusted GDP (GDPHS) is used rather than the currentdollars (GDP$WB, see Table on p.33 in Fakin and de Crombrugghe, 1996). A positive relation can be explained bya high cost of a number of public goods and social provisions included in public spending. It is also difficult to taxpoorer and rather informal economies. The estimated regression coefficients are higher with GDPHS than withGDP$WB (compare Table 2 with Table on p.33 in Fakin and de Crombrugghe, 1996). This is in line with the

13
But the ex-post measures that we have (like the share of income in the richest decile), performed
poorly in this broad sample, while showing some negative correlations with GDP per capita, the
Western and Central European dummies and a positive correlation with Latin America.
(3) In addition to the income per capita effect there is an even stronger « European Effect » in
social spending and in social security contributions6. The coefficients for the CEC Dummy are
even larger than those for the European Union. It means that experiences and policy solutions from
the OECD are of direct relevance for reforms in the CEC.
emparical observation that rich countries have a lower GDP in purchasing power parities than in current $, while thecontrary is true for poor countries.6 Speaking of regional effect, the positive correlation of subsidies of Latin America (Dummy 2) is noteworthy.Subsidies are relatively difficult to explain with structural variables. They are discretionary and despite some successtories in Asia, their contribution to the economic performance remains uncertain.

14
Table 2. SUR Estimates for Taxes and Functional Expenditure (GDPHS)
Const DUMMY1
DUMMY2
DUMMY3
DDO GDPHS R2 F
SOCIAL -0.31(-0.6)
14.73(5.29**)
1.47(0.86)
7.69(3.84**)
-0.02(-0.07)
3.89 E-4(1.93+)
71.6 16.2
DIRECT -4.87(-0.94)
5.56(1.88+)
-1.03(-0.56)
5.79(2.76**)
0.58(1.83+)
9.45 E-4(4.35**)
58.1 8.89
TTAXGDP 13.70(4.44**)
3.72(2.04*)
-1.97(-1.68)
3.98(3.13**)
-0.26(-1.33)
2.72 E-4(-2.03*)
56.6 9.1
SOCGDP 3.66(0.86)
15.96(6.41**)
1.57(1.00)
7.33(4.04**)
-0.31(-1.21)
6.16 E-4(3.54**)
84.2 33.1
EXPGDP 17.28(2.77**)
25.38(6.80**)
-3.27(-1.36)
17.37(6.67**)
-0.01(-0.03)
11.97 E-4(4.44**)
87.1 47.2
SUBSIDY -0.51(-0.14)
2.53(1.21)
3.20(2.54*)
1.37(0.92)
0.33(1.49)
2.30 E-5(0.15)
34.5 3.5
HEALTHGDP 3.95(1.83+)
-0.10(-0.08)
-0.28(-0.36)
0.41(0.48)
-0.25(-1.91+)
3.76 E-4(4.06**)
77.5 23.4
EDUGDP 2.39(1.49)
1.17(1.29)
-0.50(-0.91)
1.01(1.57)
0.005(0.05)
1.77 E-4(2.65*)
57.2 8.0
Legend:highly significant ... ** < 0.01significant ... * < 0.05marginally significant ... + < 0.10+ or - denotes the sign of estimated regression coefficient
Method of estimation: SUR i.e. seemingly unrelated regressions (Zellner, 1962).See Appendix III for variable descriptions and rules of presentation.
Source: Fakin and de Crombrugghe (1996), p.9; see also pp.33-34.

15
3.2. Early retirement and the generosity of the pension system
Apart from the global significance of GDP per capita, the aggregate analysis identified a strong
« European Effect » for social transfers, total expenditure, and for social contributions. The CEC
have a low income per capita, but seem to follow West-European patterns in social transfers, rather
than take their place on the income line. This section tries to see whether this ‘European specificity’
can be explained (see Table 3 below) in a ‘narrow sample’ of OECD and CEC.
Table 3. Social Transfers, Government Wages and Effective Dependency Ratios
- DDO GLABOUR SOCWAGE UNEMPLOY R2
FObs.
Missing/Residuals
ADR-
-0.25(-4.45**)
-0.02(-3.83**)
- 0.03(4.80**)
60.310.124
None/Slo. -0.2Po. -0.2
ADR-
-0.25
(-3.97**)
-0.02(-3.57**)
-0.002(-0.97)
0.03
(4.84**)
64.77.722
None/Cz.R. +0.1Po. -0.1
GDP$WB(* 10E-4)
DDO GLABOUR SOCWAGE TRANSFER R2
F
Obs.
Missing/
Residuals
SOCEXP - -3.23(-1.51)
-0.53(-2.44*)
0.38(5.16**)
- 62.610.022
None/Cz.R.-10.8Po. -8.0Slo. +8.2
SOCGDP - -2.33(-2.90**)
- 0.28(8.53**)
- 78.436.823
None/Cz.R. -5.2Po. -4.0
WAGESEXP -6.32(-3.31**)
- - - -0.25(-3.55**)
61.715.322
Slo./Hu.. -6.6Cz.R. -8.3
Note:In the regression for WAGESEXP, GDPHS as well as DUMMY1 were significantly negative, the latter beingaccompanied with stronger income effect. ADR was marginally significant and positive. GINVGDP was significantlypositive. Regressors GINVEXP, POPULATION and UNEMPLOY were nonsignificant.
Regressors DUMMY1, GDPHS, POPULATION, INEQUAL, UNEMPLOY, ADR, GINVGDP, GINVEXP were neversignificant in the regressions for SOCEXP and SOCGDP. In ADR regressions INEQUAL, INVGDP, SOCGDP werenever significant. DUMMY1 was highly significant in combination with UNEMPLOY and GLABOUR, whereGLABOUR turned out to be insignificant and R2 was only 46.3.
See Appendix III for variable description and rules of presentation.

16
First, we try to explain the actual number of retirees, measured by the actual dependency ratio
(ADR). Second, we examine the relation between shares of social expenditure in total public
spending and in GDP (SOCEXP & SOCGDP) with demography and income policy choices.
The actual dependency (ADR) is largely explained by the demographic dependency ratio (DDO),
as could be expected. The generosity of the benefits, measured by the wage replacement rate
(SOCWAGE) seems however to have no effect on the actual number of retirees of the countries
in the sample. Other variables nevertheless have a small but significant effect: the share of
government employment in total employment (GLABOUR, negative effect) and the
unemployment rate (UNEMPLOY, positive effect). This last variable indicates that early
retirement is a way to deal with unemployment, but not to eliminate it. Job security in
government reduces the cases of early retirement and may actually be a substitute for it in case of
labour market problems. These observations point to the eligibility rules in the determination of
the number of retirees.
Social expenditure as a share of government expenditure (SOCEXP) or as a share of GDP
(SOCGDP) depends upon the number of retirees as expected, but also and very significantly
upon the generosity of the benefits (SOCWAGE). Given the previous observation on the number
of retirees, simultaneity problems in the econometric estimation can be expected to be minimal.
Nevertheless we preferred to use the demographic dependency ratio DDO as a regressor here
rather than the actual one (ADR).

17
Our observations have important retirement policy implications: The absence of relation
between the number of retirees and the benefits they earn gives governments two independent
policy instruments: eligibility rules and the generosity of the benefits. With a given social
security budget it would thus be possible to raise pensions and tighten access, or the converse. It
should also be possible to reduce the relatively large burden of social expenditure by raising the
effective retirement age, keeping benefits constant.
The absence of relation between income per capita and retirement or retirement spending is
noteworthy. In the larger sample of Table 2, there was a positive relation but also a strong
European effect. In fact most of the European countries of the OECD and the Central Europe
were above the income line. It is thus normal that the relation vanished in the smaller sample.
The purpose of Table 3 is to explain the determinants of the European effect.
It is also interesting to point to two variables which tend to reduce government wage expenditure:
income per capita and social transfers. The negative relation with income per capita was also
present in the larger sample for the SUR regressions of the economic classification of
expenditure (Fakin and de Crombrugghe, 1996, Table 2b). Rich countries seem to have found a
way to master their wage expenditure despite usually higher wage levels and higher relative wage
costs. For any given level of income per capita, the possibility to substitute government wage
expenditure for social transfers seems to be present as it is for government employment as a
substitute for early retirement.
18
To conclude generally on pensions and government employment: It seems that national
preferences dominate price and income effects. Some governments just choose to retire more
people, other to employ more of them.7 Most governments choose retirement when they also face
unemployment. The total cost of high unemployment and abundant retirement is usually high.
But the generosity of the individual transfers (SOCWAGE) can vary, and so explains the cost of
the policy, given the number of beneficiaries.8 The number of beneficiaries is indeed controlled
administratively by the design of the pension system - and is, assuming that pensions are usually
attractive, the result of an independent policy choice. Specifically, the problems with high
social security outlays in the CEC are largely due to the excessive number of early retirees,
i.e. to loose eligibility criteria for early retirement under the current pensions systems.
3.3. Expenditure policy choices
Finally we note (see Table 4) that total government expenditure in the OECD and CEC’s tends
to be independent of income per capita - as is social expenditure - but to be related to specific
policy choices. Unequality, measured by the share of income of the 10 percent richest, appears as
a key determinant for low government spending in the sample.9 Egalitarian countries tend to
spend more as do countries with a large government payroll or with generous pension benefits
7 For the unemployment problem in Europe compared to the United States a similar idea is expressed in CEPR(1995).8 It is important to clarify that pensions are not too high in the sense that they would attract a lot of people into earlyretirement out of the labour force. ‘The incentive effect’ of pensions is in fact ruled out by the institutionalizedeligibility criteria (under pay-as-you-go systems). Rather, in some countries pensions may be too high because, giventhe number of pensioners, the replacement rates (SOCWAGE) are too high.9 We could not find the same relation between social spending and unequality. Other elements of total spendingplay an egalitarian role, possibly government employment. Social spending depending on the way it is targeted andthe way it raises the income of the insiders at the expense of the outsiders could also contribute to unequality.Further research would be needed.

19
(SOCWAGE). The high government expenditures are also linked with a low share of investment
spending in the total (GINVEXP).
The low investment of high spenders may be a cause of a slower growth of income per capita in
the long run. We have not been able to test this growth effect, especially given the limited
significance of any recent growth figures for Central Europe. Nevertheless referring to the
literature quoted in the section 2, it can be expected that low investment and large tax distortions
are harmful for growth. Social security can be efficiency enhancing in the few cases where it
raises the productivity of the labour force by selecting the most productive workers but its
financing on a pay-as-you-go basis can have negative effects on investment and hence on growth.
Table 4. The Size of Public Redistribution
GDPHS(* 10E-3)
INEQUAL GLABOUR GINVEXP TTAXREV SOCWAGE R2
FObs.
Missing/Residuals
EXPGDP - -0.99(-2.26*)
0.54(2.69*)
-0.91(-2.62*)
- 0.12(1.90+)
82.416.419
Cz.R./Hu. -5.3
Note:Regressors DUMMY1, DDO, ADRDDO, ADR were not significant. DEBTGDP was marginally significant in aregression with INEQUAL and GLABOUR.See Appendix III for variable description and rules of presentation.Source: Fakin and de Crombrugghe (1996), p.12.
The regression analysis of total and social expenditure thus shows that the CEC’s and many of
the other European countries are off the income line and have opted for generous and/or
easy accessible social transfers, large government payrolls and egalitarian distribution of
income. They face nevertheless high unemployment and low investment rates. We leave the
growth effects of these choices to the other branches of the literature. We now turn to another

20
type of evaluation of these policy choices: the efficiency analysis. This is necessary to see
whether the high spenders dominate the low spenders in a number of performance indicators
related to government action and public welfare or should learn from countries which perform as
well at a lower cost.
4. Efficiency of public spending
The medium-term strategy for the reform of the budget should include elements for monitoring
the efficiency of government performance. Non-parametric efficiency analysis (Tulkens, 1993;
Vanden Eeckaut, Tulkens, Jamar, 1993) is just an example of how the efficiency of government
spending can be tested.10 It compares a number of outputs (government services) with the input
cost (represented by the aggregate government expenditure). The output indicators used in the
illustrative test were: patents, university entry, infant mortality, life expectancy, old-age
demographic dependency ratio and telephone mainlines. This list includes two important
parameters of the pension system namely demographic dependency ratio and life expectancy.
Each output indicator is a full variable and it is never weighted. A country is identified as
inefficient only if there is another country which does better in all output indicators with no
more government expenditure. A better performance than the lower spenders in any single
indicator saves a country from inefficiency. The results are summarised in Table 5 below.
10 For the conceptual framework, and its application to the poverty problems and corresponding social expenditurepolicies see Cornia et.all. (1987), and Pleskovic & Sivitanides (1993).

21
Table 5. Summary of Cost-Inefficiency Cases
Inefficient EXPGDP Potentialrevisions ofspending inthe sample
Expenditureper capita inPPP
Potentialrevisions ofspending inthe sample
Expenditurein current $per capita
Potentialrevisions ofspending inthe sample
Belgium 55.2 1 10024 1 - -
Hungary 54.5 7 - - - -
Italy 51.3 1 9095 1 10496 1
Poland 50.7 15 - - - -
Slovenia 49.4 10 5335 2 - -
CzechRepublic
48.5 7 - - - -
Greece 47.1 2 - - - -
Portugal 39.3 1 - - - -
Note: See Appendix II for details.Source: Fakin and de Crombrugghe (1996), p.23; 22-25 for detailed description of results.
Judged by the sample of the OECD and CEC’s, the striking result is that a transition economy
can find between 7 and 15 countries11 which spend a lower share of current GDP, and reach
better results on all the performance indicators selected for the test. It may seem that the private
sector in CEC can contribute to the satisfaction of our performance indicators. This doesn’t
invalidate our indicators at all. On the contrary, it reminds especially transition countries that the
welfare objectives of the society require a government intervention only where there is a
demonstrated market failure. Furthermore, such an intervention doesn’t always take the form of
direct provision of services but also (above all) the form of regulation 12.
11 The list of countries is given in appendix III.12 As for instance, an old-age income insurance under a funded pension system rather than state pensions on a pay-as-you-go basis.

22
An additional output indicator, which has not been used to set up Table 5 is the degree of
income inequality. If the income inequality is measured by the share of income of the 10 percent
richest, the CEC’s and Belgium would become efficient because all the countries whose
government spends less have a more unequal income distribution. The share of income of the 40
percent poorest is probably a better indicator of the social role of the state. Using this indicator, it
is still possible to find a few countries where the poor get more while the government spend less
than in Belgium and the CEC’s. This discussion of income redistribution also shows the price at
which it comes: huge government expenditures and poor performances in all other indicators of
public action. Newbery (1993 and 1995) also suggests that the reforming CEC’s could tolerate
some increase in income unequality in order to achieve a better overall performance.
It thus seems plausible that CEC could lower their government expenditure and/or
restructure in favour of infrastructure, retraining and market -oriented tertiary education .
Such fiscal adjustment can be expected to improve their medium-term performance in efficiency
indicators, and to enhance long-run economic growth. The question is, how to shift government
spending away from social transfers?
5. Pension Reform
The CECs’ governments are facing the problems of: (i) high social security outlays due to loose
eligibility criteria under the current state pay-as-you go pension system, and (ii) given the
structure of government expenditure, relatively low efficiency of public spending. To solve these
problems the CECs should reach social consensus on the reform of future pension rights. In

23
other words, they should introduce a multipillar pension system13, which would recognise the
diversity of national circumstances and operationalise the introduction of a country-specific
combination of the two pure pension systems: capitalisation system and pay-as-you-go-system. It
is important to note that: First, the introduction of a (partially) funded system creates an extra
cost, as when a pay-as-you-go system was introduced the first generation of retirees was made
strictly better-off. Second, if the transition from the present state pay-as-you-go system is
successful, the pension reform would be growth enhancing. Third, selective generosity and in
particular, eligibility criteria are much less of a financial problem under a funded pension
system.14 The crucial question therefore is: Which tax instruments are to be used to finance
transition?
Based on the theory a transition from a pay-as-you-go to capitalisation system can be financed by
different tax instruments: (1) lump-sum contributions (Breyer and Stroub, 1993) in the form of
an uniform ceiling of maximal pensions, (2) consumption tax (Feldstein, 1994), (3) external or
public government debt (Hombug, 1990), (4) state assets (International Institutions), and (5)
inheritance (wealth) taxation or taxation of bequests (Gruner, 1995). There are however a few
practical limitations which has to be taken into account. Further increases of indirect taxation
(i.e. introduction of environmental taxes and/or increased sales taxes) would indeed improve the
efficiency of the tax system and increase public income generating capacity15, but might be
13 Following the proposition made by International institutions (Averting the Old-Age-Crisis, 1994), the pensionsystem would have three pillars: Pillar 1 is a mandatory, tax financed, public pay-as-you-go system; Pillar 2 ismandatory and fully funded pension system; and Pillar 3 is private owned and fully funded.14 We demonstrated (see Table 3) that one of the main factors of excessive social transfers is selective generosity.Pensions in the funded system are unequal because savings are unequal and not because of unequal expenditure.Furthermore, eligibility criteria are not such a problem under the funded system as the retirement date is a function ofsavings. To the contary, under the state pay-as-you-go system retirement date is uniformly legislated.15 Measured as a share of revenues in GDP.

24
detrimental to the intergenerational equity (i.e. equality in current income). Inheritance taxation
doesn’t seem to be a practically viable solution, as the share of wealth taxes in government
revenues in most of developed countries account for less than 3% of GDP. Similarly, lump-sum
contributions can not be practically implemented. We therefore propose that CECs finance the
pension reform by a combination of: (i) external or public government debt (ii) state assets
canalised from privatisation programmes, and given the results of our analysis, (iii)
efficiency gains16 from lowering and restructuring of public spending, and possibly, by
further increases in sales taxes and introduction of environmental taxes.
6. Conclusions
In summary, the main findings of comparative analysis of patterns of government expenditure
and taxation in CECs vs. OECD countries are as follows. First of all we found a strong
« European Effect », which indicate that CEC are not so much different from OECD countries for
social security contributions and outlays. Consequently, experiences and policy solutions from
the OECD do matter for the CEC. Second, regression analysis demonstrate that the problems
with social security spending is largely due to loose eligibility criteria for early retirement, i.e. to
a large number of early retirees. Third, non-parametric efficiency analysis reveals « cost-
inefficiency » of transition governments. It seems that CEC the could enhance their efficiency by
lowering and restructuring their government expenditure. The reform of future pension rights
would contribute to this end. Fourth, it is recommended to introduce a country-specific
multipillar pension system . The transition from current pay-as-you-go to capitalisation system
16 Expenditure management is most likely growth-enhancing and increases the amount of fiscal revenue given theshare of taxes in GDP.

25
need to be financed by a combination of : (a) government debt, (b) state assets derived from
privatisation, (c ) efficiency gains from expenditure management.

26
7. Appendix
I. Regression Estimates
a) A NOTE ON THE REGRESSION TABLES 2,3,4.
The tables always contain the following information:
Equations are in rows. Independent variables (regressors) are on top of each column.
R2 is the determination coefficient.
T-statistics are in parenthesis.
Significance levels are indicated as follows ** < 1%, * < 5%, +< 10%.
Symbols for variables with description are given in the table "List of Variables and Country Samples and Dummy
Variables", below.
Single regressions were estimated for an alphabetically ordered sample of OECD and Transition countries.
Missing observations and residuals are explicitly named for transition countries only.
(Abbreviations: Cz.R. for Czech Republic, Hu. for Hungary, Po. for Poland, Slo. for Slovenia)
Residuals are given for transition countries when they exceed the one-standard-deviation band.
b) Seemingly Unrelated Regressions were estimated for an alphabetically ordered sample of OECD, Transition
countries, Latin American and East Asian Countries.

27
II. Non-Parametric Efficiency Analysis
Table. Efficiency Analysis
Inefficient EXPGDP Degree Comparator EXPPP Degree EXP$ Degree
BELGIUM 55.2 95.8 NORWAY 10024 95.2 - -
Hungary 54.5 64.2 70.3 72.8 81.5 83.9 89.0 97.1
Switzerland SpainUnited Kingdom Germany Austria France Norway
- - - - - - -
- - - - - - -
- - - - - - -
- - - - - - -
ITALY 51.3 89.1 AUSTRIA 9095 92.2 10496 97.4
Poland 50.7 50.1 69.0 71.8 72.2 73.2 75.5(77.5 78.3 82.6 87.6 90.1(92.9 94.5 95.7(97.4
Japan Switzerland USA Australia New Zealand Spain Portugal)United Kingdom Ireland Germany Austria Greece) Canada France Slovenia)
- - - - - - - - - - - - - - -
- - - - - - - - - - - - - - -
- - - - - - - - - - - - - - -
- - - - - - - - - - - - - - -
SLOVENIA 49.4 51.4 70.9 74.9 75.1 80.4 84.8 89.9 92.5 97.0 98.2
JAPAN Switzerland Australia New-ZealandUnited Kingdom IRELAND Germany Austria Canada France
5335 - - - - - - - - -
96.0 - - - - 94.8 - - - -
- - - - - - - - - -
- - - - - - - - - -
Czech Republic 48.5 72.2 75.1 79.0 81.9 91.5 94.2100.0
Switzerland USA SpainUnited Kingdom Germany Austria France
- - - - - - -
- - - - - - -
- - - - - - -
- - - - - - -
Greece 47.1 74.3 97.0
Switzerland Austria
- - - -
Portugal 39.3 87.1 Switzerland - - - -

28
Note:EXPPP = EXP$/$PPP where EXP$ = (EXPGDP*GDP$WB)/100. and $PPP = GDP$WB/GDPPPWBwhere: EXPPP ..... government expenditure per capita in 1992 purchasing power dollars, EXP$ ..... governmentexpenditure per capita in 1992 US$, $PPP ..... the dollar price of one unit of PPP, PPP ..... purchasing power parity of1 US$.Source: Fakin and de Crombrugghe (1996), pp.30-31.

29
III. List of Variables and Country Samples with Dummy Variables
Table . List of Variables with Symbols
SYMBOL VARIABLE
ADR actual dependency ratio (RETIREES/EMPLOYED)
DDO old age demographic dependency ratio (i.e. working age population (15-64)/old people
(65 and 65+))
DIRECT direct taxes in % of GDP (direct taxes = corporate taxes + individual taxes)
DIRTAX direct taxes in % of taxes, fees and contributions (DIRECT/TAXES*100)
DUMMY 1 transition dummy
DUMMY 2 Latin-American dummy
DUMMY 3 European union & Norway dummy
EDUGDP public expenditure on education in % of GDP
EMPLOYED employees in thousands
EXPGDP total public expenditure in % of GDP
EXP$ the 1992 US$ total government expenditure per capita (EXPGDP*GDP$WB/100)
EXPPP the 1992 purchasing power parity dollar total government expenditure per capita
(EXP$/$PPP)
GDPPPWB GDP per capita in the 1992 purchasing power parity dollars
GDP$WB GDP per capita in current international $
GDPHS Heston-Summers gross domestic product in purchasing power parities per capita
GINVEXP government investment in % of total public spending (GINVGDP/EXPGDP * 100)
GINVGDP government investment in % of GDP
GLABOUR government employment in % of total employment employees in public administration and
defence, education services, medical and health services, and other in % of total
employment
HEALTHEXP health expenditure in % of total public spending
HEALTHGDP health expenditure in % of GDP (HEALTHEXP*EXPGDP/100)
INDIRECT indirect taxes in % of GDP (indirect taxes = domestic taxes on goods and services +
international trade taxes +'other')
INEQUAL inequality (percentage share of income or consumption in the highest 10% of income
distribution)
INFANTM infant mortality per 1000 of live births

30
continued
SYMBOL VARIABLE
INFL inflation rate (average ) in %
INTAX indirect taxes in % of taxes, fees and contributions (INDIRECT/TAXES*100)
LIFE life expectancy at birth in years
LIQUID liquidity (quasi money for 1992 divided by GDP in current prices for 1992)
PATENTS total patent applications per 100.000 of population
POPULATION total population in thousands
REVGDP total public revenues in % of GDP
RETIREES POPULATION-labour force (employed+unemployed) - young (age group of 0-14)
SOCEXP social transfers in % of total public expenditure (SOCGDP/EXPGDP*100)
SOCGDP social transfers in % of GDP
SOCIAL social security contributions in % of GDP
SOCTAX social security contributions in % of taxes, fees and contributions
(SOCIAL/TAXES*100)
SOCWAGE replacement rate or pension-wage rate (SOCGDP/WAGEGDP*100)
SUBSIDY share of subsidies in % of GDP
TAXES Taxes, fees and contributions in % of GDP (TAXES =indirect taxes + direct taxes +
social security contributions + compulsory fees, fines and penalties)
TAXGDP total tax receipts & social security contributions in % of GDP
TELEPHONES telephone mainlines per 1000 of inhabitants
TERTIARY university education rate (proportion of age-group concerned per thousand of age-group
entering tertiary education)
TRANSFER subsidies and current transfers in % of total expenditure and lending minus repayments
TTAX turnover tax (taxes on goods and services) & tariffs in % of TAXES
TTAXGDP turnover tax (& tariffs) in % of GDP (TTAX * TAXGDP /100)
TTAXREV turnover tax (& tariffs) in % of total public revenues
(TTAXGDP/REVGDP * 100)
UNEMPLOY unemployment rate
WAGESEXP share of wages in government expenditure
$PPP the dollar price of one unit of purchasing power parities (GDP$WB/GDPPPWB)
31
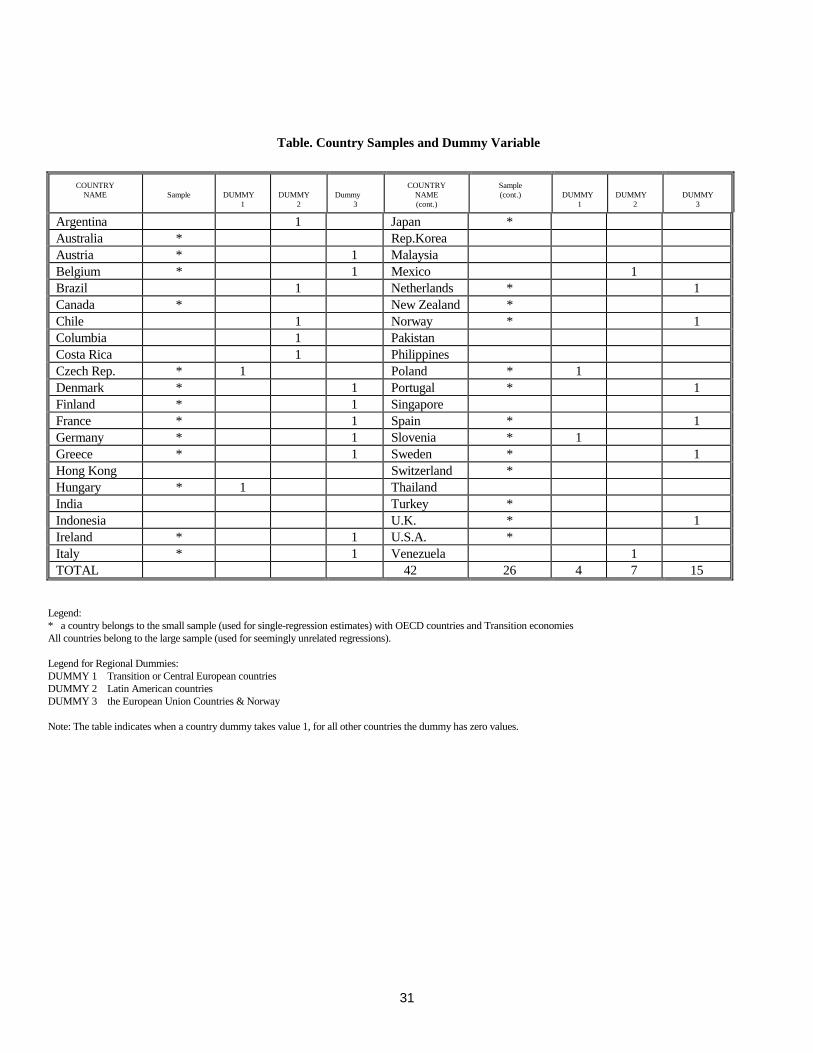
Table. Country Samples and Dummy Variable
COUNTRYNAME Sample DUMMY
1DUMMY
2Dummy
3
COUNTRYNAME(cont.)
Sample (cont.) DUMMY
1DUMMY
2DUMMY
3
Argentina 1 Japan *Australia * Rep.KoreaAustria * 1 MalaysiaBelgium * 1 Mexico 1Brazil 1 Netherlands * 1Canada * New Zealand *Chile 1 Norway * 1Columbia 1 PakistanCosta Rica 1 PhilippinesCzech Rep. * 1 Poland * 1Denmark * 1 Portugal * 1Finland * 1 SingaporeFrance * 1 Spain * 1Germany * 1 Slovenia * 1Greece * 1 Sweden * 1Hong Kong Switzerland *Hungary * 1 ThailandIndia Turkey *Indonesia U.K. * 1Ireland * 1 U.S.A. *Italy * 1 Venezuela 1TOTAL 42 26 4 7 15
Legend:* a country belongs to the small sample (used for single-regression estimates) with OECD countries and Transition economiesAll countries belong to the large sample (used for seemingly unrelated regressions).
Legend for Regional Dummies:DUMMY 1 Transition or Central European countriesDUMMY 2 Latin American countriesDUMMY 3 the European Union Countries & Norway
Note: The table indicates when a country dummy takes value 1, for all other countries the dummy has zero values.

32
8. References
Alesina, A. and Perotti, R. (1995). ‘Fiscal Expansions and Adjustments in OECD Countries ’, Economic Policy.
Averting the Old Age Crisis: Policies to Protect the Old and Promote Growth, Oxford University Press, New York,1994.
Barbone, L. and Marchetti, D. Jr. (1995). ‘Transition and the Fiscal Crisis in Central Europe’, Economics of Transition.
Barbone, L. and Polackova, H. (1996). "Public Financees and Economic Transition", MOCT-MOST, nO. 6, PP 35-61.
Barro, R.J. (1990). ‘Government Spending in a Simple Model of Endogenous Growth’, Journal of Political Economy.
Barro, R.J. (1991). ‘Economic Growth in a Cross-Section of Countries’, Quarterly Journal of Economics.
Barro, R.J. and Sala-i-Martin, X. (1995). Economic Growth, Mac-Graw-Hill, New York.
Breyer, F. and Stroub, M. (1993). ‘Welfare Effects of Unfounded Pension Systems when Labour Supply isEndogenous’, Journal of Public Economics.
Burgess, R.S. and Stern, N. H. (1993). ‘Taxation and Development’, Journal of Economic Literature .
Cashin, P. (1994). ‘Government Spending, Taxes and Economic Growth’, IMF Working Paper, WP/94/92, August1994.
CEPR (1995). Unemployment: Choices for Europe: Monitoring European Integration, CEPR, London.
Cornia, G., Jolly, R., Stewart, F., eds. (1987). Adjustment with a Human Face, Clarendon Press, Oxford.
de Long, B. and Summers, L.H. (1991). ‘Equipment Investment and Economic Growth’, Quarterly Journal ofEconomics.
de Crombrugghe, A. (1994). ‘The Polish Government Budget: Stabilisation and Sustainability’ in K. Mizsei (ed.)Developing Public Finance in Emerging Market Economies, Institute of East-West Studies, New-York.
de Crombrugghe, A. and Lipton, D. (1994).’The Government Budget and the Economic Transformation of Poland’, inO.J. Blanchard, O.J. Froot and J.D. Sachs (Eds.), The Transition in Eastern Europe: Volume II: Restructuring, NBER& University of Chicago Press, Chicago.
Dabrowski, M. (1995). ‘Fiscal Crisis in Transformation Period: Trends, Stylised Facts and Some ConceptualProblems’, Center For Social and Economic Research, Warszaw.
Fakin, B and de Crombrugghe, A. (1996). ‘Patterns of Government Expenditure and Taxation in Transition vs. OECDEconomies’, Facultes Universitaires Notre-Dame de la Paix, No.162, Namur.
Feldstein, M. (1974). ‘Social Security, Induced Retirement and Aggregate Capital Accumulation’, Journal of PoliticalEconomy.
Gruner, H.P. (1995). ‘Redistributive Policy, Inequality and Growth’, Journal of Economics.

33
Heller, P.S. and Diamond, J. (1990). ‘International Comparisons of Government Expenditure Revisited: TheDeveloping Countries, 1975-1986’, IMF Occasional Paper.
Hombug, S. (1990). ‘The Efficiency of Unfounded Pension Schemes’, Journal of Institutional and TheoreticalEconomics.
Musgrave, R.A. and Musgrave, P.B. (1984). Public Finance in Theory and Practice (4th Edition), McGraw-Hill, New-York.
Newbery, D. (1993). ‘Tax and Expenditure Policy in Hungary’, Economics of Transition.
Newbery, D. ed. (1995). Tax and Benefit Reform in Central and Eastern Europe, Center for Economic PolicyResearch, London.
Pleskovic, P. and Sivitanides, P. (1993). ‘Priorities for Poor: A Conceptual Framework for Policy Analysis’, Journal ofDevelopment Areas.
Rodrik, D. (1995). ‘Getting Interventions right: How Korea and Taiwan Grew Rich’, Economic Policy.
Sachs, J. (1995). ‘Post-Communist Parties and the Politics of Entitlements’, Transition (World Bank).
Sachs, J. and Warner, A. (1996). ‘Achieving Rapid Growth in Transition Economies of Central Europe’, HarvardInstitute for International Development, Development Discussion Paper, No.544, July 1996.
Transition Report, EBRD, London, 1994.
Tulkens, H. (1993). ’On FDH Efficiency Analysis: Some Methodological Issues and Applications to Retail Banking,Courts and Urban Transit’, The Journal of Productivity Analysis.
Vanden Eeckaut, P., Tulkens, H. and Jamar M.-A. (1993). ‘Cost-Efficiency in Belgian Municipalities’ in H.O. Fried,C.A. Knox-Lovell and S.S. Schmidt (eds.), The Measurement of Productive Efficiency: Techniques and Applications,Oxford University Press, Oxford.
Zellner, A. (1962). ‘An Efficient Method of Estimating Seemingly Unrelated Regressions and Tests for AggregationBias’, Journal of the American Statistical Association.
World Development Report : From Plan to Market, World Bank, Washington, 1996.