barclays plc group reporting changes 2015 & 2014 results ... · ay differ materi ay impact the...
TRANSCRIPT

Barclays PLC
Group Reporting Changes
2015 & 2014 Results Restatement Document

Barclays PLCRestatement
Table of C
Restateme
Overview of R
Performance
Results by Bu
Barclays U
Barclays C
Head Offi
Barclays N
Discontin
Barclays Resu
Performance
C – 2015 & 2014 Document
Contents
ent Docum
Reporting Cha
Highlights
usiness
UK
Corporate & In
ce
Non-Core
ued Operation
ults by Quarter
Management
BARCLAYS PLC,
4 Results
ment
nges
nternational
n: Barclays Afr
r
1 CHURCHILL PLACE
ica
E, LONDON, E14 5HP
1
, UNITED KINGDOM.
TELEPHONE: +44 (0)) 20 7116 1000. COMMPANY NO. 48839
Page
3-4
5-6
7-9
10-12
13
14-15
16-17
18-26
27
e
4
6
9
2
3
5
7
6
7

Barclays PLCRestatement
Notes The term Barclaof millions of Po
Notable items aitems include: ginvestigations agoodwill and otrevision of Educ
Relevant terms Standards (IFRS
The informationStatutory accouBarclays PLC anSection 495 of tthe Registrar of
These results wForm 6-K will awww.sec.gov.
Barclays is a freConsistent withthese results an
Forward-lThis document amended, and Slooking statemematerially from relate only to hi‘target’, ‘projectstatements inclprovisions, busiof growth in thstrategic cost pexpenditures annature, forwardchanges in legiapplication of acof conduct provaddition, factorsthe future strucconditions; the effects of changratings of any eimplementationthese influencesleverage ratios mfactors which mlimitation, our A
Subject to our ongoing informinformation, fut
C – 2015 & 2014 Document
ays or Group refeounds Sterling res
are considered togains on US Lehnd litigation incluther assets relat
cation, Social Hou
that are used iS) are explained in
n in this announunts for the year end Barclays Bank the Companies A Companies in ac
ill be furnished asalso be available
equent issuer in h its usual practic
d other matters r
looking sta contains certainSection 27A of tent is a guarante those contained istorical or currented’, ‘expect’, ‘esude, among othness strategy, cae banking and fiprogramme and nd plans and obje-looking statemeislation, the deveccounting and revisions, the polics including (but n
cture of the Groueffects of contin
ges in valuation oentities within then of the strategics and factors aremay differ materimay impact the Annual Report on
obligations undemation, we undeture events or oth
4 Results
ers to Barclays PLspectively.
o be significant ithman acquisitionuding Foreign Exing to businesse
using, and Local A
n this documentn the Results glos
ncement does noended 31 Decem PLC to the US S
Act 2006 (which dccordance with Se
s a Form 6-K to tfrom the Barclay
the debt capitalce, Barclays experelating to the Gr
atements n forward-lookinghe US Securities
ee of future perfo in the forward-lont facts. Forwardtimate’, ‘intend’, ers, statements pital, leverage annancial markets,the Group Strat
ectives for future ents involve risk aelopment of stanegulatory standarcies and actions not limited to) thep) applicable to p
nued volatility in of credit market e Group or any s cost programme beyond the Grally from the planGroup’s future f Form 20-F for th
er the applicable rtake no obligat
herwise.
LC together with
ems impacting pn assets; the impxchange; gain on es being disposedAuthority (ESHLA
t but are not dessary that can be
ot comprise statmber 2015, whichSecurities and Excdid not make anyection 441 of the
he SEC as soon ays Investor Relat
l markets and reects that from timoup.
g statements wi Act of 1933, as
ormance and thaooking statement
d-looking stateme ‘plan’, ‘goal’, ‘beregarding the G
nd other regulato projected costs tegy Update, run operations, projeand uncertainty bndards and interrds, the outcome of governmentae following may hpast, current andcredit markets; mexposures; chan
securities issued e; and the succe
roup’s control. Ans, goals, and expfinancial conditiohe fiscal year end
laws and regulation to update p
2
its subsidiaries. T
performance andpact of own cre valuation of a cod; losses on sale
A) valuation meth
efined under app accessed at www
utory accounts w included certainchange Commiss
y statements unde Companies Act
as practicable follotions website ww
egularly meets wme to time over t
thin the meanin amended, with
at actual results ots. These forwardents sometimes uelieve’, ‘achieve’ roup’s future finry ratios, paymen or savings, origindown of assetsected employee nbecause they relarpretations unde of current and fu
al and regulatoryhave an effect: cad future periods; market related risges in valuation by such entities;
ess of future acqAs a result, the Gpectations set for
on and performaed 31 December
ations of the Unipublicly or revise
The abbreviations
have been callededit; provisions fomponent of the e relating to the hodology.
plicable regulatow.barclays.com/r
within the meann information reqsion (SEC) and wer Section 498 of2006.
owing their publiww.barclays.com
with investors via the coming quar
g of Section 21Erespect to the G
or other financiad-looking statemuse words such aor other words o
nancial position, nt of dividends (inal and revised c
s and businessesnumbers and othate to future eveer IFRS, evolving uture legal proce
y authorities, geoapital, leverage anUK, US, Africa, Eusks such as chanof issued securit the potential foruisitions, disposa
Group’s actual furth in the Group’snce are identifie 2015), which are
ited Kingdom ane any forward lo
s ‘£m’ and ‘£bn’
d out for each offor UK customer defined retiremeSpanish, Portug
ry guidance or results.
ning of Section 4uired for the Join
which contained af the Companies
ication. Once furn/investorrelation
formal road-shorter it will meet w
E of the US SecuGroup. Barclays c
l condition or pements can be iden
as ‘may’, ‘will’, ‘seof similar meaniincome growth, ncluding dividendcommitments ans within Barclaysher statements thnts and circumst practices with
eedings and reguopolitical risks annd other regulatourozone and globnges in interest rties; volatility in cr one or more coals and other stra
uture results, divis forward-lookingd in our filings we available on the
d the United Staooking statemen
represent million
f the business se redress; provisi
ent benefit liabilituese and Italian
International Fin
434 of the Compnt Annual Report an unqualified au Act 2006) have b
nished with the Sns and from the
ows and other awith investors glo
urities Exchange autions readers t
erformance measntified by the facteek’, ‘continue’, ‘ng. Examples of assets, impairmd pay-out ratios)
nd targets in cons Non-Core, estihat are not histortances. These maregard to the inlatory investigationd the impact ofory rules (includinbal macroeconomrates and foreigncapital markets; countries exiting tategic transactiodend payments,
g statements. Adwith the SEC (ine SEC’s website at
ates in relation tonts, whether as
ns and thousands
egments. Notableons for ongoingty; impairment of businesses; and
ancial Reporting
panies Act 2006. on Form 20-F ofudit report underbeen delivered to
SEC, copies of theSEC’s website at
ad hoc meetings.obally to discuss
Act of 1934, asthat no forward-
sures could differ that they do notaim’, ‘anticipate’, forward-lookingent charges and, projected levelsnection with themates of capital
rical fact. By theiray be affected by
nterpretation andons, future levelsf competition. Inng with regard tomic and businessn exchange rates;changes in credithe Eurozone; the
ons. A number of and capital andditional risks and
ncluding, withoutt www.sec.gov.
o disclosure anda result of new
s
e g f
d
g
. f r o
e t
. s
s -r t ,
g d s e l r y d s n o s ; t e f
d d t
d w

Overview
Barclays PLCRestatement
This documeoutlined in th2014 segmen Segmental r The Gro
requirem– –
Given thBarclays
The Nonassets (R
Barclays UK The segmentPersonal andreported in th Barclays UK bUK ring-fencconsumer creofferings (We With around banking cliento service thexperiences a Barclays CorpThe segmentCorporate an(consisting ofmerchant acq Barclays Corpremaining wInvestment B CIB brings toPayments buoffering, and and consumefurther resilie Barclays AfricOn 1 March intended to bshareholder a The Barclaysresults for 20profit after taBAGL to fall balso be recog
of Reporti
C – 2015 & 2014 Document
ent provides dehe 2015 Resultntal results.
restatements
up is being sments:
Barclays UK Barclays Corp
e intention to Africa results
n-Core segmenRWAs)
t incorporatesd Corporate Bhe Barclaycard
businesses areced bank by 2edit card businealth, Entrepre
24 million conts, it is a pre-ehese customeand enabling in
porate & Internt incorporatesnd Wealth busf the US, Germquiring), previo
porate & Internwithin Barclays
ank (CIB) and
ogether a topsiness incorpo leading paymer lending, stre
ence and divers
ca 2016, Barclaybe to a level and regulatory
Africa busine015 and 2014 ax and non-cobelow the carr
gnised through
ing Chang
4 Results
etails of the imts Announcem
s
implified to fo
porate & Intern
sell down Bar in the Group f
nt has been en
s the UK PersBanking (PCB)d segment.
e now being ru2019. The segness (Barclayceneurs & Busin
mbined persoeminent UK finers and clientncome and co
national s the previoussinesses, prev
man and Nordicously reported
national comps Bank PLC a international C
p-tier global inorates the stroents capabilityength in key msification.
ys announced which will pe
y approvals if a
ess meets thehave been preontrolling interying amount oh these lines.
es
mpact on the Gment on 1 Mar
ocus on two c
national
rclays’ 62.3% ifinancials as a
nlarged, with
onal, small U) segment; an
un as a single gment comprard Consumeress Banking).
nal and card cnancial servicets more effecst synergies.
ly reported Inviously reportec consumer cr
d in the Barclay
prises the busiand certain suConsumer, Ca
nvestment bang and growiny. Barclays Cormarkets, stron
its intention termit deconsoand as required
e requirementsesented as twerest in respecof the net asse
3
Group’s financrch 2016, and
core operating
interest in Bar discontinued
the transfer to
K Corporate and the Barclay
segment and ises the UK rr UK), and the
customers inces provider. Thctively and ef
nvestment Baned in the PCBredit cards busycard segment
nesses that arubsidiaries. Th
ards & Paymen
nk and our cng US and interporate & Inter
ng growth pote
to sell down tlidation from
d.
s for presentao lines on the ct of the discoets of BAGL, a
cial reporting a provides the
g segments in
clays Africa Goperation
o the segment
and UK Wealtycard UK con
represent the retail banking UK-based we
cluding one me bringing tog
fficiently, resu
nk segment; th segment; an
sinesses), and t.
re intended to he segment cnts businesses.
corporate banernational credrnational has sential, and go
the Group’s 6an accountin
ation as a disc face of the Gontinued oper
a resulting imp
as a result of restated quart
n preparation
roup Limited (
t of approxim
h businesses; nsumer credit
businesses th operations (
ealth, entrepren
illion wealth, egether of theseulting in impr
he large UK Cd the internat Barclaycard B
form the noncomprises the.
king franchisedit cards businescale in wholeod balance in
2.3% interest g and regulat
continued operoup income sration. Were t
pairment to Ba
the business rterly and full y
for regulatory
(BAGL) we ha
ately £8bn of
previously recards busine
hat are intende(Personal Banneurs and bus
entrepreneurse businesses aroved custom
Corporate, andtional Barclayusiness Solutio
n-ring-fenced be combined C
e. The Consuess, the internsale and corpo income strea
in BAGL. Thistory perspecti
eration. As sustatement, repthe market carclays’ stake in
reorganisationyear 2015 and
y ring fencing
ve treated the
risk weighted
eported in theess, previously
ed to form theking), the UK
siness banking
and businessllows Barclays
mer and client
d internationalcard businessons (including
bank by 2019,Corporate and
mer, Cards &ational wealthorate banking,ms, delivering
s sell down isve, subject to
uch, the BAGLpresenting theapitalisation ofn BAGL would
n d
g
e
d
e y
e K g
s s t
l s g
, d
& h ,
g
s o
L e f
d

Overview
Barclays PLCRestatement
The Egypt anhave been tra RWAs and levthey continue Barclays NonOn 1 March 2businesses ancountries andZimbabwe bpreviously rereported in th In addition, tsale of this bu Presentatio In order to sibasis. The imtheir impact o Basis of seg
Key judgmenfollowing:
Operating anCosts of tradcosts betweereceived the r RWAs RWAs have bexposures. Wusing approp Returns and eSegment retureporting, hisCRD IV fully lo The tangible Head Office aThe Group cothose businesreassessed. Abeen allocateincome and R
of Reporti
C – 2015 & 2014 Document
d Zimbabwe bansferred to Ba
verage exposue to be part of
-Core (BNC) 2016, a one-timnd assets pland certain produsinesses, pre
eported in the he Barclaycard
he Barclays Wusiness compl
n of perform
implify reportimpact of notab
on return on a
gment allocat
nts around the
d other expening activity areen operating srelated benefit
been allocatedWhere RWAs apriate drivers b
equity by businurns are calcustoric average oaded RWAs f
equity allocate
allocations ontinues to allosses’ results is
As part of this red from Head ORWAs relating
ing Chang
4 Results
businesses prearclays Non-Co
ure in respect the regulatory
me expansion nned to be exduct lines, preveviously report PCB segmen
d segment (£1b
Wealth Americaeted in Decem
mance highlig
ing, going forwble items (equi
verage tangib
tions
e allocation o
ses e reported witsegments, thist.
d to new operare not directlyased on either
ness ulated as attrallocated tangfor each segm
ed to the Barcl
ocate element closely alignerestatement anOffice to busin to these chan
es
eviously reportore.
of the Barclayy balance shee
of the Non-Coited over 2016viously reporteted in the Afrt (£1bn of RWbn of RWAs).
as business, pmber 2015.
ghts and resu
ward Group revalent to prevle equity and b
of activity and
hin the relevans has been do
rating segmeny attributable r the underlyin
ibutable profitgible equity forent, adjusted f
ays Africa disc
ts of the Head d to the Groupn additional £4
ness segmentsges are immat
4
ted in the Afric
ys Africa discoet.
ore perimeter 6 and 2017. Ted in the Inverica Banking sWAs) and the
reviously repo
ults
esults will be viously reportebasic earnings
d related finan
nt segment. Wone with the
ts directly, wh to specific ex
ng risk profile o
t divided by ar each segmenfor CRD IV fully
continued ope
Office performp’s results. The45bn (as at De relating to liqterial. Own cre
ca Banking seg
ntinued opera
by £8bn of RWThis expansionstment Bank s
segment (£2be Southern Eu
orted in the PC
primarily repoed adjusting ite per share.
ncial metrics b
Where it has beobjective of r
here possible, xposures, allocor business pe
average allocant has been resy loaded capit
eration is held i
mance to busine methodologiecember 2015uidity requirem
edit will be rep
gment, but wh
ation are show
WAs was annon principally resegment (£3bn of RWAs), t
uropean credit
CB segment, is
orted on a staems) will how
between repor
een necessary reporting cost
based on thecation methodrformance.
ated tangible stated to use 1tal deductions.
in Head Office
ness segmentsies used for th) of the Group
ments. Historicorted within th
ich are not ow
wn within the H
ounced, represelated to the ebn of RWAs), tthe Asian We
t cards busine
s included in N
tutory rather wever be identif
rting segment
to make allocats in the segm
movement odologies have
equity. To alig1.5% (previou
.
e.
s, so that the aese allocation
p liquidity pool c impacts on she Head Office
wned by BAGL,
Head Office as
senting furtherexiting of ninethe Egypt and
ealth business,ess, previously
Non-Core. The
than adjustedfied, including
ts include the
ations of suchment that has
f relevant risk been devised
gn with 2016usly 10.5%) of
ggregation of s are regularly assets have egment e.
,
s
r e d ,
y
e
d g
e
h s
k d
6 f
y
Performa
Barclays PLCRestatement
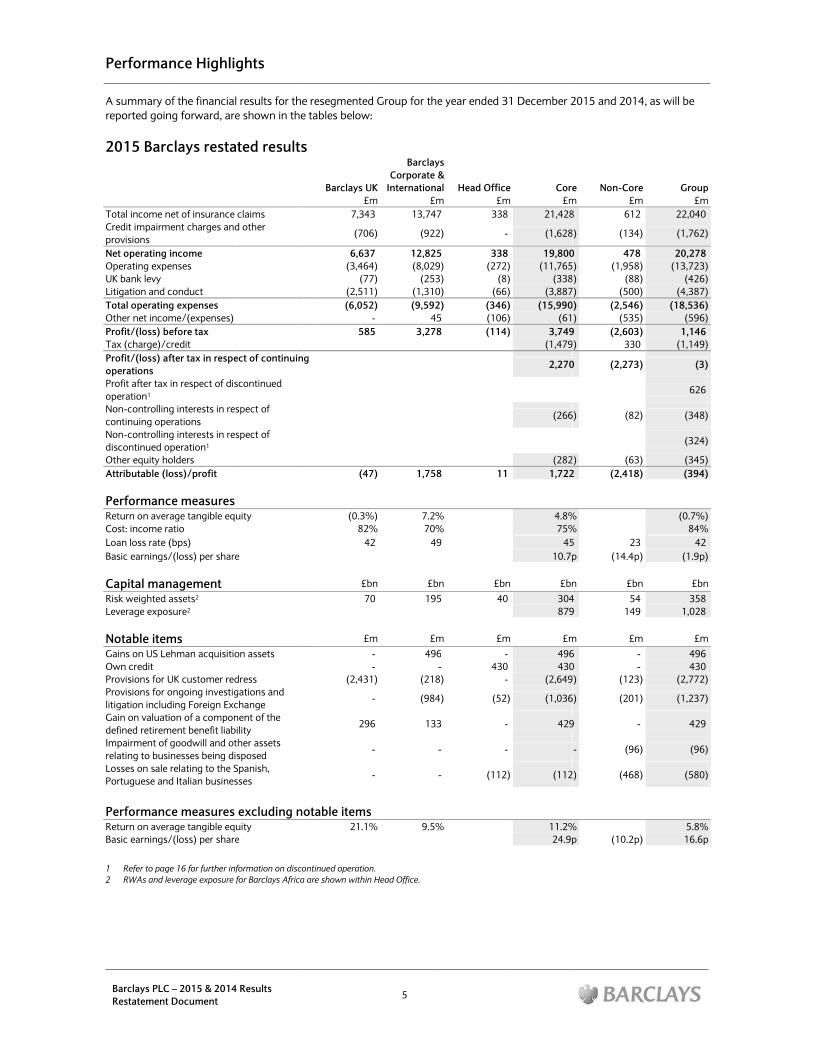
A summary oreported goin
2015 Barc
Total income nCredit impairmprovisions Net operating Operating expeUK bank levy Litigation and cTotal operatingOther net incomProfit/(loss) bTax (charge)/cProfit/(loss) afoperations Profit after tax operation1 Non-controllingcontinuing opeNon-controllingdiscontinued oOther equity hoAttributable (lo PerformancReturn on averCost: income raLoan loss rate (Basic earnings/
Capital manRisk weighted aLeverage expos
Notable itemGains on US LeOwn credit Provisions for UProvisions for olitigation includGain on valuatidefined retiremImpairment of relating to busiLosses on sale Portuguese and
PerformancReturn on averBasic earnings/
1 Refer to pag2 RWAs and le
nce Highlig
C – 2015 & 2014 Document
of the financialng forward, are
clays resta
net of insurance ment charges and
income enses
conduct g expenses me/(expenses) efore tax
credit fter tax in respe
in respect of dis
g interests in reserations g interests in res
operation1 olders oss)/profit
ce measures
rage tangible equatio (bps) /(loss) per share
nagement assets2 sure2
ms
ehman acquisitio
UK customer redongoing investigding Foreign Excion of a compon
ment benefit liab goodwill and otinesses being di relating to the Sd Italian busines
ce measures rage tangible equ/(loss) per share
ge 16 for further infeverage exposure f
ghts
4 Results
results for thee shown in the
ated results
claims d other
ect of continuin
scontinued
spect of
spect of
uity
e
on assets
dress gations and change nent of the ility ther assets sposed
Spanish, sses
excluding nuity
e
formation on discofor Barclays Africa
e resegmentede tables below:
s
Barclays U£m
7,343
(706
6,637(3,464
(77(2,511(6,052
585
g
(47
(0.3%82%
42
£b70
£m
(2,431
296
otable items21.1%
ontinued operationa are shown within
5
d Group for the:
UK
BarclayCorporate &
Internationam £m3 13,747
6) (922
7 12,8254) (8,0297) (2531) (1,3102) (9,592- 455 3,278
7) 1,758
%) 7.2%% 70%2 49
bn £b0 195
m £m
- 496-
1) (218
- (984
6 133
-
-
s
% 9.5%
n. n Head Office.
e year ended 3
ys & al Head Officm £m7 338
2) -
5 3389) (2723) (80) (662) (3465 (1068 (114
8 11
% % 9
n £b5 40
m £m
6 -- 430
8) -
4) (52
3 -
- -
- (112
%
31 December 2
e Corem £m8 21,428
- (1,628
8 19,8002) (11,7658) (3386) (3,8876) (15,9906) (614) 3,749
(1,479
2,270
(266
(2821 1,722
4.8% 75% 45 10.7p
n £bn0 304
879
m £m
- 4960 430- (2,649
2) (1,036
- 429
-
2) (112
11.2% 24.9p
2015 and 2014
e Non-Corem £m8 612
) (134)
0 478) (1,958)) (88)) (500)) (2,546)) (535)
9 (2,603)) 330
0 (2,273)
6) (82)
) (63)2 (2,418)
% % 5 23p (14.4p)
n £bn4 549 149
m £m
6 -0 -) (123)
6) (201)
9 -
- (96)
) (468)
% p (10.2p)
4, as will be
e Groupm £m2 22,040
) (1,762)
8 20,278 ) (13,723)) (426)) (4,387)) (18,536)) (596)) 1,146
0 (1,149)
) (3)
626
) (348)
(324)
) (345)) (394)
(0.7%) 84%
3 42 ) (1.9p)
n £bn4 358 9 1,028
m £m
- 496 - 430 ) (2,772)
) (1,237)
- 429
) (96)
) (580)
5.8%) 16.6p
p
m
)
)
) )
)
)
)
)
)
)
)
)
) %
)
n
m
)
)
)
)
% p

Performa
Barclays PLCRestatement
2014 Barc
Total income nCredit impairmprovisions Net operating Operating expeUK bank levy Litigation and cTotal operatingOther net incomProfit/(loss) bTax (charge)/cProfit/(loss) afoperations Profit after tax operation1 Non-controllingcontinuing opeNon-controllingdiscontinued oOther equity hoAttributable pr PerformancReturn on averCost: income raLoan loss rate (Basic earnings/ Capital manRisk weighted aLeverage expos
Notable itemGains on US LeOwn credit Revision of ESHProvisions for UProvisions for olitigation includLosses on sale
PerformancReturn on averBasic earnings/
1 Refer to pag2 RWAs and le
nce Highlig
C – 2015 & 2014 Document
clays resta
net of insurance ment charges and
income enses
conduct g expenses me/(expenses) efore tax
credit fter tax in respe
in respect of dis
g interests in reserations g interests in res
operation1 olders rofit/(loss)
ce measures
rage tangible equatio (bps) /(loss) per share
nagement assets2 sure2
ms
ehman acquisitio
HLA valuation mUK customer redongoing investigding Foreign Exc relating to the S
ce measures rage tangible equ/(loss) per share
ge 17 for further infeverage exposure f
ghts
4 Results
ated results
claims d other
ect of continuin
scontinued
spect of
spect of
uity
e
on assets
methodology dress gations and change Spanish business
excluding nuity
e
formation on discofor Barclays Africa
s
Barclays U£m
7,436
(901
6,535(4,108
(59(1,108(5,275
1,260
g
852
9.5%71%
53
£b
69
£m
(1,067
s
otable items18.9%
ontinued operationa are shown within
6
UK
BarclayCorporate &
Internationam £m6 12,908
1) (679
5 12,2298) (8,1709) (2488) (1,3335) (9,751- 520 2,530
2 926
% 3.8%% 76%3 35
bn £b
9 202
m £m- 461-
-
7) 32
- (1,250
-
s
% 7.0%
n. n Head Office.
ys & al Head Officm £m8 276
9) -
9 2760) (708) (93) (651) (1442 3160 448
6 374
% % 5
n £b
2 42
m £m1 -- 34- -2 -
0) -
- 315
%
e Corem £m6 20,620
- (1,580
6 19,0400) (12,3489) (3165) (2,5064) (15,1706 3688 4,238
(1,590
2,648
(303
(1934 2,152
7.0% 74% 43 13.4p
n £bn
2 313 917
m £m- 4614 34- -- (1,035
- (1,250
5 315
11.2% 22.0p
e Non-Corem £m0 1,143
) (241)
0 902) (2,611)) (102)) (301)) (3,014)
8 (813)8 (2,925)) 469
8 (2,456)
) (146)
) (57)2 (2,659)
% % 3 39p (16.2p)
n £bn
3 897 316
m £m -
4 -- (935)) (75)
) -
5 (761)
% p (6.7p)
e Groupm £m
21,763
) (1,821)
19,942 ) (14,959)) (418)) (2,807)) (18,184)) (445)) 1,313
9 (1,121)
) 192
653
) (449)
(320)
) (250)) (174)
(0.3%) 84%
9 42 ) (0.7p)
n £bn
9 402 6 1,233
m £m- 461 - 34 ) (935)) (1,110)
- (1,250)
) (446)
5.9%) 17.3p
p
m
)
)
) )
)
)
)
)
)
)
)
) %
)
n
m
)
)
)
)
% p

Results by
Barclays PLCRestatement
2015 Barc
Analysis of Barpage 9.
Income statNet interest incNet fee, commTotal income Credit impairmprovisions Net operating Operating expeUK bank levy Litigation and cTotal operatingOther net (expeProfit before taAttributable pr Balance sheLoans and advaamortised costTotal assets Customer depoRisk weighted a
PerformancReturn on averAverage allocatCost: income raLoan loss rate (Loan: deposit r
Notable itemProvisions for UGain on valuatithe defined ret
PerformancReturn on aver
1 Refer to pag
y Business
C – 2015 & 2014 Document
clays UK
rclays UK betwee
tement inforcome ission and other
ment charges and
income enses
conduct g expenses enses)/income ax ofit/(loss)
eet informatiances to customt
osits assets
ce measures
rage tangible equted tangible equatio (bps) ratio
ms UK customer redion of a componirement benefit
ce measures rage tangible equ
ge 10 for a breakdo
4 Results
en Personal Ban
(Pubrmation
r income
d other
(
ion
mers at
uity
uity (£bn)
dress nent of liability
excluding nuity
own of moves to B
king, Barclaycar
PCB
blished) Barclay(Publis
£m
6,438 32,288 18,726 4
(378) (1,
8,348 3(5,066) (2,
(93) (109)
(5,268) (2,(40)
3,040 12,179 1
£bn
218.4
287.2
305.4
120.4
16.2% 2213.6 60%
17
otable items
arclays Corporate
7
rd Consumer UK
ycard shed)
MoveBarc
CorporaInternatio
£m ,520 (3,7,407 (2,,927 (5,8
,251)
,676 (5,0,033) 2,(42)
- ,075) 2,8
33 ,634 (2,1,106 (1,4
£bn
39.8 (8
47.4 (1410.2 (1341.3 (8
2.3% 5.0
42% 289
s
& International fro
K and Wealth, En
es to clays ate & onal1
Non-Core
moves £m £m
723) (262)
164) (161)
887) (423)
867 56
020) (367)
838 501
54 4 2 27
894 532 (45) 52
171) 217 467) 143
£bn £bn
87.8) (4.3)
49.8) 10.9 34.5) (4.3)
89.2) (2.5)
om PCB and Barcla
ntrepreneurs & B
Head Office
moves
Barcla(excl
noi
£m - -
-
-
- 6- (3
- -
- (3- - 2-
£bn
-
6.8 -
(0.5)
aycard.
Business Banking
ays UK luding otable items)
Notaite
£m 5,973 1,370 7,343
(706)
6,637 3,760) 2
(77) (80) (2,4
3,917) (2,1-
2,720 (2,11,961 (2,0
£bn £
166.1
202.5 176.8
69.5
g is shown on
able ems
2015 asRestated
£m £m- 5,973 - 1,370 - 7,343
- (706)
- 6,637 296 (3,464)
- (77)31) (2,511)35) (6,052)
- - 35) 585 08) (47)
£bn £bn
- 166.1
- 202.5 - 176.8 - 69.5
(0.3%) 9.3 82% 42 94%
£m (2,431)
296
21.1%
s d
m
)
) ) ) ) )
n
)
%
%
m )
6
%

Results by
Barclays PLCRestatement
2014 Barc
Income statNet interest incNet fee, commTotal income Credit impairmprovisions Net operating Operating expeUK bank levy Litigation and cTotal operatingOther net incomProfit before taAttributable pr
Balance sheLoans and advaamortised costTotal assets Customer depoRisk weighted a
PerformancReturn on averAverage allocatCost: income raLoan loss rate (Loan: deposit r
Notable itemProvisions for U
PerformancReturn on aver
1 Refer to pag
y Business
C – 2015 & 2014 Document
clays UK
tement inforcome ission and other
ment charges and
income enses
conduct g expenses me ax ofit
eet informatiances to customt
osits assets
ce measures
rage tangible equted tangible equatio (bps) ratio
ms UK customer red
ce measures rage tangible equ
ge 11 for a breakdo
4 Results
(Prmation
r income
d other
ion
mers at
uity
uity (£bn)
dress
excluding nuity
own of moves to B
PCB
Published) Barc(Pub
£m
6,298
2,530
8,828
(482)
8,346 (5,351)
(70) (54)
(5,475)
14
2,885 2,058
£bn
217.0
285.0
299.2
120.2
15.8%
13.1 62%
21
otable items
arclays Corporate
8
laycard blished)
MoBa
CorpoInterna
£m 3,044 (1,312 (4,356 (
(1,183)
3,173 (4(1,845)
(29) -
(1,874) 40
1,339 (938 (
£bn
36.6
41.3 (7.3 (
39.9
19.9% 4.7
43% 308
s
& International fro
oves to arclays orate & ational1
Non-Comov
£m £(3,254) (24(1,944) (305,198) (550
694 7
4,504) (4802,610 47
38 11
2,659 48(54)
1,899) (1,292)
£bn £b
(83.2) (5.
(142.5) 8.(130.7) (7.
(86.7) (4.
om PCB and Barcla
ore es
Head Office
moves
Ba(e
m £m 9) - 1) - 0) -
70 -
0) - 78 -
2 - 2 -
82 - - -
2 - 3 -
bn £bn
1) -
.1 6.1 5) - 1) -
aycard.
rclays UK excluding
notable items)
Noi
£m 5,839 1,597 7,436
(901)
6,535 (4,108)
(59) (41) (1,
(4,208) (1,-
2,327 (1,1,707 (
£bn
165.3
198.0 168.3
69.3
table tems
2014 asRestated
£m £m- 5,839 - 1,597 - 7,436
- (901)
- 6,535 - (4,108)- (59)
,067) (1,108)067) (5,275)
- - 067) 1,260
(855) 852
£bn £bn
- 165.3
- 198.0 - 168.3 - 69.3
9.5% 9.1 71% 53 98%
£m (1,067)
18.9%
s d
m
)
) ) ) )
n
%
%
%
m )
%

Results by
Barclays PLCRestatement
Analysis o
Analysis of totPersonal BankiBarclaycard CoWealth, EntrepTotal income Analysis of crePersonal BankiBarclaycard CoWealth, EntrepTotal credit im
Analysis of loaPersonal BankiBarclaycard CoWealth, EntrepTotal loans and Analysis of cusPersonal BankiBarclaycard CoWealth, EntrepTotal custome
y Business
C – 2015 & 2014 Document
of Barclays
tal income ng
onsumer UK reneurs & Busin
edit impairmentng
onsumer UK reneurs & Busin
mpairment charg
ans and advanceng
onsumer UK reneurs & Busind advances to c
stomer depositsng
onsumer UK reneurs & Businr deposits
4 Results
s UK
ness Banking
t charges and ot
ness Banking ges and other p
es to customers
ness Banking customers at am
s
ness Banking
ther provisions
rovisions
s at amortised c
mortised cost
9
cost
Year en31.12
3,2,1,7,3
(1(4
(7
A31.12
1311
16
13
417
nded
2.15 £m
714
065
564
343
194)
488)
(24)
706)
As at
2.15
£bn
34.0
16.2 15.9
66.1
31.0
- 45.8
76.8
Year ended31.12.14
£m3,788 2,078 1,570 7,436
(211)(592)
(98)(901)
As at31.12.14
£bn133.8
15.8 15.7
165.3
124.5 -
43.8 168.3
d 4
m
) ) ) )
t
4
n

Results by
Barclays PLCRestatement
2015 Barc Analysis of Barpage 12.
Income statNet interest incNet trading incNet fee, commTotal income Credit impairmprovisions Net operating Operating expeUK bank levy Litigation and cTotal operatingOther net incomProfit before taAttributable pr
Balance sheLoans and advaat amortised coTrading portfoDerivative finanDerivative finanReverse repurcsimilar securedFinancial assetTotal assets Customer depoRisk weighted a
PerformancReturn on averAverage allocatCost: income raLoan loss rate (Loan: deposit r
Notable itemGains on US LeProvisions for UProvisions for olitigation includGain on valuatidefined retirem
PerformancReturn on aver
1 As at 31 Dec
collateral of advances to
2 As at 31 Dec
y Business
C – 2015 & 2014 Document
clays Corp
rclays Corporate
tement inforcome ome ission and other
ment charges and
income enses
conduct g expenses me ax ofit
eet informatiances to banks aost1 lio assets ncial assets ncial liabilities chase agreementd lending s designated at
osits2 assets
ce measures
rage tangible equted tangible equatio (bps) ratio
ms ehman acquisitioUK customer redongoing investigding Foreign Excion of a compon
ment benefit liab
ce measures rage tangible equ
cember 2015 loanf £24.8bn), and £2 banks and customcember 2015 custo
4 Results
orate & Int
e & International
rmation
r income
d other
ion
and customers
ts and other
fair value
uity
uity (£bn)
on assets dress gations and change nent of the ility
excluding nuity
ns and advances in21.5bn of loans anmers in respect of Comer deposits incl
ternationa
between Corpo
Investment Bank
(Published)
M
£m
588
3,859
3,125
7,572 3
(55)
7,517 3(5,596) (
(203) (107)
(5,906) (1-
1,611 804
£bn
92.2
65.1 114.3
122.2
25.5
48.1 375.9
51.3 108.3
6.0%
13.9 78%
otable items
ncluded £162.6bn nd advances to baConsumer, Cards &luded settlement b
10
l
orate and Investm
Moves from PCB
Mofr
Barclayc£m
2,150 1,516
1,029 1,13,195 2,6
(159) (7
3,036 1,91,513) (1,3
(38) ((2)
1,553) (1,312
1,495 61,054 4
£bn £
69.0 23
- 0.3
-
-
- 120.6 29124.3 167.3 2
s
of loans and advaanks (including set& Payments were £balances of £16.3b
ment Bank, and
oves rom card
Non-Core moves
£m £m 573 13
(5) (88) 24 (118)
692 (193)
08) -
984 (193) 25) 278
(16) 4 - 1
41) 283 33 1
676 91 413 75
£bn £bn
3.0 (0.3)
- (3.2) - (3.1) - (3.2)
- (0.8)
- (1.3) 9.1 (25.3) 0.2 (0.2)
1.9 (2.9)
ances to customersttlement balances£32.1bn.
bn and cash collate
Consumer, Card
Head Office
moves
BarCorpor
Internat(exclu
noit
£m - 4- 3
(15) 5(15) 13
- (
(15) 12(6) (8
- (- (
(6) (8,(1)
(22) 3(26) 2
£bn
0.2 1
- - 1- 1
-
- 31.9 5
- 10.2 1
rs (including settlem of £1.6bn and ca
eral of £15.9bn.
ds & Payments i
rclays ate & tional uding otable tems)
Notabitem
£m £4,324 3,782 5,145 49
,251 49
(922)
2,329 49,162) 13(253) (108) (1,20,523) (1,06
45 ,851 (57
2,320 (56
£bn £
84.1
61.9 11.5 19.0
24.7
46.8 532.2
85.6
94.8
ment balances of ash collateral of £5
s shown on
ble ms
2015 asRestated
£m £m- 4,324 - 3,782
96 5,641 96 13,747
- (922)
96 12,825 33 (8,029)
- (253)02) (1,310)69) (9,592)
- 45 73) 3,278 62) 1,758
bn £bn
- 184.1
- 61.9 - 111.5 - 119.0
- 24.7
- 46.8 - 532.2 - 185.6 - 194.8
7.2% 24.9 70% 49 88%
£m 496 (218)
(984)
133
9.5%
£18.5bn and cash5.7bn). Loans and
s d
m
)
) ) ) )
n
%
%
%
m
)
)
%
h d

Results by
Barclays PLCRestatement
2014 Barc
Income statNet interest incNet trading incNet fee, commTotal income Credit impairmNet operating Operating expeUK bank levy Litigation and cTotal operatingOther net incomProfit before taAttributable pr
Balance sheLoans and advaamortised costTrading portfoDerivative finanDerivative finanReverse repurcsimilar securedFinancial assetTotal assets Customer depoRisk weighted a
PerformancReturn on averAverage allocatCost: income raLoan loss rate (Loan: deposit r
Notable itemGains on US LeProvisions for UProvisions for olitigation includ
PerformancReturn on aver
1 As at 31 De
collateral oadvances t
2 As at 31 De
y Business
C – 2015 & 2014 Document
clays Corp
tement inforcome ome ission and other
ment charges andincome enses
conduct g expenses me ax ofit
eet informatiances to banks at1 lio assets ncial assets ncial liabilities chase agreementd lending s designated at
osits2 assets
ce measures
rage tangible equted tangible equatio (bps) ratio
ms ehman acquisitioUK customer redongoing investigding Foreign Exc
ce measures rage tangible equ
ecember 2014 loaof £32.2bn), and £to banks and custoecember 2014 cus
4 Results
orate & Int
rmation
r income
d other provision
ion
and customers a
ts and other
fair value
uity
uity (£bn)
on assets dress gations and change
excluding nuity
ns and advances i£24.3bn of loans aomers in respect ofstomer deposits inc
ternationa
Investment Bank
(Published) £m
647
3,735
3,206
7,588 ns 14
7,602 (5,878)
(218) (129)
(6,225)
-
1,377 397
£bn
at 106.3
94.8 152.6
160.6
64.3
8.9 455.7
57.8 122.4
2.8%
14.6 82%
otable items
included £169.3bnnd advances to baf Consumer, Cardscluded settlement
11
l
Moves
from PCB Ba £m 2,158 4 935 3,097 (170) 2,927 (1,476) (25) (11) (1,512) 11 1,426 1,000
£bn
67.9
- 0.3 -
-
- 117.5 123.4 67.1
s
n of loans and advaanks (including ses & Payments were balances of £25.1
Moves from
rclaycard
NC
mo£m
1,096 (- (2
1,005 (12,101 (3(524)
1,577 (3(1,134) 3
(13) -
(1,147) 343
473 292
£bn £
19.9 (0
- (7- (3- (3
- (
- (325.0 (3
7.3 (019.6 (7
ances to customerettlement balancese £29.7bn. 1bn and cash colla
Non-Core oves
Head Office
moves
CoInte
(
£m £m
(27) - 206) -
06) - 339) -
1 - 338) - 315 3
8 - 26 (1)
349 2 2 (4)
13 (2) 47 (2)
£bn £bn
0.5) -
7.5) - 3.3) - 3.3) -
1.4) -
3.2) - 1.6) 29.9 0.3) - 7.9) 0.5
rs (including settles of £2.7bn and ca
teral of £24.5bn.
Barclays orporate & ernational excluding
notable items)
Notaite
£m
3,874 3,533 5,040 4
12,447 4(679)
11,768 4(8,170)
(248) (115) (1,2
(8,533) (1,252
3,287 (71,734 (8
£bn £
193.6
87.3 149.6 157.3
62.9
5.7 596.5 188.2
201.7
ement balances of ash collateral of £6
able ems
2014 asRestated
£m £m
- 3,874 - 3,533
461 5,501 461 12,908
- (679)461 12,229
- (8,170)- (248)
18) (1,333)18) (9,751)
- 52 57) 2,530 08) 926
£bn £bn
- 193.6
- 87.3 - 149.6 - 157.3
- 62.9
- 5.7 - 596.5 - 188.2 - 201.7
3.8% 25.0 76% 35 90%
£m 461 32
(1,250)
7.0%
£25.6bn and cash6.7bn). Loans and
s d
m
) ) ) ) )
n
%
%
%
m
)
%
h d

Results by
Barclays PLCRestatement
Analysis o
Corporate Income statAnalysis of totCredit
Equities Macro Markets Banking fees Corporate lendTransactional bBanking Other1 Total income Credit impairmTotal operatingProfit before ta
PerformancReturn on averAverage allocat
PerformancReturn on aver
ConsumerIncome statTotal income Credit impairmTotal operatingProfit before ta
Balance sheLoans and advaCustomer depo
PerformancReturn on aver
PerformancReturn on aver
1 Other inclu
y Business
C – 2015 & 2014 Document
of Barclays
and Investmtement infortal income
ding banking
ment charges andg expenses ax
ce measures
rage tangible equted tangible equ
ce measures rage tangible equ
, Cards & Patement infor
ment charges andg expenses ax
eet informatiances to banks aosits
ce measures
rage tangible equ
ce measures rage tangible equ
udes gains on US L
4 Results
s Corporate
ment Bank
rmation
d other provision
uity
uity (£bn)
excluding nuity
ayments
rmation
d other provision
ion and customers a
uity
excluding nuity
ehman acquisition
e & Interna
ns
otable items
ns
at amortised cos
otable items
n assets of £496m
12
ational
s
st
s
(2014: £461m).
Year ende31.12.1
£
821,912,104,842,081,361,665,11
4910,45
(19(7,922,32
5.421.
8.2
Year ende31.12.1
£3,29(72
(1,6695
As at 31.12.1£b
32.41.
20.2
18.9
ed
15 m
24
2
08
44 87
61
63
1 95
50 9)
9)
22
%
.9
%
ed
15 m
97 3)
3)
56
15
bn
.1
.8
%
%
Year ended31.12.14
£m
792 1,956 1,950 4,698 2,115 1,268 1,594 4,977
476 10,151
(87)(8,279)1,787
1.9%22.0
5.6%
Year ended31.12.14
£m2,757 (592)
(1,472)743
As at 31.12.14£bn
29.7 37.9
17.8%
17.8%
d 4
m
) )
%
%
d 4
m ) )
4 n
%
%

Results by
Barclays PLCRestatement
2015 Hea
Income statNet operating (Operating expeUK bank levy Litigation and cTotal operatingOther net incomLoss before taxAttributable (lo Balance sheTotal assets Risk weighted a
Notable itemOwn credit Provisions for oincluding ForeiLosses on sale Italian business
2014 Hea
Income statNet operating iOperating expeUK bank levy Litigation and cTotal operatingOther net (expeProfit before taAttributable pr Balance sheTotal assets Risk weighted a
Notable itemOwn credit Losses on sale
y Business
C – 2015 & 2014 Document
ad Office
tement infor(expenses)/ incoenses
conduct g expenses me/(expenses) x
oss)/profit
eet informati
assets
ms
ongoing investiggn Exchange relating to the Sses
ad Office
tement inforncome
enses
conduct g expenses enses)/income ax ofit
eet informati
assets
ms
relating to the S
4 Results
rmation ome
ion
gations and litiga
Spanish, Portugu
rmation
ion
Spanish business
He(P
ation
uese and
He(P
s
13
ead Office Published)
s
£m
(107)
(278)
(8) (14)
(300)
5
(402)
(202)
£bn
56.4 7.7
ead Office Published)
s
£m
242
(67)
(9) (66)
(142)
(3)
97 112
£bn
49.1 5.6
Group tructure
moves
Head O(excl
noit
£m 15
6 - - 6 1
22 (26 (
£bn (44.9)
0.3
Group tructure
moves
Head O(excl
noit
£m
- (3)
- 1
(2) 4 2 2
£bn (41.8)
(0.5)
Office uding otable tems)
Notaite
£m (92) 4
(272) (8)
(14) ((294) (
6 (1(380) 2(176)
£bn £11.5
8.0
Office uding otable tems)
Notaite
£m
242 (70)
(9) (65)
(144) 1 3
99 3114 2
£bn £7.3 5.1
able ems
Discontinuoperatio
BarclaAfri
£m £430
- -
(52) (52) 12) 266 187
£bn £- 47- 31
able ems
Discontinuoperatio
BarclaAfri
£m £
34 - - - -
315 349 260
£bn £- 53- 36
ed on: ays ica
2015 asRestated
£m £m- 338 - (272)- (8)- (66)- (346)- (106)- (114)- 11
bn £bn7.9 59.4
.7 39.7
£m 430
(52)
(112)
ed on: ays ica
2014 asRestated
£m £m
- 276 - (70)- (9)- (65)- (144)- 316 - 448 - 374
bn £bn.7 61.0
6.7 41.8
£m 34 315
s d
m ) ) ) ) ) )
n
m 0
)
)
s d
m
) ) ) )
4
n
m 4 5

Results by
Barclays PLCRestatement
2015 Barc
Income statNet interest incNet trading incNet fee, commTotal income Net claims andcontracts Total income nCredit impairmNet operating Operating expeUK bank levy Litigation and cTotal operatingOther net expeLoss before taxAttributable los
Balance sheLoans and advaamortised costDerivative finanDerivative finanReverse repurclending Financial assetTotal assets Customer depoRisk weighted a
PerformancAverage allocatPeriod end allo
Notable itemProvisions for UProvisions for oincluding ForeiImpairment of businesses beinLosses on sale Italian business
Analysis of totBusinesses Securities and Derivatives Total income n
1 As at 31 Dec
collateral of 2 As at 31 Dec
y Business
C – 2015 & 2014 Document
clays Non-
tement inforcome ome ission and other
d benefits incurre
net of insurancement charges and
(expenses)/incenses
conduct g expenses
enses x ss
eet informatiances to banks at1 ncial instrumentncial instrumentchase agreement
s designated at
osits2 assets
ce measures
ted tangible equocated tangible e
ms UK customer redongoing investiggn Exchange goodwill and otng disposed relating to the Sses
tal income net o
loans
net of insurance
cember 2015 loansf £19.0bn), and £1cember 2015 custo
4 Results
Core
rmation
r income
ed under insuran
e claims d other provisioncome
ion
and customers a
t assets t liabilities ts and other sim
fair value
uity (£bn) equity (£bn)
dress gations and litiga
ther assets relati
Spanish, Portugu
of insurance cla
e claims
s and advances in1.4bn of loans andomer deposits incl
(P
nce
ns
at
milar secured
ation
ing to
uese and
ims
cluded £40.4bn ofd advances to bankluded settlement b
14
Barclays Non-Core
Published) N
£m
249
(805)
765
209
(373)
(164)
(78)
(242)
(973)
(78) (148)
(1,199)
(18)
(1,459)
(1,523)
£bn
45.9
210.3
198.7
2.4
20.1 303.1
14.9 46.6
8.9 7.2
£m
613
(481)
(296)
(164)
f loans and advancks (including settlebalances of £0.2bn
on-Core moves
Head m
£m 366
99 310 775
1
776 (56) 720
(886) (10) (28)
(924) (52)
(256) (188)
£bn
5.9
3.4 3.4
0.7
1.3 16.4
6.0 7.7
£m 526 131 119 776
ces to customers (ement balances of n and cash collater
Office moves
BarcNon-C
(excludnot
ite£m
- 6- (7- 1,0- 9
- (3
- 6- (1- 4- (1,8- - (1- (2,1- - (1,7- (1,7
£bn
- 5
- 21- 20
-
- 26.3 32
- 2- 5
£m - 1,- (3- (1- 6
(including settlemef £nil and cash collral of £12.3bn.
clays Core ding able
ems) Notab
item£m £
615 706) 075 984
372)
612 134) 478 859) (9(88) 176) (32123) (42(70) (46
715) (88711) (70
£bn £b
51.8
13.7 02.1
3.1
21.4 25.8 20.9 54.3
£m £139 350) 177) 612
ent balances of £0.lateral of £10.1bn)
ble ms
2015 asRestated
£m £m- 615 - (706)- 1,075 - 984
- (372)
- 612 - (134)- 478
99) (1,958)- (88)
24) (500)3) (2,546)
65) (535)8) (2,603)
07) (2,418)
bn £bn
- 51.8
- 213.7 - 202.1
- 3.1
- 21.4 - 325.8 - 20.9 - 54.3
10.9 8.5
£m (123)
(201)
(96)
(468)
£m £m- 1,139 - (350)- (177)- 612
.3bn and cash ).
s d
m )
)
) ) ) ) ) ) ) )
n
m )
)
)
)
m ) )

Results by
Barclays PLCRestatement
2014 Barc
Income statNet interest incNet trading incNet fee, commTotal income Net claims andcontracts Total income nCredit impairmNet operating Operating expeUK bank levy Litigation and cTotal operatingOther net expeLoss before taxAttributable los Balance sheLoans and advaamortised costDerivative finanDerivative finanReverse repurcsecured lendingFinancial assetTotal assets Customer depoRisk weighted a
PerformancAverage allocatPeriod end allo
Notable itemRevision of ESHProvisions for ULosses on sale
Analysis of totBusinesses Securities and Derivatives Total income n
1 As at 31 Dec
collateral of 2 As at 31 Dec
y Business
C – 2015 & 2014 Document
clays Non-
tement inforcome ome ission and other
d benefits incurre
net of insurancement charges and
income enses
conduct g expenses
enses x ss
eet informatiances to banks at1 ncial instrumentncial instrumentchase agreementg s designated at
osits2 assets
ce measures
ted tangible equocated tangible e
ms HLA valuation mUK customer red relating to the S
tal income net o
loans
net of insurance
cember 2015 loansf £22.1bn), and £1cember 2014 custo
4 Results
Core
rmation
r income
ed under insuran
e claims d other provision
ion
and customers a
t assets t liabilities ts and other sim
fair value
uity (£bn) equity (£bn)
methodology dress Spanish business
of insurance cla
claims
s and advances in1.4bn of loans andomer deposits incl
BNo
(Pub
nce
ns
at
milar
s
ims
cluded £40.5bn ofd advances to bankluded settlement b
15
Barclays on-Core blished)
Nonm
£m
214
120
1,026
1,360
(310)
1,050 (168)
882 (1,722)
(91) (198)
(2,011)
(51)
(1,180)
(1,085)
£bn
63.9
285.4
277.1
49.3
22.2 471.5
21.6 75.3
13.2 11.0
£m
1,101
117
(168)
1,050
f loans and advancks (including settlebalances of £1.1bn
n-Core moves
Head Om
£m 376
(710) 1,361 1,027
1
1,028 (73) 955
(889) (11) (28)
(928) (1) 26
(24)
£bn
6.8
3.5 3.5
1.4
3.3 25.1
9.2 13.8
£m 402 500 126
1,028
ces to customers (ement balances of n and cash collater
Office moves
BarclaNon-Co
(excludnota
item£m
- 5- (59- 2,3- 2,3
- (30
- 2,0- (24- 1,8- (2,6- (10- (2- (2,93- (5- (1,15- (1,10
£bn £
- 70
- 288- 280
- 50
- 255.8 502
- 30- 89
£m - 1,5- 6- (4- 2,0
(including settlemef £0.3bn and cash cral of £11.7bn.
ays ore ing
able ms)
Notabitem
£m £m90 90) 87 (93587 (935
09)
78 (93541) 37 (93511) 02) 26) (7539) (7552) (76154) (1,77109) (1,550
£bn £b
0.7
8.9 0.6
0.7
5.5 2.4 0.8 9.1
£m £m03
617 (93542) 78 (935
ent balances of £1.collateral of £11.3
ble ms
2014 asRestated
m £m- 590 - (590)
5) 1,452 5) 1,452
- (309)
5) 1,143 - (241)
5) 902 - (2,611)- (102)
5) (301)5) (3,014)1) (813)1) (2,925)0) (2,659)
bn £bn
- 70.7
- 288.9 - 280.6
- 50.7
- 25.5 - 502.4 - 30.8 - 89.1
15.6 13.1
£m (935) (75) (761)
m £m- 1,503
5) (318)- (42)
5) 1,143
.9bn and cash 3bn).
s d
m )
)
) ) ) ) ) ) ) )
n
6
m ) ) )
m ) )

Results by
Barclays PLCRestatement
Discontin Under IFRS 5 requirementspresented as interests in re
Income statNet interest incNet fee, commTotal income Net claims andTotal income nCredit impairmNet operating Operating expeUK bank levy Total operatingOther net incomProfit before taProfit after tax Attributable pr
Balance sheLoans and advaTotal assets Customer depoRisk weighted a
PerformancReturn on averAverage allocatCost: income raLoan loss rate (Loan: deposit r
y Business
C – 2015 & 2014 Document
ued Opera
Non-Current As for recognitio two lines on tespect of disco
tement inforcome ission and other
d benefits incurrenet of insurance
ment charges andincome enses
g expenses me ax ofit
eet informatiances to custom
osits assets
ce measures
rage tangible equted tangible equatio (bps) ratio
4 Results
ation: 2015
Assets Held foon as a disconthe face of the
ontinued opera
rmation
r income
ed under insurane claims d other provision
ion
mers at amortise
uity
uity (£bn)
5 Barclays
or Sale and Distinued operati Group incomeations.
nce contracts
ns
ed cost
16
Africa
continued Opon. As such the statement, re
erations, the Bhe Barclays Afrepresenting th
Africa Banking(Published
£m2,0661,6683,734(160
3,574(352
3,222(2,198
(52(2,250
7979657332
£bn29.949.930.633.9
11.7%2.8
63%109
Barclays Africarica 2015 and he profit after t
g d) Non-Corm
6
8
4 0)
4 2)
2 8)
2)
0)
7
9 7
2
n
9 9 6 9
%
8 %
9
business mee2014 results htax and non-co
re moves 20£m
(116) (44)
(160) -
(160) (1)
(161) 107
2 109
- (52) (31) (30)
£bn (0.7) (2.0) (1.5) (2.2)
ets the have been ontrolling
015 as Restated£m
1,950 1,624 3,574 (160)
3,414 (353)
3,061 (2,091)
(50)(2,141)
7 927 626 302
£bn29.2 47.9 29.1 31.7
11.8%2.6
63%112
100%
d m
) ) ) ) )
n
%
%
%

Results by
Barclays PLCRestatement
Discontin
Income statNet interest incNet fee, commTotal income Net claims andTotal income nCredit impairmNet operating Operating expeUK bank levy Litigation and cTotal operatingOther net incomProfit before taProfit after tax Attributable pr
Balance sheLoans and advaTotal assets Customer depoRisk weighted a
PerformancReturn on averAverage allocatCost: income raLoan loss rate (Loan: deposit r
y Business
C – 2015 & 2014 Document
ued Opera
tement inforcome ission and other
d benefits incurrenet of insurance
ment charges andincome enses
conduct g expenses me ax ofit
eet informatiances to custom
osits assets
ce measures
rage tangible equted tangible equatio (bps) ratio
4 Results
ation: 2014
rmation
r income
ed under insurane claims d other provision
ion
mers at amortise
uity
uity (£bn)
4 Barclays
nce contracts
ns
ed cost
17
Africa
Africa Bank(Publish
2,01,73,8(1
3,6(3
3,3(2,2
(
(2,3
963
3533
12
6
king hed) Non-Co
£m
093
741
834 70)
664 349)
315 295)
(45) (2)
342)
11
984 681
360
£bn
35.2 55.5 35.0 38.5
.9%
2.8 64%
93
ore moves 20£m
(99) (39)
(138) -
(138) 2
(136) 96
1 -
97 (1)
(40) (27) (26)
£bn (0.6) (1.8) (1.4) (1.8)
014 as Restated£m
1,994 1,702 3,696 (170)
3,526 (347)
3,179 (2,199)
(44)(2)
(2,245)10
944 654 334
£bn34.6 53.7 33.6 36.7
13.2%2.5
64%95
103%
d m
) ) ) ) ) )
n
%
%
%

Barclays R
Barclays PLCRestatement
Barclays G
Income statTotal income nCredit impairmNet operating Operating expeUK bank levy Litigation and cTotal operatingOther net (expe(Loss)/profit bTax (charge)/c(Loss)/profit aoperations Profit after tax operation AttributableOrdinary equityOther equity hoNon-controlling
Balance sheTotal assets Risk weighted aLeverage expos
PerformancReturn on averAverage tangibCost: income raLoan loss rate (Basic (loss)/ea
Notable itemGains on US LeOwn credit Revision of ESHProvisions for UProvisions for olitigation includGain on valuatiretirement benImpairment of to businesses bLosses on sale and Italian bus
PerformancReturn on averBasic (loss)/ea
Results by
C – 2015 & 2014 Document
Group
tement infornet of insurance
ment charges andincome enses
conduct g expenses enses)/income
before tax credit after tax in resp
in respect of dis
e to:
y holders of the olders g interests
eet informati
assets sure
ce measures
rage tangible shable shareholdersatio (bps)
arnings per share
ms
ehman acquisitio
HLA valuation mUK customer redongoing investigding Foreign Excion of a componefit liability goodwill and otbeing disposed relating to the Sinesses
ce measures rage tangible shaarnings per share
Quarter
4 Results
rmation claims d other provision
ect of continuin
scontinued
parent
ion
areholders' equits' equity (£bn)
e
on assets
methodology dress gations and change nent of the defin
ther assets relati
Spanish, Portugu
excluding nareholders' equite
Q415
£m 4,448
ns (554)
3,894 (3,547)
(426) (1,722)
(5,695)
(274)
(2,075)
(164)
ng (2,239)
101
(2,422)
107
177
£bn
1,120.0
358.4
1,027.8
ty (20.1%)
47.8
128%
53 (14.4p)
£m
- (175)
- (1,450)
(167)
ned -
ing (96)
uese (261)
otable itemsty (1.9%)
(1.3p)
18
Q315 £m 5,481 6 (429) 5,052 6 (3,552) (3 - (699) (4,251) (4 (182) 619 1 (133)
486 1
167
417 1 79 157
£bn 1,236.5 1,1 381.9 3 1,140.7 1,1
3.6% 47.6 78% 37 2.6p
£m - 195 - (290)
(270)
-
-
(201)
s
6.7% 4.8p
Q215 Q115£m £m
6,461 5,650(393) (386
6,068 5,2643,557) (3,067
- (927) (1,039
4,484) (4,106(39) (101
1,545 1,057(324) (528
1,221 529
162 196
1,146 46579 80
158 180
£bn £bn196.7 1,416.4376.7 395.9139.3 1,254.7
9.8% 4.0%47.2 48.169% 73%
35 327.0p 2.9p
£m £m
496 -282 128
- -(850) (182
- (800
- 429
- -
- (118
9.1% 9.0%6.5p 6.6p
5 Q414 m £m 0 4,097 ) (495)
4 3,602 ) (3,696) - (418) ) (1,089) ) (5,203) ) (82)
7 (1,683) ) 134
9 (1,549)
6 168
5 (1,679) 0 80 0 218
n £bn 4 1,357.9 9 401.9 7 1,233.4
% (13.8%)1 48.3
% 127% 2 45 p (10.2p)
m £m
- - 8 (62) - (935) ) (200)
) (750)
9 -
- -
) (82)
% 1.7%p 1.3p
Q314 Q£m
5,987 5(435) (
5,552 5(3,653) (3,
- (607) (1,
(4,260) (4,(336) 956
(507) (
449
171
379 80
161
£bn 1,365.7 1,3
412.9 41,323.9 1,3
3.4% 46.8 71%
39 2.4p
£m
461 44
- (10) (
(500)
-
-
(364)
7.1% 5.2p
Q214 Q114£m £m
5,756 5,923 (439) (452),317 5,471 ,762) (3,848)
- -,046) (65),808) (3,913)
(48) 21 461 1,579
(215) (533)
246 1,046
145 169
161 965 41 49
189 201
£bn £bn314.9 1,362.1 411.1 436.3 353.0 n/a
1.4% 8.4%46.7 46.484% 66%
39 40 1.0p 6.0p
£m £m
- - (67) 119
- - (900) -
- -
- -
- -
- -
7.5% 7.6%5.4p 5.5p
4 m
) ) - ) ) )
n
% 4
%
p
m
% p
Barclays R
Barclays PLCRestatement
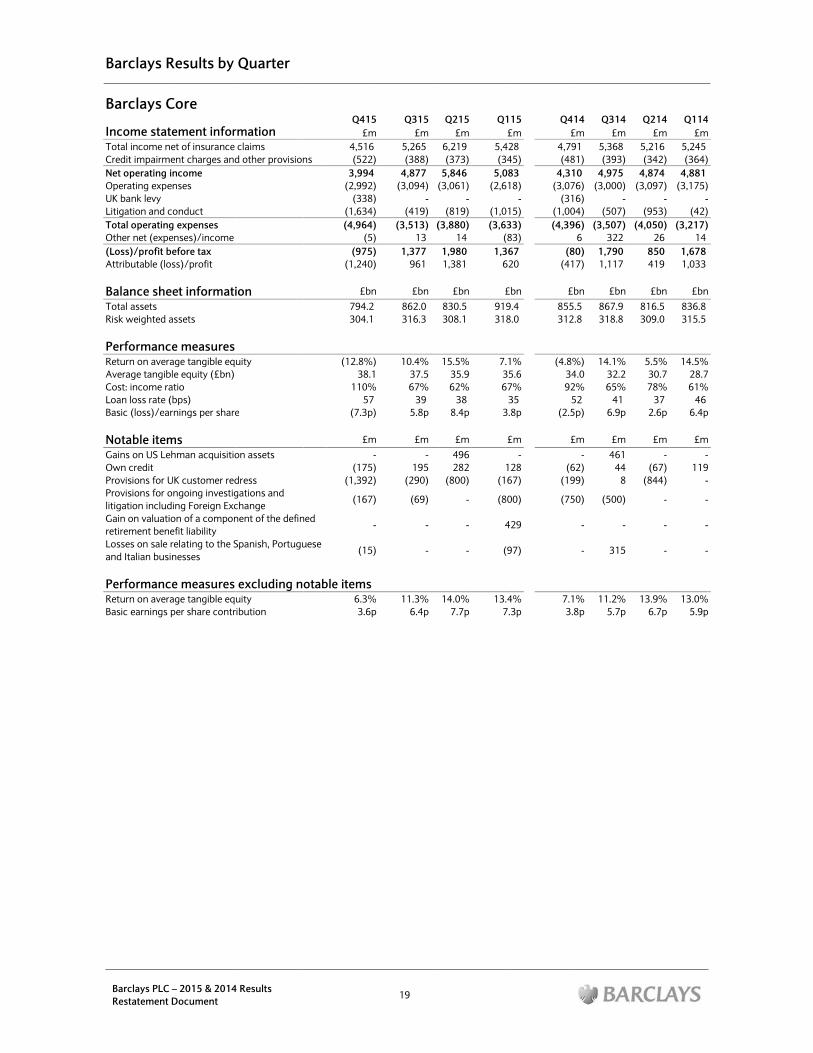
Barclays C
Income statTotal income nCredit impairmNet operating Operating expeUK bank levy Litigation and cTotal operatingOther net (expe(Loss)/profit bAttributable (lo Balance sheTotal assets Risk weighted a
PerformancReturn on averAverage tangibCost: income raLoan loss rate (Basic (loss)/ea
Notable itemGains on US LeOwn credit Provisions for UProvisions for olitigation includGain on valuatiretirement benLosses on sale and Italian bus
PerformancReturn on averBasic earnings
Results by
C – 2015 & 2014 Document
Core
tement infornet of insurance
ment charges andincome enses
conduct g expenses enses)/income
before tax oss)/profit
eet informati
assets
ce measures
rage tangible equble equity (£bn) atio (bps)
arnings per share
ms
ehman acquisitio
UK customer redongoing investigding Foreign Excion of a componefit liability relating to the Sinesses
ce measures rage tangible equ per share contr
Quarter
4 Results
rmation
claims d other provision
ion
uity
e
on assets
dress gations and change nent of the defin
Spanish, Portugu
excluding nuity
ibution
Q41£m
4,516ns (522
3,994(2,992
(338(1,634(4,964
(5(975
(1,240
£b794.2304.1
(12.8%38.
110%57
(7.3p
£m
(175(1,392
(167
ned
uese (15
otable items6.3%3.6
19
5 Q315 m £m 6 5,265 2) (388) 4 4,877 2) (3,094) 8) - 4) (419) 4) (3,513) (5) 13 5) 1,377 0) 961
n £bn 2 862.0 1 316.3
%) 10.4% 1 37.5
% 67% 7 39 p) 5.8p
m £m - -
5) 195 2) (290)
7) (69)
- -
5) -
s
% 11.3% p 6.4p
Q215 Q£m
6,219 5,4(373) (3
5,846 5,0(3,061) (2,6
- (819) (1,0
(3,880) (3,614 (
1,980 1,31,381 6
£bn £830.5 91308.1 31
15.5% 7.35.9 362% 6
38 8.4p 3
£m 496 282
(800) (1
- (8
- 4
- (
14.0% 13.7.7p 7
115 Q4£m £
428 4,79345) (48083 4,31618)
(3,07
- (31015)
(1,00
633)
(4,39(83) 367 (8620 (41
£bn £9.4 8558.0 312
.1% (4.8%35.6 3467% 92
35 53.8p (2.5
£m £-
128
(667)
(19
800)
(75
429
(97)
.4% 7.17.3p 3.
14 Q314 £m £m 91 5,368 81) (393) 10 4,975 476) (3,000) (316) - 04) (507) 96) (3,507) (4
6 322 80) 1,790 17) 1,117
£bn £bn 5.5 867.9 2.8 318.8
%) 14.1% 4.0 32.2 2% 65% 52 41 5p) 6.9p
£m £m - 461
62) 44 99) 8
50) (500)
- -
- 315
1% 11.2% .8p 5.7p
Q214 Q114£m £m
5,216 5,245 (342) (364)
4,874 4,881 3,097) (3,175)
- -(953) (42)
4,050) (3,217)26 14
850 1,678 419 1,033
£bn £bn816.5 836.8 309.0 315.5
5.5% 14.5%30.7 28.778% 61%
37 46 2.6p 6.4p
£m £m- -
(67) 119(844) -
- -
- -
- -
13.9% 13.0%6.7p 5.9p
4 m
) ) - ) )
n
% 7
%
p
m - 9 -
-
-
-
% p

Barclays R
Barclays PLCRestatement
Barclays N
Income statBusinesses Securities and Derivatives Total income nCredit impairmNet operating Operating expeUK bank levy Litigation and cTotal operatingOther net (expeLoss before taxAttributable los Balance sheLoans and advaamortised costDerivative finanDerivative finanReverse repurcsecured lendingFinancial assetTotal assets Customer depoRisk weighted a
PerformancAverage allocatPeriod end alloLoan loss rate (Basic loss per s
Notable itemOwn credit
Revision of ESHProvisions for UProvisions for oincluding ForeiImpairment of to businesses bLosses on sale and Italian bus
PerformancBasic loss per s
Results by
C – 2015 & 2014 Document
Non-Core
tement infor
loans
net of insurancement charges and
(expenses)/incenses
conduct g expenses enses)/income x ss
eet informatiances to banks at ncial instrumentncial instrumentchase agreementg s designated at
osits assets
ce measures
ted tangible equocated tangible e(bps) share contributio
ms
HLA valuation mUK customer redongoing investiggn Exchange goodwill and otbeing disposed relating to the Siness
ce measures share contributio
Quarter
4 Results
rmation
e claims d other provisioncome
ion
and customers a
t assets t liabilities ts and other sim
fair value
uity (£bn) equity (£bn)
on
methodology dress gations and litiga
ther assets relati
Spanish, Portugu
excluding non
Q41£
22(19(10(68
ns (3(100(55
(8(8
(732(26
(1,100(1,20
£bat
51.
213.202.
milar 3.
21.325.
20.54.
982
(7.2
(5ation
ing (9
uese (24
otable items(5.1
20
15 Q315 m £m
29 314 5) (87) 2) (12) 8) 215 2) (41) 0) 174 5) (458) 8) - 9) (279) 2) (737) 8) (195) 0) (758) 8) (628)
bn £bn
.8 57.1
.7 243.3
.1 235.0
.1 8.5
.4 22.8
.8 374.5
.9 25.8
.3 65.6
9.7 10.2 8.5 10.2 25 27 p) (3.7p)
- - - -
8) -
- (201)
6) -
6) (201)
s
p) (2.1p)
Q215 Q115£m £m
292 304- (68
(49) (14243 222(20) (41223 181
(496) (449- -
(108) (24(604) (473
(54) (18(435) (310(324) (258
£bn £bn
60.4 73.1
223.9 305.6216.7 299.6
16.7 43.7
22.1 25.0366.2 497.0
27.9 29.968.6 77.9
11.3 12.410.1 11.7
13 17(1.9p) (1.5p
- -- -
(50) (15
- -
- -
- (21
(1.7p) (1.3p
5 Q414m £m4 3618) (1,0214) (352 (695) (13
1 (7089) (618- (102
4) (85) (805
8) (900) (1,6038) (1,347
n £b
70.7
6 288.96 280.6
7 50.7
0 25.50 502.49 30.89 89.1
4 14.37 13.
7 10p) (8.2p
- -- (935
5) (1
- -
- -
) (82
p) (3.0p
4 Q314 m £m 1 379 ) 275
5) (35) 5) 619 3) (42) 8) 577 8) (654) 2) - 5) (100) 5) (754) 0) (657) 3) (834) 7) (819)
n £bn
7 72.4
9 252.6 26 243.2 2
7 75.3
5 27.3 4 497.8 48 32.2 1 94.1 1
3 14.7 1 14.1 0 27 p) (5.0p) (
- - 5) -
) (18)
- -
- -
2) (679)
p) (1.0p) (
Q214 Q114£m £m
376 387 172 256
(8) 36 540 679 (98) (88)442 591
(666) (673)- -
(93) (23)(759) (696)
(72) 6 (389) (99)(333) (160)
£bn £bn
83.6 90.5
229.7 234.5 217.8 223.7
87.8 99.5
24.9 24.4 498.4 525.2
41.1 48.1 102.0 120.8
16.0 17.714.9 17.4
48 28 (2.0p) (1.0p)
- - - -
(56) -
- -
- -
- -
(1.8p) (1.0p)
4 m
) ) ) ) ) )
n
7 4 )
)

Barclays R
Barclays PLCRestatement
Barclays U
Income statTotal income Credit impairmNet operating Operating expeUK bank levy Litigation and cTotal operatingOther net incom(Loss)/profit bAttributable (lo
Balance sheLoans and advacost Total assets Customer depoRisk weighted a
PerformancReturn on averAverage allocatCost: income raLoan loss rate (
Notable itemProvisions for UGain on valuatiretirement ben
PerformancReturn on aver
Results by
C – 2015 & 2014 Document
UK
tement infor
ment charges andincome enses
conduct g expenses me/(expenses) before tax oss)/profit
eet informatiances to custom
osits assets
ce measures
rage tangible equted tangible equatio (bps)
ms
UK customer redion of a componefit liability
ce measures rage tangible equ
Quarter
4 Results
rmation
d other provision
ion
mers at amortise
uity
uity (£bn)
dress nent of the defin
excluding nuity
Q415
£m
1,834
ns (219)
1,615
(920)
(77) (1,466)
(2,463)
1
(847)
(1,078)
£bn
ed 166.1
202.5
176.8
69.5
(46.5%)
9.2
134%
51
£m
(1,391)
ned -
otable items 14.8%
21
Q315 £m 1,874 1 (154) 1,720 1 (925) - (76) (1,001) (1 1 720 541
£bn
166.7 1
204.1 2 173.4 1 71.0
23.3% (7 9.3 53% 36
£m (73)
-
s 25.8% 1
Q215 Q115£m £m
1,804 1,831(166) (167
1,638 1,664(970) (649
- -(801) (168,771) (817
1 (3(132) 844(174) 664
£bn £bn
166.1 166.0
202.2 199.6171.6 168.7
71.7 72.3
7.3%) 28.3%9.4 9.4
98% 45%40 40
£m £m
(800) (167
- 296
19.9% 24.0%
5 Q414 m £m
1,882 7) (264) 4 1,618 9) (1,041) - (59)
8) (211) 7) (1,311) 3) (3) 4 304 4 208
n £bn
0 165.3
6 198.0 7 168.3 3 69.3
% 9.3% 4 9.2
% 70% 0 62
m £m
7) (199)
6 -
% 16.2%
Q314 £m
1,898 1 (217) 1,681 1 (1,048) (1 - (32) (1,080) (1 (1) 600 442
£bn
164.3 1
190.9 1 165.9 1 71.3
19.4% (99.2
57% 1 51
£m
(24)
-
21.0% 2
Q214 Q114£m £m
1,834 1,822 (191) (229)
1,643 1,593 ,000) (1,019)
- - (850) (15),850) (1,034)
1 3 (206) 562 (208) 410
£bn £bn
163.5 162.1
185.6 184.6 166.8 165.7
69.5 69.5
9.1%) 18.3%9.0 9.0
101% 57%46 56
£m £m
(844) -
- -
20.2% 18.3%
4 m
) ) ) )
n
% 0
%
m
%

Barclays R
Barclays PLCRestatement
Analysis oAnalysis of totPersonal BankiBarclaycard CoWealth, EntrepTotal income Analysis of creother provisionPersonal BankiBarclaycard CoWealth, EntrepTotal credit improvisions Analysis of loaat amortised cPersonal BankiBarclaycard CoWealth, EntrepTotal loans andamortised cost Analysis of cusPersonal BankiBarclaycard CoWealth, EntrepTotal custome
Results by
C – 2015 & 2014 Document
of Barclaystal income ng
onsumer UK reneurs & Busin
edit impairmentns
ng
onsumer UK reneurs & Busin
mpairment charg
ans and advanceost
ng onsumer UK reneurs & Busind advances to ct
stomer depositsng
onsumer UK reneurs & Businr deposits
Quarter
4 Results
s UK
ness Banking
t charges and
ness Banking ges and other
es to customers
ness Banking customers at
s
ness Banking
Q415
£m
945
505
384
1,834
(39)
(176)
(4)
(219)
s £bn
134.0
16.2 15.9
166.1
131.0
- 45.8
176.8
22
Q315 Q2
£m £938 9552 5384 3
1,874 1,8
(36) (5(111) (10
(7) (
(154) (16
£bn £134.5 134
15.9 1516.3 15
166.7 166
128.4 126-
45.0 44173.4 171
215 Q115
£m £m 05 927 03 505 96 399 04 1,831
50) (69) 06) (95) 10) (3)
66) (167)
£bn £bn 4.4 134.3 5.8 15.7 5.9 16.0
6.1 166.0
6.7 123.4 - -
4.9 45.3 1.6 168.7
Q414
£m 955 518 409 1,882
(57) (185) (22)
(264)
£bn 133.8 15.8 15.7
165.3
124.5 - 43.8 168.3
Q314 Q
£m 968 530 400
1,898 1,
(57) (139) (
(21)
(217) (
£bn 133.3 13
15.5 115.5 1
164.3 16
122.2 12-
43.7 4165.9 16
Q214 Q114
£m £m935 929 519 511 380 382 834 1,822
(40) (57)129) (138)(22) (34)
191) (229)
£bn £bn32.6 131.5 15.2 15.0 15.7 15.6
63.5 162.1
21.1 120.0 - -
45.7 45.7 66.8 165.7
4

Barclays R
Barclays PLCRestatement
Barclays C
Income statTotal income Credit impairmNet operating Operating expeUK bank levy Litigation and cTotal operatingOther net incomProfit/(loss) bAttributable (lo
Balance sheLoans and advaamortised costTrading portfoDerivative finanDerivative finanReverse repurcsecured lendingFinancial assetTotal assets Customer depoRisk weighted a
PerformancReturn on averAverage allocatCost: income raLoan loss rate (
Notable itemGains on US LeProvisions for UProvisions for olitigation includGain on a compbenefit liability
PerformancReturn on aver
Results by
C – 2015 & 2014 Document
Corporate
tement infor
ment charges andincome enses
conduct g expenses me efore tax
oss)/profit
eet informatiances to banks at lio assets ncial instrumentncial instrumentchase agreementg s designated at
osits assets
ce measures
rage tangible equted tangible equatio (bps)
ms
ehman acquisitioUK customer redongoing investigding Foreign Excponent of the de
ce measures rage tangible equ
Quarter
4 Results
& Internat
rmation
d other provision
ion
and customers a
t assets t liabilities ts and other sim
fair value
uity
uity (£bn)
on assets dress gations and change efined retiremen
excluding nuity
tional
Q415
£m
2,968
ns (303)
2,665 (2,007)
(253) (151)
(2,411)
8
262 (24)
£bn
at 184.1
61.9 111.5
119.0
milar 24.7
46.8 532.2
185.6 194.8
(0.2%)
24.9
81%
65
£m
- -
(145)
nt -
otable items3.5%
23
Q315 £m 3,223 4 (235) 2,988 3 (2,059) (2 - (302) (2,361) (2 9 636 1 422 1
£bn
220.3 2
72.8 133.7 1 142.0 1
68.0
5.6 596.1 5
207.0 1 204.0 1
7.0% 2 24.7 73% 42
£m - (218)
(39)
-
s 9.6% 1
Q215 Q115£m £m
4,102 3,454(206) (178
3,896 3,2762,027) (1,936
- -(12) (845
2,039) (2,78113 15
1,870 5101,376 (16
£bn £bn
210.5 224.7
75.3 92.7116.0 172.8124.8 182.3
57.4 57.1
5.6 5.2566.1 656.2197.7 206.2195.4 202.6
22.5% (0.1%24.7 25.350% 81%
38 32
£m £m496 -
- -
- (800
- 133
13.9% 10.9%
5 Q414m £m4 2,945 ) (217)
6 2,728 ) (2,014)
- (248) ) (786)) (3,048)
5 7 0 (313)) (673)
n £bn
7
193.6
7 87.3 8 149.6 3 157.3
62.9
2 5.7 2 596.5 2 188.2 6 201.7
) (10.4%)3 25.6
% 103%2 44
m £m- - - -
)
(750)
3
-
% 1.9%
Q314 Q£m
3,370 3(176) (
3,194 3(1,943) (2,
- (470)
(2,413) (2,9
790 1449
£bn
206.5 2
91.5 128.7 1134.6 1
81.5
10.9 608.5 5
205.0 1205.9 1
7.4% 924.6 72%
34
£m 461
32
(500)
-
7.8% 9
Q214 Q114£m £m
,367 3,226 (151) (135),216 3,091 ,068) (2,145)
- - (62) (15)
,130) (2,160)24 12
,110 943 594 556
£bn £bn
00.6 213.1
92.8 92.8 01.8 97.2 06.7 104.0
82.1 85.5
10.9 11.5 61.9 588.8 98.0 209.3 98.7 196.7
9.6% 9.0%24.8 24.863% 67%
30 36
£m £m- - - -
- -
- -
9.6% 9.0%
4 m
) ) ) )
n
% 8
%
m
%

Barclays R
Barclays PLCRestatement
Analysis oCorporate Income statAnalysis of totCredit
Equities Macro Markets Banking fees Corporate lendTransactional bBanking Other Total income Credit impairmprovisions Total operatingProfit/(loss) be
PerformancReturn on averAverage allocat
PerformancReturn on aver
ConsumerIncome statTotal income Credit impairmTotal operatingProfit before ta
Balance sheLoans and advaamortised costCustomer depo
PerformancReturn on aver
PerformancReturn on aver
Results by
C – 2015 & 2014 Document
of Barclays and Investmtement infortal income
ding banking
ment (charges)/r
g expenses efore tax
ce measures
rage tangible equted tangible equ
ce measures rage tangible equ
, Cards & Patement infor
ment charges andg expenses ax
eet informatiances to banks at osits
ce measures
rage tangible equ
ce measures rage tangible equ
Quarter
4 Results
s Corporatement Bank
rmation
releases and oth
uity
uity (£bn)
excluding nuity
ayments
rmation
d other provision
ion
and customers a
uity
excluding nuity
e & InternaQ415
£m
195
319
382
896 458 312
415
1,185 16
2,097 er
(83)
(1,962)
52
(2.5%)
21.8
otable items1.8%
£m
871 ns (219)
(449)
210
£bn
at 32.1
41.8
15.3%
otable items15.7%
24
ational
Q315 Q2
£m
191 2416 5487 5
1,094 1,3 501 5 377 3 419 4
1,297 1,3(17) 4
2,374 3,2
(75) (
(1,940) (1,6358 1,6
4.5% 22.21.7 2
s
7.5% 12.
£m 849 8
(160) (1(421) (4278 2
£bn
30.6 2
39.8 3
24.7% 23.
s
24.7% 23.
215 Q115
£m £m
218 220 588 589 582 657 388 1,466 580 548 387 285 416 413 383 1,246 495 1 266 2,713
(42) 1
605) (2,422) 620 292
.3% (2.5%) 1.7 22.3
.6% 10.7%
£m £m 836 741 65) (179)
434) (359) 250 218
£bn £bn
9.6 29.8
8.4 40.1
.4% 17.5%
.4% 11.8%
Q414
£m
117 418 436 971
529 334 404
1,267 (4) 2,234
(26)
(2,614) (408)
(12.8%) 22.5
1.2%
£m 711 (190) (434) 93
£bn
29.7
37.9
6.6%
6.6%
Q314 Q
£m
189 370 472
1,031 1,3 420 6 334 2 420 3
1,174 1,3460
2,665 2,6
(24)
(2,036) (1,7606
6.1% 721.6 2
6.5% 7
£m 705 6
(153) ((377) (3185 2
£bn
28.4 2
37.1 3
17.3% 24
17.3% 24
Q214 Q114
£m £m
221 265 597 571 510 532 328 1,368 658 508 288 312 385 385 331 1,205
20 - 679 2,573
(13) (24)
791) (1,838)876 713
7.7% 7.1%21.9 21.9
7.7% 7.1%
£m £m688 653 138) (111)339) (322)235 230
£bn £bn
27.0 26.4
33.1 33.7
4.4% 23.8%
4.4% 23.8%
4
m
)
)
%
%
m ) )
n
%
%

Barclays R
Barclays PLCRestatement
Head Offi
Income statTotal income Credit impairmprovisions Net operating Operating expeUK bank levy Litigation and cTotal operatingOther net (expe(Loss)/profit bAttributable (lo
Balance sheTotal assets1 Risk weighted a
Notable itemOwn credit Provisions for oincluding ForeiLosses on sale and Italian bus
1 Includes Ba
Results by
C – 2015 & 2014 Document
ce
tement infor
ment releases/(ch
(expenses)/incenses
conduct g expenses enses)/income
before tax oss)/profit
eet informati
assets1
ms
ongoing investiggn Exchange relating to the Sinesses
arclays Africa.
Quarter
4 Results
rmation
harges) and oth
come
ion
gations and litiga
Spanish, Portugu
Q4
(2er
(2(
(((
(3(1
53
(1ation
(
uese (
25
415 Q315 £m £m
285) 169
- 1
285) 170 (64) (110)
(8) - (17) (42) (89) (152) (14) 2
388) 20 40) (1)
£bn £bn 59.4 61.8 39.7 41.3
£m £m 75) 195
(23) (29)
(15) -
Q215 Q1£m 312 1
(1)
311 1(64) (3
- (6)
(70) (31 (9
242 180 (2
£bn £62.2 6341.0 43
£m 282 1
-
- (9
115 Q414£m £m142 (36
-
-
142 (3634) (21
- (9(1) (735) (3795) 312 (70
28) 47
£bn £bn3.6 61.03.1 41.8
£m £m28 (62
-
-
97)
-
4 Q314 m £m 6) 100
- -
) 100 ) (10) ) - ) (4) ) (14) 3 314 ) 400 7 226
n £bn 0 68.5 8 41.6
m £m ) 44
- -
- 315
Q214 Q114£m £m15 197
- -
15 197(28) (11)
- -(42) (12)(70) (23)
- (1)(55) 173
33 68
£bn £bn69.0 63.4 40.9 49.3
£m £m(67) 119
- -
- -
4 m 7
7 ) - ) ) ) 3 8
n
m

Barclays R
Barclays PLCRestatement
Barclays A
Income statTotal income nCredit impairmNet operating Operating expeUK bank levy Litigation and cTotal operatingOther net incomProfit before taProfit after tax Attributable pr
Balance sheLoans and advaTotal assets Customer depoRisk weighted a
PerformancReturn on averAverage allocatCost: income raLoan loss rate (
Results by
C – 2015 & 2014 Document
Africa
tement infornet of insurance
ment charges andincome enses
conduct g expenses me ax ofit
eet informatiances to custom
osits assets
ce measures
rage tangible equted tangible equatio (bps)
Quarter
4 Results
rmation claims d other provision
ion
mers at amortise
uity
uity (£bn)
Q4
8ns (
7(5
(
(5
11
ed cost 2423
4
61
26
415 Q315 £m £m
814 822 (93) (66) 721 756 501) (515) (50) -
- - 551) (515)
3 1 173 242 101 168
25 85
£bn £bn 29.2 31.0 47.9 50.2 29.1 30.3 31.7 33.8
.1% 14.0% 2.4 2.4
68% 63% 115 78
Q215 Q1£m
870 9(103) (9767 8
(536) (53- -
(536) (531
232 2161 1
88 1
£bn £33.2 3552.2 5533.1 3334.4 37
13.5% 14.92.6
62% 59115
115 Q414£m £m08 92591) (7917 84639) (585
- (44- (1
39) (6302 2
80 21896 16704 85
£bn £bn5.1 34.65.9 53.73.6 33.67.3 36.7
9% 12.6%2.8 2.79% 68%97 85
4 Q314 m £m 5 895 ) (74)
6 821 ) (557)
4) - ) (1) ) (558)
2 1 8 264 7 171 5 82
n £bn 6 34.0 7 52.9 6 32.1 7 36.2
% 13.0% 17 2.5
% 62% 5 81
Q214 Q114£m £m
860 846 (99) (95)761 751
(534) (523)- - - -
(534) (523)2 5
229 233 147 169
75 92
£bn £bn33.2 34.4 50.8 52.4 32.0 32.7 34.9 34.9
12.0% 15.1%2.5 2.4
62% 62%113 106
4 m
) ) )
n
% 4
%

Performa
Barclays PLCRestatement
Returns a
Profit/(loss) atBarclays UK Barclays CorpoHead Office
Barclays Core Barclays Non-C Barclays Group
Average allocaBarclays UK Barclays CorpoHead Office2
Barclays Core Barclays Non-CBarclays Group
Period end alloBarclays UK Barclays CorpoHead Office2
Barclays Core Barclays Non-CBarclays Group
Return on averBarclays UK Barclays CorpoBarclays Core
Barclays Group
1 Profit for theother equity
2 Based on ris
nce Manag
C – 2015 & 2014 Document
nd equity
ttributable to or
orate & Internatio
Core impact
p (including Bar
ated tangible eq
orate & Internatio
Core
p
ocated tangible
orate & Internatio
Core
p
rage tangible eq
orate & Internatio
p
e period attributaby instruments.
k weighted assets
gement
4 Results
by busines
rdinary equity h
onal
rclays Africa dis
quity
onal
equity
onal
quity
onal
ble to ordinary equi
and capital deduc
ss
holders of the pa
scontinued ope
ity holders of the p
ctions in the Head
27
arent1
ration)
parent includes the
Office plus the res
e tax credit recorde
sidual balance of a
Year en31.12
(1,8
1,7(2,4
(3
Year en31.12
2
314
A31.12
2
3
4
Year en31.12
(
(0
ed in reserves in re
average tangible or
ded
2.15
£m
(33)
800
11
778 405)
324)
ded
2.15
£bn
9.3 24.9
2.6 36.8 10.9 47.7
As at
2.15
£bn
9.0 23.8
5.0 37.8
8.5 46.3
ded
2.15
%
0.3) 7.2 4.8
0.7)
espect of interest p
rdinary shareholde
Year ended31.12.14
£m869949373
2,191(2,645)
(120)
Year ended31.12.14
£bn9.1
25.0(2.7)31.415.647.0
As at31.12.14
£bn9.1
24.70.2
34.013.147.1
Year ended31.12.14
%9.53.87.0
(0.3)
payments on
ers’ equity.
d 4
m 9 9 3
)
)
d 4 n
0 ) 4 6 0
t 4 n
7 2 0
d 4
% 5 8 0
)