barclays shale oil technical teach...
TRANSCRIPT

BarclaysShale Oil Technical Teach InG R E G L E V E I L L EChief Technology OfficerMarch 20, 2018

Cautionary StatementThis presentation contains forward-looking statements. Forward-looking statements relate to future events and anticipated results of operations, business strategies, and other aspects of our operations or operating results. In many cases you can identify forward-looking statements by terminology such as "anticipate," "estimate," "believe," "continue," "could," "intend," "may," "plan," "potential," "predict," "should," "will," "expect," "objective," "projection," "forecast," "goal," "guidance," "outlook," "effort," "target" and other similar words. However, the absence of these words does not mean that the statements are not forward-looking. Where, in any forward-looking statement, the company expresses an expectation or belief as to future results, such expectation or belief is expressed in good faith and believed to have a reasonable basis. However, there can be no assurance that such expectation or belief will result or be achieved. Our actual results of operations, including our targets for our capital program and share buybacks, can and will be affected by a variety of risks and other matters including, but not limited to, our ability to liquidate the common stock issued to us by Cenovus Energy Inc. as part of our sale of assets in western Canada at prices we deem acceptable, or at all; our ability to complete the sale of our announced dispositions on the timeline currently anticipated, if at all; the possibility that regulatory approvals for our announced dispositions will not be received on a timely basis, if at all, or that such approvals may require modification to the terms of our announced dispositions or our remaining business; business disruptions during or following our announced dispositions, including the diversion of management time and attention; the ability to deploy net proceeds from our announced dispositions in the manner and timeframe we currently anticipate, if at all; changes in commodity prices; changes in expected levels of oil and gas reserves or production; operating hazards, drilling risks, unsuccessful exploratory activities; difficulties in developing new products and manufacturing processes; unexpected cost increases or technical difficulties in constructing, maintaining, or modifying company facilities; international monetary conditions and exchange rate fluctuations; potential liability for remedial actions under existing or future environmental regulations; potential liability resulting from pending or future litigation; limited access to capital or significantly higher cost of capital related to illiquidity or uncertainty in the domestic or international financial markets; and general domestic and international economic and political conditions; as well as changes in tax, environmental and other laws applicable to our business. Other factors that could cause actual results to differ materially from those described in the forward-looking statements include other economic, business, competitive and/or regulatory factors affecting our business generally as set forth in our filings with the Securities and Exchange Commission. Unless legally required, ConocoPhillips undertakes no obligation to update publicly any forward-looking statements, whether as a result of new information, future events or otherwise.Use of non-GAAP financial information – This presentation may include non-GAAP financial measures, which help facilitate comparison of company operating performance across periods and with peer companies. Any non-GAAP measures included herein will be accompanied by a reconciliation to the nearest corresponding GAAP measure either within the presentation or on our website at www.conocophillips.com/nongaap. Cautionary Note to U.S. Investors – The SEC permits oil and gas companies, in their filings with the SEC, to disclose only proved, probable and possible reserves. We use the term "resource" in this presentation that the SEC’s guidelines prohibit us from including in filings with the SEC. U.S. investors are urged to consider closely the oil and gas disclosures in our Form 10-K and other reports and filings with the SEC. Copies are available from the SEC and from the ConocoPhillips website.
2

3Source: Post 1965 to 2016 from BP Statistical Review of World Energy 2017; 2017 production estimated from multiple sources; Pre-1965 oil production from EIA; Pre-1970 natural gas estimated from multiple sources.
United States Oil and Natural Gas Production History
0
5
10
15
20
25
1860
1875
1890
1905
1920
1935
1950
1965
1980
1995
2010
2025
Peak U.S.ConventionalProduction
Unconventional ReservoirRelated Production Growth
Million BOE per Day
2005
1972

U.S. Oil Production is at Record Levels; Texas Leading the Way
UAE,All Others
U.S. and Texas Oil Production Data from U.S. EIA
Texas Oil Production(Million BO per Day)
U.S. Oil Production(Million BO per Day)
7
8
9
10
Jan.2013
Jan.2015
Jan.2016
Jan.2017
Jan.2018
Jan.2014
9.63
8.55
10.04
3.0
3.5
4.0
4.5
Jan.2017
Jan.2018
Iraq
IranChina
Canada3.93
3.20
U.S., Russia,Saudi Arabia
4
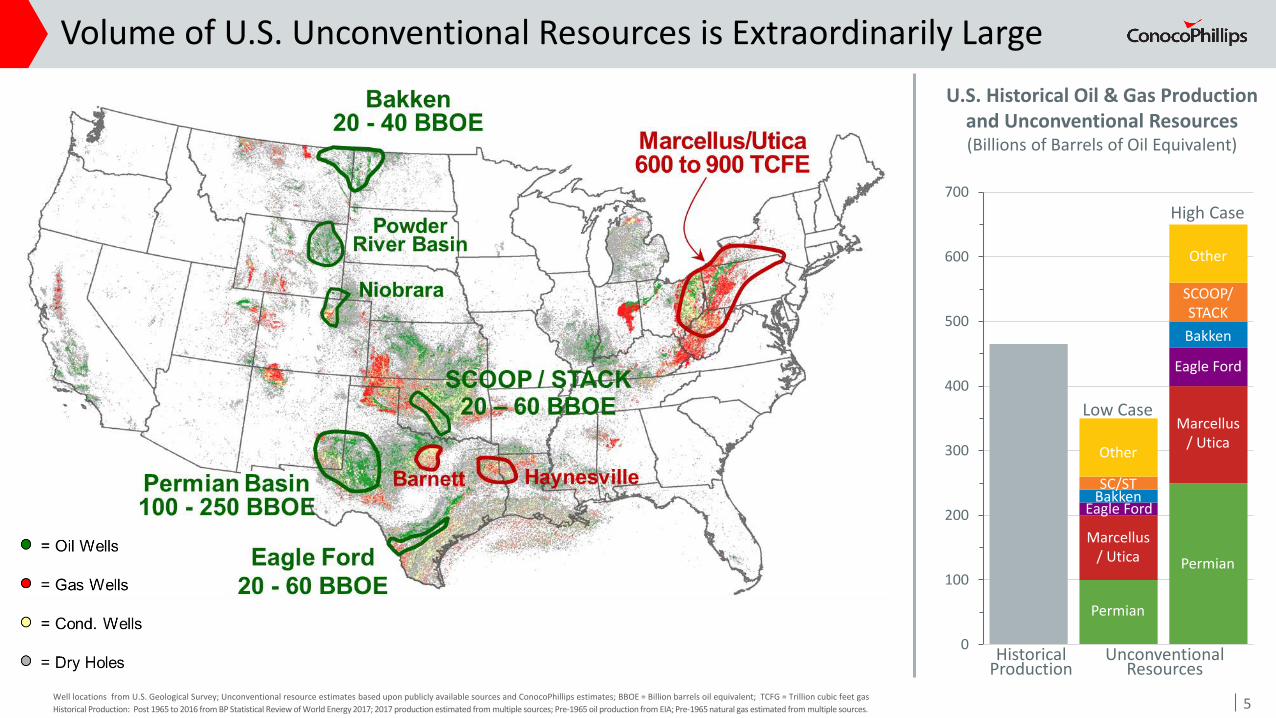
Volume of U.S. Unconventional Resources is Extraordinarily Large
Well locations from U.S. Geological Survey; Unconventional resource estimates based upon publicly available sources and ConocoPhillips estimates; BBOE = Billion barrels oil equivalent; TCFG = Trillion cubic feet gasHistorical Production: Post 1965 to 2016 from BP Statistical Review of World Energy 2017; 2017 production estimated from multiple sources; Pre-1965 oil production from EIA; Pre-1965 natural gas estimated from multiple sources.
0
100
200
300
400
500
600
700
Permian
Permian
Marcellus/ Utica
Marcellus/ Utica
Eagle Ford
Eagle Ford
Bakken
Bakken
Other
Other
U.S. Historical Oil & Gas Production and Unconventional Resources(Billions of Barrels of Oil Equivalent)
HistoricalProduction
UnconventionalResources
Low Case
High Case
SCOOP/STACK
SC/ST
5

Horizontal Drilling & Fracing have Enabled Unconventional Revolution
Horizontal Fracturing Techniques
Open Hole Pump & Pray
Open Hole Sliding Sleeves
Cemented Plug & Perf
2012 2017
5,000’5,000’
70 PerfClusters
300 PerfClusters
3.5 MM lbs.Proppant
15.5 MM lbs.Proppant
Fracturing IntensityU.S. Well Trajectories
0%
10%
20%
30%
40%
50%
60%
70%
80%
90%
100%
0%
10%
20%
30%
40%
50%
60%
70%
80%
90%
100%
Jan-
00
Jan-
02
Jan-
04
Jan-
06
Jan-
08
Jan-
10
Jan-
12
Jan-
14
Jan-
16
Jan-
18
Horizontal
Vertical & Directional
Rig count data from Baker Hughes GE website 6

Technical Knowledge Enables Rapid Improvement in Completion Design
7
Stimulated Rock Volume (SRV) Insights
SRV Understanding Enabled
Production Months
Cum
ulat
ive
Prod
uctio
n
0 36
7
Per Well Production Volumes
CorePhoto
ImageLog
ConocoPhillips Eagle Ford SRV Pilot: Wellbore Side View
Fracture StimulatedDevelopment Well
Fractures in Post-Frac Wells
Pressure Gauges
Vintage 1
Vintage 2Vintage 3Vintage 4
Two Feet

Daily
Pro
duct
ion
(boe
pd)
Adding Resources by Refracing Wells with Early-Vintage Completions
2015 2017
Refrac Cost ExampleRefrac Incremental Production Example
Pre-Refrac Forecast
Actual
8
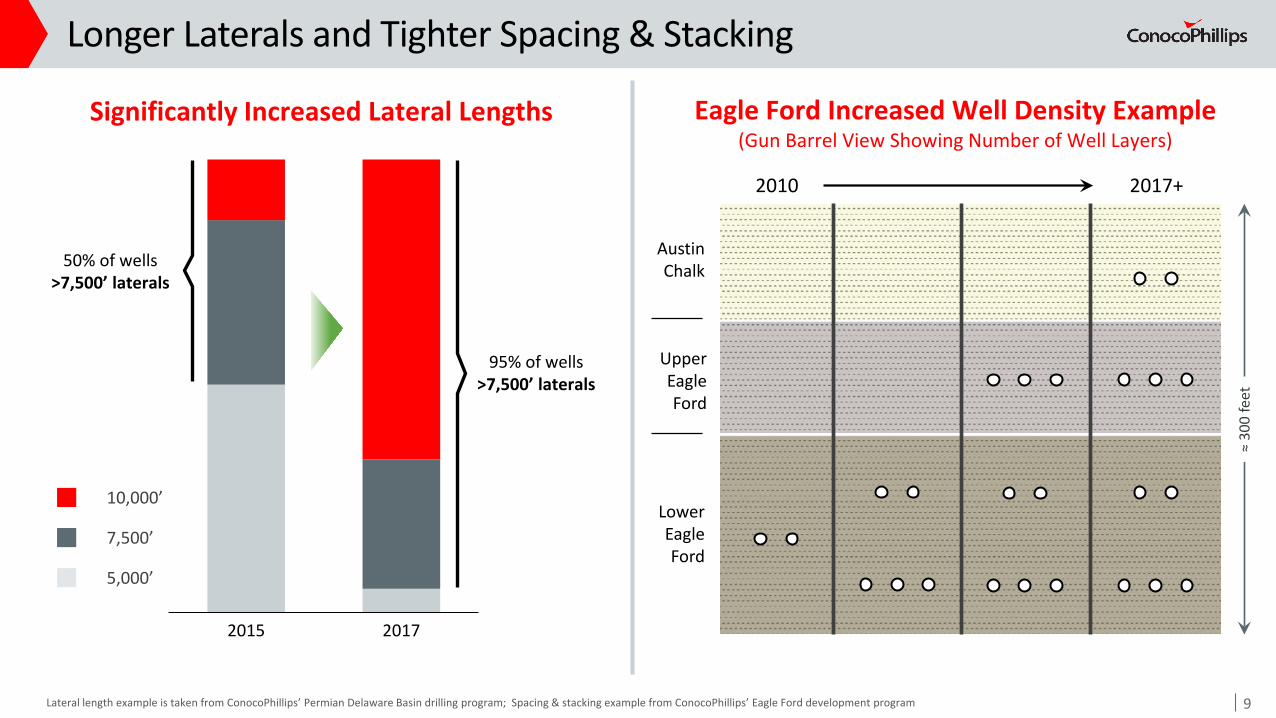
Longer Laterals and Tighter Spacing & Stacking
2015 2017
95% of wells >7,500’ laterals
Significantly Increased Lateral Lengths
50% of wells >7,500’ laterals
Lateral length example is taken from ConocoPhillips’ Permian Delaware Basin drilling program; Spacing & stacking example from ConocoPhillips’ Eagle Ford development program
10,000’
5,000’
7,500’
Eagle Ford Increased Well Density Example(Gun Barrel View Showing Number of Well Layers)
AustinChalk
LowerEagleFord
2010 2017+
UpperEagleFord
≈ 30
0 fe
et
9
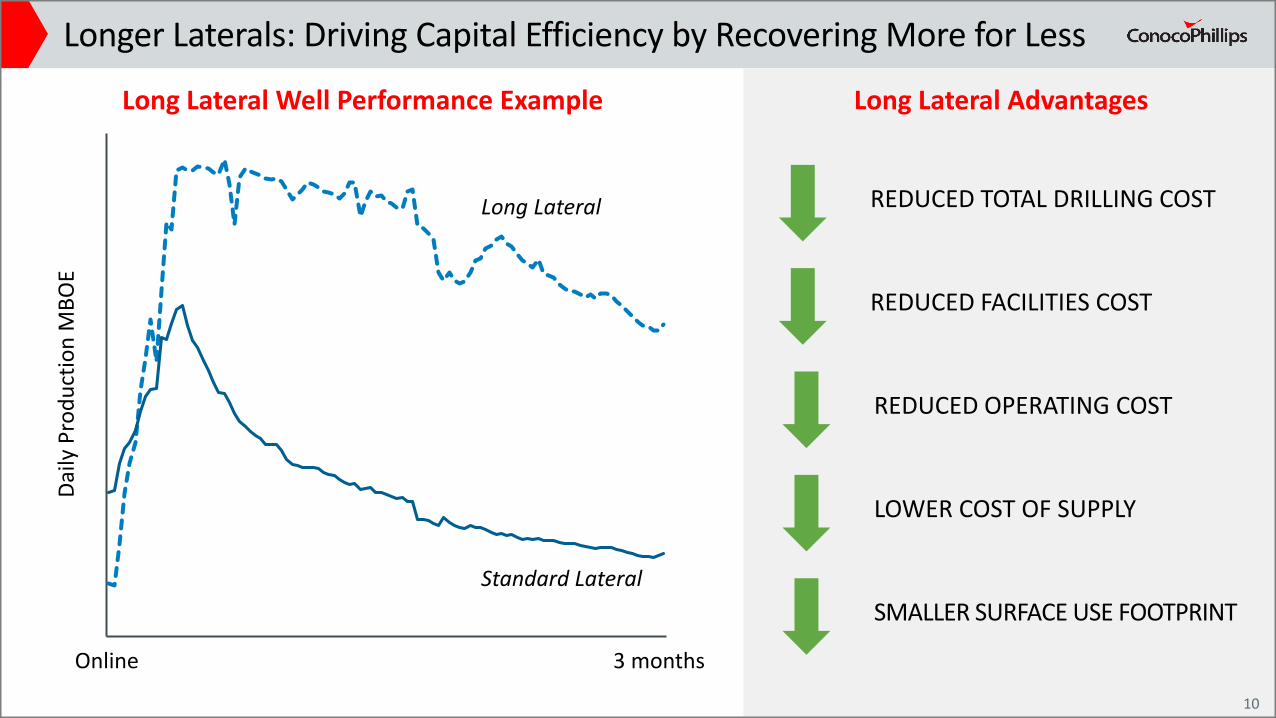
Longer Laterals: Driving Capital Efficiency by Recovering More for Less
Long Lateral
Standard Lateral
Online 3 months
Daily
Pro
duct
ion
MBO
ELong Lateral Well Performance Example Long Lateral Advantages
10
REDUCED TOTAL DRILLING COST
REDUCED FACILITIES COST
REDUCED OPERATING COST
SMALLER SURFACE USE FOOTPRINT
LOWER COST OF SUPPLY

The E&P Industry is Also Undergoing a Digital Technology Revolution
11
Unconventional Advantages
IntegratedData
Warehouse
ADVANCED ANALYTICS IMPLEMENTATION
Spud
to S
pud
Days
2013 2014 2015 2016
50% REDUCTIONIN DRILLING DAYS
ConocoPhillips Eagle Ford ResultsConocoPhillips Data Analytics Approach
DATA-DRIVEN
DECISIONS
NEW INSIGHTS
ProprietaryAlgorithms
DataVisualization
AdvancedAnalytics
Data
Data Data
Data
Abundant Data to Analyze
Numerous Operators
Rapid, Low Cost Experimentation
Small per Well Gains = Big Wins
Considerable Play-to-Play Synergy
11
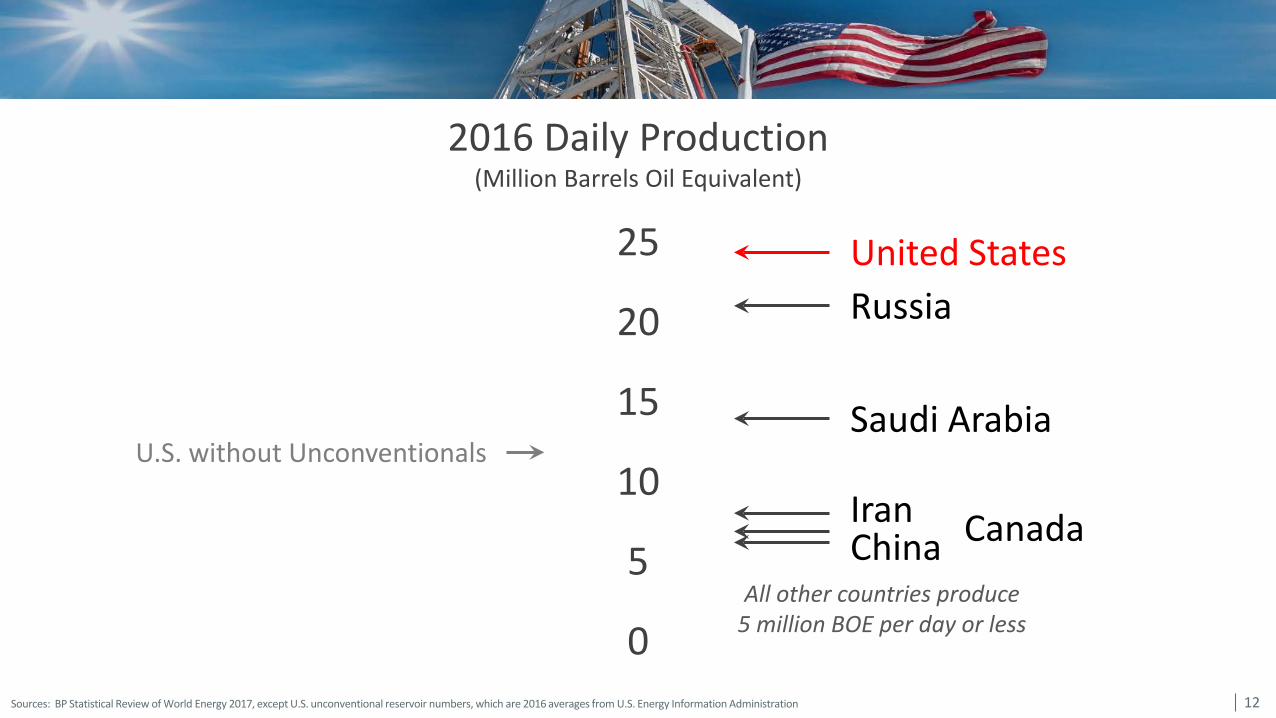
Sources: BP Statistical Review of World Energy 2017, except U.S. unconventional reservoir numbers, which are 2016 averages from U.S. Energy Information Administration
2016 Daily Production(Million Barrels Oil Equivalent)
United StatesRussia
Saudi Arabia
IranChina
All other countries produce5 million BOE per day or less
U.S. without Unconventionals
Canada
25
20
15
10
5
012
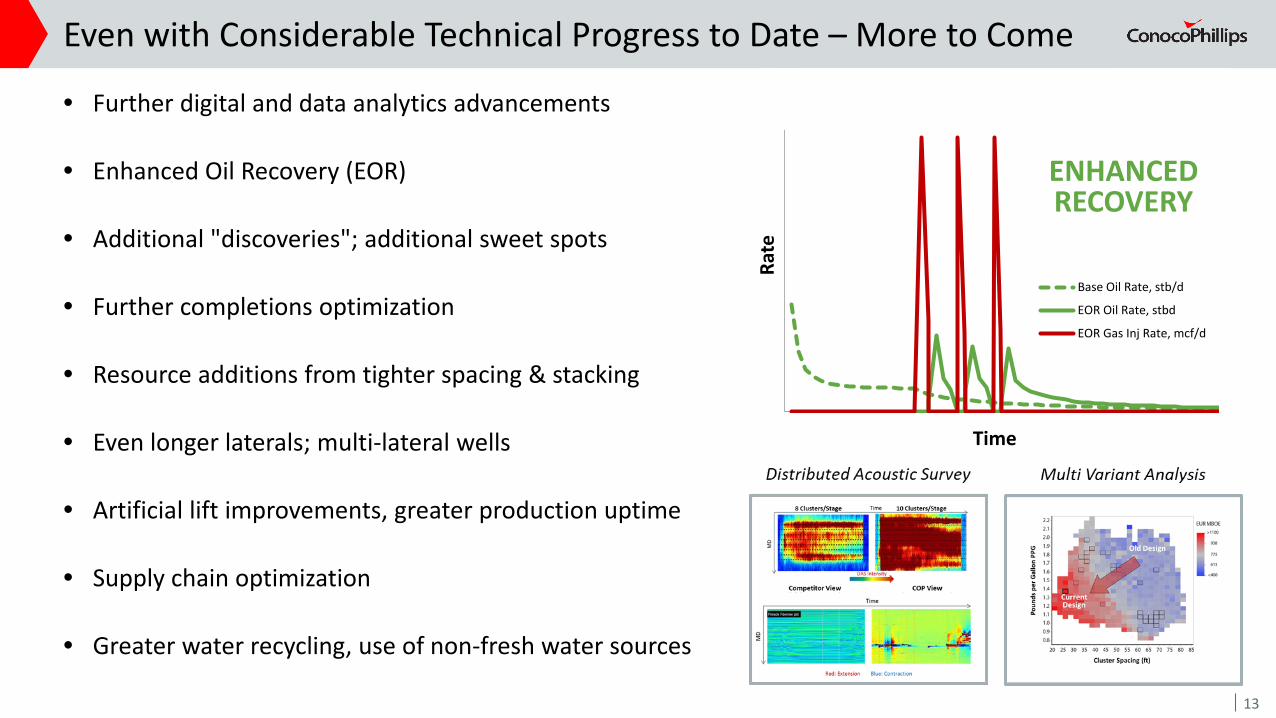
• Further digital and data analytics advancements
• Enhanced Oil Recovery (EOR)
• Additional "discoveries"; additional sweet spots
• Further completions optimization
• Resource additions from tighter spacing & stacking
• Even longer laterals; multi-lateral wells
• Artificial lift improvements, greater production uptime
• Supply chain optimization
• Greater water recycling, use of non-fresh water sources
Even with Considerable Technical Progress to Date – More to Come
13
Base Oil Rate, stb/d
EOR Oil Rate, stbd
EOR Gas Inj Rate, mcf/d
Time
Rate
ENHANCED RECOVERY

ConocoPhillips is an Industry Leader in Unconventional E&P
Cost of Supply
Unconventional Resources
15 BBOE ~8 BBOE
Megatrend
$40-50/BBL
$30-40/BBL
<$30/BBL
CONVENTIONAL
LNG & OIL SANDS
UNCONVENTIONAL
Montney
Niobrara
T E X A S
N E WM E X I C O
M O N T A N A
C O L O R A D O
B R I T I S H C O L U M B I A
~8 BBOE RESOURCES<$35/BBL average cost of supply
Asset Class
14 Graphic excerpted from ConocoPhillips’ November 2017 Analyst & Investor Meeting Slide Deck
Eagle Ford
Permian
N O R T H D A K O T A
Bakken
14
Key Takeaway Messages
• Unconventional revolution has rejuvenated U.S. E&P industry
• Concurrent digital and data analytics revolution
• World-class discoveries plus rapid technology advancements
• Expect additional progress in lowering cost-of-supply
• ConocoPhillips is proud to be an unconventional industry leader
15 15
BarclaysShale Oil Technical Teach InG R E G L E V E I L L EChief Technology OfficerMarch 20, 2018