bargains - annualreports.com€¦ · bargains you can count on since 1982, our customers have...
TRANSCRIPT
Bargains
Ross Stores, Inc. 2014 Annual Report
Ross Stores, Inc.
5130 Hacienda Drive
Dublin, CA 94568-7579
(925) 965-4400
www.rossstores.com
To minimize our environmental impact, the Ross Stores 2014 Annual Report
was printed on papers containing fibers from environmentally appropriate,
socially beneficial and economically viable forest resources.
Sustainable Choice. Reduce, Reuse & Recycle.
Ro
ss
Sto
res
, Inc
. 20
14
An
nu
al R
ep
ort
16185_Ross AR14_COVER_CS6-r4.indd 1 3/31/15 4:04 PM

Bargains You Can Count On Since 1982, our customers have counted on us for great bargains. More than 30 years
later, our main focus remains unchanged – to deliver the best name brand fashions at
incredible values. We accomplish this through our two off-price apparel and home fashion
chains, Ross Dress for Less® (“Ross”) and dd’s DISCOUNTS®. Ross Dress for Less is the
largest off-price apparel and home fashion chain in the U.S. with over 1,200 stores in 33
states, the District of Columbia and Guam, while dd’s DISCOUNTS operates over 150
stores in 15 states. Ross offers name brand designer apparel, accessories, footwear and
home fashions for the entire family at savings of 20% to 60% off department store and
specialty store regular prices every day. dd’s DISCOUNTS features a more moderately-priced
assortment at savings of 20% to 70% off moderate department and discount store prices
every day. We plan to maximize the significant opportunities we have for profitable growth
in the years ahead by continuing to deliver the values our customers have come to expect.
Corporate Data
Corporate HeadquartersRoss Stores, Inc.
5130 Hacienda Drive
Dublin, California 94568-7579
(925) 965-4400
Corporate Websitewww.rossstores.com
New York Buying OfficeRoss Stores, Inc.
1372 Broadway, 2nd Floor
New York, New York 10018-6141
Los Angeles Buying OfficeRoss Stores, Inc.
110 East 9th Street, Suite A-979
Los Angeles, California 90079-1979
Annual Report (Form 10-K)A copy of the Company’s 2014 Annual
Report on Form 10-K as filed with the
Securities and Exchange Commission is
available from our corporate website, or
without charge, by contacting the following:
Investor Relations Department
Ross Stores, Inc
5130 Hacienda Drive
Dublin, California 94568-7579
Transfer Agent and RegistrarComputershare
P. O. Box 30170
College Station, Texas 77842
or
Overnight Correspondence
211 Quality Circle, Suite 210
College Station, Texas 77845
Inquiries by:
Websitewww.computershare.com/investor
or
Onlinehttps://www-us.computershare.com/investor/Contact
Telephone1-866-455-3120 (domestic holders)1-800-231-5469 (TDD#)1-201-680-6578 (foreign holders)1-201-680-6610 (foreign TDD#)
16185_Ross AR14_COVER_CS6-r3.indd 2 3/31/15 12:50 PM

1 2012 results are based on a 53-week fiscal year; all other years are on a 52-week basis.
2 Includes cash dividends and stock repurchases.
Financial Highlights1
1110 12
Earnings Per Share
13 14
$2.86
$2.31
$3.53
$3.88
$4.42
1110 12
Total Sales($ billions)
13 14
$11.0
$8.6
$7.9
$9.7$10.2
1110 12
Cash Returned to Stockholders2
($ millions)
13 14
$552
$452
$576
$698
$718
1110 12
Return on Average Stockholders’ Equity
13 14
47%45%
48%
44%
43%
Ross Stores, Inc. 2014 Annual Report | 1
16185_Ross AR14_Editorial_CS6-r2.indd 1 3/30/15 6:33 PM

To Our StockholdersDelivering bargains that our customers can count on every day will always be our top
priority at both Ross Dress for Less and dd’s DISCOUNTS. We are pleased to report
that the successful execution of this core strategy drove another year of solid sales and
earnings growth in fiscal 2014.
Solid Sales and EPS Growth in Fiscal 2014
For the fiscal year ended January 31, 2015, sales grew
8% to $11.0 billion, up from $10.2 billion for the fiscal
year ended February 1, 2014. Comparable store sales
for 2014 increased 3% over the prior year.
Net earnings were $925 million in 2014, up from $837
million in the prior year. Earnings per share grew to $4.42
compared to $3.88 in 2013, up 14% on top of strong
multi-year gains. Operating margin increased 35 basis
points in 2014 to 13.5%, benefiting from a combination
of higher merchandise gross margin and leverage on
operating expenses.
Ongoing Store Growth and Expansion into New Markets
As planned, the Company opened 86 net new locations
during the year, consisting of 64 Ross Dress for Less
and 22 dd’s DISCOUNTS. We ended 2014 with a
combined 1,362 stores in 33 states, the District of
Columbia and Guam.
Our store growth included ongoing expansion of Ross
Dress for Less in established regions as well as the
new markets we entered beginning in October 2011.
By the end of 2014, we operated a total of 81 Ross
locations in Illinois, Missouri, Kansas, Kentucky and
Indiana. dd’s DISCOUNTS also entered five new states
in 2014 including Louisiana, New Jersey, North Carolina,
Oklahoma and Oregon.
For 2015, we plan to open about 70 new Ross Dress for
Less and 20 dd’s DISCOUNTS stores. As usual, these
numbers do not reflect our plans to close or relocate
about ten older locations.
We continue to believe that Ross Dress for Less can grow
into a chain of at least 2,000 locations across the United
States and that dd’s DISCOUNTS can eventually expand
to about 500 stores. Combined, this reflects projected
long-term domestic capacity of about 2,500 locations,
providing us with significant store growth potential over
the next several years.
Continued Gains in Sales and Profits at dd’s DISCOUNTS
dd’s DISCOUNTS delivered another year of solid gains in
sales and ongoing operating profits in 2014. Like Ross,
dd’s DISCOUNTS continued to benefit from their ability to
deliver a faster flow of fresh and exciting product to their
stores while operating on lower inventory levels. Its solid
performance also reflects that dd’s customers continue
to respond favorably to its compelling value offerings.
Healthy Cash Flows Fund Growth and Ongoing Stock Repurchases
Operating cash flows in 2014 helped fund new store
expansion and infrastructure improvements to support our
long-term growth. We invested approximately $650 million
of capital during the year, including about $200 million
to open new locations and update existing stores, $240
million for distribution and information technology projects,
2 | 2014 Annual Report Ross Stores, Inc.
16185_Ross AR14_Editorial_CS6-r2.indd 2 3/30/15 6:33 PM

Another year of solid sales and earnings growth in fiscal 2014.
Ross Stores, Inc. 2014 Annual Report | 3
16185_Ross AR14_Editorial_CS6-r2.indd 3 3/30/15 6:33 PM

Our top priority will always be delivering the best values possible to our customers.
4 | 2014 Annual Report Ross Stores, Inc.
16185_Ross AR14_Editorial_CS6-r2.indd 4 3/30/15 6:33 PM

Ross Stores, Inc. 2014 Annual Report | 5
13%Shoes
13%
13% 24%
29%
8%
Men’s
Accessories, Lingerie, Fine Jewelry, Fragrances
Home Accents, Bed and Bath
Ladies
Children’s
and $210 million for the acquisition of our New York Buying
Office building, which we financed with a $250 million
bond offering. We ended the year with approximately
$700 million in cash and short-term investments and
$400 million in long-term debt.
For fiscal 2015, capital expenditures are expected to be
approximately $450 million to fund new store openings
as well as ongoing infrastructure investments, including
the completion of another new distribution center.
During 2014, we repurchased $550 million of common
stock, or about 7.4 million shares, under the two-year
$1.1 billion stock repurchase program authorized by our
Board of Directors at the beginning of 2013. In February
2015, we announced a new two-year $1.4 billion stock
repurchase program to be completed during fiscal 2015
and 2016. Our Board also approved an increase in the
quarterly cash dividend to $.235 per share, up 18% on
top of an 18% increase in the prior year.
The growth of our stock repurchase and dividend
programs has been driven by the large amounts of cash
our business generates after funding store expansion
and other capital needs. We have repurchased stock
as planned every year since 1993 and have also raised
our quarterly cash dividend annually since 1994. This
consistent record reflects our unwavering commitment
to enhancing stockholder value and returns.
Flexible Business Model Enhances Long-Term Profitability
We are pleased with the solid sales and earnings growth
we achieved in 2014. In 2015, we will continue to focus
on the initiatives that have driven our success over the
past several years.
First, our top priority will always be delivering the best
values possible to our customers. As a result, we will
continue to make strategic investments in merchandising.
The people and processes of this critical organization are
key to gaining access to the most desirable name brand
products available in the marketplace.
Second, we will continue to operate our business with
lean selling store inventory levels. Over the past several
years, we have reduced in-store inventories by more than
40%, which has contributed to improved sales and gross
margins. For 2015, we are planning selling store inventories
to be down slightly on top of these multi-year declines.
16185_Ross AR14_Editorial_CS6-r2.indd 5 3/31/15 10:25 AM
6 | 2014 Annual Report Ross Stores, Inc.
Finally, we will continue to maintain tight expense control
throughout our entire Company. This has helped drive
profitability while still enabling us to invest in the most vital
areas of our business to support our long-term growth.
Looking ahead, we are excited and optimistic about our
long-term prospects, as we believe that off-price will
remain a strong-performing sector of the retail industry
for the foreseeable future. We know that consistently
delivering bargains our customers can count on every
day will always be the key to enhancing our opportunities
for growth in both sales and profits over the short
and long term.
Social Responsibility at Ross
The six Ross Dress for Less stores we opened in Northern
California in 1982 have grown into the largest off-price
apparel and home fashion chain in the United States, with
1,210 locations at the end of 2014. dd’s DISCOUNTS,
which we launched in 2004, had 152 stores at year end.
Our success over the past 32 years has been driven by
an unwavering commitment to creating value, with a
focus on excellence, ethics and integrity in all we do. This
extends far beyond our mission of offering customers
great name brand bargains. It also means enhancing
the lives of more than 71,400 associates by providing a
work environment where they can grow and succeed.
Our greatest assets are the people that work in our
stores, distribution centers and offices. They play a key
role in delivering great value to our customers and we
want to recognize their hard work and commitment
in contributing to our ongoing success. Further, we
continue to support the communities where we operate
through local hiring and philanthropic efforts, including
a foundation we established in 2013 that supports our
charitable mission to help create a brighter future for
today’s youth. In addition, we continually look for ways
to strengthen operating efficiencies while minimizing
our impact on the environment.
In closing, we would l ike to thank all of our
customers, business partners and stockholders
for their continued support.
Sincerely,
16185_Ross AR14_Editorial_CS6-r2.indd 6 3/30/15 6:33 PM
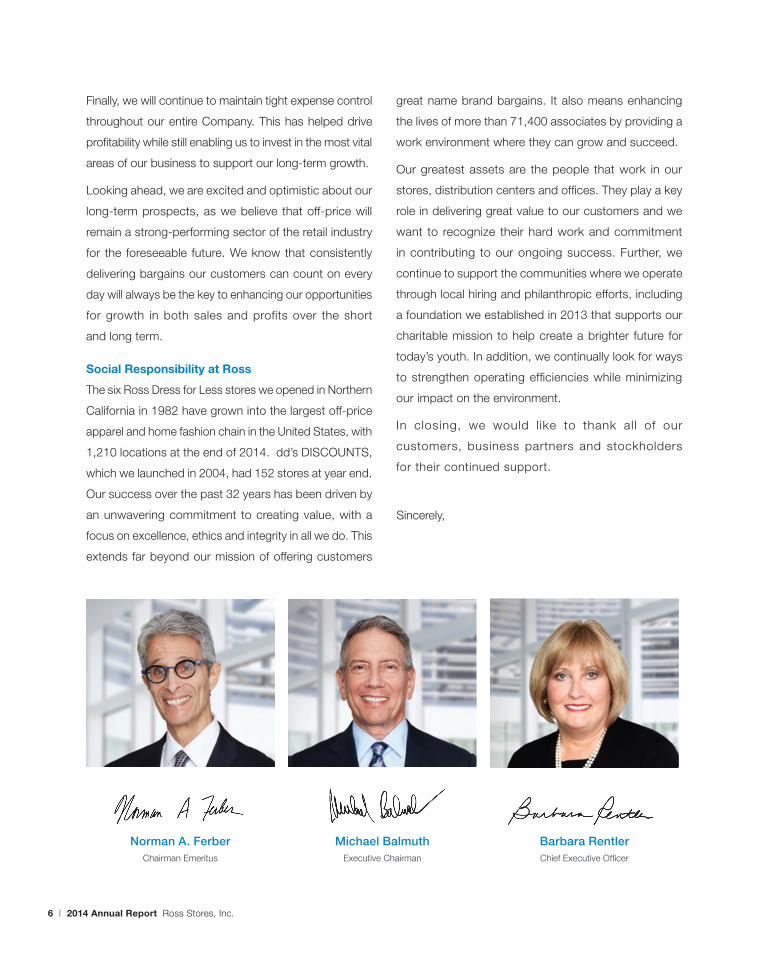
Norman A. FerberChairman Emeritus
Michael BalmuthExecutive Chairman
Barbara RentlerChief Executive Officer

Our greatest assets are the people that work in our stores, distribution centers and offices.
Ross Stores, Inc. 2014 Annual Report | 7
16185_Ross AR14_Editorial_CS6-r2.indd 7 3/30/15 6:33 PM

Alabama 19Arizona* 68Arkansas 6California* 335Colorado 30Delaware 1District of Columbia 1Florida* 166Georgia* 51
Guam 1Hawaii 17Idaho 10Illinois 49Indiana 5Kansas 6Kentucky 5Louisiana* 14Maryland* 23
Mississippi 8Missouri 16Montana 6Nevada* 31New Jersey* 13New Mexico* 10North Carolina* 38Oklahoma* 20Oregon* 31
Pennsylvania 43South Carolina* 21Tennessee* 29Texas* 197Utah 16Virginia 34Washington 40Wyoming 2
1,362 stores across 33 states
8 | 2014 Annual Report Ross Stores, Inc.
* Includes 67, 30, 24, and nine dd’s DISCOUNTS stores in California, Texas, Florida and Arizona, respectively, seven stores in Georgia, three in Nevada, two
each in Maryland, New Mexico and Tennessee, and one store each in Louisiana, New Jersey, North Carolina, Oklahoma, Oregon and South Carolina.
Locations
16185_Ross AR14_Editorial_CS6-r3.indd 8 4/1/15 12:44 PM

Form 10-KRoss Stores, Inc.
16185_Ross AR14_10K_CS6-r3.indd 1 3/31/15 9:30 AM

Table of Contents
Business 12Selected Financial Data 24Management’s Discussion and Analysis 26Financial Statements and Supplementary Data 36Notes to Consolidated Financial Statements 40Report of Independent Registered Public Accounting Firm 60Signatures 66Index to Exhibits 67Certifications 73
Index to Other Information
Directors and Officers 76Corporate Data Inside Back Cover
16185_Ross AR14_10K_CS6-r4.indd 2 3/31/15 4:11 PM

UNITED STATES SECURITIES AND EXCHANGE COMMISSIONWashington, D.C. 20549
FORM 10-K (Mark one) X ANNUAL REPORT PURSUANT TO SECTION 13 OR 15(d) OF THE SECURITIES EXCHANGE ACT OF 1934 For the fiscal year ended January 31, 2015
or TRANSITION REPORT PURSUANT TO SECTION 13 or 15(d) OF THE SECURITIES EXCHANGE ACT OF 1934 For the transition period from ________ to ________
Commission file number 0-14678
Ross Stores, Inc.(Exact name of registrant as specified in its charter)
Delaware 94-1390387 (State or other jurisdiction of incorporation or organization) (I.R.S. Employer Identification No.)
5130 Hacienda Drive, Dublin, California 94568-7579 (Address of principal executive offices) (Zip Code)
Registrant’s telephone number, including area code (925) 965-4400
Securities registered pursuant to Section 12(b) of the Act:
Title of each class Name of each exchange on which registered ________________ ________________________________________ Common stock, par value $.01 Nasdaq Global Select Market
Securities registered pursuant to Section 12(g) of the Act:Title of each class________________
None
Indicate by check mark if the registrant is a well-known seasoned issuer, as defined in Rule 405 of the Securities Act. Yes X No
Indicate by check mark if the registrant is not required to file reports pursuant to Section 13 or Section 15(d) of the Act. Yes No X
Indicate by check mark whether the registrant (1) has filed all reports required to be filed by Section 13 or 15(d) of the Securities Exchange Act of 1934 during the preceding 12 months (or for such shorter period that the registrant was required to file such reports), and (2) has been subject to such filing requirements for the past 90 days. Yes X No
Indicate by check mark whether the registrant has submitted electronically and posted on its corporate Web site, if any, every Interactive Data File required to be submitted and posted pursuant to Rule 405 of Regulation S-T (§232.405 of this chapter) during the preceding 12 months (or for such shorter period that the registrant was required to submit and post such files). Yes X No
Indicate by check mark if disclosure of delinquent filers pursuant to Item 405 of Regulation S-K is not contained herein, and will not be contained, to the best of registrant’s knowledge, in definitive proxy or information statements incorporated by reference in Part III of this Form 10-K or any amendment to this Form 10-K.
Indicate by check mark whether the registrant is a large accelerated filer, an accelerated filer, a non-accelerated filer, or a smaller reporting company. See definitions of “large accelerated filer,” “accelerated filer” and “smaller reporting company” in Rule 12b-2 of the Exchange Act. Large accelerated filer X Accelerated filer Non-accelerated filer Smaller reporting company
Indicate by check mark whether the registrant is a shell company (as defined in Rule 12b-2 of the Act). Yes No X
The aggregate market value of the voting common stock held by non-affiliates of the Registrant as of August 2, 2014 was $13,252,215,244, based on the closing price on that date as reported by the NASDAQ Global Select Market®. Shares of voting stock held by each director and executive officer have been excluded in that such persons may be deemed to be affiliates. This determination of affiliate status is not necessarily a conclusive determination for other purposes.
The number of shares of Common Stock, with $.01 par value, outstanding on March 9, 2015 was 207,489,276.
Documents incorporated by reference:
Portions of the Proxy Statement for the Registrant’s 2015 Annual Meeting of Stockholders, which will be filed on or before June 1, 2015, are incorporated herein by reference into Part III.
11
16185_Ross AR14_10K_CS6-r3.indd 11 3/31/15 9:30 AM
PART I
ITEM 1. BUSINESS
Ross Stores, Inc. and its subsidiaries (“we” or the “Company”) operate two brands of off-price retail apparel and home fashion stores—Ross Dress for Less® (“Ross”) and dd’s DISCOUNTS®.
Ross is the largest off-price apparel and home fashion chain in the United States, with 1,210 locations in 33 states, the District of Columbia and Guam, as of January 31, 2015. Ross offers first-quality, in-season, name brand and designer apparel, accessories, footwear, and home fashions for the entire family at savings of 20% to 60% off department and specialty store regular prices every day. Ross’ target customers are primarily from middle income households.
We also operate 152 dd’s DISCOUNTS stores in 15 states as of January 31, 2015. dd’s DISCOUNTS features more moderately-priced first-quality, in-season, name brand apparel, accessories, footwear, and home fashions for the entire family at savings of 20% to 70% off moderate department and discount store regular prices every day. The typical dd’s DISCOUNTS store is located in an established shopping center in a densely populated urban or suburban neighborhood and its target customers typically come from households with more moderate incomes than Ross customers.
The merchant, store, and distribution organizations for Ross and dd’s DISCOUNTS are separate and distinct. The two chains share certain other corporate and support services.
Both our Ross and dd’s DISCOUNTS brands target value-conscious women and men between the ages of 18 and 54. The decisions we make, from merchandising, purchasing, and pricing, to the locations of our stores, are based on these customer profiles. We believe that both brands derive a competitive advantage by offering a wide assortment of product within each of our merchandise categories in organized and easy-to-shop store environments.
Our mission is to offer competitive values to our target customers by focusing on the following key strategic objectives:
• Maintain an appropriate level of recognizable brands, labels, and fashions at strong discounts throughout the store.
• Meet customer needs on a local basis.
• Deliver an in-store shopping experience that reflects the expectations of the off-price customer.
• Manage real estate growth to compete effectively across all our markets.
We refer to our fiscal years ended January 31, 2015, February 1, 2014, and February 2, 2013 as fiscal 2014, fiscal 2013, and fiscal 2012, respectively. Fiscal 2014 and 2013 were each 52-week years. Fiscal 2012 was a 53-week year.
Merchandising, Purchasing, and Pricing
We seek to provide our customers with a wide assortment of first-quality, in-season, brand name and designer apparel, accessories, footwear, and home merchandise for the entire family at savings of 20% to 60% below department and specialty store regular prices every day at Ross, and 20% to 70% below moderate department and discount store regular prices at dd’s DISCOUNTS. We sell recognizable brand name merchandise that is current and fashionable in each category. New merchandise typically is received from three to six times per week at both Ross and dd’s DISCOUNTS stores. Our buyers review their merchandise assortments on a weekly basis, enabling them to respond to selling trends and purchasing opportunities in the market. Our merchandising strategy is reflected in our advertising, which emphasizes a strong value message. Our stores offer a treasure-hunt shopping experience where customers can find great savings every day on a broad assortment of brand name bargains for the family and the home.
Merchandising. Our merchandising strategy incorporates a combination of off-price buying techniques to purchase advance-of-season, in-season, and past-season merchandise for both Ross and dd’s DISCOUNTS. We believe nationally recognized name brands sold at compelling discounts will continue to be an important determinant of our success. We generally leave the brand name label on the merchandise we sell.
12
16185_Ross AR14_10K_CS6-r3.indd 12 3/31/15 9:30 AM

We have established merchandise assortments that we believe are attractive to our target customers. Although we offer fewer classifications of merchandise than most department stores, we generally offer a large selection within each classification with a wide assortment of vendors, labels, prices, colors, styles, and fabrics within each size or item. The mix of comparable store sales by department in fiscal 2014 was approximately as follows: Ladies 29%, Home Accents and Bed and Bath 24%, Accessories, Lingerie, Fine Jewelry, and Fragrances 13%, Men’s 13%, Shoes 13%, and Children’s 8%. These merchandise offerings include, but are not limited to, small furniture and furniture accents, educational toys and games, luggage, gourmet food and cookware, watches, and sporting goods.
Purchasing. We have a combined network of approximately 8,200 merchandise vendors and manufacturers for both Ross and dd’s DISCOUNTS and believe we have adequate sources of first-quality merchandise to meet our requirements. We purchase the vast majority of our merchandise directly from manufacturers, and we have not experienced any difficulty in obtaining sufficient merchandise inventory.
We believe that our ability to effectively execute certain off-price buying strategies is a key factor in our success. Our buyers use a number of methods that enable us to offer our customers brand name and designer merchandise at strong discounts every day relative to department and specialty stores for Ross and moderate department and discount stores for dd’s DISCOUNTS. By purchasing later in the merchandise buying cycle than department, specialty, and discount stores, we are able to take advantage of imbalances between retailers’ demand for products and manufacturers’ supply of those products.
Unlike most department and specialty stores, we typically do not require that manufacturers provide promotional allowances, co-op advertising allowances, return privileges, split shipments, drop shipments to stores, or delayed deliveries of merchandise. For most orders, only one delivery is made to one of our five distribution centers. These flexible requirements further enable our buyers to obtain significant discounts on in-season purchases.
The majority of the apparel and apparel-related merchandise that we offer in all of our stores is acquired through opportunistic purchases created by manufacturer overruns and canceled orders both during and at the end of a season. These buys are referred to as “close-out” and “packaway” purchases. Close-outs can be shipped to stores in-season, allowing us to get in-season goods into our stores at lower prices. Packaway merchandise is purchased with the intent that it will be stored in our warehouses until a later date, which may even be the beginning of the same selling season in the following year. Packaway purchases are an effective method of increasing the percentage of prestige and national brands at competitive savings within our merchandise assortments. Packaway merchandise is mainly fashion basics and, therefore, not usually affected by shifts in fashion trends.
In fiscal 2014, we continued our emphasis on this important sourcing strategy in response to compelling opportunities available in the marketplace. Packaway accounted for approximately 45% and 49% of total inventories as of January 31, 2015 and February 1, 2014, respectively, and reflects our merchants’ continued ability to take advantage of a large amount of close-out opportunities in the marketplace. We believe the strong discounts we are able to offer on packaway merchandise are one of the key drivers of our business results.
Our primary buying offices are located in New York City and Los Angeles, the nation’s two largest apparel markets. These strategic locations allow our buyers to be in the market on a daily basis, sourcing opportunities and negotiating purchases with vendors and manufacturers. These locations also enable our buyers to strengthen vendor relationships—a key element to the success of our off-price buying strategies.
Over the past year, we continued to make strategic investments in our merchandising organization to further enhance our ability to deliver name brand bargains to our customers. At the end of fiscal 2014, we had approximately 700 merchants for Ross and dd’s DISCOUNTS combined. The Ross and dd’s DISCOUNTS buying organizations are separate and distinct, and each includes merchandise management, buyers, and assistant buyers. Ross and dd’s DISCOUNTS buyers have on average eight years of experience, including merchandising positions with other retailers such as Bloomingdale’s, Burlington Stores, Foot Locker, Kohl’s, Loehmann’s, Lord & Taylor, Macy’s, Nordstrom, Saks, and TJX. We expect to continue to make additional targeted
13
16185_Ross AR14_10K_CS6-r3.indd 13 3/31/15 9:30 AM

investments in new merchants to further develop our relationships with an expanding number of manufacturers and vendors. Our ongoing objective is to strengthen our ability to procure the most desirable brands and fashions at competitive discounts.
The off-price buying strategies utilized by our experienced team of merchants enable us to purchase Ross merchandise at net prices that are lower than prices paid by department and specialty stores, and to purchase dd’s DISCOUNTS merchandise at net prices that are lower than prices paid by moderate department and discount stores.
Pricing. Our policy is to sell brand name merchandise at Ross that is priced 20% to 60% below most department and specialty store regular prices. At dd’s DISCOUNTS, we sell more moderate brand name product and fashions that are priced 20% to 70% below most moderate department and discount store regular prices. Our pricing policy is reflected on the price tag displaying our selling price as well as the comparable selling price for that item in department and specialty stores for Ross merchandise, or in more moderate department and discount stores for dd’s DISCOUNTS merchandise.
Our pricing strategy at Ross differs from that of a department or specialty store. We purchase our merchandise at lower prices and mark it up less than a department or specialty store. This strategy enables us to offer customers consistently low prices and compelling value. On a weekly basis our buyers review specified departments in our stores for possible markdowns based on the rate of sale as well as at the end of fashion seasons to promote faster turnover of merchandise inventory and to accelerate the flow of fresh product. A similar pricing strategy is in place at dd’s DISCOUNTS where prices are compared to those in moderate department and discount stores.
Stores
As of January 31, 2015, we operated a total of 1,362 stores comprised of 1,210 Ross stores and 152 dd’s DISCOUNTS stores. Our stores are located predominantly in community and neighborhood shopping centers in heavily populated urban and suburban areas. Where the size of the market and real estate opportunities permit, we cluster Ross stores to benefit from economies of scale in advertising, distribution, and field management. We do the same for dd’s DISCOUNTS stores.
We believe a key element of our success at both Ross and dd’s DISCOUNTS, is our organized, attractive, easy-to-shop, in-store environments which allow customers to shop at their own pace. While our stores promote a self-service, treasure hunt shopping experience, the layouts are designed to enhance customer convenience in their merchandise presentation, dressing rooms, checkout, and merchandise return areas. Our store’s sales area is based on a prototype single floor design with a racetrack aisle layout. A customer can locate desired departments by signs displayed just below the ceiling of each department. We enable our customers to select among sizes and prices through prominent category and sizing markers. At most stores, shopping carts and / or baskets are available at the entrance for customer convenience. Cash registers are primarily located at store exits for customer ease and efficient staffing.
We accept a variety of payment methods. We provide refunds on all merchandise (not used, worn, or altered) returned with a receipt within 30 days. Merchandise returns having a receipt older than 30 days are exchanged or refunded with store credit.
Operating Costs
Consistent with the other aspects of our business strategy, we strive to keep operating costs as low as possible. Among the factors which have enabled us to do this are: labor costs that are generally lower than full-price department and specialty stores due to a store design that creates a self-service retail format and due to the utilization of labor saving technologies; economies of scale with respect to general and administrative costs resulting from centralized merchandising, marketing, and purchasing decisions; and flexible store layout criteria which facilitate conversion of existing buildings to our formats.
Information Systems
We continue to invest in new information systems and technology to provide a platform for growth over the next several years. Recent initiatives include enhancements to our merchandise planning, core merchandising, allocation management, and store point-of-sale and store labor management systems. These initiatives support our expansion in both new and existing markets and our assortment execution and plan achievement, while also supporting future growth.
14
16185_Ross AR14_10K_CS6-r3.indd 14 3/31/15 9:30 AM

investments in new merchants to further develop our relationships with an expanding number of manufacturers and vendors. Our ongoing objective is to strengthen our ability to procure the most desirable brands and fashions at competitive discounts.
The off-price buying strategies utilized by our experienced team of merchants enable us to purchase Ross merchandise at net prices that are lower than prices paid by department and specialty stores, and to purchase dd’s DISCOUNTS merchandise at net prices that are lower than prices paid by moderate department and discount stores.
Pricing. Our policy is to sell brand name merchandise at Ross that is priced 20% to 60% below most department and specialty store regular prices. At dd’s DISCOUNTS, we sell more moderate brand name product and fashions that are priced 20% to 70% below most moderate department and discount store regular prices. Our pricing policy is reflected on the price tag displaying our selling price as well as the comparable selling price for that item in department and specialty stores for Ross merchandise, or in more moderate department and discount stores for dd’s DISCOUNTS merchandise.
Our pricing strategy at Ross differs from that of a department or specialty store. We purchase our merchandise at lower prices and mark it up less than a department or specialty store. This strategy enables us to offer customers consistently low prices and compelling value. On a weekly basis our buyers review specified departments in our stores for possible markdowns based on the rate of sale as well as at the end of fashion seasons to promote faster turnover of merchandise inventory and to accelerate the flow of fresh product. A similar pricing strategy is in place at dd’s DISCOUNTS where prices are compared to those in moderate department and discount stores.
Stores
As of January 31, 2015, we operated a total of 1,362 stores comprised of 1,210 Ross stores and 152 dd’s DISCOUNTS stores. Our stores are located predominantly in community and neighborhood shopping centers in heavily populated urban and suburban areas. Where the size of the market and real estate opportunities permit, we cluster Ross stores to benefit from economies of scale in advertising, distribution, and field management. We do the same for dd’s DISCOUNTS stores.
We believe a key element of our success at both Ross and dd’s DISCOUNTS, is our organized, attractive, easy-to-shop, in-store environments which allow customers to shop at their own pace. While our stores promote a self-service, treasure hunt shopping experience, the layouts are designed to enhance customer convenience in their merchandise presentation, dressing rooms, checkout, and merchandise return areas. Our store’s sales area is based on a prototype single floor design with a racetrack aisle layout. A customer can locate desired departments by signs displayed just below the ceiling of each department. We enable our customers to select among sizes and prices through prominent category and sizing markers. At most stores, shopping carts and / or baskets are available at the entrance for customer convenience. Cash registers are primarily located at store exits for customer ease and efficient staffing.
We accept a variety of payment methods. We provide refunds on all merchandise (not used, worn, or altered) returned with a receipt within 30 days. Merchandise returns having a receipt older than 30 days are exchanged or refunded with store credit.
Operating Costs
Consistent with the other aspects of our business strategy, we strive to keep operating costs as low as possible. Among the factors which have enabled us to do this are: labor costs that are generally lower than full-price department and specialty stores due to a store design that creates a self-service retail format and due to the utilization of labor saving technologies; economies of scale with respect to general and administrative costs resulting from centralized merchandising, marketing, and purchasing decisions; and flexible store layout criteria which facilitate conversion of existing buildings to our formats.
Information Systems
We continue to invest in new information systems and technology to provide a platform for growth over the next several years. Recent initiatives include enhancements to our merchandise planning, core merchandising, allocation management, and store point-of-sale and store labor management systems. These initiatives support our expansion in both new and existing markets and our assortment execution and plan achievement, while also supporting future growth.
Distribution
We own and operate five distribution processing facilities – two in California, one in Pennsylvania, and two in South Carolina. We ship all of our merchandise to our stores through these distribution centers, which are large, highly automated, and built to suit our specific off-price business model. An additional distribution center in Shafter, California is currently under construction and expected to open in 2015.
Currently we own four and lease three other warehouse facilities for packaway storage. We also use other third-party facilities as needed for storage of packaway inventory.
We also utilize third-party cross dock facilities to distribute merchandise to stores on a regional basis. Shipments are made by contract carriers to the stores three to six times per week depending on location.
We believe that our distribution centers with their current expansion capabilities will provide adequate processing capacity to support our current store growth. Information on the size and locations of our distribution centers and warehouse facilities is found under “Properties” in Item 2.
Advertising
Advertising for Ross Dress for Less relies primarily on television to communicate the Ross value proposition—savings off the same brands carried at leading department stores every day. This strategy reflects our belief that television is the most efficient and cost effective medium for communicating our brand position. While television is our primary advertising medium, we continue to utilize additional channels to communicate our brand position. Advertising for dd’s DISCOUNTS is primarily focused on new store grand openings and local media initiatives.
Trademarks
The trademarks for Ross Dress For Less® and dd’s DISCOUNTS® have been registered with the United States Patent and Trademark Office.
Employees
As of January 31, 2015, we had approximately 71,400 total employees, which includes both full and part-time employees. Additionally, we hire temporary employees especially during the peak seasons. Our employees are non-union. Management considers the relationship between the Company and our employees to be good.
Competition
We believe the principal competitive factors in the off-price retail apparel and home fashion industry are offering significant discounts on brand name merchandise, offering a well-balanced assortment that appeals to our target customers, and consistently providing store environments that are convenient and easy to shop. To execute this concept, we continue to make strategic investments in our merchandising organization. We also continue to make improvements to our core merchandising system to strengthen our ability to plan, buy, and allocate product based on more local versus regional trends. We believe that we are well-positioned to compete based on each of these factors.
Nevertheless, the retail apparel market is highly fragmented and competitive. We face a challenging macro-economic and retail environment that creates intense competition for business from department stores, specialty stores, discount stores, warehouse stores, other off-price retailers, and manufacturer-owned outlet stores, many of which are units of large national or regional chains that have substantially greater resources. We also compete to some degree with retailers that sell apparel and home fashions through catalogs or online. The retail apparel and home-related businesses may become even more competitive in the future.
15
16185_Ross AR14_10K_CS6-r3.indd 15 3/31/15 9:30 AM
Available Information
The internet address for our corporate website is www.rossstores.com. Our Annual Reports on Form 10-K, quarterly reports on Form 10-Q, current reports on Form 8-K, Proxy Statements, and any amendments to those reports are made available free of charge on or through the Investors section of our corporate website promptly after being electronically filed with the Securities and Exchange Commission. The information found on our corporate website is not part of this, or any other report or regulatory filing we file with or furnish to the Securities and Exchange Commission.
ITEM 1A. RISK FACTORS
Our Annual Report on Form 10-K for fiscal 2014, and information we provide in our Annual Report to Stockholders, press releases, and other investor communications, including those on our corporate website, may contain forward-looking statements with respect to anticipated future events and our projected growth, financial performance, operations, and competitive position that are subject to risks and uncertainties that could cause our actual results to differ materially from those forward-looking statements and our prior expectations and projections. Refer to Management’s Discussion and Analysis for a more complete identification and discussion of “Forward-Looking Statements.”
Our financial condition, results of operations, cash flows, and the performance of our common stock may be adversely affected by a number of risk factors. Risks and uncertainties that apply to both Ross and dd’s DISCOUNTS include, without limitation, the following:
We are subject to the economic and industry risks that affect large retailers operating in the United States.
Our business is exposed to the risks of a large, multi-store retailer, which must continually and efficiently obtain and distribute a supply of fresh merchandise throughout a large and growing network of stores and distribution centers. These risk factors include:
• An increase in the level of competitive pressures in the apparel or home-related merchandise retailing industry.
• Changes in the level of consumer spending on or preferences for apparel or home-related merchandise.
• The impacts from the macro-economic environment and financial and credit markets that affect consumer disposable income and consumer confidence, including but not limited to interest rates, recession, inflation, deflation, energy costs, tax rates and policy, unemployment trends, and fluctuating commodity costs.
• Changes in geopolitical and geoeconomic conditions.
• Unseasonable weather trends that could affect consumer demand for seasonal apparel and apparel-related products.
• Changes in the availability, quantity, or quality of attractive brand name merchandise at desirable discounts that could impact our ability to purchase product and continue to offer customers a wide assortment of merchandise at competitive prices.
• Potential disruptions in the supply chain or in information systems that could impact our ability to deliver product to our stores in a timely and cost-effective manner.
• A change in the availability, quality, or cost of new store real estate locations.
• A downturn in the economy or a natural disaster in California or in another region where we have a concentration of stores or a distribution center. Our corporate headquarters, Los Angeles buying office, two operating distribution centers, two warehouses, and 25% of our stores are located in California.
16
16185_Ross AR14_10K_CS6-r3.indd 16 3/31/15 9:30 AM

We are subject to operating risks as we attempt to execute on our merchandising and growth strategies.
The continued success of our business depends in part upon our ability to increase sales at our existing store locations, to open new stores, and to operate stores on a profitable basis. Our existing strategies and store and distribution center expansion programs may not result in a continuation of our anticipated revenue or profit growth. In executing our off-price retail strategies and working to improve efficiencies, expand our store network, and reduce our costs, we face a number of operational risks, including our ability to:
• Attract, train, and retain associates with the retail talent necessary to execute our strategies.
• Effectively operate and continually upgrade our various supply chain, store, core merchandising, and other information systems.
• Improve our merchandising and transaction processing capabilities, and the reliability and security of our data communication systems, through implementation of new processes and systems enhancements.
• Protect against security breaches, including cyber-attacks on our transaction processing and computer information systems, that could result in the theft, transfer or unauthorized disclosure of customer, credit card, employee or other private and valuable information that we collect and process in the ordinary course of our business, and avoid resulting damage to our reputation, loss of customer confidence, exposure to litigation and regulatory action, unanticipated costs and disruption of our operations.
• Improve new store sales and profitability, especially in newer regions and markets.
• Add capacity to our existing distribution centers, find new distribution center sites, and build out planned additional distribution centers timely and cost effectively.
• Achieve and maintain targeted levels of productivity and efficiency in our existing and new distribution centers.
• Lease or acquire acceptable new store sites with favorable demographics and long-term financial returns.
• Identify and successfully enter new geographic markets.
• Achieve planned gross margins by effectively managing inventories, markdowns, and inventory shortage.
• Effectively manage all operating costs of the business, the largest of which are payroll and benefit costs for store and distribution center employees.
ITEM 1B. UNRESOLVED STAFF COMMENTS
Not applicable.
ITEM 2. PROPERTIES
At January 31, 2015, we operated a total of 1,362 stores, of which 1,210 were Ross locations in 33 states, the District of Columbia and Guam, and 152 were dd’s DISCOUNTS stores in 15 states. All stores are leased, with the exception of three locations which we own.
During fiscal 2014, we opened 73 new Ross stores and closed nine existing stores. The average approximate Ross store size is 28,800 square feet.
During fiscal 2014, we opened 22 new dd’s DISCOUNTS stores and closed no existing stores. The average approximate dd’s DISCOUNTS store size is 23,400 square feet.
During fiscal 2014, no one store accounted for more than 1% of our sales.
We carry earthquake insurance to help mitigate the risk of financial loss due to an earthquake.
17
16185_Ross AR14_10K_CS6-r3.indd 17 3/31/15 9:30 AM

Our real estate strategy in 2015 is to open stores in states where we currently operate, to increase our market penetration and reduce overhead and advertising expenses as a percentage of sales in each market. We also expect to continue our store expansion in newer markets in 2015. Important considerations in evaluating a new store location in both newer and more established markets are the availability and quality of potential sites, demographic characteristics, competition, and population density of the local trade area. In addition, we continue to consider opportunistic real estate acquisitions.
The following table summarizes the locations of our stores by state/territory as of January 31, 2015 and February 1, 2014.
State/Territory January 31, 2015 February 1, 2014
Alabama 19 20Arizona 68 67Arkansas 6 4California 335 315Colorado 30 27Delaware 1 1District of Columbia 1 1Florida 166 156Georgia 51 51Guam 1 1Hawaii 17 15Idaho 10 10Illinois 49 37Indiana 5 2Kansas 6 4Kentucky 5 3Louisiana 14 13Maryland 23 22Mississippi 8 6Missouri 16 14Montana 6 6Nevada 31 29New Jersey 13 11New Mexico 10 9North Carolina 38 36Oklahoma 20 19Oregon 31 28Pennsylvania 43 39South Carolina 21 22Tennessee 29 29Texas 197 189Utah 16 15Virginia 34 34Washington 40 39Wyoming 2 2
Total 1,362 1,276
18
16185_Ross AR14_10K_CS6-r3.indd 18 3/31/15 9:30 AM
Where possible, we obtain sites in buildings requiring minimal alterations, allowing us to establish stores in new locations in a relatively short period of time at reasonable costs in a given market. At January 31, 2015, the majority of our stores had unexpired original lease terms ranging from three to ten years with three to four renewal options of five years each. The average unexpired original lease term of our leased stores is five years or 21 years if renewal options are included. See Note E of Notes to Consolidated Financial Statements.
See additional discussion under “Stores” in Item 1.
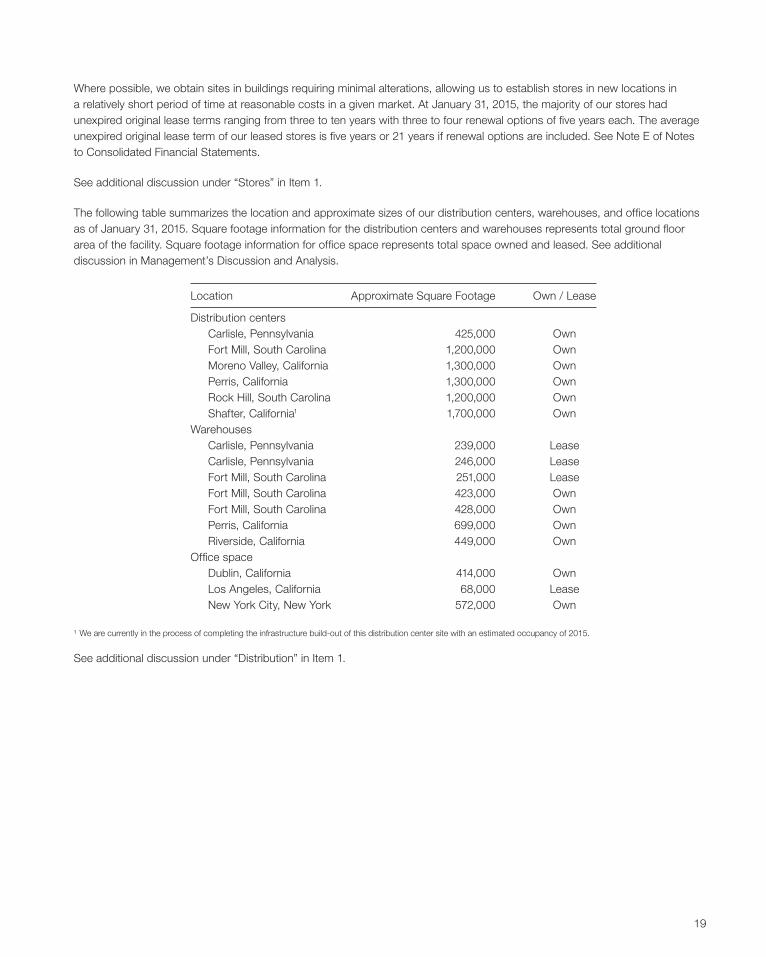
The following table summarizes the location and approximate sizes of our distribution centers, warehouses, and office locations as of January 31, 2015. Square footage information for the distribution centers and warehouses represents total ground floor area of the facility. Square footage information for office space represents total space owned and leased. See additional discussion in Management’s Discussion and Analysis.
Location Approximate Square Footage Own / Lease
Distribution centers Carlisle, Pennsylvania 425,000 Own Fort Mill, South Carolina 1,200,000 Own Moreno Valley, California 1,300,000 Own Perris, California 1,300,000 Own Rock Hill, South Carolina 1,200,000 Own Shafter, California1 1,700,000 OwnWarehouses Carlisle, Pennsylvania 239,000 Lease Carlisle, Pennsylvania 246,000 Lease Fort Mill, South Carolina 251,000 Lease Fort Mill, South Carolina 423,000 Own Fort Mill, South Carolina 428,000 Own Perris, California 699,000 Own Riverside, California 449,000 OwnOffice space Dublin, California 414,000 Own Los Angeles, California 68,000 Lease New York City, New York 572,000 Own
¹ We are currently in the process of completing the infrastructure build-out of this distribution center site with an estimated occupancy of 2015.
See additional discussion under “Distribution” in Item 1.
19
16185_Ross AR14_10K_CS6-r3.indd 19 3/31/15 9:30 AM

ITEM 3. LEGAL PROCEEDINGS
Like many California retailers, we have been named in class action lawsuits alleging violation of wage and hour and other employment laws. Class action litigation remains pending as of January 31, 2015.
We are also party to various other legal and regulatory proceedings arising in the normal course of business. Actions filed against us include commercial, product and product safety, customer, intellectual property, and labor and employment-related claims, including lawsuits in which private plaintiffs or governmental agencies allege that we violated federal, state, and / or local laws. Actions against us are in various procedural stages. Many of these proceedings raise factual and legal issues and are subject to uncertainties.
We believe that the resolution of our pending class action litigation and other currently pending legal and regulatory proceedings will not have a material adverse effect on our financial condition, results of operations, or cash flows.
ITEM 4. MINE SAFETY DISCLOSURES
Not applicable.
Executive Officers of the Registrant
The following sets forth the names and ages of our executive officers, indicating each person’s principal occupation or employment during at least the past five years. The term of office is at the discretion of our Board of Directors.
Name Age Position
Michael Balmuth 64 Executive Chairman of the BoardBarbara Rentler 57 Chief Executive OfficerJames S. Fassio 60 President and Chief Development OfficerMichael O’Sullivan 51 President and Chief Operating OfficerLisa Panattoni 52 President, Merchandising, Ross Dress for LessBernie Brautigan 50 Group Executive Vice President, Merchandising, Ross Dress for LessJohn G. Call 56 Executive Vice President, Finance and Legal, and Corporate SecretaryMichael J. Hartshorn 47 Group Senior Vice President, Chief Financial Officer and Principal Accounting Officer
Mr. Balmuth has served as Executive Chairman of the Board of Directors since June 2014. From 1996 to May 2014, he was Vice Chairman of the Board of Directors and Chief Executive Officer. He also served as President from 2005 to 2009. Previously, Mr. Balmuth was Executive Vice President, Merchandising from 1993 to 1996 and Senior Vice President and General Merchandise Manager from 1989 to 1993. Before joining Ross, he was Senior Vice President and General Merchandising Manager at Bon Marché in Seattle from 1988 to 1989 and Executive Vice President and General Merchandising Manager for Karen Austin Petites from 1986 to 1988.
Ms. Rentler has served as Chief Executive Officer and a member of the Board of Directors since June 2014. From 2009 to May 2014, she was President and Chief Merchandising Officer, Ross Dress for Less and Executive Vice President, Merchandising, from 2006 to 2009. She also served at dd’s DISCOUNTS as Executive Vice President and Chief Merchandising Officer from 2005 to 2006 and Senior Vice President and Chief Merchandising Officer from 2004 to 2005. Prior to that, she held various merchandising positions since joining the Company in 1986.
20
16185_Ross AR14_10K_CS6-r3.indd 20 3/31/15 9:30 AM

Mr. Fassio has served as President and Chief Development Officer since 2009. Prior to that, he was Executive Vice President, Property Development, Construction and Store Design from 2005 to 2009 and Senior Vice President, Property Development, Construction and Store Design from 1991 to 2005. He joined the Company in 1988 as Vice President of Real Estate. Prior to joining Ross, Mr. Fassio held various retail and real estate positions with Safeway Stores, Inc.
Mr. O’Sullivan has served as President and Chief Operating Officer since 2009 and a member of the Board of Directors since June 2014. From 2005 to 2009, he was Executive Vice President and Chief Administrative Officer and Senior Vice President, Strategic Planning and Marketing from 2003 to 2005. Before joining Ross, Mr. O’Sullivan was a partner with Bain & Company, providing consulting advice to retail, consumer goods, financial services and private equity clients since 1991.
Ms. Panattoni has served as President, Merchandising, Ross Dress for Less since June 2014 with responsibility for all of the Home businesses, Men’s, Junior Sportswear, Lingerie, and Cosmetics. Previously, she was Group Executive Vice President, Merchandising at Ross from 2009 to May 2014. She joined the Company in 2005 as Senior Vice President and General Merchandise Manager of Home and was promoted to Executive Vice President later that same year. Prior to joining Ross, Ms. Panattoni was with The TJX Companies, where she served as Senior Vice President of Merchandising and Marketing for HomeGoods from 1998 to 2004 and as Divisional Merchandise Manager of the Marmaxx Home Store from 1994 to 1998.
Mr. Brautigan has served as Group Executive Vice President, Merchandising, Ross Dress for Less since June 2014, with responsibility for Ladies and Children’s apparel, Shoes, Accessories, and Jewelry. Previously, he was Executive Vice President of Merchandising at Ross from 2009 to May 2014. From 2006 to 2009, Mr. Brautigan was Senior Vice President and General Merchandise Manager and Group Vice President of Shoes from 2003 to 2006. Prior to Ross, he spent 20 years in various merchandising positions at Macy’s East.
Mr. Call has served as Executive Vice President, Finance and Legal, and Corporate Secretary since March 2014. From 2012 to 2014, Mr. Call was Group Senior Vice President and Chief Financial Officer, with additional oversight for Legal and the Corporate Secretary function. From 1997 to 2012, he was Senior Vice President and Chief Financial Officer and also served as Corporate Secretary from 1997 to 2009. Mr. Call was Senior Vice President, Chief Financial Officer, Secretary and Treasurer of Friedman’s from 1993 until 1997. For ten years prior to joining Friedman’s, Mr. Call held various positions with Ernst & Young LLP.
Mr. Hartshorn has served as Group Senior Vice President, Chief Financial Officer since March 2015. Previously, he was Senior Vice President and Chief Financial Officer from 2014 to March 2015, Senior Vice President and Deputy Chief Financial Officer from 2012 to 2014, Group Vice President, Finance and Treasurer from 2011 to 2012, and Vice President, Finance and Treasurer from 2006 to 2011. From 2002 to 2006, he held a number of management roles in the Ross IT and supply chain organizations. He initially joined the Company in 2000 as Director and Assistant Controller. For seven years prior to joining Ross, Mr. Hartshorn held various financial roles at The May Department Stores Company.
21
16185_Ross AR14_10K_CS6-r3.indd 21 3/31/15 9:30 AM
PART II
ITEM 5. MARKET FOR REGISTRANT’S COMMON EQUITY, RELATED STOCKHOLDER MATTERS AND ISSUER PURCHASES OF EQUITY SECURITIES
General information. See the information set forth under the caption “Quarterly Financial Data (Unaudited)” under Note K of Notes to Consolidated Financial Statements in Item 8 of this Annual Report, which is incorporated herein by reference. Our stock is traded on The NASDAQ Global Select Market® under the symbol ROST. There were 817 stockholders of record as of March 9, 2015 and the closing stock price on that date was $105.45 per share.
Cash dividends. In February 2015, our Board of Directors declared a quarterly cash dividend of $0.235 per common share, payable on March 31, 2015. Our Board of Directors declared cash dividends of $0.20 per common share in February, May, August, and November 2014, cash dividends of $0.17 per common share in January, May, August, and November 2013, and cash dividends of $0.14 per common share in January, May, August, and November 2012.
Stock dividends. In March 2015, our Board of Directors approved a two-for-one stock split in the form of a 100 percent stock dividend, to be paid on June 11, 2015 to stockholders of record as of April 22, 2015. The stock split will not have an impact on our consolidated financial position or results of operations. Share and per share amounts have not been restated to reflect the pending stock split.
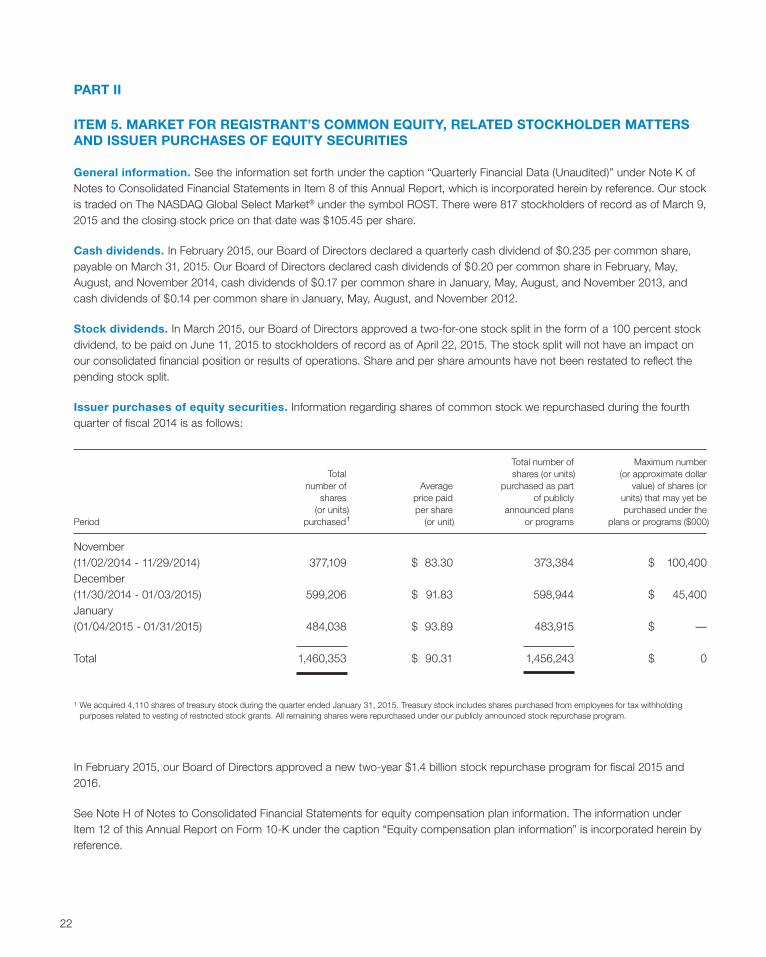
Issuer purchases of equity securities. Information regarding shares of common stock we repurchased during the fourth quarter of fiscal 2014 is as follows:
Total number of Maximum number Total shares (or units) (or approximate dollar number of Average purchased as part value) of shares (or shares price paid of publicly units) that may yet be (or units) per share announced plans purchased under thePeriod purchased1 (or unit) or programs plans or programs ($000)
November(11/02/2014 - 11/29/2014) 377,109 $ 83.30 373,384 $ 100,400December(11/30/2014 - 01/03/2015) 599,206 $ 91.83 598,944 $ 45,400January(01/04/2015 - 01/31/2015) 484,038 $ 93.89 483,915 $ —
Total 1,460,353 $ 90.31 1,456,243 $ 0
¹ We acquired 4,110 shares of treasury stock during the quarter ended January 31, 2015. Treasury stock includes shares purchased from employees for tax withholding purposes related to vesting of restricted stock grants. All remaining shares were repurchased under our publicly announced stock repurchase program.
In February 2015, our Board of Directors approved a new two-year $1.4 billion stock repurchase program for fiscal 2015 and 2016.
See Note H of Notes to Consolidated Financial Statements for equity compensation plan information. The information under Item 12 of this Annual Report on Form 10-K under the caption “Equity compensation plan information” is incorporated herein by reference.
22
16185_Ross AR14_10K_CS6-r4.indd 22 3/31/15 4:33 PM

Stockholder Return Performance Graph
The following information in this Item 5 shall not be deemed filed for purposes of Section 18 of the Securities Act of 1934, nor shall it be deemed incorporated by reference in any filing under the Securities Act of 1933.
Total stockholder returns for our common stock outperformed the Standard & Poor’s (“S&P”) 500 Index and the S&P Retailing Group over the last five years as set forth in the graph below. The cumulative total return listed below assumed an initial investment of $100 and reinvestment of dividends at each fiscal year end and measures the performance of this investment as of the last trading day in the month of January for each of the following five years. These measurement dates are based on the historical month-end data available and may vary slightly from our actual fiscal year-end date for each period. Data with respect to returns for the S&P indexes is not readily available for periods shorter than one month. The graph is a historical representation of past performance only and is not necessarily indicative of future performance.
COMPARISON OF 5 YEAR CUMULATIVE TOTAL RETURN
Among Ross Stores, Inc., the S&P 500 Index, and S&P Retailing Group
Indexed Returns for Years Ended Base Period Company / Index 2010 2011 2012 2013 2014 2015
Ross Stores, Inc. 100 144 228 267 309 421S&P 500 Index 100 122 127 149 181 206S&P Retailing Group 100 130 151 196 248 297
23
16185_Ross AR14_10K_CS6-r3.indd 23 3/31/15 9:30 AM

ITEM 6. SELECTED FINANCIAL DATA
The following selected financial data is derived from our consolidated financial statements. The data set forth below should be read in conjunction with “Management’s Discussion and Analysis of Financial Condition and Results of Operations,” the section “Forward-Looking Statements” in this Annual Report on Form 10-K and our consolidated financial statements and notes thereto.
($000, except per share data) 2014 2013 20121 2011 2010
Operations
Sales $ 11,041,677 $ 10,230,353 $ 9,721,065 $ 8,608,291 $ 7,866,100
Cost of goods sold 7,937,956 7,360,924 7,011,428 6,240,760 5,729,735
Percent of sales 71.9% 72.0% 72.1% 72.5% 72.8%
Selling, general and administrative 1,615,371 1,526,366 1,437,886 1,304,065 1,229,775
Percent of sales 14.6% 14.9% 14.8% 15.2% 15.6%
Interest expense (income), net 2,984 (247) 6,907 10,322 9,569
Earnings before taxes 1,485,366 1,343,310 1,264,844 1,053,144 897,021
Percent of sales 13.5% 13.1% 13.0% 12.2% 11.4%
Provision for taxes on earnings 560,642 506,006 478,081 395,974 342,224
Net earnings 924,724 837,304 786,763 657,170 554,797
Percent of sales 8.4% 8.2% 8.1% 7.6% 7.1%
Basic earnings per share² $ 4.47 $ 3.93 $ 3.59 $ 2.91 $ 2.35
Diluted earnings per share² $ 4.42 $ 3.88 $ 3.53 $ 2.86 $ 2.31
Cash dividends declared
per common share² $ 0.80 $ 0.513 $ 0.59 $ 0.47 $ 0.35
¹ Fiscal 2012 was a 53-week year; all other fiscal years presented were 52 weeks.
² All per share amounts have been adjusted for the two-for-one stock split effective December 15, 2011.
³ Dividend declaration of $0.20 per share for the fourth quarter which historically had been declared in January was declared in February 2014.
24
16185_Ross AR14_10K_CS6-r3.indd 24 3/31/15 9:30 AM

ITEM 6. SELECTED FINANCIAL DATA
The following selected financial data is derived from our consolidated financial statements. The data set forth below should be read in conjunction with “Management’s Discussion and Analysis of Financial Condition and Results of Operations,” the section “Forward-Looking Statements” in this Annual Report on Form 10-K and our consolidated financial statements and notes thereto.
($000, except per share data) 2014 2013 20121 2011 2010
Operations
Sales $ 11,041,677 $ 10,230,353 $ 9,721,065 $ 8,608,291 $ 7,866,100
Cost of goods sold 7,937,956 7,360,924 7,011,428 6,240,760 5,729,735
Percent of sales 71.9% 72.0% 72.1% 72.5% 72.8%
Selling, general and administrative 1,615,371 1,526,366 1,437,886 1,304,065 1,229,775
Percent of sales 14.6% 14.9% 14.8% 15.2% 15.6%
Interest expense (income), net 2,984 (247) 6,907 10,322 9,569
Earnings before taxes 1,485,366 1,343,310 1,264,844 1,053,144 897,021
Percent of sales 13.5% 13.1% 13.0% 12.2% 11.4%
Provision for taxes on earnings 560,642 506,006 478,081 395,974 342,224
Net earnings 924,724 837,304 786,763 657,170 554,797
Percent of sales 8.4% 8.2% 8.1% 7.6% 7.1%
Basic earnings per share² $ 4.47 $ 3.93 $ 3.59 $ 2.91 $ 2.35
Diluted earnings per share² $ 4.42 $ 3.88 $ 3.53 $ 2.86 $ 2.31
Cash dividends declared
per common share² $ 0.80 $ 0.513 $ 0.59 $ 0.47 $ 0.35
¹ Fiscal 2012 was a 53-week year; all other fiscal years presented were 52 weeks.
² All per share amounts have been adjusted for the two-for-one stock split effective December 15, 2011.
³ Dividend declaration of $0.20 per share for the fourth quarter which historically had been declared in January was declared in February 2014.
Selected Financial Data
($000, except per share data) 2014 2013 20121 2011 2010
Financial Position
Cash and cash equivalents $ 696,608 $ 423,168 $ 646,761 $ 649,835 $ 833,924
Merchandise inventory 1,372,675 1,257,155 1,209,237 1,130,070 1,086,917
Property and equipment, net 2,273,752 1,875,299 1,493,284 1,241,722 983,776
Total assets 4,703,134 3,896,797 3,670,561 3,301,209 3,116,204
Return on average assets 22% 22% 23% 20% 19%
Working capital 603,422 474,102 608,845 578,319 690,919
Current ratio 1.4:1 1.3:1 1.4:1 1.4:1 1.5:1
Long-term debt 398,375 150,000 150,000 150,000 150,000
Long-term debt as a percent
of total capitalization 15% 7% 8% 9% 10%
Stockholders’ equity 2,279,210 2,007,302 1,766,863 1,493,012 1,332,692
Return on average
stockholders’ equity 43% 44% 48% 47% 45%
Book value per common share
outstanding at year-end² $ 10.99 $ 9.41 $ 8.00 $ 6.58 $ 5.64
Operating Statistics
Number of stores opened 95 88 82 80 56
Number of stores closed 9 11 8 10 6
Number of stores at year-end 1,362 1,276 1,199 1,125 1,055
Comparable store sales increase³
(52-week basis) 3% 3% 6% 5% 5%
Sales per average square foot of
selling space (52-week basis) $ 372 $ 362 $ 355 $ 338 $ 324
Square feet of selling space
at year-end (000) 30,400 28,900 27,800 26,100 24,800
Number of employees at year-end 71,400 66,300 57,500 53,900 49,500
Number of common stockholders
of record at year-end 817 823 831 817 804
¹ Fiscal 2012 was a 53-week year; all other fiscal years presented were 52 weeks.
² All per share amounts have been adjusted for the two-for-one stock split effective December 15, 2011.
³ Comparable stores are stores open for more than 14 complete months.
25
16185_Ross AR14_10K_CS6-r3.indd 25 3/31/15 9:30 AM

ITEM 7. MANAGEMENT’S DISCUSSION AND ANALYSIS OF FINANCIAL CONDITION AND RESULTS OF OPERATIONS
Overview
Ross Stores, Inc. operates two brands of off-price retail apparel and home fashion stores—Ross Dress for Less® (“Ross”) and dd’s DISCOUNTS®. Ross is the largest off-price apparel and home fashion chain in the United States with 1,210 locations in 33 states, the District of Columbia and Guam as of January 31, 2015. Ross offers first-quality, in-season, name brand and designer apparel, accessories, footwear, and home fashions for the entire family at savings of 20% to 60% off department and specialty store regular prices every day. We also operate 152 dd’s DISCOUNTS stores in 15 states as of January 31, 2015 that feature a more moderately-priced assortment of first-quality, in-season, name brand apparel, accessories, footwear, and home fashions for the entire family at savings of 20% to 70% off moderate department and discount store regular prices every day.
Our primary objective is to pursue and refine our existing off-price strategies to maintain and improve both profitability and financial returns over the long term. In establishing appropriate growth targets for our business, we closely monitor market share trends for the off-price industry and believe our share gains over the past few years were driven mainly by continued focus on value by consumers. Our sales and earnings gains in 2014 continued to benefit from efficient execution of our off-price model throughout all areas of our business. Our merchandise and operational strategies are designed to take advantage of the expanding market share of the off-price industry as well as the ongoing customer demand for name brand fashions for the family and home at compelling discounts every day.
We refer to our fiscal years ended January 31, 2015, February 1, 2014, and February 2, 2013 as fiscal 2014, fiscal 2013, and fiscal 2012, respectively. Fiscal 2014 and 2013 were 52-week years. Fiscal 2012 was a 53-week year.
Results of Operations
The following table summarizes the financial results for fiscal 2014, 2013, and 2012:
2014 2013 20121
Sales
Sales (millions) $ 11,042 $ 10,230 $ 9,721
Sales growth 7.9% 5.2% 12.9%
Comparable store sales growth (52-week basis) 3% 3% 6%
Costs and expenses (as a percent of sales)
Cost of goods sold 71.9% 72.0% 72.1%
Selling, general and administrative 14.6% 14.9% 14.8%
Interest expense (income), net 0.0% 0.0% 0.1%
Earnings before taxes (as a percent of sales) 13.5% 13.1% 13.0%
Net earnings (as a percent of sales) 8.4% 8.2% 8.1%
¹ Fiscal 2012 was a 53-week year; all other fiscal years presented were 52 weeks.
26
16185_Ross AR14_10K_CS6-r3.indd 26 3/31/15 9:30 AM
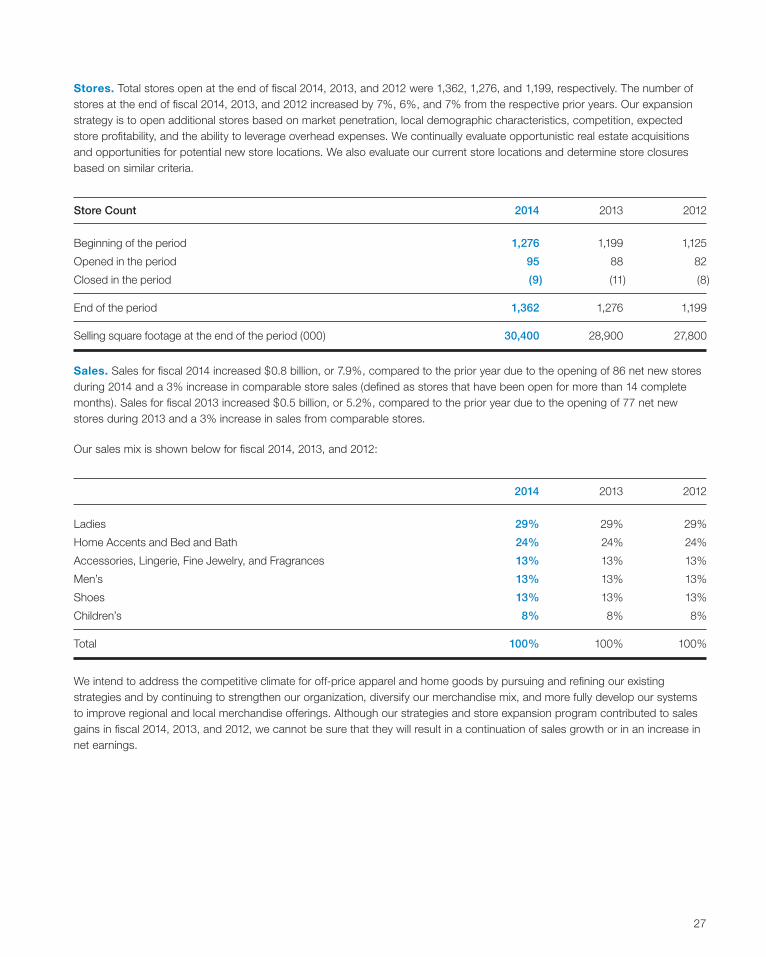
Stores. Total stores open at the end of fiscal 2014, 2013, and 2012 were 1,362, 1,276, and 1,199, respectively. The number of stores at the end of fiscal 2014, 2013, and 2012 increased by 7%, 6%, and 7% from the respective prior years. Our expansion strategy is to open additional stores based on market penetration, local demographic characteristics, competition, expected store profitability, and the ability to leverage overhead expenses. We continually evaluate opportunistic real estate acquisitions and opportunities for potential new store locations. We also evaluate our current store locations and determine store closures based on similar criteria.
Store Count 2014 2013 2012
Beginning of the period 1,276 1,199 1,125
Opened in the period 95 88 82
Closed in the period (9) (11) (8)
End of the period 1,362 1,276 1,199
Selling square footage at the end of the period (000) 30,400 28,900 27,800
Sales. Sales for fiscal 2014 increased $0.8 billion, or 7.9%, compared to the prior year due to the opening of 86 net new stores during 2014 and a 3% increase in comparable store sales (defined as stores that have been open for more than 14 complete months). Sales for fiscal 2013 increased $0.5 billion, or 5.2%, compared to the prior year due to the opening of 77 net new stores during 2013 and a 3% increase in sales from comparable stores.
Our sales mix is shown below for fiscal 2014, 2013, and 2012:
2014 2013 2012
Ladies 29% 29% 29%
Home Accents and Bed and Bath 24% 24% 24%
Accessories, Lingerie, Fine Jewelry, and Fragrances 13% 13% 13%
Men’s 13% 13% 13%
Shoes 13% 13% 13%
Children’s 8% 8% 8%
Total 100% 100% 100%
We intend to address the competitive climate for off-price apparel and home goods by pursuing and refining our existing strategies and by continuing to strengthen our organization, diversify our merchandise mix, and more fully develop our systems to improve regional and local merchandise offerings. Although our strategies and store expansion program contributed to sales gains in fiscal 2014, 2013, and 2012, we cannot be sure that they will result in a continuation of sales growth or in an increase in net earnings.
27
16185_Ross AR14_10K_CS6-r3.indd 27 3/31/15 9:30 AM

Cost of goods sold. Cost of goods sold in fiscal 2014 increased $577.0 million compared to the prior year mainly due to increased sales from the opening of 86 net new stores during the year and a 3% increase in sales from comparable stores.
Cost of goods sold as a percentage of sales for fiscal 2014 decreased approximately 5 basis points from the prior year primarily due to a 20 basis point increase in merchandise gross margin. This improvement was partially offset by a 15 basis point increase in buying costs.
Cost of goods sold in fiscal 2013 increased $349.5 million compared to the prior year mainly due to increased sales from the opening of 77 net new stores during the year and a 3% increase in sales from comparable stores.
Cost of goods sold as a percentage of sales for fiscal 2013 decreased approximately 15 basis points from the prior year. This improvement was due primarily to a 45 basis point increase in merchandise gross margin, which was partially offset by increases in occupancy of about 20 basis points and increases in distribution and buying expenses of about 5 basis points each.
We cannot be sure that the gross profit margins realized in fiscal 2014, 2013, and 2012 will continue in future years.
Selling, general and administrative expenses. For fiscal 2014, selling, general and administrative expenses (“SG&A”) increased $89.0 million compared to the prior year, mainly due to increased store operating costs reflecting the opening of 86 net new stores during the year. SG&A as a percentage of sales for fiscal 2014 decreased by approximately 30 basis points compared to the prior year primarily due to tight expense control.
For fiscal 2013, SG&A increased $88.5 million compared to the prior year, mainly due to increased store operating costs reflecting the opening of 77 net new stores during the year. SG&A as a percentage of sales for fiscal 2013 increased by approximately 15 basis points compared to the prior year primarily due to higher costs related to the relocation of our data center.
The largest component of SG&A is payroll. The total number of employees, including both full and part-time, as of fiscal year end 2014, 2013, and 2012 was approximately 71,400, 66,300, and 57,500, respectively.
Interest expense (income), net. In fiscal 2014, net interest expense increased by $3.2 million primarily due to the issuance of our unsecured 3.375% Senior Notes due September 2024. As a percentage of sales, net interest expense in fiscal 2014 increased by approximately five basis points compared to the same period in the prior year. The table below shows the components of interest expense and income for fiscal 2014, 2013, and 2012:
($ millions) 2014 2013 2012
Interest expense on long-term debt $ 13.0 $ 9.7 $ 9.7
Other interest expense 1.2 1.4 1.7
Capitalized interest (10.8) (10.8) (3.9)
Interest income (0.4) (0.5) (0.6)
Total interest expense (income), net $ 3.0 $ (0.2) $ 6.9
Taxes on earnings. Our effective tax rate for fiscal 2014, 2013 and 2012 was approximately 38% in each year, which represents the applicable combined federal and state statutory rates reduced by the federal benefit of state taxes deductible on federal returns. The effective rate is impacted by changes in laws, location of new stores, level of earnings, and the resolution of tax positions with various taxing authorities. We anticipate that our effective tax rate for fiscal 2015 will be between 37% and 38%.
28
16185_Ross AR14_10K_CS6-r3.indd 28 3/31/15 9:30 AM

Net earnings. Net earnings as a percentage of sales for fiscal 2014 were higher than fiscal 2013 primarily due to both lower cost of goods sold and lower SG&A expenses. Net earnings as a percentage of sales for fiscal 2013 were higher compared to fiscal 2012 primarily due to lower cost of goods sold partially offset by higher SG&A expenses.
Earnings per share. Diluted earnings per share in fiscal 2014 was $4.42 compared to $3.88 in the prior year period. The 14% increase in diluted earnings per share is attributable to an approximate 10% increase in net earnings and a 4% reduction in weighted average diluted shares outstanding, largely due to the repurchase of common stock under our stock repurchase program. Diluted earnings per share in fiscal 2013 was $3.88 compared to $3.53 in fiscal 2012. The 10% increase in diluted earnings per share is attributable to an approximate 6% increase in net earnings and a 4% reduction in weighted average diluted shares outstanding, largely due to the repurchase of common stock under our stock repurchase program.
Financial Condition
Liquidity and Capital Resources
Our primary sources of funds for our business activities are cash flows from operations and short-term trade credit. Our primary ongoing cash requirements are for merchandise inventory purchases, payroll, rent, taxes, and capital expenditures in connection with new and existing stores, and investments in distribution centers, information systems, and buying and corporate offices. We also use cash to repurchase stock under our stock repurchase program and to pay dividends.
($ millions) 2014 2013 2012
Cash provided by operating activities $ 1,372.8 $ 1,022.0 $ 979.6
Cash used in investing activities (639.0) (563.8) (425.7)
Cash used in financing activities (460.4) (681.8) (557.0)
Net increase (decrease) in cash and cash equivalents $ 273.4 $ (223.6) $ (3.1)
Operating Activities
Net cash provided by operating activities was $1,372.8 million, $1,022.0 million, and $979.6 million in fiscal 2014, 2013, and 2012 respectively, and was primarily driven by net earnings excluding non-cash expenses for depreciation and amortization. Our primary source of operating cash flow is the sale of our merchandise inventory. We regularly review the age and condition of our merchandise and are able to maintain current merchandise inventory in our stores through replenishment processes and liquidation of slower-moving merchandise through clearance markdowns.
Net cash from operations increased in 2014 compared to 2013 primarily due to higher net earnings and an increase in accounts payable leverage (defined as accounts payable divided by merchandise inventory). The change in accounts payable net of the change in merchandise inventory, resulted in a source of cash of approximately $89 million in fiscal 2014 compared to a use of cash of approximately $52 million and $39 million for fiscal 2013 and 2012, respectively. Accounts payable leverage was 73%, 62%, and 67% as of January 31, 2015, February 1, 2014, and February 2, 2013, respectively. Changes in accounts payable leverage are primarily driven by the levels and timing of inventory receipts and payments. Accounts payable leverage at the end of fiscal 2013 was also impacted due to the timing shift of the dividend declaration from January 2014 to February 2014.
As a regular part of our business, packaway inventory levels will vary over time based on availability of compelling opportunities in the marketplace. Packaway merchandise is purchased with the intent that it will be stored in our warehouses until a later date. The timing of the release of packaway inventory to our stores is principally driven by the product mix and seasonality of the merchandise, and its relation to our store merchandise assortment plans. As such, the aging of packaway varies by merchandise category and seasonality of purchase, but typically packaway remains in storage less than six months. We expect to continue to take advantage of packaway inventory opportunities to maximize our ability to deliver bargains to our customers.
29
16185_Ross AR14_10K_CS6-r3.indd 29 3/31/15 9:30 AM

Changes in packaway inventory levels impact our operating cash flow. At the end of fiscal 2014, packaway inventory was 45% of total inventory compared to 49% and 47% at the end of fiscal 2013 and 2012, respectively.
Investing Activities
Net cash used in investing activities was $639.0 million, $563.8 million, and $425.7 million in fiscal 2014, 2013, and 2012, respectively. The increases in cash used for investing activities in fiscal 2014, 2013, and 2012 were primarily due to increases in our capital expenditures.
In fiscal 2014, 2013, and 2012, our capital expenditures were $646.7 million, $550.5 million, and $424.4 million, respectively. Our capital expenditures include costs to build or expand distribution centers, open new stores and improve existing stores, and for various other expenditures related to our information technology systems, buying, and corporate offices. We opened 95, 88, and 82 new stores in fiscal 2014, 2013, and 2012, respectively. In September 2014 we completed the purchase of the office building where our New York buying office is located for $222 million.
Our capital expenditures over the last three years are set forth in the table below:
($ millions) 2014 2013 2012
New York buying office $ 210.9 $ 11.1 $ —
Distribution 193.2 248.4 157.9
New stores 119.8 121.3 118.7
Existing stores 79.5 59.1 86.9
Information systems, corporate, and other 43.3 110.6 60.9
Total capital expenditures $ 646.7 $ 550.5 $ 424.4
We are forecasting approximately $450 million in capital expenditures for fiscal year 2015 to fund costs for fixtures and leasehold improvements to open new Ross and dd’s DISCOUNTS stores, the upgrade or relocation of existing stores, investments in information technology systems, and for various other expenditures related to our stores, distribution centers, buying and corporate offices. We expect to primarily fund capital expenditures with available cash and cash flows from operations.
We had no purchases of investments in fiscal 2014 and purchases of $12.0 million and $5.4 million in fiscal 2013 and fiscal 2012, respectively. We had proceeds from investments of $12.0 million, $1.6 million, and $6.2 million in fiscal 2014, 2013, and 2012, respectively.
Financing Activities
Net cash used in financing activities was $460.4 million, $681.8 million, and $557.0 million in fiscal 2014, 2013, and 2012, respectively. During fiscal 2014, 2013, and 2012, our liquidity and capital requirements were provided by available cash and cash flows from operations and in fiscal 2014, the issuance of our unsecured 3.375% Senior Notes due September 2024 (“2024 Notes”).
In September 2014, we issued $250 million of unsecured 2024 Notes and used most of the net proceeds of approximately $246 million to purchase our New York buying office building for $222 million and the remaining $24 million for other general corporate purposes.
We repurchased 7.4 million, 8.2 million, and 7.5 million shares of common stock for aggregate purchase prices of approximately $550 million, $550 million, and $450 million in fiscal 2014, 2013, and 2012, respectively. We also acquired 0.5 million shares in each of fiscal 2014, 2013, and 2012 of treasury stock from our employee stock equity compensation programs, for aggregate purchase prices of approximately $39.0 million, $29.9 million, and $29.4 million during fiscal 2014, 2013, and 2012, respectively. In February 2015, our Board of Directors approved a new two-year $1.4 billion stock repurchase program for fiscal 2015 and 2016.
30
16185_Ross AR14_10K_CS6-r3.indd 30 3/31/15 9:30 AM

In February 2015, our Board of Directors declared a quarterly cash dividend of $0.235 per common share, payable on March 31, 2015. Our Board of Directors declared cash dividends of $0.20 per common share in February, May, August, and November 2014, cash dividends of $0.17 per common share in January, May, August, and November 2013, and cash dividends of $0.14 per common share in January, May, August, and November 2012.
During fiscal 2014, 2013, and 2012, we paid dividends of $168.5 million, $147.9 million, and $125.7 million, respectively.
In March 2015, our Board of Directors approved a two-for-one stock split in the form of a 100 percent stock dividend, to be paid on June 11, 2015 to stockholders of record as of April 22, 2015. The stock split will not have an impact on our consolidated financial position or results of operations. Share and per share amounts have not been restated to reflect the pending stock split.
Short-term trade credit represents a significant source of financing for merchandise inventory. Trade credit arises from customary payment terms and trade practices with our vendors. We regularly review the adequacy of credit available to us from all sources and expect to be able to maintain adequate trade credit, bank lines, and other credit sources to meet our capital and liquidity requirements, including lease payment obligations, in 2015.
Our existing $600 million unsecured revolving credit facility expires in June 2017 and contains a $300 million sublimit for issuance of standby letters of credit. Interest on this facility is based on LIBOR plus an applicable margin (currently 100 basis points) and is payable quarterly and upon maturity. As of January 31, 2015, we had no borrowings or standby letters of credit outstanding on this facility and our $600 million credit facility remains in place and available.
We estimate that existing cash balances, cash flows from operations, bank credit lines, and trade credit are adequate to meet our operating cash needs and to fund our planned capital investments, common stock repurchases, and quarterly dividend payments for at least the next twelve months.
Contractual Obligations
The table below presents our significant contractual obligations as of January 31, 2015:
Less than 1 1 – 3 3 – 5 After 5($000) year years years years Total1
Senior notes $ — $ — $ 85,000 $ 315,000 $ 400,000
Interest payment obligations 18,105 36,210 30,109 50,146 134,570
Operating leases (rent obligations) 432,005 855,580 589,540 475,499 2,352,624
New York buying office ground lease2 6,418 12,835 12,835 958,986 991,074
Purchase obligations 1,928,578 19,726 4,663 — 1,952,967
Total contractual obligations $ 2,385,106 $ 924,351 $ 722,147 $ 1,799,631 $ 5,831,235
¹ We have a $101.7 million liability for unrecognized tax benefits that is included in Other long-term liabilities on our Consolidated Balance Sheets. This liability is excluded from the schedule above as the timing of payments cannot be reasonably estimated.
2 Our New York buying office building is subject to a 99-year ground lease.
31
16185_Ross AR14_10K_CS6-r3.indd 31 3/31/15 9:30 AM

Senior notes. In September 2014, we issued unsecured 2024 Notes with an aggregate principal amount of $250 million. The 2024 Notes were issued at a price equal to 99.329% of the principal amount. Interest on the 2024 Notes is payable semi-annually beginning March 2015.
As of January 31, 2015, we also had outstanding two series of unsecured senior notes in the aggregate principal amount of $150 million, held by various institutional investors. The Series A notes totaling $85 million are due in December 2018 and bear interest at a rate of 6.38%. The Series B notes totaling $65 million are due in December 2021 and bear interest at a rate of 6.53%. Borrowings under these senior notes are subject to certain financial covenants, including interest coverage and other financial ratios. As of January 31, 2015, we were in compliance with those covenants.
The 2024 Notes, Series A, and Series B senior notes are all subject to prepayment penalties for early payment of principal.
Off-Balance Sheet Arrangements
Operating leases. We currently lease all but three of our store locations, three warehouse facilities, and a buying office. In addition, we have a ground lease related to our New York buying office. Except for certain leasehold improvements and equipment, these leased locations do not represent long-term capital investments.
Two of the warehouses are in Carlisle, Pennsylvania with leases expiring in 2016 and 2017. The third warehouse is in Fort Mill, South Carolina, with a lease expiring in 2019. The leases for the two Carlisle, Pennsylvania warehouses contain renewal provisions.
We currently lease approximately 68,000 square feet of office space for our Los Angeles buying office. The lease term for this facility expires in 2017 and contains renewal provisions.
Purchase obligations. As of January 31, 2015 we had purchase obligations of approximately $1,953 million. These purchase obligations primarily consist of merchandise inventory purchase orders, commitments related to construction projects, store fixtures and supplies, and information technology service, transportation, and maintenance contracts.
Commercial Credit Facilities
The table below presents our significant available commercial credit facilities at January 31, 2015:
Amount of Commitment Expiration Per Period
Less than 1 – 3 3 – 5 After 5 Total amount($000) 1 year years years years committed
Revolving credit facility $ — $ 600,000 $ — $ — $ 600,000
Total commercial commitments $ — $ 600,000 $ — $ — $ 600,000
For additional information relating to this credit facility, refer to Note D of Notes to Consolidated Financial Statements.
32
16185_Ross AR14_10K_CS6-r3.indd 32 3/31/15 9:30 AM

Revolving credit facility. Our existing $600 million unsecured revolving credit facility expires in June 2017 and contains a $300 million sublimit for issuance of standby letters of credit. Interest on this facility is based on LIBOR plus an applicable margin (currently 100 basis points) and is payable quarterly and upon maturity. As of January 31, 2015 we had no borrowings outstanding or standby letters of credit issued under this facility.
Our revolving credit facility has covenant restrictions requiring us to maintain certain interest coverage and other financial ratios. In addition, the interest rates under the revolving credit facility may vary depending on actual interest coverage ratios achieved. As of January 31, 2015 we were in compliance with these covenants.
Standby letters of credit and collateral trust. We use standby letters of credit outside of our revolving credit facility in addition to a funded trust to collateralize our insurance obligations. As of January 31, 2015 and February 1, 2014, we had $19.5 million and $24.3 million, respectively, in standby letters of credit outstanding and $56.3 million and $47.2 million, respectively, in a collateral trust. The standby letters of credit are collateralized by restricted cash and the collateral trust consists of restricted cash, cash equivalents, and investments.
Trade letters of credit. We had $32.8 million and $31.6 million in trade letters of credit outstanding at January 31, 2015 and February 1, 2014, respectively.
Effects of inflation or deflation. We do not consider the effects of inflation or deflation to be material to our financial position and results of operations.
Other
Critical Accounting Policies
The preparation of our consolidated financial statements requires our management to make estimates and assumptions that affect the reported amounts. These estimates and assumptions are evaluated on an ongoing basis and are based on historical experience and on various other factors that management believes to be reasonable. We believe the following critical accounting policies describe the more significant judgments and estimates used in the preparation of our consolidated financial statements.
Merchandise inventory. Our merchandise inventory is stated at the lower of cost (determined using a weighted average basis) or net realizable value. We purchase manufacturer overruns and canceled orders both during and at the end of a season which are referred to as “packaway” inventory. Packaway inventory is purchased with the intent that it will be stored in our warehouses until a later date. The timing of the release of packaway inventory to our stores is principally driven by the product mix and seasonality of the merchandise, and its relation to the Company’s store merchandise assortment plans. As such, the aging of packaway varies by merchandise category and seasonality of purchase, but typically packaway remains in storage less than six months. Packaway inventory accounted for approximately 45%, 49%, and 47% of total inventories as of January 31, 2015, February 1, 2014, and February 2, 2013, respectively. Merchandise inventory includes acquisition, processing, and storage costs related to packaway inventory.
Included in the carrying value of our merchandise inventory is a provision for shortage. The shortage reserve is based on historical shortage rates as evaluated through our annual physical merchandise inventory counts and cycle counts. If actual market conditions, markdowns, or shortage are less favorable than those projected by us, or if sales of the merchandise inventory are more difficult than anticipated, additional merchandise inventory write-downs may be required.
33
16185_Ross AR14_10K_CS6-r3.indd 33 3/31/15 9:30 AM
Long-lived assets. We review for a long-lived asset impairment charge when events or changes in circumstances indicate that the carrying amount of a long-lived asset may not be recoverable based on estimated future cash flows. If analysis of the undiscounted cash flow of an asset group was less than the carrying value of the asset group, an impairment loss would be recognized to write the asset group down to its fair value. If our actual results differ materially from projected results, an impairment charge may be required in the future. In the course of performing our annual analysis, we determined that no long-lived asset impairment charge was required for fiscal 2014, 2013, or 2012.
Depreciation and amortization expense. Property and equipment are stated at cost, less accumulated depreciation and amortization. Depreciation is calculated using the straight-line method over the estimated useful life of the asset, typically ranging from three to 12 years for equipment and 20 to 40 years for land improvements and buildings. The cost of leasehold improvements is amortized over the lesser of the useful life of the asset or the applicable lease term.
Lease accounting. When a lease contains “rent holidays” or requires fixed escalations of the minimum lease payments, we record rental expense on a straight-line basis over the term of the lease and the difference between the average rental amount charged to expense and the amount payable under the lease is recorded as deferred rent. We begin recording rent expense on the lease possession date. Tenant improvement allowances are included in Other long-term liabilities and are amortized over the lease term. Changes in tenant improvement allowances are included as a component of operating activities in the Consolidated Statements of Cash Flows.
Insurance obligations. We use a combination of insurance and self-insurance for a number of risk management activities, including workers’ compensation, general liability, and employee-related health care benefits. Our self-insurance and deductible liability is determined actuarially, based on claims filed and an estimate of claims incurred but not reported. Should a greater amount of claims occur compared to what is estimated or the costs of medical care increase beyond what was anticipated, our recorded reserves may not be sufficient and additional charges could be required.
Stock-based compensation. We recognize compensation expense based upon the grant date fair value of all stock-based awards. We use historical data to estimate pre-vesting forfeitures and to recognize stock-based compensation expense. All stock-based compensation awards are expensed over the service or performance periods of the awards.
Income taxes. We account for our uncertain tax positions in accordance with Accounting Standards Codification (“ASC”) 740. We are required to make assumptions and judgments regarding our income tax exposures. Our policy is to recognize interest and/or penalties related to all tax positions in income tax expense. To the extent that accrued interest and penalties do not ultimately become payable, amounts accrued will be reduced and reflected as a reduction of the overall income tax provision in the period that such determination is made.
The critical accounting policies noted above are not intended to be a comprehensive list of all of our accounting policies. In many cases, the accounting treatment of a particular transaction is specifically dictated by Generally Accepted Accounting Principles (“GAAP”), with no need for management’s judgment in their application. There are also areas in which management’s judgment in selecting one alternative accounting principle over another would not produce a materially different result. See our audited consolidated financial statements and notes thereto under Item 8 in this Annual Report on Form 10-K, which contain accounting policies and other disclosures required by GAAP.
Recently issued accounting standards. In May 2014, the Financial Accounting Standards Board (“FASB”) issued Accounting Standards Update (ASU) 2014-09, Revenue from Contracts with Customers. The guidance provides a five-step analysis of transactions to determine when and how revenue is recognized. The core principle of the guidance is that a company should recognize revenue when the customer obtains control of promised goods or services in an amount that reflects the consideration which the company expects to receive in exchange for those goods or services. ASU 2014-09 is effective for our annual and interim reporting periods beginning in fiscal 2017. We are currently evaluating the effect adoption of this new guidance will have on our consolidated financial statements.
34
16185_Ross AR14_10K_CS6-r3.indd 34 3/31/15 9:30 AM

Forward-Looking Statements
Our Annual Report on Form 10-K for fiscal 2014, and information we provide in our Annual Report to Stockholders, press releases, and other investor communications including those on our corporate website, may contain a number of forward-looking statements regarding, without limitation, planned store growth, new markets, expected sales, projected earnings levels, capital expenditures, and other matters. These forward-looking statements reflect our then current beliefs, projections, and estimates with respect to future events and our projected financial performance, operations, and competitive position. The words “plan,” “expect,” “target,” “anticipate,” “estimate,” “believe,” “forecast,” “projected,” “guidance,” “looking ahead” and similar expressions identify forward-looking statements.
Future economic and industry trends that could potentially impact revenue, profitability, and growth remain difficult to predict. As a result, our forward-looking statements are subject to risks and uncertainties which could cause our actual results to differ materially from those forward-looking statements and our previous expectations and projections. Refer to Item 1A in this Annual Report on Form 10-K for a more complete discussion of risk factors for Ross and dd’s DISCOUNTS. The factors underlying our forecasts are dynamic and subject to change. As a result, any forecasts or forward-looking statements speak only as of the date they are given and do not necessarily reflect our outlook at any other point in time. We disclaim any obligation to update or revise these forward-looking statements.
ITEM 7A. QUANTITATIVE AND QUALITATIVE DISCLOSURES ABOUT MARKET RISK
We are exposed to market risks, which primarily include changes in interest rates. We do not engage in financial transactions for trading or speculative purposes.
We occasionally use forward contracts to hedge against fluctuations in foreign currency prices. We had no outstanding forward contracts as of January 31, 2015.
Interest that is payable on our revolving credit facility is based on variable interest rates and is, therefore, affected by changes in market interest rates. As of January 31, 2015, we had no borrowings outstanding under our revolving credit facility.
We have two outstanding series of unsecured notes held by institutional investors: Series A Senior Notes due December 2018 for $85 million accrues interest at 6.38% and Series B Senior Notes due December 2021 for $65 million accrues interest at 6.53%. The amount outstanding under these notes as of January 31, 2015 was $150 million. We also have unsecured 3.375% Senior Notes due September 2024 with an aggregate principal amount of $250 million. Interest that is payable on our senior notes is based on fixed interest rates and is therefore, unaffected by changes in market interest rates.
Interest is receivable on our short- and long-term investments. Changes in interest rates may impact interest income recognized in the future, or the fair value of our investment portfolio.
A hypothetical 100 basis point increase or decrease in prevailing market interest rates would not have a material impact on our consolidated financial position, results of operations, cash flows, or the fair values of our short- and long-term investments as of and for the year ended January 31, 2015. We do not consider the potential losses in future earnings and cash flows from reasonably possible, near-term changes in interest rates to be material.
35
16185_Ross AR14_10K_CS6-r3.indd 35 3/31/15 9:30 AM

ITEM 8. FINANCIAL STATEMENTS AND SUPPLEMENTARY DATA
Consolidated Statements of Earnings
Year Ended Year Ended Year Ended ($000, except per share data) January 31, 2015 February 1, 2014 February 2, 2013
Sales $ 11,041,677 $ 10,230,353 $ 9,721,065Costs and Expenses Cost of goods sold 7,937,956 7,360,924 7,011,428 Selling, general and administrative 1,615,371 1,526,366 1,437,886 Interest expense (income), net 2,984 (247) 6,907
Total costs and expenses 9,556,311 8,887,043 8,456,221
Earnings before taxes 1,485,366 1,343,310 1,264,844Provision for taxes on earnings 560,642 506,006 478,081
Net earnings $ 924,724 $ 837,304 $ 786,763
Earnings per share Basic $ 4.47 $ 3.93 $ 3.59 Diluted $ 4.42 $ 3.88 $ 3.53
Weighted average shares outstanding (000) Basic 206,777 212,881 219,130 Diluted 209,039 215,805 222,784
The accompanying notes are an integral part of these consolidated financial statements.
Consolidated Statements of Comprehensive Income
Year Ended Year Ended Year Ended ($000) January 31, 2015 February 1, 2014 February 2, 2013
Net earnings $ 924,724 $ 837,304 $ 786,763
Other comprehensive income: Change in unrealized loss on investments, net of tax (59) (196) (50)
Comprehensive income $ 924,665 $ 837,108 $ 786,713
The accompanying notes are an integral part of these consolidated financial statements.
36
16185_Ross AR14_10K_CS6-r5.indd 36 4/1/15 10:24 AM

Consolidated Balance Sheets
($000, except share data) January 31, 2015 February 1, 2014
AssetsCurrent Assets Cash and cash equivalents $ 696,608 $ 423,168 Short-term investments 500 12,006 Accounts receivable 73,278 62,612 Merchandise inventory 1,372,675 1,257,155 Prepaid expenses and other 106,778 101,991 Deferred income taxes 12,951 10,227
Total current assets 2,262,790 1,867,159
Property and Equipment Land and buildings 952,428 478,973 Fixtures and equipment 1,933,383 1,678,397 Leasehold improvements 854,572 813,972 Construction-in-progress 293,715 510,221
4,034,098 3,481,563 Less accumulated depreciation and amortization 1,760,346 1,606,264
Property and equipment, net 2,273,752 1,875,299Long-term investments 3,110 3,710Other long-term assets 163,482 150,629
Total assets $ 4,703,134 $ 3,896,797
Liabilities and Stockholders’ EquityCurrent Liabilities Accounts payable $ 1,000,700 $ 779,455 Accrued expenses and other 385,325 359,929 Accrued payroll and benefits 256,141 235,324 Income taxes payable 17,202 18,349
Total current liabilities 1,659,368 1,393,057
Long-term debt 398,375 150,000Other long-term liabilities 279,500 287,567Deferred income taxes 86,681 58,871
Commitments and contingencies
Stockholders’ Equity Common stock, par value $.01 per share 2,075 2,134 Authorized 600,000,000 shares Issued and outstanding 207,470,000 and 213,420,000 shares, respectively Additional paid-in capital 1,015,681 935,591 Treasury stock (160,600) (121,559) Accumulated other comprehensive income 330 389 Retained earnings 1,421,724 1,190,747
Total stockholders’ equity 2,279,210 2,007,302
Total liabilities and stockholders’ equity $ 4,703,134 $ 3,896,797
The accompanying notes are an integral part of these consolidated financial statements.
37
16185_Ross AR14_10K_CS6-r3.indd 37 3/31/15 9:30 AM

Consolidated Statements of Stockholders’ Equity
Accumulated Additional other com- Common stock paid-in Treasury prehensive Retained(000) Shares Amount capital stock income (loss) earnings Total
Balance at January 28, 2012 226,864 $ 2,269 $ 788,895 $ (62,262) $ 635 $ 763,475 $ 1,493,012Net earnings — — — — — 786,763 786,763Unrealized investment loss, net — — — — (50) — (50)Common stock issued under stock plans, net of shares used for tax withholding 1,315 13 19,030 (29,446) — — (10,403)Tax benefit from equity issuance — — 29,989 — — — 29,989Stock-based compensation — — 48,952 — — — 48,952Common stock repurchased (7,458) (75) (20,347) — — (429,578) (450,000)Dividends declared ($0.59 per share) — — — — — (131,400) (131,400)
Balance at February 2, 2013 220,721 $ 2,207 $ 866,519 $ (91,708) $ 585 $ 989,260 $ 1,766,863Net earnings — — — — — 837,304 837,304Unrealized investment loss, net — — — — (196) — (196)Common stock issued under stock plans, net of shares used for tax withholding 878 9 19,065 (29,851) — — (10,777)Tax benefit from equity issuance — — 27,661 — — — 27,661Stock-based compensation — — 46,847 — — — 46,847Common stock repurchased (8,179) (82) (24,501) — — (525,417) (550,000)Dividends declared ($0.51 per share) — — — — — (110,400) (110,400)
Balance at February 1, 2014 213,420 $ 2,134 $ 935,591 $ (121,559) $ 389 $ 1,190,747 $ 2,007,302Net earnings — — — — — 924,724 924,724Unrealized investment loss, net — — — — (59) — (59)Common stock issued under stock plans, net of shares used for tax withholding 1,453 15 21,963 (39,041) — — (17,063)Tax benefit from equity issuance — — 29,759 — — — 29,759Stock-based compensation — — 53,001 — — — 53,001Common stock repurchased (7,403) (74) (24,633) — — (525,293) (550,000)Dividends declared ($0.80 per share) — — — — — (168,454) (168,454)
Balance at January 31, 2015 207,470 $ 2,075 $ 1,015,681 $ (160,600) $ 330 $ 1,421,724 $ 2,279,210
The accompanying notes are an integral part of these consolidated financial statements.
38
16185_Ross AR14_10K_CS6-r3.indd 38 3/31/15 9:30 AM
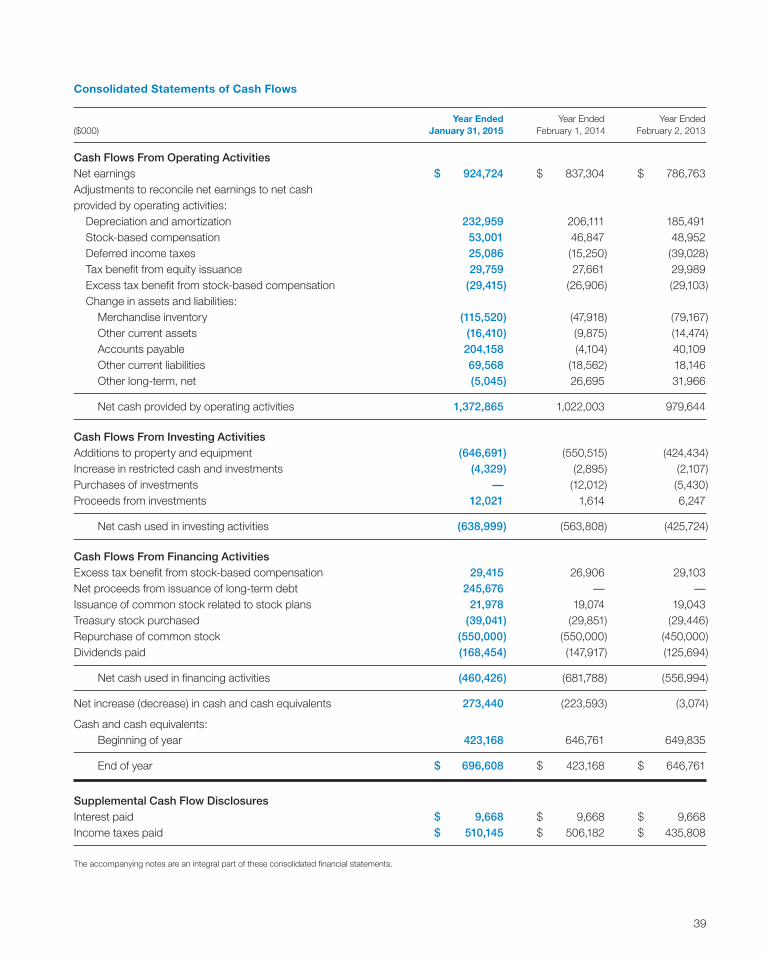
Consolidated Statements of Cash Flows
Year Ended Year Ended Year Ended ($000) January 31, 2015 February 1, 2014 February 2, 2013
Cash Flows From Operating ActivitiesNet earnings $ 924,724 $ 837,304 $ 786,763Adjustments to reconcile net earnings to net cash provided by operating activities: Depreciation and amortization 232,959 206,111 185,491 Stock-based compensation 53,001 46,847 48,952 Deferred income taxes 25,086 (15,250) (39,028) Tax benefit from equity issuance 29,759 27,661 29,989 Excess tax benefit from stock-based compensation (29,415) (26,906) (29,103) Change in assets and liabilities: Merchandise inventory (115,520) (47,918) (79,167) Other current assets (16,410) (9,875) (14,474) Accounts payable 204,158 (4,104) 40,109 Other current liabilities 69,568 (18,562) 18,146 Other long-term, net (5,045) 26,695 31,966
Net cash provided by operating activities 1,372,865 1,022,003 979,644
Cash Flows From Investing ActivitiesAdditions to property and equipment (646,691) (550,515) (424,434)Increase in restricted cash and investments (4,329) (2,895) (2,107)Purchases of investments — (12,012) (5,430)Proceeds from investments 12,021 1,614 6,247
Net cash used in investing activities (638,999) (563,808) (425,724)
Cash Flows From Financing ActivitiesExcess tax benefit from stock-based compensation 29,415 26,906 29,103 Net proceeds from issuance of long-term debt 245,676 — —Issuance of common stock related to stock plans 21,978 19,074 19,043 Treasury stock purchased (39,041) (29,851) (29,446)Repurchase of common stock (550,000) (550,000) (450,000)Dividends paid (168,454) (147,917) (125,694)
Net cash used in financing activities (460,426) (681,788) (556,994)
Net increase (decrease) in cash and cash equivalents 273,440 (223,593) (3,074)
Cash and cash equivalents: Beginning of year 423,168 646,761 649,835
End of year $ 696,608 $ 423,168 $ 646,761
Supplemental Cash Flow DisclosuresInterest paid $ 9,668 $ 9,668 $ 9,668Income taxes paid $ 510,145 $ 506,182 $ 435,808
The accompanying notes are an integral part of these consolidated financial statements.
39
16185_Ross AR14_10K_CS6-r3.indd 39 3/31/15 9:30 AM
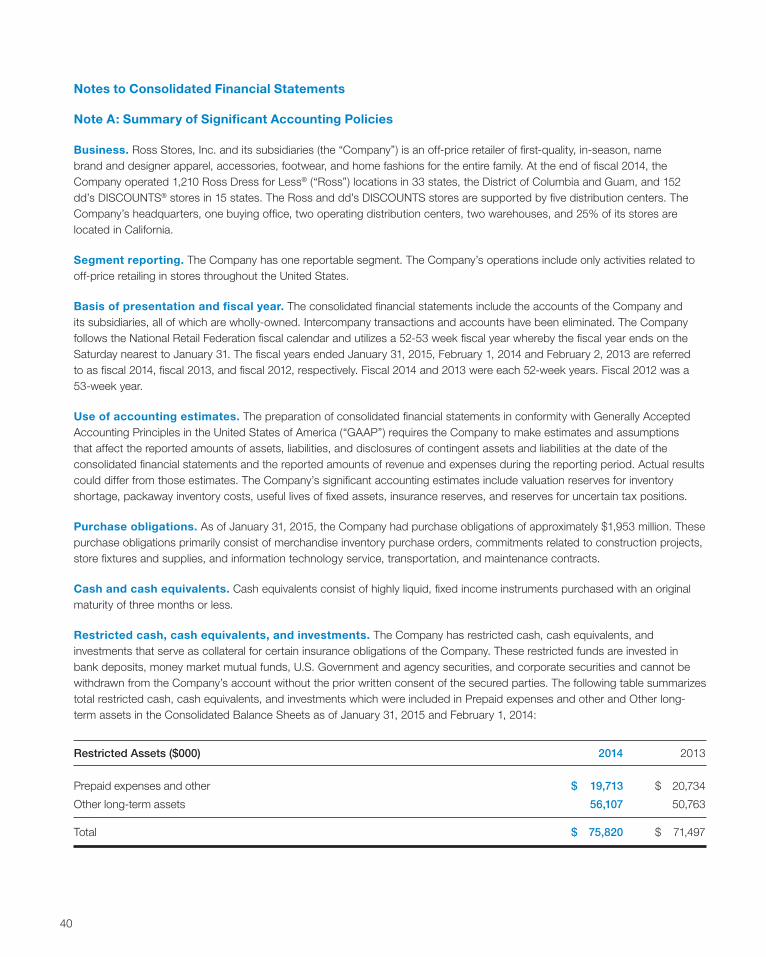
Notes to Consolidated Financial Statements
Note A: Summary of Significant Accounting Policies
Business. Ross Stores, Inc. and its subsidiaries (the “Company”) is an off-price retailer of first-quality, in-season, name brand and designer apparel, accessories, footwear, and home fashions for the entire family. At the end of fiscal 2014, the Company operated 1,210 Ross Dress for Less® (“Ross”) locations in 33 states, the District of Columbia and Guam, and 152 dd’s DISCOUNTS® stores in 15 states. The Ross and dd’s DISCOUNTS stores are supported by five distribution centers. The Company’s headquarters, one buying office, two operating distribution centers, two warehouses, and 25% of its stores are located in California.
Segment reporting. The Company has one reportable segment. The Company’s operations include only activities related to off-price retailing in stores throughout the United States.
Basis of presentation and fiscal year. The consolidated financial statements include the accounts of the Company and its subsidiaries, all of which are wholly-owned. Intercompany transactions and accounts have been eliminated. The Company follows the National Retail Federation fiscal calendar and utilizes a 52-53 week fiscal year whereby the fiscal year ends on the Saturday nearest to January 31. The fiscal years ended January 31, 2015, February 1, 2014 and February 2, 2013 are referred to as fiscal 2014, fiscal 2013, and fiscal 2012, respectively. Fiscal 2014 and 2013 were each 52-week years. Fiscal 2012 was a 53-week year.
Use of accounting estimates. The preparation of consolidated financial statements in conformity with Generally Accepted Accounting Principles in the United States of America (“GAAP”) requires the Company to make estimates and assumptions that affect the reported amounts of assets, liabilities, and disclosures of contingent assets and liabilities at the date of the consolidated financial statements and the reported amounts of revenue and expenses during the reporting period. Actual results could differ from those estimates. The Company’s significant accounting estimates include valuation reserves for inventory shortage, packaway inventory costs, useful lives of fixed assets, insurance reserves, and reserves for uncertain tax positions.
Purchase obligations. As of January 31, 2015, the Company had purchase obligations of approximately $1,953 million. These purchase obligations primarily consist of merchandise inventory purchase orders, commitments related to construction projects, store fixtures and supplies, and information technology service, transportation, and maintenance contracts.
Cash and cash equivalents. Cash equivalents consist of highly liquid, fixed income instruments purchased with an original maturity of three months or less.
Restricted cash, cash equivalents, and investments. The Company has restricted cash, cash equivalents, and investments that serve as collateral for certain insurance obligations of the Company. These restricted funds are invested in bank deposits, money market mutual funds, U.S. Government and agency securities, and corporate securities and cannot be withdrawn from the Company’s account without the prior written consent of the secured parties. The following table summarizes total restricted cash, cash equivalents, and investments which were included in Prepaid expenses and other and Other long-term assets in the Consolidated Balance Sheets as of January 31, 2015 and February 1, 2014:
Restricted Assets ($000) 2014 2013
Prepaid expenses and other $ 19,713 $ 20,734
Other long-term assets 56,107 50,763
Total $ 75,820 $ 71,497
40
16185_Ross AR14_10K_CS6-r3.indd 40 3/31/15 9:30 AM

Notes to Consolidated Financial Statements
Note A: Summary of Significant Accounting Policies
Business. Ross Stores, Inc. and its subsidiaries (the “Company”) is an off-price retailer of first-quality, in-season, name brand and designer apparel, accessories, footwear, and home fashions for the entire family. At the end of fiscal 2014, the Company operated 1,210 Ross Dress for Less® (“Ross”) locations in 33 states, the District of Columbia and Guam, and 152 dd’s DISCOUNTS® stores in 15 states. The Ross and dd’s DISCOUNTS stores are supported by five distribution centers. The Company’s headquarters, one buying office, two operating distribution centers, two warehouses, and 25% of its stores are located in California.
Segment reporting. The Company has one reportable segment. The Company’s operations include only activities related to off-price retailing in stores throughout the United States.
Basis of presentation and fiscal year. The consolidated financial statements include the accounts of the Company and its subsidiaries, all of which are wholly-owned. Intercompany transactions and accounts have been eliminated. The Company follows the National Retail Federation fiscal calendar and utilizes a 52-53 week fiscal year whereby the fiscal year ends on the Saturday nearest to January 31. The fiscal years ended January 31, 2015, February 1, 2014 and February 2, 2013 are referred to as fiscal 2014, fiscal 2013, and fiscal 2012, respectively. Fiscal 2014 and 2013 were each 52-week years. Fiscal 2012 was a 53-week year.
Use of accounting estimates. The preparation of consolidated financial statements in conformity with Generally Accepted Accounting Principles in the United States of America (“GAAP”) requires the Company to make estimates and assumptions that affect the reported amounts of assets, liabilities, and disclosures of contingent assets and liabilities at the date of the consolidated financial statements and the reported amounts of revenue and expenses during the reporting period. Actual results could differ from those estimates. The Company’s significant accounting estimates include valuation reserves for inventory shortage, packaway inventory costs, useful lives of fixed assets, insurance reserves, and reserves for uncertain tax positions.
Purchase obligations. As of January 31, 2015, the Company had purchase obligations of approximately $1,953 million. These purchase obligations primarily consist of merchandise inventory purchase orders, commitments related to construction projects, store fixtures and supplies, and information technology service, transportation, and maintenance contracts.
Cash and cash equivalents. Cash equivalents consist of highly liquid, fixed income instruments purchased with an original maturity of three months or less.
Restricted cash, cash equivalents, and investments. The Company has restricted cash, cash equivalents, and investments that serve as collateral for certain insurance obligations of the Company. These restricted funds are invested in bank deposits, money market mutual funds, U.S. Government and agency securities, and corporate securities and cannot be withdrawn from the Company’s account without the prior written consent of the secured parties. The following table summarizes total restricted cash, cash equivalents, and investments which were included in Prepaid expenses and other and Other long-term assets in the Consolidated Balance Sheets as of January 31, 2015 and February 1, 2014:
Restricted Assets ($000) 2014 2013
Prepaid expenses and other $ 19,713 $ 20,734
Other long-term assets 56,107 50,763
Total $ 75,820 $ 71,497
The classification between current and long-term is based on the timing of expected payments of the insurance obligations.
Estimated fair value of financial instruments. The carrying value of cash and cash equivalents, short- and long-term investments, restricted cash and cash equivalents, restricted investments, accounts receivable, other long-term assets, accounts payable, and other long-term liabilities approximates their estimated fair value. See Note B and Note D for additional fair value information.
Cash and cash equivalents were $696.6 million and $423.2 million, at January 31, 2015 and February 1, 2014, respectively, and include bank deposits and money market funds for which the fair value was determined using quoted prices for identical assets in active markets, which are considered to be Level 1 inputs under the fair value measurements and disclosures guidance.
Investments. The Company’s investments are comprised of various debt securities. At January 31, 2015 and February 1, 2014, these investments were classified as available-for-sale and are stated at fair value. Investments are classified as either short- or long-term based on their original maturities and the Company’s intent. Investments with an original maturity of less than one year are classified as short-term. See Note B for additional information.
Merchandise inventory. Merchandise inventory is stated at the lower of cost (determined using a weighted average basis) or net realizable value. The Company purchases manufacturer overruns and canceled orders both during and at the end of a season which are referred to as “packaway” inventory. Packaway inventory is purchased with the intent that it will be stored in the Company’s warehouses until a later date. The timing of the release of packaway inventory to the stores is principally driven by the product mix and seasonality of the merchandise, and its relation to the Company’s store merchandise assortment plans. As such, the aging of packaway varies by merchandise category and seasonality of purchase, but typically packaway remains in storage less than six months. Merchandise inventory includes acquisition, processing, and storage costs related to packaway inventory. The cost of the Company’s merchandise inventory is reduced by valuation reserves for shortage based on historical shortage experience from the Company’s physical merchandise inventory counts and cycle counts.
Cost of goods sold. In addition to product costs, the Company includes in cost of goods sold its buying, distribution and freight expenses as well as occupancy costs, and depreciation and amortization related to the Company’s retail stores, buying, and distribution facilities. Buying expenses include costs to procure merchandise inventories. Distribution expenses include the cost of operating the Company’s distribution centers and warehouse facilities.
Prepaid expenses and other. Prepaid expenses and other as of January 31, 2015 and February 1, 2014 consisted of the following:
($000) 2014 2013
Restricted cash and investments $ 19,713 $ 20,734
Prepaid expenses 87,065 81,257
Total $ 106,778 $ 101,991
Property and equipment. Property and equipment are stated at cost, less accumulated depreciation and amortization. Depreciation is calculated using the straight-line method over the estimated useful life of the asset, typically ranging from three to 12 years for equipment and 20 to 40 years for land improvements and buildings. Depreciation and amortization expense on property and equipment was $233.0 million, $206.1 million, and $185.5 million for fiscal 2014, 2013, and 2012, respectively. The cost of leasehold improvements is amortized over the useful life of the asset or the applicable lease term, whichever is less. The Company capitalizes interest during the construction period. Interest capitalized was $10.8 million, $10.8 million, and $3.9 million in fiscal 2014, fiscal 2013, and fiscal 2012, respectively. As of January 31, 2015, February 1, 2014, and February 2, 2013 the Company had $58.6 million, $61.3 million, and $23.7 million, respectively, of property and equipment purchased but not yet paid. These purchases are included in Property and Equipment and in Accounts payable and Accrued expenses and other in the accompanying Consolidated Balance Sheets.
41
16185_Ross AR14_10K_CS6-r3.indd 41 3/31/15 9:30 AM

In September 2014, the Company completed the purchase of its previously leased New York buying office for $222 million.
Other long-term assets. Other long-term assets as of January 31, 2015 and February 1, 2014 consisted of the following:
($000) 2014 2013
Deferred compensation (Note B) $ 94,054 $ 88,269
Restricted cash and investments 56,107 50,763
Deposits 3,285 3,285
Goodwill 2,889 2,889
Other 7,147 5,423
Total $ 163,482 $ 150,629
Property and other long-term assets that are subject to amortization are reviewed for impairment whenever events or changes in circumstances indicate that the carrying amount of an asset may not be recoverable. Intangible assets that are not subject to amortization, including goodwill, are tested for impairment annually or more frequently if events or changes in circumstances indicate that the asset may be impaired. Based on the Company’s evaluation during fiscal 2014, 2013, and 2012, no impairment charges were recorded.
Store closures. The Company continually reviews the operating performance of individual stores. For stores that are closed, the Company records a liability for future minimum lease payments net of estimated sublease recoveries and related ancillary costs at the time the liability is incurred. In 2014, the Company closed nine stores. In 2013, the Company closed 11 stores. The lease loss liability was $2.7 million and $6.3 million, as of January 31, 2015 and February 1, 2014, respectively. Operating costs, including depreciation, of stores to be closed are expensed during the period they remain in use.
Accounts payable. Accounts payable represents amounts owed to third parties at the end of the period. Accounts payable includes book cash overdrafts (checks issued under zero balance accounts not yet presented for payment) in excess of cash balances in such accounts of approximately $123.8 million and $75.7 million at January 31, 2015 and February 1, 2014, respectively. The Company includes the change in book cash overdrafts in operating cash flows.
Insurance obligations. The Company uses a combination of insurance and self-insurance for a number of risk management activities, including workers’ compensation, general liability, and employee-related health care benefits. The self-insurance and deductible liability is determined actuarially, based on claims filed and an estimate of claims incurred but not yet reported. Self-insurance and deductible reserves as of January 31, 2015 and February 1, 2014 consisted of the following:
($000) 2014 2013
Workers’ compensation $ 87,388 $ 82,223
General liability 37,253 34,524
Medical plans 3,159 3,537
Total $ 127,800 $ 120,284
Workers’ compensation and self-insured medical plan liabilities are included in Accrued payroll and benefits, and accruals for general liability are included in Accrued expenses and other in the accompanying Consolidated Balance Sheets.
42
16185_Ross AR14_10K_CS6-r3.indd 42 3/31/15 9:30 AM

Other long-term liabilities. Other long-term liabilities as of January 31, 2015 and February 1, 2014 consisted of the following:
($000) 2014 2013
Income taxes (Note F) $ 101,696 $ 104,944
Deferred compensation (Note G) 94,054 88,269
Deferred rent 59,465 64,671
Tenant improvement allowances 19,562 19,744
Other 4,723 9,939
Total $ 279,500 $ 287,567
Lease accounting. When a lease contains “rent holidays” or requires fixed escalations of the minimum lease payments, the Company records rental expense on a straight-line basis over the term of the lease and the difference between the average rental amount charged to expense and the amount payable under the lease is recorded as deferred rent. The Company begins recording rent expense on the lease possession date. Tenant improvement allowances are included in Other long-term liabilities and are amortized over the lease term. Changes in tenant improvement allowances are included as a component of operating activities in the Consolidated Statements of Cash Flows.
Revenue recognition. The Company recognizes revenue at the point of sale and maintains an allowance for estimated future returns. Sales of stored value cards are deferred until they are redeemed for the purchase of Company merchandise. The Company’s stored value cards do not have expiration dates. Based upon historical redemption rates, a small percentage of stored value cards will never be redeemed, which represents breakage. The Company recognizes income from stored value card breakage as a reduction of operating expenses when redemption by a customer is considered to be remote. Income recognized from breakage was not significant in fiscal 2014, 2013, and 2012.
Sales tax collected is not recognized as revenue and is included in Accrued expenses and other.
43
16185_Ross AR14_10K_CS6-r3.indd 43 3/31/15 9:30 AM

Sales mix. The Company’s sales mix is shown below for fiscal 2014, 2013, and 2012:
2014 2013 2012
Ladies 29% 29% 29%
Home Accents and Bed and Bath 24% 24% 24%
Accessories, Lingerie, Fine Jewelry, and Fragrances 13% 13% 13%
Men’s 13% 13% 13%
Shoes 13% 13% 13%
Children’s 8% 8% 8%
Total 100% 100% 100%
Allowance for sales returns. An allowance for the gross margin loss on estimated sales returns is included in Accrued expenses and other in the Consolidated Balance Sheets. The allowance for sales returns consists of the following:
($000) Beginning Balance Additions Returns Ending Balance
Year ended:
January 31, 2015 $ 7,431 $ 717,040 $ (715,877) $ 8,594
February 1, 2014 $ 7,165 $ 699,835 $ (699,569) $ 7,431
February 2, 2013 $ 6,426 $ 680,058 $ (679,319) $ 7,165
Store pre-opening. Store pre-opening costs are expensed in the period incurred.
Advertising. Advertising costs are expensed in the period incurred and are included in Selling, general and administrative expenses. Advertising costs for fiscal 2014, 2013, and 2012 were $72.1 million, $70.2 million, and $67.7 million, respectively.
Stock-based compensation. The Company recognizes compensation expense based upon the grant date fair value of all stock-based awards, typically over the vesting period. See Note C for more information on the Company’s stock-based compensation plans.
Taxes on earnings. The Company accounts for income taxes in accordance with Accounting Standards Codification (“ASC”) 740, “Accounting for Income Taxes,” which requires the recognition of deferred tax assets and liabilities for the expected future tax consequences of events that have been recognized in the Company’s consolidated financial statements or tax returns. In estimating future tax consequences, the Company generally considers all expected future events other than changes in the tax law or tax rates. ASC 740 clarifies the criteria that an individual tax position must satisfy for some or all of the benefits of that position to be recognized in a company’s consolidated financial statements. ASC 740 prescribes a recognition threshold of more-likely-than-not, and a measurement standard for all tax positions taken or expected to be taken on a tax return, in order for those tax positions to be recognized in the consolidated financial statements. See Note F.
44
16185_Ross AR14_10K_CS6-r3.indd 44 3/31/15 9:30 AM

Treasury stock. The Company records treasury stock at cost. Treasury stock includes shares purchased from employees for tax withholding purposes related to vesting of restricted stock grants.
Earnings per share (“EPS”). The Company computes and reports both basic EPS and diluted EPS. Basic EPS is computed by dividing net earnings by the weighted average number of common shares outstanding for the period. Diluted EPS is computed by dividing net earnings by the sum of the weighted average number of common shares and dilutive common stock equivalents outstanding during the period. Diluted EPS reflects the total potential dilution that could occur from outstanding equity plan awards, including unexercised stock options and unvested shares of both performance and non-performance based awards of restricted stock and restricted stock units.
In fiscal 2014, 2013, and 2012 there were 2,500, 2,900, and 53,900 weighted average shares, respectively, that were excluded from the calculation of diluted EPS because their effect would have been anti-dilutive for those years.
The following is a reconciliation of the number of shares (denominator) used in the basic and diluted EPS computations:
Effect of dilutive Basic common stock Diluted Shares in (000s) EPS equivalents EPS
2014
Shares 206,777 2,262 209,039
Amount $ 4.47 $ (0.05) $ 4.42
2013
Shares 212,881 2,924 215,805
Amount $ 3.93 $ (0.05) $ 3.88
2012
Shares 219,130 3,654 222,784
Amount $ 3.59 $ (0.06) $ 3.53
Comprehensive income. Comprehensive income includes net earnings and components of other comprehensive income (loss), net of tax, consisting of unrealized investment gains or losses.
Recently issued accounting standards. In May 2014, the Financial Accounting Standards Board (“FASB”) issued Accounting Standards Update (ASU) 2014-09, Revenue from Contracts with Customers. The guidance provides a five-step analysis of transactions to determine when and how revenue is recognized. The core principle of the guidance is that a company should recognize revenue when the customer obtains control of promised goods or services in an amount that reflects the consideration which the company expects to receive in exchange for those goods or services. ASU 2014-09 is effective for the Company’s annual and interim reporting periods beginning in fiscal 2017. The Company is currently evaluating the effect that adoption of this new guidance will have on its consolidated financial statements.
45
16185_Ross AR14_10K_CS6-r3.indd 45 3/31/15 9:30 AM

Note B: Investments and Restricted Investments
The amortized cost and fair value of the Company’s available-for-sale securities as of January 31, 2015 were:
($000)Amortized
costUnrealized
gainsUnrealized
lossesFair
valueShort-term
Long term
-
Investments
Corporate securities $ 3,298 $ 243 $ (5) $ 3,536 $ 500 $ 3,036
Mortgage-backed securities 69 5 — 74 — 74
Total investments 3,367 248 (5) 3,610 500 3,110
Restricted Investments
U.S. government and agency securities 3,563 265 — 3,828 — 3,828
Total restricted investments 3,563 265 — 3,828 — 3,828
Total $ 6,930 $ 513 $ (5) $ 7,438 $ 500 $ 6,938
The amortized cost and fair value of the Company’s available-for-sale securities as of February 1, 2014 were:
($000)Amortized
costUnrealized
gainsUnrealized
lossesFair
valueShort-term
Long term
-
Investments
Corporate securities $ 3,298 $ 325 $ (4) $ 3,619 $ — $ 3,619
U.S. government and agency securities 12,005 1 — 12,006 12,006 —
Mortgage-backed securities 86 5 — 91 — 91
Total investments 15,389 331 (4) 15,716 12,006 3,710
Restricted Investments
Corporate securities 110 5 — 115 115 —
U.S. government and agency securities 3,728 266 — 3,994 145 3,849
Total restricted investments 3,838 271 — 4,109 260 3,849
Total $ 19,227 $ 602 $ (4) $ 19,825 $ 12,266 $ 7,559
The change in fair value of investment securities for fiscal years 2014, 2013, and 2012 was a decrease of $0.1 million, $0.3 million, and $0.1 million, respectively.
Accounting standards pertaining to fair value measurements establish a three-tier fair value hierarchy, which prioritizes the inputs used in measuring fair value. These tiers include: Level 1, defined as observable inputs such as quoted prices in active markets; Level 2, defined as inputs other than quoted prices in active markets that are either directly or indirectly observable; and Level 3, defined as unobservable inputs in which little or no market data exists, therefore requiring an entity to develop its own assumptions. This fair value hierarchy also requires the Company to maximize the use of observable inputs and minimize the use of unobservable inputs when measuring fair value. Corporate, U.S. government and agency, and mortgage-backed securities are classified within Level 1 or Level 2 because these securities are valued using quoted market prices or alternative pricing sources and models utilizing market observable inputs.
46
16185_Ross AR14_10K_CS6-r3.indd 46 3/31/15 9:30 AM

Investments and restricted investments measured at fair value at January 31, 2015 are summarized below:
Fair Value Measurements at Reporting Date
Quoted prices Significant in active markets other Significant for identical observable unobservable assets inputs inputs ($000) January 31, 2015 (Level 1) (Level 2) (Level 3)
Investments
Corporate securities $ 3,536 $ — $ 3,536 $ —
Mortgage-backed securities 74 — 74 —
Total investments 3,610 — 3,610 —
Restricted Investments
U.S. government and agency securities 3,828 3,828 — —
Total restricted investments 3,828 3,828 — —
Total $ 7,438 $ 3,828 $ 3,610 $ —
Investments and restricted investments measured at fair value at February 1, 2014 are summarized below:
Fair Value Measurements at Reporting Date
Quoted prices Significant in active markets other Significant for identical observable unobservable assets inputs inputs ($000) February 1, 2014 (Level 1) (Level 2) (Level 3)
Investments
Corporate securities $ 3,619 $ — $ 3,619 $ —
U.S. government and agency securities 12,006 12,006 — —
Mortgage-backed securities 91 — 91 —
Total investments 15,716 12,006 3,710 —
Restricted Investments
Corporate securities 115 — 115 —
U.S. government and agency securities 3,994 3,994 — —
Total restricted investments 4,109 3,994 115 —
Total $ 19,825 $ 16,000 $ 3,825 $ —
47
16185_Ross AR14_10K_CS6-r3.indd 47 3/31/15 9:30 AM

The future maturities of investment and restricted investment securities at January 31, 2015 were:
Investments Restricted Investments
($000) Cost basisEstimated fair value Cost basis
Estimated fair value
Maturing in one year or less $ 500 $ 500 $ — $ —
Maturing after one year through five years 2,867 3,110 3,563 3,828
Total $ 3,367 $ 3,610 $ 3,563 $ 3,828
The underlying assets in the Company’s non-qualified deferred compensation program as of January 31, 2015 and February 1, 2014 (included in Other long-term assets and in Other long-term liabilities) primarily consist of participant-directed money market, stable value, stock, and bond funds. The fair value measurement for funds with quoted market prices in active markets (Level 1) and for funds without quoted market prices in active markets (Level 2) are as follows:
($000) 2014 2013
Level 1 $ 81,926 $ 76,913
Level 2 12,128 11,356
Total $ 94,054 $ 88,269
Fair market value for Level 2 funds is considered to be the sum of participant funds invested under a group annuity contract plus accrued interest.
Note C: Stock-Based Compensation
For fiscal 2014, 2013, and 2012, the Company recognized stock-based compensation expense as follows:
($000) 2014 2013 2012
Restricted stock $ 34,729 $ 30,921 $ 29,191
Performance awards 16,003 13,812 17,872
ESPP 2,269 2,114 1,889
Total $ 53,001 $ 46,847 $ 48,952
Capitalized stock-based compensation cost was not significant in any year.
No stock options were granted during fiscal 2014, 2013, and 2012. The Company recognizes expense for ESPP purchase rights equal to the value of the 15% discount given on the purchase date. At January 31, 2015, the Company had one active stock-based compensation plan, which is further described in Note H.
48
16185_Ross AR14_10K_CS6-r3.indd 48 3/31/15 9:30 AM

Total stock-based compensation recognized in the Company’s Consolidated Statements of Earnings for fiscal 2014, 2013, and 2012 is as follows:
Statements of Earnings Classification ($000) 2014 2013 2012
Cost of goods sold $ 27,088 $ 24,432 $ 22,915
Selling, general and administrative 25,913 22,415 26,037
Total $ 53,001 $ 46,847 $ 48,952
Note D: Debt
Senior notes. Unsecured senior debt, net of unamortized discounts as of January 31, 2015 and February 1, 2014 consisted of the following:
($000) 2014 2013
6.38% Series A Senior Notes due 2018 $ 85,000 $ 85,000
6.53% Series B Senior Notes due 2021 65,000 65,000
3.375% Senior Notes due 20241 248,375 —
Total $ 398,375 $ 150,000
1 Net of unamortized discount of $1.6 million at January 31, 2015.
In September 2014, the Company issued unsecured 3.375% Senior Notes due September 2024 (the “2024 Notes”) with an aggregate principal amount of $250 million at a price equal to 99.329% of the principal amount. Cash proceeds, net of discount and other issuance fees and expenses, were approximately $246 million and were used to purchase the Company’s New York buying office for $222 million and for other general corporate purposes. Interest on the 2024 Notes is payable semi-annually beginning March 2015.
At January 31, 2015, the Company also had outstanding two series of unsecured senior notes in the aggregate principal amount of $150 million, held by various institutional investors. The Series A notes totaling $85 million are due in December 2018 and bear interest at a rate of 6.38%. The Series B notes totaling $65 million are due in December 2021 and bear interest at a rate of 6.53%. Borrowings under these senior notes are subject to certain financial covenants, including interest coverage and other financial ratios. As of January 31, 2015, the Company was in compliance with these covenants.
The 2024 Notes, Series A, and Series B senior notes are all subject to prepayment penalties for early payment of principal.
The aggregate fair value of the three outstanding senior note issuances was approximately $442 million as of January 31, 2015 and the aggregate fair value of the Series A and Series B notes was $182 million as of February 1, 2014. The fair value is estimated by obtaining comparable market quotes which are considered to be Level 1 inputs under the fair value measurements and disclosures guidance.
49
16185_Ross AR14_10K_CS6-r4.indd 49 3/31/15 4:40 PM
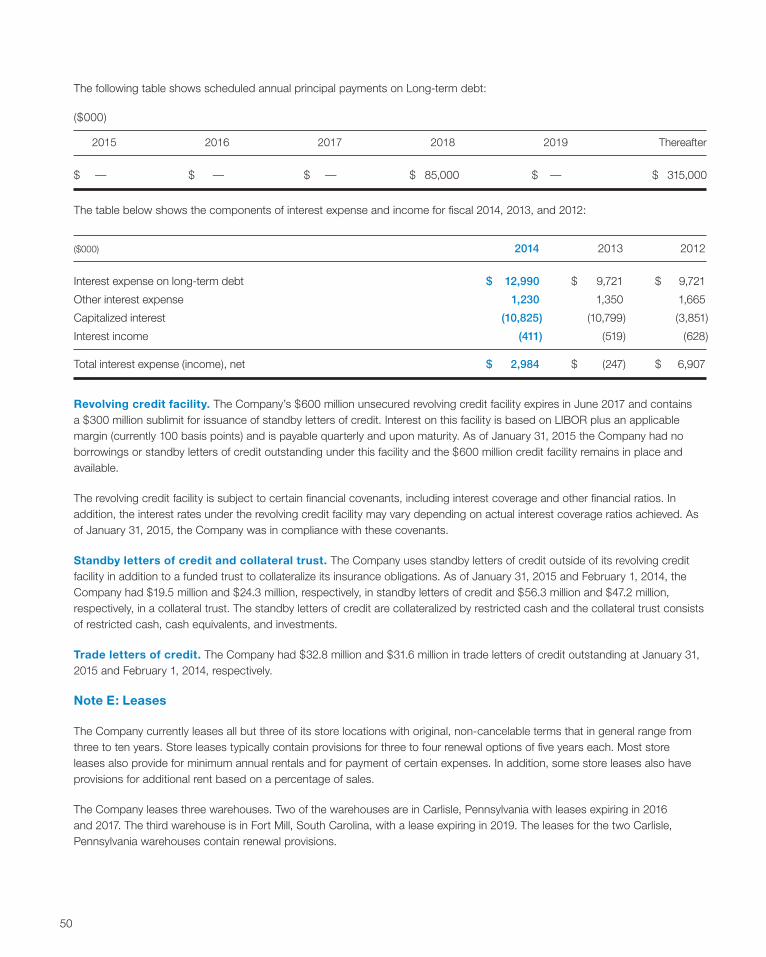
The following table shows scheduled annual principal payments on Long-term debt:
($000)
2015 2016 2017 2018 2019 Thereafter
$ — $ — $ — $ 85,000 $ — $ 315,000
The table below shows the components of interest expense and income for fiscal 2014, 2013, and 2012:
($000) 2014 2013 2012
Interest expense on long-term debt $ 12,990 $ 9,721 $ 9,721
Other interest expense 1,230 1,350 1,665
Capitalized interest (10,825) (10,799) (3,851)
Interest income (411) (519) (628)
Total interest expense (income), net $ 2,984 $ (247) $ 6,907
Revolving credit facility. The Company’s $600 million unsecured revolving credit facility expires in June 2017 and contains a $300 million sublimit for issuance of standby letters of credit. Interest on this facility is based on LIBOR plus an applicable margin (currently 100 basis points) and is payable quarterly and upon maturity. As of January 31, 2015 the Company had no borrowings or standby letters of credit outstanding under this facility and the $600 million credit facility remains in place and available.
The revolving credit facility is subject to certain financial covenants, including interest coverage and other financial ratios. In addition, the interest rates under the revolving credit facility may vary depending on actual interest coverage ratios achieved. As of January 31, 2015, the Company was in compliance with these covenants.
Standby letters of credit and collateral trust. The Company uses standby letters of credit outside of its revolving credit facility in addition to a funded trust to collateralize its insurance obligations. As of January 31, 2015 and February 1, 2014, the Company had $19.5 million and $24.3 million, respectively, in standby letters of credit and $56.3 million and $47.2 million, respectively, in a collateral trust. The standby letters of credit are collateralized by restricted cash and the collateral trust consists of restricted cash, cash equivalents, and investments.
Trade letters of credit. The Company had $32.8 million and $31.6 million in trade letters of credit outstanding at January 31, 2015 and February 1, 2014, respectively.
Note E: Leases
The Company currently leases all but three of its store locations with original, non-cancelable terms that in general range from three to ten years. Store leases typically contain provisions for three to four renewal options of five years each. Most store leases also provide for minimum annual rentals and for payment of certain expenses. In addition, some store leases also have provisions for additional rent based on a percentage of sales.
The Company leases three warehouses. Two of the warehouses are in Carlisle, Pennsylvania with leases expiring in 2016 and 2017. The third warehouse is in Fort Mill, South Carolina, with a lease expiring in 2019. The leases for the two Carlisle, Pennsylvania warehouses contain renewal provisions.
50
16185_Ross AR14_10K_CS6-r4.indd 50 3/31/15 4:41 PM

The Company leases approximately 68,000 square feet of office space for its Los Angeles buying office. The lease term for this facility expires in 2017 and contains renewal provisions. In addition, the Company has a ground lease related to its New York buying office.
The aggregate future minimum annual lease payments under leases in effect at January 31, 2015 are as follows:
($000) Total operating leases
2015 $ 438,423
2016 462,606
2017 405,809
2018 340,607
2019 261,768
Thereafter 1,434,485
Total minimum lease payments $ 3,343,698
Total rent expense was $457.0 million, $434.9 million, and $406.6 million in fiscal 2014, 2013, and 2012, respectively.
Note F: Taxes on Earnings
The provision for income taxes consisted of the following:
($000) 2014 2013 2012
Current
Federal $ 499,009 $ 486,203 $ 485,882
State 36,547 35,053 31,227
535,556 521,256 517,109
Deferred
Federal 23,452 (11,055) (37,178)
State 1,634 (4,195) (1,850)
25,086 (15,250) (39,028)
Total $ 560,642 $ 506,006 $ 478,081
In fiscal 2014, 2013, and 2012, the Company realized tax benefits of $29.8 million, $27.7 million and $30.0 million, respectively, related to employee equity programs that were recorded in additional paid-in capital.
51
16185_Ross AR14_10K_CS6-r3.indd 51 3/31/15 9:30 AM

The provision for taxes for financial reporting purposes is different from the tax provision computed by applying the statutory federal income tax rate. The differences are reconciled below:
2014 2013 2012
Federal income taxes at the statutory rate 35% 35% 35%
State income taxes (net of federal benefit) and other, net 3% 3% 3%
Total 38% 38% 38%
The components of deferred income taxes at January 31, 2015 and February 1, 2014 are as follows:
($000) 2014 2013
Deferred Tax Assets
Accrued liabilities $ 77,791 $ 87,835
Deferred compensation 33,456 31,034
Stock-based compensation 35,332 33,048
Deferred rent 26,370 17,888
California franchise taxes and credits 18,478 16,479
Employee benefits 23,136 16,177
Other 4,927 4,992
219,490 207,453
Deferred Tax Liabilities
Depreciation (252,013) (212,383)
Merchandise inventory (26,668) (28,558)
Supplies (11,616) (10,730)
Prepaid expenses (2,923) (4,426)
(293,220) (256,097)
Net Deferred Tax Liabilities $ (73,730) $ (48,644)
Classified as:
Current net deferred tax asset $ 12,951 $ 10,227
Long-term net deferred tax liability (86,681) (58,871)
Net Deferred Tax Liabilities $ (73,730) $ (48,644)
At the end of fiscal 2014 and 2013, the Company’s state tax credit carryforwards for income tax purposes were approximately $12.1 million and $11.0 million, respectively. The state tax credit carryforwards will begin to expire in fiscal 2023.
52
16185_Ross AR14_10K_CS6-r3.indd 52 3/31/15 9:30 AM

The changes in amounts of unrecognized tax benefits (gross of federal tax benefits and excluding interest and penalties) at fiscal 2014, 2013, and 2012 are as follows:
($000) 2014 2013 2012
Unrecognized tax benefits — beginning of year $ 80,323 $ 65,667 $ 56,524Gross increases:
Tax positions in current period 15,441 15,591 11,009
Tax positions in prior period — 2,418 4,167Gross decreases:
Tax positions in prior periods (9,432) (519) (1,476)
Lapse of statute limitations (5,732) (2,274) (1,312)
Settlements (2,484) (560) (3,245)
Unrecognized tax benefits — end of year $ 78,116 $ 80,323 $ 65,667
At the end of fiscal 2014, 2013, and 2012, the reserves for unrecognized tax benefits were $101.7 million, $104.9 million, and $82.5 million inclusive of $23.6 million, $24.6 million, and $16.8 million of related interest and penalties, respectively. The Company accounts for interest and penalties related to unrecognized tax benefits as a part of its provision for taxes on earnings. If recognized, $51.0 million would impact the Company’s effective tax rate. The difference between the total amount of unrecognized tax benefits and the amounts that would impact the effective tax rate relates to amounts attributable to deferred income tax assets and liabilities. These amounts are net of federal and state income taxes.
During the next twelve months, it is reasonably possible that the statute of limitations may lapse pertaining to positions taken by the Company in prior year tax returns. If this occurs, the total amount of unrecognized tax benefits may decrease, reducing the provision for taxes on earnings by up to $6.3 million.
The Company is generally open to audit by the Internal Revenue Service under the statute of limitations for fiscal years 2011 through 2014. The Company’s state income tax returns are generally open to audit under the various statutes of limitations for fiscal years 2010 through 2014. Certain state tax returns are currently under audit by state tax authorities. The Company does not expect the results of these audits to have a material impact on the consolidated financial statements.
Note G: Employee Benefit Plans
The Company has a defined contribution plan that is available to certain employees. Under the plan, employee and Company contributions and accumulated plan earnings qualify for favorable tax treatment under Section 401(k) of the Internal Revenue Code. This plan permits employees to make contributions up to the maximum limits allowable under the Internal Revenue Code. The Company matches up to 4% of the employee’s salary up to the plan limits. Company matching contributions to the 401(k) plan were $11.4 million, $10.4 million, and $9.4 million in fiscal 2014, 2013, and 2012, respectively.
The Company also has an Incentive Compensation Plan which provides cash awards to key management and employees based on Company and individual performance.
The Company also makes available to management a Non-qualified Deferred Compensation Plan which allows management to make payroll contributions on a pre-tax basis in addition to the 401(k) plan. Other long-term assets include $94.1 million and $88.3 million at January 31, 2015 and February 1, 2014, respectively, of long-term plan investments, at market value, set aside or designated for the Non-qualified Deferred Compensation Plan (See Note B). Plan investments are designated by the participants, and investment returns are not guaranteed by the Company. The Company has a corresponding liability to participants of $94.1 million and $88.3 million at January 31, 2015 and February 1, 2014, respectively, included in Other long-term liabilities in the Consolidated Balance Sheets.
53
16185_Ross AR14_10K_CS6-r3.indd 53 3/31/15 9:30 AM

In addition, the Company has certain individuals who receive or will receive post-employment medical benefits. The estimated liability for these benefits of $9.7 million and $6.8 million is included in Accrued expenses and other in the accompanying Consolidated Balance Sheets as of January 31, 2015 and February 1, 2014, respectively.
Note H: Stockholders’ Equity
Common stock. In February 2015, the Company’s Board of Directors approved a two-year $1.4 billion stock repurchase program for fiscal 2015 and 2016.
The following table summarizes the Company’s stock repurchase activity in fiscal 2014, 2013, and 2012:
Shares repurchased Average repurchase Repurchased Fiscal Year (in millions) price (in millions)
2014 7.4 $ 74.30 $ 550
2013 8.2 $ 67.24 $ 550
2012 7.5 $ 60.34 $ 450
Preferred stock. The Company has four million shares of preferred stock authorized, with a par value of $.01 per share. No preferred stock is issued or outstanding.
Dividends. In February 2015, the Company’s Board of Directors declared a quarterly cash dividend of $0.235 per common share, payable on March 31, 2015. The Company’s Board of Directors declared cash dividends of $0.20 per common share in February, May, August, and November 2014, cash dividends of $0.17 per common share in January, May, August, and November 2013, and cash dividends of $0.14 per common share in January, May, August, and November 2012.
In March 2015, the Company’s Board of Directors approved a two-for-one stock split in the form of a 100 percent stock dividend, to be paid on June 11, 2015 to stockholders of record as of April 22, 2015. The stock split will not have an impact on the Company’s consolidated financial position or results of operations. Share and per share amounts have not been restated to reflect the pending stock split.
2008 Equity Incentive Plan. In 2008, the Company’s stockholders approved the adoption of the Ross Stores, Inc. 2008 Equity Incentive Plan (the “2008 Plan”) with an initial share reserve of 16.5 million shares of the Company’s common stock, of which 12.0 million shares can be issued as full value awards. The 2008 Plan provides for various types of incentive awards, which may potentially include the grant of stock options, stock appreciation rights, restricted stock purchase rights, restricted stock bonuses, restricted stock units, performance shares, performance units, and deferred compensation awards. As of January 31, 2015, there were 6.6 million shares that remained available for grant under the 2008 Plan.
54
16185_Ross AR14_10K_CS6-r3.indd 54 3/31/15 9:30 AM

A summary of the stock option activity for fiscal 2014 is presented below:
Weighted Weighted average average remaining Aggregate Number of exercise contractual intrinsic (000, except per share data) shares price term value
Outstanding at February 1, 2014 1,169 $ 14.07
Granted — —
Exercised (650) 14.05
Forfeited — —
Outstanding at January 31, 2015, all vested 519 $ 14.09 0.99 $ 40,285
The following table summarizes information about the weighted average remaining contractual life (in years) and the weighted average exercise prices for stock options both outstanding and exercisable as of January 31, 2015 (number of shares in thousands):
Options outstanding and exercisable
Exercise price range Number of shares Remaining life Exercise price
$ 11.47 to $ 13.77 116 0.98 $ 13.28
13.84 to 13.89 56 0.29 13.85
13.91 to 13.91 185 1.11 13.91
13.92 to 14.65 106 0.52 14.32
14.70 to 16.39 56 2.19 16.22
$ 11.47 to $ 16.39 519 0.99 $ 14.09
A summary of the restricted stock activity for fiscal 2014 is presented below:
Weighted average Number of grant date (000, except per share data) shares fair value
Unvested at February 1, 2014 3,914 $ 37.14 Awarded 967 67.15 Released (1,316) 29.29
Forfeited (74) 55.46
Unvested at January 31, 2015 3,491 $ 48.02
55
16185_Ross AR14_10K_CS6-r3.indd 55 3/31/15 9:30 AM

The market value of shares of restricted stock and of the stock underlying restricted stock units at the date of grant is amortized to expense over the vesting period of generally three to five years. The unamortized compensation expense at January 31, 2015 and February 1, 2014 was $87.4 million and $74.9 million, respectively, which is expected to be recognized over a weighted average remaining period of 1.7 years. Intrinsic value for restricted stock, defined as the closing market value on the last business day of fiscal year 2014 (or $91.71), was $320.2 million. A total of 6,628,000, 6,986,000, and 7,202,000 shares were available for new restricted stock awards at the end of fiscal 2014, 2013, and 2012, respectively. During fiscal 2014, 2013, and 2012, shares purchased by the Company for tax withholding totaled 534,000, 496,000, and 505,000 shares, respectively, and are considered treasury shares which are available for reissuance. As of January 31, 2015 and February 1, 2014, the Company held 4,888,000 and 4,354,000 shares of treasury stock, respectively.
Performance share awards. The Company has a performance share award program for senior executives. A performance share award represents a right to receive shares of restricted stock or restricted stock units on a specified settlement date based on the Company’s attainment of a profitability-based performance goal during the performance period, which is the Company’s fiscal year. If attained, the restricted stock or units then vest over a service period, generally two to three years from the date the performance award was granted. The release of shares related to restricted stock units earned is deferred generally for one year from the date earned. The Company issued approximately 303,000, 240,000, and 280,000 shares in settlement of the fiscal 2014, 2013, and 2012 awards.
Employee Stock Purchase Plan. Under the Employee Stock Purchase Plan (“ESPP”), eligible employees participating in the quarterly offering period can choose to have up to the lesser of 10% of their annual base earnings or the IRS annual share purchase limit of $25,000 in aggregate market value to purchase the Company’s common stock. The purchase price of the stock is 85% of the closing market price on the date of purchase. Purchases occur on a quarterly basis (on the last trading day of each calendar quarter). The Company recognizes expense for ESPP purchase rights equal to the value of the 15% discount given on the purchase date.
During fiscal 2014, 2013, and 2012, employees purchased approximately 200,000, 208,000, and 211,000 shares, respectively, of the Company’s common stock under the plan at weighted average per share prices of $64.35, $57.57, and $50.67, respectively. Through January 31, 2015, approximately 19,342,000 shares had been issued under this plan and 658,000 shares remained available for future issuance.
Note I: Related Party Transactions
The Company has a consulting agreement with Norman Ferber, its Chairman Emeritus of the Board of Directors, under which the Company pays him an annual consulting fee of $1.5 million through May 2018. In addition, the agreement provides for administrative support and health and other benefits for the individual and his dependents, which totaled approximately $0.3 million in fiscal 2014, 2013, and 2012, along with amounts to cover premiums through May 2018 on a life insurance policy with a death benefit of $2.0 million. On termination of Mr. Ferber’s consultancy with the Company, the Company will pay Mr. Ferber $75,000 per year for a period of 10 years.
Robert Ferber, the son of Norman Ferber, is a buyer with the Company. For fiscal 2014, the Company paid Robert Ferber compensation including salary and bonus of approximately $133,000.
56
16185_Ross AR14_10K_CS6-r3.indd 56 3/31/15 9:30 AM

Note J: Litigation, Claims, and Assessments
Like many California retailers, the Company has been named in class action lawsuits alleging violation of wage and hour and other employment laws. Class action litigation remains pending as of January 31, 2015.
The Company is also party to various other legal and regulatory proceedings arising in the normal course of business. Actions filed against the Company include commercial, product and product safety, customer, intellectual property, and labor and employment-related claims, including lawsuits in which private plaintiffs or governmental agencies allege that the Company violated federal, state, and / or local laws. Actions against the Company are in various procedural stages. Many of these proceedings raise factual and legal issues and are subject to uncertainties.
In the opinion of management, the resolution of pending class action litigation and other currently pending legal and regulatory proceedings will not have a material adverse effect on the Company’s financial condition, results of operations, or cash flows.
57
16185_Ross AR14_10K_CS6-r3.indd 57 3/31/15 9:30 AM
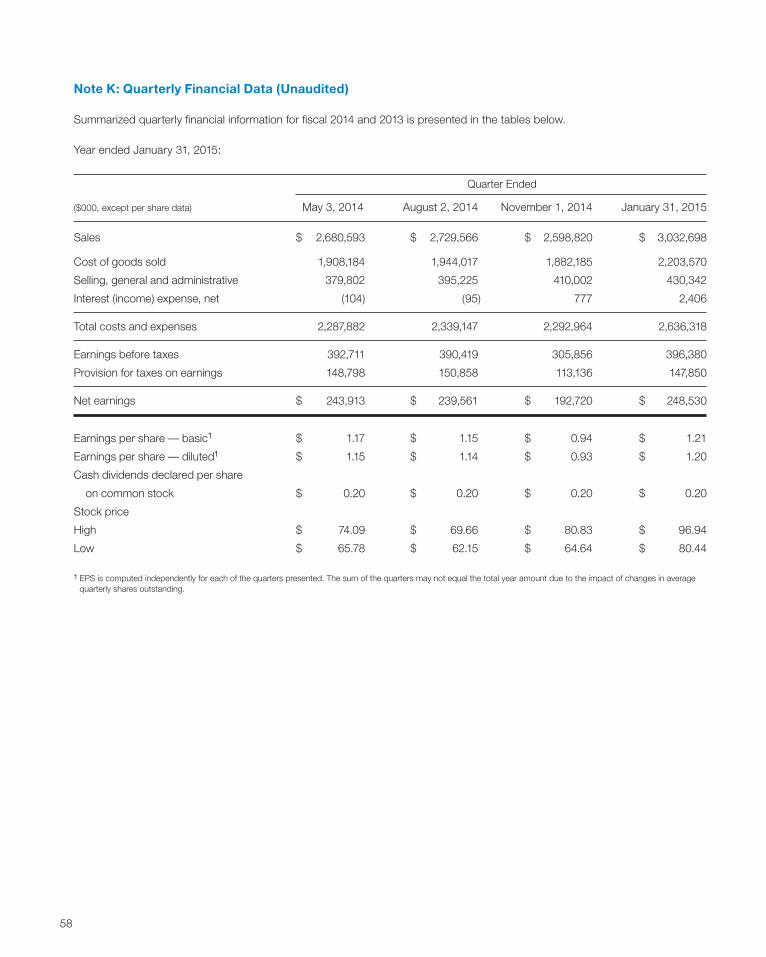
Note K: Quarterly Financial Data (Unaudited)
Summarized quarterly financial information for fiscal 2014 and 2013 is presented in the tables below.
Year ended January 31, 2015:
Quarter Ended
($000, except per share data) May 3, 2014 August 2, 2014 November 1, 2014 January 31, 2015
Sales $ 2,680,593 $ 2,729,566 $ 2,598,820 $ 3,032,698
Cost of goods sold 1,908,184 1,944,017 1,882,185 2,203,570
Selling, general and administrative 379,802 395,225 410,002 430,342
Interest (income) expense, net (104) (95) 777 2,406
Total costs and expenses 2,287,882 2,339,147 2,292,964 2,636,318
Earnings before taxes 392,711 390,419 305,856 396,380
Provision for taxes on earnings 148,798 150,858 113,136 147,850
Net earnings $ 243,913 $ 239,561 $ 192,720 $ 248,530
Earnings per share — basic1 $ 1.17 $ 1.15 $ 0.94 $ 1.21
Earnings per share — diluted1 $ 1.15 $ 1.14 $ 0.93 $ 1.20
Cash dividends declared per share
on common stock $ 0.20 $ 0.20 $ 0.20 $ 0.20
Stock price
High $ 74.09 $ 69.66 $ 80.83 $ 96.94
Low $ 65.78 $ 62.15 $ 64.64 $ 80.44
1 EPS is computed independently for each of the quarters presented. The sum of the quarters may not equal the total year amount due to the impact of changes in average quarterly shares outstanding.
58
16185_Ross AR14_10K_CS6-r3.indd 58 3/31/15 9:30 AM
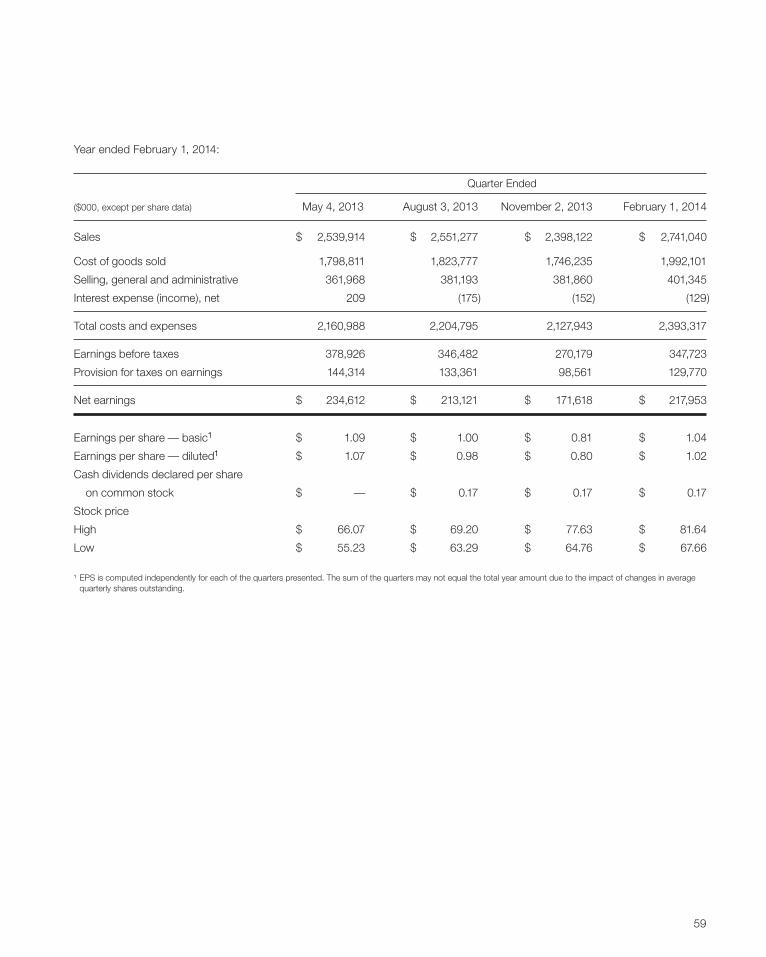
Year ended February 1, 2014:
Quarter Ended
($000, except per share data) May 4, 2013 August 3, 2013 November 2, 2013 February 1, 2014
Sales $ 2,539,914 $ 2,551,277 $ 2,398,122 $ 2,741,040
Cost of goods sold 1,798,811 1,823,777 1,746,235 1,992,101
Selling, general and administrative 361,968 381,193 381,860 401,345
Interest expense (income), net 209 (175) (152) (129)
Total costs and expenses 2,160,988 2,204,795 2,127,943 2,393,317
Earnings before taxes 378,926 346,482 270,179 347,723
Provision for taxes on earnings 144,314 133,361 98,561 129,770
Net earnings $ 234,612 $ 213,121 $ 171,618 $ 217,953
Earnings per share — basic1 $ 1.09 $ 1.00 $ 0.81 $ 1.04
Earnings per share — diluted1 $ 1.07 $ 0.98 $ 0.80 $ 1.02
Cash dividends declared per share
on common stock $ — $ 0.17 $ 0.17 $ 0.17
Stock price
High $ 66.07 $ 69.20 $ 77.63 $ 81.64
Low $ 55.23 $ 63.29 $ 64.76 $ 67.66
¹ EPS is computed independently for each of the quarters presented. The sum of the quarters may not equal the total year amount due to the impact of changes in average quarterly shares outstanding.
59
16185_Ross AR14_10K_CS6-r4.indd 59 3/31/15 4:15 PM

REPORT OF INDEPENDENT REGISTERED PUBLIC ACCOUNTING FIRM
To the Board of Directors and Stockholders of Ross Stores, Inc.:
We have audited the accompanying consolidated balance sheets of Ross Stores, Inc. and subsidiaries (the “Company”) as of January 31, 2015 and February 1, 2014, and the related consolidated statements of earnings, comprehensive income, stockholders’ equity, and cash flows for each of the three years in the period ended January 31, 2015. We also have audited the Company’s internal control over financial reporting as of January 31, 2015, based on criteria established in Internal Control - Integrated Framework (2013) issued by the Committee of Sponsoring Organizations of the Treadway Commission. The Company’s management is responsible for these financial statements, for maintaining effective internal control over financial reporting, and for its assessment of the effectiveness of internal control over financial reporting, included in the accompanying “Management’s Annual Report on Internal Control over Financial Reporting.” Our responsibility is to express an opinion on these financial statements and an opinion on the Company’s internal control over financial reporting based on our audits.
We conducted our audits in accordance with the standards of the Public Company Accounting Oversight Board (United States). Those standards require that we plan and perform the audit to obtain reasonable assurance about whether the financial statements are free of material misstatement and whether effective internal control over financial reporting was maintained in all material respects. Our audits of the financial statements included examining, on a test basis, evidence supporting the amounts and disclosures in the financial statements, assessing the accounting principles used and significant estimates made by management, and evaluating the overall financial statement presentation. Our audit of internal control over financial reporting included obtaining an understanding of internal control over financial reporting, assessing the risk that a material weakness exists, and testing and evaluating the design and operating effectiveness of internal control based on the assessed risk. Our audits also included performing such other procedures as we considered necessary in the circumstances. We believe that our audits provide a reasonable basis for our opinions.
A company’s internal control over financial reporting is a process designed by, or under the supervision of, the company’s principal executive and principal financial officers, or persons performing similar functions, and effected by the company’s board of directors, management, and other personnel to provide reasonable assurance regarding the reliability of financial reporting and the preparation of financial statements for external purposes in accordance with generally accepted accounting principles. A company’s internal control over financial reporting includes those policies and procedures that (1) pertain to the maintenance of records that, in reasonable detail, accurately and fairly reflect the transactions and dispositions of the assets of the company; (2) provide reasonable assurance that transactions are recorded as necessary to permit preparation of financial statements in accordance with generally accepted accounting principles, and that receipts and expenditures of the company are being made only in accordance with authorizations of management and directors of the company; and (3) provide reasonable assurance regarding prevention or timely detection of unauthorized acquisition, use, or disposition of the company’s assets that could have a material effect on the financial statements.
60
16185_Ross AR14_10K_CS6-r3.indd 60 3/31/15 9:30 AM

Because of the inherent limitations of internal control over financial reporting, including the possibility of collusion or improper management override of controls, material misstatements due to error or fraud may not be prevented or detected on a timely basis. Also, projections of any evaluation of the effectiveness of the internal control over financial reporting to future periods are subject to the risk that the controls may become inadequate because of changes in conditions, or that the degree of compliance with the policies or procedures may deteriorate.
In our opinion, the consolidated financial statements referred to above present fairly, in all material respects, the financial position of Ross Stores, Inc. and subsidiaries as of January 31, 2015 and February 1, 2014, and the results of their operations and their cash flows for each of the three years in the period ended January 31, 2015, in conformity with accounting principles generally accepted in the United States of America. Also, in our opinion, the Company maintained, in all material respects, effective internal control over financial reporting as of January 31, 2015, based on the criteria established in Internal Control - Integrated Framework (2013) issued by the Committee of Sponsoring Organizations of the Treadway Commission.
/s/DELOITTE & TOUCHE LLP
San Francisco, CaliforniaMarch 31, 2015
61
16185_Ross AR14_10K_CS6-r3.indd 61 3/31/15 9:30 AM

ITEM 9. CHANGES IN AND DISAGREEMENTS WITH ACCOUNTANTS ON ACCOUNTING AND FINANCIAL DISCLOSURE
None
ITEM 9A. CONTROLS AND PROCEDURES
Disclosure Controls and Procedures
Our management, with the participation of our Chief Executive Officer and Chief Financial Officer, conducted an evaluation of the effectiveness of our “disclosure controls and procedures,” (as defined in Exchange Act Rule 13a-15(e)), as of the end of the period covered by this report. Our disclosure controls and procedures are designed to provide reasonable assurance of achieving their objectives. Based on that evaluation, our Chief Executive Officer and Chief Financial Officer concluded that our disclosure controls and procedures were effective at that reasonable assurance level as of the end of the period covered by this report.
It should be noted that any system of controls, however well designed and operated, can provide only reasonable, and not absolute, assurance that the objectives of the system will be met. In addition, the design of any control system is based in part upon certain assumptions about the likelihood of future events.
Management’s Annual Report on Internal Control Over Financial Reporting
Our management is responsible for establishing and maintaining adequate internal control over financial reporting, as defined in Exchange Act Rule 13a-15(f). Our internal control over financial reporting is designed to provide reasonable assurance regarding the reliability of financial reporting and the preparation of consolidated financial statements for external purposes in accordance with generally accepted accounting principles.
Under the supervision and with the participation of our management, including our Chief Executive Officer and Chief Financial Officer, we conducted an evaluation of the effectiveness of our internal control over financial reporting based on the framework established by the Committee of Sponsoring Organizations of the Treadway Commission (COSO) as set forth in Internal Control — Integrated Framework (2013). Based on our evaluation under the framework in Internal Control — Integrated Framework (2013), our management concluded that our internal control over financial reporting was effective as of January 31, 2015.
Our internal control over financial reporting as of January 31, 2015 has also been audited by Deloitte & Touche LLP, an independent registered public accounting firm, and their opinion as to the effectiveness of our internal control over financial reporting is stated in their report, dated March 31, 2015, which is included in Item 8 in this Annual Report on Form 10-K.
Because of its inherent limitations, internal control over financial reporting may not prevent or detect misstatements. It should be noted that any system of controls, however well designed and operated, can provide only reasonable, and not absolute, assurance that the objectives of the system will be met. In addition, the design of any control system is based in part upon certain assumptions about the likelihood of future events. Also, projections of any evaluation of effectiveness to future periods are subject to the risk that controls may become inadequate because of changes in conditions, or that the degree of compliance with the policies or procedures may deteriorate.
Quarterly Evaluation of Changes in Internal Control Over Financial Reporting
Our management, with the participation of our Chief Executive Officer and Chief Financial Officer, also conducted an evaluation of our internal control over financial reporting to determine whether any change occurred during the fourth fiscal quarter of 2014 that has materially affected, or is reasonably likely to materially affect, our internal control over financial reporting. Based on that evaluation, our management concluded that there was no such change during the fourth fiscal quarter.
62
16185_Ross AR14_10K_CS6-r3.indd 62 3/31/15 9:30 AM

ITEM 9B. OTHER INFORMATION
None
PART III
ITEM 10. DIRECTORS, EXECUTIVE OFFICERS AND CORPORATE GOVERNANCE
Information required by Item 401 of Regulation S-K is incorporated herein by reference to the sections entitled “Executive Officers of the Registrant” at the end of Part I of this report; and to the sections of the Ross Stores, Inc. Proxy Statement for the Annual Meeting of Stockholders to be held on Wednesday, May 20, 2015 (the “Proxy Statement”) entitled “Information Regarding Nominees and Incumbent Directors.” Information required by Item 405 of Regulation S-K is incorporated by reference to the Proxy Statement under the section titled “Section 16(a) Beneficial Ownership Reporting Compliance.” We have not made any material changes to the procedures by which our stockholders may recommend nominees to the Board of Directors. Information required by Item 407(d)(4) and (d)(5) of Regulation S-K is incorporated by reference to the Proxy Statement under the section entitled “Information Regarding Nominees and Incumbent Directors” under the caption “Audit Committee.”
Our Board of Directors has adopted a Code of Ethics for Senior Financial Officers that applies to the Company’s Executive Chairman; Chief Executive Officer; Chief Operating Officer; Chief Merchandising Officer; Chief Development Officer; Executive Vice President, Finance and Legal; Chief Financial Officer; Group Vice President, Controller; Group Vice President, Finance and Treasurer; Vice President, Accounting and Assistant Controller; Vice President Finance; Vice President Tax; Assistant Treasurer; Investor and Media Relations personnel; and other positions that may be designated by the Company. This Code of Ethics is posted on our corporate website (www.rossstores.com) under Corporate Governance in the Investors Section. We intend to satisfy the disclosure requirements of Item 5.05 of Form 8-K regarding any future amendments to, or waivers from, our Code of Ethics for Senior Financial Officers by posting any changed version on the same corporate website.
ITEM 11. EXECUTIVE COMPENSATION
The information required by Item 402 of Regulation S-K is incorporated herein by reference to the sections of the Proxy Statement entitled “Compensation of Directors” and “Executive Compensation” under the captions “Compensation Discussion and Analysis,” “Summary Compensation Table,” “All Other Compensation,” “Perquisites,” “Discussion of Summary Compensation,” “Grants of Plan-Based Awards During Fiscal Year,” “Outstanding Equity Awards at Fiscal Year-End,” “Option Exercises and Stock Vested,” “Non-Qualified Deferred Compensation,” and “Potential Payments Upon Termination or Change in Control.”
The information required by Items 407(e)(4) and (e)(5) of Regulation S-K are incorporated herein by reference to the sections of the Proxy Statement entitled “Compensation Committee Interlocks and Insider Participation” and “Compensation Committee Report.”
63
16185_Ross AR14_10K_CS6-r3.indd 63 3/31/15 9:30 AM
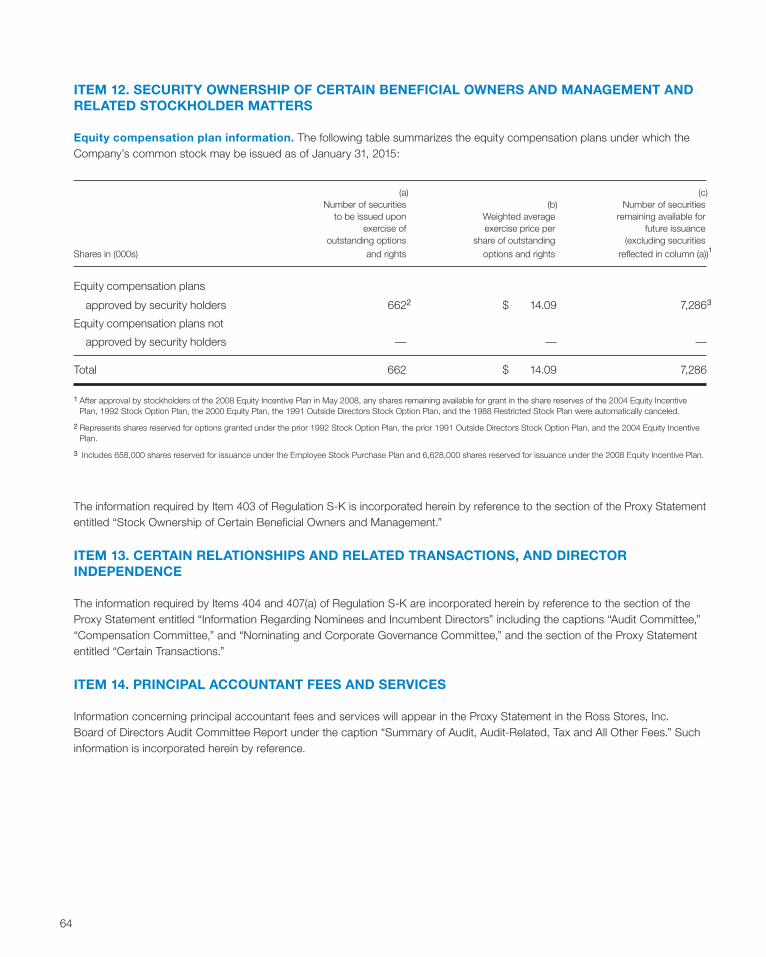
ITEM 12. SECURITY OWNERSHIP OF CERTAIN BENEFICIAL OWNERS AND MANAGEMENT AND RELATED STOCKHOLDER MATTERS
Equity compensation plan information. The following table summarizes the equity compensation plans under which the Company’s common stock may be issued as of January 31, 2015:
(a) (c) Number of securities (b) Number of securities to be issued upon Weighted average remaining available for exercise of exercise price per future issuance outstanding options share of outstanding (excluding securitiesShares in (000s) and rights options and rights reflected in column (a))1
Equity compensation plans
approved by security holders 6622 $ 14.09 7,2863
Equity compensation plans not
approved by security holders — — —
Total 662 $ 14.09 7,286
1 After approval by stockholders of the 2008 Equity Incentive Plan in May 2008, any shares remaining available for grant in the share reserves of the 2004 Equity Incentive Plan, 1992 Stock Option Plan, the 2000 Equity Plan, the 1991 Outside Directors Stock Option Plan, and the 1988 Restricted Stock Plan were automatically canceled.
2 Represents shares reserved for options granted under the prior 1992 Stock Option Plan, the prior 1991 Outside Directors Stock Option Plan, and the 2004 Equity Incentive Plan.
3 Includes 658,000 shares reserved for issuance under the Employee Stock Purchase Plan and 6,628,000 shares reserved for issuance under the 2008 Equity Incentive Plan.
The information required by Item 403 of Regulation S-K is incorporated herein by reference to the section of the Proxy Statement entitled “Stock Ownership of Certain Beneficial Owners and Management.”
ITEM 13. CERTAIN RELATIONSHIPS AND RELATED TRANSACTIONS, AND DIRECTOR INDEPENDENCE
The information required by Items 404 and 407(a) of Regulation S-K are incorporated herein by reference to the section of the Proxy Statement entitled “Information Regarding Nominees and Incumbent Directors” including the captions “Audit Committee,” “Compensation Committee,” and “Nominating and Corporate Governance Committee,” and the section of the Proxy Statement entitled “Certain Transactions.”
ITEM 14. PRINCIPAL ACCOUNTANT FEES AND SERVICES
Information concerning principal accountant fees and services will appear in the Proxy Statement in the Ross Stores, Inc. Board of Directors Audit Committee Report under the caption “Summary of Audit, Audit-Related, Tax and All Other Fees.” Such information is incorporated herein by reference.
64
16185_Ross AR14_10K_CS6-r3.indd 64 3/31/15 9:30 AM
PART IVITEM 15. EXHIBITS, FINANCIAL STATEMENT SCHEDULES
(a) The following consolidated financial statements, schedules, and exhibits are filed as part of this report or are incorporated herein as indicated:
1. List of Consolidated Financial Statements.
The following consolidated financial statements are included herein under Item 8:
Consolidated Statements of Earnings for the years ended January 31, 2015, February 1, 2014, and February 2, 2013.
Consolidated Statements of Comprehensive Income for the years ended January 31, 2015, February 1, 2014, and February 2, 2013.
Consolidated Balance Sheets at January 31, 2015 and February 1, 2014.
Consolidated Statements of Stockholders’ Equity for the years ended January 31, 2015, February 1, 2014, and February 2, 2013.
Consolidated Statements of Cash Flows for the years ended January 31, 2015, February 1, 2014, and February 2, 2013.
Notes to Consolidated Financial Statements.
Report of Independent Registered Public Accounting Firm.
2. List of Consolidated Financial Statement Schedules.
Schedules are omitted because they are not required, not applicable, or such information is included in the consolidated financial statements or notes thereto which are included in this Report.
3. List of Exhibits (in accordance with Item 601 of Regulation S-K).
Incorporated herein by reference to the list of Exhibits contained in the Exhibit Index within this Report.
65
16185_Ross AR14_10K_CS6-r3.indd 65 3/31/15 9:30 AM

SIGNATURES
Pursuant to the requirements of Section 13 or 15 (d) of the Securities Exchange Act of 1934, the Registrant has duly caused this Report to be signed on its behalf by the undersigned, thereunto duly authorized.
ROSS STORES, INC. (Registrant)
Date: March 31, 2015 By: /s/Barbara Rentler Barbara Rentler Chief Executive Officer
Pursuant to the requirements of the Securities Exchange Act of 1934, this report has been signed below by the following persons on behalf of the Registrant and in the capacities and on the dates indicated.
Signature Title Date
/s/Barbara Rentler Chief Executive Officer, Director March 31, 2015 Barbara Rentler
/s/Michael J. Hartshorn Group Senior Vice President, Chief Financial Officer, March 31, 2015 Michael J. Hartshorn and Principal Accounting Officer
/s/Michael Balmuth Executive Chairman of the Board, Director March 31, 2015 Michael Balmuth
/s/K. Gunnar Bjorklund Director March 31, 2015 K. Gunnar Bjorklund
/s/Michael J. Bush Director March 31, 2015 Michael J. Bush
/s/Norman A. Ferber Chairman Emeritus of the Board, Director March 31, 2015 Norman A. Ferber
/s/Sharon D. Garrett Director March 31, 2015 Sharon D. Garrett
/s/Stephen D. Milligan Director March 31, 2015 Stephen D. Milligan
/s/G. Orban Director March 31, 2015 George P. Orban
/s/Michael O’Sullivan President and Chief Operating Officer, Director March 31, 2015 Michael O’Sullivan
/s/Larry S. Peiros Director March 31, 2015 Lawrence S. Peiros
/s/G. L. Quesnel Director March 31, 2015 Gregory L. Quesnel
66
16185_Ross AR14_10K_CS6-r3.indd 66 3/31/15 9:30 AM

INDEX TO EXHIBITS
Exhibit Number Exhibit
3.1 Amendment of Certificate of Incorporation dated May 21, 2004 and Amendment of Certificate of Incorporation dated June 5, 2002 and Corrected First Restated Certificate of Incorporation, incorporated by reference to Exhibit 3.1 to the Form 10-Q filed by Ross Stores, Inc. for its quarter ended July 31, 2004.
3.2 Amendment of Certificate of Incorporation dated July 18, 2011, incorporated by reference to Exhibit 3.3 to the Form 10-Q filed by Ross Stores, Inc. for its quarter ended July 30, 2011.
3.3 Amended and Restated Bylaws of Ross Stores, Inc. as amended, January 23, 2013, incorporated by reference to Exhibit 3.3 to the Form 10-K filed by Ross Stores, Inc. for its fiscal year ended February 2, 2013.
4.1 Note Purchase Agreement dated October 17, 2006, incorporated by reference to Exhibit 10.2 to the Form 10-Q filed by Ross Stores, Inc. for its quarter ended October 28, 2006.
4.2 Officers’ Certificate, dated as of September 18, 2014, establishing the terms and form of the Notes, incorporated by reference to Exhibit 4.2 to the Form 8-K filed by Ross Stores, Inc. on September 18, 2014.
4.3 Form of the 3.375% Senior Notes Due 2024, included in Exhibit 4.2 and incorporated by reference to Exhibit 4.2 to the Form 8-K filed by Ross Stores, Inc. on September 18, 2014.
4.4 Indenture, dated as of September 18, 2014, between Ross Stores, Inc. and U.S. Bank National Association, incorporated by reference to Exhibit 4.1 to the Form 8-K filed by Ross Stores, Inc. on September 18, 2014.
10.1 Revolving Credit Agreement dated March 3, 2011, incorporated by reference to Exhibit 10.1 to the Form 10-Q filed by Ross Stores, Inc. for its quarter ended April 30, 2011.
10.2 Amendment No. 1 to Revolving Credit Agreement dated June 27, 2012, incorporated by reference to Exhibit 10.1 to the Form 10-Q filed by Ross Stores, Inc. for its quarter ended July 28, 2012.
10.3 Amendment No. 2 to Credit Agreement, dated August 18, 2014, incorporated by reference to Exhibit 10.3 to the Form 10-Q filed by Ross Stores, Inc. for its quarter ended August 2, 2014.
10.4 Underwriting Agreement, dated as of September 15, 2014, by and among Ross Stores, Inc., Merrill Lynch, Pierce, Fenner & Smith Incorporated, Wells Fargo Securities, LLC and J.P. Morgan Securities LLC, as representatives of the underwriters named therein, incorporated by reference to Exhibit 1.1 to the Form 8-K filed by Ross Stores, Inc. on September 18, 2014.
MANAGEMENT CONTRACTS AND COMPENSATORY PLANS (EXHIBITS 10.5 - 10.49)
10.5 Third Amended and Restated Ross Stores, Inc. 1992 Stock Option Plan, incorporated by reference to Exhibit 10.5 to the Form 10-K filed by Ross Stores, Inc. for its fiscal year ended January 29, 2000.
10.6 Amendment to Third Amended and Restated Ross Stores, Inc. 1992 Stock Option Plan, incorporated by reference to Exhibit 10.4 to the Form 10-Q filed by Ross Stores, Inc. for its quarter ended August 4, 2001.
67
16185_Ross AR14_10K_CS6-r3.indd 67 3/31/15 9:30 AM

10.7 Ross Stores, Inc. 2000 Equity Incentive Plan, incorporated by reference to Exhibit 10.7 to the Form 10-K filed by Ross Stores, Inc. for its fiscal year ended January 29, 2000.
10.8 Amended and Restated Ross Stores, Inc. Employee Stock Purchase Plan dated November 20, 2007, incorporated by reference to Exhibit 10.6 to the Form 10-K filed by Ross Stores, Inc. for its fiscal year ended February 2, 2008.
10.9 Amended and Restated Ross Stores, Inc. 1991 Outside Directors Stock Option Plan, as amended through January 30, 2003, incorporated by reference to Exhibit 10.9 to the Form 10-K filed by Ross Stores, Inc. for its fiscal year ended February 1, 2003.
10.10 Ross Stores Executive Medical Plan, incorporated by reference to Exhibit 10.9 to the Form 10-K filed by Ross Stores, Inc. for its fiscal year ended January 30, 1999.
10.11 Ross Stores Executive Dental Plan, incorporated by reference to Exhibit 10.10 to the Form 10-K filed by Ross Stores, Inc. for its fiscal year ended January 30, 1999.
10.12 Third Amended and Restated Ross Stores, Inc. Non-Qualified Deferred Compensation Plan effective December 31, 2008, incorporated by reference to Exhibit 10.7 to the Form 10-Q filed by Ross Stores, Inc. for its quarter ended April 30, 2011.
10.13 Ross Stores, Inc. Second Amended and Restated Incentive Compensation Plan, incorporated by reference to the appendix to the Definitive Proxy Statement on Schedule 14A filed by Ross Stores, Inc. on April 12, 2006.
10.14 Ross Stores, Inc. 2004 Equity Incentive Plan, incorporated by reference to Exhibit 99 to the Definitive Proxy Statement on Schedule 14A filed by Ross Stores, Inc. on April 15, 2004.
10.15 First Amendment to the Ross Stores, Inc. 2004 Equity Incentive Plan, effective May 17, 2005, incorporated by reference to Exhibit 10.2 to the Form 10-Q filed by Ross Stores, Inc. for its quarter ended July 30, 2005.
10.16 Second Amendment to the Ross Stores, Inc. 2004 Equity Incentive Plan effective March 22, 2007, incorporated by reference to Exhibit 10.7 to the Form 10-Q filed by Ross Stores, Inc. for its quarter ended May 5, 2007.
10.17 Form of Stock Option Agreement for Non-Employee Directors for options granted pursuant to Ross Stores, Inc. 2004 Equity Incentive Plan, incorporated by reference to Exhibit 10.3 to the Form 10-Q filed by Ross Stores, Inc. for its quarter ended July 30, 2005.
10.18 Ross Stores, Inc. 2008 Equity Incentive Plan, as amended through March 18, 2009, incorporated by reference to Exhibit 10.1 to the Form 10-Q filed by Ross Stores, Inc. for its quarter ended May 2, 2009.
10.19 Form of Nonemployee Director Equity Notice of Grant of Restricted Stock and Restricted Stock Agreement under the Ross Stores, Inc. 2008 Equity Incentive Plan, incorporated by reference to Exhibit 99.2 to the Form 8-K filed by Ross Stores, Inc. on May 23, 2008.
10.20 Form of Nonemployee Director Equity Notice of Grant of Restricted Stock Units and Restricted Stock Units Agreement under the Ross Stores, Inc. 2008 Equity Incentive Plan, incorporated by reference to Exhibit 99.3 to the Form 8-K filed by Ross Stores, Inc. on May 23, 2008.
68
16185_Ross AR14_10K_CS6-r3.indd 68 3/31/15 9:30 AM
10.21 Form of Notice of Grant of Restricted Stock and Restricted Stock Agreement under the Ross Stores, Inc. 2008 Equity Incentive Plan, incorporated by reference to Exhibit 99.4 to the Form 8-K filed by Ross Stores, Inc. on May 23, 2008.
10.22 Form of Notice of Grant of Restricted Stock Units and Restricted Stock Units Agreement under the Ross Stores, Inc. 2008 Equity Incentive Plan, incorporated by reference to Exhibit 99.5 to the Form 8-K filed by Ross Stores, Inc. on May 23, 2008.
10.23 Form of Notice of Grant of Stock Option and Stock Option Agreement under the Ross Stores, Inc. 2008 Equity Incentive Plan, incorporated by reference to Exhibit 99.7 to the Form 8-K filed by Ross Stores, Inc. on May 23, 2008.
10.24 Ross Stores, Inc. Restricted Stock Agreement, incorporated by reference to Exhibit 10.2 to the Form 10-Q filed by Ross Stores, Inc. for its quarter ended May 2, 2009.
10.25 Form of Restricted Stock Agreement, incorporated by reference to Exhibit 10.2 to the Form 10-Q filed by Ross Stores, Inc. for its quarter ended May 3, 2014.
10.26 Ross Stores, Inc. Restricted Stock Agreement for Nonemployee Director, incorporated by reference to Exhibit 10.3 to the Form 10-Q filed by Ross Stores, Inc. for its quarter ended May 2, 2009.
10.27 Form of Notice of Grant of Performance Shares and Performance Share Agreement under the Ross Stores, Inc. 2008 Equity Incentive Plan, incorporated by reference to Exhibit 10.2 to the Form 10-Q filed by Ross Stores, Inc. for its quarter ended July 30, 2011.
10.28 Form of Performance Shares Grant Agreement, incorporated by reference to Exhibit 10.1 to the Form 10-Q filed by Ross Stores, Inc. for its quarter ended May 3, 2014.
10.29 Form of Indemnity Agreement between Ross Stores, Inc. for Directors and Executive Officers, incorporated by reference to Exhibit 10.26 to the Form 10-K filed by Ross Stores, Inc. for its fiscal year ended February 2, 2013.
10.30 Forms of Executive Employment Agreement between Ross Stores, Inc. and Executives, incorporated by reference to Exhibit 10.1 to the Form 10-Q filed by Ross Stores, Inc. for its quarter ended May 4, 2013.
10.31 Form of Executive Employment Agreement, incorporated by reference to Exhibit 10.3 to the Form 10-Q filed by Ross Stores, Inc. for its quarter ended May 3, 2014.
10.32 Amended and Restated Independent Contractor Consultancy Agreement effective January 6, 2010 between Norman A. Ferber and Ross Stores, Inc., incorporated by reference to Exhibit 10.47 to the Form 10-K filed by Ross Stores, Inc. for its fiscal year ended January 30, 2010.
10.33 Amended Independent Contractor Consultancy Agreement effective January 30, 2012 between Norman A. Ferber and Ross Stores, Inc., incorporated by reference to Exhibit 10.52 to the Form 10-K filed by Ross Stores, Inc. for its fiscal year ended January 28, 2012.
69
16185_Ross AR14_10K_CS6-r3.indd 69 3/31/15 9:30 AM

10.34 Amended and Restated Retirement Benefit Package Agreement effective January 6, 2010 between Norman A. Ferber and Ross Stores, Inc., incorporated by reference to Exhibit 10.48 to the Form 10-Q filed by Ross Stores, Inc. for its quarter ended May 1, 2010.
10.35 Amended Retirement Benefits Package Agreement effective January 30, 2012 between Norman A. Ferber and Ross Stores, Inc., incorporated by reference to Exhibit 10.53 to the Form 10-K filed by Ross Stores, Inc. for its fiscal year ended January 28, 2012.
10.36 Employment Agreement effective May 31, 2001 between Michael Balmuth and Ross Stores, Inc., incorporated by reference to Exhibit 10.3 to the Form 10-Q filed by Ross Stores, Inc. for its quarter ended August 4, 2001.
10.37 First Amendment to the Employment Agreement effective January 30, 2003 between Michael Balmuth and Ross Stores, Inc., incorporated by reference to Exhibit 10.1 to the Form 10-Q filed by Ross Stores, Inc. for its quarter ended May 3, 2003.
10.38 Second Amendment to the Employment Agreement effective May 18, 2005 between Michael Balmuth and Ross Stores, Inc., incorporated by reference to Exhibit 10.1 to the Form 10-Q filed by Ross Stores, Inc. for its quarter ended July 30, 2005.
10.39 Restated Third Amendment to the Employment Agreement effective April 6, 2007 between Michael Balmuth and Ross Stores, Inc. incorporated by reference to Exhibit 10.42 to the Form 10-K filed by Ross Stores, Inc. for its year ended January 31, 2009.
10.40 Fourth Amendment to the Employment Agreement effective June 9, 2009 between Michael Balmuth and Ross Stores, Inc., incorporated by reference to Exhibit 10.10 to the Form 10-Q filed by Ross Stores, Inc. for its quarter ended August 1, 2009, and to Exhibit A-1 included in Exhibit 10.36 to the Form 10-Q filed by Ross Stores, Inc. for its quarter ended May 1, 2010.
10.41 Fifth Amendment to the Employment Agreement effective April 23, 2010 between Michael Balmuth and Ross Stores, Inc., incorporated by reference to Exhibit 10.2 to the Form 10-Q filed by Ross Stores, Inc. for its quarter ended May 1, 2010.
10.42 Sixth Amendment to the Employment Agreement effective June 1, 2011 between Michael Balmuth and Ross Stores, Inc., incorporated by reference to Exhibit 10.1 to the Form 10-Q filed by Ross Stores, Inc. for its quarter ended July 30, 2011.
10.43 Employment Agreement effective June 1, 2012 between Michael Balmuth and Ross Stores, Inc., incorporated by reference to Exhibit 10.1 to the Form 10-Q filed by Ross Stores, Inc. for its quarter ended October 27, 2012.
10.44 Notice of Grant of Restricted Stock Units and Restricted Stock Units Agreement pursuant to the Ross Stores, Inc. 2008 Equity Incentive Plan to Michael Balmuth on August 15, 2012, incorporated by reference to Exhibit 10.2 to the Form 10-Q filed by Ross Stores, Inc. for its quarter ended October 27, 2012.
10.45 Executive Employment Agreement effective June 1, 2014 between Barbara Rentler and Ross Stores, Inc., incorporated by reference to Exhibit 10.1 to the Form 10-Q filed by Ross Stores, Inc. for its quarter ended August 2, 2014.
10.46 Executive Employment Agreement effective June 1, 2014 between Michael O’Sullivan and Ross Stores, Inc., incorporated by reference to Exhibit 10.1 to the Form 10-Q filed by Ross Stores, Inc. for its quarter ended August 2, 2014.
70
16185_Ross AR14_10K_CS6-r3.indd 70 3/31/15 9:30 AM

10.47 Executive Employment Agreement effective March 16, 2013 between James Fassio and Ross Stores, Inc., incorporated by reference to Exhibit 10.2 to the Form 10-Q filed by Ross Stores, Inc. for its quarter ended May 4, 2013.
10.48 Executive Employment Agreement effective February 2, 2014 between Michael J. Hartshorn and Ross Stores, Inc., incorporated by reference to Exhibit 10.5 to the Form 10-Q filed by Ross Stores, Inc. for its quarter ended May 3, 2014.
10.49 Executive Employment Agreement effective March 16, 2013 between Douglas Baker and Ross Stores, Inc.
21 Subsidiaries.
23 Consent of Independent Registered Public Accounting Firm.
31.1 Certification of Chief Executive Officer Pursuant to Sarbanes-Oxley Act Section 302(a).
31.2 Certification of Chief Financial Officer Pursuant to Sarbanes-Oxley Act Section 302(a).
32.1 Certification of Chief Executive Officer Pursuant to 18 U.S.C. Section 1350.
32.2 Certification of Chief Financial Officer Pursuant to 18 U.S.C. Section 1350.
101.INS XBRL Instance Document
101.SCH XBRL Taxonomy Extension Schema
101.CAL XBRL Taxonomy Extension Calculation Linkbase
101.DEF XBRL Taxonomy Extension Definition Linkbase
101.LAB XBRL Taxonomy Extension Label Linkbase
101.PRE XBRL Taxonomy Extension Presentation Linkbase
71
16185_Ross AR14_10K_CS6-r3.indd 71 3/31/15 9:30 AM

EXHIBIT 21
SUBSIDIARIES & AFFILIATES
Certain subsidiaries and affiliates of the Registrant and their subsidiaries are listed below. The names of certain subsidiaries, which considered in the aggregate would not constitute a significant subsidiary, have been omitted.
Subsidiary Name Domiciled Date of Incorporation
Ross Procurement, Inc. Delaware November 22, 2004Ross Merchandising, Inc. Delaware January 12, 2004Ross Dress for Less, Inc. Virginia January 14, 2004Retail Assurance Group, Inc. Hawaii October 15, 1991
EXHIBIT 23
CONSENT OF INDEPENDENT REGISTERED PUBLIC ACCOUNTING FIRM
We consent to the incorporation by reference in Registration Statements No. 33-61373, No. 333-06119, No. 333-34988, No. 333-51478, No. 333-56831, No. 333-115836, and No. 333-151116 on Form S-8, and No. 333-198738 on Form S-3 of our report dated March 31, 2015, relating to the consolidated financial statements of Ross Stores, Inc. and subsidiaries (the “Company”), and the effectiveness of the Company’s internal control over financial reporting, appearing in this Annual Report on Form 10-K of the Company for the year ended January 31, 2015.
/s/DELOITTE & TOUCHE LLP
San Francisco, California March 31, 2015
72
16185_Ross AR14_10K_CS6-r3.indd 72 3/31/15 9:30 AM

EXHIBIT 31.1
Ross Stores, Inc. Certification of Chief Executive Officer Pursuant to Sarbanes-Oxley Act Section 302(a)
I, Barbara Rentler, certify that:
1. I have reviewed this annual report on Form 10-K of Ross Stores, Inc.;
2. Based on my knowledge, this report does not contain any untrue statement of a material fact or omit to state a material fact necessary to make the statements made, in light of the circumstances under which such statements were made, not misleading with respect to the period covered by this report;
3. Based on my knowledge, the financial statements, and other financial information included in this report, fairly present in all material respects the financial condition, results of operations and cash flows of the registrant as of, and for, the periods presented in this report;
4. The registrant’s other certifying officer(s) and I are responsible for establishing and maintaining disclosure controls and procedures (as defined in Exchange Act Rules 13a-15(e) and 15d-15(e)) and internal control over financial reporting (as defined in Exchange Act Rules 13a-15(f) and 15d-15(f)) for the registrant and have:
(a) Designed such disclosure controls and procedures, or caused such disclosure controls and procedures to be designed under our supervision, to ensure that material information relating to the registrant, including its consolidated subsidiaries, is made known to us by others within those entities, particularly during the period in which this report is being prepared;
(b) Designed such internal control over financial reporting, or caused such internal control over financial reporting to be designed under our supervision, to provide reasonable assurance regarding the reliability of financial reporting and the preparation of financial statements for external purposes in accordance with generally accepted accounting principles;
(c) Evaluated the effectiveness of the registrant’s disclosure controls and procedures and presented in this report our conclusions about the effectiveness of the disclosure controls and procedures, as of the end of the period covered by this report based on such evaluation; and
(d) Disclosed in this report any change in the registrant’s internal control over financial reporting that occurred during the registrant’s most recent fiscal quarter (the registrant’s fourth fiscal quarter in the case of an annual report) that has materially affected, or is reasonably likely to materially affect, the registrant’s internal control over financial reporting; and
5. The registrant’s other certifying officer(s) and I have disclosed, based on our most recent evaluation of internal control over financial reporting, to the registrant’s auditors and the audit committee of the registrant’s board of directors (or persons performing the equivalent functions):
(a) All significant deficiencies and material weaknesses in the design or operation of internal control over financial reporting which are reasonably likely to adversely affect the registrant’s ability to record, process, summarize and report financial information; and
(b) Any fraud, whether or not material, that involves management or other employees who have a significant role in the registrant’s internal control over financial reporting.
Date: March 31, 2015 /s/Barbara Rentler
Barbara Rentler
Chief Executive Officer
73
16185_Ross AR14_10K_CS6-r3.indd 73 3/31/15 9:30 AM

EXHIBIT 31.2
Ross Stores, Inc. Certification of Chief Financial Officer Pursuant to Sarbanes-Oxley Act Section 302(a)
I, Michael J. Hartshorn, certify that:
1. I have reviewed this annual report on Form 10-K of Ross Stores, Inc.;
2. Based on my knowledge, this report does not contain any untrue statement of a material fact or omit to state a material fact necessary to make the statements made, in light of the circumstances under which such statements were made, not misleading with respect to the period covered by this report;
3. Based on my knowledge, the financial statements, and other financial information included in this report, fairly present in all material respects the financial condition, results of operations and cash flows of the registrant as of, and for, the periods presented in this report;
4. The registrant’s other certifying officer(s) and I are responsible for establishing and maintaining disclosure controls and procedures (as defined in Exchange Act Rules 13a-15(e) and 15d-15(e)) and internal control over financial reporting (as defined in Exchange Act Rules 13a-15(f) and 15d-15(f)) for the registrant and have:
(a) Designed such disclosure controls and procedures, or caused such disclosure controls and procedures to be designed under our supervision, to ensure that material information relating to the registrant, including its consolidated subsidiaries, is made known to us by others within those entities, particularly during the period in which this report is being prepared;
(b) Designed such internal control over financial reporting, or caused such internal control over financial reporting to be designed under our supervision, to provide reasonable assurance regarding the reliability of financial reporting and the preparation of financial statements for external purposes in accordance with generally accepted accounting principles;
(c) Evaluated the effectiveness of the registrant’s disclosure controls and procedures and presented in this report our conclusions about the effectiveness of the disclosure controls and procedures, as of the end of the period covered by this report based on such evaluation; and
(d) Disclosed in this report any change in the registrant’s internal control over financial reporting that occurred during the registrant’s most recent fiscal quarter (the registrant’s fourth fiscal quarter in the case of an annual report) that has materially affected, or is reasonably likely to materially affect, the registrant’s internal control over financial reporting; and
5. The registrant’s other certifying officer(s) and I have disclosed, based on our most recent evaluation of internal control over financial reporting, to the registrant’s auditors and the audit committee of the registrant’s board of directors (or persons performing the equivalent functions):
(a) All significant deficiencies and material weaknesses in the design or operation of internal control over financial reporting which are reasonably likely to adversely affect the registrant’s ability to record, process, summarize and report financial information; and
(b) Any fraud, whether or not material, that involves management or other employees who have a significant role in the registrant’s internal control over financial reporting.
Date: March 31, 2015 /s/Michael J. Hartshorn
Michael J. Hartshorn
Group Senior Vice President, Chief Financial Officer,
and Principal Accounting Officer
74
16185_Ross AR14_10K_CS6-r4.indd 74 3/31/15 4:22 PM

EXHIBIT 32.1
Certification of Chief Executive Officer Pursuant to 18 U.S.C. Section 1350, As Adopted Pursuant to Section 906 of the Sarbanes-Oxley Act of 2002
In connection with the Annual Report of Ross Stores, Inc. (the “Company”) on Form 10-K for the year ended January 31, 2015 as filed with the Securities and Exchange Commission on the date hereof (the “Report”), I, Barbara Rentler, as Chief Executive Officer of the Company, hereby certify, pursuant to 18 U.S.C. Section 1350, as adopted pursuant to Section 906 of the Sarbanes-Oxley Act of 2002 (“Section 906”), that, to the best of my knowledge:
(1) The Report fully complies with the requirements of Section 13(a) of the Securities Exchange Act of 1934 (15 U.S.C. 78m); and
(2) The information contained in the Report fairly presents, in all material respects, the financial condition and results of operations of the Company.
Date: March 31, 2015 /s/Barbara Rentler
Barbara Rentler
Chief Executive Officer
EXHIBIT 32.2
Certification of Chief Financial Officer Pursuant to 18 U.S.C. Section 1350, As Adopted Pursuant to Section 906 of the Sarbanes-Oxley Act of 2002
In connection with the Annual Report of Ross Stores, Inc. (the “Company”) on Form 10-K for the year ended January 31, 2015 as filed with the Securities and Exchange Commission on the date hereof (the “Report”), I, Michael J. Hartshorn, as Chief Financial Officer of the Company, hereby certify, pursuant to 18 U.S.C. Section 1350, as adopted pursuant to Section 906 of the Sarbanes-Oxley Act of 2002 (“Section 906”), that, to the best of my knowledge:
(1) The Report fully complies with the requirements of Section 13(a) of the Securities Exchange Act of 1934 (15 U.S.C. 78m); and
(2) The information contained in the Report fairly presents, in all material respects, the financial condition and results of operations of the Company.
Date: March 31, 2015 /s/Michael J. Hartshorn
Michael J. Hartshorn
Group Senior Vice President, Chief Financial Officer,
and Principal Accounting Officer
75
16185_Ross AR14_10K_CS6-r4.indd 75 3/31/15 4:23 PM

76
Board of Directors
Norman A. Ferber
Chairman Emeritus
Ross Stores, Inc.
Michael Balmuth
Executive Chairman of the Board
Ross Stores, Inc.
K. Gunnar Bjorklund 2, 3
Managing Director,
Sverica International
Michael J. Bush 1, 3
Former President and
Chief Executive Officer,
NTN Buzztime;
Managing Member,
B IV Investments, LLC
Sharon D. Garrett 1, 3
Management Consultant;
Board Member,
Scott’s Liquid Gold-Inc.
Stephen D. Milligan
President and
Chief Executive Officer,
Western Digital Corporation
Michael O’Sullivan
President and
Chief Operating Officer,
Ross Stores, Inc.
George P. Orban 2, 3, 4
Managing Partner,
Orban Partners
1 Audit Committee2 Compensation Committee3 Nominating & Corporate Governance Committee4 Lead Independent Director
Lawrence S. Peiros 2, 3
Former Chief Operating Officer,
The Clorox Company;
Board Member,
Potlatch Corporation
Gregory L. Quesnel 1, 3
Former Chief Executive Officer,
CNF, Inc.;
Board Member,
Potlatch Corporation
Barbara Rentler
Chief Executive Officer,
Ross Stores, Inc.
Corporate Officers
Michael Balmuth
Executive Chairman of the Board
Barbara Rentler
Chief Executive Officer
James S. Fassio
President and
Chief Development Officer
Michael O’Sullivan
President and
Chief Operating Officer
Lisa Panattoni
President, Merchandising,
Ross Dress for Less
Bernie Brautigan
Group Executive Vice President
Merchandising,
Ross Dress For Less
John G. Call
Executive Vice President
Finance and Legal, and
Corporate Secretary
Michael J. Hartshorn
Group Senior Vice President
Chief Financial Officer
Directors and Officers
16185_Ross AR14_10K_CS6-r3.indd 76 3/31/15 9:30 AM

Bargains You Can Count On Since 1982, our customers have counted on us for great bargains. More than 30 years
later, our main focus remains unchanged – to deliver the best name brand fashions at
incredible values. We accomplish this through our two off-price apparel and home fashion
chains, Ross Dress for Less® (“Ross”) and dd’s DISCOUNTS®. Ross Dress for Less is the
largest off-price apparel and home fashion chain in the U.S. with over 1,200 stores in 33
states, the District of Columbia and Guam, while dd’s DISCOUNTS operates over 150
stores in 15 states. Ross offers name brand designer apparel, accessories, footwear and
home fashions for the entire family at savings of 20% to 60% off department store and
specialty store regular prices every day. dd’s DISCOUNTS features a more moderately-priced
assortment at savings of 20% to 70% off moderate department and discount store prices
every day. We plan to maximize the significant opportunities we have for profitable growth
in the years ahead by continuing to deliver the values our customers have come to expect.
Corporate Data
Corporate HeadquartersRoss Stores, Inc.
5130 Hacienda Drive
Dublin, California 94568-7579
(925) 965-4400
Corporate Websitewww.rossstores.com
New York Buying OfficeRoss Stores, Inc.
1372 Broadway, 2nd Floor
New York, New York 10018-6141
Los Angeles Buying OfficeRoss Stores, Inc.
110 East 9th Street, Suite A-979
Los Angeles, California 90079-1979
Annual Report (Form 10-K)A copy of the Company’s 2014 Annual
Report on Form 10-K as filed with the
Securities and Exchange Commission is
available from our corporate website, or
without charge, by contacting the following:
Investor Relations Department
Ross Stores, Inc
5130 Hacienda Drive
Dublin, California 94568-7579
Transfer Agent and RegistrarComputershare
P. O. Box 30170
College Station, Texas 77842
or
Overnight Correspondence
211 Quality Circle, Suite 210
College Station, Texas 77845
Inquiries by:
Websitewww.computershare.com/investor
or
Onlinehttps://www-us.computershare.com/investor/Contact
Telephone1-866-455-3120 (domestic holders)1-800-231-5469 (TDD#)1-201-680-6578 (foreign holders)1-201-680-6610 (foreign TDD#)
16185_Ross AR14_COVER_CS6-r3.indd 2 3/31/15 12:50 PM

Bargains
Ross Stores, Inc. 2014 Annual Report
Ross Stores, Inc.
5130 Hacienda Drive
Dublin, CA 94568-7579
(925) 965-4400
www.rossstores.com
To minimize our environmental impact, the Ross Stores 2014 Annual Report
was printed on papers containing fibers from environmentally appropriate,
socially beneficial and economically viable forest resources.
Sustainable Choice. Reduce, Reuse & Recycle.
Ro
ss
Sto
res
, Inc
. 20
14
An
nu
al R
ep
ort
16185_Ross AR14_COVER_CS6-r4.indd 1 3/31/15 4:04 PM