barkerville gold mines ltd. - british columbia
TRANSCRIPT
M09967A03
June 2015
Barkerville Gold Mines Ltd. Goldstream Tailings Storage Facility
Background Report for Response
to MEM Memorandum

150630R-Goldstream MEM Background Report M09967A03.730
Klohn Crippen Berger Ltd. • 500 - 2955 Virtual Way • Vancouver BC V5M 4X6 • CANADA 604.669.3800 t • 604.669.3835 f • www.klohn.com
June 30, 2015
Barkerville Gold Mines Ltd. 11th Floor, 1111 Melville Street Vancouver, British Columbia V6E 3V6 Kevin McMurren Mine Manager Dear Mr. McMurren: Goldstream Tailings Storage Facility Background Report for Response to MEM Memorandum We are pleased to enclose one (1) electronic copy of the Background Report for Response to MEM Memorandum for the Goldstream Tailings Storage Facility. This report provides our analysis in response to the MEM memorandum issued on February 3rd, 2015. Should you have any questions regarding the enclosed information, please feel free to contact me. Yours truly,
KLOHN CRIPPEN BERGER LTD. Robert Cross, M.Eng., P.Eng. Project Manager and Geotechnical Engineer RAC/JC/eeb
Cover
M09967A03 June 2015
Barkerville Gold Mines Ltd. Goldstream Tailings Storage Facility
Background Report for Response
to MEM Memorandum

Barkerville Gold Mines Ltd. Goldstream Tailings Storage Facility
Background Report for MEM Response Letter
150630R-Goldstream MEM Background Report
Page i M09967A03.730 June 2015
CLARIFICATIONS
This report is an instrument of service of Klohn Crippen Berger Ltd. The report has been prepared for the exclusive use of Barkerville Gold Mines Limited (Client) for the specific application to the Goldstream Tailings Storage Facility. The report's contents may not be relied upon by any other party without the express written permission of Klohn Crippen Berger. The review is based on available design and as-constructed documentation. In this report, Klohn Crippen Berger has endeavoured to comply with generally-accepted professional practice common to the local area. Klohn Crippen Berger makes no warranty, express or implied.

Barkerville Gold Mines Ltd. Goldstream Tailings Storage Facility
Background Report for MEM Response Letter
150630R-Goldstream MEM Background Report
Page ii M09967A03.730 June 2015
Table of Contents CLARIFICATIONS ......................................................................................................................... I
1 INTRODUCTION ..................................................................................................................... 1 1.1 Assessment Scope ........................................................................................................................... 1
2 OVERVIEW OF THE GOLDSTREAM TAILINGS STORAGE FACILITY ............................................... 2
3 ITEM 1: UNDRAINED SHEAR FAILURE OF SILT AND CLAY FOUNDATIONS................................... 4
4 ITEM 2: WATER BALANCE ADEQUACY .................................................................................... 10
5 ITEM 3: FILTER ADEQUACY ................................................................................................... 14
6 SUMMARY OF GAPS AND SCHEDULE TO ADDRESS .................................................................. 19
7 CLOSING .............................................................................................................................. 20
Appendices Appendix I MEM Memorandum to Barkerville Gold Mines Ltd.
Appendix II Summary of Relevant Reports
Appendix III Historic SSI Data
Appendix IV 2014 Piezometer Readings
Appendix V 2014 Site Photographs
Appendix VI 1984 Construction Records for Blanket Filter

Barkerville Gold Mines Ltd. Goldstream Tailings Storage Facility
Background Report for MEM Response Letter
150630R-Goldstream MEM Background Report
Page 1 M09967A03.730 June 2015
1 INTRODUCTION
The Independent Expert Panel1 (Panel) appointed by Ministry of Energy and Mines, British Columbia (MEM) released their report on the Mount Polley tailings dam failure on January 30th, 2015. Subsequent to the release of the Expert Panel report, MEM issued a memorandum on February 3rd, 2015 (MEM memorandum) to all tailings dam owners in British Columbia to undertake a specific risk assessment of their tailing dams and report the results to MEM by June 30th, 2015. A copy of the MEM memorandum is included as Appendix I.
This report outlines KCB’s assessment of conditions at the two dams forming the Goldstream Tailings Storage Facility relative to the specific aspects raised by the MEM memorandum, based on a review of available documents to prepare a “summary of knowledge”. This assessment has been sealed by a qualified professional engineer and complies with generally-accepted professional practice common to the local area.
The report format is based on the MEM wording and numbering system, as requested by MEM. In Sections 3 to 5 MEM items are shown in blue italicized text; KCB’s response is shown in normal black text.
We consider this assessment to represent the available knowledge of the facility at the time of writing. Operating, inactive and closed facilities are subject to physical and geochemical changes over time, including ongoing construction activities. It is essential that monitoring and assessment of the facilities continue through regular surveillance, dam safety inspections, dam safety reviews and other stewardship activities.
1.1 Assessment Scope
The MEM memorandum asked that an assessment be undertaken to evaluate whether the dams may be at risk due to the following three conditions:
1. undrained shear failure of silt and clay foundation;
2. water balance adequacy; and
3. filter adequacy
KCB reviewed available historical information on foundation characterization, design, construction, and operations records for the Goldstream Tailings Storage Facility (TSF) dams to prepare responses for sub-items listed in the MEM memorandum. A register of the documents reviewed is included in Appendix II. The responses for the above three items are provided in Sections 3 to 5, respectively, following the numbering system used in the MEM memorandum.
1 Independent Expert Engineering Investigation and Review Panel, 2015. Report on Mount Polley Tailings Storage Facility Breach. January 30, 2015.

Barkerville Gold Mines Ltd. Goldstream Tailings Storage Facility
Background Report for MEM Response Letter
150630R-Goldstream MEM Background Report
Page 2 M09967A03.730 June 2015
2 OVERVIEW OF THE GOLDSTREAM TAILINGS STORAGE FACILITY
The Goldstream Mine site is located approximately 70 km north-northwest of Revelstoke, BC. The mine is located on the South (left) bank of the Goldstream River. The mine area is bisected by Brewster Creek, a relatively large tributary of the Goldstream River. Virginia Creek is located at the west limit of the TSF area. There are other minor creeks across the mine and TSF area. The east limit of the TSF is located approximately 0.3 km west of Brewster Creek.
The TSF is located on a terrace above the Goldstream River between approximately El. 670 m and El. 690 m. The surrounding topography in the vicinity of the site rises steeply to peaks of about El. 2,200 m. The area surrounding the TSF is forested and has an annual precipitation of approximately 1,100 mm (KCB, 2009).
The Goldstream Mine operated between 1983 and 1996. Mining operations started with a small open pit. Some underground mining was undertaken between 1991 and 1996. The Goldstream mine ceased operations in January 1996 and has been under care and maintenance ever since.
Regional bedrock geology (GSC, 1971) near the site consists of Lower Paleozoic Lardeau Group bedrock, namely crystalline schists and gneisses, with Paleozoic biotite quartz monzonite located uphill of the site.
The surficial geology (GSC, 1984) of the terrace on which the site is located is described as a relatively thick (up to 18 m) morainal deposit, consisting generally of sandy, silty, and gravelly materials, with small areas of glaciofluvial sand and gravel. In some limited areas, the moraine is thinner, acting more as a blanket (2 m to 5 m thick till units) overlying bedrock. The Goldstream River valley is characterized as alluvial overbank and deltaic deposit material, consisting of sand, gravel, and minor silt, with some limited organics present. Outside of the terrace, exposed bedrock is present at surface. Surficial geology of the area is shown on Figure 1.
This surficial geology description is further confirmed by additional mapping (GSC, 1986) which designates the surficial materials at site as loamy till described as sandy and silty, compact and massive, with localized lenses of stratified sediments. Thicknesses of till are noted as typically between 2 m and 5 m. The valley is again described as channel materials, consisting of sand and gravel deposits with minor finer grained overbank material.
The TSF is impounded by two compacted earthfill dams, the West Dam and the North Dam. In addition to the two earthfill embankment structures, notable features at the TSF include an Emergency Spillway (now the operating spillway) and a series of diversion ditches which divert runoff from upslope catchments away from the TSF. The two dams also have seepage collection ditches (Main Drainage Ditch) for each dam. A general arrangement of the TSF site is presented in Figure 2.
The West Dam and the North Dam consist of an upstream zone of low permeability glacial till, with a silty sand downstream shell. The two fill zones in each dam are separated by a sand filter drain which drains into a foundation filter extending to the downstream toe of each dam. The North Dam contains a thin upstream zone of silty sand and gravel designated as erosion protection (which is not shown as present on the West Dam). The West Dam is located in the Virginia Creek valley, a tributary

Barkerville Gold Mines Ltd. Goldstream Tailings Storage Facility
Background Report for MEM Response Letter
150630R-Goldstream MEM Background Report
Page 3 M09967A03.730 June 2015
to the Goldstream River. The West and North Dams were initially constructed to El. 690.0 m in 1982. The dam crests were subsequently raised in 1993 from El. 690.0 m to El. 691.5 m by steepening of the upper slopes of the original embankment. Based upon the available records, the North Dam is founded on a dense glacial till, while the West Dam is founded primarily on silty sand and gravel deposits (KL, 1982a).
In 2004 (KC, 2004) Klohn Crippen assessed the failure consequence of the dams as High according to the CDA Guidelines (CDA, 1999). This Classification was based on the environmental impact of release of potentially acid generating tailings and the clean-up costs in the Goldstream River floodplain. There is also some undefined potential for loss of life due to the proximity of an RV Park on Revelstoke Lake just downstream of the outlet of Goldstream River into the lake. In 2004 the RV park was the site of some permanent residences (KC, 2004). A dam breach and inundation study is currently being carried out to verify the potential for loss of life.

Barkerville Gold Mines Ltd. Goldstream Tailings Storage Facility
Background Report for MEM Response Letter
150630R-Goldstream MEM Background Report
Page 4 M09967A03.730 June 2015
3 ITEM 1: UNDRAINED SHEAR FAILURE OF SILT AND CLAY FOUNDATIONS
In the Mount Polley TSF area the surficial geology is dominated by glacially deposited quaternary deposits overlying bedrock. The Panel concluded that a glacio-lacustrine unit (GLU) interlayered between glacial till units that are present at relatively shallow depths (6 m to 8 m) in the breach area was not identified during the site characterization and was, therefore, unaccounted for in the design. The site investigation and laboratory testing completed by the Panel on this unit indicated that this GLU unit is a varved silt and clay. At higher dam loads the unit behaved as a normally consolidated soil, and the available undrained shear strength of the unit was exceeded by the shear stress exerted by the dam load.
a. Including a determination with respect to whether or not similar foundation conditions exist below the dams on your site.
The geomorphology of the Goldstream Mine site consists of a terrace of glacial moraine materials directly overlying bedrock. A regional surficial geology map of the Goldstream Mine TSF area is shown on Figure 1.
The subsurface foundation investigations indicate the depth to bedrock at the location of the Goldstream Mine TSF ranges from approximately 5 m to over 17 m, with an average depth of approximately 11 m (KL, 1982b). The relative density of the foundation units above bedrock was assessed by means of Standard Penetration Testing (SPT). Based upon the published geological information together with the site investigation data, the overburden stratigraphy was primarily divided into three units for foundation characterization purposes (KL, 1982b):
1. Near to surface, prior to construction, a surface swamp deposit consisting of a dark brown peat layer was present, with a thickness of approximately 2 m at the West Dam and up to 11 m at the North Dam. This unit was removed prior to construction of the dams (KL, 1984).
2. A silty sand and gravel deposit, consisting of fluvial river and colluvial slide materials is present below the surface swamp deposit, or is at surface in areas where the swamp deposit was not observed. The West Dam is primarily founded on this unit. The unit is medium dense, well graded, angular to sub-rounded, with occasional to some cobbles and boulders. Loose silty fine sand was observed in localized pockets within this deposit, and the dam alignment was adjusted in order to minimize the occurrence of these localized pockets in the dam foundations. Construction records suggest that some loose sand was encountered under the footprint of the new alignment of the West Dam, inferred as a buried channel deposit. This material was excavated or compacted during construction (KL, 1984).
3. A medium dense to dense, blue-grey glacial till unit is present below the silty sand and gravel deposit. This unit consists of a low plasticity silt-sand-gravel mixture with occasional to some cobbles and boulders. This till material forms the foundation for the North Dam (KL, 1982b).

Barkerville Gold Mines Ltd. Goldstream Tailings Storage Facility
Background Report for MEM Response Letter
150630R-Goldstream MEM Background Report
Page 5 M09967A03.730 June 2015
Figure 3 shows the location of the identified drill holes (thirty in total) and test pits conducted at the site. Fifteen of the thirty drill holes were terminated in bedrock and the remaining drill holes were terminated in the glacial till unit. The test pits were excavated to shallow depths with most test pits reaching sand and gravel, inferred as till, or fluvial and colluvial material. Two idealized geologic cross-sections from the 1982 design report (KL, 1982b) are shown on Figure 4.
A review of the drill hole and test pit logs indicated that the foundation predominantly consists of sandy and gravelly deposits. Clay, where present, forms a component of the till. This characterization is consistent with the reviewed surficial geology maps, prepared by the Geological Survey of Canada (GSC 1971, GSC 1984, GSC 1986). Select historic site investigation data is presented in Appendix III.
In conclusion, the geological units present beneath the dams suggest similar foundations to those encountered during the Mount Polley investigations are unlikely to be present beneath the site for the following reasons:
The regional geology maps for the area do not indicate that glaciolacustrine units are present at the Site. Soil units at the site are believed to comprise till deposits and glaciofluvial deposits overlain by fluvial and colluvial deposits.
Three Atterberg limit tests were conducted on till samples at the site, of which two were from under or near the West Dam. Both samples from near the West Dam were taken from just above the bedrock (DH-3001 and DH-3009) and indicate the sample contains low plasticity clay (KL, 1982b). Likewise, the third Atterberg limit test, conducted on a sample from the east end of the TSF, indicates the sample contains low plasticity silt. At the Mount Polley Site, the GLU consisted of “thinly laminated or varved silts and clays, and both classify predominantly as low- to high-plasticity clay (CL to CH)”. The absence of high plasticity clay suggests that GLU is unlikely to be present at the Goldstream TSF.
Construction records indicate that sand and gravel deposits form the main foundation soil for the West Dam foundation (KL, 1982b). Site investigation conducted at the West Dam indicates that this sand and gravel deposit, inferred as Alluvium and Colluvium, overlie glacial till which directly overlies bedrock.
Construction records also indicate that the North Dam is founded on glacial till (KL, 1982b). The available site investigation at the north dam and characterization of the sub-surface geology (KL, 1982b) suggests that the North Dam is underlain by glacial till, directly overlying bedrock.
Two drill holes (DH-1022 and DH-1027) within the reviewed site investigation data make reference to a laminated or varved structure. In DH-1022, a “varved” structure is noted within the Till (Silt) unit at approximately 17 m depth. In DH-1027, “silt lumps laminated light and darker layers” are noted within a Sand and Silt unit at approximately 9 m depth. These drill holes are believed to contain basal clayey till and till with silt to clayey components rather than glaciolacustrine clays because of the following:
DH-1022 is located at the west end of the TSF, while DH-1027 is located at the east end of the TSF, approximately 1 km from DH-1022. Adjacent drill holes do not indicate the

Barkerville Gold Mines Ltd. Goldstream Tailings Storage Facility
Background Report for MEM Response Letter
150630R-Goldstream MEM Background Report
Page 6 M09967A03.730 June 2015
presence of glaciolacustrine deposits. While glaciolacustrine units can be deposited within till units as a result of the formation of glacial dams or resulting from isostatically down-warped segments (GSC, 1986), these laminated silt sand clays would likely be more prevalent throughout the site and would be noted in other drill holes.
Standard penetration tests (SPTs) conducted in the noted unit indicate that the soil is very dense; i.e. similar to the rest of the Till unit
The Atterberg Limit testing conducted was on two glacial till samples less than 100 m from DH-1022 and at a comparable depth to the unit noted above. The testing indicates that the clays present are low plasticity. Likewise, Atterberg testing conducted on a till sample from DH-3013, located approximately 30 m from DH-1027 and at a comparable depth, indicates the sample is low plasticity silt.
The available information from the site investigations (primarily drillholes and test pits) indicate the majority of the foundations are predominantly sand and gravel with little clay and silt and are, therefore, not similar to the problematic soils at Mount Polley.
Given the above, on the basis of available information from both the published geological information and the site investigation information, there is minor evidence of the localised presence of problematic soils similar to those encountered at Mount Polley within the dam foundations.
b. Whether or not sufficient site investigation (drill holes, etc.) has been completed to have confidence in this determination.
Three major site investigations were conducted for the Goldstream TSF, comprising the 1977 site investigation by KL, the 1980 site investigation by KL, and the 1981 site investigation by KL. The 1977 site investigation was conducted with the purpose of siting the dam alignments and confirming borrow materials. The 1980 site investigation found the presence of pockets of loose silty sand, which could be susceptible to liquefaction under seismic conditions. In 1981, 23 drill holes were advanced to delineate the extent of this loose silty sand. Holes were drilled near known locations of loose sand and extended outward, as required, to define their extent. The drilling showed that the loose sand layers occurred as localized deposits. The dam alignments were revised and additional holes were drilled under the revised dam alignment to confirm the foundation conditions and the absence of loose sand deposits. Investigation was also undertaken at this time to confirm available borrow materials, and foundation conditions underlying the new dam alignments (KL, 1982b).
These site investigations consisted of the following, in the vicinity of the West Dam and the North Dam:
14 drill holes and 10 test pits advanced at or near the West Dam footprint;
1 drill hole and 10 test pits advanced at or near the North Dam footprint;
Atterberg Limit testing of two samples of till obtained from the footprint of the West Dam;
Hydraulic conductivity testing conducted on select drill holes within the footprints of both dams;

Barkerville Gold Mines Ltd. Goldstream Tailings Storage Facility
Background Report for MEM Response Letter
150630R-Goldstream MEM Background Report
Page 7 M09967A03.730 June 2015
Standard Penetration Testing (SPT) in all drill holes except one; and
Sampling and laboratory grain size and proctor compaction testing of select samples.
As noted in (a) above, two drill holes (DH-1022 and DH-1027) within the reviewed site investigations make reference to a laminated or varved structure. However, given the available information previously described above, the material in these two drill holes is believed to be a till with a clayey fraction which is limited in lateral extent, rather than a glaciolacustrine unit.
According to the U.S. Bureau of Reclamation “the number of drill holes required for foundation exploration of small dams should be determined by the complexity of geologic conditions, but the depth of the drill holes should be greater than the height of the dam.” (USBR, 1987). Although the drill holes advanced at site are generally equal to, or slightly less than, the current dam heights, most of the drill holes were advanced through the overburden and terminated within the bedrock, suggesting that drilling was conducted to an appropriate depth for this tailings facility.
Given the site investigation conducted to date, drilling coverage at the West Dam is also believed to be adequate for sufficient confidence in the conclusions presented above. There is sufficient foundation characterization data to have confidence in the determination that glaciolacustrine deposits are unlikely to be present at the West Dam.
One drill hole was advanced at the North Dam, DH1024 (see Appendix III for log). This was advanced to a depth of 19 m and encountered 3 m - 4 m of Peat, underlain by 1 m - 2 m of Sand and Gravel, which was underlain by Till (initially sandy but becoming more silty with depth). The drillhole did not encounter bedrock. Nine of the 10 test pits advanced at the North Dam appear to be terminated in till, based on the geologic unit noted in the test pit log where available, or based on the soil description where a geologic unit is not noted. No glaciolacustrine material was logged in either the drillhole or the test pits. While the geological factors described under (a) above would suggest the presence of glaciolacustrine deposits within the foundation of the North Dam is unlikely, there was only one location where the foundations were investigated to a significant depth and this did not penetrate the complete depth of the till unit. On this basis the amount of site investigation conducted is insufficient to confirm the interpreted geological conditions beneath the North Dam.
c. If present, whether or not the dam design properly accounts for these materials.
Typical dam sections are presented in Figure 5. The structures typically comprised a glacial till low permeability zone with a downstream shell of silty sand and gravel (bulk fill). Filter protection is provided by a foundation blanket below the bulk fill zone and a chimney filter between the glacial till and the bulk fill.
The foundation review for the West Dam did not find a continuous glaciolacustrine clay layer. There were, however, a few locations within the glacial till unit where finer soils were present, presumably as localized pockets, and as indicated in DH-1022 and DH-1027. Such soils could be problematic to dam stability if they are both sufficiently extensive and continuous within the dam foundations and have sufficiently low strengths under the current loading conditions at the dams. These are not believed to be problematic because of the following:

Barkerville Gold Mines Ltd. Goldstream Tailings Storage Facility
Background Report for MEM Response Letter
150630R-Goldstream MEM Background Report
Page 8 M09967A03.730 June 2015
These zones of finer soils are understood to be very dense soils with high SPT values noted during the site investigation.
Atterberg testing conducted indicates that the till contains low plasticity silts to low plasticity clay.
The reviewed borehole and test pit logs suggest this material is limited in extent, with till gradations generally containing a larger fraction of coarser sand and gravel.
The site investigation conducted appears to be insufficient to confirm conditions beneath the North Dam. The following is also noted regarding the dam conditions:
The dam has been stable for more than two decades with no signs of distress.
The facility has been closed and has not been raised for several years. Construction pore pressures generated as a result of dam construction should, therefore, have largely dissipated, leading to an increase in the Factor of Safety (everything else remaining equal).
The dam is of moderate height in comparison to dams at Mount Polley.
As part of this review, the following dam stability analyses for the constructed structures were reviewed:
1982 assessment of the design starter dams and ultimate dams for the North Dam and West Dam.
1994 assessment of the as-built West Dam and North Dam following the construction of partial lifts in 1993.
Engineering standards typical of the time were applied in the design of the Goldstream TSF in 1977 through 1982. The starter dams were assessed as temporary structures, with a 1:100 year return period design earthquake, resulting in the application of a peak ground acceleration (PGA) equal to 0.024 g in the seismic stability assessment for the West and North Dams (KL, 1982b). The ultimate dam profiles were assessed using the maximum credible earthquake (MCE) criteria. However, the mine was put on care and maintenance shortly after construction and, as a result, subsequent dam lifts were not constructed (KC, 2004). As such, the starter dams comprise the bulk of the current dam structures for both the West Dam and the North Dam.
The stability of the dams with the 1993 partial lifts was assessed in 1994 (KL, 1994). The seismicity assessment conducted as part of the 1993 feasibility study (KL, 1993) suggested a PGA of 0.19 g may result from the MCE, and a pseudostatic acceleration of 0.13 g (2/3 PGA) was assumed for the 1994 stability analyses. Using these updated criteria, factors of safety of 1.2 were obtained for both the North Dam and the West Dam respectively, which were deemed adequate at the time for the constructed structures (KL, 1994). It should be noted that undrained loading conditions do not appear to have been addressed during these historic stability assessments.
Due to the limited site investigation information available for the North Dam, KCB conducted a preliminary stability assessment for the North dam using the historic parameter values assumed during design, an assumed phreatic surface based on recent observations, and the presence of a

Barkerville Gold Mines Ltd. Goldstream Tailings Storage Facility
Background Report for MEM Response Letter
150630R-Goldstream MEM Background Report
Page 9 M09967A03.730 June 2015
normally consolidated glaciolacustrine clay within the foundations. The results of the preliminary assessment showed that If a 1 m thick glaciolacustrine clay unit is located at a depth of 2.5 m below the base of the peat layer (which is equivalent to the general level of the test pitting), the factor of safety would be 1.2 (for static conditions), i.e., the dam remains stable for this likely conservative assumption.
(It should be noted that the preliminary stability analysis performed was based on the assumed design parameters used during the original dam design. This assessment has not considered all loading conditions recommended for dam stability under the CDA guidelines.)
Based upon the above, the following conclusions may be made with regard to whether the dam design accounted for the presence of glaciolacustrine clays within the foundations.
For the West Dam, due to the number of drill holes advanced to bedrock, their spatial distribution, and absence of encountered clay units, it is considered unlikely that a glaciolacustrine unit is present.
For the North Dam, based upon the local geology, it is considered unlikely that a glaciolacustrine unit is present within the dam foundations. However the presence of such a layer could not be completely ruled out as a result of the limited site investigation information at depth. The original design of the dam did not account for the presence of such a potential weak layer in the foundations. A preliminary stability analysis incorporating a weak layer in the foundations indicated the Factor of Safety was 1.2, i.e., the dam remained stable.
As indicated in KCB (2014), changes in the phreatic surfaces within the dams have occurred since the last stability analysis was completed in 1994 (KCB, 2014), and the current factors of safety against instability are not known for both dams. Current phreatic levels in the dams are presented in Appendix IV.
d. If any gaps have been identified, a plan and schedule for additional sub-surface investigation.
Based on the site investigation conducted to date and the screening level stability assessment conducted, no further subsurface investigation is recommended at this time to address the foundation soils. However, it is recommended that a more complete stability analysis be performed in order to verify that the dams have the minimum factors of safety required by the CDA Guidelines under the dams’ current configuration, consequence classification, and site conditions.
As part of this evaluation the impact of including a weak layer within the foundations of the North Dam should be considered to assess whether the presence of such a weak layer has a significant impact on the Factor of Safety. Depending upon the results of the analyses, consideration should be given to installation of additional piezometers in the dam fill and foundations.

Barkerville Gold Mines Ltd. Goldstream Tailings Storage Facility
Background Report for MEM Response Letter
150630R-Goldstream MEM Background Report
Page 10 M09967A03.730 June 2015
4 ITEM 2: WATER BALANCE ADEQUACY
At the time of August 4, 2014 breach, the Mount Polley TSF was holding surplus water. Surplus water was defined by the Panel as the volume of water that accumulates in the TSF over time because the inflow exceeds the outflow capacity. The inflow could be from mine operations, a climatic event or a combination of both. The Panel concluded that excess water accumulated in the TSF did not trigger the failure but did contribute to a more severe downstream adverse impact.
a. Including the total volume of surplus mine site water (if any) stored in the tailings storage facility.
The Goldstream Mine ceased operations in January 1996 and has been under care and maintenance since. The TSF is a closed facility and does not receive or hold water from mining operations. The current sources of inflow to the TSF comprise precipitation on the tailings surface and surface runoff from its small catchment. There is no surplus mine water in the Goldstream TSF, as excess water in the facility is passed through the Emergency Spillway.
Diversion ditches were constructed above the tailings facility to reduce the catchment reporting to the TSF impoundment to 0.5 km2 during normal precipitation events. The flood capacity of the ditches was not designed to handle significant inflows from extreme flood events. Provided the ditches are properly maintained and cleared regularly, they will continue to divert water around the TSF. In the situation where the design discharge capacity of the channels is exceeded, the channels become blocked by debris, ice, side-slope failure, etc., the inflows will report to the TSF and be discharged via the Emergency Spillway.
Outflow from the facility includes evaporation, seepage, and discharge through the Emergency Spillway. When the mine was operating, removal of excess water (as permitted by regulatory authorities) was achieved by pumping and siphoning from the tailings pond over the south abutment of the West Dam into the natural drainage course downstream of the dam. The pump and siphon system is no longer used and all flow is discharged through the Emergency Spillway.
b. The volume of surplus mine water that has been added to the facility over each of the past five years.
The water level fluctuates during the year in response to seasonal variation of precipitation; however, no water has been added to the Goldstream TSF from mining operations over the last five years.
In order to mitigate acid generation by the tailings, the water level in the TSF is maintained at a level above the tailings surface. Based on recent visual observations (KCB, 2014) the water level of the facility is held constant at, or near, the Emergency Spillway sill elevation. No significant changes in the pond elevation have been observed in the last five years.
An annual water balance for the tailings pond was developed in 2003 and refined in 2006. The water balance concluded that the average outflow from the facility was estimated to be 4.1L/s (357 m3 per day), consisting of (Lorax, 2014):
2.1 L/s of seepage through the West Dam (50% of total outflow)

Barkerville Gold Mines Ltd. Goldstream Tailings Storage Facility
Background Report for MEM Response Letter
150630R-Goldstream MEM Background Report
Page 11 M09967A03.730 June 2015
0.3 L/s of seepage through the North Dam (8% of total outflow)
0.9 L/s average evaporation (22% of total outflow)
0.8 L/s average outflow through the Emergency Spillway (20% of total outflow)
c. Any plans that are in place or that are under development to release surplus mine water to the environment.
When inflows to the facility exceed seepage and evaporation, surplus water is released from the facility through the Emergency Spillway. The current spillway was constructed in late 1993 (KC, 1994) to permit discharge of water from the TSF. The original discharge permit (PE-06168) was issued on December 10, 1981 and was most recently amended on February 28, 2006, allowing discharge through the Spillway.
d. Recommended beach width(s), and the ability of the mine to maintain these widths.
In the context of this report, beach width refers to the extent of the above water tailings that forms upstream of the tailings dam during the tailings deposition process. While the mine was in operation, tailings were primarily discharged at the east end of the pond, from the North Dam and from the West Dam. Tailings were also discharged near the centre of the pond to maximize pond filling. A beach was developed on all sides of the impoundment except the south shore of the pond, where the fresh water reclaim barge was located. Most above-water beach slopes formed at around 1% while below-water beach slopes formed at around 10% (KC, 1993). It is unknown what the ultimate beach configuration was prior to the tailings being flooded.
The Goldstream TSF is confined by downstream constructed dams and, as such, the stability of the dams does not rely on a tailings beach. The seepage barrier within the dam is a sloping upstream relatively wide and impervious glacial till zone. The bulk of the dam fill is constructed of competent granular silt-sand-gravel material (KL, 1981, 1982a, 1982b / KCB, 2004). No minimum beach width was recommended for the TSF in the original design. The design drawings indicate that the proposed ultimate tailings profile was designed to be approximately 1% and fully submerged at closure. Given the erosion protection provided to the upstream slope, the construction drawings suggest the design of the North Dam accounts for water being against the face of the dam during closure. However, the as-construction sections for the West Dam (shown on Figure 5) indicate there is no erosion protection on the upstream slope of the West Dam. The current vegetation on the upstream slope of the dam may inhibit erosion; however, as recommended in the 2014 DSI (KCB, 2014), the vegetation on the dams should be cut close to the ground surface. As such, erosion protection against surface water rise due to wind set up and wave run-up against the West Dam should be evaluated and monitoring of gullying and rutting on the upstream face of the dam is recommended.

Barkerville Gold Mines Ltd. Goldstream Tailings Storage Facility
Background Report for MEM Response Letter
150630R-Goldstream MEM Background Report
Page 12 M09967A03.730 June 2015
e. The ability of the TSF embankments to undergo deformations without the release of water (i.e., the adequacy of the recommended beach width).
Construction of the dams has been complete for several years and as the nature of the fill and foundation materials are such that the majority of consolidation settlement should have occurred in the years since the end of construction. It is expected, therefore, there will be little further ongoing settlement of the dam due to consolidation.
The main potential source of additional deformation for Goldstream TSF dams is possible earthquake loading. KC (2004) reviewed historical earthquakes within about 600 km of the project site, and carried out a probabilistic seismic hazard analysis for the site. For the designated “High” consequence classification for the facility, the earthquake design ground motion is defined as a 2,500 year return period (CDA, 2013). The probabilistic seismic hazard analysis calculated a Peak Ground Acceleration (PGA) of 0.12 g for this return period. Swaisgood (2013) and Hynes-Griffin and Franklin (1984) methods were used to estimate potential vertical and lateral seismic deformations of the dams, respectively. Based on the available background information regarding expected design yield accelerations for the dams, the calculated seismic deformations can be accommodated by the available normal freeboard of 1.2 m at either dam, to prevent the release of any water or tailings due to embankment deformation.
f. Provisions and contingencies that are in place to account for wet years.
The Emergency Spillway was constructed in late 1993 (KCB, 1994) to permit discharge of water from the TSF. The design capacity of the Emergency Spillway is reported to be a three-day 1:1,000 year event, plus 60% of the runoff from a 100 year wet year (KC, 1994) which was an appropriate Inflow Design Flood (IDF) event according to the then-current CDA Guidelines (CDA, 1999). The Emergency Spillway design assumed 1 m of water storage would be available before discharge occurs; (i.e., the water level would be 1 m below the spillway sill level).
The existing spillway geometry, pond level (currently maintained at the spillway control sill elevation) and elevations of the TSF dam crests are insufficient to prevent overtopping during the original 1:1,000 year IDF event (KCB, 2014). As noted in the 2014 DSI (KCB, 2014), revision of the IDF event to one third of the way between the 1:1,000 year event and the Probable Maximum Flood (according to the 2007 revisions to the CDA Guidelines) will exacerbate this non-compliance .
In the event of a ‘wet year,’ assumed to be a 100-year return period event, excess inflows to the TSF will be discharged via the Emergency Spillway. The facility is closed and under care and maintenance and the TSF is not intended to retain or store additional water. The water level is maintained at or near the Emergency Spillway sill elevation and precipitation on the tailings surface and surface runoff from the facilities catchment is released via seepage, evaporation or the Emergency Spillway. The design capacity of the spillway is sufficient to release the anticipated inflows generated from a 100-year return wet year event without overtopping the dams.

Barkerville Gold Mines Ltd. Goldstream Tailings Storage Facility
Background Report for MEM Response Letter
150630R-Goldstream MEM Background Report
Page 13 M09967A03.730 June 2015
g. If any gaps have been identified, a plan and schedule for addressing these issues.
The following recommendations have been made in previous dam inspection reports (KCB, 2010, 2014 / BGC, 2011):
The discharge capacity of the Emergency Spillway should be confirmed to quantify the available discharge capacity.
The management of the IDF by the diversion structures, the Emergency Spillway and freeboard provided by the TSF dams should be evaluated.
A schedule for addressing these issues is provided in Section 6.

Barkerville Gold Mines Ltd. Goldstream Tailings Storage Facility
Background Report for MEM Response Letter
150630R-Goldstream MEM Background Report
Page 14 M09967A03.730 June 2015
5 ITEM 3: FILTER ADEQUACY
During the post-breach site investigations of Mount Polley TSF, the Panel found evidence of a cavity in the left abutment of the breach that was possibly caused by internal erosion of the dam fill materials. Furthermore, the Panel noted the filter and transition zones were thin and the as-built drawings indicated departure from intended design. Also, much of the as-placed filter material failed to meet generally recognized filter criteria and requirements for internal stability. While the Panel did not find evidence that the Mount Polley failure was caused by piping and and/or cracking due to filter inadequacy, it did note that piping and cracking of the core of an earth-rockfill dam can lead to internal erosion and ultimately loss of containment and is one of the most common causes of failure of earth dams.
a. Including the beach width and filter specifications necessary to prevent potential piping.
Beach Widths and Seepage The Goldstream TSF is confined by downstream constructed dams. The stability of the dams does not rely on a tailings beach, and no design beach width was specified for either the North Dam or the West Dam.
The original design called for two years deposition of non-classified tailings. After two years, tailings would be classified using hydrocyclones to produce, it is assumed, a fine tailings overflow (“slimes”) which would be deposited within the basin to reduce seepage through the dam, with the coarse tailings underflow used in underground mine backfill. However annual review reports indicate the tailings were not classified using hydrocyclones. Seepage control, therefore, relied primarily upon the permeability of the whole tailings, which had a fines content of approximately 86% passing the No. 200 sieve (KL, 1992). No information on the whole gradation of the tailings could be located.
Filter Specifications Within the North and West Dams a glacial till core (Zone E), a filter (Zone B), and Bulk Fill comprise the three major fill zones. Design envelopes are presented in Figure 6. It should be noted that construction specifications for the West Dam initially indicated gradations for materials A through E (5 zones), however, due to limited availability of rockfill, the West Dam was redesigned to match the three design zones (Zone E, Zone B, and Bulk Fill) as per the North Dam (KL, 1981, 1984).
Bulk fill for both the North Dam and West Dam was designated “random fill”, and consisted generally of silty sand and gravel. A design gradation for this zone was not found.
The design for the filter zones were developed based on engineering standards at the time. As filter design recommendations have changed since the development of the design recommendations for the filter gradations at the Goldstream Mine, KCB has compared the available design information to current design recommendations as per the US Army Corps of Engineers (2004), and Kenney and Lau (1986). Assessment of the filter design compared to modern design recommendations is presented in Table 5.1.

Barkerville Gold Mines Ltd. Goldstream Tailings Storage Facility
Background Report for MEM Response Letter
150630R-Goldstream MEM Background Report
Page 15 M09967A03.730 June 2015
Table 5.1 Design Gradations Compared to Modern Design Criteria
Method Criteria Purpose Parameter Modern Criteria (mm) (1)
1981 Design Specification –
Filter (Zone B) (2)
Comparison of Design to Criteria
USACE, 2004
General Criterion % Passing No. 200 Sieve 5% 5% Pass
Soil Retention Maximum D15 < 0.7 mm 2 mm Fail Permeability Minimum D15 > 0.1 mm 0.2 mm Pass
No Segregation during
Construction Maximum D90 < 20 mm 219 mm Fail
General Criterion Maximum D100 < 75 mm 180 mm Fail Kenney and Lau,
1986(3) Internal Stability H H < F for F<20% H=13% for F=5% H=13% for F=10% Fail
(1)Modern design criteria were calculated based on the fine limit of the design gradation envelope for the till core for most criteria, with the exception of the Kenney and Lau (1986) criteria. See Note (3). (2)Design gradations for the filter zone (B) are presented. Parameter values correspond with values along the coarse limit of the specified design envelope with the exception of the minimum D15 (USACE, 2004) criteria, which was obtained from the fine limit of the specified design envelope. (3)Kenney and Lau (1986) method was applied for a widely graded filter. Parameter H corresponds to the mass fraction of the filter particles whose diameter ranges between D and 4D. F corresponds to the mass fraction of particles whose diameter is smaller than diameter D.
In conclusion, although the filters were designed according to generally accepted standards typical at the time of design development, the filter design does not meet modern design criteria (USACE, 2004). Based on the assessment conducted, the design criteria specified for the filter (Zone B) may be susceptible to internal erosion (Kenney and Lau, 1986).
b. Whether or not the filter has been constructed in accordance with the design.
Limited information regarding the construction and quality assurance conducted during the construction of the filters is available. In the construction records, Klohn Leonoff noted: “our review of the inspection records suggests that more data should have been obtained for record purposes to support the acceptable quality of the work being performed” (KL, 1984). Insufficient information is available to conclude that filters were constructed in accordance with the design for both dams.
Based on our review of the available background information, we also noted the following:
Although construction for both dams was undertaken in 1981-1982, and again in 1993, the filters are understood to have been built entirely during the 1981-1982 construction period (KL, 1984; KC, 1994; KCB, 2014). Available information is contained in the 1982 Construction Summary Report (KL, 1982) and the 1984 Construction Summary Report (KL, 1984).
As-built material gradations were available from the construction periods for the Zone E Core and Zone B Filter materials only. In total, seven grain size gradation tests were believed to have been conducted on the Zone E filter material during the construction period. The available data is presented in Figure 7. One of the filter samples is obtained from the West

Barkerville Gold Mines Ltd. Goldstream Tailings Storage Facility
Background Report for MEM Response Letter
150630R-Goldstream MEM Background Report
Page 16 M09967A03.730 June 2015
Dam, as indicated in the 1982 Construction Summary Report (KL, 1982). A gradation envelope for the remaining six gradation tests conducted on the filter material was also available and is presented on the right side of Figure 7. This envelope is understood to show the coarsest and finest extents of the tested samples.
The available gradation charts (KL, 1982) (KL, 1984) indicate that the tested filter material meets the design specifications. However, the location that these samples were obtained from is not available. The 1982 gradation chart indicates that the sample was obtained from the West Dam filter zone; it is unclear where the sample was obtained within the dam. The construction records also do not indicate where the samples for the 1984 gradation chart were obtained from. It is unclear how many samples were therefore obtained from the West Dam and the North Dam.
A gradation envelope for the eleven tested Glacial Till samples is also available and presented on the right side of Figure 7. This envelope is understood to show the coarsest and finest extents of the tested samples. The available data indicates that the gradations are generally coarser than the specified Zone E design limits, particularly in the sand and finer fraction of the distribution curve.
Based on the approximate quantity of fill placed (259,000 m3 total, consisting of 79,000 m3 for the North Dam and approximately 180,000 m3 for the West Dam), an average quantity of fill placed per gradation test is listed below.
6,400 m3 of fill placed / gradation test for the glacial till core
4,300 m3 of fill placed / gradation test for the filter material
Although the construction specifications do not provide a quantified frequency of gradation testing for the fill materials, it indicated that “testing will be performed by the Engineer as frequently as he deems necessary”. Based on the available data, more as-placed samples of the embankment fill materials should have been tested to confirm that the design criteria were met. In addition, the specific locations of test material should have been recorded to confirm that the testing was representative.
The following changes from the design criteria were also noted in the construction records (KL, 1982a, KL, 1984):
During the Phase I construction of the West Dam, the design of the filter blanket was changed, and a gap in the filter blanket was left at the bottom of the valley in which the West Dam was constructed. The filter blanket extends from where the glacial till core is in contact with the base material, to approximately 12 m downstream of the core. Correspondence regarding this design change and the as-built drainage blanket are presented in Appendix VI.
KCB has compared the available as-built design information to current design recommendations as per the US Army Corps of Engineers (2004), Kenney and Lau (1986), and the recommendations of Foster and Fell (2001). Assessment of the as-built filters compared to modern design recommendations is presented in Table 5.2 for the filter material (Zone B) compared to the glacial till

Barkerville Gold Mines Ltd. Goldstream Tailings Storage Facility
Background Report for MEM Response Letter
150630R-Goldstream MEM Background Report
Page 17 M09967A03.730 June 2015
core (Zone E). As noted earlier, no as-constructed information regarding the bulk fill material was available.
Table 5.2 As-Built Gradations Compared to Modern Design Criteria
Method Criteria Purpose Parameter Modern Criteria (mm) (1)
As Constructed Filter Gradation
(Zone B) (2)
Comparison of Design to Criteria
USACE, 2004
General Criterion % Passing No. 200 Sieve < 5% 2% – 4.5% Pass
Soil Retention Maximum D15 < 0.7 mm 0.6 mm Pass Permeability Minimum D15 > 0.1 mm 0.3 mm Pass
No Segregation during
construction Maximum D90 < 20 mm > 76 mm Fail
General Criterion Maximum D100 < 75 mm > 76 mm Fail
Kenney and Lau, 1986(3) Internal Stability F < D for D<20 H < F for F<20%
H=10% for F=5% H=15% for
F=10% Fail
Foster and Fell, 20014
No Erosion D15 < 0.7 mm 0.6 mm Pass No Excessive
Erosion D15 6 mm 0.6 mm Pass
No Continuous Erosion D15 28 mm 0.6 mm Pass
(1)Modern design criteria were calculated based on the fine limit of the available as-built gradation envelope for the till, with the exception of the Kenney and Lau (1986) criteria for internal instability. See Note 3. (2)Parameter values correspond with the coarse limit of the available as-constructed filter gradation envelope, with the exception of the minimum D15 (USACE, 2004) criteria, which was obtained from the fine limit of the available as-constructed filter gradation envelope. (3) The Kenney and Lau (1986) method was applied for a widely graded filter. Parameter H corresponds to the mass fraction of the particles whose diameter ranges between d and 4d. F corresponds to the mass fraction of particles whose diameter is smaller than diameter D. This method was applied to the as-built filter gradation. (4)Application of the Foster and Fell criteria may not be applicable as both the filter and base soil are susceptible to segregation (as per USACE, 2004) and internal stability (as per Kenney and Lau, 1986). Based on the assessment of the available gradations for the as-constructed dam materials, both indicate that soil retention (Foster and Fell, 2001) (USACE, 2004) and permeability design criteria (USACE, 2004) are met. However the assessment also indicates that the as-constructed filters may be susceptible to internal erosion (Kenney and Lau, 1986), and do not meet maximum particle size criterion or gradation requirements to prevent segregation during construction (USACE, 2004).
The soils are susceptible to segregation and possible internal instability, however, on the basis of the generally clear seepage, there is no evidence of widespread migration of the base soil or the impounded tailings through the dam.
c. If any gaps have been identified, a plan and schedule for addressing these issues.
As noted previously, information gaps in the construction record are present. In addition, the design and the as-built gradations of the filters do not meet modern standards for filter design.

Barkerville Gold Mines Ltd. Goldstream Tailings Storage Facility
Background Report for MEM Response Letter
150630R-Goldstream MEM Background Report
Page 18 M09967A03.730 June 2015
Despite these shortcomings, no immediate further assessment of the filters is deemed necessary in order to evaluate filter adequacy, there is a requirement for ongoing monitoring of the seepage to check for continuing filter adequacy. This is based on the following:
No documentation of observations of local deformations / washouts, voids, or piping in the construction, operations and closure records.
Filter performance has been demonstrated by clear seepage and retention of tailings in the impoundment during operations and closure. Seepage at the West Dam toe has been clear (KCB, 2014). Seepage at the North Dam toe has been generally clear, with the exception of one location where discoloured ponded water was noted (KCB, 2014).
Subsequent observations made by Barkerville at the Goldstream TSF have not found ponded water at the North Dam toe.
There is, however, a requirement for ongoing monitoring of the seepage to check for continuing filter adequacy, based upon the following:
The gradations of the filter and base soils are such that they are susceptible to segregation and internal stability, and are within the range of gradations where filter performance has often been poor (Foster and Fell, 2001).
The facility continues to retain water, including water ponded directly against the upstream face of the dams.
Seepage flows continue to be observed. Flow rates are not currently monitored by weirs.
The above requirement for continued monitoring of the performance of the dam was also recommended in the 2014 DSI (KCB, 2014), and the following specific recommendations were noted with respect to filter adequacy:
The observations of seepage flows which are no longer being monitored by weir, combined with recent increases in piezometric levels, indicates a dam safety monitoring deficiency. The West Dam toe drain system should be assessed as to whether it should be repaired or replaced. Given the potential for inadequacy in the filters and the high piezometric levels in the dam, seepage should be monitored for both dams on a weekly basis. The seepage should also be monitored for suspended solids.
The nature of the discoloured ponded water at the North Dam downstream toe, observed during the 2014 DSI (KCB, 2014), should be further investigated, and periodic observations of the North Dam toe should be continued to be made to monitor for ponding of water. It is unknown at this time if the observed discoloured ponded water was due to entrained fine materials from seepage through or beneath the dam, chemical composition of seepage from the TSF, or turbidity associated with runoff from the recent rainfall. If ponded water is noted again, water quality should be determined by particle and chemical analysis as soon as possible.

Barkerville Gold Mines Ltd.
Goldstream Tailings Storage Facility
Background Report for MEM Response Letter
150630R-Goldstream MEM Background Report
Page 19
M09967A03.730 June 2015
6 SUMMARY OF GAPS AND SCHEDULE TO ADDRESS
MEM Memorandum
Schedule to Address Item
No. Gap Identified
1. Undrained shear failure of silt and clay foundation
� No further subsurface investigation is recommended at this
time to address the foundation soils.
� Carrying out a stability analysis on both dams is recommended.
� Stability analysis to be performed in
2015.
2. Water balance adequacy
� The discharge capacity of the Emergency Spillway should be
confirmed.
� The management of the IDF by the diversion structures, the
Emergency Spillway and the freeboard provided by the TSF
dams should be evaluated.
� Discharge capacity of Emergency
Spillway to be confirmed in Q3 2015.
� Management of IDF by the diversion
structures will be evaluated in Q3
2015.
3. Filter adequacy
� The nature of the discoloured ponded water at the North Dam
downstream toe should be further investigated.
� The seepage from both the North Dam and the West Dam
should be monitored on a weekly basis for the seepage rate
and for the presence of any suspended solids. Weirs should be
re-established.
� Ongoing monitoring of North and
West Dam to be carried out on a
weekly basis.
� Weirs to be re-established by
July 15, 2015.


Barkerville Gold Mines Ltd. Goldstream Tailings Storage Facility
Background Report for MEM Response Letter
150630R-Goldstream MEM Background Report
Page 21 M09967A03.730 June 2015
REFERENCES
BGC Engineering Inc. (BGC). 2011. 2011 Dam Safety Inspection – Goldstream Tailings Storage Facility. Report submitted to Barkerville Gold Mines Ltd.
Canadian Dam Association (CDA). 1999. Dam Safety Guidelines.
Canadian Dam Association (CDA). 2013. Dam Safety Guidelines 2007 (Revised 2013).
Coulson, C.H. 1991. Manual of Operational Hydrology in British Columbia – Second Edition, February.
Foster and Fell. 2001. Assessing Embankment Dam Filters that do not Satisfy Design Criteria. Journal of Geotechnical and Geoenvironmental Engineering, May 2001.
Geological Survey of Canada (GSC). 1984. Kootenay Lake – Surficial Geology, Open File 1084.
Geological Survey of Canada (GSC). 1986. Surficial Geology – Seymour Arm – British Columbia, Map 1609A [Scale 1: 250,000].
Geological Survey of Canada (GSC). 1971. Geology – Big Bend (Seymour Arm, East Half) – British Columbia, Map 12-1964 [Scale 1:253,440].
Hynes-Griffin and Franklin. 1984. Rationalizing the Seismic Coefficient Method. US Army Corps of Engineer.
Kenney, T.C. and Lau, D. 1986. Internal Stability of Granular Filters: Reply, Canadian Geotechnical Journal, 23: 420-423.
Klohn Crippen Berger Ltd. (KCB). 2014. Goldstream Mine Tailings Storage Facility – 2014 Dam Safety Inspection and Review. Prepared for Barkerville Gold Mines, November 27, 2014.
Klohn Crippen Berger Ltd. (KCB). 2010. Goldstream Tailings Facility – 2009 Annual Review. Prepared for International Bethlehem Mining Corp., July 15, 2010.
Klohn Crippen Berger Ltd. (KCB). 2009. Goldstream Tailings Facility – 2008 Annual Review. Prepared for International Bethlehem Mining Corp., April 22, 2009.
Klohn-Crippen Consultants Ltd. (KC). 2004. Goldstream Tailings Facility – Feasibility Study. Prepared for International Bethlehem Mining Corp., October 4, 2004.
Klohn-Crippen Consultants Ltd. (KC). 1994. Tailings Impoundment – Goldstream Mine - 1993 Annual Review. Prepared for Bethlehem Resources Corp., April 8, 1994.
Klohn-Crippen Consultants Ltd. (KC). 1993. Tailings Impoundment – Goldstream Mine – Dam Raising Design, June 21, 1993.
Klohn Leonoff (KL). 1992. Tailings Impoundment – 1992 Annual Review. Prepared for Bethlehem Resources Corp., July 24, 1992.
Klohn Leonoff (KL). 1984. Construction and Performance of the Tailings Storage Dams, Phase I. Prepared for Noranda Mines Limited, March 1, 1984.

Barkerville Gold Mines Ltd. Goldstream Tailings Storage Facility
Background Report for MEM Response Letter
150630R-Goldstream MEM Background Report
Page 22 M09967A03.730 June 2015
Klohn Leonoff (KL). 1982a. Construction and Performance of the Tailings Storage Dams, Phase I. Prepared for Noranda Mines Limited, October 5, 1982.
Klohn Leonoff (KL). 1982b. Supplementary Report on the Tailings Storage Facility at Goldstream Dam. Prepared for Noranda Mines Limited, January 29, 1982.
Klohn Leonoff (KL). 1981. Goldstream Tailings Storage Facility. Prepared for Noranda Mines Limited, April 1, 1981.
Lorax Environmental. 2014. 2012-2013 Water Quality Monitoring Report Goldstream Mine, B.C. Prepared for Barkerville Gold Mines Ltd., June 26, 2014.
Swaisgood, James, R. 2013. Predicting Dam Deformation Caused by Earthquakes – An Update. Presented at the ASDSO Dam Safety Conference, Providence, Rhode Island, September.
US Army Corps of Engineer. 2004. General Design and Construction Considerations for Earth and Rock-fill Dams. Engineering and Design. EM 1110-2-2300. July.
United States Bureau of Reclamation (USBR).1987. Design of Small Dams. 3rd Edition.

Barkerville Gold Mines Ltd. Goldstream Tailings Storage Facility
Response to MEM Memorandum
150630R-Goldstream MEM Background Report
M09967A03.730 June 2015
FIGURES


“”
“”

Barkerville Gold Mines Ltd. Goldstream Tailings Storage Facility
Background Report for MEM Response Letter
150630R-Goldstream MEM Background Report
M09967A03.730 June 2015
APPENDIX I MEM February 3, 2015 Memorandum

Ministry of Energy and Mines
Mines and Mineral Resources Division
MEMORANDUM
Ministry of Energy and Mines Mines and Mineral Resources Division
February 3, 2015
To: Dave McMillan, President ‐ Goldstream – Bethlehem Resources (1996) Corporation As you know, the Expert Panel that was convened to examine the Mount Polley tailings dam breach has issued a report on their findings. This report has been made public and you may already be familiar with the conclusions of this report. Chief among these was the determination that the failure at Mount Polley was related to the presence of weak glacio‐lacustrine soils in the dam foundation. The Panel also indicated that the severity of the consequence of failure was in large part owing to the quantity of stored water and the proximity of this water to the dam embankment (i.e. lack of beach). The Ministry of Energy and Mines (MEM) requires confirmation that the conditions that lead to the incident at Mount Polley are not present at other mines in B.C.
More specifically, you are required to undertake an assessment to determine if the dam(s) associated with your tailings storage facility/facilities may be at risk due to:
1. Undrained shear failure of silt and clay foundations; a. Including a determination with respect to whether or not similar foundation
conditions exist below the dams on your site, b. Whether or not sufficient site investigation (drill holes, etc.) has been
completed to have confidence in this determination, c. If present, whether or not the dam design properly accounts for these
materials, and d. If any gaps have been identified, a plan and schedule for additional sub‐
surface investigation.
2. Water balance adequacy; a. Including the total volume of surplus mine site water (if any) stored in the
tailings storage facility, b. The volume of surplus mine water that has been added to the facility over
each of the past five years, c. Any plans that are in place or that are under development to release surplus
mine water to the environment, d. Recommended beach width(s), and the ability of the mine to maintain these
widths, e. The ability of the TSF embankments to undergo deformation without the
release of water (i.e. the adequacy of the recommended beach width), f. Provisions and contingencies that are in place to account for wet years, and g. If any gaps have been identified, a plan and schedule for addressing these
issues.

Page 2 of 2
3. Filter adequacy;
a. Including the beach width and filter specifications necessary to prevent potential piping,
b. Whether or not the filter has been constructed in accordance with the design, and
c. If any gaps have been identified, a plan and schedule for addressing these issues.
The Ministry is cognizant of the demands that were placed on your company by the Chief Inspector’s Orders of August 18, 2014, and does not wish to place any additional undue burdens on your company. However, the previous Orders were issued before the mechanism of failure was known. Consequently, you are asked to provide a letter of assurance to respond to the items listed above. The letter is to be prepared and sealed by a qualified professional engineer, and is to be submitted to the Chief Inspector of Mines by June 30, 2015. To facilitate MEM’s review, you are asked to maintain the above numbering system in your response to each item.
It is envisioned that the above items would best be addressed through a fulsome review of existing information. Where this information has not been compiled, it will be necessary to conduct a review of historical information to determine if any gaps remain in the understanding of the relevant conditions for the tailings storage facility dams on your site. Where appropriate, follow‐up actions shall be identified that will be taken to address any opportunities for improvement.
Documents supporting the letter of assurance shall be maintained on‐site and shall be made available to any Inspector of Mines upon request.
It should be noted that the Panel made a number of additional recommendations in Chapters 9 and 11 of their January 30, 2015 Report on Mount Polley Tailings Storage Facility Breach. MEM is in general agreement with all of the recommendations, and will be examining each of them to determine how they can be implemented over the coming weeks and months. You are asked to do the same.
Thank you for your prompt attention to these matters,
Regards,
Al Hoffman, P. Eng. Chief Inspector of Mines Ministry of Energy and Mines Cc: Diane Howe, Deputy Chief Inspector, Reclamation and Permitting, MEM George Warnock, Manager, Geotechnical Engineering, MEM Heather Narynski, Sr. Geotechnical Inspector, MEM

Barkerville Gold Mines Ltd. Goldstream Tailings Storage Facility
Background Report for MEM Response Letter
150630R-Goldstream MEM Background Report
M09967A03.730 June 2015
APPENDIX II Summary of Relevant Reports

Barkerville Gold Mines Ltd.Goldstream Tailings Storage Facility
Appendix IISummary of Relevant Reports
AppII-SummaryofRelevantReports
Table II-1 - List of Reports ReviewedDocument Title Author Date of Issue
Goldstream Project - Tailings Dam (Draft) Klohn Leonoff (KL) 17-Dec-1977Report on Tailings Storage Facility for Goldstream Mine KL 01-Apr-1981
Supplementary Report on the Tailings Storage Facility at Goldstream Mine KL 29-Jan-1982
Tailings Storage Dams Phase I Construction - Special Construction Requirements and Specifications for Construction
KL 19-May-1981
Tailings Storage Facility - Alternative Design for West Dam KL 08-Jun-1981Construction of Tailings Storage Dams Phase I KL 05-Oct-1982Construction and Performance of the Tailings Storage Dams, Phase 1
KL 01-Mar-1984
1984 Annual Review KL 15-Feb-1985Feasibility Review - Tailings Pond Goldstream Mine KL 19-May-1989Annual Review of Tailings Dams for 1989 KL 03-May-1989Annual Review, Tailings Impoundment (1990) KL 17-Oct-1990Tailings Impoundment Goldstream Mine - 1992 Annual Review KL 24-Jul-1992Tailings Impoundment Goldstream Mine - Dam Raising Design KL 21-Jun-1993
Tailings Impoundment Goldstream Mine - 1993 Annual Review Klohn Crippen (KC) 08-Apr-1994
Tailings Impoundment Goldstream Mine - 1994 Annual Review KC 07-Mar-1995
Goldstream Mine Tailing Impoundment - Hydrology Study for Mine Closure KC 30-Jun-95
Tailings Impoundment Goldstream Mine - 1995 Annual Review KC 11-Mar-1996Tailings Impoundment Goldstream Mine - 1996 Annual Review KC 10-Jan-1997Tailings Impoundment Goldstream Mine - 1997 Annual Review KC 11-Mar-19982003 Annual Tailings Dam Inspection Brodie January, 2004Goldstream Tailings Facility - Feasibility Study KC 04-Oct-2004
Goldstream Tailings facility - 2005 Annual ReviewKlohn Crippen Berger (KCB)
29-Mar-2006
Goldstream Tailings Facility - 2006 Annual Review KCB 30-Mar-2007Goldstream Tailings Facility - 2007 Annual Review KCB 31-Mar-2008Goldstream Tailings Facility - 2008 Annual Review KCB 22-Apr-2009Goldstream Tailings Facility - 2009 Annual Review KCB 15-Jul-2010
July 2011 Dam Safety Inspection - Goldstream Tailings Storage FacilityBGC Engineering
(BGC)30-Aug-2011
2011 Annual Reclamation Report, Goldstream Mine, B.C. Lorax 07-Mar-2012Goldstream Mine Tailings Storage Facility - 2014 Dam Safety Inspection and Review
KCB 27-Nov-2014
2014 Independent Review/Audit of Tailings Dam Safety Inspection and Consequence Classification: Goldstream Mine, BC
BGC 01-Dec-2014

Barkerville Gold Mines Ltd. Goldstream Tailings Storage Facility
Appendix II Annotated Bibliography
AppII-Annotated Bibliograoph
Page II 1
M09967A03.730 June 2015
Table II-2 Annotated Bibliography
Reference Reviewed Data/ Key Information
Klohn Leonoff (KL). 1977. “Goldstream Project - Tailings Dam (Draft)”, Decemeber 1977.
• Feasibility report (presented in draft) outlining the basic design concepts and results of the 1977 site investigation.
Klohn Leonoff (KL). 1981a. “Report on Tailings Storage Facility for Goldstream Mine”, April 1981.
• Design report intended to support Noranda’s application for regulatory permits to construct the Goldstream TSF, includes: • Inferred site conditions including surficial geology (Identifies presence
of loose silty sands at the site, necessitating further investigation) • Design concept and analyses conducted for an earth fill North Dam
(similar to the constructed structure) and a rockfill West Dam (subsequently re-designed).
• Results of 1977 and 1980 site investigation are presented. Klohn Leonoff (KL). 1981b. “Tailings
Storage Dams Phase I Construction - Special Construction Requirements and Specifications for Construction”, May, 1981.
• Technical scope and specifications, including: • Design gradation envelopes for all fill materials presented in the initial
design (KL, 1981a) of the dams.
Klohn Leonoff (KL). 1981c. “Tailings Storage Facility - Alternative Design for West Dam”, June 1981.
• Presents the design and stability analyses developed for an earthfill West Dam, with the same dam section as the North Dam. This design was developed because rockfill was not expected to be available in time for dam construction.
Klohn Leonoff (KL). 1982. “Supplementary Report on the Tailings Storage Facility at Goldstream Mine”, January, 1982.
• This report was produced with the intention of supplementing the 1981 design report (KL, 1981a).
• The findings of the 1981 site investigation are presented. The site investigation was conducted to further define the extent and size of the loose sand zones encountered in earlier investigations.
• The re-aligned North Dam and West Dam are presented, as well as stability analyses corresponding to the revised dam sections and locations.
Klohn Leonoff (KL). 1982. “Construction of Tailings Storage Dams Phase I”, October 1982.
• A summary of observations and quality assurance measures undertaken during the initial construction of the Goldstream TSF are presented in this report., including: • General notes on foundation preparation and compaction; and, • Design changes and recommendations.
Klohn Leonoff (KL). 1984. “Construction and Performance of the Tailings Storage Dams, Phase 1”, March 1984.
• This report is intended to serve as a revised and updated version of the earlier 1982 KL construction summary report, intended to address comments and questions from the B.C. Ministry of Energy, Mines and Petroleum Resources (BC MEMPR) in their review of the earlier report. The report presents observations from construction up until the fall of 1983, including: • General notes on foundation preparation and compaction • As-built particle size envelopes of fill materials used • Design changes and recommendations
• Appendix I, a letter from the BC MEMPR to KL was used to identify specific questions from the ministry.
• Appendix I includes a letter from KL to Noranda Mines Ltd. (Site Owner) to address the availability of borrow material for the filter and design changes.
Klohn Leonoff (KL). 1984. “1984 Annual Review”, Feburary 1985.
• This report presents initial observations regarding the operations of the Goldstream TSF. Generally, the report confirms that site conditions were acceptable at the time, apart from damage noted to piezometers in the North Dam. The north dam toe is noted as “spongy” in this report due to a higher phreatic surface.

Barkerville Gold Mines Ltd. Goldstream Tailings Storage Facility
Appendix II Annotated Bibliography
AppII-Annotated Bibliograoph
Page II 2
M09967A03.730 June 2015
Klohn Leonoff (KL). 1989.” Annual Review of Tailings Dams for 1989”, May 1989.
• This report presents the results of the 1989 annual review of the Goldstream TSF. The review indicates that the Goldstream Mine has been shut down since May 1, 1984. The review indicated that the dams were generally in good conditions although the piezometric levels in both dams were relatively high, suggesting the dams were behaving as homogenous structures rather than zoned earthfill structures as intended.
• The report indicated the tailings would normally be submerged, however excess water was being siphoned off each spring to maintain the required freeboard.
Klohn Leonoff (KL). 1990. “Annual Review, Tailings Impoundment (1990)”, October 1990.
• The 1990 annual review indicates that the tailings beach was completely covered by water along the entire length of the West Dam. The review concludes that the dams appear to be acceptable, although high piezometer readings in the North Dam indicate low head loss in the core zone.
Klohn Leonoff (KL). 1992. “Tailings Impoundment Goldstream Mine - 1992 Annual Review”, July 1992.
• This report indicates that tailings deposition in the pond had recommenced since May 2, 1992, when concentrator production was resumed.
• The annual review indicates that the tailings beach sloped eastward to the North and proposed East dam, with a beach developed at the West Dam.
• The report concludes that the tailings dams appear to be acceptable, although piezometric levels in both dams remain high.
• Development of a perimeter beach is recommended to improve future tailings storage capacity (this future tailings storage does not appear to have been ultimately required in future years).
Klohn Leonoff (KL). 1993. “Tailings Impoundment Goldstream Mine - Dam Raising Design”, June 1993.
• This report presents the design for a dam raise to elevation 694.5 m. Although this lift was not constructed, and a partial lift was constructed instead, this report contains an update on the seismicity assessment for the Goldstream Mine, resulting in an increase in the maximum credible earthquake (MCE) and resulting peak ground accelerations relative to values used for the original design of the Goldstream impoundment.
Klohn Crippen (KC) 1994. “Tailings Impoundment Goldstream Mine - 1993 Annual Review”, April 1994.
• Summary of the design and construction of the spillway. • Annual review report. • The report suggests that permeability through the North Dam may be
considerably less permeable than the West Dam due to the dam being founded directly on till. In contrast, the West Dam is believed to be built on silty sand and gravel.
• The report indicates that a tailings beach was being developed on the north dam, which resulted in a slight lowering of the piezometric level.
Klohn Crippen (KC) 1995. “Tailings
Impoundment Goldstream Mine - 1994 Annual Review”, March 1995.
• The report summarizes the construction of a partial lift built in 1993. Although KC only conducted site visits and did not observe the entire construction period, the report suggests that “construction of the dam raises to crest elevation 691.5 m appears to have been done conscientiously”.
• A stability analysis of the as-built structures is also presented in this report, using criteria outlined in the 1993 design report (KL, 1993).
Klohn Crippen (KC) 1995. “Goldstream Mine Tailing Impoundment - Hydrology Study for Mine Closure”, June 1995.
• Annual review report.
Klohn Crippen (KC) 1996. “Tailings Impoundment Goldstream Mine - 1995 Annual Review”, March 1996.
• Annual review report.
Klohn Crippen (KC) 1997. “Tailings Impoundment Goldstream Mine -
• Annual review report. It is understood that the mine was in operation until
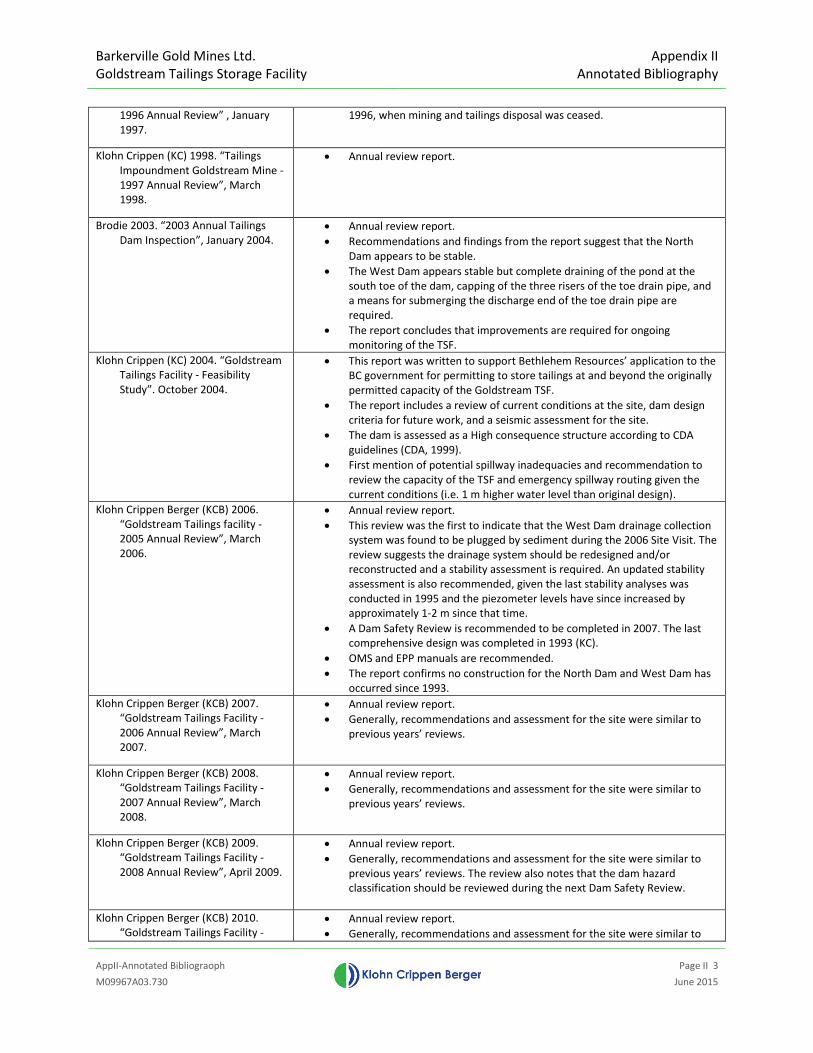
Barkerville Gold Mines Ltd. Goldstream Tailings Storage Facility
Appendix II Annotated Bibliography
AppII-Annotated Bibliograoph
Page II 3
M09967A03.730 June 2015
1996 Annual Review” , January 1997.
1996, when mining and tailings disposal was ceased.
Klohn Crippen (KC) 1998. “Tailings Impoundment Goldstream Mine - 1997 Annual Review”, March 1998.
• Annual review report.
Brodie 2003. “2003 Annual Tailings Dam Inspection”, January 2004.
• Annual review report. • Recommendations and findings from the report suggest that the North
Dam appears to be stable. • The West Dam appears stable but complete draining of the pond at the
south toe of the dam, capping of the three risers of the toe drain pipe, and a means for submerging the discharge end of the toe drain pipe are required.
• The report concludes that improvements are required for ongoing monitoring of the TSF.
Klohn Crippen (KC) 2004. “Goldstream Tailings Facility - Feasibility Study”. October 2004.
• This report was written to support Bethlehem Resources’ application to the BC government for permitting to store tailings at and beyond the originally permitted capacity of the Goldstream TSF.
• The report includes a review of current conditions at the site, dam design criteria for future work, and a seismic assessment for the site.
• The dam is assessed as a High consequence structure according to CDA guidelines (CDA, 1999).
• First mention of potential spillway inadequacies and recommendation to review the capacity of the TSF and emergency spillway routing given the current conditions (i.e. 1 m higher water level than original design).
Klohn Crippen Berger (KCB) 2006. “Goldstream Tailings facility - 2005 Annual Review”, March 2006.
• Annual review report. • This review was the first to indicate that the West Dam drainage collection
system was found to be plugged by sediment during the 2006 Site Visit. The review suggests the drainage system should be redesigned and/or reconstructed and a stability assessment is required. An updated stability assessment is also recommended, given the last stability analyses was conducted in 1995 and the piezometer levels have since increased by approximately 1-2 m since that time.
• A Dam Safety Review is recommended to be completed in 2007. The last comprehensive design was completed in 1993 (KC).
• OMS and EPP manuals are recommended. • The report confirms no construction for the North Dam and West Dam has
occurred since 1993. Klohn Crippen Berger (KCB) 2007.
“Goldstream Tailings Facility - 2006 Annual Review”, March 2007.
• Annual review report. • Generally, recommendations and assessment for the site were similar to
previous years’ reviews.
Klohn Crippen Berger (KCB) 2008. “Goldstream Tailings Facility - 2007 Annual Review”, March 2008.
• Annual review report. • Generally, recommendations and assessment for the site were similar to
previous years’ reviews.
Klohn Crippen Berger (KCB) 2009. “Goldstream Tailings Facility - 2008 Annual Review”, April 2009.
• Annual review report. • Generally, recommendations and assessment for the site were similar to
previous years’ reviews. The review also notes that the dam hazard classification should be reviewed during the next Dam Safety Review.
Klohn Crippen Berger (KCB) 2010. “Goldstream Tailings Facility -
• Annual review report. • Generally, recommendations and assessment for the site were similar to

Barkerville Gold Mines Ltd. Goldstream Tailings Storage Facility
Appendix II Annotated Bibliography
AppII-Annotated Bibliograoph
Page II 4
M09967A03.730 June 2015
2009 Annual Review”, July 2010. previous years’ reviews. • Preliminary flood routing analysis indicates that the dam(s) may be
overtopped during a one-day 1,000 year precipitation event. A more detailed assessment of the spillway capacity and available dam freeboard is required to confirm whether or not the TSF can safely handle the design flood.
BGC Engineering (BGC) 2011. “2011 Dam Safety Inspection - Goldstream Tailings Storage Facility”, August 2011.
• Annual review report • Generally, recommendations and assessment for the site were similar to
previous years’ reviews.
Lorax Environmental 2012. “2011 Annual Reclamation Report, Goldstream Mine, B.C.”, March 2012.
• Summary of 2003 and 2006 water balances • Attached is a copy of permit PE-06168 (including water discharge
allowances)
Klohn Crippen Berger (KCB) 2014. “Goldstream Mine Tailings Storage Facility - 2014 Dam Safety Inpsection and Review”, November 2014.
• Annual review report • Report includes:
o Summary of monthly piezometric and pond levels (from 30-June-05 to 20-Nov-14).
• The report notes a rise in piezometric elevations in the West Dam relative to historic levels.
• The report outlines a list of action items and conclusions. BGC Engineering (BGC) 2014. “2014
Independent Review/Audit of Tailings Dam Safety Inspection and Consequence Classification: Goldstream Mine, BC”, December 2014.
• This third party review was used to assess current recommendations for the Goldstream Site.

Barkerville Gold Mines Ltd. Goldstream Tailings Storage Facility
Background Report for MEM Response Letter
150630R-Goldstream MEM Background Report
M09967A03.730 June 2015
APPENDIX III Historic SSI Data


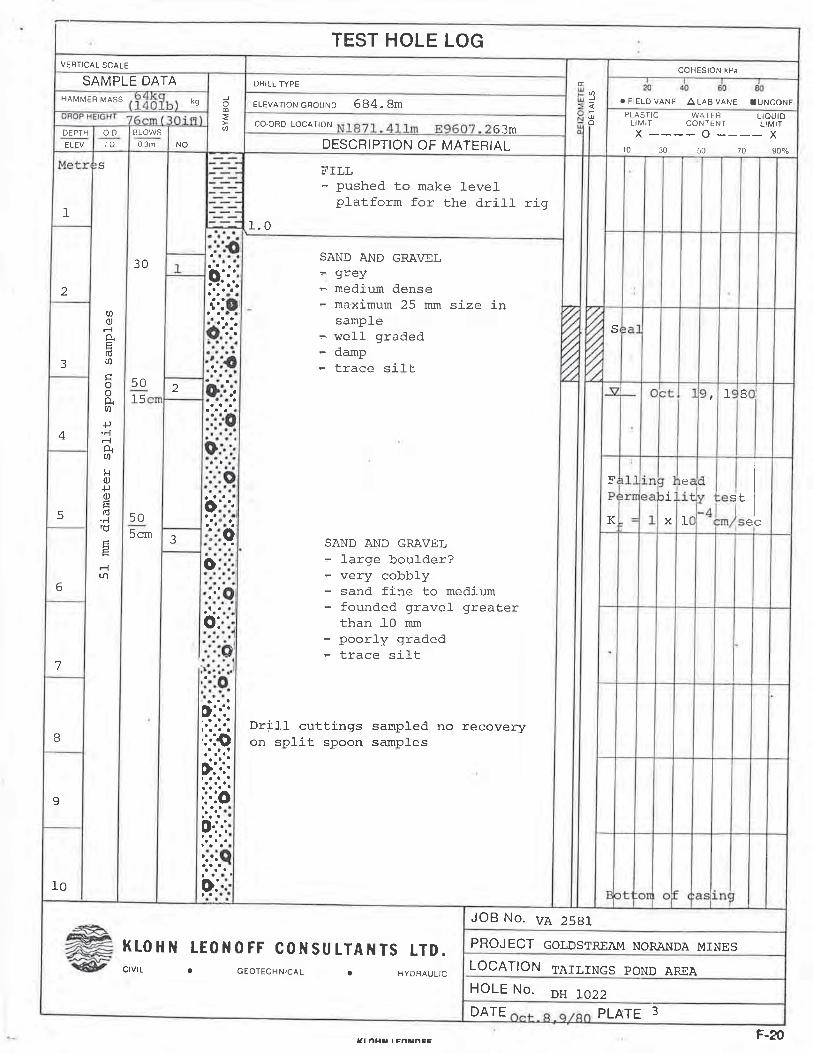


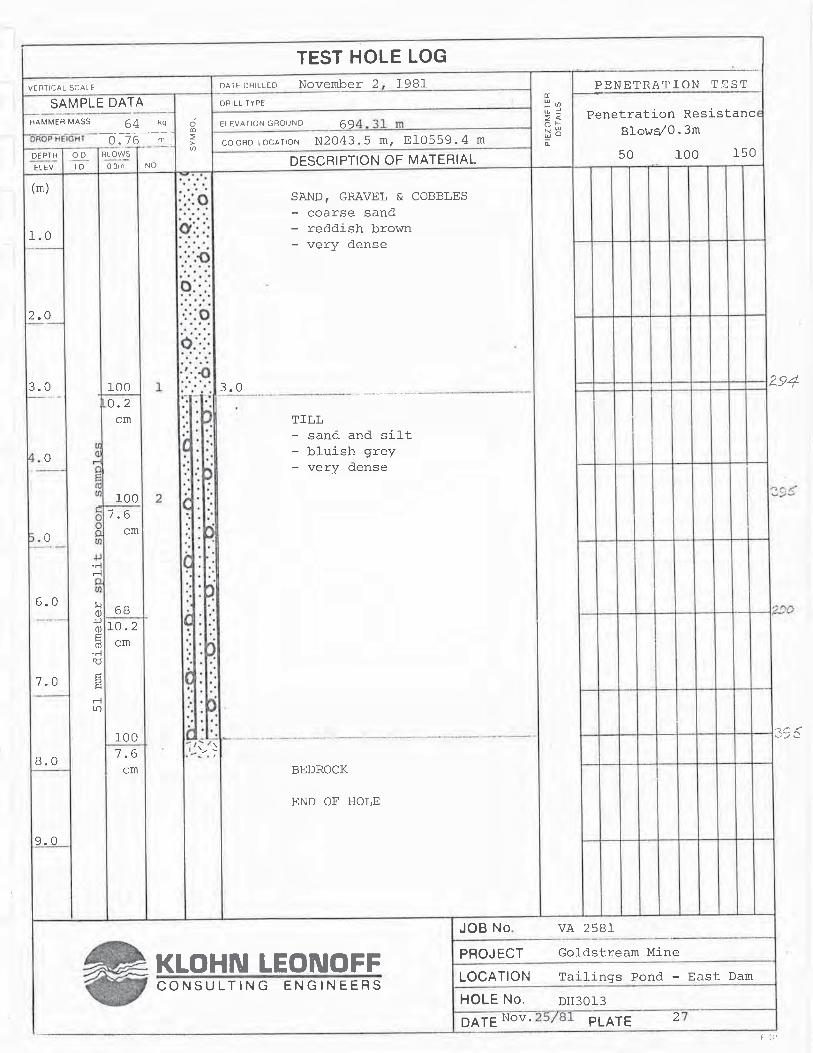
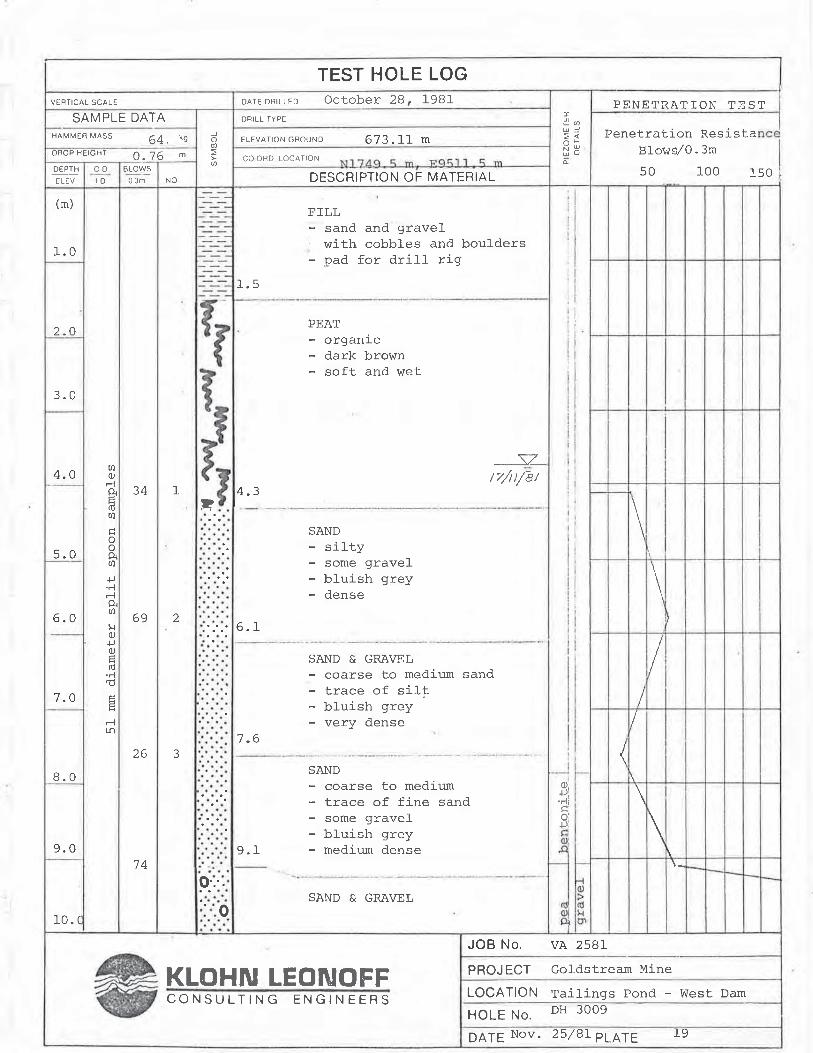


Barkerville Gold Mines Ltd. Goldstream Tailings Storage Facility
Background Report for MEM Response Letter
150630R-Goldstream MEM Background Report
M09967A03.730 June 2015
APPENDIX IV 2014 Piezometer Readings

Barkerville Gold Mines Ltd.Goldstream Tailings Storage Facility
Appendix IV - 2014 Piezometer Readings
AppIV-2014PiezometerReadings
Goldstream Piezometer and Flow Data
Goldstream Tailings FacilityMonthly Piezometric Levels
TOC El.= 691.829 TOC El.= 685.493 TOC El.= 691.248 TOC El.= 677.205Pond
Elevation (TNPZ) (BNPZ) (TWPZ) (BWPZ)Reading Elevation Reading Elevation Reading Elevation Reading Elevation
(m) (m) (m) (m) (m) (m) (m) (m) (m)30-Jan-05 690.25 5.44 686.39 2.06 683.43 13.86 677.39 4.70 672.5126-Feb-05 690.25 5.42 686.41 2.01 683.48 13.84 677.41 4.52 672.6929-Mar-05 690.25 5.24 686.59 1.79 683.70 13.71 677.54 4.29 672.9227-Apr-05 690.31 5.41 686.42 1.97 683.52 13.75 677.50 4.49 672.7228-May-05 690.13 5.52 686.31 2.07 683.42 13.85 677.40 4.56 672.6526-Jun-05 690.09 5.50 686.33 1.98 683.51 13.79 677.46 4.30 672.9130-Jul-05 690.20 5.54 686.29 1.94 683.55 13.72 677.53 4.42 672.79
27-Aug-05 690.12 5.54 686.29 2.05 683.44 13.76 677.49 4.72 672.4927-Sep-05 690.16 5.62 686.21 2.03 683.46 13.70 677.55 4.40 672.8127-Oct-05 690.27 5.29 686.54 1.89 683.60 13.58 677.67 4.27 672.9328-Nov-05 690.25 5.30 686.53 1.88 683.61 13.57 677.68 4.37 672.8428-Dec-05 690.25 5.29 686.54 1.83 683.66 13.53 677.72 4.35 672.8629-Jan-06 690.25 5.14 686.69 1.82 683.67 13.50 677.75 4.34 672.8725-Feb-06 5.32 686.51 1.92 683.57 13.52 677.73 4.45 672.7627-Mar-06 5.13 686.70 1.82 683.67 13.40 677.85 4.30 672.9128-Apr-06 690.76 5.16 686.67 1.81 683.68 13.38 677.87 4.37 672.8428-May-06 690.23 5.16 686.67 1.77 683.72 13.53 677.72 4.46 672.7530-Jun-06 690.11 5.36 686.47 1.94 683.55 13.54 677.71 4.53 672.6829-Jul-06 689.84 5.47 686.36 1.98 683.51 13.72 677.53 4.78 672.43
31-Aug-06 690.07 6.40 685.43 2.40 683.09 13.92 677.33 4.82 672.3928-Sep-06 690.05 6.28 685.55 2.60 682.89 14.03 677.22 4.69 672.5230-Oct-06 690.00 6.50 685.33 2.69 682.80 14.08 677.17 4.70 672.5129-Nov-06 690.25 6.23 685.60 2.77 682.72 14.02 677.23 4.45 672.7629-Dec-06 690.25 5.85 685.98 2.41 683.08 13.80 677.45 4.38 672.8329-Jan-07 690.25 5.68 686.15 2.36 683.13 13.76 677.49 4.26 672.9525-Feb-07 690.25 5.57 686.26 2.28 683.21 13.56 677.69 4.20 673.0128-Mar-07 690.25 5.52 686.31 2.10 683.39 13.55 677.70 4.30 672.9129-Apr-07 690.40 5.27 686.56 1.86 683.63 13.25 678.00 4.18 673.0326-May-07 690.28 5.23 686.60 1.90 683.59 13.29 677.96 4.50 672.7126-Jun-07 690.03 5.45 686.38 2.10 683.39 13.53 677.72 4.49 672.7226-Jul-07 690.03 5.45 686.38 2.08 683.41 13.57 677.68 4.60 672.61
28-Jan-08 690.00 5.50 686.33 2.34 683.15 13.60 677.65 4.24 672.9726-Feb-08 690.00 5.56 686.27 2.20 683.29 13.40 677.85 4.20 673.0128-Mar-08 690.30 5.56 686.27 2.08 683.41 13.20 678.05 4.30 672.9127-Apr-08 690.00 5.40 686.43 1.90 683.59 13.45 677.80 4.12 673.0928-May-08 690.50 5.40 686.43 1.60 683.89 13.10 678.15 4.25 672.9625-Jun-08 690.00 5.50 686.33 2.10 683.39 13.50 677.75 4.49 672.7226-Jul-08 690.00 5.40 686.43 2.08 683.41 13.40 677.85 4.40 672.81
25-Aug-08 690.30 5.38 686.45 1.96 683.53 13.42 677.83 4.45 672.765-Sep-08 690.00 5.92 685.91 2.32 683.17 13.30 677.95 4.42 672.7927-Oct-08 690.00 5.87 685.96 2.28 683.21 13.20 678.05 4.40 672.8128-Nov-08 690.20 6.22 685.61 2.76 682.73 14.02 677.23 4.45 672.7623-Dec-08 690.25 5.95 685.88 2.41 683.08 13.80 677.45 4.38 672.83
26-Jan-09 690.20 5.15 686.68 1.90 683.59 13.50 677.75 4.34 672.8728-Feb-09 690.25 5.57 686.26 2.20 683.29 13.56 677.69 4.20 673.0126-Mar-09 690.25 5.52 686.31 2.10 683.39 13.55 677.70 4.30 672.9124-Apr-09 690.20 5.40 686.43 2.80 682.69 13.20 678.05 4.20 673.0125-May-09 690.10 5.38 686.45 2.20 683.29 13.30 677.95 4.25 672.9625-Jun-09 689.00 5.39 686.44 2.10 683.39 13.10 678.15 4.23 672.9825-Jul-09 688.40 5.35 686.48 2.10 683.39 13.26 677.99 4.20 673.01
24-Aug-09 690.10 8.20 683.63 2.80 682.69 14.00 677.25 5.10 672.1125-Sep-09 690.01 8.00 683.83 2.60 682.89 14.03 677.22 4.69 672.5223-Oct-09 690.03 6.50 685.33 2.58 682.91 14.00 677.25 4.60 672.6121-Nov-09 690.00 6.23 685.60 2.41 683.08 14.02 677.23 4.45 672.7621-Dec-09 690.00 5.95 685.88 2.40 683.09 13.80 677.45 4.38 672.83
24-Jan-11 690.00 5.94 685.89 2.30 683.19 13.25 678.00 4.38 672.8321-Feb-11 690.00 5.15 686.68 2.10 683.39 13.50 677.75 4.30 672.9121-Mar-11 690.00 5.30 686.53 2.12 683.37 13.52 677.73 4.40 672.8120-Apr-11 690.00 5.45 686.38 2.10 683.39 13.57 677.68 4.60 672.6122-May-11 690.00 5.32 686.51 2.12 683.37 13.56 677.69 4.42 672.7922-Jun-11 690.00 5.28 686.55 2.10 683.39 13.50 677.75 4.40 672.819-Jul-11 690.00 5.10 686.73 2.35 683.14 12.90 678.35 4.40 672.81
24-Aug-11 690.00 5.80 686.03 2.20 683.29 12.00 679.25 4.39 672.8220-Sep-11 690.00 5.90 685.93 2.20 683.29 12.15 679.10 4.38 672.8324-Oct-11 690.00 5.60 686.23 2.20 683.29 12.14 679.11 4.36 672.8522-Nov-11 690.00 6.01 685.82 2.30 683.19 13.00 678.25 4.36 672.8520-Dec-11 690.00 6.00 685.83 2.28 683.21 13.02 678.23 4.38 672.83
24-Jan-12 690.20 5.15 686.68 1.90 683.59 13.50 677.75 4.34 672.8728-Feb-12 690.25 5.57 686.26 2.20 683.29 13.56 677.69 4.20 673.0126-Mar-12 690.25 5.52 686.31 2.10 683.39 13.55 677.70 4.30 672.9124-Apr-12 690.20 5.40 686.43 2.80 682.69 13.20 678.05 4.20 673.0125-May-12 690.10 5.38 686.45 2.20 683.29 13.30 677.95 4.25 672.9625-Jun-12 690.30 5.39 686.44 2.10 683.39 13.10 678.15 4.23 672.9825-Jul-12 688.40 5.35 686.48 2.10 683.39 13.26 677.99 4.20 673.01
24-Aug-12 690.00 8.20 683.63 2.80 682.69 14.00 677.25 5.10 672.1125-Sep-12 690.00 8.00 683.83 2.60 682.89 14.03 677.22 4.69 672.5223-Oct-12 690.03 6.50 685.33 2.58 682.91 14.00 677.25 4.60 672.6110-Nov-12 690.00 6.10 685.73 2.10 683.39 13.21 678.04 4.30 672.9115-Dec-12 690.00 5.40 686.43 2.80 682.69 13.20 678.05 4.20 673.01
22-Jan-13 5.30 686.53 2.10 683.39 13.20 678.05 4.36 672.8526-Feb-13 5.12 686.71 2.10 683.39 13.48 677.77 4.25 672.9627-Mar-13 5.30 686.53 2.15 683.34 14.13 677.12 4.39 672.8224-Apr-13 690.00 5.35 686.48 2.12 683.37 13.57 677.68 4.40 672.8122-May-13 690.00 5.32 686.51 2.12 683.37 13.58 677.67 4.40 672.8121-Jun-13 690.00 5.28 686.55 2.80 682.69 13.10 678.15 4.28 672.9320-Jul-13 688.10 5.28 686.55 2.60 682.89 13.80 677.45 4.18 673.03
25-Aug-13 690.30 5.26 686.57 1.96 683.53 13.41 677.84 4.30 672.9122-Sep-13 5.90 685.93 2.30 683.19 13.30 677.95 4.40 672.8120-Oct-13 690.10 5.61 686.22 2.11 683.38 14.00 677.25 4.33 672.8828-Nov-13 5.22 686.61 2.15 683.34 14.00 677.25 4.33 672.8815-Dec-13 5.20 686.63 1.83 683.66 13.53 677.72 4.35 672.86
20-Jan-14 5.12 686.71 1.90 683.59 13.46 677.79 4.30 672.9118-Feb-14 5.13 686.70 2.05 683.44 13.47 677.78 4.26 672.9528-Mar-14 5.15 686.68 2.10 683.39 13.47 677.78 4.30 672.9120-Apr-14 5.35 686.48 2.12 683.37 13.57 677.68 4.40 672.8118-May-14 690.00 5.40 686.43 2.15 683.34 13.54 677.71 4.42 672.7920-Jun-14 690.00 5.50 686.33 1.98 683.51 13.50 677.75 4.30 672.911-Jul-14 690.00 5.30 686.53 2.08 683.41 13.40 677.85 4.40 672.81
24-Aug-14 8.20 683.63 2.70 682.79 14.00 677.25 5.10 672.1114-Sep-14 690.00 5.09 686.74 4.05 681.44 13.05 678.20 2.65 674.5620-Oct-14 690.00 5.00 686.83 4.00 681.49 12.02 679.23 2.60 674.6120-Nov-14 - - 12.05 679.20 4.04 673.17
Note: Top of casing (TOC) elevations based on those reported in 1997 Annual Review - Unable to measure 2005-2009 data from 2009 KCB Annual Inspection Report
Italics - Estimated values 2011-2014 data from Gordon and Maureen Markstrom
Piezometric Levels
DateNorth Dam Upper West Dam Upper West Dam LowerNorth Dam Lower

Barkerville Gold Mines Ltd. Goldstream Tailings Storage Facility
Background Report for MEM Response Letter
150630R-Goldstream MEM Background Report
M09967A03.730 June 2015
APPENDIX V 2014 Site Photographs
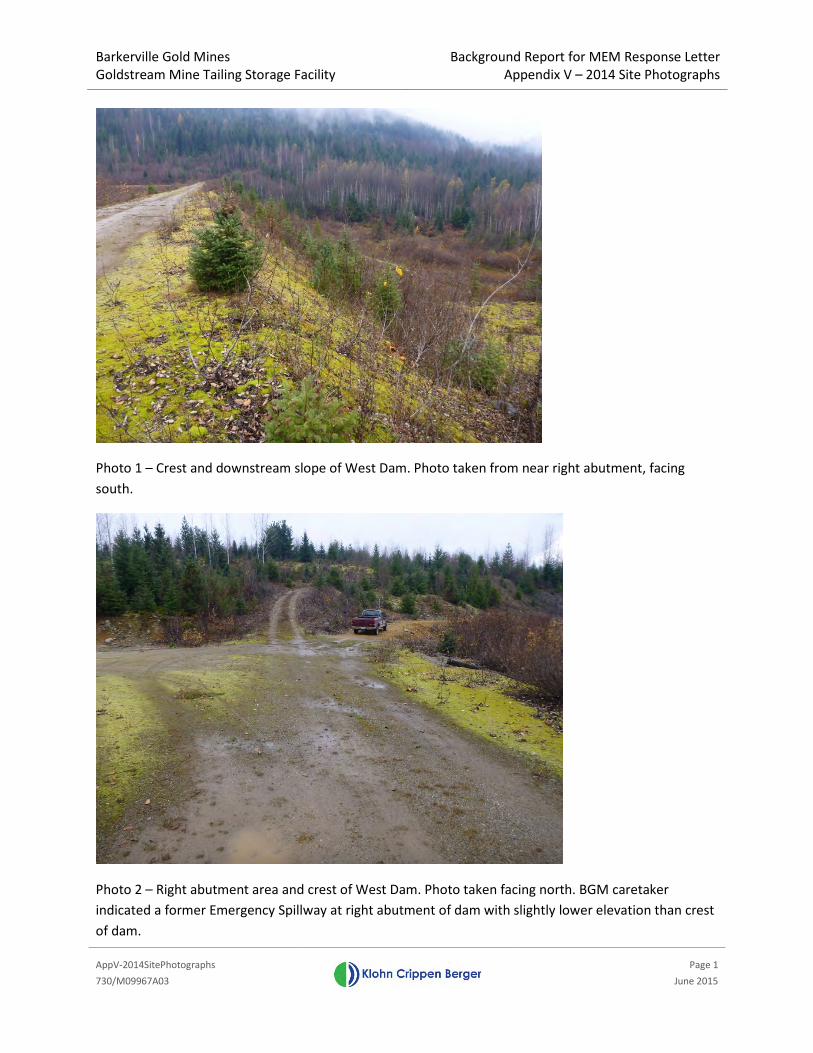
Barkerville Gold Mines Goldstream Mine Tailing Storage Facility
Background Report for MEM Response Letter Appendix V – 2014 Site Photographs
AppV-2014SitePhotographs
Page 1
730/M09967A03 June 2015
Photo 1 – Crest and downstream slope of West Dam. Photo taken from near right abutment, facing south.
Photo 2 – Right abutment area and crest of West Dam. Photo taken facing north. BGM caretaker indicated a former Emergency Spillway at right abutment of dam with slightly lower elevation than crest of dam.

Barkerville Gold Mines Goldstream Mine Tailing Storage Facility
Background Report for MEM Response Letter Appendix V – 2014 Site Photographs
AppV-2014SitePhotographs
Page 2
730/M09967A03 June 2015
Photo 3 – Crest and downstream slope of West Dam. Photo taken from near left abutment, facing north.
Photo 4 – Crest and upstream slope of West Dam. Photo taken near right abutment, facing south.

Barkerville Gold Mines Goldstream Mine Tailing Storage Facility
Background Report for MEM Response Letter Appendix V – 2014 Site Photographs
AppV-2014SitePhotographs
Page 3
730/M09967A03 June 2015
Photo 5 – Crest and upstream slope of West Dam. Photo taken from near mid-point of crest, facing south. Note deteriorated wood structure formerly used to support tailings discharge in middle of TSF.
Photo 6 – Downstream slope, right abutment and toe area viewed from crest of West Dam. Photo taken from mid-point of dam, facing north northwest. Note bench at mid-slope on downstream slope of dam.
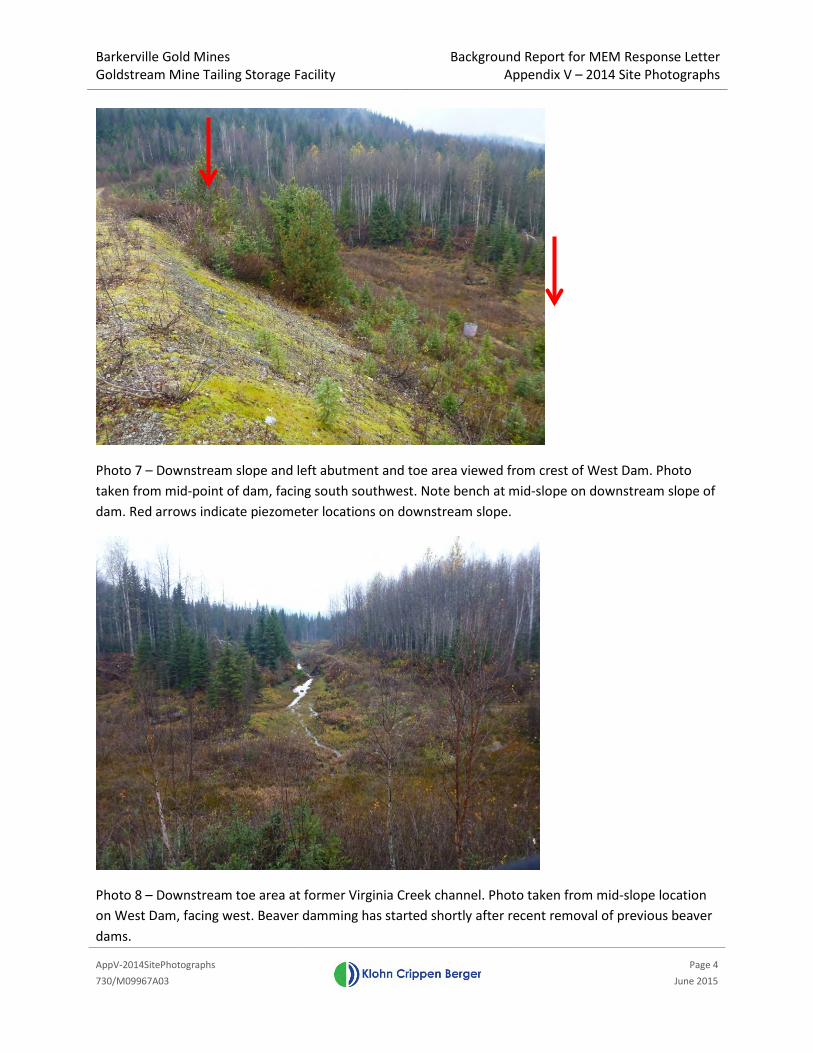
Barkerville Gold Mines Goldstream Mine Tailing Storage Facility
Background Report for MEM Response Letter Appendix V – 2014 Site Photographs
AppV-2014SitePhotographs
Page 4
730/M09967A03 June 2015
Photo 7 – Downstream slope and left abutment and toe area viewed from crest of West Dam. Photo taken from mid-point of dam, facing south southwest. Note bench at mid-slope on downstream slope of dam. Red arrows indicate piezometer locations on downstream slope.
Photo 8 – Downstream toe area at former Virginia Creek channel. Photo taken from mid-slope location on West Dam, facing west. Beaver damming has started shortly after recent removal of previous beaver dams.

Barkerville Gold Mines Goldstream Mine Tailing Storage Facility
Background Report for MEM Response Letter Appendix V – 2014 Site Photographs
AppV-2014SitePhotographs
Page 5
730/M09967A03 June 2015
Photo 9 - Access ramp on downstream slope of West Dam, near right abutment. Photo taken from near right abutment, facing south. Note tree and shrub growth on downstream slope of dam.
Photo 10 – Mid slope bench on downstream slope of West Dam. Photo taken at mid point of dam, facing north.

Barkerville Gold Mines Goldstream Mine Tailing Storage Facility
Background Report for MEM Response Letter Appendix V – 2014 Site Photographs
AppV-2014SitePhotographs
Page 6
730/M09967A03 June 2015
Photo 11 – Lower portion of slope and mid-slope bench of West Dam. Photo taken facing south west.
Photo 12 – Mid slope bench on West Dam. Photo taken from left abutment, facing north.

Barkerville Gold Mines Goldstream Mine Tailing Storage Facility
Background Report for MEM Response Letter Appendix V – 2014 Site Photographs
AppV-2014SitePhotographs
Page 7
730/M09967A03 June 2015
Photo 13 – Seepage area on lower portion of right abutment fill – native ground contact of West Dam. Photo taken facing north east. Note density of vegetation and hydrophilic vegetation.
Photo 14 – Downstream toe area of West Dam. Photo taken from right abutment toe area, facing south. Note density of shrubs (willows, alders) at toe of dam.
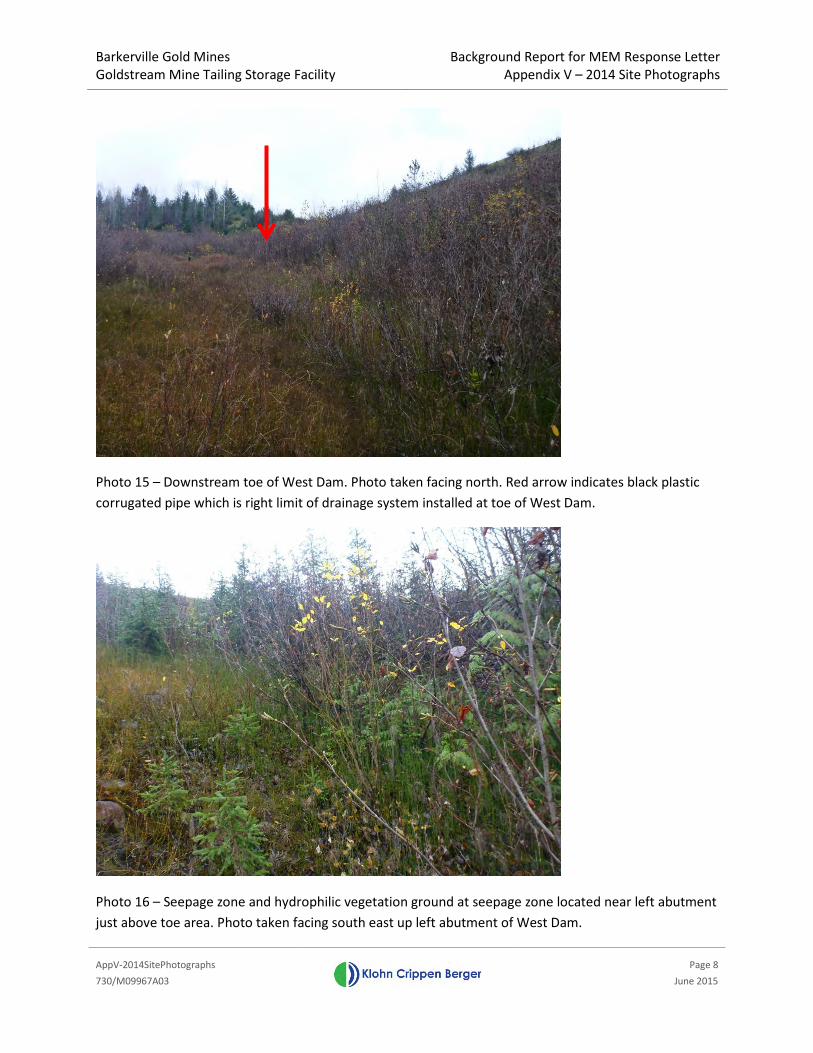
Barkerville Gold Mines Goldstream Mine Tailing Storage Facility
Background Report for MEM Response Letter Appendix V – 2014 Site Photographs
AppV-2014SitePhotographs
Page 8
730/M09967A03 June 2015
Photo 15 – Downstream toe of West Dam. Photo taken facing north. Red arrow indicates black plastic corrugated pipe which is right limit of drainage system installed at toe of West Dam.
Photo 16 – Seepage zone and hydrophilic vegetation ground at seepage zone located near left abutment just above toe area. Photo taken facing south east up left abutment of West Dam.

Barkerville Gold Mines Goldstream Mine Tailing Storage Facility
Background Report for MEM Response Letter Appendix V – 2014 Site Photographs
AppV-2014SitePhotographs
Page 9
730/M09967A03 June 2015
Photo 17 – Crest and upstream slope of North Dam. Photo taken near right abutment facing west north west.
Photo 18 – Crest of North Dam. Photo taken near right “elbow” in dam, facing west.

Barkerville Gold Mines Goldstream Mine Tailing Storage Facility
Background Report for MEM Response Letter Appendix V – 2014 Site Photographs
AppV-2014SitePhotographs
Page 10
730/M09967A03 June 2015
Photo 19 – Crest and upstream slope of North Dam. Photo taken near left abutment facing east north east.
Photo 20 – Downstream slope of North Dam. Photo taken from mid-point of dam crest facing east.

Barkerville Gold Mines Goldstream Mine Tailing Storage Facility
Background Report for MEM Response Letter Appendix V – 2014 Site Photographs
AppV-2014SitePhotographs
Page 11
730/M09967A03 June 2015
Photo 21 – Damaged (but still functioning) piezometer at crest of North Dam. Corrugated steel pipe protection was relocated during routine maintenance and red arrow indicates accidently damaged piezometer. Photo take facing north west.
Photo 22 – Crest and downstream slope above mid-slope bench of North Dam. Photo taken from mid-point of dam crest, facing west.

Barkerville Gold Mines Goldstream Mine Tailing Storage Facility
Background Report for MEM Response Letter Appendix V – 2014 Site Photographs
AppV-2014SitePhotographs
Page 12
730/M09967A03 June 2015
Photo 23 – Downstream slope of North Dam near left abutment viewed from mid-slope bench. Photo taken facing south west.
Photo 24 – Downstream slope of North Dam viewed from mid-slope bench. Photo taken facing east.

Barkerville Gold Mines Goldstream Mine Tailing Storage Facility
Background Report for MEM Response Letter Appendix V – 2014 Site Photographs
AppV-2014SitePhotographs
Page 13
730/M09967A03 June 2015
Photo 25 – Downstream slope of North Dam viewed from mid-slope bench at approximate mid-point of dam. Photo taken facing east.
Photo 26 – Downstream toe of North Dam near right abutment. Photo taken facing west. Note ponded water at toe and dense vegetation at downstream toe of dam.

Barkerville Gold Mines Goldstream Mine Tailing Storage Facility
Background Report for MEM Response Letter Appendix V – 2014 Site Photographs
AppV-2014SitePhotographs
Page 14
730/M09967A03 June 2015
Photo 27 – Downstream toe of North Dam near right abutment. Photo taken facing east.
Photo 28 – Turbid water plume at base of pond of water at downstream toe of North Dam. Pond located at approximately 50 m from right elbow of dam. Photo taken facing northwest.

Barkerville Gold Mines Goldstream Mine Tailing Storage Facility
Background Report for MEM Response Letter Appendix V – 2014 Site Photographs
AppV-2014SitePhotographs
Page 15
730/M09967A03 June 2015
Photo 29 – Emergency Spillway control section. Photo taken facing north east. Note accumulation of debris at control section due to beaver activity and stockpile of previous beaver dam materials to right of control section.
Photo 30 – Approach channel upstream of Emergency Spillway control section. Photo taken facing north west.

Barkerville Gold Mines Goldstream Mine Tailing Storage Facility
Background Report for MEM Response Letter Appendix V – 2014 Site Photographs
AppV-2014SitePhotographs
Page 16
730/M09967A03 June 2015
Photo 31 – Emergency Spillway channel downstream of control section. Photo taken facing north east.
Photo 32 – East Diversion ditch near start of ditch. Photo taken facing south east.

Barkerville Gold Mines Goldstream Mine Tailing Storage Facility
Background Report for MEM Response Letter Appendix V – 2014 Site Photographs
AppV-2014SitePhotographs
Page 17
730/M09967A03 June 2015
Photo 33 – Confluence of tributary stream and East Diversion ditch. Photo taken facing south. Note alluvium building up in diversion ditch.
Photo 34 – East Diversion ditch with water backed up due to beaver damming. Photo taken facing east.
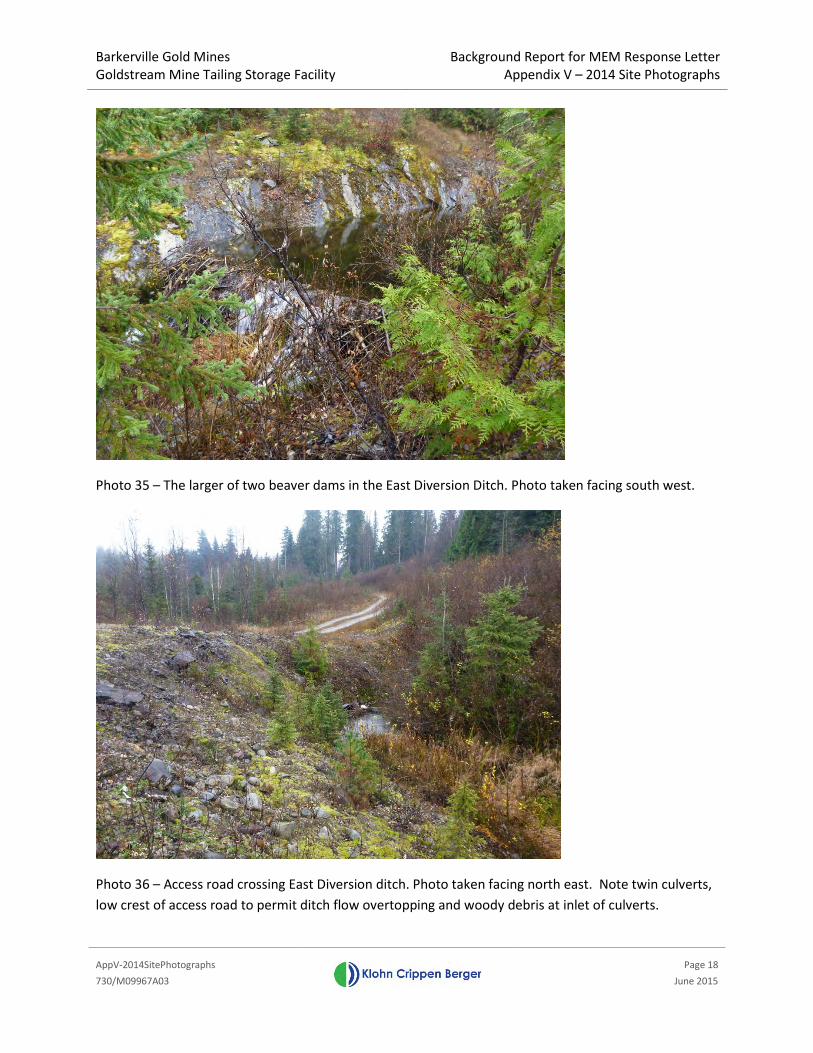
Barkerville Gold Mines Goldstream Mine Tailing Storage Facility
Background Report for MEM Response Letter Appendix V – 2014 Site Photographs
AppV-2014SitePhotographs
Page 18
730/M09967A03 June 2015
Photo 35 – The larger of two beaver dams in the East Diversion Ditch. Photo taken facing south west.
Photo 36 – Access road crossing East Diversion ditch. Photo taken facing north east. Note twin culverts, low crest of access road to permit ditch flow overtopping and woody debris at inlet of culverts.

Barkerville Gold Mines Goldstream Mine Tailing Storage Facility
Background Report for MEM Response Letter Appendix V – 2014 Site Photographs
AppV-2014SitePhotographs
Page 19
730/M09967A03 June 2015
Photo 37 – Virginia Creek Diversion Ditch upstream of south TSF access road. Photo taken facing south east. Note willows/alders growing in channel.
Photo 38 – Inlet to Virginia Creek Diversion Ditch culvert crossing access road to south of TSF. Photo taken facing north west. Note density of willows/alders at inet of culvert.

Barkerville Gold Mines Goldstream Mine Tailing Storage Facility
Background Report for MEM Response Letter Appendix V – 2014 Site Photographs
AppV-2014SitePhotographs
Page 20
730/M09967A03 June 2015
Photo 39 – Field book shows approximate location of Virginia Creek culvert crossing access road to West Dam at left abutment of West Dam. Photo taken facing north east.

Barkerville Gold Mines Ltd. Goldstream Tailings Storage Facility
Background Report for MEM Response Letter
150630R-Goldstream MEM Background Report
M09967A03.730 June 2015
APPENDIX VI 1984 Construction Records for Blanket Filter


