barley qulaity and grain size homogenity for malting: voulme … · · 2014-03-18project report...
TRANSCRIPT

PPRROOJJEECCTT RREEPPOORRTT NNoo.. 332200
BARLEY QUALITY AND GRAIN SIZE HOMOGENEITY FOR MALTING:
VOLUME I: AGRONOMIC EFFECTS ON VARIETIES
VOLUME II: ASSESSMENT AND CONTROL
SEPTEMBER 2003 Price £5.25

PROJECT REPORT No. 320 BARLEY QUALITY AND GRAIN SIZE HOMOGENEITY
FOR MALTING:
VOLUME I: AGRONOMIC EFFECTS ON VARIETIES
By
A WADE1 and M A FROMENT2 1ADAS Rosemaund, Preston Wynne, Wynne, Hereford HR1 3PG
2Formerly of ADAS Bridgets, Martyr Worthy, Winchester, Hampshire, SO21 1AP
Volume I is the final report of a 34-month project that started in July 2001. The research was
funded by a grant of £149,345 from HGCA (project no. 2306).
VOLUME II: ASSESSMENT AND CONTROL
By
R MULLER Brewing Research International,
Lyttel Hall, Coopers Hill Road, Redhill, Surrey RY1 4HY
Volume II is the final report of a 36-month project that started in July 2001. The research was
funded by a grant of £128,000 from HGCA (project no. 2294).
The Home-Grown Cereals Authority (HGCA) has provided funding for this project but has not conducted the research or written this report. While the authors have worked on the best information available to them, neither HGCA nor the authors shall in any event be liable for any loss, damage or injury howsoever suffered directly or indirectly in relation to the report or the research on which it is based. Reference herein to trade names and proprietary products without stating that they are protected does not imply that they may be regarded as unprotected and thus free for general use. No endorsement of named products is intended nor is it any criticism implied of other alternative, but unnamed, products.

Joint abstract covering Project Report No. 120, Volumes I and II
Homogeneity, a measure of grain uniformity, is important for malting and brewing performance and is of increasing interest to maltsters who have to produce a homogeneous malt. The aim of this project was to investigate how barley and malt homogeneity are affected and could be improved by, agronomic management and malting process. The work was conducted at two sites over three years. Field trials (Volume I of Project Report No. 120) The influences of barley variety, nitrogen application, seed rate, fungicide treatment and sowing date on barley properties were examined by ADAS. Malting trials (Volume II of Project Report No. 120) The grain produced in the field trials was passed to Brewing Research International for malting. The influence of the malting process (both commercial and laboratory) on malt homogeneity was then examined. Reducing plant density significantly increased grain size and, possibly, grain size distribution. Grain size has a large influence on the homogeneity of a sample of barley. Seed rate may therefore be a practical way of agronomically influencing homogeneity. Grain nitrogen also increased at reduced plant densities. This effect was greater than that of variety and should be taken into consideration to achieve malting specification. Fertiliser nitrogen rate and fungicide programme affected grain size by altering crop canopy size and duration and also influenced homogeneity. Nitrogen rate effects on grain nitrogen and thus endosperm structure are a major influence on homogeneity. There is a need to balance use of these agronomic treatments for homogeneity whilst aiming to optimise yield. The main factors influencing the homogeneity of the malt were damage to grain, endosperm structure of the grain and the corn size distribution. Commercial malting plants did not have a major effect of malt homogeneity. The main factor influencing the homogeneity of malt was the quality of the barley and the way it was treated in the field. The three key results found when malting grain obtained from the field trials were:
• a significant influence of the seed rate on the corn size distribution (mentioned above),
• a significant influence of nitrogen application on the endosperm structure of the grain (by LTm),
• a significant influence of variety on endosperm structure, corn size distribution and on homogeneity.
Treatments in the commercial malting plant had much less influence than did agronomic factors. This suggests that there are opportunities to grow malting barley under agronomic management to increase homogeneity. However, as such management regimes may not necessarily optimise output for the grower, premiums would have to be set to encourage their adoption.

Contents
Page
Abstract 1
Summary
Introduction 2
Aims and objectives 2
Methods 2
Measurements 3
Key results and conclusions 4
Implications 11
Technical detail
Introduction 12
Appendix 1: Seed rate x Variety interaction 14
Appendix 2: Seed rate x Nitrogen/fungicide interaction 28
Appendix 3: Variety typing 48
Appendix 4: Sowing date x Variety interaction 53
Appendix 5: Image analysis assessments 57

1
Abstract
Barley homogeneity, a measure of grain lot uniformity, is important for malting and brewing
performance and is of increasing interest to maltsters who have to produce a homogeneous
malt sample. The aim of this project was to investigate how barley homogeneity was affected
and could be improved by, agronomic management.
.
Four field experiments were set-up at three sites in three years (2000, 2001 and 2002).
Experiment 1: four varieties at five seed rates in 2000-02.
Experiment 2: three nitrogen and three fungicide treatments with one variety at two seed
rates in 2000-01.
Experiment 3: thirteen varieties at two sites in 2002.
Experiment 4: seven varieties at two sowing dates in 2002.
Spring barley compensates for reduced plant population similarly to winter wheat. Increases
in tiller number, ear number per plant and grain number were all recorded at reduced plant
densities. However, full compensation to maintain yield at low plant densities was not
achieved. Hence, economic optimum seed rates for spring barley cannot be reduced as much
as is possible with wheat.
Reducing plant density significantly increased grain size and, possibly, grain size distribution.
Grain size has a large influence on the homogeneity of a sample of barley. Seed rate may
therefore be a practical way of agronomically influencing homogeneity. Grain nitrogen also
increased at reduced plant densities. This effect was greater than that of variety and should be
taken into consideration to achieve malting specification.
Fertiliser nitrogen rate and fungicide programme affected grain size by altering crop canopy
size and duration and also influenced homogeneity. Nitrogen rate effects on grain nitrogen
and thus endosperm structure are a major influence on homogeneity. There is a need to
balance use of these agronomic treatments for homogeneity whilst aiming to optimise yield.
Results suggest that there are opportunities to grow malting barley under agronomic
management to increase homogeneity. However, as such management regimes may not
necessarily optimise output for the grower, premiums would have to be set to encourage their
adoption.

2
Summary
Introduction
Barley homogeneity is a measure of the uniformity of grains in a sample of barley. A number
of grain properties are thought to influence homogeneity. Grain size, texture (mealiness and
steeliness) and germinability (rate and evenness of germination) are considered to be most
important. The homogeneity of barley is important for malting and brewing performance and
thus is of increasing interest to processors. Poor homogeneity is often masked as analyses are
carried out on milled samples of large numbers of grains. This variation between grains can
lead to processing difficulties and a less uniform malt than is desirable for optimal brewing
performance.
The aim of this project was to investigate the agronomic manipulation of key crop factors,
such as tiller number and ear size that were most likely to influence homogeneity and
therefore could be employed by growers to increase the homogeneity of their malting barley.
A suite of field experiments that provided treatments with a ‘stretch’ in environmental and
management regimes were investigated at three sites over three years.
Aims and Objectives
Main aim:
1. To optimise barley homogeneity through variety-specific agronomic manipulation.
Specific Objectives:
1. To determine the major agronomic factors affecting homogeneity of barley samples
through effects on tiller number, crop canopy, ear size and individual grain weight.
2. To develop understanding of the genetic influence of current and future varieties on
tillering ability, source:sink relationships and variation in grain quality parameters.
3. To apply this understanding for manipulating crop performance and growth in the
management of future varietal types.
4. To provide malting barley grain of known provenance for homogeneity evaluation by BRi.
Methods
In each of three years, fully randomised and replicated field trials were set up at three sites. A
site at ADAS Bridgets, Martyr Worthy, Winchester, Hampshire was used in 2000 and 2001
harvest years. ADAS Terrington, Terrington St.Clement, King’s Lynn, Norfolk was used in
2002. A west of England site at White House Farm, Sellack, Ross-on-Wye was used in 2000
and at ADAS Rosemaund, Preston Wynne, Hereford in 2001 and 2002. A site at plant
breeders New Farm Crops, Market Stainton, Lincolnshire was used in all three years.
At all sites in all years plots were drilled with an ‘Oyjord type’ tractor-mounted seed drill.
Plot dimensions were 2m wide by 24m long at the ADAS sites and 1.5m wide by 10m long at

3
Syngenta seeds. Other than the experimental treatments described crops were grown using
standard rates of agrochemicals and fertilisers with an aim to maintain undisturbed and
healthy crop growth.
Experiment 1: Variety x Seed rate
Four varieties (Optic, Chariot, Cellar and Tavern), which represented the leading
commercially available varieties at the time, were chosen. These varieties were sown at five
seed rates (50, 100, 200, 400 and 800 seeds m-²) in a two-way factorial design of variety and
seed rate replicated three times.
Experiment 2: Seedrate x nitrogen/fungicide
A single variety Optic was sown at two seed rates 100 and 400 seeds m-2 at three sites in 2000
(Ross-on-Wye, Bridgets and NFC) and 2001 (Rosemaund, Bridgets and NFC). Nitrogen
treatments with rates of prilled ammonium nitrate of 50, 100 and 150 kg/ha were applied.
Three fungicide treatment programmes were used:
1. GS30/31 Amistar Pro 2.0 l/ha plus Unix 0.67 kg/ha
2. GS30/31 Opus 1.0 l/ha plus Corbel 0.5 l/ha
3. GS30/31 Amistar Pro 2.0 l/ha plus Unix 0.67 kg/ha and GS45-59 Amistar Pro 2.0 l/ha
The experimental design was a fully randomised three-way factorial replicated three times.
Experiment 3: Variety typing
At two sites (Rosemaund and NFC) in 2002 thirteen varieties were sown at a standard seed
rate (400 seeds m-2). The varieties evaluated were Optic, Chariot, Cellar, Tavern, Chalice,
County, Pewter, Static, Colston, Cocktail, Vortex, Novello and Sebastien. The varieties were
fully randomised in each block and replicated three times.
Experiment 4: Sowing date x Variety
At a single site (Terrington) in 2002 seven varieties were sown at a standard seed rate (400
seeds m-2) on two sowing dates: a normal sowing on 18 February 2002 and a late sowing of
10 April 2002. The seven varieties evaluated were Optic, Cellar, Tavern, Chalice, County,
Pewter and Static. The experimental design was a split plot plus factorial with sowing date as
main plots and variety as fully randomised sub-plots.
Measurements
At the ADAS sites crop establishment was assessed pre-tillering with the number of plants
counted in 10m x 1m row lengths per plot. Weekly measurements of light interception with
ceptometers (Sunfleck meters) allowed canopy development to be monitored through the

4
growing season. Crop growth assessed as both dry matter and green area index measurements
were taken when 50% of all the main shoots reached mid-anthesis (GS65). An assessment of
the components of yield was made on samples taken immediately pre-harvest. Grain yield
was measured using a plot combine from a harvest area of 10m by 2m. Grain was analysed
for moisture content and specific weight using a GAC 2000 grain analysis computer (Dickey-
John corporation) and thousand-grain weight measured using a numigral grain counter.
Additional image analysis assessments of grain size distribution were done on a sub-set of
samples (see Appendix 5 for full methodology).
At NFC crop establishment was assessed pre-tillering with the number of plants counted in
10m x 1m row lengths per plot. Grain yield was measured using a plot combine from a
harvest area of 10m by 1.5m. Grain was analysed for moisture content, specific weight,
sieving fractions and grain nitrogen %.
Key results and conclusions
Plant population
The number of plants established from a given seed rate varied between sites and years, plant
densities ranged from 30 to 721 plants m-2 from the seed rates used of 50 to 800 seeds m-2.
Plant populations were lowest on a silty clay loam over chalk soil at Bridgets, Hampshire in
2000 and 2001 and highest in all three years on a loamy clay soil at NFC, Lincolnshire. Plant
establishment declined with increasing seed rate with on average a 3.4% decline for every 100
seeds/m2 increase in seed rate. This concurred with findings in wheat (Spink et al, 2000)
although on average the rate of decline was less in spring barley. However, there was a
greater variation in the magnitude of the effect than in wheat; establishment ranged from a
high of 100% at 50 seeds to a low of 43% at 800 seeds. This may indicate that a spring-drilled
barley crop’s establishment may be more influenced by soil type, seedbed conditions and
prevailing weather conditions post drilling than a winter-drilled cereal.
Plant compensation for reduced plant densities
Tiller production primarily through extension of the duration of tillering has been shown to be
a key mechanism by which plants compensate for reduced plant densities. Fertile shoot counts
assessed from a destructive growth analysis sample at mid-anthesis showed that a 3.5 fold
difference in plant density had been reduced to a 1.5 fold difference in shoot number by
increased tiller production. Fertile shoot numbers of 439 and 684 per m2 had been produced
from 76 and 264 plants per m2 respectively. As well as greater tiller production at reduced
plant densities the size of the shoots in both dry matter and green area terms was increased.
Green area and dry matter per shoot were increased on average by 24 and 32% respectively.
5
Variety effects showed that Tavern had a greater tiller capacity than the other three varieties,
which produced similar numbers of tillers.
This compensation was maintained through to harvest with the 1.5 fold difference further
reduced to a 1.3 fold difference in final ear numbers indicating a small increase in tiller
survival. At the extremes of plant density (470 to 43 plants m-2) an 11-fold difference in
established plant number had been reduced to 2-fold difference in final ear number. Varietal
differences in ear numbers confirmed what was observed in shoot numbers earlier in the
season with the varieties ranked Tavern > Cellar > Chariot > Optic.
Ear number per plant calculated from final ear number and established plant population
showed that on average 10 ears per plant were produced from low plant densities compared to
1.8 at the highest. In wheat up to 20 ears per plant were produced from reduced plant
densities. The smaller response in spring barley may be symptomatic of the shorter time
period available for tiller production in a spring-drilled crop.
Significant increases in grain number per ear as seed rate was reduced were seen in three site
seasons. In 2000, 20% more grains per ear were produced as seed rate was reduced from 400
to 100 seeds and in 2001 an increase of 30% from 800 to 100 seeds. The increases, where
they occurred, were significantly less than that seen in wheat where increase up to 70% have
been recorded. This is because 2-row barleys have a determinate number of spikelets per
floret (1) so the only mechanism for increasing ear size is to increase the numbers of
spikelets. Wheat, however, has a determinate spikelet number but has the flexibility to
increase the floret number per spikelet and therefore a greater capacity to increase grain
number per ear. All of the varieties commonly grown for malting are 2-row barleys.
Yield response to reduced plant densities
Average yields ranged from 3.8 to 7.56 t/ha at Rosemaund in 2001 and NFC in 2000
respectively, showing considerable variation between sites and seasons. An initial rapid
increase in yield as seed rates increased was recorded which then slowed once 200 seeds m-2
(153 plants m-2) was reached, but in general continued to increase up to the highest seed rates.
In a number of site seasons Chariot in particular demonstrated the need for high seed rates for
optimum yield. In the majority of site seasons for the other varieties no significant increase in
yield was seen over and above 200 seeds m-2. Using the linear plus exponential curve fits and
a seed cost to grain price ratio of 3:1, economic optimum seed rates were estimated. Optima
ranged from 136 to 364 seeds m-2 or 81 to 328 plants m-2. The wide variation between sites,
seasons and varieties suggests that there is a greater risk in reducing seed rates in spring
barley. A significant proportion of the variation is accounted for by establishment suggesting

6
that soil conditions, seed bed quality and weather conditions immediately post-drilling are
also critical.
Effects of reduced plant densities on grain quality
Significant increases in grain size in response to reduced plant population were recorded in all
sites and seasons except Terrington in 2002. Grain size increased on average 11.5 % when
plant population was reduced from 470 to 43 plants m-2. In absolute terms this resulted in
thousand-grain weight increases from 4 to 9 g (figure 1.0). This is almost double that seen in
wheat, where average increases over the range of 16 to 340 plants m-2 were 3.2g.
y = -0.0123x + 51.979R2 = 0.2907
30
35
40
45
50
55
60
0 100 200 300 400 500 600
Plant density m2
TGW
g
Figure 1.0. Regression analysis to indicate the relationship between thousand grain weight (g)
and plant density (plants m2) in spring barley from five site seasons meaned across four
varieties.
This compensatory mechanism for reduced plant density may be the most important in terms
of influencing homogeneity for two reasons: firstly because of the magnitude of the increases
seen and secondly because of the importance of grain size in malting performance.

7
In five site seasons, the highest grain nitrogen contents were consistently produced from the
lowest seed rates with 50 seed m-2 on average 0.27%N higher than 800 seeds m-2. This seed
rate effect was double that seen between varieties where the lowest was Tavern and the
highest was Chariot at 1.54 and 1.68% respectively (figure 1.1).
Grain nitrogen is of critical importance to ensure malting specifications are met and to
increase saleability into a particular malting market. Malting barley growers select varieties
and manage the nitrogen and fungicide inputs carefully to ensure crops meet malting
specification and attract a premium. These results suggest that seed rate, and hence plant
population, should also be taken into consideration, as its effects are considerable.
1.01.11.21.31.41.51.61.71.81.92.0
50 100 200 400 800Seeds m-2
Gra
in n
itrog
en %
OpticChariotCellarTavern
Figure 1.1. Grain nitrogen content (%) from four varieties across a range of seed rates mean
of five site seasons.

8
Effects of nitrogen and fungicide
Nitrogen and fungicide effects on canopy size were seen from data collected from two sites
Rosemaund and Bridgets in 2000 and 2001 on the variety Optic. Increased fertiliser nitrogen
rate were seen resulted in significant increases in both leaf and total green area index (GAI)
and dry matter. On average, GAI was increased by 30 and 55 % from the 100 and 150 kg/ha
N treatments compared to the 50 kg/ha. Dry matter was increased by 17.8 and 20.6% from the
same two treatments. Strobilurin fungicide programmes increased GAI at mid-anthesis. On
average, compared to the triazole program, GAI was 9% larger at mid-anthesis from a single
application of strobilurin and 7.5% larger from a two-spray application.
These increases in crop size resulted in significant yield responses in all years to nitrogen. As
fertiliser nitrogen rate increased yield increased, for every 1 kg/ha of applied nitrogen there
was an increase of 15 kg of grain. Using a strobilurin fungicide programme increased yield in
all years. On average, there was a 3% yield benefit in using a strobilurin compared to triazole
in a single spray programme and 7% in using two sprays of a strobilurin. There was an
indication that this response to strobilurin was improved at higher nitrogen rates especially at
the more traditional light soil spring barley sites such as Bridgets in Hampshire on a loam soil
overlaying chalk (figure 1.4).
0
0.2
0.4
0.6
0.8
1
1.2
50 100 150Nitrogen rate kg/ha
t/ha
Single strobilurinSecond strobilurin
Figure 1.4. Yield responses in Optic to strobilurin fungicide programmes at three nitrogen
rates average of Bridgets in 2000 and 2001.

9
The importance of grain size in malting performance discussed in the malting section of this
report indicates that any manipulation through agronomy is of significance. Both nitrogen and
fungicide significantly affect thousand-grain weight (tgw) (figure 1.4). On average, increases
compared to the lowest N rate were 2.1 and 2.4% from the 100 and 150 kg/ha nitrogen
treatments. Using a strobilurin fungicide increased tgw in three years out of four. Using a
strobilurin instead of a triazole in a single spray programme increased tgw by 2% and in a
two-spray programme by 3.8% on average. Although the effects are less than that seen with
seed rate it demonstrates that careful consideration of a range of inputs will be needed if the
grower is going to grow malting barley for maximum homogeneity.
45
46
47
48
49
50
51
50 kg N 100 kg N 150 kg N
tgw
(g)
Triazole 31Strob 31Strob 31 & 45
Figure 1.4. Thousand grain weight (g) in Optic from three fungicide programmes at three
nitrogen rates average of four site years (Rosemaund, Bridgets 2000 and 2001)
Meeting the correct grain nitrogen specification is of critical importance to growers in order
for them to achieve a saleable product at a malting premium. The changes in the maltsters
requirements to higher grain nitrogen specifications in recent years means that the risk of over
shooting on grain nitrogen has lessened. This allows growers a greater opportunity to
maximise yield by increasing nitrogen rates. On average from the four site seasons of data
collected in this study for every 50kg/ha increase in fertiliser nitrogen a 0.075% increase in
grain nitrogen is seen. So the increases in yield with nitrogen rate would have to be balanced
with risk of missing the 1.6-1.8% grain nitrogen target. This would suggest that nitrogen

10
inputs of around 120-130 kg/ha would maximise yield without a high risk of producing grain
higher than 1.8%. However, it has been seen earlier that plant population has a significant
effect on grain nitrogen and this, along with soil type and soil mineral nitrogen reserves,
would have to also be taken into consideration. There was no significant evidence of yield
dilution effects of strobilurins on grain nitrogen (figure 1.5). The effect of nitrogen on
endosperm structure and thus homogeneity is discussed further in the malting section of this
report.
1.0
1.1
1.2
1.3
1.4
1.5
1.6
1.7
1.8
1.9
50 kg N 100 kg N 150 kg N
Gra
in N
%
Triazole 31Strob 31
Strob 31 & 45
Figure 1.5. Grain nitrogen (%) from three fungicide programmes at three nitrogen rates
average of four site years (Rosemaund, Bridgets 2000 and 2001)
Effects of sowing date
From the limited amount of data collected in this study there was an indication of significant
interaction between sowing date and variety in terms of crop growth. The significant
differences in crop growth seen did not result in significant interactions in terms of grain
yield. Further research would be needed across a wider range of sowing dates in order to
investigate these growth differences further and to assess the affect on ultimate grain yield
and quality.
Image analysis
Results from this analysis technique concurred with those found by more traditional
assessment methods such as thousand-grain weight. Increased grain area, perimeter, width

11
and length were seen as seed rate was reduced. Frequency distribution graphs of grain area
and width suggested that reducing seed rate had an adverse effect on grain size distribution,
with a less homogeneous sample produced at reduced seed rates. With further validation
against malt homogeneity and digital technology development of the technique, it may then
be able to be used as a rapid analysis method at the grain intake stage.
Implications
A main aim of this project was to identify whether agronomic factors can be used to
manipulate and optimise the homogeneity of barley grain. Results show that seed rate can be
used to manipulate grain size and possibly grain size distribution. This has been identified as a
key influence barley homogeneity. Seed rate also has a large effect on grain nitrogen, which is
also important in achieving homogeneous malt. Thus seed rate offers the grower one
relatively easy agronomic way of manipulating homogeneity and possibly saleability.
Nitrogen and choice of fungicide programme also have effects on grain size although to a
lesser extent than seed rate. These inputs also have larger beneficial effects on yield than seed
rate. Hence use of these inputs would have to be balanced with the effects of other agronomic
and quality factors such as yield optimisation and grain nitrogen. The conclusion of the
project forming Part II of this report on malt homogeneity, that how the crop is grown has a
much larger effect on homogeneity than malting processes offers the grower further
encouragement to grow for homogeneity. However, growing methods to produce the most
homogeneous malt may not always correspond to the highest output to the grower, so
premiums would have to be offered to encourage adoption by growers.
Further validation of the interaction of seed rate and fungicide programme in current and new
varieties would enable growers to ‘grow for homogeneity’ with greater confidence. It would
then be possible to set some graduated quality criteria for homogeneity, which would attract a
varying premium to incentivise growers to achieve a more homogeneous sample.

12
Technical detail
Introduction
The importance of further research into quality requirements relating to Barley homogeneity
was identified at the HGCA Malting Barley Workshop (Dr D Baxter, 29/30 June 1998).
Barley homogeneity is defined as the uniformity between grains in a sample of barley. It can
refer to numerous grain properties but those considered of most importance for malting are
grain size, texture (mealiness and steeliness) and germinability (rate and evenness of
germination). Homogeneity is an important parameter for malting and brewing performance
and is becoming of increasing interest amongst processors, as evidenced by a number of
recent publications in this area (Axcell, 1999; Home et al., 1999; Palmer, 1999).
Poor homogeneity is frequently overlooked because barley and malt analyses are carried out
on a milled sample from a large number of individual grains. Poor homogeneity masked in
this way can lead to processing difficulties for which the cause cannot be easily identified.
Variation between grains in a sample of barley is further exacerbated during the malting
process due to differences in grain hydration and rate of germination, thus leading to different
rates of modification. Malting factors such as uneven steep aeration and differential kiln
drying rates contribute further variation with the resultant malt being considerably less
uniform than is desirable for optimal brewing performance. Rapid malting programmes such
as are found in many modern malting plants means that greater emphasis must be placed on
the homogeneity of barley if a uniform sample of malt is to be produced.
The agronomic manipulation of the key crop factors, such as tiller number and ear size (grain
number/ear), thought most likely to have the most significant affect on homogeneity was the
main focus of the project. The hypotheses of how agronomic manipulation can affect these
factors are summarised in Table 1.

13
Table 1. Hypotheses on the effects of agronomic variables on tiller numbers
and ear size
Factor Effects on tillering Effects on ear size Variety type Varieties differ in economy of tillering due to genetic
makeup Grains/ear and individual grain weight strongly influenced by genetic factors
Seedrate High seedrates lead to higher ear numbers m² and greater intra plant competition
High seedrates can result in less grains/ear on average and lower individual seed weight Relationships not linear
Sowing date Early sowing date encourages additional tillers since the tiller production phase is prolonged
Early sowing resulting in more fertile tillers which can reduce grains/ear
Nitrogen/ fungicides
Greater plant available N maximises tillering. More N can increase survival of later tillers but usually small. Fungicides, by prolonging photosynthetic tissue increase tiller survival and duration of grain filling.
Fungicides can enhance grain fill, enhancing grain size and perhaps texture, mealiness:steeliness.
These hypotheses were investigated in a suite of field experiments at three sites over three
years. The field experiments were designed to ‘stretch’ environmental and management
regimes to provide a wide range of UK produced barley samples. The project therefore had
the main aim:
To optimise barley homogeneity through variety specific agronomic manipulation.
Optimising the balance between source and sink relationships in malting barley will maximise
yield of saleable, quality grain. An incorrect balance may lead to loss of potential yield as
shrivelled or smaller grains or poor homogeneity in malting performance. Work was carried
out in parallel with a study at Brewing Research International in which aspects of the malting
process of importance for malt homogeneity were examined (see Volume II of Project Report
No. 320).
Specific objectives were set to achieve the main aim:
To determine the major agronomic factors affecting homogeneity of barley samples
through effects on tiller number, crop canopy, ear size and individual grain weight.
To develop understanding of the genetic influence of current and future varieties on
tillering ability, source:sink relationships and variation in grain quality parameters.
To apply this understanding for manipulating crop performance and growth in the
management of future varietal types.
To provide malting barley grain of known provenance for homogeneity evaluation by
BRi.

14
Appendix 1
Variety x Seed rate Interaction experiments
Materials & Methods
In each of three years, fully randomised and replicated field trials were set up at three sites. A
site at ADAS Bridgets, Martyr Worthy, Winchester, Hampshire was used in 2000 and 2001
harvest years and was replaced by ADAS Terrington, Terrington St.Clement, King’s Lynn,
Norfolk in 2002. A west of England site at White House Farm, Sellack, Ross-on-Wye was
used in 2000 and at ADAS Rosemaund, Preston Wynne, Hereford in 2001 and 2002. A site at
plant breeders New Farm Crops (NFC, now part of Syngenta seeds) Market Stainton,
Lincolnshire was used in all three years.
The design was a two way factorial of variety and seedrate replicated three times. Four
varieties were chosen (Optic, Chariot, Cellar and Tavern) which represented the leading
commercially available varieties and a genetic variation in key traits. These varieties were
sown at five seedrates (50, 100, 200, 400 and 800 seeds m-²), which was expected to give a
stretch in both plant population and tiller number. Plot size was 2m wide by 24m long at the
ADAS sites and 1.5m wide by 10m long at Syngenta seeds. An Oyjord tractor mounted seed
drill was used for drilling at all sites. All plots received standard rates of agrochemicals and
fertilisers with an aim to maintain undisturbed and healthy crop growth.
Crop establishment was assessed pre-tillering with the number of plants counted in 10 x 1m
row lengths per plot. Weekly measurements of light interception with ceptometers (Sunfleck
meters) allowed canopy development to be monitored through the growing season. Crop
growth was measured as both dry matter and green area index when 50% of all the main
shoots reached mid-anthesis (GS65). An assessment of the components of yield was made on
samples taken immediately pre-harvest and their relationship with combine grain yield and
quality investigated.

15
Results and Discussion
Plant Establishment
Plant densities ranged from 30-721 plants m-2 from the seed rates used 50 to 800 seeds m-2
(Table 1.1). Establishment rates were higher at lower seed rates than at high seed rates this
concurred with recent findings in wheat (Spink et al, 2000). Plant populations were low at the
Bridgets site in 2001 and were highest in all three years at the NFC site in Lincolnshire.
Table 1.1. Plant establishment meaned across varieties and 3 sites
Seed rate Seeds m-2
Established plant population m-2 Plant establishment %
2000 2001 2002 Mean Mean 50 47.37 37.20 42.83 43.17 86.34 100 87.60 76.95 81.62 82.85 82.85 200 161.37 147.45 145.95 152.99 76.49 400 300.63 303.70 278.15 295.09 73.77 800 481.77 426.45 495.70 469.94 58.74
The varieties differed in their establishment with Optic consistently being the poorest to
establish with a mean establishment across the seed rates over the seven site seasons of
70.98% compared with Chariot 75.74, Cellar 76.26 and Tavern 76.50.
Establishment declined with increasing seed rate, averaged over all sites and years there was a
decline of 3.4% establishment for every 100 seeds/m2 that seed rate was increased. There was
however significant variation in the magnitude of this effect, for example in the first year: at
Rosemaund establishment declined from 92% at 50 seeds to 59% at 800 seeds, at Bridgets
comparable figures at the same seed rates were 84% down to 43% and at New Farm Crops
100% down to 78%, the reason for this variation is however not understood. Autotoxicity is
thought to be due to germinating seeds exuding chemicals which inhibit the germination of
their neighbours (Molisch,1937 and Putman,1985) the efficacy of these chemicals may be
influenced by soil type and or prevailing meterological conditions. For example, in wet
weather these exudates may be diluted, or leached down into the soil away from the
germinating seed.
Canopy Production
Plant compensatory mechanisms for reduced plant populations in winter wheat crops have
been the focus of much research recently. The increased tillering capacity and duration of
tillering have been identified as key. It was thought that the shorter growing season and faster
development rates of spring barley may limit the crops ability to compensate in the same way.

16
However evidence of compensation for reduced plant population was seen in the fertile shoot
counts taken with the growth analysis sample at GS 65 from a reduced and normal plant
density. Where a 3.5 fold reduction in plant density (264 to 76 plants m-2) was reduced to a
1.5 fold reduction in shoot number by increased tiller production (Table 1.2). There were
significant differences in tillering between the varieties, Tavern, was consistently the most
profuse of the four with the others having a similar tillering capacity. This response was
consistent across the seed rates with a significant interaction in only one site year, at Bridgets
in 2000, at this site Chariot produced few tillers at a low seed rate but was one of the best
tillered at a higher seed rate.
Table 1.2 Average Canopy growth data from GS 65 growth analysis at two seed rates from
two sites (Rosemaund and Bridgets) in all three years.
Variety Plant Density
Fertile shoots (m2)
Green area index
Dry matter (t/ha)
Green area per shoot (cm2)
Dry matter per shoot (g/m2)
Optic 72 446.32 2.88 5.88 64.62 1.35
Chariot 76 387.25 2.53 6.13 63.53 1.57
Cellar 82 422.60 2.63 6.51 62.28 1.56
Tavern 70 500.09 2.74 6.46 54.32 1.30
Mean 76 439.12 2.69 6.24 60.49 1.43
Optic 242 608.57 3.37 6.70 54.24 1.11
Chariot 265 702.49 3.44 7.88 47.68 1.14
Cellar 274 637.45 3.35 7.19 50.02 1.12
Tavern 275 786.31 3.65 7.57 44.79 0.97
Mean 264 683.55 3.45 7.34 48.80 1.08
Overall mean 561.24 3.08 6.79 53.69 1.22
Canopy sizes and to a lesser extent dry matter production were lower than those that are
produced by winter cereals and were particularly low in the first two years as a consequence
of dry periods in the spring during canopy formation. In the three years 2000, 2001, 2002,
green area indices ranged from 1.51 to 3.37, 1.28 to 4.03 and 3.79 to 6.87 respectively. At
lower plant densities green area per shoot was on average 24% higher to that at a higher
density. This is consistent with the findings in wheat where an average increase of 22% was
seen. In dry matter terms shoots of lower density plants are larger as well. On average across
the varieties shoots from plants grown at low density had 32% more dry matter than those at a

17
higher density. Therefore the compensation for reduced plant densities was not only in
increased tillering but also in the size of the tillers.
The small canopies in spring barley maybe a factor limiting yield potential and have possible
quality implications and therefore worthy of further research. The quality implications will be
discussed further later in this report.
An indication of the timing of this compensation during the growing season and therefore it’s
impact on resource capture and yield formation can be gained from weekly light interception
readings. These indicate that by GS 45, the compensation and the effect of seed rate on the
plant’s ability to intercept photosynthetically active radiation (PAR) in the all of the seed rates
apart from the lowest were negligible, an example from one site season can be seen in Figure
1.
0
10
20
30
40
50
60
70
80
90
04-May 10-May 16-May 23-May 31-May 06-Jun 13-Jun 20-Jun 27-Jun 04-Jul 11-Jul 18-Jul 25-Jul
% Absorbed
Figure 1.0 PAR absorbed by the spring barley crop at Rosemaund 2000 at 50 ( — — ),
100 ( — — ), 200 ( — — ), 400 ( -- ), 800 seeds ( — ).
Fertile ear numbers
By harvest, the 3.5 fold difference in plant density from seed rates 100 and 400 seeds had
been further reduced from a 1.5 fold difference seen at GS 65 to a 1.3 fold difference in final
ear numbers. This was due to a slightly improved tiller survival at the lower plant densities.
At the extremes of plant density (470 to 43 plants m-2) an 11 fold difference in established
plant number had been reduced to 2 fold difference in final ear number.
Varietal differences in ear numbers confirmed what was observed in shoot numbers earlier in
the season with the varieties ranked Tavern > Cellar > Chariot > Optic. Tavern, Cellar,
GS 30-31
GS45GS59

18
Chariot and Optic produced 662, 625, 600 and 598 ears/m2 respectively averaged over all the
seed rates in seven site seasons. There was a significant interaction of variety and seed rate in
the first year only at both Rosemaund and Bridgets. At Bridgets, Tavern produced fewer ears
than the other varieties at reduced plant densities whereas at high densities it was the
converse. At Rosemaund, Optic was one of the varieties that produced the most ears at
reduced plant densities but at high densities produced the least.
Ear numbers per plant
Using the final ear number and the established plant population to calculate fertile ear
numbers per plant, on average 10 ears per plant were produced at the lowest plant density
compared to 1.8 at the highest. This compensation for low plant densities is about half that
seen in wheat where 20 ears per plant were produced at low plant densities. This is most
likely to be due to the shorter period of time after crop emergence of a spring drilled crop
compared to a winter crop that is available for the plant to produce tillers.
0
2
4
6
8
10
12
14
0 200 400 600 800
Plants m-2
Ears
/pla
nt
Figure 1.2. The effect of plant density of ear number per plant meaned across the varieties
from seven site seasons, variance accounted for 71.8%. Curve fitted 2.51 + 11.89 * 0.98778x
+ -0.00173x.
The ranking of the varieties differs when you look at them in terms of ear numbers per plant
compared to tiller number (Figure 1.3) although due to Tavern’s high tillering capacity it still
has significantly more ears per plant. This ranking remained constant across the changes in
plant densities so no interaction of variety and seed rate was observed.

19
0
2
4
6
8
10
12
43 83 153 295 470
Plant density m2
Ears/plantOpticChariotCellarTavern
Figure 1.3 Varietal differences in ear numbers per plant calculated from final ear numbers and
established plant population across a range of plant densities average across seven site
seasons.
Grain number per ear
As with wheat there was a significant increase in grain number per ear as seed rate was
reduced at both Rosemaund and Bridgets in the first year resulting in an increase in grain
number of about 20% as seed rate was reduced from 400 to 100 seeds/m2. In the second year
there was again a significant increase in grain number with 100 seeds producing about 30%
more grain per ear than 800 seeds per m2 (Figure 1.4). However this effect was not seen, at
either Bridgets in the second year or either site in the third year. Even where increases in
grain number per ear were observed they were relatively small in comparison to those found
in wheat where increases of up to 70% have been recorded (Spink et al, 2000). This is
perhaps unsurprising as these 2-row barleys have a determinate number of spikelets per floret
and any increase in ear size must be due to increased spikelet number, whereas wheat
although determinate in terms of spikelet number has significant flexibility in floret number
per spikelet, with up to 10 possible but rarely more than 3-4 viable.

20
10
12
14
16
18
20
22
24
45 93 181 366 495
Plant density m2
Gra
in n
umbe
r/ear
OpticChariotCellarTavern
Figure 1.4. Grain number per ear across the range of plant densities for all varieties from
ADAS Rosemaund in Year 2 (2001). SED for seed rate means is 1.31 (P = 0.003), Variety
and Seed rate x Variety not significant.
Grain size
Grain size increased with decreasing seed rate in all sites and seasons except Terrington in
year 3, where average thousand grain weight (TGW) decreased by 3g from 800 seeds to 50
seeds. Grain size increase over the same seed rate range over the other sites and years
averaged 6g, but ranged from 4g at Bridgets in the second year to 9g at Rosemaund in the first
year (Table 1.3). This 11.5 % increase in grain size at reduced plant population was
significantly greater than the 6 % seen in wheat, where average TGW increased by 3.2 g from
640 to 20 seeds per m2 (Spink et al, 2000). The importance and significance in terms of
homogeneity and malting performance of the changes in TGW at different plant populations
will be discussed later in this report but this does suggest that the grower can use seed rate in
spring malting barley to manipulate the physical grain size of his crop.
There are significant differences in TGW between the varieties in all sites and seasons, in
most cases this is due to Chariot having significantly smaller grain than the other three
varieties (Table 1.4). In all years except Rosemaund in the first year and Bridgets in the
second year there is no interaction between Variety and seed rate therefore the ranking in
grain size terms of Cellar > Tavern > Optic > Chariot remained relatively constant across the
seedrates.

21
Table 1.3. Thousand grain weight (g, 15% moisture) at a range of seed rates (m-2) at two sites
in each of three years, 2000, 2001 and 2002 meaned across four varieties.
Seed rate Year 1 (2000) Year 2 (2001) Year 3 (2002) Seeds m-2 Rosemaund Bridgets Rosemaund Bridgets Rosemaund Terrington50 53.9 50.54 54.17 50.1 53.83 33.19 100 52.3 50.74 53.72 49.7 52.93 35.71 200 49.5 47.58 50.75 48.2 51.14 37.36 400 47.7 45.55 51.74 45 50.65 37.33 800 44.9 43.57 50.77 45.4 49.53 36.88 Mean 49.7 47.6 52.23 47.4 51.62 36.09 Seedrate SED 0.602 0.907 1.827 0.653 0.691 1.359 p value <0.001 <0.001 NS <0.001 <0.001 0.005
Table 1.4. Thousand grain weight (g, 15% moisture) of Optic, Chariot, Cellar, and Tavern at
two sites in each of three years, 2000, 2001 and 2002 meaned across five seed rates (m-2).
Seed rate Year 1 (2000) Year 2 (2001) Year 3 (2002) Seeds m-2 Rosemaund Bridgets Rosemaund Bridgets Rosemaund Terrington Optic 51.22 48.26 55.14 47.90 49.80 35.69 Chariot 46.18 44.77 47.57 43.92 46.38 30.33 Cellar 51.72 49.63 54.60 49.06 56.22 39.26 Tavern 49.56 47.73 51.60 48.68 54.07 39.10 Mean 49.67 47.60 52.23 47.39 51.62 36.09 Variety SED 0.539 0.811 1.634 0.584 0.618 1.216 p value <0.001 <0.001 <0.001 <0.001 <0.001 <0.001

22
As well as average grain size the distribution of grain size may be important in determining
homogeneity. An image analysis method was therefore developed whereby a number of
grains were scanned and the projected area measured. The results reflected the increased
grain size at lower seed rates but indicated larger variation in grain size as indicated by the
higher standard deviation at lower seed rate (figures 1.6 and 1.7). This suggests that although
lower seed rates have more large grains because of the larger variation in size this may lead to
a less homogeneous sample.
0
10
20
30
40
50
60
70
80
1.6 1.8 2 2.2 2.4 2.6 2.8 3 3.2 3.4
50400800
0
10
20
30
40
50
60
70
80
90
1.6 1.8 2 2.2 2.4 2.6 2.8 3 3.2 3.4
50400800
Figure 1.6. Frequency distribution graphs for Figure 1.7. Frequency distribution graphs for
grain area mm-2 for 50, 400 and 800 seeds grain area mm-2 for 50, 400 and 800 seeds
from Rosemaund in year 1. from Bridgets in year 1.
Standard deviations 50 = 0.312, 400 = 0.278 Standard deviations 50 = 0.331, 400 = 0.248
800 = 0.313. 800 = 0.252.
Yield
Seed rate and variety main effects were significant at all sites in all years (Table 1.5).
Considerable variation in grain yield was seen between sites and seasons with average yields
ranging from 3.8 t/ha at Rosemaund in 2001 to 7.56 t/ha at New Farm Crops in 2000.
Variety main effects showed Tavern and Cellar having similar average yields of 5.78 and 5.72
t/ha respectively, Optic 5.4 and Chariot consistently the poorest yielding at 4.79.
As seed rate and thus plant population is increased from 50 seeds m-2 or 43 plants m-2 yield
increased rapidly once 200 seeds m-2 or 153 plants m-2 is reached the yield increases lessen
but tend to continue to increase up to 800 seeds m-2 or 470 plants m-2. This response curve to
seed rate is in general consistent with that seen in wheat at low populations but in wheat once
at plant population of 150 plants m-2 is achieved there is no further significant increase in
yield.
23
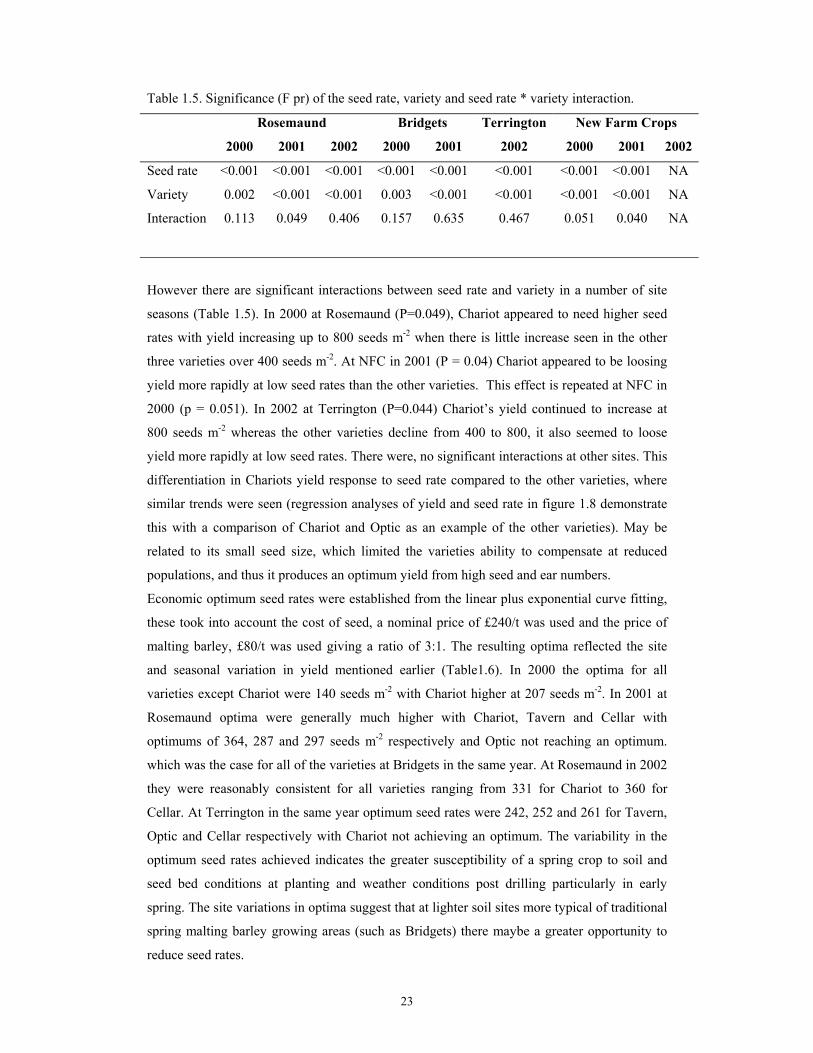
Table 1.5. Significance (F pr) of the seed rate, variety and seed rate * variety interaction.
Rosemaund Bridgets Terrington New Farm Crops
2000 2001 2002 2000 2001 2002 2000 2001 2002
Seed rate <0.001 <0.001 <0.001 <0.001 <0.001 <0.001 <0.001 <0.001 NA
Variety 0.002 <0.001 <0.001 0.003 <0.001 <0.001 <0.001 <0.001 NA
Interaction 0.113 0.049 0.406 0.157 0.635 0.467 0.051 0.040 NA
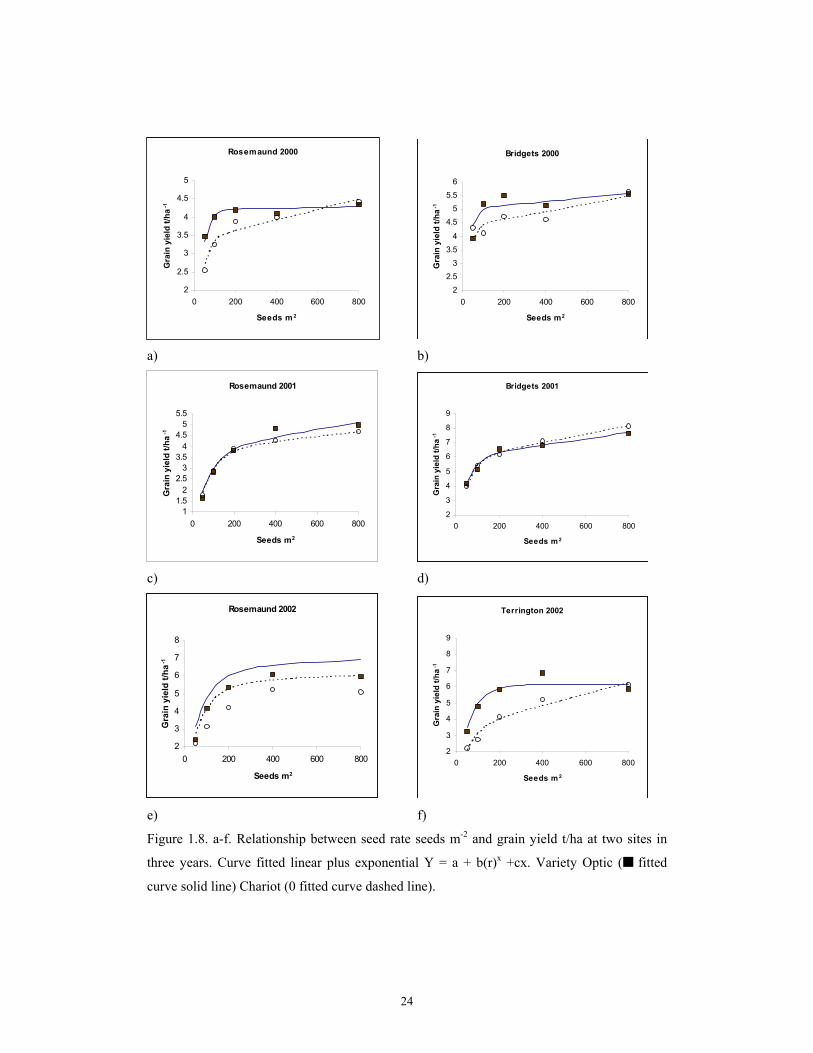
However there are significant interactions between seed rate and variety in a number of site
seasons (Table 1.5). In 2000 at Rosemaund (P=0.049), Chariot appeared to need higher seed
rates with yield increasing up to 800 seeds m-2 when there is little increase seen in the other
three varieties over 400 seeds m-2. At NFC in 2001 (P = 0.04) Chariot appeared to be loosing
yield more rapidly at low seed rates than the other varieties. This effect is repeated at NFC in
2000 (p = 0.051). In 2002 at Terrington (P=0.044) Chariot’s yield continued to increase at
800 seeds m-2 whereas the other varieties decline from 400 to 800, it also seemed to loose
yield more rapidly at low seed rates. There were, no significant interactions at other sites. This
differentiation in Chariots yield response to seed rate compared to the other varieties, where
similar trends were seen (regression analyses of yield and seed rate in figure 1.8 demonstrate
this with a comparison of Chariot and Optic as an example of the other varieties). May be
related to its small seed size, which limited the varieties ability to compensate at reduced
populations, and thus it produces an optimum yield from high seed and ear numbers.
Economic optimum seed rates were established from the linear plus exponential curve fitting,
these took into account the cost of seed, a nominal price of £240/t was used and the price of
malting barley, £80/t was used giving a ratio of 3:1. The resulting optima reflected the site
and seasonal variation in yield mentioned earlier (Table1.6). In 2000 the optima for all
varieties except Chariot were 140 seeds m-2 with Chariot higher at 207 seeds m-2. In 2001 at
Rosemaund optima were generally much higher with Chariot, Tavern and Cellar with
optimums of 364, 287 and 297 seeds m-2 respectively and Optic not reaching an optimum.
which was the case for all of the varieties at Bridgets in the same year. At Rosemaund in 2002
they were reasonably consistent for all varieties ranging from 331 for Chariot to 360 for
Cellar. At Terrington in the same year optimum seed rates were 242, 252 and 261 for Tavern,
Optic and Cellar respectively with Chariot not achieving an optimum. The variability in the
optimum seed rates achieved indicates the greater susceptibility of a spring crop to soil and
seed bed conditions at planting and weather conditions post drilling particularly in early
spring. The site variations in optima suggest that at lighter soil sites more typical of traditional
spring malting barley growing areas (such as Bridgets) there maybe a greater opportunity to
reduce seed rates.
24
Rosemaund 2000
2
2.5
3
3.5
4
4.5
5
0 200 400 600 800
Seeds m2
Gra
in y
ield
t/ha
-1
Bridgets 2000
22.5
33.5
4
4.55
5.56
0 200 400 600 800
Seeds m2
Gra
in y
ield
t/ha
-1
a) b)
Rosemaund 2001
11.5
22.5
33.5
44.5
55.5
0 200 400 600 800
Seeds m2
Gra
in y
ield
t/ha
-1
Bridgets 2001
2
3
4
5
6
7
8
9
0 200 400 600 800
Seeds m2
Gra
in y
ield
t/ha
-1
c) d)
Rosemaund 2002
2
3
4
5
6
7
8
0 200 400 600 800
Seeds m2
Gra
in y
ield
t/ha
-1
Terrington 2002
2
3
4
5
6
7
8
9
0 200 400 600 800
Seeds m 2
Gra
in y
ield
t/ha
-1
e) f)
Figure 1.8. a-f. Relationship between seed rate seeds m-2 and grain yield t/ha at two sites in
three years. Curve fitted linear plus exponential Y = a + b(r)x +cx. Variety Optic (■ fitted
curve solid line) Chariot (0 fitted curve dashed line).

25
Table 1.6. Relationship between yield and seed rates, and the coefficients a, b, c and r in the
linear plus exponential equation Y = a + b(r)x +cx. % var refers to % of variance accounted;
SE to standard error; opt rate to optimum seed rate and opt plants to optimum plant
population.
Year Site Variety a=-b c r % var opt rate SE opt rate opt plants
2000 Rosemaund Optic 4.20 0.0001 0.9688 35.4 144 18 115
Chariot 3.36 0.00143 0.9688 35.4 230 >opt 183
Bridgets Optic 4.99 0.00073 0.9597 39.9 136 24 81
Chariot 4.36 0.00143 0.9597 39.9 184 >opt 110
2001 Rosemaund Optic 3.74 0.00173 0.9866 79.8 >max - -
Chariot 3.81 0.00112 0.9866 79.8 364 115 328
Bridgets Optic 5.98 0.00214 0.9789 88.4 >max 235 -
Chariot 5.79 0.00301 0.9789 88.4 >max - -
2002 Rosemaund Optic 6.32 0.00075 0.9867 78.7 352 77 176
Chariot 5.57 0.00061 0.9867 78.7 331 64 166
Terrington Optic 6.16 -0.00001 0.9834 85.8 252 25 189
Chariot 3.45 0.00356 0.9834 85.8 >max >max -
Grain quality
Specific weight
The effect of seed rate on specific weight was generally small and inconsistent. There were,
however, significant effects in all but two sites, the lowest seed rate was never the best on
average 2.4 % lower. The highest specific weights were achieved from 800 seeds m-2 in five
of the nine site seasons, but in the other four years it was as poor as the lowest seed rate. The
intermediate seed rates of 100-400 seeds m-2 were however consistently good and comparable
to each other, 400 seeds m-2 having the overall highest specific weight. Varietal effects were
significant in all years bar one, however the effects were inconsistent across site seasons and
suggested no real varietal trends. The ranking of the varieties averaged across all years was
Tavern > Optic > Cellar > Chariot.
Grain moisture
The moisture content of grain at harvest is always of concern to growers due to storage and
drying costs but the effect of moisture content on malting processes due to differential water
uptake may not have been considered. The perceived higher risk of increased moisture

26
contents from crops grown at reduced plant populations due to greater tiller hierarchy and
therefore an increased risk of immature tillers has also concerned growers. In these
experiments moisture content was significantly higher in low compared to high seed rates at
all sites. The effect was greatest at the 50 seeds m-2, and sometimes the 100 seeds m-2 seed
rate, there was rarely however a significant difference between the 200 and 800 seed rates.
There were perhaps unsurprisingly significant variety differences in grain moisture, this is to
be expected if varieties with different maturity dates are harvested on the same date following
identical sowing dates. There was however more surprisingly a significant variety * seed rate
interaction at Bridgets in years 1 & 2, NFC in year 2 and Rosemaund and Terrington in year
3. This interaction appeared to be due to a tendency for Optic to suffer from particularly high
moisture contents at low seed rates.
13.514.014.515.015.516.016.517.017.518.0
50 100 200 400 800
Seeds m-2
Moi
stur
e co
nten
t %
OpticChariotCellarTavern
Figure 1.9 Moisture content of harvested grain from four varieties across a range of seed rates
mean of seven site seasons.
Grain nitrogen
Grain nitrogen was measured on replicated samples at the Bridgets site in years 1 & 2 and on
treatment-bulked samples at the NFC site in all three years. In all years the lowest seed rates
produced higher grain nitrogen than high seed rates. The 50 seeds m-2 treatment produced
grain 0.27%N higher on average than the 800 seeds m-2 treatment, which produced grain
nitrogen of on average 1.48%. Where it was possible to statistically analyse (the Bridgets site)
seed rate was significant in both years (P=< 0.001).
The varietal effects seen are that Chariot produces high grain nitrogen of on average 1.68
compared to 1.57, 1.59, for Optic and Cellar respectively, Tavern tended to produce the
lowest grain nitrogens particularly in years 2 and 3 producing on average 1.54 % (Figure 2.0).
27
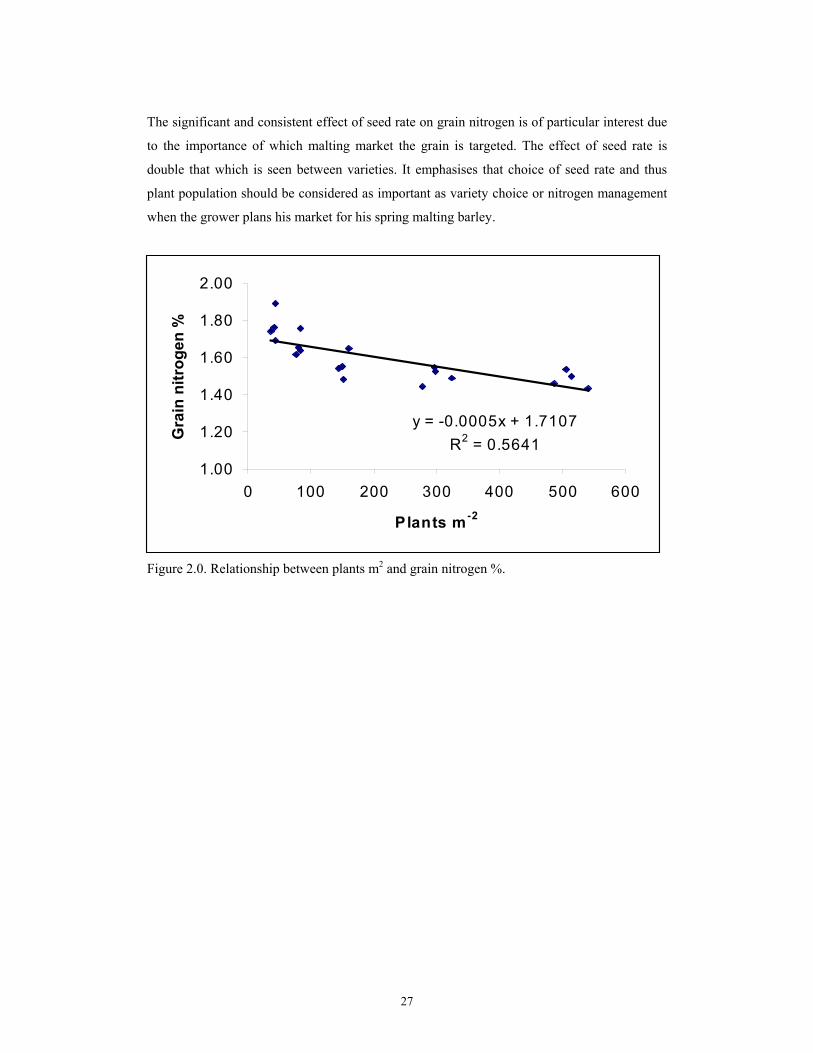
The significant and consistent effect of seed rate on grain nitrogen is of particular interest due
to the importance of which malting market the grain is targeted. The effect of seed rate is
double that which is seen between varieties. It emphasises that choice of seed rate and thus
plant population should be considered as important as variety choice or nitrogen management
when the grower plans his market for his spring malting barley.
y = -0.0005x + 1.7107R2 = 0.5641
1.00
1.20
1.40
1.60
1.80
2.00
0 100 200 300 400 500 600
Plants m-2
Gra
in n
itrog
en %
Figure 2.0. Relationship between plants m2 and grain nitrogen %.

28
Appendix 2
Seedrate x nitrogen/fungicide interaction
Materials & Methods
Fully randomised and replicated field trials were set up at three sites in two years. A site at
ADAS Bridgets, Martyr Worthy, Winchester, Hampshire was used in 2000 and 2001 harvest
years. A west of England site at White House Farm, Sellack, Ross-on-Wye was used in 2000
and at ADAS Rosemaund, Preston Wynne, Hereford in 2001. A site at plant breeders New
Farm Crops (NFC, now part of Syngenta seeds) Market Stainton, Lincolnshire was used in
both years.
The experimental design was a three way factorial replicated three times, there were two seed
rates, three nitrogen rates and three fungicide applications on a single variety, Optic. Two
seed rates (100 and 400 seeds m-2) were selected as examples of a reduced and a normal seed
rates. At NFC 200 seeds m-2 was used as the reduced rate. Nitrogen treatments with rates of
prilled ammonium nitrate of 50, 100 and 150 kg/ha were applied. Three fungicide treatment
programmes were used and applied using a hand held knapsack sprayer:
1. GS30/31 Amistar Pro 2.0 l/ha plus Unix 0.67 kg/ha
2. GS30/31 Opus 1.0 l/ha plus Corbel 0.5 l/ha
3. GS30/31 Amistar Pro 2.0 l/ha plus Unix 0.67 kg/ha and GS45-59 Amistar Pro 2.0 l/ha
Plots were drilled with an ‘Oyjord type’ tractor mounted seed drill and plot dimensions were
2m wide by 24m long at the ADAS sites and 1.5m wide by 10m long at Syngenta seeds.
At the ADAS sites soil samples were taken to a depth of 90 cm to establish residual soil
mineral nitrogen supply in the spring. Crop establishment was assessed pre-tillering with the
number of plants counted in 10 x 1m row lengths per plot. Weekly measurements of light
interception with ceptometers (Sunfleck meters) allowed canopy development to be
monitored through the growing season. Crop growth as both dry matter and green area index
measurements were taken when 50% of all the main shoots reached mid-anthesis (GS65)
from the normal seed rates only. An assessment of the components of yield was made on
samples taken immediately pre-harvest. Grain yield was measured using a plot combine from
a harvest area of 10m by 2m. Grain was analysed for moisture content and specific weight
using a GAC 2000 grain analysis computer (Dickey-John corporation) and thousand grain
weight measured using a numigral grain counter.
At NFC crop establishment was assessed pre-tillering with the number of plants counted in 10
x 1m row lengths per plot. Grain yield was measured using a plot combine from a harvest area
of 10m by 1.5m. Grain was analysed for moisture content, specific weight, sieving fractions
and grain nitrogen %.

29
Results and Discussion
Plant establishment
Plant counts assessed before nitrogen or fungicide treatments were applied concurred with
findings of the seed rate x variety interaction experiments with higher establishment at
reduced seed rates (Table 2.1.). On average 80.4% and 72.7% of plants were established from
100 and 400 seeds m-2. Establishment was consistent across the years in both seed rates
although higher establishment was achieved at Rosemaund in 2001.
Table 2.1. Plant establishment of Optic spring barley at 2 sites, White House farm (Wh) in
2000, ADAS Rosemaund (Rm) in 2001 and ADAS Bridgets (Br) in 2000 and 2001.
Seed rate Seeds m-2
Established plant population m-2 Plant establishment %
2000 2001 2000 2001
Wh Br Rm Br Rm Br Rm Br
100 76.8 77.5 88.4 79.0 76.8 77.5 88.4 79.0
400 259.3 256.7 387.7 260.0 64.8 64.2 96.9 65.0
Crop growth
The effects of nitrogen nutrition on canopy formation and size and fungicide programmes
particularly strobilurins on canopy duration were quantified by growth analysis of the high
seed rates at mid-anthesis. There were no significant interactions between nitrogen and
fungicide however there were significant main effects particularly nitrogen. Increases in
fertile shoot numbers with nitrogen were significant at Bridgets in both 2000 (p= <0.001) and
2001 (p= 0.031), they were not significant in the west in either year however the trend was
similar. On average, shoot numbers were increased 9.5% with the first 50 kg of nitrogen
applied over and above 50 kg/ha and 5.7% for the second (table 2.2). As nitrogen was
increased canopy size increased consistently across all site years. Increased rates of nitrogen
significantly increased (p= <0.001) both leaf and overall green area index at all sites except
Rosemaund in 2001. When 100 kg/ha of nitrogen was applied leaf and overall green area
index were increased compared with the 50 kg/ha by 0.46 and 0.7 respectively. At 150 kg/ha
there were increases of 0.85 and 1.26 in leaf and overall green area index respectively.
Significant increases in canopy size in terms of dry matter were also seen in all years except
Rosemaund in 2001. On average leaf dry matter was increased by 0.18 and 0.27 t/ha when
100 and 150 kg/ha of nitrogen was applied, respectively. Total dry matter increased by 1.07

30
and 1.24 t/ha respectively from the same two treatments. These increases in crop dry matter
biomass with increasing nitrogen nutrition were still significant when assessed at a growth
analysis taken immediately pre-harvest. Both straw and grain dry matter were significantly
increased in all site years, illustrated by the total crop dry matter presented in table 2.3. On
average, compared to the lowest nitrogen treatment crop dry matter was increased by 27 %
and 39.5% with the addition of an extra 50 and 100 kg/ha respectively. This diminishing
response in canopy size and crop dry matter to nitrogen application is typical of response
curves seen in other crops (Sylvester-Bradley et al, 1984, DT Stokes et al, 1998).
The effects of the fungicide treatments were less consistent than that seen for nitrogen
emphasising the seasonal effects on disease pressure and fungicide response. Shoot numbers
were not significantly affected by fungicide application. However there was a trend for the
two spray application of a strobilurin to have more shoots due to the relatively late timing of
the second spray this is most likely, to have been due to improved tiller survival. The
expected effect of the strobilurin treatments on prolonging the duration of canopy greenness
through improved retention of green leaf area index was only statistically significant at
Bridgets in 2000. At this site both strobilurin treatments had significantly (p= <0.001) higher
leaf and overall green area index than the triazole treatment. A single spray of strobilurin
produced a 36% larger green area index than the single spray triazole treatment and a two
spray strobilurin 23% more than a single spray of either a strobilurin or a triazole. The
response at this site was reflected at other sites and in the overall trend averaged across the
four site seasons. On average compared to the triazole program, green area index was 9%
larger at mid-anthesis from a single application of strobilrurin and 7.5% larger from a two
spray application (table 2.2). This indicated strobilurin sprays did have an effect on the
canopy, although it was not always significant and that an early season strobilurin spray was
the most important for canopy retention.
Leaf dry matter data was consistent with the green area index data; again with Bridgets in
2000 the only site with statistically significant (p= 0.001) differences between the strobilurin
and triazole fungicide treatments. A single spray of strobilurin produced a 50% higher leaf
dry matter than the single spray triazole treatment and a two spray strobilurin 35%. On
average compared to the triazole program, leaf dry matter was 14% higher at mid-anthesis
from a single application of strobilurin and 10% larger from a two spray application. By the
time of harvest, crop dry matter increases due to fungicide program were still evident. A two-
spray strobilurin program significantly increased crop dry matter at both White House (p=
0.009) and Bridgets (p= 0.035) in 2000 (table 2.3). On average over the four site seasons, a
two-spray strobilurin program increased dry matter by 8.5% compared with a single triazole
spray.

31
The data from the growth analysis indicated effects of strobilurins on canopy size, the
resultant effect on yield and quality will be discussed later in this report.
Table 2.2 Average Canopy growth data of Optic spring barley from GS 65 growth analysis at
400 seeds/m2 from two sites (Rosemaund and Bridgets) in two years (2000, 2001).
Nitrogen Fungicide
Fertile shoots (m2)
Leaf area index
Green area
index
Leaf dry matter (t/ha)
Crop dry matter (t/ha)
50 kg N Strob 31 570 1.22 2.32 0.41 5.81
Triazole 31 579 0.94 2.08 0.36 5.88
Strob 31 &
45 647 1.24 2.43 0.41 6.34
Mean 599 1.14 2.28 0.39 6.01
100 kg
N Strob 31 660 1.74 3.20 0.62 7.01
Triazole 31 689 1.54 2.92 0.53 7.32
Strob 31 &
45 622 1.53 2.81 0.55 6.91
Mean 656 1.60 2.98 0.57 7.08
150 kg
N Strob 31 673 2.07 3.56 0.67 7.21
Triazole 31 678 1.78 3.33 0.61 7.10
Strob 31 &
45 720 2.12 3.72 0.68 7.52
Mean 690 1.99 3.54 0.66 7.25
Strob 31 Mean 634 1.68 3.03 0.57 6.65
Triazole 31 Mean 648 1.42 2.78 0.50 6.77
Strob 31 & 45 Mean 663 1.63 2.99 0.55 6.92

32
Table 2.3 Crop dry matter t/ha of Optic spring barley from pre-harvest growth analysis at 400
seeds/m2 from two sites, White House and Bridgets in 2000, Rosemaund and Bridgets in
2001.
2000 2001
Nitrogen Fungicide
White
House Bridgets Rosemaund Bridgets Average
50 kg N Strob 31 10.39 7.64 5.23 12.25 8.88
Triazole 31 8.56 7.46 6.22 11.17 8.35
Strob 31 & 45 10.91 7.81 6.31 11.81 9.21
Mean 9.95 7.64 5.92 11.74 8.81
100 kg N Strob 31 10.41 9.29 7.71 15.58 10.75
Triazole 31 11.42 9.51 8.85 15.2 11.25
Strob 31 & 45 11.76 9.79 6.85 17.86 11.57
Mean 11.19 9.53 7.81 16.21 11.19
150 kg N Strob 31 11.3 10.48 8.67 17.34 11.95
Triazole 31 11.86 9.79 8.07 17.36 11.77
Strob 31 & 45 13.56 12.2 9.58 11.77 11.78
Mean 12.08 10.8 8.78 17.49 12.29
Strob 31 Mean 10.7 9.13 7.21 15.06 10.53
Triazole 31 Mean 10.61 8.92 7.71 14.58 10.46
Strob 31 & 45 Mean 12.08 9.93 7.58 15.81 11.35
Grand Mean 11.13 9.33 7.5 15.15
cv% 8.8 8.4 22.2 17.3
Nitrogen p value <0.001 <0.001 0.007 <0.001
SED 0.462 0.37 0.786 1.233
Fungicide p value 0.009 0.035 0.802 0.608
SED 0.462 0.37 0.786 1.233
Nitrogen x Fungicide p
value
0.122 0.162 0.469 0.888
SED 0.801 0.641 1.361 2.135
33
df 16 16 16 16
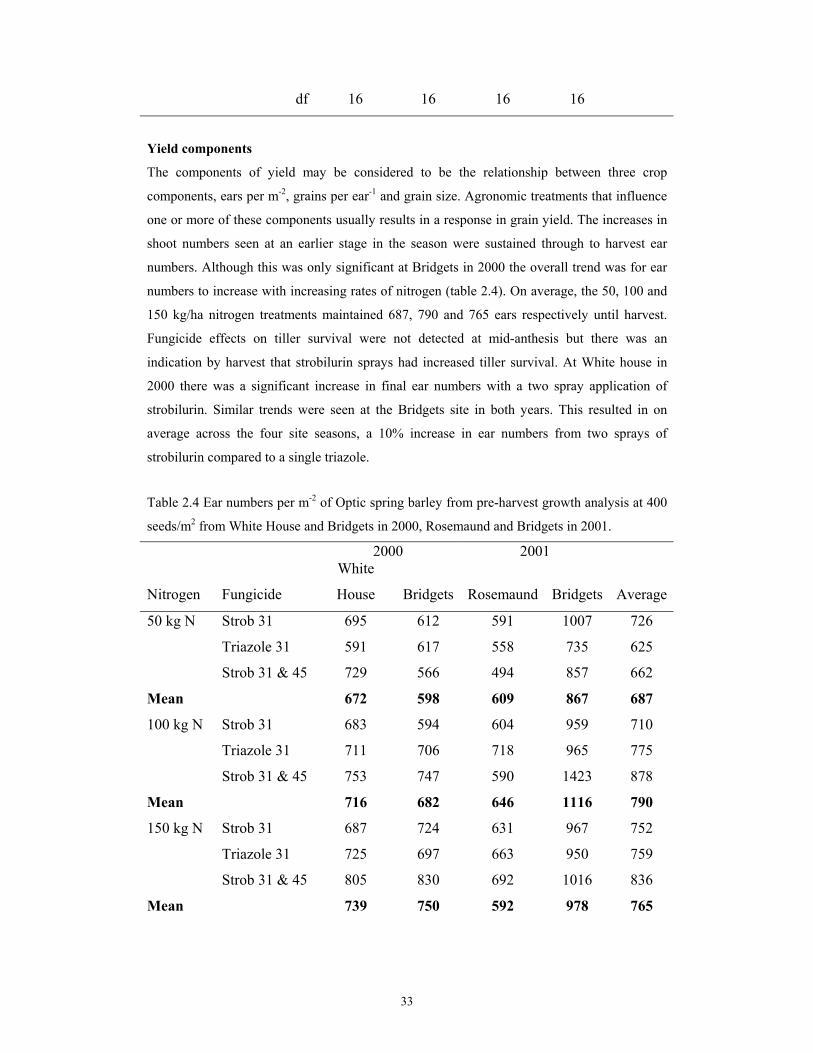
Yield components
The components of yield may be considered to be the relationship between three crop
components, ears per m-2, grains per ear-1 and grain size. Agronomic treatments that influence
one or more of these components usually results in a response in grain yield. The increases in
shoot numbers seen at an earlier stage in the season were sustained through to harvest ear
numbers. Although this was only significant at Bridgets in 2000 the overall trend was for ear
numbers to increase with increasing rates of nitrogen (table 2.4). On average, the 50, 100 and
150 kg/ha nitrogen treatments maintained 687, 790 and 765 ears respectively until harvest.
Fungicide effects on tiller survival were not detected at mid-anthesis but there was an
indication by harvest that strobilurin sprays had increased tiller survival. At White house in
2000 there was a significant increase in final ear numbers with a two spray application of
strobilurin. Similar trends were seen at the Bridgets site in both years. This resulted in on
average across the four site seasons, a 10% increase in ear numbers from two sprays of
strobilurin compared to a single triazole.
Table 2.4 Ear numbers per m-2 of Optic spring barley from pre-harvest growth analysis at 400
seeds/m2 from White House and Bridgets in 2000, Rosemaund and Bridgets in 2001.
2000 2001
Nitrogen Fungicide
White
House Bridgets Rosemaund Bridgets Average
50 kg N Strob 31 695 612 591 1007 726
Triazole 31 591 617 558 735 625
Strob 31 & 45 729 566 494 857 662
Mean 672 598 609 867 687
100 kg N Strob 31 683 594 604 959 710
Triazole 31 711 706 718 965 775
Strob 31 & 45 753 747 590 1423 878
Mean 716 682 646 1116 790
150 kg N Strob 31 687 724 631 967 752
Triazole 31 725 697 663 950 759
Strob 31 & 45 805 830 692 1016 836
Mean 739 750 592 978 765

34
Strob 31 Mean 688 643 609 978 730
Triazole 31 Mean 676 673 646 883 720
Strob 31 & 45 Mean 762 714 592 1099 792
Grand Mean 709 677 616 987
cv% 9.6 9.8 12.3 31.1
Nitrogen p value 0.137 <0.001 0.191 0.255 SED 32.1 31.3 62.8 144.6
Fungicide p value 0.033 0.105 0.682 0.351 SED 32.1 31.3 62.8 144.6
Nitrogen x Fungicide p
value
0.381 0.063 0.733 0.493
SED 55.6 54.3 108.8 250.4
df 16 16 16 16

35
Nitrogen treatments increased grain number per ear in three out of the four years (table 2.5)
although it was only significant at Rosemaund in 2001 (p=0.036). At Rosemaund in 2001,
grain number per ear was increased by 6.5% and 21.4% by the 100 and 150 kg/ha nitrogen
treatments respectively when compared to the 50 kg/ha rate. The overall trend was for the 100
and 150 kg/ha nitrogen treatments to increase grain number per ear by 3.8 and 9.5%
respectively.
Fungicide programmes had no significant affect on grain number per ear.
Table 2.5 Grain number per ear of Optic spring barley from pre-harvest growth analysis at
400 seeds/m2 White House and Bridgets in 2000, Rosemaund and Bridgets in 2001.
2000 2001
Nitrogen Fungicide
White
House Bridgets Rosemaund Bridgets Average
50 kg N Strob 31 19.6 19.6 12.9 15.6 16.9
Triazole 31 19.9 19.0 15.5 19.0 18.4
Strob 31 & 45 19.9 21.0 17.8 16.9 18.9
Mean 19.8 19.9 15.4 17.2 18.1
100 kg N Strob 31 19.7 21.3 16.9 19.0 19.2
Triazole 31 20.9 20.1 17.1 19.8 19.5
Strob 31 & 45 19.7 18.6 15.2 16.6 17.5
Mean 20.1 20.0 16.4 18.5 18.8
150 kg N Strob 31 20.9 20.4 19.0 18.6 19.7
Triazole 31 21.5 19.2 17.2 20.1 19.5
Strob 31 & 45 21.4 19.6 19.9 19.8 20.2
Mean 21.3 19.7 18.7 19.5 19.8
Strob 31 Mean 20.1 20.4 16.3 17.7 18.6
Triazole 31 Mean 20.8 19.4 16.6 19.7 19.1
Strob 31 & 45 Mean 20.3 19.7 17.6 17.8 18.9
Grand Mean 20.4 19.9 16.8 18.4
cv% 6.6 6.4 15 12.9
Nitrogen p value 0.084 0.887 0.036 0.151

36
SED 0.637 0.599 1.19 1.122 Fungicide p value 0.56 0.251 0.516 0.177
SED 0.637 0.599 1.19 1.122 Nitrogen x Fungicide p
value
0.938 0.102 0.185 0.581
SED 1.103 1.037 2.061 1.943
df 16 16 16 16

37
Significant effects of nitrogen on grain size were seen at Bridgets in 2001 (p=0.001).
Thousand grain weight (tgw) increased by 3.2% and 6.2% with the 100 and 150 kg/ha
nitrogen treatments respectively when compared to the 50 kg/ha rate (table 2.6). At other sites
the trend was smaller or there was no significant difference between nitrogen treatments.
Fungicide effects were significant at both sites in 2000 (table 2.6), at both sites tgw was
higher when a strobilurin fungicide was used. A two spray program had the greatest effect
with increases of 5% at White house and 9% at Bridgets compared to the triazole treatment.
Table 2.6 Thousand grain weight (g) of Optic spring barley from pre-harvest growth analysis
at 400 seeds/m2 White House and Bridgets in 2000, Rosemaund and Bridgets in 2001.
2000 2001
Nitrogen Fungicide
White
House Bridgets Rosemaund Bridgets Average
50 kg N Strob 31 49.0 41.1 50.2 52.4 48.2
Triazole 31 46.3 41.0 50.5 52.1 47.5
Strob 31 & 45 48.7 44.3 51.6 53.9 49.6
Mean 48.0 42.1 50.8 52.8 48.4
100 kg N Strob 31 48.7 44.2 51.7 55.5 50.0
Triazole 31 47.1 40.4 53.2 52.8 48.4
Strob 31 & 45 49.6 44.1 51.4 55.1 50.1
Mean 48.5 42.8 52.1 54.5 49.5
150 kg N Strob 31 48.1 42.6 53.6 56.7 50.3
Triazole 31 46.8 40.9 51.0 56.1 48.7
Strob 31 & 45 48.9 45.1 51.7 55.6 50.3
Mean 48.0 42.6 52.1 56.1 49.7
Strob 31 Mean 48.6 42.7 51.9 54.8 49.5
Triazole 31 Mean 46.7 40.8 51.6 53.7 48.2
Strob 31 & 45 Mean 49.1 44.5 51.6 54.8 50.0
Grand Mean 48.1 42.6 51.7 54.5
cv% 3.3 2.7 3.6 2.9
Nitrogen p value 0.756 0.318 0.255 0.001 SED 0.747 0.536 0.882 0.732

38
Fungicide p value 0.016 <0.001 0.932 0.224 SED 0.747 0.536 0.882 0.732
Nitrogen x Fungicide p
value
0.931 0.081 0.274 0.361
SED 1.293 0.928 1.527 0.732
df 16 16 16 16 The grain size differences seen in the hand-harvested samples were reinforced when tgw was
assessed on samples taken from the combine. In these samples in most years the main effects
were significant this may be due to the hand threshed samples losing less of the smaller grains
hence figures are lower than from the combine samples. As a result there is more variation
and less significance detected compared to the combine samples. Increasing fertiliser nitrogen
rate increased tgw significantly at White house in 2000 (p=<0.001), Rosemaund (p=0.009)
and Bridgets (p=0.002) in 2001 (figure 2.1). On average, increases compared to the lowest N
treatment were 2.1 and 2.4% from the 100 and 150 kg/ha N respectively. Seed rate effects
were significant in all years (p=<0.001) with tgw higher at lower seed rates. Increases ranged
from 2.2 g at Rosemaund in 2001 to 5.1g at Bridgets in 2000 (figure 2.2). On average there
was an increase in tgw of 8% as seed rate was reduced from 400 to 100 seeds m-2, the
difference seen was very consistent with that seen in the variety x seed rate interaction trials.
Fungicide effects were significant in three out of the four years, White house, Bridgets in
2000 (p=<0.001) and Bridgets in 2001 (p=0.009), Rosemaund in 2001 was not significant but
the trend was the same. The effects seen were consistent with that seen in the hand-harvested
samples with significantly higher tgw when a strobilurin fungicide was used compared to a
triazole (figure 2.3). A two spray strobilurin programme produced the largest grain with on
average a 3.8% increase over a triazole. Grain size has been identified in section 2 of this
report as one of the most influential factors in homogeneity. So agronomic treatments that
effect grain size offer the grower a way of manipulating homogeneity.

39
42
44
46
48
50
52
54
56
58
Wh 00 Br 00 Rm 01 Br 01
tgw
(g)
50 kg N100 kg N150 kg N
Figure 2.1. Thousand grain weight (g) in Optic spring barley at three nitrogen rates (50, 100
and 150 kg/ha N) from four site seasons.
40
42
44
46
48
50
52
54
56
58
Wh 00 Br 00 Rm 01 Br 01
tgw
(g)
100 seeds/m2400 seeds/m2
Figure 2.2. Thousand grain weight (g) in Optic spring barley at two seed rates (100 and 400
seeds m-2) from four site seasons.

40
42
44
46
48
50
52
54
56
Wh 00 Br 00 Rm 01 Br 01
tgw
(g)
Strob 31Triazole 31Strob 31 & 45
Figure 2.2. Thousand grain weight (g) in Optic spring barley from three fungicide
programmes from four site seasons.
Yield responses
Grain yield was significantly increased with increasing nitrogen rate in all six site years (table
2.7). Responses to the 100 kg/ha rate of nitrogen compared to the lowest nitrogen treatment
ranged from 1.54 t/ha from Bridgets in 2000 to 0.26 at NFC in 2001. Responses to 150 kg/ha
ranged from 1.56 t/ha at NFC in 2000 and 0.58 t/ha from the same site in 2001. On average,
responses were 0.86 t/ha and 0.87 t/ha to each increment of 50 kg N/ha. This concurred with
findings throughout the season of the nitrogen treatments producing larger canopies which
therefore had more assimilates to maintain and increase crop yield components which in turn
leads to an increase in yield.
Fungicide main effects on grain yield were significant in three site years, Rosemaund and
Bridgets in 2000 and Bridgets in 2001 (table 2.8). A significant interaction was seen between
fungicide and nitrogen treatments at Bridgets in 2000 and close to significant at the same site
in 2001. At Bridgets in 2001 there was very little yield response to a second strobilurin at 50
or 100 kg/ha of nitrogen but there was at 150 kg/ha whereas the response to single strobilurin
decreased from 0.23 to 0.03 t/ha as nitrogen was increased. At Bridgets in 2000, the response
to either strobilurin program was significantly better at the higher nitrogen rates than the
response at the low nitrogen rate (figure 2.4). There was an indication of this trend in other

41
years, which can be illustrated by the mean yield response across the six site years presented
in figure 2.5. This suggests that yield responses to strobilurins are greater at higher nitrogen
rates when crop canopies are larger. However the effects of fungicide program on grain
quality and therefore eventual malting market must be taken into consideration, this will be
discussed further in the malting section of this report.
As seed rate was increased from 100 to 400 seeds-2 grain yields increased significantly at four
out of the six sites (table 2.8). The increases seen ranged from 0.2 t/ha at White house in 2000
to 1.13 t/ha at Rosemaund in 2001. On average over the six site seasons the difference
between 100 and 400 seeds was 0.45 t/ha. This represents an 8% yield benefit in using the
higher seed rate for a 300% increase in seed cost. The economic implications of changes in
seed rate are discussed further in Appendix 1 of this report. In general there was no
interaction of seed rate with any other treatment, however the effect of seed rate on physical
grain quality again is something the grower must take into consideration when growing a crop
of spring malting barley.

42
Table 2.7 Combine grain yield (t/ha) of Optic spring barley at harvest from White House and
Bridgets in 2000, Rosemaund and Bridgets in 2001.
2000 2001 Nitrogen treatment
Fungicide treatment
Seedrate Wh Bridgets NFC Rosemaund Bridgets NFC
50 kg N Strob 31 100 4.88 4.88 5.38 2.61 7.14 5.31 400 5.13 5.13 5.18 3.56 8.21 5.21 Triazole 31 100 4.89 4.89 5.57 2.5 7.48 5.24 400 4.44 4.44 5.77 3.53 7.41 5.2 Strob 31 &
45 100 4.85 4.85 5.28 2.56 7.13 5.33
400 5.31 5.31 5.66 5.57 7.92 5.08 Mean 4.92 4.92 5.48 3.06 7.55 5.3
100 kg N Strob 31 100 6.51 6.51 5.66 3.41 8.54 5.55 400 6.44 6.44 5.78 3.87 9.69 5.57 Triazole 31 100 5.89 5.89 5.32 2.72 8.44 5.49 400 5.71 5.71 6.55 4.2 9.44 5.41 Strob 31 &
45 100 7.21 7.21 5.51 3.39 8.75 5.62
400 6.98 6.98 6.71 4.58 9.53 5.67 Mean 6.46 6.46 5.92 3.69 9.07 5.56
150 kg N Strob 31 100 6.83 6.83 6.77 3.72 9.18 5.81 400 7.20 7.2 7.09 5.05 10.56 5.84 Triazole 31 100 6.38 6.38 6.79 3.19 9.24 5.8 400 6.00 6 7.13 4.93 10.45 5.9 Strob 31 &
45 100 7.69 7.69 6.99 3.89 9.84 6.03
400 7.68 7.68 7.49 4.97 11.13 6.18 Mean 6.97 6.97 7.04 4.29 10.07 5.88 Strob 31 Mean 6.17 6.17 5.98 3.7 8.89 5.56 Triazole 31 Mean 5.55 5.55 6.19 3.51 8.74 5.51 Strob 31 & 45 Mean 6.62 6.62 6.27 3.83 9.05 5.67 100 seeds/m2 6.13 6.13 5.92 3.12 8.42 5.59 400 seeds/m2 6.10 6.1 6.37 4.25 9.37 5.6 Grand Mean 6.11 6.11 6.15 3.68 8.89 5.58
cv% 6.8 6.8 9.6 16.4 3.6 5.8 Nitrogen p value <0.001 <0.001 <0.001 <0.001 <0.001 <0.001 SED 0.139 0.139 0.197 0.202 0.107 0.108 Fungicide p value <0.001 <0.001 0.314 0.303 0.03 0.374 SED 0.138 0.138 0.197 0.202 0.107 0.108 Seedrate p value 0.819 0.819 0.008 <0.001 <0.001 0.749 SED 0.113 0.113 0.161 0.165 0.088 0.088 Nitrogen.Fungicide p
value0.038 0.038 0.87 0.871 0.06 0.959

43
SED 0.240 0.24 0.197 0.349 0.186 0.187 Nitrogen.Seedrate p
value0.674 0.674 0.193 0.871 0.01 0.123
SED 0.196 0.196 0.278 0.285 0.152 0.153 Fungicide.Seedrate p
value0.162 0.162 0.259 0.458 0.09 0.991
SED 0.196 0.196 0.278 0.285 0.152 0.153 Nitro.Fung.Seed p
value0.628 0.628 0.824 0.809 0.208 0.648
SED 0.340 0.34 0.482 0.494 0.263 0.265 df 34 34 34 34 32 34
0
0.2
0.4
0.6
0.8
1
1.2
1.4
1.6
50 100 150Nitrogen rate kg/ha
t/ha
Single strobilurinSecond strobilurin
Figure 2.4. Yield response in Optic spring barley to strobilurin fungicide programmes at three
nitrogen rates from Bridgets in 2000.

44
0.0
0.1
0.2
0.3
0.4
0.5
0.6
0.7
50 100 150
Nitrogen rate kg/ha
t/ha
Single strobilurin
Second strobilurin
Figure 2.5. Average yield responses in Optic spring barley to strobilurin fungicide
programmes at three nitrogen rates from six site years.
Grain quality
Specific weight
Specific weight differences were generally small with no significant interactions between the
treatments. Nitrogen had the most significant effect, specific weight increased significantly as
nitrogen rate increased in all six site seasons. Increases from nil to 2.3 kg/hl were seen from
l00 kg N/ha and 0.6 to 2.7 from 150 kg/ha compared to the 50 kg N/ha treatment. On average
across all site seasons, responses were 1.3% and 2% from 100 and 150 kg/ha respectively
compared to the 50 kg/ha nitrogen treatment. Fungicide main effects were significant (p=
<0.001) at all three sites in 2000 but no differences were seen at either site in 2001. Where
significant differences were seen, both strobilurin fungicides programmes increased specific
weight but the most significant were seen from a two-spray programme. Increases of 2.6, 3.7
and 0.7% compared to the single triazole program were seen at White house, Bridgets and
NFC respectively in 2000. Seed rate main effects were significant at Bridgets and NFC in
2000 and Rosemaund in 2001 however they were inconsistent and overall there was little
difference between the seed rates. Although specific weight is used as a quality specification
in the purchase of grain it is of little use as an indicator of malting quality or homogeneity for
brewing performance. Quality measurements for homogeneity that are better at predicting

45
brewing performance have been identified in section 2 of this report which may be more
useful than specific weight.

46
Table 2.8 Specific weight (kg/hl) of Optic spring barley at harvest from White House and
Bridgets in 2000, Rosemaund and Bridgets in 2001.
2000 2001 Nitrogen treatment
Fungicide treatment
Seedrate Wh Bridgets NFC Rosemaund Bridgets
50 kg N Strob 31 100 68 69.6 65.6 68.9 69.9 400 67.3 69.4 65.3 68.9 69.9 Triazole 31 100 68.3 70.1 65.6 69 70 400 67.3 68.7 65.4 69.6 69.6 Strob 31 & 45 100 68.7 70.9 66.1 68.8 70 400 68.7 70.5 65.9 69.6 70.4 Mean 68.1 69.9 65.7 69.2 69.9
100 kg N Strob 31 100 69.5 72.8 65.7 69.6 70.4 400 68.9 71.9 65.5 69.9 70.6 Triazole 31 100 68.6 71.6 65.9 69.6 70.3 400 68.3 70.9 65.3 70 70.9 Strob 31 & 45 100 69.7 73.4 66.6 69.6 70.3 400 70.1 72.5 66.4 70.2 70.6 Mean 69.2 72.2 65.7 69.8 70.5
150 kg N Strob 31 100 69.7 72.3 66 70.2 70.5 400 70.2 72.9 65.5 70.5 71.3 Triazole 31 100 69.5 72.3 66.3 69.7 70.7 400 69.3 70.6 65.6 70.3 70.4 Strob 31 & 45 100 70.7 73.8 66.5 70.4 70.1 400 70.7 73.4 66.7 70.5 71.1 Mean 70 72.6 66.3 70.3 70.7 Strob 31 Mean 69 71.5 65.6 69.7 70.4 Triazole 31 Mean 68.5 70.7 65.7 69.7 70.3 Strob 31 & 45 Mean 69.8 72.5 66.3 69.9 70.4 100 seeds/m2 69.2 71.9 66 69.5 70.2 400 seeds/m2 69 71.2 65.7 69.9 70.5 Grand Mean 69.1 71.6 65.9 69.7 70.4
cv% 0.8 0.9 0.7 0.7 0.9 Nitrogen p value <0.001 <0.001 0.058 <0.001 0.003 SED 0.192 0.211 0.161 0.153 0.217 Fungicide p value <0.001 <0.001 <0.001 0.415 0.884 SED 0.192 0.211 0.161 0.153 0.217 Seedrate p value 0.152 <0.001 0.024 0.003 0.092 SED 0.157 0.172 0.132 0.125 0.178 Nitrogen.Fungicide p
value0.427 0.186 0.87 0.383 0.76
SED 0.332 0.365 0.279 0.265 0.377
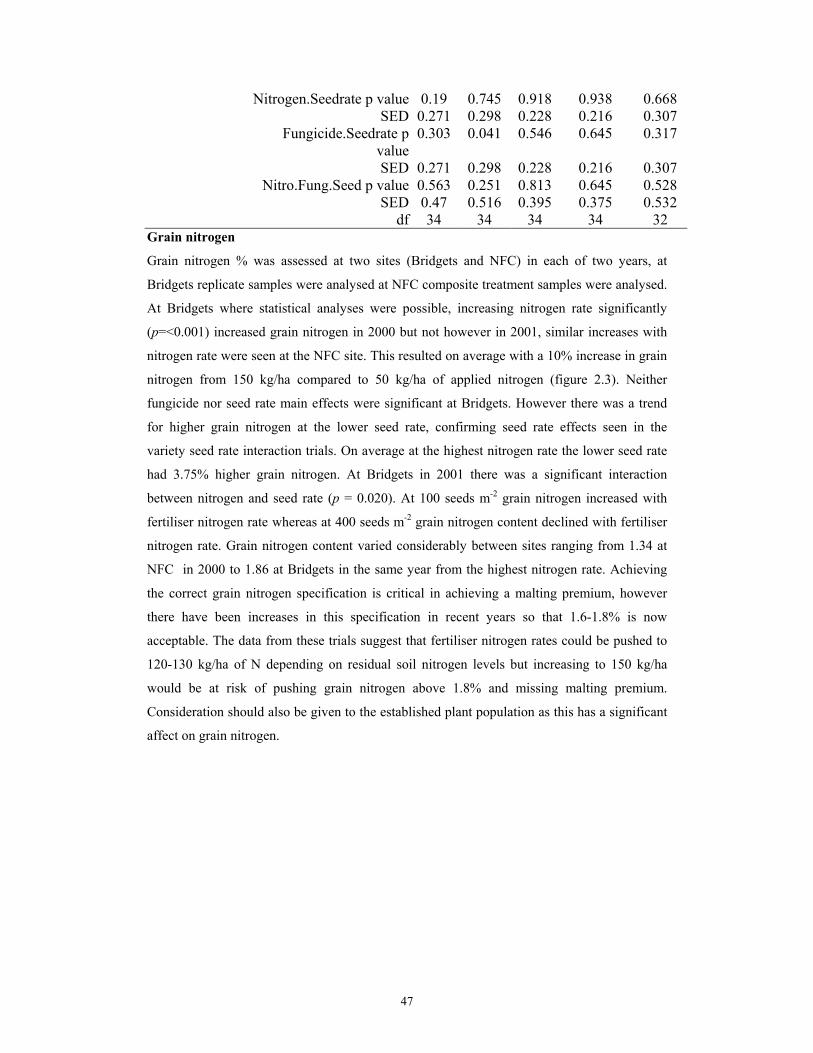
47
Nitrogen.Seedrate p value 0.19 0.745 0.918 0.938 0.668 SED 0.271 0.298 0.228 0.216 0.307 Fungicide.Seedrate p
value0.303 0.041 0.546 0.645 0.317
SED 0.271 0.298 0.228 0.216 0.307 Nitro.Fung.Seed p value 0.563 0.251 0.813 0.645 0.528 SED 0.47 0.516 0.395 0.375 0.532 df 34 34 34 34 32
Grain nitrogen
Grain nitrogen % was assessed at two sites (Bridgets and NFC) in each of two years, at
Bridgets replicate samples were analysed at NFC composite treatment samples were analysed.
At Bridgets where statistical analyses were possible, increasing nitrogen rate significantly
(p=<0.001) increased grain nitrogen in 2000 but not however in 2001, similar increases with
nitrogen rate were seen at the NFC site. This resulted on average with a 10% increase in grain
nitrogen from 150 kg/ha compared to 50 kg/ha of applied nitrogen (figure 2.3). Neither
fungicide nor seed rate main effects were significant at Bridgets. However there was a trend
for higher grain nitrogen at the lower seed rate, confirming seed rate effects seen in the
variety seed rate interaction trials. On average at the highest nitrogen rate the lower seed rate
had 3.75% higher grain nitrogen. At Bridgets in 2001 there was a significant interaction
between nitrogen and seed rate (p = 0.020). At 100 seeds m-2 grain nitrogen increased with
fertiliser nitrogen rate whereas at 400 seeds m-2 grain nitrogen content declined with fertiliser
nitrogen rate. Grain nitrogen content varied considerably between sites ranging from 1.34 at
NFC in 2000 to 1.86 at Bridgets in the same year from the highest nitrogen rate. Achieving
the correct grain nitrogen specification is critical in achieving a malting premium, however
there have been increases in this specification in recent years so that 1.6-1.8% is now
acceptable. The data from these trials suggest that fertiliser nitrogen rates could be pushed to
120-130 kg/ha of N depending on residual soil nitrogen levels but increasing to 150 kg/ha
would be at risk of pushing grain nitrogen above 1.8% and missing malting premium.
Consideration should also be given to the established plant population as this has a significant
affect on grain nitrogen.

48
1.35
1.40
1.45
1.50
1.55
1.60
1.65
1.70
50 100 150
Nitrogen rate (kg/ha)
N%100 seeds400 seeds
Figure 2.3. Average Grain nitrogen % in Optic spring barley from two seed rates (100 and
400 seeds m-2) at three nitrogen rates from four site years (Bridgets and NFC 2000 and 2001).
Appendix 3
Variety typing
Materials & Methods
At two sites (Rosemaund and NFC) in 2002 thirteen varieties were sown at a standard seed
rate (400 seeds m-2). The varieties evaluated were Optic, Chariot, Cellar, Tavern, Chalice,
County, Pewter, Static, Colston, Cocktail, Vortex, Novello and Sebastien. The varieties were
fully randomised in each block and replicated three times. Plots were drilled with an ‘Oyjord
type’ tractor mounted seed drill and plot dimensions were 2m wide by 24m long at the ADAS
site and 1.5m wide by 10m long at NFC. All plots received standard rates of agrochemicals
and fertilisers with an aim to maintain undisturbed and healthy crop growth.
Results and Discussion
Plant establishment
Established plant populations from Rosemaund showed there was a significant difference
(p=0.008) in plant establishment between the varieties. Plant populations ranged from 203 for
Optic and Chariot to 274 for Static. From the seed rate x variety interaction data from the
same site in the same year, the established population was slightly below the economic
optimum population.
Table 3.1. Plant population of a range of varieties at ADAS Rosemaund in 2002.
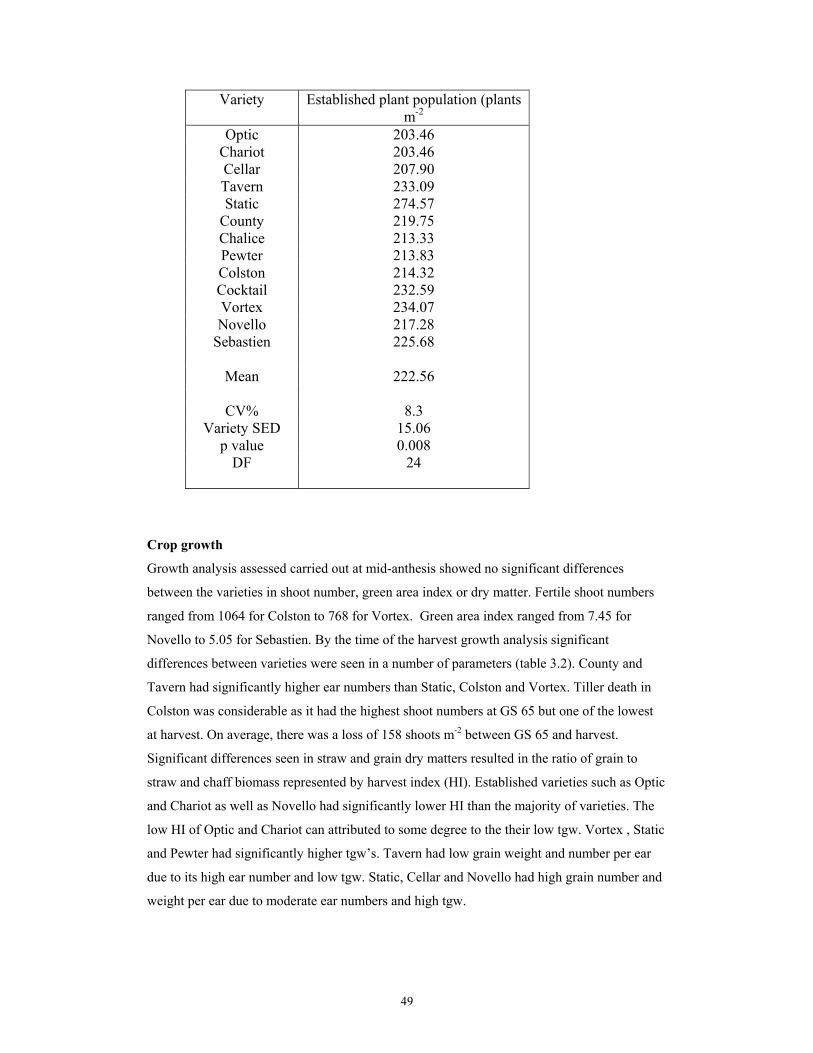
49
Variety Established plant population (plants m-2
Optic 203.46 Chariot 203.46 Cellar 207.90 Tavern 233.09 Static 274.57
County 219.75 Chalice 213.33 Pewter 213.83 Colston 214.32 Cocktail 232.59 Vortex 234.07 Novello 217.28
Sebastien 225.68
Mean 222.56
CV% 8.3 Variety SED 15.06
p value 0.008 DF 24
Crop growth
Growth analysis assessed carried out at mid-anthesis showed no significant differences
between the varieties in shoot number, green area index or dry matter. Fertile shoot numbers
ranged from 1064 for Colston to 768 for Vortex. Green area index ranged from 7.45 for
Novello to 5.05 for Sebastien. By the time of the harvest growth analysis significant
differences between varieties were seen in a number of parameters (table 3.2). County and
Tavern had significantly higher ear numbers than Static, Colston and Vortex. Tiller death in
Colston was considerable as it had the highest shoot numbers at GS 65 but one of the lowest
at harvest. On average, there was a loss of 158 shoots m-2 between GS 65 and harvest.
Significant differences seen in straw and grain dry matters resulted in the ratio of grain to
straw and chaff biomass represented by harvest index (HI). Established varieties such as Optic
and Chariot as well as Novello had significantly lower HI than the majority of varieties. The
low HI of Optic and Chariot can attributed to some degree to the their low tgw. Vortex , Static
and Pewter had significantly higher tgw’s. Tavern had low grain weight and number per ear
due to its high ear number and low tgw. Static, Cellar and Novello had high grain number and
weight per ear due to moderate ear numbers and high tgw.

50
Table 3.2. Crop growth assessment at harvest from a range of varieties at ADAS Rosemaund
in 2002.
Variety Final Ear number
Harvest Index %
Thousand grain
weight g
Grain weight /ear
g
Grain number /ear
Optic 737.90 46.54 45.93 0.71 17.80 Chariot 712.11 43.26 44.24 0.74 19.18 Cellar 726.26 55.22 50.92 0.98 22.04 Tavern 920.38 52.78 47.10 0.67 16.31 Static 631.37 57.24 52.00 1.04 23.05 County 923.22 53.69 49.45 0.75 17.51 Chalice 781.06 52.49 49.52 0.87 20.27 Pewter 722.12 54.12 51.80 0.96 21.31 Colston 562.06 52.19 49.73 0.92 21.26 Cocktail 757.03 54.14 49.28 0.86 20.08 Vortex 560.10 51.75 53.03 0.97 21.03 Novello 539.30 48.21 51.61 0.98 21.86 Sebastien 818.07 55.61 47.88 0.83 20.00 Mean 722.38 52.10 49.42 0.87 20.13
CV% 19.5 4.9 3.6 8.5 6.1 Variety SED 115.0 2.084 1.47 0.060 1.005
p value 0.035 < 0.001 < 0.001 < 0.001 < 0.001 DF 24 24 24 24 24
Yield and quality
Significant varietal differences (p = <0.001) in yield were seen at both sites. The low HI and
tgw detected in Optic and Chariot at the Rosemaund site in 2002, which indicated likely poor
yield performance, were substantiated by the combine grain yields. Optic and Chariot were 6
and 14 % below average respectively (figure 3.1) and this loss of yield performance compared
newer varieties is responsible for them no longer featuring on the recommended list. Some of
the newer varieties such as Vortex, Colston and Cocktail performed well in yield terms.
However to be considered for malting other quality characteristics and acceptance by the
maltsters is required. Vortex had very low grain N in these trials which maybe of concern to
the malsters, but may also indicate it needs higher rates of applied fertiliser nitrogen than
other varieties.
Thousand grain weight assessed on combine grain sample in general agreed with those
assessed on hand harvested samples with Optic and Chariot significantly lower. Novello,
Cellar, Static and Pewter had the highest tgw’s (table 3.3). There was some agreement

51
between sites in specific weight with Pewter having the lowest at both sites (table 3.3 and
3.4). Significantly higher screening losses were seen in Chariot, County and Chalice at
Rosemaund but no differences were detected at NFC.
5.0
5.5
6.0
6.5
7.0
7.5
8.0
Vortex
Colston
Cellar
Cockta
il
County
Static
Pewter
Tavern
Novell
o
Chalic
e
Sebas
tien
Optic
Chario
t
Yield t/ha
1
1.1
1.2
1.3
1.4
1.5
1.6
1.7
1.8
Grain %N
Figure 3.1. Average yield from a range of varieties from two site Rosemaund and New farm
crops in 2002, Grain % nitrogen from NFC in 2002.
Table 3.3. Grain quality data from combine grain samples from Rosemaund in 2002
Variety Specific weight kg/hl
Thousand grain weight g
Grain size % > 2.2 mm
Optic 73.50 46.89 97.07 Chariot 72.10 45.07 95.11 Cellar 71.83 54.33 98.21 Tavern 73.37 51.32 98.07 Static 71.10 53.20 98.10 County 72.10 51.66 96.90 Chalice 71.60 51.71 96.75 Pewter 70.60 52.71 98.30 Colston 72.60 49.94 98.35 Cocktail 72.43 50.33 97.42 Vortex 72.43 52.57 97.56 Novello 71.47 54.71 98.08 Sebastien 72.13 48.52 97.52 Mean 72.10 51.00 97.50
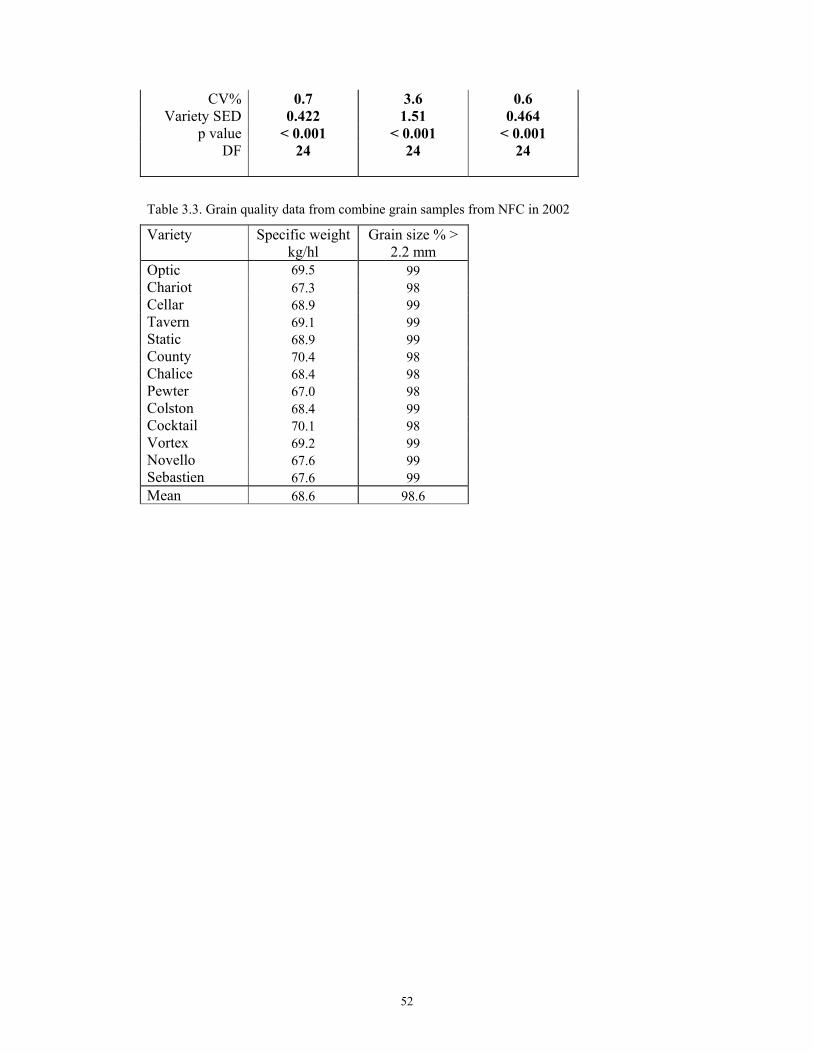
52
CV% 0.7 3.6 0.6 Variety SED 0.422 1.51 0.464
p value < 0.001 < 0.001 < 0.001 DF 24 24 24
Table 3.3. Grain quality data from combine grain samples from NFC in 2002
Variety Specific weight kg/hl
Grain size % > 2.2 mm
Optic 69.5 99 Chariot 67.3 98 Cellar 68.9 99 Tavern 69.1 99 Static 68.9 99 County 70.4 98 Chalice 68.4 98 Pewter 67.0 98 Colston 68.4 99 Cocktail 70.1 98 Vortex 69.2 99 Novello 67.6 99 Sebastien 67.6 99 Mean 68.6 98.6

53
Appendix 4
Sowing date x Variety interaction
Materials & Methods
At a single site (Terrington) in 2002 seven varieties were sown at a standard seed rate (400
seeds m-2) on two sowing dates. A normal sowing on 18 February 2002 and a late sowing of
10 April 2002. The seven varieties evaluated were Optic, Cellar, Tavern, Chalice, County,
Pewter and Static. The experimental design was a split plot plus factorial with sowing date as
main plots and variety as fully randomised sub-plots. Plots were drilled with an ‘Oyjord type’
tractor mounted seed drill and plot dimensions were 2m wide by 24m long. All plots received
standard rates of agrochemicals and fertilisers with an aim to maintain undisturbed and
healthy crop growth.
Results and Discussion
Crop growth
Crop growth assessed just before harvest showed significant differences (p=0.046) in harvest
index (HI) between sowing dates (table 4.1). A higher ratio of grain to straw and chaff
biomass indicated by a higher HI was produced from the normal sowings compared to the
later sowing date. On average, HI was 9% higher from a February sowing than an April
sowing. From the individual components of crop growth, straw, grain and total biomass a
significant interaction of sowing date and variety was seen (table 4.1). Variety County
differed significantly in it’s response in grain biomass at the different sowing dates, it has
2.17 t/ha lower hand harvested grain yield from an April sowing date compared to a February
sowing date. Whereas Cellar had a grain yield 1.05 t/ha higher from an April sowing date
compared to a February sowing. Cellar also showed a similar trend in straw and total biomass
producing more from an April sowing compared to a February sowing. The grain yield
interaction is linked to the number of ears produced as significant varietal interactions
(p=0.053) are also seen in this component (table 4.2). From a February sowing date, where
County had the highest hand harvested grain yield it also produced the highest ear numbers.
At the later sowing where it had significantly lower yield it produced one of the lowest ear
numbers. Cellar produces the highest number of ears and hand harvested yield from an April
sowing but had the converse from a February sowing. On average, 78 more ears were
produced from an April sowing compared to a February sowing. Varietal interactions with
sowing date similar to these have been seen in wheat (J Spink, MJ Fouulkes et al, 2000). The
differences in ear number with sowing date affected grain weight and number per ear. These
were both significantly higher from a February sowing compared to an April sowing. Grain

54
weight and grain number per ear were 16 % and 13% higher respectively from a February
sowing compared to the later sowing. There was no significant interaction between sowing
date and variety in hand harvested thousand grain weight (tgw) and only the varieties differed
significantly in main effects. Although there was a trend for higher tgw’s from the February
sowing date.
Table 4.1. Crop growth assessment at harvest from a range of varieties and two sowing dates
at ADAS Terrington in 2002.
Biomass t/ha at 100% dry
matter Sowing date Variety Harvest Index
% Straw Grain Total
February Optic 47.76 3.86 4.92 10.26 Cellar 52.97 2.70 4.76 8.99 Tavern 49.45 3.29 5.06 10.27 Static 49.01 3.77 5.62 11.48 County 53.14 4.21 7.06 13.26 Chalice 48.76 3.48 4.72 9.74 Pewter 49.57 2.69 4.19 8.46 February Mean 50.10 3.43 5.19 10.35 April Optic 43.90 4.28 4.59 10.48 Cellar 45.36 4.94 5.81 12.73 Tavern 47.48 4.23 5.60 11.81 Static 48.26 4.56 5.59 11.58 County 43.22 4.45 4.89 11.28 Chalice 46.89 3.77 4.91 10.47 Pewter 45.64 3.52 4.65 10.12 April Mean 45.82 4.25 5.15 11.21 Overall Mean 47.96 3.84 5.17 10.78
CV% 2.4 9.0 2.3 4.8 Sowing date
SED 0.947 0.282 0.097 0.423
p value 0.046 NS NS NS DF 2 2 2 2
Variety SED 1.938 0.282 0.442 0.685 p value NS 0.005 0.026 0.006
CV% 7.0 12.7 14.8 11.0 Interaction SED 2.741 0.399 0.625 0.969
p value NS 0.027 0.036 0.017 DF 24 24 24 24

55
Table 4.2. Crop growth assessment at harvest from a range of varieties and two sowing dates
at ADAS Terrington in 2002.
Sowing date Variety Thousand
grain weight g Grain weight /ear g
Grain number /ear
Final Ear
number February Optic 47.48 1.02 24.56 497.38 Cellar 49.15 1.00 23.35 483.72 Tavern 51.53 1.06 23.80 479.03 Static 50.17 0.99 22.66 575.64 County 50.70 0.95 21.58 744.23 Chalice 51.80 0.95 20.96 512.31 Pewter 52.65 1.04 22.72 421.62 February Mean 50.50 1.00 22.80 530.56 April Optic 46.93 0.81 19.99 565.53 Cellar 49.52 0.80 18.63 736.10 Tavern 50.21 0.84 19.31 672.75 Static 48.39 0.88 20.97 639.71 County 50.83 0.85 19.18 577.69 Chalice 48.10 0.86 20.54 575.39 Pewter 49.08 0.95 22.14 492.08 April Mean 49.01 0.86 20.11 608.46 Overall Mean 49.75 0.93 21.46 569.51
CV% 1.9 3.9 1.7 4.6 Sowing date
SED 0.778 0.030 0.306 21.4
p value NS 0.039 0.013 0.068 DF 2 2 2 2
Variety SED 1.007 0.89 1.976 59.2 p value 0.014 NS NS 0.051
CV% 3.5 16.6 15.9 18.0 Interaction SED 1.425 0.126 2.794 83.8
p value NS NS NS 0.053 DF 24 24 24 24
Combine yield and quality
The significant interactions and differences seen in hand harvested grain yield were not borne
out by combine grain yields, which only detected significant differences (p= <0.001) in
varietal main effects (table 4.3). The reason for this is unknown and further research to
investigate the interaction of sowing date and variety would be required to understand more
fully the effects on crop growth and grain yield. Varietal main effects in combine grain yield
saw Tavern and Cellar giving the best yields of 7.45 and 7.19 t/ha respectively meaned across
the two sowing dates. Similarly thousand grain weight assessed on combine grain samples
saw significant differences between varieties only. Although there was a trend for higher

56
tgw’s from a February sowing which was consistent with that seen in the same assessment on
hand harvested samples. County had the highest tgw of 50.64g and Optic the lowest of 43.89g
averaged across the sowing dates.
There was an indication that there were varietal interactions in crop growth at different
sowing dates although final yield results did not confirm this. A larger difference in sowing
date than achieved in these trials may result in significant differences in combine grain yield
being detected. The results suggest that a more thorough investigation of varietal suitability to
certain sowing dates and effects on grain quality is required in order to quantify the effect on
homogeneity of the barley sample.
Table 4.3. Yield and quality data from a range of varieties and two sowing dates at ADAS
Terrington in 2002.
Sowing date Variety Grain yield
t/ha Specific
weight kg/hl Thousand
grain weight g February Optic 6.03 63.76 46.88 Cellar 6.87 64.23 49.64 Tavern 7.19 64.65 50.03 Static 6.78 61.97 49.83 County 6.82 65.01 52.90 Chalice 6.24 61.91 47.34 Pewter 6.81 63.66 50.60 February Mean 6.67 63.60 49.60 April Optic 6.65 64.03 40.90 Cellar 7.51 63.66 48.22 Tavern 7.72 64.25 47.11 Static 6.66 61.72 41.86 County 6.94 63.50 48.38 Chalice 6.62 63.22 43.89 Pewter 7.03 62.54 47.46 April Mean 7.02 63.27 45.40 Overall Mean 6.85 63.44 47.50
CV% 3.2 2.5 5.1 Sowing date
SED 0.178 1.276 1.98
p value NS NS NS DF 2 2 2
Variety SED 0.196 0.910 1.287 p value <0.001 0.074 <0.001
CV% 5.0 2.5 4.7 Interaction SED 0.277 1.287 1.819
p value NS NS NS DF 24 24 24

57
Appendix 5
IMAGE ANALYSIS ASSESSMENTS Materials and Methods Field experiments Replicated experiments were conducted at White house farm, Sellack, Ross-on-Wye, Herefordshire in 2000, ADAS Rosemaund, Preston wynne, Herefordshire in 2001 and ADAS Bridgets, Martyr Worthy, Hampshire in 2000 and 2001. The experiments investigated the effects of a range of five seedrates (50, 100, 200, 400, 800 seeds/m2) on four varieties. Grain samples At harvest, grain yield was determined using a plot combine harvester and associated weigh equipment, 3 kg samples were taken from all plots in both experiments. A sub-sample was then cleaned to the industry standard, moisture content (%), specific weight (kg/hl) and temperature (0C) determined using a Dickey-John II moisture meter and thousand grain weight (g) using a numigral grain counter. A representative 50g sub-sample of the cleaned grain was taken for grain image analysis assessment from all the plots from one variety (Optic) at both sites. This gave a total of 15 samples per site (5 seedrates x 3 replicates). Grain Image Analysis The 50g sub-sample was carefully poured onto a modified 5mm slotted sieve plate situated on a substage illuminated light box. Grains were carefully brushed into the slots in the sieve plate and any excees grain removed. The sieve plate was then carefully removed without disturbing any grains to leave 150-160 spatially isolated grains in a 17cm x 17cm field on the light box. A solid state video camera mounted to a camera stand directly above the light box and connected to a Delta-T Image Analysis System (DIAS, Delta-T Devices, Burwell, Cambridge) was used to capture the silhouetted images. The DIAS digitised the images with 512 x 488 pixels with a spatial resolution of 0.33 mm/pixel. The minimum object area was set to 0.1 mm. Each grain was automatically identified and measured for area, perimeter, length, width and shape factor (ratio of actual perimeter to that of a circle with the same area). The mean value for each variate for the 150-160 grains was then subjected to analysis of variance.

58
Results and Conclusions The image analysis data in table 1 for the Herefordshire site confirms the increase in grain size with seedrate seen in the thousand grain weight figures. Significant effects of seedrate are seen in all the image analysed grain size measurements. However the increases seen are much less than those detected in thousand grain weight. Thousand grain weight was seen to increase 20.6 % from 800 to 50 seeds/m2 but grain area only increased by 10.8 % and grain width by 6.1 % for the corresponding seedrates (Fig 1.). Grain shape was not significantly influenced by seedrate as demonstrated by the shape factor variable. Table 1. Grain size components obtained by Image Analysis of Optic Spring Barley from Sellack, Herefordshire in 2000.
Seedrate m-2 Area mm-2
Perimeter mm
Length mm
Width mm
Shape Factor
Thousand grain wt (g)
50 27.11 22.182 9.034 3.968 12.037 56.42 100 26.64 21.993 8.927 3.945 12.033 52.42 200 26.14 21.848 8.885 3.884 12.069 50.98 400 25.21 21.331 8.664 3.823 12.003 49.50 800 24.47 21.118 8.586 3.740 12.067 46.77
Mean 25.92 21.695 8.819 3.872 12.042 51.22
Seedrate p value <0.001 0.003 <0.001 <0.001 ns <0.001
SED 0.034 0.196 0.070 0.031 0.062 0.60 df 14 14 14 14 14 14
cv% 1.6 1.1 1.0 1.0 0.6 3.0
0.0
5.0
10.0
15.0
20.0
25.0
50 100 200 400 800Seedrate
%
TgwAreaWidth
Figure 1. Response (% of 800) to seedrate of Tgw, grain area and grain width. The data from the Hampshire site concurs with the Herefordshire site with significant increases in grain size with reduced seedrates, although some of the significance levels were less. The complete thousand grain weight data set was not available but the indication was that a similar trend to that seen at the other site was present. The increases in thousand grain

59
weight seen when seedrates were reduced from 400 to 100 were about double what was detected in grain area and grain width. Again grain shape was not significantly influenced by seedrate. Table 2. Grain size components obtained by Image Analysis of Optic Spring Barley from Bridgets, Hampshire in 2000.
Seedrate m-2 Area mm-2
Perimeter mm
Length mm
Width mm
Shape Factor
Thousand grain wt (g)
50 26.60 21.972 8.897 3.976 12.033 100 25.99 21.671 8.790 3.927 12.002 45.03 200 25.48 21.505 8.723 3.854 12.031 400 24.50 21.020 8.591 3.754 11.994 40.23 800 24.34 21.079 8.590 3.726 12.067
Mean 25.38 21.449 8.718 3.847 12.026 42.63
Seedrate p value 0.003 0.003 0.016 <0.001 ns
SED 0.043 0.178 0.076 0.035 0.041 df 14 14 14 14 14
cv% 2.1 1.0 1.1 1.1 0.4 A cross site analysis of the image analysis data shows that the site had a significant effect on grain area only at p<0.05 although some trends were seen in grain length and perimeter at lower significance levels. There were no significant site x seedrate interactions showing a consistency of the seedrate effect on grain size across the sites. Table 3. Cross site analysis of grain size components for 2000.
Seedrate m-2 Area mm-2
Perimeter mm
Length mm
Width mm
Shape Factor
50 26.86 22.077 8.965 3.972 12.035 100 26.32 21.832 8.858 3.936 12.018 200 25.81 21.676 8.804 3.869 12.050 400 24.86 21.176 8.627 3.789 11.998 800 24.40 21.098 8.588 3.733 12.067
Mean 25.65 21.572 8.769 3.860 12.034
Site p value 0.034 0.095 0.171 ns ns
SED 0.017 0.112 0.060 0.022 0.047 df 4 4 4 4 4
cv% 0.8 0.6 0.8 0.7 0.5 Seedrate p value <0.001 <0.001 <0.001 <0.001 ns
SED 0.027 0.132 0.052 0.023 0.037 Site x Seedrate p value ns ns ns ns ns
SED 0.038 0.202 0.089 0.036 0.066 df 16 16 16 16 16
cv% 1.8 1.1 1.0 1.0 0.5

60
The assessments were repeated on grain samples from the 2001 trials using the same analysis techniques. These results concurred with the first years findings with significant effects on all image analysed grain size measurements except width and shape factor from the Rosemaund site (table 4). In this year the Hampshire site showed greater significant differences (p=<0.001) than the Herefordshire site (table 5). Thousand grain weight was seen to increase 14.9% from 800 to 50 seed/m2 at Bridgets compared to 8.5% at Rosemaund. Table 4. Grain size components obtained by Image Analysis of Optic Spring Barley from ADAS Rosemaund, Herefordshire in 2001.
Seedrate m-2 Area mm-2
Perimeter mm
Length mm
Width mm
Shape Factor
Thousand grain wt (g)
50 26.273 22.035 9.024 3.809 1.217 57.11 100 26.319 21.962 8.992 3.829 1.211 56.33 200 25.549 21.611 8.824 3.783 1.209 55.34 400 24.835 21.257 8.692 3.734 1.206 54.28 800 24.897 21.232 8.656 3.762 1.203 52.64
Mean 25.525 21.590 8.824 3.781 1.209 55.14
Seedrate p value 0.027 0.014 0.017 0.152 0.096 -
SED 0.449 0.205 0.196 0.036 0.004 - df 13 13 13 13 13 -
cv% 2.1 1.2 1.3 1.2 0.4 - Table 5. Grain size components obtained by Image Analysis of Optic Spring Barley from Bridgets, Hampshire in 2001.
Seedrate m-2 Area mm-2
Perimeter mm
Length mm
Width mm
Shape Factor
Thousand grain wt (g)
50 26.457 22.279 9.176 3.799 1.226 50.2 100 25.942 21.820 8.954 3.807 1.211 49.9 200 24.994 21.353 8.763 3.744 1.208 50.1 400 23.956 20.829 8.542 3.668 1.203 45.6 800 23.581 20.673 8.468 3.646 1.203 43.7
Mean 24.986 21.391 8.781 3.733 1.210 47.9
Seedrate p value <0.001 <0.001 <0.001 <0.001 <0.001 -
SED 0.202 0.114 0.055 0.012 0.002 - df 14 14 14 14 14 -
cv% 1.0 0.7 0.8 0.4 0.3 -

61
Table 6. Cross site analysis of grain size components in 2001
Seedrate m-2 Area mm-2
Perimeter mm
Length mm
Width mm
Shape Factor
50 26.383 22.181 9.115 3.803 1.222 100 26.131 21.891 8.973 3.818 1.211 200 25.272 21.482 8.794 3.763 1.209 400 24.396 21.043 8.617 3.701 1.205 800 24.239 20.952 8.562 3.704 1.203
Mean 25.246 21.487 8.802 3.756 1.209
Site p value <0.001 0.003 0.085 <0.001 0.434
SED 0.145 0.068 0.032 0.012 0.001 df 4 4 4 4 4
cv% 0.4 0.2 0.1 0.3 0.1 Seedrate p value <0.001 <0.001 <0.001 <0.001 <0.001
SED 0.230 0.108 0.050 0.018 0.002 Site x Seedrate p value 0.060 0.021 0.034 0.083 0.153
SED 0.325 0.153 0.071 0.026 0.003 df 17 17 17 17 17
cv% 1.6 0.9 1.0 0.9 0.3 The preceeding discussion and results have been concerned with differences in grain size between seedrates detected by the image analysis technique. However more interesing for this project is to understand whether different seedrates produce a grain sample of more or less uniform or homogeneous grain size than others. Hence to explore the hypothesis ‘that physical grain uniformity does not change with changes in seed rate’. Further statistical analysis of the data is required to verify this hypothesis. In the following frequency distribution graphs, data are presented for the whole sample of between 450-470 grains per treatment for two grain size components, grain area and width. These suggest that reducing seed rate increases grain size so that there are more larger grains. However it has an adverse affect on the grain size distribution in that there is a larger variation in grain size indicated by the higher standard deviations at lower seed rates. This would possibly lead to a less homogenous sample. This seedrate effect on grain size distribution is worthy of further analysis particularly the relationship to malt homogeneity. The image analysis technique may be able to developed further using new digital camera or scanner technology, which would improve throughput and accuracy. It then may have utility in grain intake as a rapid analysis method.

62
Frequency distribution graphs for grain area (mm-2) all sample (450-60 grains) from Herefordshire site in 2000. Figure 1. 50 seeeds/m2 Figure 2. 100 seeeds/m2
Standard Deviation: 0.312
0
10
20
30
40
50
60
70
80
1.6 1.8 2 2.2 2.4 2.6 2.8 3 3.2 3.4
Standard Deviation: 0.295
0
10
20
30
40
50
60
70
80
1.6 1.8 2 2.2 2.4 2.6 2.8 3 3.2 3.4
Figure 3. 200 seeeds/m2 Figure 4. 400 seeeds/m2
Standard Deviation: 0.289
0
10
20
30
40
50
60
70
80
1.6 1.8 2 2.2 2.4 2.6 2.8 3 3.2 3.4
Standard Deviation: 0.278
0
10
20
30
40
50
60
70
80
1.6 1.8 2 2.2 2.4 2.6 2.8 3 3.2 3.4
Figure 5. 800 seeeds/m2 Figure 6. Comparison of three seedrates
Standard Deviation: 0.313
0
10
20
30
40
50
60
70
80
1.6 1.8 2 2.2 2.4 2.6 2.8 3 3.2 3.4
0
10
20
30
40
50
60
70
80
1.6 1.8 2 2.2 2.4 2.6 2.8 3 3.2 3.4
50400800

63
Frequency distribution graphs for grain area (mm-2) all sample (450-60 grains) from Hants site in 2000 Figure 1. 50 seeeds/m2 Figure 2. 100 seeeds/m2
Standard Deviation: 0.331
0
10
20
30
40
50
60
70
80
1.6 1.8 2 2.2 2.4 2.6 2.8 3 3.2 3.4
Standard Deviation: 0.276
0
10
20
30
40
50
60
70
80
1.6 1.8 2 2.2 2.4 2.6 2.8 3 3.2 3.4
Figure 3. 200 seeeds/m2 Figure 4. 400 seeeds/m2
Standard Deviation: 0.248
0
10
20
30
40
50
60
70
80
1.6 1.8 2 2.2 2.4 2.6 2.8 3 3.2 3.4
Standard Deviation: 0.249
0
10
20
30
40
50
60
70
80
1.6 1.8 2 2.2 2.4 2.6 2.8 3 3.2 3.4
Figure 5. 800 seeeds/m2 Figure 6. Comparison of three seedrates
Standard Deviation: 0.252
0
10
20
30
40
50
60
70
80
1.6 1.8 2 2.2 2.4 2.6 2.8 3 3.2 3.4
0
10
20
30
40
50
60
70
80
90
1.6 1.8 2 2.2 2.4 2.6 2.8 3 3.2 3.4
50400800

64
Frequency distribution graphs for grain width (mm) all sample (450-60 grains) from Herefordshire site in 2000 Figure 1. 50 seeeds/m2 Figure 2. 100 seeeds/m2
Standard Deviation: 0.290
0
20
40
60
80
100
120
140
160
2.8 3 3.2 3.4 3.6 3.8 4 4.2 4.4 4.6 4.8 5 5.2 5.4
Standard Deviation: 0.269
0
20
40
60
80
100
120
140
160
2.8 3 3.2 3.4 3.6 3.8 4 4.2 4.4 4.6 4.8 5 5.2 5.4
Figure 3. 200 seeeds/m2 Figure 4. 400 seeeds/m2
Standard Deviation: 0.271
0
20
40
60
80
100
120
140
160
2.8 3 3.2 3.4 3.6 3.8 4 4.2 4.4 4.6 4.8 5 5.2 5.4
Standard Deviation: 0.275
0
20
40
60
80
100
120
140
160
2.8 3 3.2 3.4 3.6 3.8 4 4.2 4.4 4.6 4.8 5 5.2 5.4
Figure 5. 800 seeeds/m2 Figure 6. Comparison of three seedrates
Standard Deviation: 0.298
0
20
40
60
80
100
120
140
160
2.8 3 3.2 3.4 3.6 3.8 4 4.2 4.4 4.6 4.8 5 5.2 5.40
0.1
0.2
0.3
0.4
0.5
0.6
0.7
0.8
0.9
1
0
20
40
60
80
100
120
140
160
180
2.8 3 3.2 3.4 3.6 3.8 4 4.2 4.4 4.6 4.8 5 5.2 5.4
50400800

65
Frequency distribution graphs for grain width (mm) all sample (450-60 grains) from Hants site in 2000 Figure 1. 50 seeeds/m2 Figure 2. 100 seeeds/m2
Standard Deviation: 0.261
0
20
40
60
80
100
120
140
160
2.8 3 3.2 3.4 3.6 3.8 4 4.2 4.4 4.6 4.8 5 5.2 5.4
Standard Deviation: 0.239
0
20
40
60
80
100
120
140
160
2.8 3 3.2 3.4 3.6 3.8 4 4.2 4.4 4.6 4.8 5 5.2 5.4
Figure 3. 200 seeeds/m2 Figure 4. 400 seeeds/m2
Standard Deviation: 0.238
0
20
40
60
80
100
120
140
160
2.8 3 3.2 3.4 3.6 3.8 4 4.2 4.4 4.6 4.8 5 5.2 5.4
Standard Deviation: 0.237
0
20
40
60
80
100
120
140
160
2.8 3 3.2 3.4 3.6 3.8 4 4.2 4.4 4.6 4.8 5 5.2 5.4
Figure 5. 800 seeeds/m2 Figure 6. Comparison of three seedrates
Standard Deviation: 0.249
0
20
40
60
80
100
120
140
160
2.8 3 3.2 3.4 3.6 3.8 4 4.2 4.4 4.6 4.8 5 5.2 5.40
0.1
0.2
0.3
0.4
0.5
0.6
0.7
0.8
0.9
1
0
20
40
60
80
100
120
140
160
180
2.8 3 3.2 3.4 3.6 3.8 4 4.2 4.4 4.6 4.8 5 5.2 5.4
50400800

66
References
AXCELL, B. (1999) The implications of malt homogeneity in brewing. Proc. Congr. Eur. Brew. Conv.
(Cannes), in press.
HOME, S., STENHOLM, K. AND OLKKU, J. (1999) Proc. Congr. Eur. Brew. Conv. (Cannes), in press.
MOLISCH, H. (1937) Der Einfluss einer Pflanze auf die andere – Alelopathie. Jena, Germany. Fischer (Jena).
PALMER, G. H. (1999) Achieving homogeneity in malting. Proc. Congr. Eur. Brew. Conv. (Cannes), in press.
PUTNAM A.R. (1985) Allelopathic research in agriculture: Past highlights and potential. In The Chemistry of
Allelopathy: Biochemical interactions among plants. American Chemical Society Symposium Series No 268,
pp.1-8. Ed. AC Thompson, Washington DC, USA: American Chemical Society.
SPINK J H, J WHALEY, T SEMERE, A WADE, D SPARKES AND J FOULKES. (2000). Prediction of
optimum plant population in winter wheat. HGCA Project Report No. 234.
SPINK J., M.J. FOULKES, A. GAY, R.BRYSON, P.BERRY, R.SYLVESTER-BRADLEY, T.SEMERE,
R.W.CLARE AND R.K.SCOTT. (2000). The value of crop intelligence to wheat growers. HGCA Project
Report No.235.
STOKES D T, R SYLVESTER-BRADLEY, R CLARE, R K SCOTT, J HOPKINSON, G F J MILFORD, S E
SALMON. (1998). An integrated approach to nitrogen nutrition for wheat. HGCA Project Report No. 159.
SYLVESTER-BRADLEY, R., DAMPNEY, P. M. R. & MURRAY, A. W. A. (1984). The response of winter
wheat to nitrogen. in The nitrogen requirement of cereals, MAFF/ADAS Reference Book 385, pp 151-174.