barro-becker model of fertility choice - lecture 2, … · the barro-becker model of fertility...
TRANSCRIPT

The Barro-Becker Model of FertilityComparative statics
The US experience 1800-1990Policy in the Barro-Becker Model
Barro-Becker Model of Fertility ChoiceLecture 2, Barro-Becker
Economic Policy in Development 2, Part 2
April 27, 2007
Lecture 2, Barro-Becker 1/28 Economic Policy in Development 2, Part 2

The Barro-Becker Model of FertilityComparative statics
The US experience 1800-1990Policy in the Barro-Becker Model
Intro 2
Fertility is negatively correlated with economic development. Itis very high, as high as seven children per women, indeveloping countries; and extremely low in many rich countries,often well below the replacement rate. Fertility rates are oftendiscussed by policy-makers, who argue, for example, thatlowering fertility in poor countries could lead to increasedeconomic growth. At the same time, many OECD governmentshave recently become concerned about low fertility rates inrelation to the viability of pensions systems in the future. Inresponse, several countries have instituted policies thatsubsidize child-rearing in an effort to increase the fertility rate.
Lecture 2, Barro-Becker 2/28 Economic Policy in Development 2, Part 2

The Barro-Becker Model of FertilityComparative statics
The US experience 1800-1990Policy in the Barro-Becker Model
Intro 3
In these notes simple models of fertility choice are described.In here we study the qualitative and quantitative properties ofthe becker barro and barro becker (hereafter B&B) models offertility along with one based on the ideas of Caldwell (1978) onthe demand for children as a source of old age support, seeboldrin jones (B&J henceforth) for the model formalization.
Lecture 2, Barro-Becker 3/28 Economic Policy in Development 2, Part 2

The Barro-Becker Model of FertilityComparative statics
The US experience 1800-1990Policy in the Barro-Becker Model
Intro 4
The B&B model of fertility is based on the assumption thatparents get direct utility from the consumption of their children,their grandchildren, etc. That is, parents have forward lookingaltruism, and, thus, they view their fertility decisions asextensions of their own dynastic family. This forms the basis fortheir demand for children in the B&B model.
Lecture 2, Barro-Becker 4/28 Economic Policy in Development 2, Part 2

The Barro-Becker Model of FertilityComparative statics
The US experience 1800-1990Policy in the Barro-Becker Model
Intro 5
In contrast, much of the literature in demography, focuses on ademand for children arising out of a need for support in old age.Various authors have implemented this idea, but, a naturalcandidate is to model this as a situation in which children careabout the welfare of their parents, i.e., as ’reverse altruism.’That is, parents’ demand for children arises because they knowthat children care about them, and will, because of this, helpsupport them in old age. This is the focus of the B&Jimplementation of the Caldwell approach.Of course, in reality, both of these sources of demand forchildren are operative.
Lecture 2, Barro-Becker 5/28 Economic Policy in Development 2, Part 2
The Barro-Becker Model of FertilityComparative statics
The US experience 1800-1990Policy in the Barro-Becker Model
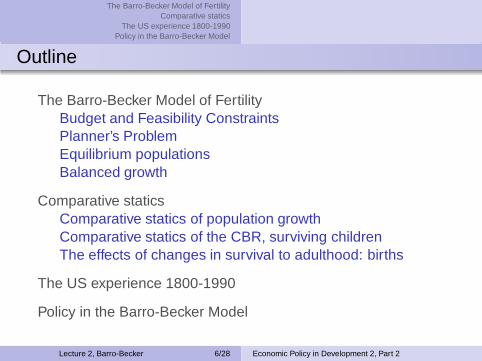
Outline
The Barro-Becker Model of FertilityBudget and Feasibility ConstraintsPlanner’s ProblemEquilibrium populationsBalanced growth
Comparative staticsComparative statics of population growthComparative statics of the CBR, surviving childrenThe effects of changes in survival to adulthood: births
The US experience 1800-1990
Policy in the Barro-Becker Model
Lecture 2, Barro-Becker 6/28 Economic Policy in Development 2, Part 2

The Barro-Becker Model of FertilityComparative statics
The US experience 1800-1990Policy in the Barro-Becker Model
Budget and Feasibility ConstraintsPlanner’s ProblemEquilibrium populationsBalanced growth
Preferences 7
It is assumed that parents care about three separate objects:
i) their own consumption in the period, ct ,
ii) the number of children they have, nt , and,
iii) the average utility of their children, Ut+1.
Utility of the typical time t household is of the form:
Ut = u(ct) + βg(nt)Ut+1.
Lecture 2, Barro-Becker 7/28 Economic Policy in Development 2, Part 2

The Barro-Becker Model of FertilityComparative statics
The US experience 1800-1990Policy in the Barro-Becker Model
Budget and Feasibility ConstraintsPlanner’s ProblemEquilibrium populationsBalanced growth
Intuition 8
Intuitively, it makes sense to assume:
1.) Parents like the consumption good: Utility is increasing andconcave in own consumption;
2.) Parents are altruistic: Holding nt fixed and increasing Ut+1
increases (strictly) the utility of the parent, Ut ;
3.) Parents like having children: Holding Ut+1 fixed andincreasing nt increases (strictly) the utility of the parent.
It is also natural to assume:
4.) The increase described in 3.) is subject to diminishingreturns.
Lecture 2, Barro-Becker 8/28 Economic Policy in Development 2, Part 2

The Barro-Becker Model of FertilityComparative statics
The US experience 1800-1990Policy in the Barro-Becker Model
Budget and Feasibility ConstraintsPlanner’s ProblemEquilibrium populationsBalanced growth
Dynastic Utility 9
Successive substitution leads to a formulation of dynastic utilityat time 0 in terms of the basic choice variables:
U0 =∑∞
t=0
[
Πt−1s=1g(ns)
]
u(ct).
Assume that g(n) = nη, and let Nt = Πt−1s=1ns, this is the total
number of adult descendants alive during period t . ThenΠt−1
s=1g(ns) = g(Πt−1s=1ns) = g(Nt), and so preferences for the
dynasty head can be rewritten as:
U0 =∑∞
t=0 βtg(Nt)u[
CtNt
]
,
where Ct = Ntct is total consumption in period t .Lecture 2, Barro-Becker 9/28 Economic Policy in Development 2, Part 2
The Barro-Becker Model of FertilityComparative statics
The US experience 1800-1990Policy in the Barro-Becker Model
Budget and Feasibility ConstraintsPlanner’s ProblemEquilibrium populationsBalanced growth
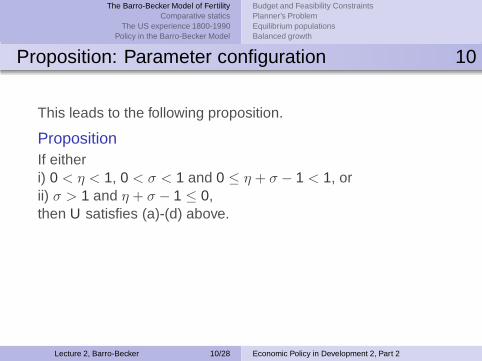
Proposition: Parameter configuration 10
This leads to the following proposition.
PropositionIf eitheri) 0 < η < 1, 0 < σ < 1 and 0 ≤ η + σ − 1 < 1, orii) σ > 1 and η + σ − 1 ≤ 0,then U satisfies (a)-(d) above.
Lecture 2, Barro-Becker 10/28 Economic Policy in Development 2, Part 2

The Barro-Becker Model of FertilityComparative statics
The US experience 1800-1990Policy in the Barro-Becker Model
Budget and Feasibility ConstraintsPlanner’s ProblemEquilibrium populationsBalanced growth
Budget and Feasibility Constraints 11
Labor as only input:{
(Nt , Ct)∞t=0|∀t ≥ 0, Ct + θtNbt ≤ wtNt
Nt+1 = πNt + Nbt
}
Under this constraint set, the time 0 maximization problem hasa convex constraint set and a concave objective function. Thus,the problem has unique solutions, concave value functions, etc.
Lecture 2, Barro-Becker 11/28 Economic Policy in Development 2, Part 2
The Barro-Becker Model of FertilityComparative statics
The US experience 1800-1990Policy in the Barro-Becker Model
Budget and Feasibility ConstraintsPlanner’s ProblemEquilibrium populationsBalanced growth
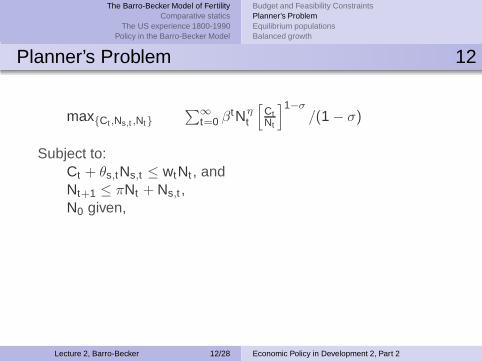
Planner’s Problem 12
max{Ct ,Ns,t ,Nt}
∑∞t=0 βtNη
t
[CtNt
]1−σ/(1 − σ)
Subject to:Ct + θs,tNs,t ≤ wtNt , andNt+1 ≤ πNt + Ns,t ,N0 given,
Lecture 2, Barro-Becker 12/28 Economic Policy in Development 2, Part 2
The Barro-Becker Model of FertilityComparative statics
The US experience 1800-1990Policy in the Barro-Becker Model
Budget and Feasibility ConstraintsPlanner’s ProblemEquilibrium populationsBalanced growth
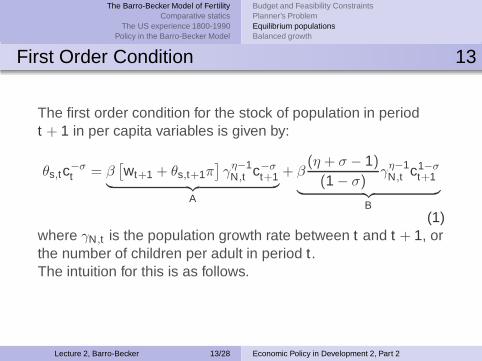
First Order Condition 13
The first order condition for the stock of population in periodt + 1 in per capita variables is given by:
θs,tc−σt = β
[wt+1 + θs,t+1π
]γη−1
N,t c−σt+1
︸ ︷︷ ︸
A
+ β(η + σ − 1)
(1 − σ)γη−1
N,t c1−σt+1
︸ ︷︷ ︸
B(1)
where γN,t is the population growth rate between t and t + 1, orthe number of children per adult in period t .The intuition for this is as follows.
Lecture 2, Barro-Becker 13/28 Economic Policy in Development 2, Part 2

The Barro-Becker Model of FertilityComparative statics
The US experience 1800-1990Policy in the Barro-Becker Model
Budget and Feasibility ConstraintsPlanner’s ProblemEquilibrium populationsBalanced growth
Ak Analogy 14
Consider the special case in which η = 1 − σ. Because of this,we get:
[Ct+1
Ct
]σ
= β
[wt+1
θs,t+
θs,t+1
θs,tπ
]
(2)
This is the standard Euler Equation from an Ak model in termsof aggregate consumption, modified for the case θs potentiallydifferent from 1 with π corresponding to 1 − δ (where δ denotesdepreciation), and time varying costs and benefits, i.e., wt andθs,t .
Lecture 2, Barro-Becker 14/28 Economic Policy in Development 2, Part 2

The Barro-Becker Model of FertilityComparative statics
The US experience 1800-1990Policy in the Barro-Becker Model
Budget and Feasibility ConstraintsPlanner’s ProblemEquilibrium populationsBalanced growth
Equilibrium 15
The Euler equation in (??) or (2) together with the feasibilityconstraint
Ct
Nt+ θs,t
[Nt+1
Nt− π
]
= wt . (3)
and the initial condition N0 completely describe the equilibriumpath.
Lecture 2, Barro-Becker 15/28 Economic Policy in Development 2, Part 2
The Barro-Becker Model of FertilityComparative statics
The US experience 1800-1990Policy in the Barro-Becker Model
Budget and Feasibility ConstraintsPlanner’s ProblemEquilibrium populationsBalanced growth
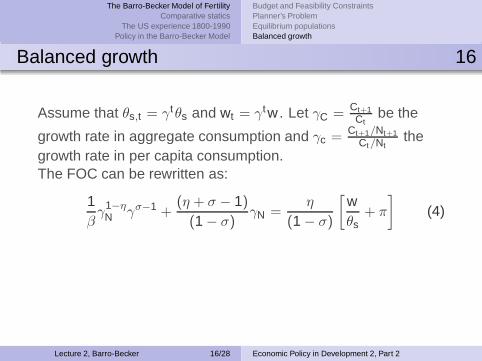
Balanced growth 16
Assume that θs,t = γtθs and wt = γtw . Let γC =Ct+1Ct
be the
growth rate in aggregate consumption and γc =Ct+1/Nt+1
Ct /Ntthe
growth rate in per capita consumption.The FOC can be rewritten as:
1β
γ1−ηN γσ−1 +
(η + σ − 1)
(1 − σ)γN =
η
(1 − σ)
[wθs
+ π
]
(4)
Lecture 2, Barro-Becker 16/28 Economic Policy in Development 2, Part 2

The Barro-Becker Model of FertilityComparative statics
The US experience 1800-1990Policy in the Barro-Becker Model
Comparative statics of population growthComparative statics of the CBR, surviving childrenThe effects of changes in survival to adulthood: births
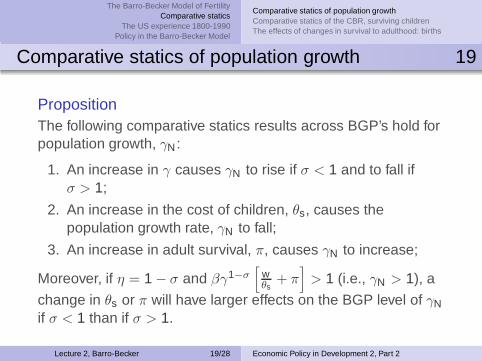
Comparative statics of population growth 17
Further, the above equation simplifies considerably when1 − σ = η. In fact,
γσN = βγ1−σ
[wθs
+ π
]
. (5)
Lecture 2, Barro-Becker 17/28 Economic Policy in Development 2, Part 2

The Barro-Becker Model of FertilityComparative statics
The US experience 1800-1990Policy in the Barro-Becker Model
Comparative statics of population growthComparative statics of the CBR, surviving childrenThe effects of changes in survival to adulthood: births
Comparative statics of population growth 18
Figure: Increase in γN is larger for σ < 1 than σ > 1
0 0.5 1 1.50
0.5
1
1.5
2
γN
LH
S,R
HS
RHSLHS σ>1RHS changeLHS σ<1
Lecture 2, Barro-Becker 18/28 Economic Policy in Development 2, Part 2
The Barro-Becker Model of FertilityComparative statics
The US experience 1800-1990Policy in the Barro-Becker Model
Comparative statics of population growthComparative statics of the CBR, surviving childrenThe effects of changes in survival to adulthood: births
Comparative statics of population growth 19
PropositionThe following comparative statics results across BGP’s hold forpopulation growth, γN :
1. An increase in γ causes γN to rise if σ < 1 and to fall ifσ > 1;
2. An increase in the cost of children, θs, causes thepopulation growth rate, γN to fall;
3. An increase in adult survival, π, causes γN to increase;
Moreover, if η = 1 − σ and βγ1−σ[
wθs
+ π]
> 1 (i.e., γN > 1), a
change in θs or π will have larger effects on the BGP level of γN
if σ < 1 than if σ > 1.
Lecture 2, Barro-Becker 19/28 Economic Policy in Development 2, Part 2
The Barro-Becker Model of FertilityComparative statics
The US experience 1800-1990Policy in the Barro-Becker Model
Comparative statics of population growthComparative statics of the CBR, surviving childrenThe effects of changes in survival to adulthood: births
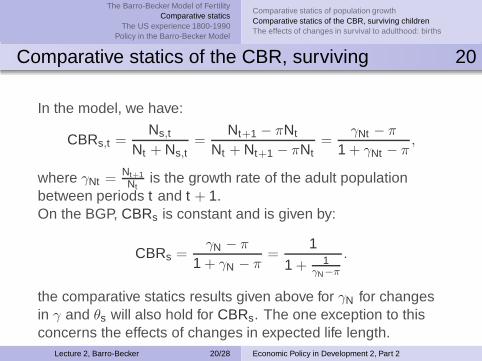
Comparative statics of the CBR, surviving 20
In the model, we have:
CBRs,t =Ns,t
Nt + Ns,t=
Nt+1 − πNt
Nt + Nt+1 − πNt=
γNt − π
1 + γNt − π,
where γNt =Nt+1Nt
is the growth rate of the adult populationbetween periods t and t + 1.On the BGP, CBRs is constant and is given by:
CBRs =γN − π
1 + γN − π=
1
1 + 1γN−π
.
the comparative statics results given above for γN for changesin γ and θs will also hold for CBRs. The one exception to thisconcerns the effects of changes in expected life length.
Lecture 2, Barro-Becker 20/28 Economic Policy in Development 2, Part 2
The Barro-Becker Model of FertilityComparative statics
The US experience 1800-1990Policy in the Barro-Becker Model
Comparative statics of population growthComparative statics of the CBR, surviving childrenThe effects of changes in survival to adulthood: births
Comparative statics of the CBR, surviving 21
PropositionThe following comparative statics results hold across BGP’s forsurviving children, CBRs:
1. An increase in γ causes CBRs to rise if σ < 1 and fall ifσ > 1;
2. An increase in the cost of children, θs, causes the fertilityrate, CBRs to fall;
3. If η = 1 − σ < 0, and βγ1−σ[
wθs
+ π]
> 1 (i.e., γN > 1), an
increase in π causes CBRs to fall.
Moreover, if η = 1 − σ and βγ1−σ[
wθs
+ π]
> 1 (i.e., γN > 1), a
change θs will have larger effects on the BGP level of CBRs ifσ < 1 than if σ > 1.
Lecture 2, Barro-Becker 21/28 Economic Policy in Development 2, Part 2
The Barro-Becker Model of FertilityComparative statics
The US experience 1800-1990Policy in the Barro-Becker Model
Comparative statics of population growthComparative statics of the CBR, surviving childrenThe effects of changes in survival to adulthood: births
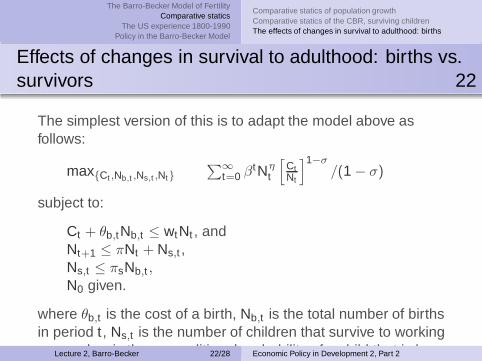
Effects of changes in survival to adulthood: births vs.survivors 22
The simplest version of this is to adapt the model above asfollows:
max{Ct ,Nb,t ,Ns,t ,Nt}
∑∞t=0 βtNη
t
[CtNt
]1−σ/(1 − σ)
subject to:
Ct + θb,tNb,t ≤ wtNt , andNt+1 ≤ πNt + Ns,t ,Ns,t ≤ πsNb,t ,N0 given.
where θb,t is the cost of a birth, Nb,t is the total number of birthsin period t , Ns,t is the number of children that survive to workingage and πs is the unconditional probability of a child that is bornsurviving to working age.
Lecture 2, Barro-Becker 22/28 Economic Policy in Development 2, Part 2

The Barro-Becker Model of FertilityComparative statics
The US experience 1800-1990Policy in the Barro-Becker Model
Comparative statics of population growthComparative statics of the CBR, surviving childrenThe effects of changes in survival to adulthood: births
Effects of changes in survival to adulthood: births 23
This problem can be rewritten by eliminating Nb,t to obtain:
max{Ct ,Ns,t ,Nt}
∑∞t=0 βtNη
t
[CtNt
]1−σ/(1 − σ)
Subject to:Ct + θs,tNs,t ≤ wtNt , andNt+1 ≤ πNt + Ns,t ,N0 given,
where θs,t =θb,tπs
is the cost of producing a surviving child.
Lecture 2, Barro-Becker 23/28 Economic Policy in Development 2, Part 2
The Barro-Becker Model of FertilityComparative statics
The US experience 1800-1990Policy in the Barro-Becker Model
Comparative statics of population growthComparative statics of the CBR, surviving childrenThe effects of changes in survival to adulthood: births
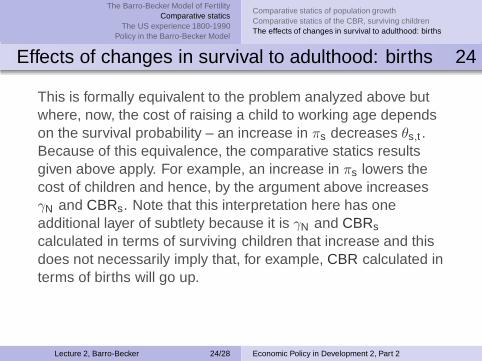
Effects of changes in survival to adulthood: births 24
This is formally equivalent to the problem analyzed above butwhere, now, the cost of raising a child to working age dependson the survival probability – an increase in πs decreases θs,t .Because of this equivalence, the comparative statics resultsgiven above apply. For example, an increase in πs lowers thecost of children and hence, by the argument above increasesγN and CBRs. Note that this interpretation here has oneadditional layer of subtlety because it is γN and CBRs
calculated in terms of surviving children that increase and thisdoes not necessarily imply that, for example, CBR calculated interms of births will go up.
Lecture 2, Barro-Becker 24/28 Economic Policy in Development 2, Part 2

The Barro-Becker Model of FertilityComparative statics
The US experience 1800-1990Policy in the Barro-Becker Model
Comparative statics of population growthComparative statics of the CBR, surviving childrenThe effects of changes in survival to adulthood: births
Effects of changes in survival to adulthood: births 25
To make this distinction clear we will introduce one new piece ofnotation
CBRt =Nb,t
Nt+Ns,t=
CBRs,tπs
.
Thus, even though CBRs is increasing in πs it need not be truethat CBR is.
Lecture 2, Barro-Becker 25/28 Economic Policy in Development 2, Part 2
The Barro-Becker Model of FertilityComparative statics
The US experience 1800-1990Policy in the Barro-Becker Model
Comparative statics of population growthComparative statics of the CBR, surviving childrenThe effects of changes in survival to adulthood: births
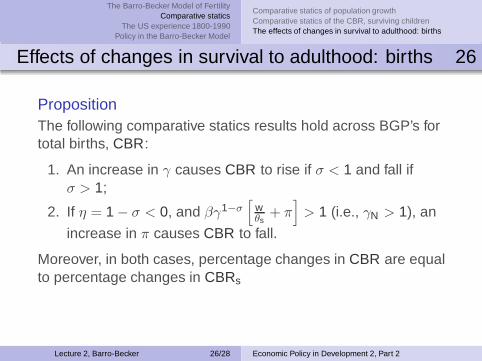
Effects of changes in survival to adulthood: births 26
PropositionThe following comparative statics results hold across BGP’s fortotal births, CBR:
1. An increase in γ causes CBR to rise if σ < 1 and fall ifσ > 1;
2. If η = 1 − σ < 0, and βγ1−σ[
wθs
+ π]
> 1 (i.e., γN > 1), an
increase in π causes CBR to fall.
Moreover, in both cases, percentage changes in CBR are equalto percentage changes in CBRs
Lecture 2, Barro-Becker 26/28 Economic Policy in Development 2, Part 2

The Barro-Becker Model of FertilityComparative statics
The US experience 1800-1990Policy in the Barro-Becker Model
The US experience 1800-1990 27
see paper
Lecture 2, Barro-Becker 27/28 Economic Policy in Development 2, Part 2

The Barro-Becker Model of FertilityComparative statics
The US experience 1800-1990Policy in the Barro-Becker Model
Policy in the Barro-Becker Model 28
◮ Cross-country Income Tax differences
→ higher taxes, lower fertility
◮ Pensions
→ larger social security system, lower fertility?◮ Child-labour laws and compulsory schooling
→ quntity-quality trade-off
Lecture 2, Barro-Becker 28/28 Economic Policy in Development 2, Part 2