basal and postprandial plasma levels of pyy, ghrelin
TRANSCRIPT

K. ZWIRSKA-KORCZALA1, S. J. KONTUREK2, M. SODOWSKI3, M. WYLEZOL4, D. KUKA3, P. SOWA1, M. ADAMCZYK-SOWA1, M. KUKLA1, A. BERDOWSKA1,
J. F. REHFELD5, W. BIELANSKI2, T. BRZOZOWSKI2
BASAL AND POSTPRANDIAL PLASMA LEVELS OF PYY, GHRELIN,CHOLECYSTOKININ, GASTRIN AND INSULIN IN WOMEN WITH
MODERATE AND MORBID OBESITY AND METABOLIC SYNDROME
1Department of Physiology, Zabrze, Medical University of Silesia, Katowice, Poland;2Department of Physiology, Jagiellonian University Medical Collage, Cracow, Poland;
3Department of Obstetric and Gynecology, Ruda Slaska, Medical University of Silesia; Katowice,Poland; 4Department of General and Bariatric Surgery in Zabrze, Medical University of Silesia,
Katowice, Poland; 5University Department of Clinical Biochemistry Rigshhospitalet,Copenhagen, Denmark
Metabolic syndrome (MS), defined as central obesity, hyperinsulinemia, insulinresistance, hypertension, dyslipidemia and glucose intolerance, has been associatedwith inflammatory biomarkers and cardiovascular diseases. This study was carriedout on three groups of women; lean controls, moderately obese with MS (OB-MS)and morbidly obese with MS (MOB-MS). The main objectives were: 1. to analyzethe plasma levels of total and acylated ghrelin, peptide YY3-36 (PYY3-36),cholecystokinin (CCK), gastrin and insulin levels under basal conditions and inresponse to a standard mixed meal, and 2. to elucidate the relationship between theplasma levels of these gut peptides and metabolic syndrome parameters. Plasmalevels of the gut hormones were measured by radioimmunoassays at time 0 justbefore the meal and at 30, 60 and 120 min after a meal ingestion. Traditional lipidprofile and high-sensitivity C reactive protein (hs-CRP), the strongest biomarker ofinflammation were also determined in OB-MS and MOB-MS. When compared toOB-MS, MOB-MS exhibited much higher antropometric parameters such as waistcircumference, higher fat mass and higher plasma levels of low density lipoprotein-cholesterol (LDL-C) and hs-CRP. Both these obese groups revealed significantlyhigher values of body mass index (BMI), fat mass, total cholesterol (TC), LDL-C,fasting glucose, fasting insulin, insulin resistance (IR) calculated from homeostaticmodel assessment (HOMA) and hs-CRP compared to the values recorded in leansubjects. Fasting PYY3-36 level was lower, while fasting acylated ghrelin was higherin MOB-MS than in OB-MS. Plasma total and acylated ghrelin levels weresignificantly lower in OB-MS compared to lean women. In MOB-MS women thefasting PYY3-36 levels were lower compared to lean controls and OB-MS, whilst
JOURNAL OF PHYSIOLOGY AND PHARMACOLOGY 2007, 58, Suppl 1, 13�35
www.jpp.krakow.pl

postprandially in both OB-MS and MOB-MS, it was much lower than in lean women.The fasting plasma levels of total and acylated ghrelin and their postprandial decreasewere significantly smaller in both obese groups compared to lean subjects. Plasma hs-CRP levels correlated positively with BMI, waist circumference, fat mass, fastingglucose, HOMA IR and fasting active ghrelin, whilst it negatively correlated withplasma fasting and total ghrelin. Moreover, plasma fasting acylated ghrelin correlatedpositively with fat mass. Fasting total ghrelin correlated positively with BMI, HDL-C and negatively with HOMA IR. We conclude that MS features of obesity areclosely related to fasting and postprandial alterations of concentrations of PYY3-36,CCK and ghrelin, suggesting that determination of gut hormones controlling foodintake might be considered as a valuable tool to assess the progression of MS tocomorbidities of obesity.
K e y w o r d s : obesity, PYY, ghrelin, cholecystokinin, gastrin, insulin, metabolic syndrome
INTRODUCTION
Obesity is a major healthcare priority of the present century. The WorldHealth Organization has estimated that worldwide, over one billion adultsexhibit overweight, with at least 300 million of them being obese. Overweight isdefined by body mass index (BMI) of 25.0-29.9 kg/m2 and obesity is defined ashaving a BMI of 30 kg/m2 or greater. Obesity has reached epidemic proportionsnot only in USA but also in European-developed countries, including Poland.According to National Health and Nutritional Examination Survey from 1988-1994 (NHANES III) to NHANES 1999-2000, the prevalence of overweight inadults increased from 55.9% to 64.5% and obesity from 22.9% to 30.5% (1).According to Polish studies (NATPOL PLUS) in 2003, the prevalence of obesitywas; overweight by 56% and obesity by 30% (2). In Poland obese subjects withBMI above 40 constitute about 1% (287.000 obese), and those with BMI above35 constitute 5.1% (1.5 million obese) of adult subjects. All above obesesubjects are candidates for surgical weigh-loss treatments because conservativeweight-reduction programs based on dieting and exercise are usually ineffective(3). Over the past two decades, the number of people with the metabolicsyndrome (MS) has greatly increased around the globe. Obesity may beassociated with MS and type 2 diabetes (T2D), which refers to a constellation ofrisk factors for cardiovascular disease, including hyperinsulinemia, glucoseintolerance, increased plasma low level of high-density lipoproteins (HDL) andhypertension, in which the underlying pathophysiological mechanism isbelieved to be insulin resistance (4-6). Recently, compelling evidence wasobtained that the complications of obesity appear to be primarily induced byadipokines and other factors secreted by adipose tissue (7). It has been alsopointed out that obesity may be considered as a state of low-grade systemicpermanent inflammation (8, 9). Well-documented clinical studies indicate thatC-reactive protein (CRP) is increased in obese individuals concomitantly to the
14

number of existing components of the MS (10, 11). Furthermore, prospectivesupportive studies have demonstrated the predictive role of inflammatorymarkers, such as CRP, in the subsequent development of glucose intolerance andcardiovascular events (12, 13).
Much less is known whether the MS in obese individuals affects the release ofgastrointestinal (GI) hormones. Hormonal peptides are present and released notonly in the GI mucosa but also in other tissues including peripheral and centralnervous system (CNS), and they may exert different metabolic effects (14, 15).GI hormones have been associated with the regulation of feeding behavior andenergy balance.
PYY exists in two forms; one is 36-aminoacid peptide, PYY1-36, released byendocrine L-cells in distal small bowel and colon, serving as a precursor of peptidethat is more bioactive, PYY3-36. Because of the rapidity of PYY1-36 conversion toPYY3-36, the main circulating form of PYY in postprandial plasma is PYY3-36. Bothforms of PYY bind to the Y2 receptors (Y2R) and both forms inhibit gastric acidand pancreatic enzyme secretion and suppress gastrointestinal motility. Similar toneuropeptide Y (NPY), both forms injected to cerebral ventricles are potent stimulifor feeding in the CNS. In contrast to the central effects, the circulating PYY3-36
acts as major endogenous mediator of satiation, reducing the body weight gainthrough the action on Y2R. PYY3-36 has received special attention in clinicalstudies after Batterham et al. demonstrated that infusions of the PYY3-36 in dosesmimicking the postprandial increments in plasma levels of this peptide in bothnormal-weight and obese subjects, reduced appetite and food intake for 12-24 h(17, 18). Obese subjects have been reported to exhibit lower fasting andpostprandial plasma PYY levels, so its deficiency might contribute to the increasein food intake and obesity. PYY is co-secreted with GLP-1, another anorexigenicpeptide, from the same endocrine L-cells in the distal segment of the small boweland its truncated 34-aminoacid form (PYY3-36) is created from PYY1-36 byseparation from the N terminus of Tyr-Pro residues by dipeptydyl peptidase IV (DPPIV). PYY3-36 inhibits food intake directly due to its high affinity for thepresynaptic inhibitory Y2R of neurons in the hypothalamic arcuate center (ARC),and also for Y2R present in afferent vagal fibers. Plasma concentrations of totalPYY are lower during fasting, increasing subsequently after food ingestion toreach plateau after 1-2 hours, with peaking dependent upon meal composition andcaloric content (12). PYY3-36 is known as �meal terminator� opposed to ghrelinconsidered as �meal initiator� in the digestive behavior (11). Grandt et al. foundthat PYY3-36 accounts for only 37% of the total PYY circulated in fastingconditions but becomes more predominant (54%) after a standard meal (19). Inanother study this proportion of plasma PYY3-36 to PYY1-36 after a meal was foundto be 3.6 in lean subjects and 3.2 in obese persons (20). The glucose, lipids andCCK stimulate, while gastrin and GLP-1 inhibit PYY release in rodents andhumans (21). In plasma of normal subjects, PYY3-36 rises immediately after meals,suggesting that this peptide may be involved in short-term feeding control (22).
15

Higher PYY serum concentrations were found in diseases such as celiac disease,hepatic cirrhosis, T2D, and following gastrectomy and gastric-bypass surgery (23).In humans, peripherally-administered PYY3-36 lowers circulating ghrelin levels.The distribution of PYY is gradually increasing, while opposing ghrelin isdecreasing along the gut from the stomach to the colon (24).
Ghrelin is a 28-amino acid peptide isolated from human and rat stomachs asan endogenous ligand for the growth hormone secretagogue receptor (GHS-R).There are two major forms of ghrelin in plasma: acylated-ghrelin with an n-octanoyl group on the N-terminal third amino acid and desacyl-ghrelin (24 - 27).Desacyl-ghrelin is a predominant form in blood, represents 79-86% of totalghrelin, and has physiological functions distinct from acylated-ghrelin (11). Morerecent studies showed the anorectic properties of desacyl-ghrelin in rats and mice.This effect appears to be exerted by expression of fos in the PVN nucleus,presumably involving corticotrophin-releasing hormone neurons. Desacyl-ghrelin is also synthesized in the rat hypothalamus, playing an important role infeeding regulation. Apart from stimulating GH secretion, ghrelin stimulatesprolactin and ACTH secretion increases gastric motility and acid secretion,promoting pancreatic peptide synthesis (28). Ghrelin does not affect basalpancreatic exocrine excretion, but eliminates the stimulating effect of CCK onpancreatic protein production (29).
Ghrelin powerfully increases food intake in diverse species including humansand is the only hormone known to do so. Contrary to satiation GI peptides (PYY,CCK, leptin, GLP-1), ghrelin increases GI motility and decreases insulinsecretion. Also in contrast to satiation peptides, circulating ghrelin levels surgeshortly before meals and this preprandial rise of plasma ghrelin seems to be acephalic response, probably involving the sympathetic nervous system, thatparticipates in the anticipatory processes enabling animals to prepare for foodintake and nutrient disposition. It is of interest that fasting plasma ghrelin aresuppressed by ingestion of nutrients (with carbohydrates being more effectivethan proteins, which are more effective than lipids). This postprandialsuppression of plasma ghrelin does not require exposure to luminal nutrient of thestomach where the majority of ghrelin production takes place (15), but probablyresults from neurally transmitted (nonvagal) intestinal signals, augmented byinsulin. The pattern of ghrelin suppression by nutrients is broadly consistent withthe observation that while the satiation hormones (induced by ingested nutrients)such as PYY, GLP-1 or CCK, rise postprandially, the circulating orexigenichormone, ghrelin, falls, while simultaneously an insulin secretion increases (16).In healthy humans, acylated- and desacylated-ghrelin levels increase before everymeal and decrease almost immediately after eating. Lean subjects have averagefasting ghrelin concentrations higher than obese subjects, particularly at night.Ghrelin levels are decreased in response to high doses of PYY3-36 in the premealperiod (15). Batterham et al. have proved that infusion of PYY3-36 markedlydecreases circulating ghrelin levels attenuating the preprandial rise of this peptide
16

both in lean and obese subjects (17, 18). Circulating total ghrelin shows apulsating pattern in normal subjects. In obese subjects, there is no day and nightghrelin rhythm and no post-meal decrease (15). Postprandial decrease of ghrelinconcentration is associated with insulin and glucose increase.
In addition to its role in short-term feeding control, ghrelin appears also tocontribute to long-term body weight regulation. Circulating levels of ghrelinrespond in compensatory manner to bi-directional body-weight changes achievedby diverse means, increasing with weight loss and vice versa. Ghrelin influencesneuronal activity through its receptors in several areas in the brain, particularly inthe hypothalamus, to govern long-term energy homeostasis and adiposity.Chronic administration of ghrelin increases body weight and adipose tissuecontent due to numerous anabolic effects on food intake, energy expenditure andfuel utilization. Despite of the above mentioned finding, the importance of theghrelin in energy homeostasis remains unclear, partly due to the fact that thispeptide exists in two molecular forms, one is 28-amino acid peptide with an n-octanoyl modification at the N-terminal third amino acid which is indispensablefor its biological activity and another which is desacyl-ghrelin. In this study wedecided to determine the changes in both acylated and desacylated ghrelin levelsin healthy controls and in moderately and morbidly obese women with MS.
Cholecystokinin (CCK) has been known as a short-term satiety hormoneproduced by endocrine I cells in proximal intestines. Predominant forms of CCKin plasma are CCK8, CCK22, CCK33 and CCK58. CCK release is stimulatedlargely by the absorption of fatty acids or amino acids through the intestinalmucosa. In normal, healthy, lean volunteers postprandial plasma CCKconcentrations reaches a maximum at 15 min (30). There are gender differencesin CCK plasma concentrations; women have higher levels because of estrogensinfluence (31). CCK transmits satiety signals to the brain through CCK receptor1 (CCK1R, formely CCK-A for alimentary) localized on vagal afferent fibers,acting as �meal terminator� in short-term feeding control. CCK satiety signal isenhanced by leptin due to co-localization of CCK1R and leptin receptors (Ob-R)on the same vagal-sensory fibers (32). Chronic administration of CCK reducesthe meal-size but increases meal frequency. CCK may stimulate ghrelin releaseby mucosal cells of gastric fundus. Recent data reported that bulimia, obesity,T2D, gallbladder disease, and functional dyspepsia may be associated withCCK/CCK1R alterations (23, 33).
Gastrin is structurally homologous to CCK, produced and released in severalmolecular forms by the G-cells in the antral and duodenal mucosa. It does notappear to affect feeding behavior and is the principal mediator of meal-inducedgastric phase of acid secretion acting via paracrine stimulation of histamine releasefrom gastric ECL-cells. It also plays a role in the cephalic and intestinal phases ofgastric acid secretion (34). Gastrin acts on the parietal cells through high affinityCCK2 receptor (CCK2R, formely known as CCK-B, for �brain�). Both sulfated andnon-sulfated forms of 34-amino acid (gastrin34) and 17-amino acid (gastrin17) are
17

present in plasma, being equipotent stimulants of gastric acid secretion. Circulatinggastrin concentration is ten to twenty folds higher than CCK. Gastrin also acts asgrowth/differentiation factor in the gastrointestinal tract. Increased gastrin levelsmay be the first sign of such disorders such as H. pylori infection, short-bowelsyndrome, antral G-cell hyperfunction-hyperplasia, gastrinoma, ECL hyperplasiaand acid-peptic disorders (11). Gastrin is an important mediator of gastric mucosalgrowth, which may progress to the formation of gastric carcinoids (35). Gastrinsecretion is suppressed by somatostatin, therefore, some inflammatory agentswhich suppress somatostatin release may lead to hypergastrinemia and higher acidsecretion (36). Peripheral CCK administration, alone or with gastrin, stimulatesghrelin expression in peptic cells of gastric fundic glands (37).
Insulin, secreted by beta-pancreatic islet cells, and leptin, produced byadipocytes and peptic cells in oxyntic mucosa, belong to long-term adipositysignals that influence eating behavior at individual meals (16). They act in thebrain, especially the hypothalamus, by enhancing central sensitivity to input fromshort-acting peripheral satiation signals, such as CCK (16). Analogous synergismbetween long- and short-acting signals occurs in the gut at the level of L cells,where activation of CCK-receptors augments the secretion of GPL-1, anothersatiety gut peptide. In this study, we decided to monitor the release of insulin andcorrelate it with the blood levels of glucose as well as other gut hormonesaffecting food intake.
The aim of this study was to examine the plasma concentrations of PYY3-36,total ghrelin and acylated ghrelin, CCK, gastrin and insulin under fastingconditions and after a mixed meal and to answer the question whether andrelationship exists between these peptide levels and symptoms of metabolicsyndrome in obese women.
METHODS
Subjects
Eight lean, healthy women served as control group. Twelve moderately obese women with MS(OB-MS), and 17 morbidly obese women with MS (MOB-MS), qualified for weight-loss surgery,who had demonstrated a stable body weight for three months, were enrolled into this study. MOB-MS women reported earlier onset of obesity in adolescence (at ages of 11-19 years) in contrast toolder moderately obese women (OB-MS), who became obese in adulthood (age above 20 years)(Table 1). All obese subjects were recruited from the endocrine outpatient clinics of MedicalUniversity of Silesia. The lean, healthy volunteers were recruited from medical and laboratory staff.The study was approved by the local Ethics Committee of the Medical University. All subjectsagreed to participate in this study after oral and written information. To be eligible for this study, allvolunteers declared to be free of major medical illnesses, such as renal or hepatic diseases,congestive heart failure, malignancy, or coronary artery disease and T2D. The criteria to enter theexperimental design of the study also included the negative status of H. pylori infections, lack ofhypothyroidism or any endocrinological disorders. In addition, they remained free of medications
18

known to alter body weight or cause the insulin resistance. MS was defined by 3 or more criteria;fasting plasma glucose >100 mg/dL (6.1 mmol/L), plasma triacylglycerides ≥ 150 mg/dL (1.7mmol/L), plasma HDL-C <50 mg/dL (1.29 mmol/L), systolic blood pressure ≥ 140 mmHg systolicand diastolic pressure ≥ 90 mmHg or on antihypertensive treatment, abdominal obesity waistcircumference >88 cm (derived from the National Cholesterol Education Panel, World HealthOrganization and International Diabetes Federation). We excluded participants with elevated hs-CRP levels above 10 mg/L, possibly indicating other clinically relevant, inflammatory conditions.Healthy, lean controls participated in the initial laboratory screening to exclude any feature of MSand hs-CRP levels above 1 mg/mL as signs of low grade inflammation. None of the controls weretaking any medication or had a history of food dietary restrictions.
Study protocol
On the test day, at 08.00, after an overnight fast (at least 12 h), the subjects were admitted to thelaboratory at the Department of Physiology. Anthropometric variables such as height, weight andwaist circumference (WC) were measured. BMI, defined as weight (kg) per height squared (m2),was calculated and used as an index for obesity. Body composition was estimated usingbioelectrical impedance analyzer - B.I.A. 2000 M (Data Input GmbH, Frankfurt, Germany). Studieswere conducted at an ambient temperature of 22±1°C. Following baseline blood sample collection(T 0 min), subjects consumed a standard mixed breakfast of about 527 kcal during 15 min. The mealconsisted of 50 g white bread, 33 g black bread, 18 g margarine, 30 g cheese, 9 g jam and 200 mLof 0.5% fat milk (24.1% fat, 54.4% carbohydrate, 21.5% protein). Blood samples were collected at30, 60 and 120 min after the meal ingestion.
Plasma hormone determination
The samples were collected into chilled tubes containing 1.2 mg EDTA and aprotinin (500KIU/mL; Trasylol; Bayer Corp., Leverkusen, Germany) for hormone analyses. All samples werekept in an ice bath until centrifugation at 2000 rpm for 15 min at 4°C. Additionally, plasma for bothtotal and acylated ghrelin and PYY3-36 was collected according to laboratory recommendationsusing HCl, PMSF and DPPIV inhibitor, respectively. The separated plasma samples were stored at�70°C until the time of the assay. All samples of one subject were run in duplicate in the same RIAperformed partly in the laboratory of professor J. Rehfeld, Copenhagen, Denmark (except insulinwhich was assayed in Isotopic Laboratory of Department of Physiology, Cracow, Poland). PlasmaPYY3-36, total ghrelin and acylated ghrelin were measured using a commercial RIA kits (LincoResearch, Missouri, USA); inter-assay and intra-assay coefficients for total ghrelin, acylatedghrelin, PYY3-36 were 7.0% and 14.3%, 3.3% and 17.8%, 11 and 15%, respectively. Plasma CCKconcentrations were measured by CCK specific RIA. The lowest detectable concentration was 0.3pmol/L. The intra-assay and inter-assay precisions were 4.4 % and 4.2 %, respectively. One volumeof plasma (usually 1.0 mL) was mixed twice with 960 mL/L and stirred using mixer for 10 s. Themixture was then centrifuged for 30 min at 1200 x g, and the supernatant was decanted andevaporated at 37 °C in a Speed-Vac concentrator (SVC 200 H, Savant Instruments). The driedextracts were then reconstituted to the original volume with assay buffer and assayed. Themeasurements of CCK in plasma were performed with RIA using a panel of eight high titer CCKantisera specific for the C-terminal-amidated sequence of CCK as well as an antiserum specific forthe N-terminus of human CCK22 and an antiserum specific for CCK glycine-extended at the C-terminus (37). Measurements of plasma gastrin were performed by RIA using antiserum 2604,which binds all carboxyamidated gastrins (gastrin-71, -34, -17, and -14) with equimolar potencyregardless of their degree of sulfation. Antiserum 2604 does not bind any CCK peptide. The routine
19

detection limit of the assay, as employed in the present study, was 5 pg of synthetic human gastrin(SHG) per mL of plasma. Insulin was assayed using RIA kits purchased from Polatom, Otwock-Swierk in accordance with the manufacturer�s recommendations.
Other investigations
In addition, glucose, total cholesterol (TC), high density lipoprotein cholesterol (HDL-C) andtriacylglyceroles (TG) levels were measured using spectrophotometrical method on reagents(Diagnostic System GmbH, Holzheim, Germany). Low-density lipoprotein cholesterol (LDL-C)was calculated by the Friedwald formula (38) and high specific C-reactive protein (hs-CRP) usingcommercial kit (COBASA INTEGRA, C-Reactive Protein Latex). Insulin resistance was calculatedby homeostatic model assessment (HOMA-IR) and was estimated using Matthews formula: [fastinginsulin (µU/mL) x fasting glucose (mM)]/22.5 (39).
Statistical analysis
All results are expressed as means ± SEM. Comparisons between groups were made usingMann-Whitney�s U-test. Differences between means were considered statistically significant at P <0.05. All calculations were performed with STATISTICA 7.0.
RESULTS
Baseline characteristics of lean and obese subjects
As shown in Table 1 for two groups of obese women (OB-MS and MOB-MS)with the onset of obesity 19-21 years ealier, the anthropometric features and someaspects of MS differed significantly. The MOB-MS women were approximatelyfive years younger, had significantly higher waist circumference (WC), BMI andhigher fat body mass (FBM) with simultaneously lower lean body mass (LBM)(P<0.05). In MOB-MS women, the low density lipoprotein-cholesterol (LDL-C)concentrations were slightly lower, whereas hs-CRP was almost 2-folds higherthan those found in the OB-MS group. Other components of MS such as totalcholesterol (TC), plasma glucose and insulin levels, HOMA-IR and alsofrequency of hypertension were comparable in both groups of obese womengroups. In the lean, control group, the women�s anthropometric features and allbiochemical tests were within the normal range for our laboratory.
Hormonal responses to the test meal
PYY3-36. As shown in Fig. 1 and Table 2, there were no differences in fastingplasma PYY3-36 concentrations between OB-MS and lean control women, whereasMOB-MS women had significantly lower fasting PYY3-36 than lean controls andOB-MS women. After a test meal, mean plasma PYY3-36 concentration in leancontrols increased by about 40% of fasting level at 60 min and remained elevatedover fasting level to the end of postprandial observation period (120 min). In obesegroups, the PYY3-36 responses to meal differed from those in lean controls.
20

21
Control n = 8
33.9 ± 3.7-
76.4 ± 2.123.2 ± 0.715.5 ± 1.184.4 ± 2.84.63± 0.751.47± 0.12
1.01 ± 0.172.55 ± 0.17
5.5 ± 0.216.1 ± 1.5
1.9 ± 0.40.7 ± 0.2
0 (0)
OB-MS n = 12
37.1 ± 2.221.4 ± 1.8
106.2 ± 1.9 *
34.9 ± 0.9 *
34.3 ± 2.0 *
65.7 ± 2.0 *
5.42 ± 0.971.44 ± 0.19
1.8 ± 0.32*
3.35 ± 0.53*
5.7 ± 0.4 *
21.18 ± 4.86.2 ± 2.4 *
4.3 ± 0.6 *
6 (50)
MOB-MS n = 17
32.3 ± 1.719 ± 3.2
123.3 ± 4.4 * #
46.9 ± 1.6 * #
45.3 ± 1.3 * #
54.7 ± 1.3 * #
4.6 ± 0.671.29 ± 0.421.69 ± 0.2*
2.66 ± 0.24#
6.1 ± 0.3 *
26.8 ± 2.2 *
6.6 ± 2.6 *
8.6 ± 1.7 * #
8 (47)
Characteristics
Age (y)Duration of obesity (y)Waist circumference (cm)BMI (kg/m2)Fat mass (%)Lean body mass (%)TC (mmol/L)HDL-C (mmol/L)TG (mmol/L)LDL-C (mmol/L)Fasting glucose (mmol/L)Fasting insulin (µU/mL)HOMA IRhs-CRP (mg/L)Hypertension n (%)
Table 1. Patient characteristics and laboratory data in studied groups.
The values are presented as mean±SEM; *P < 0.05 vs. control group; #P < 0.05 vs. OB-MS group.Abbreviations: OB-MS � obese women with metabolic syndrome, MOB-MS � morbidly obesewomen with metabolic syndrome, BMI � body mass index, TC � total cholesterol, HDL-C � highdensity lipoprotein cholesterol, TG � triacylglicerydes, LDL-C � low density lipoproteincholesterol, HOMA IR � homeostasis model assessment, hs-CRP � high specific C reactive protein.
Fig. 1. Fasting and postprandial concentrations of PYY3-36 after 30, 60 and 120 min after meal inlean control women (∆) and in those with moderate obesity (OB-MS) (£) and with morbid obesity(MOB-MS) (n). Mean ± SEM. Asterisk indicates significant (P < 0.05) decrease as compared tothe fasting values recorded in lean control women. Cross indicates significant increase as comparedto the fasting values. Hash indicates significant decrease below the value recorded in lean controls.

Postprandial plasma PYY3-36 concentrations in MOB-MS women showed small butsignificant increase at 30 and 60 min after meal, but these increments weresignificantly lower than in lean controls. Then, the hormone level slightly increasedto achieve its highest values at 120 min, which was not different from that observedin lean controls. In contrast, the standard meal failed to affect the plasma release ofPYY3-36 in OB-MS women at all time periods tested (Fig. 1). Thus, in OB-MSwomen, the plasma PYY3-36 level after a meal was not significantly increased whencompared to that measured in lean controls and MOB-MS women. Both obesegroups showed postprandial (measured at 30 and 60 min after meal) plasma PYY3-
36 levels significantly lower than those observed in lean controls.Total ghrelin. Fig. 2 and Table 2 show the plasma fasting total ghrelin levels
that were significantly lower in the OB-MS and MOB-MS compared with thosein lean controls (P<0.05). Only in the lean controls, total plasma ghrelin fellsignificantly by about 30% at 30 min after the meal and remained loweredthroughout the observation period (60 and 120 min). In both obese groups, themeal ingestion failed to cause any significant alterations in total ghrelin levels.Thus, there were no significant effects of the meal on total ghrelin response inMOB-MS patients. In OB-MS women the total plasma levels of ghrelin showedonly a minor and not significant decrease after a meal and the ghrelinconcentrations were significantly lower than those in healthy lean controls andMOB-MS women (Fig. 2).
22
Table 2. Fasting plasma and postprandial responses for PYY3-36, total ghrelin, active ghrelin, CCK,gastrin, glucose and insulin.
The values are presented as mean±SEM; *P<0.05 vs. control group; #P<0.05 vs. OB-MS group.Abbreviations: OB-MS � obese women with metabolic syndrome; MOB-MS � morbidly obesewomen with metabolic syndrome.
Control n = 8 OB-MS n = 12 MOB-MS n = 17
PYY (3-36) Fasting values (pg/mL) 41.5 ± 2.3 38.6 ± 1.1 32.9 ± 1.2*
Total ghrelin Fasting values (pg/mL) 850 ± 86 555 ± 67* 701 ± 78
Acylated ghrelin Fasting values (pg/mL) 199 ± 23 108 ± 12* 194 ± 27#
CCK Fasting values (pmol/L) 1.27 ± 0.08 1.11 ± 0.05 0.35 ± 0.02*
Gastrin Fasting values (pmol/L) 7.2 ± 1.27 8.2 ± 1.81 7.9 ± 1.04
Glucose Fasting values (mmol/L) 5.6 ± 0.3 5.1 ± 0.2 6.6 ± 0.4*
Insulin Fasting values (µU/mL) 16.0 ± 1.3 20.8 ± 3.4 25.3 ± 4.3

Acylated ghrelin. As shown in Fig. 3 and Table 2, there were no differences infasting acylated plasma ghrelin concentrations between lean controls and MOB-MS women, while fasting acylated ghrelin levels were significantly decreased byabout 50% in OB-MS women. Similarly as total ghrelin, also acylated ghrelinlevels in lean controls dropped significantly following meal ingestion by about60% at 30 min (P<0.05) and remained decreased till the end of 2 h observationperiod. Neither OB-MS nor MOB-MS women showed any significant alterationin the acylated ghrelin levels after ingestion of a meal, though these levels in OB-MS were significantly lower compared to those observed in MOB-MS women.
Cholecystokinin (CCK). As shown in Fig. 4 and Table 2, fasting plasma CCKconcentrations were markedly lower in MOB-MS women when compared tothose observed in lean controls and OB-MS women (P<0.05). In lean controlwomen, after ingestion of meal, CCK concentrations increased by about 3-foldsat 30 min, slightly decreasing at 60 min and increasing again at 120 min followingmeal. The plasma CCK responses to a meal in OB-MS and MOB-MS subjectsshowed a steady increase, reaching peak values at 60 min (Fig. 4). Thepostprandial CCK increase in MOB-MS was significantly lower than those inlean controls and in OB-MS women (except for 60 min after a meal).
23
Fig. 2. Fasting and postprandial concentrations of total ghrelin measured after 30, 60 and 120 minafter meal in lean control women (∆) and in those with moderate obesity (OB-MS) (£) and withmorbid obesity (MOB-MS) (n). Mean ± SEM. Asterisk indicates significant decrease (P < 0.05) ascompared to the values recorded under fasting conditions in lean control women. Cross indicatessignificant decrease as compared to the fasting values. Hash indicates significant decrease belowthe value recorded in lean controls.

24
Fig. 3. Fasting and postprandial concentrations of acylated ghrelin measured after 30, 60 and 120min after meal in lean control women (∆) and in those with moderate obesity (OB-MS) (£) andwith morbid obesity (MOB-MS) (n). Mean ± SEM. Asterisk indicates significant decrease (P <0.05) as compared to the values recorded under fasting conditions in lean control women. Crossindicates significant decrease as compared to the fasting values. Hash indicates significant increasebelow the value recorded in lean controls.
Fig. 4. Fasting and postprandial concentrations of cholecystokinin measured after 30, 60 and 120min after meal in lean control women (∆) and in those with moderate obesity (OB-MS) (£) andwith morbid obesity (MOB-MS) (n). Mean ± SEM. Asterisk indicates significant decrease (P <0.05) as compared to the values recorded under fasting conditions in lean control women. Crossindicates significant increase as compared to the fasting values. Hash indicates significant decreasebelow the value recorded in lean controls.

25
Gastrin. As shown in Table 2 and Fig. 5, in lean controls and both obese groups,fasting plasma gastrin levels and incremental rise after meal displayed similarpatterns. Fasting gastrin concentrations were similar in all three groups tested.Postprandially, gastrin concentrations peaked by nearly 5-folds in lean women andalmost 4-folds in OB-MS, at 60 min and 30 min, respectively, whereas in MOB-MSgroup the postprandial peak increase in plasma gastrin release was significantlydiminished when compared to that observed in lean controls and OB-MS group.
Insulin. Fig. 6 and Table 2 show fasting plasma insulin concentrations, whichwere similar both in lean controls and obese groups. Postprandially, plasmainsulin levels in lean controls reached the peak at 30 min after meal and thendeclined gradually towards the fasting levels at the end of 2 h period. In bothobese groups (OB-MS and MOB-MS) the meal-induced increments in plasmainsulin levels were significantly higher than those observed in lean controls. Thepeaks of plasma insulin in both obese groups occurred 60 min after meal,reaching the values several folds higher than in lean controls. At the end ofpostprandial period (2 h) plasma insulin levels in both obese groups were stillsignificantly higher than those recorded under basal conditions and about 3-foldshigher as compared to those in the lean controls.
Glucose. Fasting plasma glucose in MOB-MS was significantly highercompared to lean controls (5.4 vs. 6.1 mmol/L) but not to OB-MS women (Fig. 7and Table 2). Postprandial increments in glucose level observed at 30 min after
Fig. 5. Fasting and postprandial concentrations of gastrin measured after 30, 60 and 120 min aftermeal in lean control women (∆) and in those with moderate obesity (OB-MS) (£) and with morbidobesity (MOB-MS) (n). Mean ± SEM. Cross indicates significant (P < 0.05 increase as comparedto the fasting values. Hash indicates significant decrease below the value recorded in lean controls.

26
Fig. 6. Fasting and postprandial concentrations of plasma insulin measured after 30, 60 and 120 minafter meal in lean control women (∆) and in those with moderate obesity (OB-MS) (£) and with morbidobesity (MOB-MS) (n). Mean ± SEM. Cross indicates significant (P < 0.05) increase as compared tothe fasting values. Hash indicates significant decrease below the value recorded in obese patients.
Fig. 7. Fasting and postprandial concentrations of plasma glucose measured after 30, 60 and 120min after meal in lean control women (∆) and in those with moderate obesity (OB-MS) (£) andwith morbid obesity (MOB-MS) (n). Mean ± SEM. Asterisk indicates significant increase (P <0.05) as compared to the values recorded under fasting conditions in lean control women. Crossindicates significant decrease as compared to the fasting values. Hash indicates significant decreasebelow the value recorded in obese patients.
meal were similar in all three groups, but then at 60 and 120 min, the peak glucoselevels in OB-MS and MOB-MS were significantly higher than in lean controls.
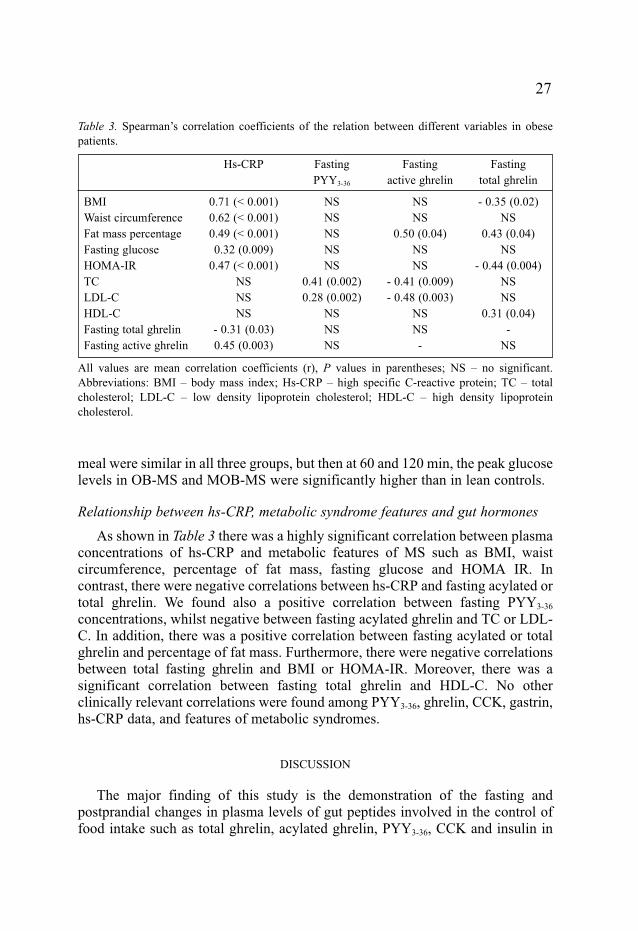
Relationship between hs-CRP, metabolic syndrome features and gut hormones
As shown in Table 3 there was a highly significant correlation between plasmaconcentrations of hs-CRP and metabolic features of MS such as BMI, waistcircumference, percentage of fat mass, fasting glucose and HOMA IR. Incontrast, there were negative correlations between hs-CRP and fasting acylated ortotal ghrelin. We found also a positive correlation between fasting PYY3-36
concentrations, whilst negative between fasting acylated ghrelin and TC or LDL-C. In addition, there was a positive correlation between fasting acylated or totalghrelin and percentage of fat mass. Furthermore, there were negative correlationsbetween total fasting ghrelin and BMI or HOMA-IR. Moreover, there was asignificant correlation between fasting total ghrelin and HDL-C. No otherclinically relevant correlations were found among PYY3-36, ghrelin, CCK, gastrin,hs-CRP data, and features of metabolic syndromes.
DISCUSSION
The major finding of this study is the demonstration of the fasting andpostprandial changes in plasma levels of gut peptides involved in the control offood intake such as total ghrelin, acylated ghrelin, PYY3-36, CCK and insulin in
27
Hs-CRP
0.71 (< 0.001)0.62 (< 0.001)0.49 (< 0.001)0.32 (0.009)
0.47 (< 0.001)NSNSNS
- 0.31 (0.03)0.45 (0.003)
Fasting PYY3-36
NSNSNSNSNS
0.41 (0.002)0.28 (0.002)
NSNSNS
Fasting active ghrelin
NSNS
0.50 (0.04)NSNS
- 0.41 (0.009)- 0.48 (0.003)
NSNS-
Fasting total ghrelin
- 0.35 (0.02)NS
0.43 (0.04)NS
- 0.44 (0.004)NSNS
0.31 (0.04)-
NS
BMIWaist circumferenceFat mass percentageFasting glucoseHOMA-IRTCLDL-CHDL-CFasting total ghrelinFasting active ghrelin
Table 3. Spearman�s correlation coefficients of the relation between different variables in obesepatients.
All values are mean correlation coefficients (r), P values in parentheses; NS � no significant.Abbreviations: BMI � body mass index; Hs-CRP � high specific C-reactive protein; TC � totalcholesterol; LDL-C � low density lipoprotein cholesterol; HDL-C � high density lipoproteincholesterol.

lean controls as well as two subcategories of obesity with MS, one concerningolder women with moderate obesity, smaller BMI and fat mass (OB-MS) andanother including younger women with morbid obesity (MOB-MS) (41-49).
Total and acylated ghrelin, which represents the most powerful orexigenichormone, failed to show a decrease in plasma levels in our obese women followingingestion of mixed meal that is typically observed in lean controls. Instead,elevated plasma levels of total and acylated ghrelin were sustained after a meal,especially in MOB-MS women, which exhibited also significantly higher BMI andfat mass and lower lean body mass. Our finding that the plasma levels of both totaland acylated plasma ghrelin are significantly elevated, particularly in MOB-MS,suggests that the constant feeding drive observed in these patients may originatefrom relatively high plasma level of this potent orexigenic peptide. Our studyconfirms that endogenous ghrelin exerts a potent appetitive behavior, possiblythrough influencing the activity of vagal afferent nerves and receptors localized inthe hypothalamic NPY/AGRP neurons of the arcuate nucleus and in feedingcenter. This notion is supported by the observations in experimental animals thatchronic ghrelin administration increases body weight through numerous effectssuch as stimulation of food intake, reduction in energy expenditure and fuelutilization. It is worthy to emphasize that the most characteristic feature of theobese-related increase in plasma ghrelin is the lack of the decrease in plasmahormone after a meal ingestion. Our extremely obese women with a stable bodyweight did not demonstrate any suppression of total or acylated ghrelin after ameal, the phenomenon observed in all lean controls. These data are consistent, inpart, with reports showing that circulating total fasting ghrelin level is usuallylower in obese subjects exhibiting an insulin resistance (40). This is also consistentwith other observations that nutrients induced insulin secretion fails to suppressghrelin in obese subjects (50). We also measured acylated ghrelin, which inpostprandial conditions was highest in extremely obese subjects and constitutedabout 30% of total ghrelin, whereas in non-obese lean controls - only 15% of totalghrelin. We confirmed that total ghrelin concentration does not reflect the changesin the concentrations of acylated ghrelin in obese subjects with metabolicsyndrome as proposed previously (51, 52). In our study paradoxically��hyperghrelinemia��of acylated form occurred mainly in severely obese subjects.It is likely that clinical consequences of such permanent hyperphagia, socharacteristic for exceptionally obese individuals, seems to be understandablebecause active ghrelin accelerates gastric emptying and gastrointestinal transit byactivating excitatory, cholinergic pathways in the vagal nerves. Furthermore, ourresults agree with paradoxically high basal ghrelin level and its responses recordedby Beck et al. in heavy, obese Zucker rats as compared to slightly obese animals(53). Considering the metabolic features associated with morbid obesity, thepresent study shows that total ghrelinemia is inversely correlated with higher BMI,insulin resistance and CRP and fat mass percentage, while acylated ghrelinemiawas positively correlated with the percentage of fat mass and also with CRP levels.
28

Furthermore, it was also found that circulating acylated ghrelin levels arenegatively correlated with TC and LDL-C levels. On the basis of the cohort studyof lipid profile in 527 severe obese patients before gastric surgery, Dixon &O�Brien reported that fasting TC and LDL-C concentrations were usually normaland also shown that increasing BMI is associated with lower TC in severely obesepatients (54). Such lipids profile in extremely obese subjects remains unclear. Ourstudy has confirmed that TC and LDL-C concentrations, without significantlydecreased HDL-C, were also usually normal in morbidly obese individuals.Among many other functions the active ghrelin have beneficial metabolic effectsby participating in lipid metabolism at least by two mechanisms: active ghrelin co-purify with HDL, destroys lipid peroxides on LDL and may down-regulate CD36scavenger macrophage receptor (55, 56). The current studies suggest thatcirculating acylated ghrelin is also closely related to paraoxonase-1 (PON1) that isassociated with high-density lipoproteins and capable of hydrolyzing oxidizedlipids as well as preventing the oxidation of low-density lipoproteins. Octanoylgroup of ghrelin may be bound with an ester to paraoxonase suggesting a possiblerole of this enzyme in the conversion of acylated- to desacylated-ghrelin form (57).Among positive effects of acylated ghrelin that need to be mentioned is its anti-inflammatory, as well as indirect effect preventing hypertension in obesity.Unfortunately, in our study we were unable to show the relationship between theconcentration of ghrelin and the presence of hypertension in obese subjects. On theother hand, recently, ghrelin has been shown to exert an vasoconstrictive actionand also its positive association with carotid artery atheroclerosis in cohort studyin males (58). We hypothesise that the results of the present study indicate thecompensatory upregulation of active ghrelin concentrations particularly inseverely obese patients.
As indicated in the introduction, PYY belongs to PP family of 36 amino acidpeptides co-released together with GLP-1 from endocrine distal-intestinal L cellsin response to caloric load with micronutrient potency of lipids being greater thanthat of carbohydrates, which is greater than that of protein. PYY1-36 released fromL cells into the circulation is immediately proteolyzed by DPP-IV to bioactivePYY3-36 that exerts a potent anorexigenic influence observed in lean controlsubjects. Since fasting levels of PYY3-36 was significantly reduced in obese,particularly in morbidly obese patients, compared to lean controls, it may bereasonable to assume that the enhanced appetite in these obese subjectsoriginates, at least in part, from the deficiency of plasma circulating level ofPYY3-36 (20, 41). Moreover, obese patients, unlike lean controls, failed to showany major increase in plasma levels of PYY3-36, explaining the lack of usualpostprandial reduction in food intake and in appetitive drive. In our study, theplasma levels of PYY3-36, which in lean control women showed a markedincrement 60 min following mixed meal, exhibited a marked suppressionobserved in obese women throughout the postprandial observation period. Incontrast to other studies on PYY3-36, a lower fasting concentration of PYY3-36 was
29

discovered only in massively obese patients (20, 41). As presented in theintroduction, PYY3-36 constitutes the dominant form of total PYY in circulation;nevertheless, due to the lack of corresponding data on the secretion of PYY3-36 inavailable literature, it is not possible to compare our results with the data relatedto total peptide.
According to le Roux et al. (41), the ratio of plasma concentrations betweenPYY1-36 to PYY3-36 was similar in normal-weight and obese subjects (41). Otherauthors, however, demonstrated that the secretion of PYY3-36 constitutes slightlyabove 50% of the portion of the total circulating PYY1-36 (19). In our study, wefailed to explored the total PYY, therefore, the results we obtained for PYY3-36
cannot be compared to the total PYY. Many earlier reports show that the totalPYY is suppressed in obese subjects as a consequence of insulin resistance andhigher glucose concentration (20, 41). In our study, two examined obese womengroups differed from lean controls by showing lower plasma PYY3-56 both underbasal conditions and after meal and this was accompanied by higher postprandialblood glucose and insulin levels. Combined with this fact, the differences in thelevels of PYY3-36 concentration in both obese groups, in our opinion, may beconnected with increased blood glucose and augmented postprandial levels ofinsulin and possibly other hormonal and metabolic disturbances, originating fromfactors released form adipose tissue (7).
However, considering the smaller postprandial secretion of PYY3-36 in obesepatients, it should be noted that exposure to the anorectic effects of this gut-brainpeptide over the postprandial period of 2 h in severely obese persons was muchsmaller than that in healthy lean subjects, suggesting that in patients with massiveobesity, functional damage to the hypothalamus may occur, resulting in decreaseof satiety and relative increase of food intake. Thus, obese subjects may havePYY deficiency that would reduce satiety and thus could reinforce their obesity(43). The PYY3-36, a most potent endogenous Y2R agonist may, modulate insulinaction via Y2R. On the other hand, hypothalamic overexpression of NPY and itsreceptors during stress, induced obesity and insulin resistance in mice and maymask the anorectic properties of PYY3-36. Results conducted on animals show thatthe Y2R appears in arteries of spontaneous hypertensive rats (SHR). Theactivation of this receptor may result in vasoconstrictors effects suggesting thatY2R plays a role in the regulation of blood pressure (44). Hoek et al. alsodemonstrated that PYY3-36 augmented insulin activity in glucose disposal in micefed a high�fat diet through a mechanism independent of food intake and bodyweight (45). Taking into account metabolic effects demonstrated in the empiricalmodel of PYY3-36 participation in insulin sensitivity, it can be assumed that lowconcentrations of PYY3-36 in obese subjects may partly contribute to their insulinresistance. Our results demonstrating higher levels of circulating ghrelin, thatoppose and counteract a PYY-acting hormone, may actually be involved in thesuppression of PYY3-36 but only in particularly obese individuals. Moreexplanations come from the studies concerning visceral banded gastroplasty and
30

jejuno-ileal-bypass, where plasma level of total PYY is significantly increasedcompared to non-operated controls. These studies suggest that the number ofPYY-containing cells is decreased in obese patients and increased followingoperation. Operations or diseases, which hinder absorption, stimulate basic andmeal-induced PYY levels (46). Thus, the combination of increased PYY levelsand elevated activity of DPP-IV, resulting in increased PYY3-36 observed afterbariatric operations, may lead to reduction in appetite and decrease in food intake.
In human studies with DPP-4�s chemical inhibitors preventing the inactivationof both glucagon-like peptide-1 (GLP-1) and gastric inhibitory peptide (GIP) andlowering blood glucose; enhanced levels of incretin hormones, such as GLP-1,GIP, and insulin occurred, preventing weight gain (42, 47). Batterham et al. hasshown the inhibitory effects of an infusion of PYY3-36 on appetite and food intakefor obese patients, but so far the attempts of using PYY3-36 in humans have notcontributed significantly to substantial reduction in body mass, and, moreover, itsuse is limited by side effects (17, 18, 48, 49).
We also attempted to determine the patterns of secretion of other gut hormonessuch as CCK and gastrin in lean controls and obese women. In our study wefound the lowest fasting CCK plasma levels and lower plasma CCK response toa meal in morbidly obese women as compared to lean controls. Our results are inagreement with data of French et al. who also found differences in CCKpostprandial profile between massive obese patients and healthy subjects (59).Low fasting plasma CCK levels and reduced postprandial peak of thisanorexigenic gut hormone may be an insufficient signal for the satiety center atthe level of hypothalamus, leading to increased food intake and subsequentobesity. Recent studies using CCK receptor agonist or antagonist showed asignificant effect of physiologically released CCK on gastrointestinal motility,postprandial contraction, inhibition of gastric contractions and inhibition of colontransit (38, 60). In our obese patients we demonstrated the reduced and delayedmeal-stimulated CCK release similar to that shown in bulimia nervosa alsoaccompanied by deficiency of CCK (61). We suggest that not only lowpostprandial concentrations of CCK but also altered patterns of CCK release bymeal may contribute to obesity. Moreover, CCK interacts with PYY and also withghrelin. CCK stimulates release PYY from L-cells and antagonizes orexigenicghrelin effects on vagal afferent fibres (62). Kobelt et al. showed that peripherallyadministered CCK together with ghrelin inhibited ghrelin-induced feedingbehavior and ghrelin-induced Fos expression in the hypothalamic arcuate nucleus(63). CCK acting via CCK-1 receptors on antral D cells that stimulatesomatostatin release, which has an inhibitory effect on gastrin secretion from Gcells. Since both fasting and postprandial release of CCK in severely obeseindividuals were much lower than in moderately obese women (OB-MS) and leancontrols, it is possible that the attenuation of the satiating action of this hormone,similarly to that of PYY3-36, could contribute to the increase in food intake and toincreased appetitive behavior observed in obese patients.
31

We conclude that: 1. metabolic syndrome features accompanying obesity areclosely related to plasma alterations of major orexigenic peptides such as ghrelinand of anorexigenic hormones such as PYY3-36 and CCK both under fasting andpostprandial conditions; and 2. determination of plasma levels of hormonescontrolling food intake could be considered as a valuable tool to assessprogression of metabolic syndrome to comorbidities in obesity.
REFERENCES
1. Ogden CL, Carroll MD, Curtin LR, McDowell MA, Tabak CJ, Flegal KM. Prevalance ofoverweight and obesity in the United States, 1999-2004. JAMA 2006; 295: 1549-1555.
2. Wyle¿o³ M, ¯wirska-Korczala K, Pa�nik K. Bariatric surgery in Poland from 1993 to 2003. JPhysiol Pharmacol 2005; 56 (suppl 6): 109-115.
3. ¯wirska-Korczala KW, Wyle¿o³ M. Surgical treatment of obesity. In The Various Types andTreatments for Obesity. I. Harsch (ed), Nova Science Publishers, Inc New York US 2006, pp.285-287.
4. Meigs JM. Definitions and mechanisms of the metabolic syndrome. Curr Opin EndocrinolDiabetes 2006; 13: 103-110.
5. Wang CC, Goalstone ML, Drazuin B. Molecular mechanism of insulin resistance that impactcardiovascular biology. Diabetes 2004; 53: 2735-2740.
6. Poirier P, Giles TD, Bray GA, et al. Obesity and cardiovascular disease: pathophysiology,evaluation, and effect of weight loss. Circulation 2006:113: 898-918.
7. Schäffler A, Müller-Ladner U, Schölmerich, J, Büchler C. Role of adipose tissue as aninflammatory organ in human diseases. Endocrine Reviews 2006; 25: 449-467.
8. Rajala MW, Scherer PE. Minireview: the adipocytes at the crossroad of energy homeostasis,inflammation and atherosclerosis. Endocrinology 2003; 144: 3765-3773.
9. Neels JG, Olefsky JM. Inflamed fat: what starts the fire? J Clin Invest 2006; 116: 33-35.10. Ford E. The metabolic syndrome and C-reactive protein, fibrynogen, and leucocyte count:
finding from the Third National Health and Nutrition Examination Survey. Atherosclerosis2003; 168: 351-358.
11. Chan JCN, Cheung JCK, Stehouwer CDA, et al. The central roles of obesity-associateddyslipidaemia, endothelial activation and cytokines in the Metabolic Syndrome � an analysis bystructural equation modelling. Int J Obes 2002; 26: 994-1008.
12. Sundstrom J, Riserus U, Byberg L, et al. Clinical value of the metabolic syndrome for long termprediction of total and cardiovascular mortality prospective, population based cohort study.BMJ 2006; 332: 878-882.
13. Wilson PW, D�Agostino RB, Parise H, et al. Metabolic syndrome as a precursor ofcardiovascular diseases and type 2 diabetes mellitus. Circulation 2005; 112: 3066-3072.
14. Gnanapavan S, Kola B, Bustin SA, et al. The tissue distribution of the mRNA of ghrelin andsubtypes of its receptor, GHS-R, in humans. J Clin Endocrinol Metab 2002; 87: 2988-2991.
15. Cummings DE. Ghrelin and the short- and long-regulation of appetite and body weight. PhysiolBehavior 2006; 89: 71-84.
16. Konturek PC, Konturek JW, Cze�nikiewicz-Guzik M, Brzozowski T, Sito E, Konturek SJ.Neuro-hormonal control of food intake; basic mechanisms and clinical implications. J PhysiolPharmacol 2005; 56 (Suppl 6): 5-25.
17. Batterham RL, Cohen MA, Ellis SM, et al. Inhibition of food intake in obese subjects by peptideYY3-36. NEJM 2003; 349: 941-948.
32

18. Batterham RL, Cowley MA, Small CJ, et al. Gut hormone PYY(3-36) physiologically inhibitsfood intake. Nature 2002; 418: 650-654.
19. Grandt D, Schimiczek M, Beglinger C, et al. Two molecular forms of peptide YY (PYY) areabundant in human blood: characterization of a radioimmunoassay recognizing PYY 1-36 andPYY 3-36. Regul Pept 1994; 51(2): 151-159.
20. Stock S, Leichner P, Wong AC, et al. Ghrelin, peptide YY, glucose-dependent insulinotropicpolypeptide, and hunger responses to a mixed meal in anorexic, obese, and control femaleadolescents. J Clin Endocrinol Metab 2005; 90: 2161-2168.
21. Konturek SJ, Konturek JW, Pawlik J, Brzozowski T. Brain-gut axis and its role in the control offord intake. J Physiol Pharmacol 2004; 55: 137-154.
22. Koda S, Date Y, Murakami N, et al. The role of the vagal nerve in peripheral PYY (3-36)induced feeding reduction in rats. Endocrinology 2005; 146: 2369-2375.
23. Jensen RT. Involvement of cholecystokinin/gastrin-related peptides and their receptors inclinical gastrointestinal disorders. Pharm Toxicol 2002; 91: 333-350.
24. Peeters TL. Ghrelin: a new player in the control of gastrointestinal functions. Gut 2005; 54:1638-1649.
25. Asakawa A, Inui A, Fujimiya M, et al. Stomach regulates energy balance via acylated ghrelinand desacyl ghrelin. Gut 2005; 54: 18-24.
26. Korbonits M, Goldstone AP, Gueorguiev M, et al. Ghrelin, -a hormone with multiple functions.Front Neuroendocrinol 2004; 24: 27-68.
27. Broglio F, Gottero C, Prodam F, et al. Ghrelin secretion is inhibited by glucose load and insulin-induced hypoglycaemia but unaffected by glucagon and arginine in humans. Clin Endocrinol2004; 61: 503-509.
28. Arosio M, Ronchi CL, Gebbia C, et al. Stimulatory effects of ghrelin on circulatingsomatostatin and pancreatic polypeptide levels. J Clin Endocrinol Metab 2003; 88: 701-704.
29. Zhang W, Chen M, Chen X, et al. Inhibition of pancreatic protein secretion by ghrelin in the rat.J Physiol 2001; 537: 231-236.
30. Pilichiewicz AN, Little TJ, Brennan IM, et al. Effects of load, and duration, of duodenal lipidon antropyloroduodenal motility, plasma CCK and PYY, and energy intake in healthy men. AmJ Physiol Regul Integr Comp Physiol 2006; 290: R668-R677.
31. Xia Y, Ran L, Yan D, Regulative effects of ovarian steroids on rat gastric motility andsensitivity. Acta Physiol Sin 2006; 58: 275-280.
32. Peters JH, Simasko SM, Ritter RC. Modulation of vagal afferent excitation and reduction offood intake by leptin and cholecystokinin. Physiol Behavior 2006; in press.
33. Marchal-Victorion S, Vionnet N, Escrieut C, et al. Genetic, pharmacological and functionalanalysis of cholecystokinin-1 and cholecystokinin-2 receptor polymorphism in type 2 diabetesand obese patients. Pharmacogenetics 2002; 12: 23-30.
34. Dockray G, Dimaline R, Varro A. Gastrin: old hormone, new functions. Pflugers Arch 2005;449: 344-355.
35. Koh TJ, Chen D. Gastrin as a growth factor in the gastrointestinal tract. Regulatory Peptides2000; 93: 37-44.
36. Schubert ML. Gastric secretion. Curr Opin Gastroenterol 2005; 21: 636-643.37. Rehfeld JF. The endoproteolytic maturation of progastrin and procholecystokinin. J Mol Med
2006; 84: 544-550.38. Jensen MD. Potential role of new therapies in modifying cardiovascular risk in overweight
patients with metabolic risk factors. Obesity 2006; 14: 143S-149S.39. Matthews DR, Hosker JP, Rudenski AS, Naylor BA, Treacher DF, Turner RC. Homeostasis
model assessment: insulin resistance and β-cell function from fasting plasma glucose andinsulin concentrations in man. Diabetologia 1985; 28: 412-419.
33

40. Ikezaki A, Hosoda H, Ito K, et al. Fasting plasma ghrelin levels are negatively correlated withinsulin resistance and PAI-1, but not with leptin, in obese children and adolescents. Diabetes2002; 51: 3408-3411.
41. le Roux CW, Batterham RL, Aylwin SJB, et al. Attenuated peptide YY release in obese subjectsis associated with reduced satiety. Endocrinology 2006; 147: 3-8.
42. Stanley S, Wynne K, Bloom S. Gastrointestinal satiety signals III. Glucagon-like peptide 1,oxyntomodulin, peptide YY, and pancreatic polypeptide. Am J Physiol Gastrointest LiverPhysiol 2004; 286: G693-G697.
43. ¯wirska-Korczala K, Ostrowska Z, Buntner B, Pardela M, Dró¿d¿ M. Growth hormone (GH),prolactin (PRL) and cortisol (F) secretion in insulin test in women several years afterjejunoileostomy for morbid obesity. Endocrine Regul 1995; 29: 95-106.
44. Gradin KA, Buus CL, Li JY, Frobert O, Simonsen U. Neuropeptide Y2 receptors are involvedin enhanced neurogenic vasoconstriction in spontaneously hypertensive rats. Br J Pharmacol2006; 148: 703-713.
45. van der Hoek AM, Heijboer AC, Corssmit EP, et al. PYY3-36 reinforces insulin action onglucose disposal in mice fed a high-fat diet. Diabetes 2004; 53: 1949-1952.
46. Alvarez Bartolome M, Borque M, Martinez-Sarmiento J, et al. Peptide YY secretion in morbidlyobese patients before and after vertical bander gastroplasty. Obes Surg 2002; 12: 324-327.
47. Ahren B, Pacini G. Islet adaptation to insulin resistance: mechanisms and implications forintervention. Diabetes Obes Metab 2005; 7: 2-8.
48. Boggiano MM, Chandler PC, Oswald KD, et al. PYY 3-36 as an anti-obesity drug target. ObesRev 2005; 6: 307-322.
49. Degen L, Oesch S, Casanova M, et al. Effect of peptide YY3-36 on food intake in humans.Gastroenterology 2005; 129: 1430-1436.
50. English PJ, Ghatei MA, Malik IA, Bloom SR, Wilding JP. Food fails to suppress ghrelin levelsin obese humans. J Clin Endocrinol Metab 2002; 87: 2984-2987.
51. Kojima S, Nakahara T, Nagai N, et al. Altered ghrelin and peptide YY responses to meals inbulimia nervosa. Clin Endocrinol 2005; 62: 74-78.
52. Nakai Y, Hosoda H, Nin K, et al. Plasma levels of active form of ghrelin during oral glucosetolerance test in patients with anorexia nervosa. Eur J Endocrinol 2003; 149: R1-R3.
53. Beck B, Richy S, Stricker-Krongrad A. Ghrelin and body weight regulation in the obese Zuckerrat in relation to feeding state and dark/light cycle. Exp Biol Med 2003; 228: 1124�1131.
54. Dixon JB, O�Brien PE. Lipid profile in the severely obese: changes with weight loss after lap-band surgery. Obes Res 2002; 10: 903-910.
55. Demers A, Mc Nicoll N, Febbraio M, et al. Identification of the growth hormone-releasingpepide binding site in CD36: a photoaffinity cross-linking study. Biochem J 2004; 382: 417-424.
56. Avallone R, Demers A, Rodrique-Way A, et al. A growth hormone-releasing peptide that bindsscavenger receptor CD36 and ghrelin receptor upregulates ABC sterol transportes andcholesterol efflux in macrophages through a PPARγ-dependent pathway. Mol Endocrinol 2006;in press
57. Macknes B, Quarck R, Verreth W, Mackness M, Holvoet P. Human paraoxonase-1overexpression inhibits atherosclerosis in a mouse model of metabolic syndrome. ArteriosclerThrob Vasc Biol 2006; 26: 1545-1550.
58. Poyyko SM, Kellokoski E, Ukkola H, et al. Plasma ghrelin concentrations are positiveyassociated with carotid artery atherosclerosis in males. J Intern Med 2006; 260: 43-52.
59. French SJ, Murra YB, Rumsey RD, et al. Preliminary studies n the gastrointestinal responses tofatty meals in obese people. Int J Obes 1993; 17: 295-300.
60. Moran TH, Lee P, Ladenheim EE, Schwartz GJ. Responsivity to NPY and melanocortins inobese OLETF rats lacking CCK-A receptors. Physiol Behav 2002; 75: 397-402.
34

61. Lydiard RB, Brewerton TD, Fossey MD, et al. CSF cholecystokinin octapeptide in patients withbulimia nervosa and in normal comparison subjects. Am J Psychiatry 1993; 150(7): 1099-101.
62. Sharf MT, Ahima MS. Gut peptides and other regulators in obesity. Semin Liver Dis 2004; 24:335-347.
63. Kobelt P, Paulitsch S, Goebel M, et al. Peripherial injection of CCK-8S induces Fos expressionin the dorsomedial hypothalamic nucleus in rats. Brain Res 2006; 1117: 109-117.
R e c e i v e d : January 25, 2007A c c e p t e d : February 20, 2007
Author�s address: Prof. Krystyna Zwirska-Korczala, Department of Physiology, Zabrze,Medical University of Silesia, 41-800 Zabrze, ul. Jordana 19, Poland.E-mail: [email protected]
35