basel ii pillar 3 disclosure for 2010 cimb bank berhad · its major credit exposures since 1 july...
TRANSCRIPT
Basel II Pillar 3 Disclosure for 2010
CIMB Bank Berhad

Abbreviations
A-IRB Approach : Advanced Internal Ratings Based Approach
BAFIA : Banking and Financial Institution Act 1989
BI : Banking Institutions
BCC : Business Credit Committee
BNM : Bank Negara Malaysia
BRC : Board Risk Committee
BSMC : Balance Sheet Management Committee
CaR : Capital-at-Risk
CCR : Counterparty Credit Risk
CIMBBG : CIMB Bank Berhad, CIMB Islamic Bank Berhad, CIMB Thai Bank Public Company Ltd and its subsidiaries, CIMB Bank PLC (Cambodia) and CIMB Factor Lease Berhad
CIMBIBG : Consist of CIMB Investment Bank Berhad and CIMB Futures Sdn Bhd
CIMBGH Group : Group of Companies under CIMB Group Holdings Berhad
CIMB Bank : CIMB Bank Berhad and CIMB Bank (L) Ltd (as determined under the RWCAF to include its wholly owned offshore banking subsidiary company)
CIMB Group or the Group : Collectively CIMBBG, CIMBIBG and CIMB Islamic as described within this Report
CIMB IB : CIMB Investment Bank Berhad
CIMB Islamic : CIMB Islamic Bank Berhad
CRC : Credit Risk Committee
CRM : Credit Risk Mitigants
CSA : Credit Support Annexes, International Swaps and Derivatives Association Agreement
DFIs : Development Financial Institutions
EAD : Exposure At Default
EaR : Earnings-at-Risk
ECAIs : External Credit Assessment Institutions
EL : Expected Loss
EP : Eligible Provision
EVE : Economic Value of Equity
EWRM : Enterprise Wide Risk Management
Group EXCO : Group Executive Committee
FDIs : Foreign Direct Investment
F-IRB Approach : Foundation Internal Ratings Based Approach
Fitch : Fitch Ratings
GC : Group Credit
GDP : Gross Domestic Product
GMRC : Group Market Risk Committee
GRC : Group Risk Committee
GRD : Group Risk Division
GRM : Group Risk Management
HPE : Hire Purchase
IRB Approach : Internal Ratings Based Approach
IRRBB : Interest Rate Risk in the Banking Book
LGD : Loss Given Default
MARC : Malaysian Rating Corporation Berhad
MDBs : Multilateral Development Bank
MATs : Management Action Triggers
Moody’s : Moody’s Investors Service
MTM : Mark-to-Market and/or Mark-to-Model
ORC : Operational Risk Committee
ORM : Operational Risk Management
ORMF : Operational Risk Management Framework
OTC : Over The Counter
PCSB : Proton Commerce Sdn Bhd
PD : Probability of Default
PSEs : Non-Federal Government Public Sector Entities
PSIA : Profit Sharing Investment Accounts
QRRE : Qualifying Revolving Retail Exposures
R&I : Rating and Investment Information, Inc
RAM : RAM Rating Services Berhad
RAROC : Risk Adjusted Return On Capital
RCC : Regional Credit Committee
RCM : Regional Credit Management
RLRC : Regional Liquidity Risk Committee
RMA : Risk Management & Analytics
RMO : Risk Middle Office
RRE : Residential Real Estate
RWA : Risk Weighted Assets
RWCAF : Risk Weighted Capital Adequacy Framework (Basel II)
RWCR : Risk Weighted Capital Ratio
S&P : Standard & Poor’s
SA : Standardised Approach
SBCC : Singapore Business Credit Committee
SMEs : Small and Medium Enterprises
Overview of Basel II and Pillar 3
Basel II Regulatory Capital Framework seeks to increase the risk sensitivity in capital
computations and prescribed a number of different approaches to risk calculation that
allows the use of internal models to calculate regulatory capital. The particular approach
selected must commensurate with the bank’s risk management capabilities. The Basel
II requirements are stipulated within three broad ‘Pillars’ or sections.
Pillar 1 focuses on the minimum capital measurement methodologies and their
respective qualifying criteria to use specified approaches available to calculate the RWA
for credit, market and operational risks. CIMB Bank and its subsidiaries, CIMB IB and its
subsidiaries and CIMB Islamic (collectively known as ‘CIMB Group’ or ‘the Group’ for
purposes of this disclosure) have the approval from BNM to apply the IRB Approach for
its major credit exposures since 1 July 2010. The IRB Approach prescribes two
approaches, the F-IRB Approach and A-IRB Approach. Under F-IRB Approach, the
Group applies its own PD and the regulator prescribed LGD, whereas under the A-IRB
Approach, the Group applies its own risk estimates of PD, LGD and EAD.
Pillar 2 focuses on how sound risk management practices should be implemented from
the Supervisory Review perspective. It requires financial institutions to make their own
assessments of capital adequacy in light of their risk profile and to have a strategy in
place for maintaining their capital levels. In light of BNM’s guidelines on the RWCAF –
Internal Capital Adequacy Assessment Process (Pillar 2), a comprehensive self
assessment to evaluate existing capital and risk management practices against the
expectations set forth in the BNM’s guidelines and development of action plans to close
any gaps identified is underway and due for submission to BNM by 30 June 2011.
Pillar 3 complements Pillar 1 and Pillar 2 by presenting disclosure requirements aimed
to encourage market discipline in a sense that every market participants can assess key
pieces of information attributed to the capital adequacy framework of financial
institutions. These disclosures herein are formulated in accordance with the
requirements of BNM’s guidelines on RWCAF – Disclosure Requirements (Pillar 3).
The qualitative disclosures in this Report are required to be updated on an annual basis
and more frequently if significant changes to policies are made. The capital structure
and adequacy disclosures are published on a quarterly basis. All other quantitative
disclosures are published semi-annually in conjunction with the Group’s half yearly
reporting cycles. These disclosures are also available on the Group’s corporate website
(www.cimb.com). The consolidated disclosures for CIMB Bank and CIMBIB are also
available in CIMBGH Group’s 2010 annual report and corporate website.

All these disclosures published are for the year ended 31 December 2010. The basis of
consolidation for financial accounting purposes is described in the 2010 financial
statements. The capital requirements are generally based on the principles of
consolidation adopted in the preparation of financial statements with the exception of
subsidiaries engaged in non-financial activities which have been excluded from the
regulatory consolidation and have been deducted from regulatory capital. During the
financial year, CIMB Bank did not experience any impediments in the distribution of
dividends. There were also no capital deficiencies in any subsidiaries that are not
included in the consolidation for regulatory purposes. For the purposes of this Report,
the disclosures presented within will be representative of the CIMB Bank entity
disclosures only.
The term ‘credit exposure’ as used in this report is a prescribed definition by BNM
based on the RWCAF – Disclosure Requirements (Pillar 3). Credit exposure is defined
as the estimated maximum amount a banking institution may be exposed to a
counterparty in the event of a default or EAD. This differs with similar terms applied in
the 2010 financial statements as the credit risk exposure definition within the ambit of
accounting standards represent the balance outstanding as at balance sheet date and
do not take into account the expected undrawn contractual commitments. Therefore,
information within this Report is not directly comparable to that of the 2010 financial
statements for CIMB Bank.
The Group has applied the provision in paragraph 7.2 of BNM’s guidelines on RWCAF –
Disclosure Requirements (Pillar 3) whereby the Group has been exempted from
disclosing comparative information as a first time adoption of this requirement. These
disclosures have been reviewed and verified by internal auditors and approved by the
Board of Directors of CIMBGH Group.
Table of Contents
RISK MANAGEMENT OVERVIEW................................................................................. 1
CAPITAL MANAGEMENT............................................................................................... 7
CREDIT RISK ............................................................................................................... 10
OFF BALANCE SHEET EXPOSURES AND CCR........................................................ 32
SECURITISATION ........................................................................................................ 35
MARKET RISK - SA...................................................................................................... 39
OPERATIONAL RISK ................................................................................................... 42
EQUITY EXPOSURES IN BANKING BOOK................................................................. 44
INTEREST RATE RISK IN THE BANKING BOOK (IRRBB) ......................................... 45

BASEL II PILLAR 3 DISCLOSURES FOR 2010
1
RISK MANAGEMENT OVERVIEW
Risk management is an integral component of the Group’s business, operations and decision-making process. In ensuring that the Group achieves optimum returns whilst operating within a sound business environment, GRM is involved at the early stage of the risk taking process by providing independent inputs such as the relevant valuations, credit evaluations, new product assessments and CaR quantifications. These inputs enable business units to align their business strategies with the Group’s risk appetite.
The objectives of CIMB Group’s risk management activities are to:
• Identify the various risk exposures and risk capital requirements;
• Ensure risk taking activities are consistent with risk policies and the aggregated risk position are within the risk appetite as approved by the Board; and
• Help create shareholder value through proper allocation of risk capital and facilitate development of new business and products.
Enterprise Wide Risk Management Framework
CIMB Group employs the EWRM framework to manage its risk and opportunity effectively. It is an on-going process of identifying, evaluating, monitoring, managing and reporting significant risks affecting the Group implemented through various Board appointed committees.
The key components of the Group’s EWRM framework are represented in the diagram
below:
The framework is centered on resilient risk and capital management which requires the Group to identify, evaluate, measure, manage and control its significant risks and risk appetite, and relate these to its capital requirements and at all times ensure capital adequacy. CIMB Group employs CaR as the common and consistent measurement of
GOVERNANCE
RISK MANAGEMENT
LIMITS & CONTROLS
RISK ANALYSIS &
REPORTING
STRESS TESTING
ECONOMIC
CAPITAL
FRAMEWORK
REGULATORY CAPITAL
FRAMEWORK – RISK
WEIGHTED ASSETS
BASEL II PILLAR 3 DISCLOSURES FOR 2010
2
risk across CIMB Group. The CaR framework provides the basis of allocating economic capital within CIMB Bank. It provides a benchmark to facilitate the comparison of risk across business units and risk types. This enables CIMB Bank to consider both the downside risk, for risk protection and upside potential, for earnings growth. Hence, allowing the Group to measure the performance of each business on an absolute basis (economic profit) and relative percentage return basis (RAROC) against CIMB Bank’s costs of capital.
Strong risk governance holds the EWRM together. The Board of Directors through the BRC is ultimately responsible for the implementation of EWRM. GRD has been principally tasked to assist the various committees and undertakes the performance of the day-to-day risk management functions of the EWRM. The implementation of the EWRM is subjected to the independent assurance and assessment by the Group Internal Audit.
The foundation of the EWRM is made up of three major building blocks, which are Limits and Controls, Analysis and Reports, and Stress Testing. Limits constitute the key mechanism to control allowable risk taking activities and are regularly reviewed in the face of changing business needs, market conditions, and regulatory changes. Timely reports and meaningful analysis of risk positions are critical to enable the Board and its management to exercise control over all exposures and make informed business decisions.
Stress testing involves identifying possible events or future changes in the financial and economic conditions that could have unfavourable effects on CIMB Bank’s exposure and the assessment of CIMB Bank’s ability to withstand such changes, usually in relation to the capacity of its capital and earnings to absorb potentially significant losses as well as the sufficiency of its liquidity surplus and reserves. Steps are then identified to manage risk and conserve capital. Group wide stress test is performed semi-annually while stress tests on selected portfolios are performed on an ad hoc basis.
Risk Governance
The BRC assumes the ultimate responsibility on behalf of the boards of directors for the supervision of risk management within CIMB Group. In line with best practices, the BRC determines the risk policy objectives and also decides on the yearly allocation of risk capital to support all risks taken by the Group.

BASEL II PILLAR 3 DISCLOSURES FOR 2010
3
GRC is the primary delegated authority for managing risk on a group-wide basis and reports directly to BRC. Sub-committees, namely CRC, GMRC, RCC, RLRC and ORC, delegated from the GRC are set up to manage and control specific risk areas. In relation to IRRBB, GRC is further assisted by BSMC that is responsible for recommending and executing strategies and hedging proposal of the banking book as well as ensuring CIMB Bank’s interest rate risk profile is within the risk limits/MATs endorsed by the GRC. With this set-up, the Board and BRC through the various risk committees and BSMC maintain oversight of various risks across CIMB Bank.
Each committee is chaired by a director respectively. The composition of the committees includes senior management and individuals from business divisions as well as divisions which are independent from the business units. BRC reviews the composition of these committees except for BSMC, to reflect a balance of experienced independent and non-independent individuals with the necessary skills and qualifications to carry out the roles and responsibilities of the relevant committee.
BASEL II PILLAR 3 DISCLOSURES FOR 2010
4
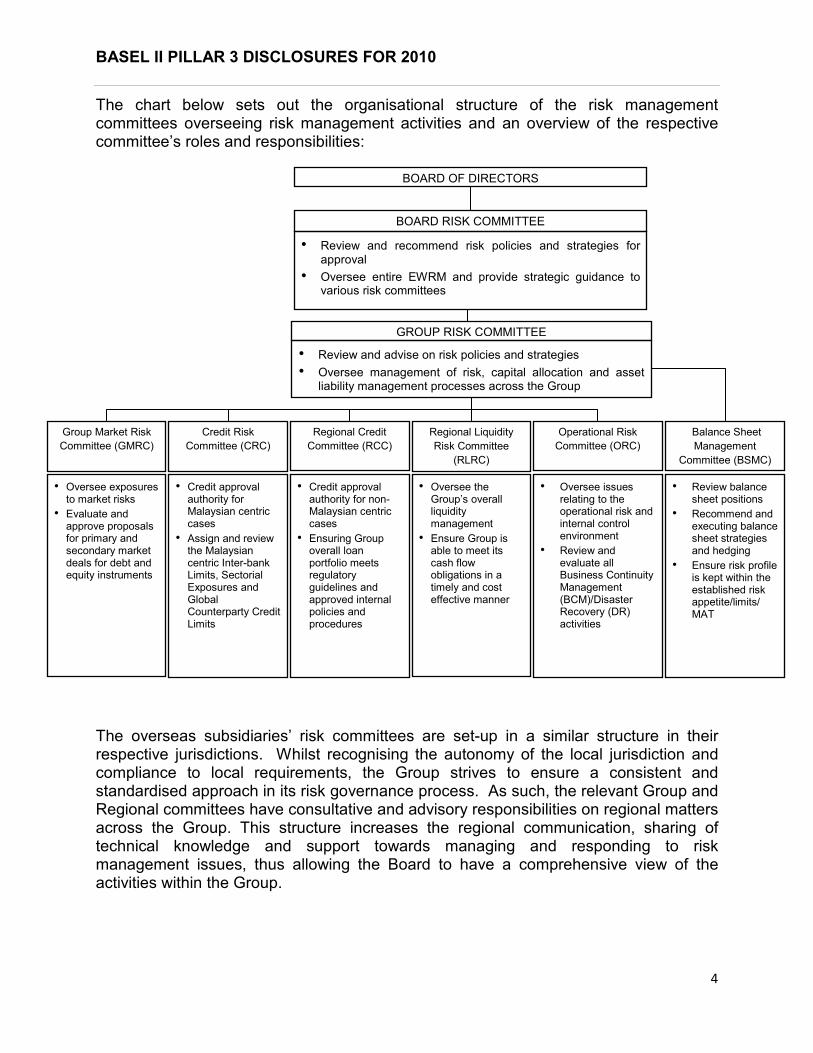
The chart below sets out the organisational structure of the risk management committees overseeing risk management activities and an overview of the respective committee’s roles and responsibilities:
The overseas subsidiaries’ risk committees are set-up in a similar structure in their respective jurisdictions. Whilst recognising the autonomy of the local jurisdiction and compliance to local requirements, the Group strives to ensure a consistent and standardised approach in its risk governance process. As such, the relevant Group and Regional committees have consultative and advisory responsibilities on regional matters across the Group. This structure increases the regional communication, sharing of technical knowledge and support towards managing and responding to risk management issues, thus allowing the Board to have a comprehensive view of the activities within the Group.
BOARD OF DIRECTORS
BOARD RISK COMMITTEE
• Review and recommend risk policies and strategies for approval
• Oversee entire EWRM and provide strategic guidance tovarious risk committees
GROUP RISK COMMITTEE
• Review and advise on risk policies and strategies • Oversee management of risk, capital allocation and asset liability management processes across the Group
Operational Risk
Committee (ORC)
• Oversee issues relating to the operational risk and internal control environment
• Review and evaluate all Business Continuity Management (BCM)/Disaster Recovery (DR) activities
Credit Risk
Committee (CRC)
• Credit approval authority for Malaysian centric cases
• Assign and review the Malaysian centric Inter-bank Limits, Sectorial Exposures and Global Counterparty Credit Limits
Regional Liquidity
Risk Committee
(RLRC)
• Oversee the Group’s overall liquidity management
• Ensure Group is able to meet its cash flow obligations in a timely and cost effective manner
Regional Credit
Committee (RCC)
• Credit approval authority for non-Malaysian centric cases
• Ensuring Group overall loan portfolio meets regulatory guidelines and approved internal policies and procedures
Group Market Risk
Committee (GMRC)
• Oversee exposures to market risks
• Evaluate and approve proposals for primary and secondary market deals for debt and equity instruments
Balance Sheet
Management
Committee (BSMC)
• Review balance sheet positions
• Recommend and executing balance sheet strategies and hedging
• Ensure risk profile is kept within the established risk appetite/limits/ MAT
BASEL II PILLAR 3 DISCLOSURES FOR 2010
5
The roles of Group Risk Division
The primary oversight body for risk management activities is GRD, comprising GRM, GC and RCM, which are independent of business units and assist the Group’s management and the various risk committees in monitoring and controlling the Group’s risk exposures.
The key responsibilities of GRD are to identify, analyse, monitor and review the principal risks to which the Group is exposed. It also helps to create shareholder value through proper allocation of risk capital, development of risk-based pricing framework and facilitate development of new businesses and products.
In ensuring a standardised approach to risk management across the Group, all risk management teams within the Group are required to conform to the Group’s EWRM framework, subject to necessary adjustments required for local regulations. For branches and subsidiaries without any risk management outfit, all risk management activities will be centralised at GRD. Otherwise, the risk management activities will be performed by the local risk management team with matrix reporting line to GRD.
• Group Risk Management
GRM monitors risk-taking activities, initiates and proposes risk policies, risk measurement methodologies, risk limits and risk capital allocation, performs independent review of loan assets quality and loan recovery plan, coordinates new products deployments and develops the risk-based product pricing framework for loan portfolios.
GRM maintains an oversight of the functions performed by the risk management units in the asset management and insurance subsidiaries.
In propagating and ensuring compliance to the market risk framework, GRM reviews and analyses treasury trading strategy, positions and activities vis-à-vis changes in the financial market and performs mark-to-market as part of financial valuation.
GRM is also tasked with the co-ordination of the Group’s effort towards implementation of the Basel II framework in compliance with the International Convergence of Capital Measurement and Capital Standards prescribed by the Bank of International Settlements and as adopted by BNM. In this regard, GRM develops, implements and validates all internal rating and scoring models and closely monitors the usage of the rating and scoring systems to ensure relevancy to current market conditions and integrity of the ratings.
BASEL II PILLAR 3 DISCLOSURES FOR 2010
6
GRM adds value to business propositions by providing advice on market valuations, CaR quantifications and independent risk assessment. This enables the business units to prepare for the potential risks associated with the new transactions or business ventures and consequently, addresses the management and mitigation of such risks from the early stage of the proposition. The business units gain understanding of the risk-reward equation of the proposition, consider the risk factors in the pricing decision, and ensure that the projected returns from the business propositions commensurate with the risks taken. In order to ensure the independence of GRM in such an arrangement, GRM’s remuneration is not linked to the success of particular transactions or deals.
• Group Credit
GC carries out independent assessments and evaluations of all credit risk related proposals originating from the various business units such as loans and advances, fixed income, derivatives, sales and trading, prior to submission to the BCC, CRC, the EXCO or Board for approval. GC ensures proper grouping of entities and counterparties under the single customer framework. GC also reviews the Bank’s holdings of all fixed income assets issued by Malaysian companies and recommends the internal ratings for CRC’s approval.
• Regional Credit Management
A regional credit platform was established with a primary objective of enhancing efficiency and effectiveness of the credit oversight as well as credit approval process for all non-Malaysian centric Corporate and Financial Institutions at the CIMB Group level. The platform includes 2 credit committees, SBCC for smaller-sized exposures and RCC for larger regional exposures. All credit proposals submitted to the 2 credit committees for approval/concurrence are routed through RCM for independent assessment and due recommendation to the credit committees.
Strategies and Processes for Various Risk Management
These information are available in later sections for each Credit Risk, Market Risk, Operational Risk and Interest Rate Risk in the Banking Book.

BASEL II PILLAR 3 DISCLOSURES FOR 2010
7
CAPITAL MANAGEMENT
Key Capital Management Principles
The key driving principles of CIMBGH Group’s capital management policies are to
diversify its sources of capital to allocate capital efficiently, and achieve and maintain an
optimal and efficient capital structure of the CIMBGH Group, with the objective of
balancing the need to meet the requirements of all key constituencies, including
regulators, shareholders and rating agencies.
The Bank sets an internal minimum capital adequacy target which is substantially above
the minimum regulatory requirement. In establishing this internal capital adequacy
target, CIMB Bank considers many critical factors, including, amongst others, credit
rating implication, current and future operating environment and peers comparisons.
The capital management process is centrally supervised by the Group EXCO, GRC and
BRC who periodically assess and review the capital requirements and source of capital
across CIMB Bank, taking into account all ongoing and future activities that consume or
create capital, and ensuring that the minimum target for capital adequacy is met.
Available capital is allocated across competing demands, guided by the predetermined
policies, and to ensure regulatory compliance. Monthly updates on capital position of
the CIMBGH Group and the Group are also provided to the Board of Directors.
Capital Structure and Adequacy
The table below sets out the summary of the sources of capital and the capital
adequacy ratios for CIMB Bank as at 31 December 2010. The relevant entities under
the Group issue various capital instruments pursuant to the respective regulatory
guidelines, including tier 2 subordinated debt, innovative and non-innovative tier 1
hybrid securities that qualify as capital pursuant to the RWCAF issued by BNM. Notes
28 to 32 in CIMB Bank separate financial statements show the summary information of
terms and conditions of the main features of capital instruments.

BASEL II PILLAR 3 DISCLOSURES FOR 2010
8
Table 1: Capital Position as at 31 December 2010
(RM '000) CIMB Bank
Tier 1 Capital
Paid-up share capital + Share Premium 8,798,102
Non-Innovative Tier 1 instruments 1,200,000
Innovative Tier 1 instruments 1,616,700
Statutory Reserve 4,383,306
Retained Earnings 2,946,010
Minority Interest -
Less: Deductions from Tier 1 capital
Goodwill 3,555,075
Deductions in excess of Tier 2 capital - Eligible Tier 1 capital 15,389,043
Subordinated Debt Capital 3,500,000
Cumulative Preference Shares 29,740
General Provision 332,130
Surplus of EP over EL 404,989
Tier 2 Capital Subject to Limits 4,266,859
Less: Deductions from Tier 2 capital 3,316,142
Investment in subsidiaries 2,998,050
Investment in capital instruments of other BI 247,976
Other Deductions 70,116
Eligible Tier 2 capital 950,717
Total eligible capital 16,339,760
RWA
Credit 87,236,173
Credit RWA Absorbed by PSIA - Market 9,176,183
Operational 9,604,531
Large Exposure for Equity Holdings 360,424
Total RWA 106,377,311
Tier 1 Capital Adequacy Ratio (%) 14.47%
Total Capital Adequacy Ratio (%) 15.36%
Proposed Dividends (600,903)
RWCR After Dividends
Core Capital Ratio 13.90%
RWCR 14.80%
BASEL II PILLAR 3 DISCLOSURES FOR 2010
9
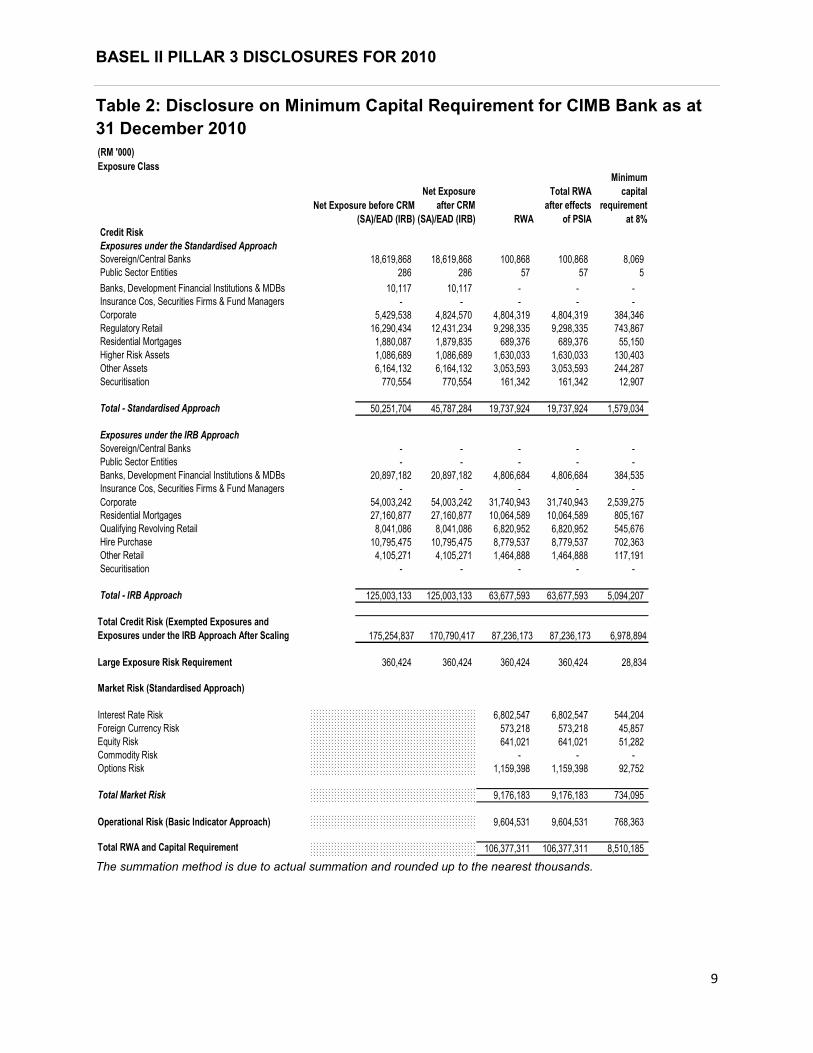
Table 2: Disclosure on Minimum Capital Requirement for CIMB Bank as at
31 December 2010
(RM '000)
Exposure Class
Net Exposure
after CRM
(SA)/EAD (IRB) RWA
Total RWA
after effects
of PSIA
Minimum
capital
requirement
at 8%
Credit Risk
Exposures under the Standardised Approach
Sovereign/Central Banks 18,619,868 18,619,868 100,868 100,868 8,069
Public Sector Entities 286 286 57 57 5
Banks, Development Financial Institutions & MDBs 10,117 10,117 - - -
Insurance Cos, Securities Firms & Fund Managers - - - - -
Corporate 5,429,538 4,824,570 4,804,319 4,804,319 384,346
Regulatory Retail 16,290,434 12,431,234 9,298,335 9,298,335 743,867
Residential Mortgages 1,880,087 1,879,835 689,376 689,376 55,150
Higher Risk Assets 1,086,689 1,086,689 1,630,033 1,630,033 130,403
Other Assets 6,164,132 6,164,132 3,053,593 3,053,593 244,287
Securitisation 770,554 770,554 161,342 161,342 12,907
Total - Standardised Approach 50,251,704 45,787,284 19,737,924 19,737,924 1,579,034
Exposures under the IRB Approach
Sovereign/Central Banks - - - - -
Public Sector Entities - - - - -
Banks, Development Financial Institutions & MDBs 20,897,182 20,897,182 4,806,684 4,806,684 384,535
Insurance Cos, Securities Firms & Fund Managers - - - - -
54,003,242 54,003,242 31,740,943 31,740,943 2,539,275
Residential Mortgages 27,160,877 27,160,877 10,064,589 10,064,589 805,167
Qualifying Revolving Retail 8,041,086 8,041,086 6,820,952 6,820,952 545,676
Hire Purchase 10,795,475 10,795,475 8,779,537 8,779,537 702,363
Other Retail 4,105,271 4,105,271 1,464,888 1,464,888 117,191
Securitisation - - - - -
Total - IRB Approach 125,003,133 125,003,133 63,677,593 63,677,593 5,094,207
Total Credit Risk (Exempted Exposures and
Exposures under the IRB Approach After Scaling 175,254,837 170,790,417 87,236,173 87,236,173 6,978,894
Large Exposure Risk Requirement 360,424 360,424 360,424 28,834
Market Risk (Standardised Approach)
Interest Rate Risk 6,802,547 6,802,547 544,204
Foreign Currency Risk 573,218 573,218 45,857
Equity Risk 641,021 641,021 51,282
Commodity Risk - - -
Options Risk 1,159,398 1,159,398 92,752
Total Market Risk 9,176,183 9,176,183 734,095
Operational Risk (Basic Indicator Approach) 9,604,531 9,604,531 768,363
Total RWA and Capital Requirement 106,377,311 106,377,311 8,510,185
Net Exposure before CRM
(SA)/EAD (IRB)
360,424
Corporate
The summation method is due to actual summation and rounded up to the nearest thousands.
BASEL II PILLAR 3 DISCLOSURES FOR 2010
10
CREDIT RISK
Credit risk, is defined as arising from losses due to the obligor, market counterparty or issuer of securities or other instruments held, failing to perform its contractual obligations to the Group. It arises primarily from lending activities through loans as well as commitments to support clients’ obligations to third parties, i.e. guarantees. In sales and trading activities, credit risk arises from the possibility that the Group’s counterparties will not be able or willing to fulfil their obligation on transactions on or before settlement date. In derivative activities, credit risk arises when counterparties to derivative contracts, such as interest rate swaps, are not able to or willing to fulfil their obligation to pay the positive fair value or receivable resulting from the execution of contract terms. Credit risk may also arise where the downgrading of an entity’s rating causes the fair value of the Group’s investment in that entity’s financial instruments to fall.
CREDIT RISK MANAGEMENT
The purpose of credit risk management is to keep credit risk exposure to an acceptable level vis-à-vis the capital, and to ensure the returns commensurate with risk.
The credit approving authority is established and documented in the Group’s credit policy. The Group adopts a multi-tiered credit approving authority spanning various delegated authorities and various credit committees. The credit committees namely, BCC, SBCC, CRC and RCC are set up to enhance the efficiency and effectiveness of the credit oversight as well as the credit approval process for all credit applications originating from the Group’s business units. The Committees also ensure the overall loan portfolio meets the guidelines of the regulatory authorities and adherence to the approved credit policies and procedures.
All credit applications are independently evaluated by GC/RCM prior to submission to the relevant committees for approval and are monitored against approved limits on a regular basis. Adherence to and compliance with single customer, country and global counterparty limits as well as the assessment of the quality of collateral are approaches adopted to address concentration risk to any large sector/industry, or to a particular counterparty group or individual.
Adherence to established credit limits is monitored daily by GRM, which combines all exposures for each counterparty or group, including off balance sheet items and potential exposures. Limits are also monitored based on rating classification of the obligor and/or counterparty.

BASEL II PILLAR 3 DISCLOSURES FOR 2010
11
It is a policy of the Group that all exposures must be rated or scored based on the appropriate internal rating models, where available. Retail exposures are managed on a portfolio basis and the risk rating models are designed to assess the credit worthiness and the likelihood of the obligors to repay their debts, performed by way of statistical analysis from credit bureau and demographic information of the obligors. The risk rating models for non-retail exposures are designed to assess the credit worthiness of the corporations or entities in paying their obligations, derived from risk factors such as financial history and demographics or company profile. These rating models are developed and implemented to standardise and enhance the credit underwriting and decision-making process for the Group’s retail and non-retail exposures.
Credit reviews and rating are conducted on the credit exposures on an annual basis and more frequent when material information on the obligor or other external factors come to light.
The exposures are actively monitored, reviewed on a regular basis and reported monthly to GRC and BRC so that deteriorating exposures are identified, analysed and discussed with the relevant business units for appropriate remedial actions including recovery actions, if required.
In addition to the above, the Group also employs CaR to measure and manage credit portfolio risk due to credit events. The Group adopted the Monte Carlo simulation approach in the generation of possible portfolio scenarios to obtain the standalone and portfolio CaR. This approach takes into account the credit concentration risk and the correlation between obligors/counterparties and industries. In estimating the portfolio CaR, the Group uses 25,000 simulation numbers at 99% confidence level. The generated portfolio CaR, and any shortfall in the provision for defaulted accounts make up to the total Credit CaR utilization to be compared against the allocated capital. The CaR usage versus pre-determined limit is monitored by RMA within GRM. Any exception will be highlighted to Management in accordance with the Group’s exception management procedures. These are summarised and reported to GRC and BRC on a monthly basis.

BASEL II PILLAR 3 DISCLOSURES FOR 2010
12
SUMMARY OF CREDIT EXPOSURES
Gross Credit Exposures by Geographic Distribution
The following table represents CIMB Bank’s credit exposures by geographic region. The
geographic distribution is based on the country in which the portfolio is geographically
managed.
Table 3: Geographic distribution of credit exposures for CIMB Bank as at
31 December 2010
(RM '000)
Exposure Class Malaysia Singapore Thailand Other Countries
Sovereign 18,252,261 367,606 - -
Bank 15,538,088 3,199,670 - 2,169,828
Corporate 52,446,073 5,965,868 - 1,020,838
Mortgage 27,515,720 1,525,244 - -
HPE 10,795,475 - - -
QRRE 8,041,086 - - -
Other Retail 19,022,684 1,364,034 - 8,986
Others 7,797,349 155,696 - 68,329
Total Gross Credit
Exposure159,408,736 12,578,120 - 3,267,982
The summation method is due to actual summation and rounded up to the nearest thousands.

BASEL II PILLAR 3 DISCLOSURES FOR 2010
13
Gross credit exposures by sector
The following table represents CIMB Bank’s credit exposure analysed by sector.
Table 4: Distribution of credit exposures for CIMB Bank as at 31 December 2010 by sector
(RM '000)
Exposure ClassPrimary
Agriculture
Mining and
QuarryingManufacturing
Electricity, Gas
and Water
Supply
Construction
Wholesale and
Retail Trade,
and
Restaurants
and Hotels
Transport,
Storage and
Communication
Finance,
Insurance, Real
Estate and
Business
Activities
Education,
Health and
Others
Others *
Sovereign - - - - - - 370,833 9,735,796 8,513,239 -
Bank - - - - - - - 20,907,586 - -
Corporate 2,526,013 734,813 8,194,514 3,534,761 6,162,441 6,509,145 9,232,040 14,597,076 1,871,682 6,070,294
Mortgage - - - - - - - - - 29,040,965
HPE - - - - - - - - - 10,795,475
QRRE - - - - - - - - - 8,041,086
Other Retail 51,854 8,637 234,774 8,988 310,442 807,945 82,697 253,109 113,409 18,523,851
Others - - - - - - - 650,113 151,331 7,219,930
Total Gross Credit
Exposure2,577,868 743,450 8,429,288 3,543,748 6,472,883 7,317,090 9,685,570 46,143,679 10,649,661 79,691,601
*Others include Retail exposures and exposures which are not elsewhere classified.
The summation method is due to actual summation and rounded up to the nearest thousands.
BASEL II PILLAR 3 DISCLOSURES FOR 2010
14
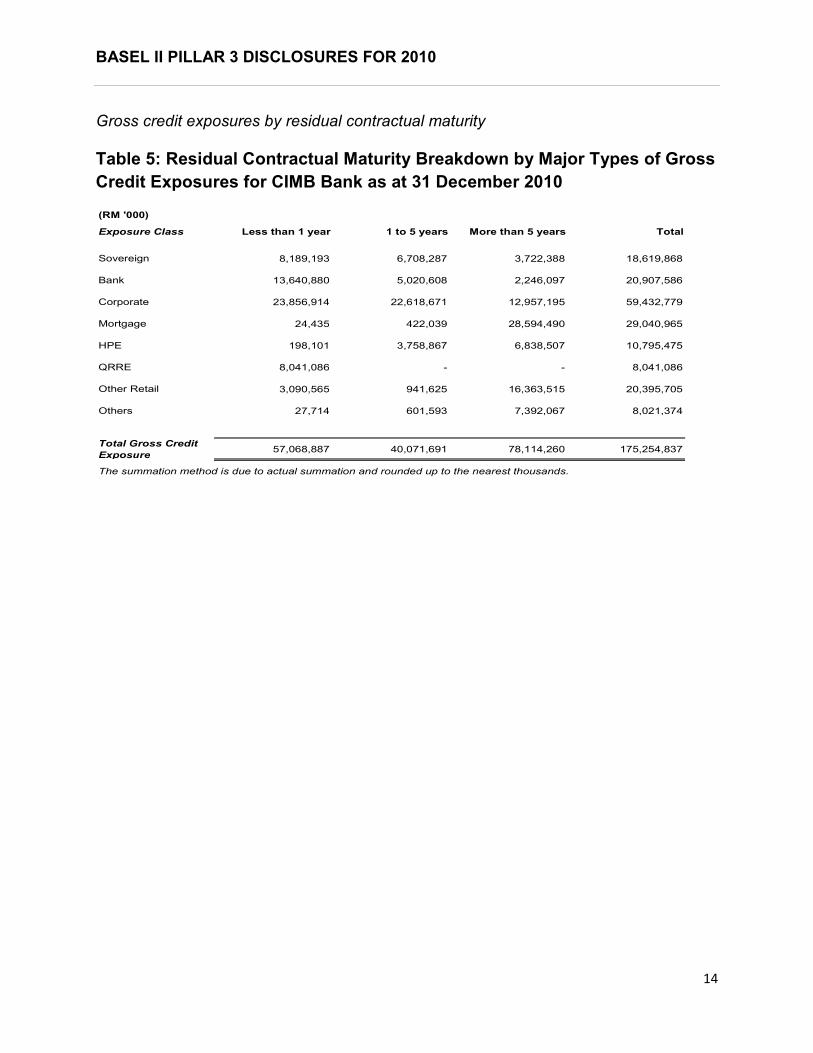
Gross credit exposures by residual contractual maturity
Table 5: Residual Contractual Maturity Breakdown by Major Types of Gross
Credit Exposures for CIMB Bank as at 31 December 2010
(RM '000)
Exposure Class Less than 1 year 1 to 5 years More than 5 years Total
Sovereign 8,189,193 6,708,287 3,722,388 18,619,868
Bank 13,640,880 5,020,608 2,246,097 20,907,586
Corporate 23,856,914 22,618,671 12,957,195 59,432,779
Mortgage 24,435 422,039 28,594,490 29,040,965
HPE 198,101 3,758,867 6,838,507 10,795,475
QRRE 8,041,086 - - 8,041,086
Other Retail 3,090,565 941,625 16,363,515 20,395,705
Others 27,714 601,593 7,392,067 8,021,374
Total Gross Credit
Exposure57,068,887 40,071,691 78,114,260 175,254,837
The summation method is due to actual summation and rounded up to the nearest thousands.

BASEL II PILLAR 3 DISCLOSURES FOR 2010
15
CREDIT QUALITY OF LOANS AND ADVANCES
Past Due But Not Impaired
A loan is considered past due when any payment due under strict contractual terms is received late or missed. Late processing and other administrative delays on the side of the borrower can lead to a financial asset being past due but not impaired. Therefore, loans and advances less than 90 days past due are not usually considered impaired, unless other information is available to indicate the contrary. For the purposes of this analysis, an asset is considered past due and included below when any payment due under strict contractual terms is received late or missed. The amount included is the entire financial asset, not just the payment, of principal or interest or both, overdue.
The following table provide an analysis of the outstanding balances as at 31 December
2010 which were past due but not impaired by sector:
Table 6(a): Past Due But Not Impaired Loans and Advances by sector for
CIMB Bank as at 31 December 2010
(RM'000)
Primary Agriculture 33,573
Mining and Quarrying 2,111
Manufacturing 149,352
Electricity, Gas and Water Supply 2,763
Construction 210,097
Wholesale and Retail Trade, and Restaurants and Hotels 193,433
Transport, Storage and Communication 55,511
Finance, Insurance, Real Estate and Business Activities 111,852
Education, Health and Others 49,354
Others* 9,661,686
10,469,732
* Others include Retail exposures and exposures which are not elsewhere classified.

BASEL II PILLAR 3 DISCLOSURES FOR 2010
16
Table 6(b): Past Due But Not Impaired Loans and Advances by Geographic
Distribution for CIMB Bank as at 31 December 2010
(RM'000)
Past Due
Malaysia 10,454,962
Singapore 14,770
Thailand -
Other Countries -
10,469,732
Impaired Loans
CIMB Bank deems a financial asset or a group of financial asset to be impaired if, and only if, there is objective evidence of impairment as a result of one or more events that has occurred after the initial recognition of the asset (an incurred 'loss event') and that loss event (or events) has an impact on the estimated future cash flows of the financial asset or the group of financial assets that can be reliably estimated.
Impairment losses are calculated on individual loans and on loans assessed collectively.
Losses for impaired loans are recognised promptly when there is objective evidence that impairment of a portfolio of loans has occurred. Evidence of impairment may include indications that the borrower or a group of borrowers is experiencing significant financial difficulty, the probability that they will enter bankruptcy or other financial reorganisation, default of delinquency in interest or principal payments and where observable data indicates that there is a measurable decrease in the estimated future cash flows, such as changes in arrears or economic conditions that correlate with defaults.
CIMB Bank assesses individually whether objective evidence of impairment exists for all assets deemed to be individually significant. If there is objective evidence that an impairment loss has been incurred, the amount of the loss is measured as the difference between the asset's carrying amount and the present value of estimated future cash flows. The carrying amount of the asset is reduced through the individual impairment allowance account and the amount of the loss is recognised in the statements of comprehensive income. Interest income continues to be accrued on the reduced carrying amount and is accrued using the rate of interest used to discount the future cash flows for the purpose of measuring the impairment loss. The interest income is recorded as part of interest income.

BASEL II PILLAR 3 DISCLOSURES FOR 2010
17
Loans that have not been individually assessed are grouped together for portfolio impairment assessment. These loans are grouped according to their credit risk characteristics for the purposes of calculating an estimated collective loss. Future cash flows on a group of financial assets that are collectively assessed for impairment are estimated on the basis of historical loss experience for assets with credit risk characteristics similar to those in the group.
The following tables provide an analysis of the outstanding balances as at 31 December
2010 which were impaired by sector and geographical respectively.
Table 7(a): Impaired Loans and Advances by sector for CIMB Bank as at 31
December 2010
(RM'000)
Primary Agriculture 21,657
Mining and Quarrying 9,865
Manufacturing 544,118
Electricity, Gas and Water Supply 348,575
Construction 401,565
Wholesale and Retail Trade, and Restaurants and Hotels 55,964
Transport, Storage and Communication 791,068
Finance, Insurance, Real Estate and Business Activities 239,169
Education, Health and Others 447,717
Others* 1,310,024
4,169,722
* Others include Retail exposures and exposures which are not elsewhere classified.
Table 7(b): Impaired Loans and Advances by Geographic Distribution for
CIMB Bank as at 31 December 2010
(RM'000)
Impaired
Malaysia 4,110,656
Singapore 59,066
Thailand -
Other Countries -
4,169,722
BASEL II PILLAR 3 DISCLOSURES FOR 2010
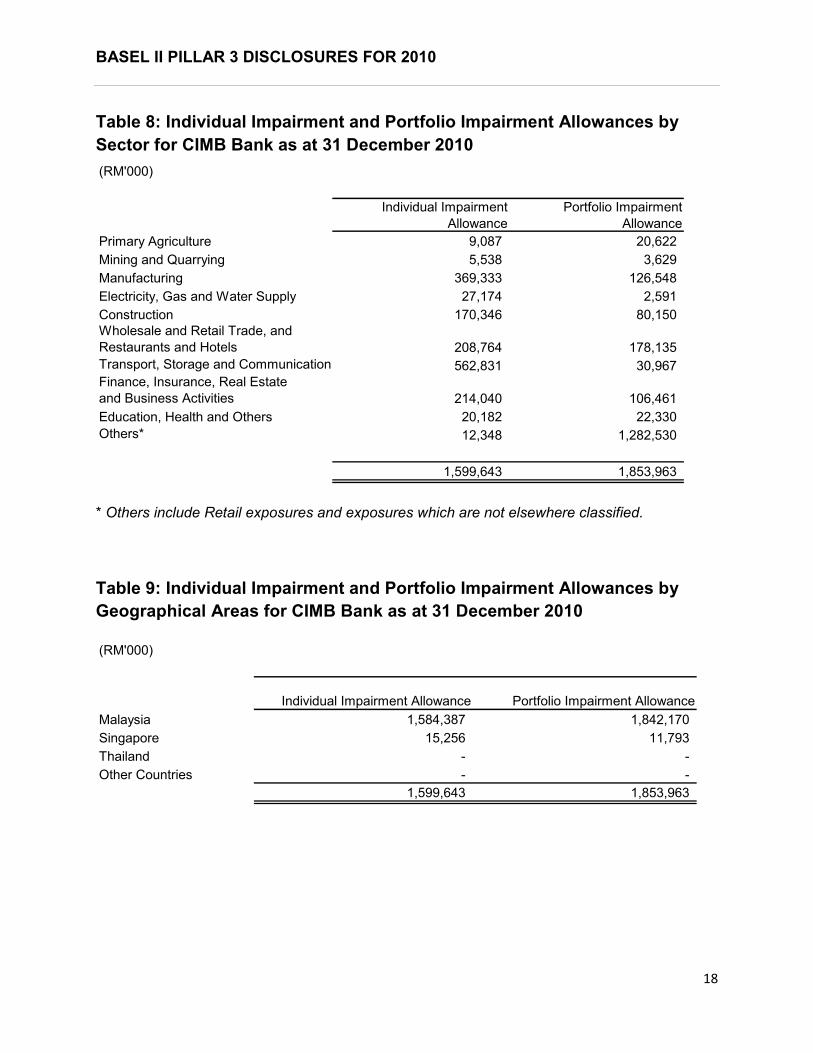
18
Table 8: Individual Impairment and Portfolio Impairment Allowances by
Sector for CIMB Bank as at 31 December 2010
(RM'000)
Individual Impairment
Allowance
Portfolio Impairment
Allowance
Primary Agriculture 9,087 20,622
Mining and Quarrying 5,538 3,629
Manufacturing 369,333 126,548
Electricity, Gas and Water Supply 27,174 2,591
Construction 170,346 80,150
Wholesale and Retail Trade, and
Restaurants and Hotels 208,764 178,135
Transport, Storage and Communication 562,831 30,967
Finance, Insurance, Real Estate
and Business Activities 214,040 106,461
Education, Health and Others 20,182 22,330
Others* 12,348 1,282,530
1,599,643 1,853,963
* Others include Retail exposures and exposures which are not elsewhere classified.
Table 9: Individual Impairment and Portfolio Impairment Allowances by
Geographical Areas for CIMB Bank as at 31 December 2010
(RM'000)
Individual Impairment Allowance Portfolio Impairment Allowance
Malaysia 1,584,387 1,842,170
Singapore 15,256 11,793
Thailand - -
Other Countries - -
1,599,643 1,853,963
BASEL II PILLAR 3 DISCLOSURES FOR 2010
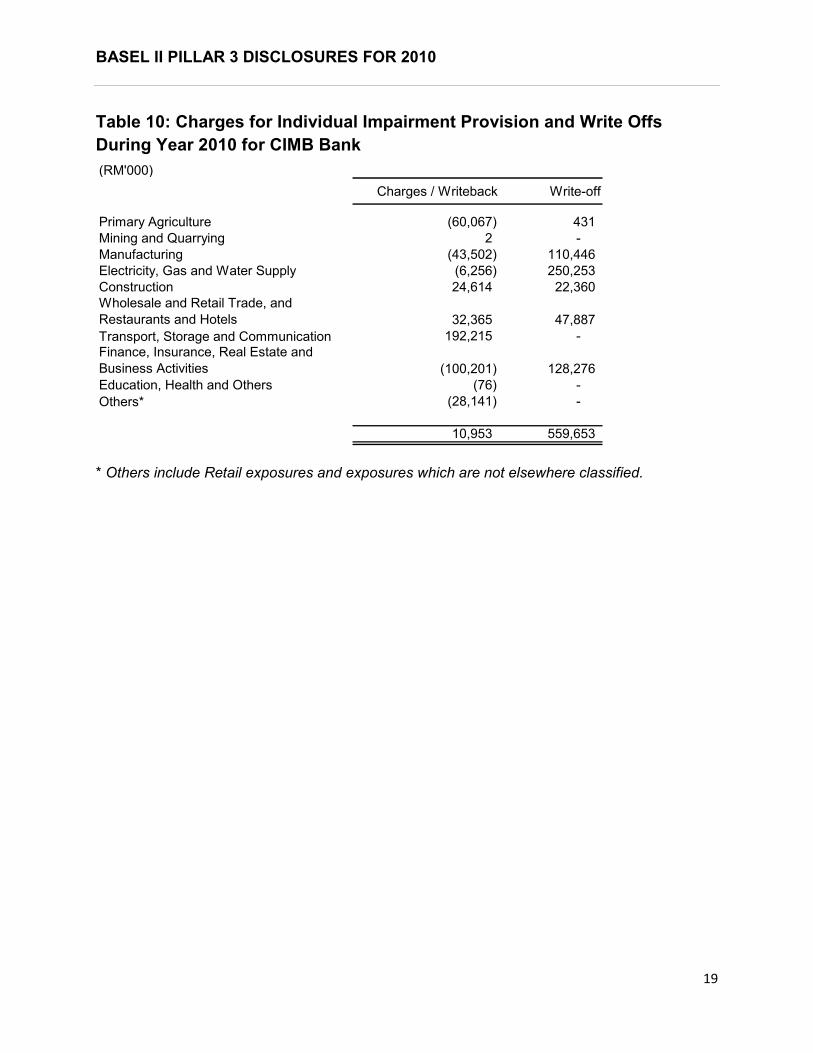
19
Table 10: Charges for Individual Impairment Provision and Write Offs
During Year 2010 for CIMB Bank
(RM'000)
Charges / Writeback Write-off
Primary Agriculture (60,067) 431
Mining and Quarrying 2 -
Manufacturing (43,502) 110,446
Electricity, Gas and Water Supply (6,256) 250,253
Construction 24,614 22,360
Wholesale and Retail Trade, and
Restaurants and Hotels 32,365 47,887
Transport, Storage and Communication 192,215 -
Finance, Insurance, Real Estate and
Business Activities (100,201) 128,276
Education, Health and Others (76) -
Others* (28,141) -
10,953 559,653
* Others include Retail exposures and exposures which are not elsewhere classified.
BASEL II PILLAR 3 DISCLOSURES FOR 2010
20
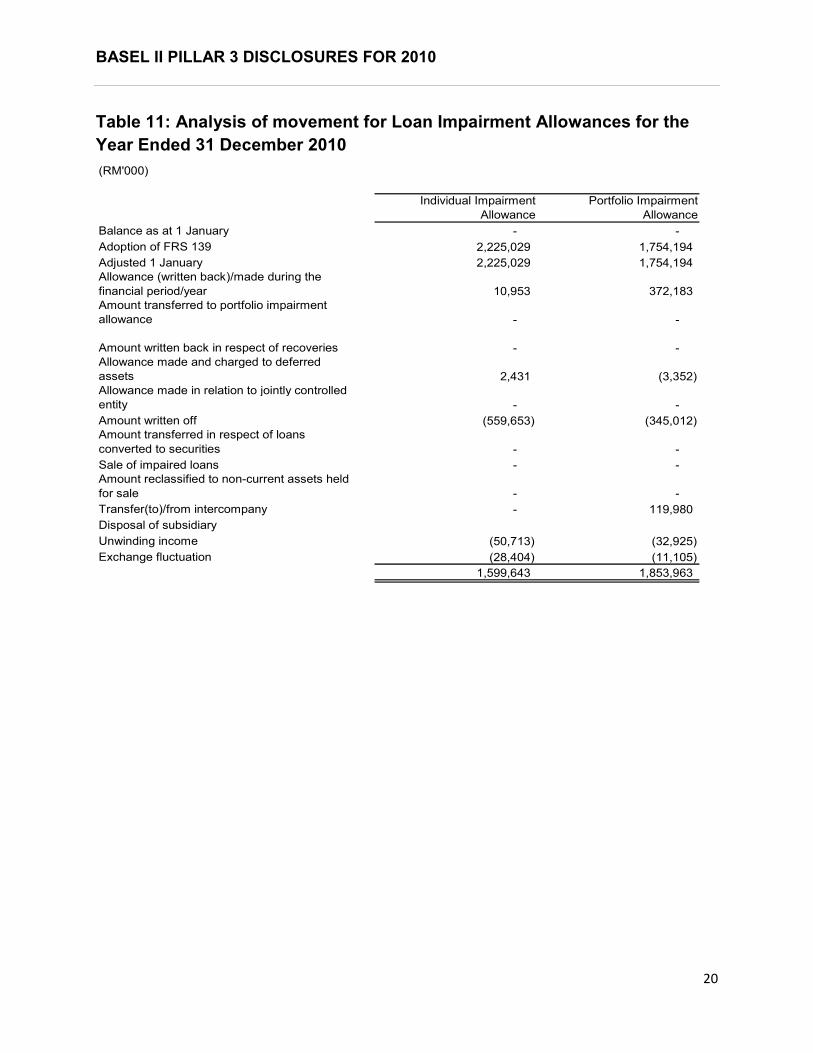
Table 11: Analysis of movement for Loan Impairment Allowances for the
Year Ended 31 December 2010
(RM'000)
Individual Impairment
Allowance
Portfolio Impairment
Allowance
Balance as at 1 January - -
Adoption of FRS 139 2,225,029 1,754,194
Adjusted 1 January 2,225,029 1,754,194
Allowance (written back)/made during the
financial period/year 10,953 372,183
Amount transferred to portfolio impairment
allowance - -
Amount written back in respect of recoveries - -
Allowance made and charged to deferred
assets 2,431 (3,352)
Allowance made in relation to jointly controlled
entity - -
Amount written off (559,653) (345,012)
Amount transferred in respect of loans
converted to securities - -
Sale of impaired loans - -
Amount reclassified to non-current assets held
for sale - -
Transfer(to)/from intercompany - 119,980
Disposal of subsidiary
Unwinding income (50,713) (32,925)
Exchange fluctuation (28,404) (11,105)
1,599,643 1,853,963

BASEL II PILLAR 3 DISCLOSURES FOR 2010
21
CREDIT RISK – DISCLOSURE FOR PORTFOLIOS
UNDER THE STANDARDISED APPROACH (SA)
Credit exposures under SA are mainly exposures where the IRB Approach is not applicable or exposures that will eventually adopt the IRB Approach. Under SA, the regulator prescribes the risk weights for all asset types.
Exposures which are rated externally relate to sovereign and central banks while the unrated exposures relate to personal financing and other exposures. The Group applies external ratings for credit exposures under SA from S&P, Moody’s, Fitch, RAM, MARC and R&I. CIMB Group follows the process prescribed under BNM’s guidelines on RWCAF - Risk-Weighted Assets Computation to map the ratings to the relevant risk weights for computation of regulatory capital.
The following table presents the credit exposures by risk weights and after credit risk mitigation:

BASEL II PILLAR 3 DISCLOSURES FOR 2010
22
Table 12: Disclosure by Risk Weight under SA for CIMB Bank as at 31 December 2010
Risk
Weights
Sovereigns/
Central BanksPSEs
Banks, MDBs
and DFIs
Insurance Cos,
Securities Firms
& Fund
Managers
CorporateRegulatory
Retail
Residential
Mortgages
Higher Risk
AssetsOther Assets Securitisation *
Total Exposures
after Netting
and Credit Risk
Mitigation *
Total Risk
Weighted Assets
0% 18,518,999 - 10,117 - - 30,896 - - 1,933,083 - 20,493,095 -
20% - 286 - - 30,826 103,880 - - 1,471,819 697,913 2,304,724 460,945
35% - - - - - - 1,752,135 - - - 1,752,135 613,247
50% - - - - 205,614 31,783 78,584 - - - 315,981 157,990
75% - - - - - 12,090,487 49,116 - - - 12,139,603 9,104,702
100% 100,868 - - - 4,373,698 134,960 - - 2,759,230 - 7,368,756 7,368,756
150% - - - - 214,433 39,228 - 1,086,689 - - 1,340,350 2,010,525
>150% - - - - - - - - - 2,525 2,525 21,759
Total 18,619,868 286 10,117 - 4,824,570 12,431,234 1,879,835 1,086,689 6,164,132 770,554 45,787,284 19,737,924
Average
Risk Weight1% 20% 0% - 100% 75% 37% 150% 50% 21% 43%
Deducation
from Capital
Base 70,116
(RM '000)
* The total for Securitisation exposures and Total Exposures after Netting and Credit Risk Mitigation includes the portion which is deducted from Capital Base
The summation method is due to actual summation and rounded up to the nearest thousands.

BASEL II PILLAR 3 DISCLOSURES FOR 2010
23
The following table presents the non-retail credit exposures before the effect of credit
risk mitigation, according to ratings by ECAIs:
Table 13: Disclosure of Rated Non-Retail Exposures under SA according to
Ratings by ECAIs for CIMB Bank
(RM '000)
Exposure Class Investment Grade Non Investment Grade No Rating
On and Off-Balance-Sheet Exposures
Credit Exposures (using Corporate Risk Weights)
Public Sector Entities - - 286
Insurance Cos, Securities Firms & Fund Managers - - -
Corporate 30,719 - 5,398,331
Sovereign/Central Banks 3,201,142 80,899 15,337,826
Banks, MDBs and DFIs 10,117 - -
Total 3,241,978 80,899 20,736,444
The summation method is due to actual summation and rounded up to the nearest thousands.
Table 14: Disclosure of Securitisation under SA according to Ratings by
ECAIs for CIMB Bank
(RM '000)
Exposure Class Investment Grade Non Investment Grade No Rating
On and Off-Balance-Sheet
Exposures
Securitisation 768,029 - 2,525
Total 768,029 - 2,525
The summation method is due to actual summation and rounded up to the nearest thousands.
BASEL II PILLAR 3 DISCLOSURES FOR 2010
24
CREDIT RISK – DISCLOSURE FOR PORTFOLIOS
UNDER THE IRB APPROACH
CIMB Group adopts the A-IRB Approach for its retail exposures and F-IRB Approach for its non-retail exposures. The IRB Approach allows the Group to adopt various rating systems to measure its credit risk to both retail and non-retail exposures. The internal risk rating systems are used not only for regulatory capital purposes, but also for credit approval and risk management reporting.
For retail exposures, application scorecards are integral to the credit approval process. Credit officers use scorecard outputs in the determination of approval of a credit application. Behavioural scorecards are used to determine the future conduct of the account and predict potential revenue based on the behaviour pattern of the customer.
For non-retail exposures, internal ratings are used to assist the approving committees in making informed decisions of the credit application. Product owners consult GRM for input on internal rating for consideration on pricing of product.
The models used in the internal rating systems are subject to strict governance and controls. The models are developed and maintained by GRM with input from business units to ensure that material risks are captured. Before the models are implemented, they are subject to approval by GRC and subsequently BRC. After implementation, the models are subject to regular performance monitoring to ensure that they continue to perform as expected and the risk parameters remain appropriate.
New models are assessed by a validation team, which is independent from the development team, to ensure robustness of the model development process, completeness of the documentation, and accuracy of the risk estimates. The validation exercise also ensures that the models meet regulatory standards. Existing models are assessed on an annual basis by the validation team to ensure that the models continue to be appropriate and the risk estimates continue to be accurate.
Retail Exposures
Retail exposures are portfolio in large numbers of similarly managed exposures due to homogeneous characteristics. This applies to both exposures to individuals as well as exposures to small businesses which are managed on a pooled basis. The exposure of a single retail facility is typically low and usually referred as program lending.
BASEL II PILLAR 3 DISCLOSURES FOR 2010
25
Retail exposures covered under the A-IRB Approach include credit cards, auto loans, personal financing and residential mortgages. The PDs of these exposures are typically estimated from the outputs of application scorecards for newer customers and behavioural scorecards for older customers. Presently, the models deployed for retail portfolio include application and behavioural scorecards, PD, LGD and EAD segmentation.
Application scorecards are derived using demographic and credit bureau data, where available, of customers at the time of application. Statistical techniques are used to identify and weight risk factors that best explain the historical default or non-default status of customers. The output of the resulting scorecards is scores that reflect the PDs of new applicants.
Behavioural scorecards are derived in a similar way to application scorecards, but using transaction data of approved customers.
PD, LGD and EAD Segmentation models
PD Segmentation Model
• PD is estimated using internal historical data. The underlying historical observation period used at point of implementation is 2 years but this requirement will be increased until the required minimum historical data of 5 years is achieved. Thereafter, PD must be estimated based on minimum historical data of 5 years.
• For the purpose of estimating risk parameters for retail exposures, default event is defined in accordance to the respective portfolios’ default experience.
• The 1-year pool default rate is defined as the number of accounts that default at any time within a 1-year period divided by the number of accounts open at the beginning of the period (observation point) for that particular pool. Only the first of 2 or more defaults occurring within the 12 months observation period will be counted as default. Hence, only one default event will be recorded for PD estimation purposes.
• PD for retail exposures is estimated at the facility level where credit limit is determined. Should multiple accounts are linked to a shared facility limit, aggregated exposures and worst default status across all accounts linked to the said facility must be used to compute the PD.
PD Calibration for Retail Exposure
• PD estimated for each pool must be representative of long term average. In the event the internal historical data is not sufficient to cover an economic cycle, appropriate adjustment (via Cycle Scaling Factor) must be incorporated based on proxy data which are relevant and of longer history to derive the long term average PD, which normally referred to “Central Tendency”.
BASEL II PILLAR 3 DISCLOSURES FOR 2010
26
• The estimation of long term PD or Central Tendency should ideally cover at least one complete economic cycle, which include at least one quarter of negative GDP growth.
• The estimated pool PD will subject to minimum PD ratio of 0.03%.
LGD Segmentation Model
• LGD for retail exposures is estimated based on historical internal data and the following sources of recoveries are incorporated into the estimation:
(i) Regularisation of defaulted accounts. Defaulted accounts can be regularised or cured via restructuring and rescheduling exercise, or when borrower/customer paid up the arrear amount and remain as “non-default” for a pre-defined period.
(ii) Sale proceeds from physical collaterals.
(iii) Cash receipts from borrowers/customers.
EAD Segmentation Model
• EAD for retail exposures is defined as the expected gross exposures of the facility upon default of the facility.
• For the purpose of measuring EAD, both on and off balance sheet are measured gross of impairment allowance or partial write-off. The EAD on drawn amount should not be less than the sum of:
(i) The amount of which a banking institution’s capital would be reduced if the exposure were fully written-off; and
(ii) Any impairment allowance and partial write-offs.
(iii) Estimates of EAD are based on conversion factor applied to the total limit of the facility.
• The EAD estimation approach adopted is based on Cohort Method.
(i) A fixed length cohort, normally one year intervals is defined. Development samples will include all non-defaulted accounts during the cohort.
The following table summarises CIMB Bank’s retail credit exposures measured under A-
IRB Approach as at 31 December 2010:

BASEL II PILLAR 3 DISCLOSURES FOR 2010
27
Table 15: Retail Credit Exposures under the IRB Approach by PD Band for
CIMB Bank
(RM '000)
PD Range of Retail Exposures 0% ≤ PD < 2% 2% ≤ PD < 100% 100% Or Default
Total Retail Exposure (EAD) 35,493,632 12,595,983 2,013,095
Residential Mortgage 21,840,752 3,927,235 1,392,890
QRRE 4,027,893 3,935,671 77,522
Hire Purchase 6,900,583 3,602,799 292,094 Other Retail 2,724,404 1,130,278 250,589
Exposure Weighted LGD %
Residential Mortgage 21% 23% 34%
QRRE 90% 90% 90%
Hire Purchase 56% 58% 59%Other Retail 18% 18% 46%
Exposure Weighted Average Risk
Weight %
Residential Mortgage 29% 83% 31%
QRRE 33% 131% 393%
Hire Purchase 60% 111% 214%Other Retail 19% 32% 234%
The summation method is due to actual summation and rounded up to the nearest thousands.
Table 16: Retail Exposures under the IRB Approach by Expected Loss
Range for CIMB Bank
(RM '000)
EL% Range of Retail Exposure EL ≤ 1% 1% < EL < 100% EL = 100%
Total Retail Exposure (EAD) 36,430,954 13,462,335 209,421
Residential Mortgage 23,586,786 3,395,387 178,705
QRRE 2,807,157 5,233,929 -
Hire Purchase 6,592,149 4,187,437 15,889
Other Retail 3,444,861 645,583 14,827
Exposure Weighted Average LGD
(%)
Residential Mortgage 21% 27% 32%
QRRE 90% 90% -
Hire Purchase 55% 58% 56%
Other Retail 17% 34% 44%
The summation method is due to actual summation and rounded up to the nearest thousands.
BASEL II PILLAR 3 DISCLOSURES FOR 2010
28
Non-retail Exposures
Non-retail exposures covered under the F-IRB Approach include corporates (Specialised Lending uses supervisory slotting criteria), SMEs and banks. The PDs of these exposures are estimated from internal ratings assigned across a spectrum of risk levels on a master scale. Each internal rating has a corresponding 1-year average PD and a likely corresponding regulatory loan/financing classification.
The process by which an internal rating is assigned to an obligor is governed by the Obligor Risk Rating framework. Firstly, a risk model uses a weighted combination of quantitative and qualitative risk factors to generate an initial rating. The quantitative risk factors and weights are derived through statistical techniques and the qualitative risk factors and weights are derived through deliberation with credit experts. The initial rating may subsequently be upgraded or downgraded based on a predefined set of criteria, such as quality of financial statements and support from a parent entity. Finally, an approving authority deliberates before deciding on a final rating. If a facility is guaranteed by one or more corporate guarantors, then the framework recognises the credit risk mitigation by upgrading the final rating accordingly.
For Corporates, SMEs and Banks, the quantitative risk factors and weights are chosen to be those that best explain the historical default or non-default status of clients by means of a logistic function. A client is considered to be in default if it is ever 90 days past due, restructured or rescheduled.
For sovereign exposures with external ratings, the internal rating is taken to correspond to the second best long-term issuer rating published by S&P, Moody's and Fitch or any other rating agencies approved by approving authority based on the Group’s internal rating system.
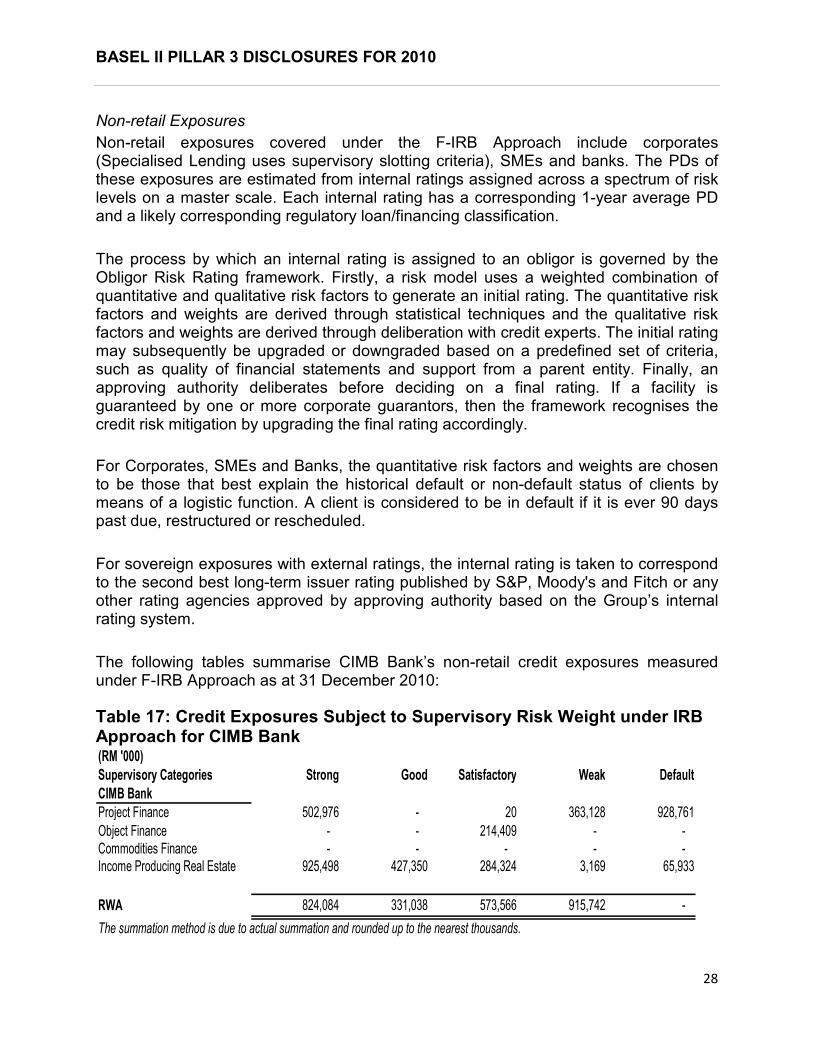
The following tables summarise CIMB Bank’s non-retail credit exposures measured under F-IRB Approach as at 31 December 2010:
Table 17: Credit Exposures Subject to Supervisory Risk Weight under IRB Approach for CIMB Bank (RM '000)
Supervisory Categories Strong Good Satisfactory Weak Default
CIMB Bank
Project Finance 502,976 - 20 363,128 928,761
Object Finance - - 214,409 - -
Commodities Finance - - - - - Income Producing Real Estate 925,498 427,350 284,324 3,169 65,933
RWA 824,084 331,038 573,566 915,742 -
The summation method is due to actual summation and rounded up to the nearest thousands.

BASEL II PILLAR 3 DISCLOSURES FOR 2010
29
CIMB Bank does not have any exposure to High Volatility Commercial Real Estate and
Equities under Simple Risk Weight Approach.
Table 18: Non Retail Exposures under IRB Approach by Risk Grades for
CIMB Bank
Total Non-Retail Exposure (EAD) 44,691,520 18,335,420 4,219,916 3,938,002
Bank 20,210,351 521,837 103,324 61,670
Corporate (excluding Specialised Lending) 24,481,169 17,813,583 4,116,592 3,876,332
Exposure Weighted LGD %
Bank 46% 50% 45% 45%
Corporate (excluding Specialised Lending) 43% 40% 38% 44%
Exposure Weighted Average Risk Weight
%
Bank 20% 97% 247% -
Corporate (excluding Specialised Lending) 26% 84% 186% -
The summation method is due to actual summation and rounded up to the nearest thousands.
BASEL II PILLAR 3 DISCLOSURES FOR 2010
30
CREDIT RISK MITIGATION
The employment of various credit risk mitigation techniques such as appropriate credit structuring, and posting of collateral and/or third party support form an integral part of the credit risk management process. Credit risk mitigants are taken where possible and is considered secondary recourse to the obligor for the credit risk underwritten.
Collaterals/Securities
All extension of credit in so far as deemed prudent, must be appropriately and adequately secured. A credit proposal is considered secured only when the entire proposal is fully covered by approved collateral/securities within their approved margins as set out in the relevant credit policy guides. GRC is empowered to approve any inclusion of new acceptable collaterals.
Recognised collaterals include both financial and physical assets. Financial collaterals consist of mainly cash deposits, shares, unit trusts and debt securities, while physical collateral include land and buildings and vehicles. Guarantors accepted are in line with BNM’s RWCAF guidelines. Eligible credit protection is also used to mitigate credit losses in the event that the obligor/counterparty defaults.
Collateral Valuation and Management
The Group has in place policies which govern the determination of eligibility of various collaterals including credit protection, to be considered for credit risk mitigation which includes the minimum operational requirements that are required for the specific collateral to be considered as effective risk mitigants.
The collateral is valued periodically ranging from daily to annually, depending on the type of collateral. Specifically for real estate properties, a framework for valuation of real estate properties is established to ensure adequate policies and procedures are in place for efficient and proper conduct of valuation of real estate properties and other related activities in relation to the interpretation, monitoring and management of valuation of real estate properties.
Netting
In mitigating the credit risks in swaps and derivative transactions, the Group enters into master agreements that provide for closeout and settlement netting arrangements with counterparties, whenever possible. A master agreement that governs all transactions between two parties, creates the greatest legal certainty that credit exposure will be netted. In effect, it enables the netting of outstanding obligations upon termination of outstanding transactions if an event of default occurs.

BASEL II PILLAR 3 DISCLOSURES FOR 2010
31
Concentrations within risk mitigation
CIMB Group avoids unwanted credit or market risk concentrations by diversifying its portfolios through a number of measures. Amongst others, there are guidelines in place relating to maximum exposure to any counterparty, sectors and country.
The following table summarises the extent of which exposures are covered by eligible credit risk mitigants as at 31 December 2010.
Table 19: Disclosure on Credit Risk Mitigation for CIMB Bank
(RM '000)
Exposure Class
Exposures
before CRM
Exposures
Covered by
Guarantees/
Credit
Exposures
Covered by
Eligible Financial
Collateral
Exposures
Covered by Other
Eligible Collateral
Performing Exposures
Sovereigns/Central Banks 18,619,868 - - -
Public Sector Entities 286 - - - Banks, Development Financial Institutions &
MDBs 20,845,629 - 50 -
Insurance Cos, Securities Firms & Fund
Managers - - - -
Corporate 54,317,149 1,184,031 3,559,022 4,608,213
Residential Mortgages 27,642,480 - 253 -
Qualifying Revolving Retail 7,963,564 - - -
Hire Purchase 10,503,382 - - -
Other Retail 19,937,459 135,091 3,856,169 -
Securisation 770,554 - - -
Higher Risk Assets 1,086,689 - - -
Other Assets 6,164,132 - - -
Defaulted Exposures 2,989,131 52,518 19,756 244,242
Total Exposures 170,840,321 1,371,640 7,435,250 4,852,455
The summation method is due to actual summation and rounded up to the nearest thousands.
The type of collateral recognised in each asset class is in accordance to the approach adopted in
computing the RWA. The CRM shown is computed after taking into account the haircut as prescribed by
the guidelines. For assets under SA, only financial collateral and guarantee are recognised. For assets
under F-IRB Approach, guarantee, financial collateral and other eligible collateral are recognised. For
assets under A-IRB Approach, the collateral has been taken into consideration in the computation of
LGD, hence, excluded from the CRM disclosure.

BASEL II PILLAR 3 DISCLOSURES FOR 2010
32
OFF BALANCE SHEET EXPOSURES AND CCR
CCR limits are established at the individual counterparty level and approved by CRC and/or RCC. These limits are monitored and reported at both business and at the Group level.
Credit Risk Mitigation
For credit derivatives and swaps transactions, CIMB Bank enters into master agreement with counterparties, whenever possible. Further, CIMB Bank may also enter into CSA
with counterparties. The net credit exposure with each counterparty is monitored and our Group may request for additional margin for any exposures above the agreed threshold, in accordance with the terms specified in the relevant CSA or the master agreement. The eligibility of collaterals and frequency calls are negotiated with the counterparty and endorsed by CRC and/or RCC.
Treatment of Rating Downgrade
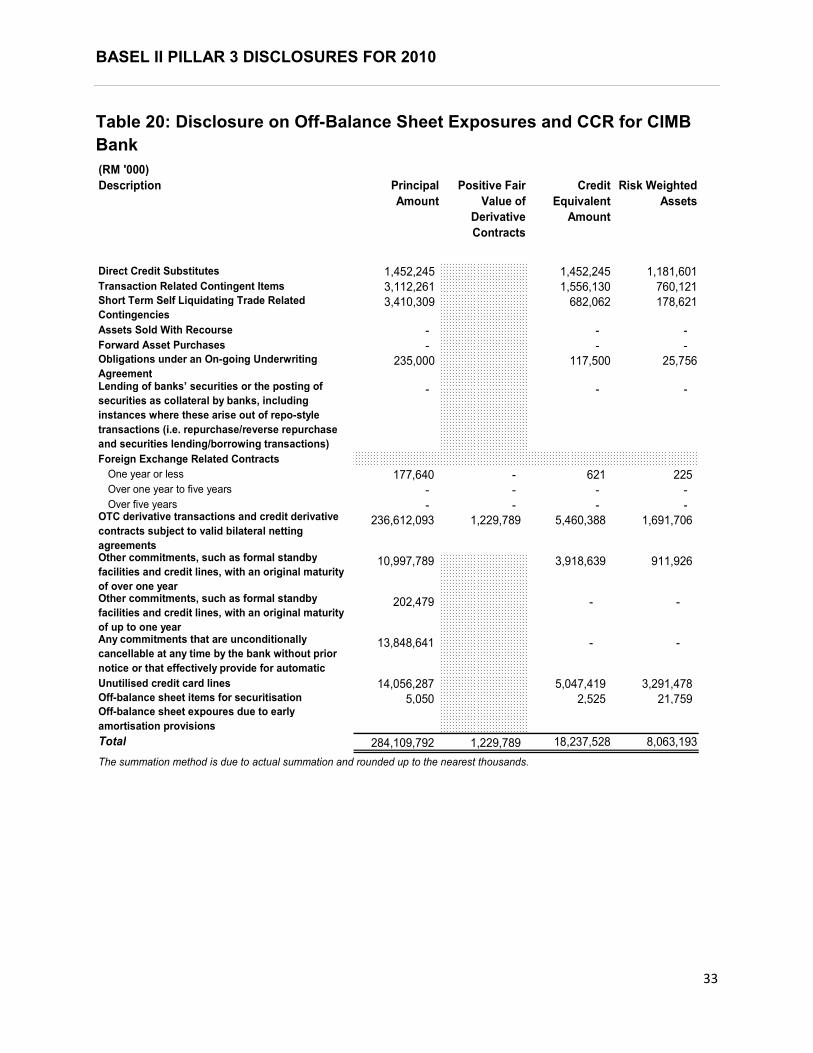
Based on the terms of the existing CSA and our exposure as at 31 December 2010, there will be no requirement for additional collateral to be posted in the event of a one-notch downgrade of rating. On the other hand, counterparty rating is being monitored and in the event of a rating downgrade, remedial actions such as revision of the counterparty credit limit, suspension of the limit or the request for additional collateral may be taken. The following table discloses the Off-Balance Sheet exposures and CCR as at 31 December 2010:
BASEL II PILLAR 3 DISCLOSURES FOR 2010
33
Table 20: Disclosure on Off-Balance Sheet Exposures and CCR for CIMB
Bank
(RM '000)
Description Principal
Amount
Positive Fair
Value of
Derivative
Contracts
Credit
Equivalent
Amount
Risk Weighted
Assets
Direct Credit Substitutes 1,452,245 1,452,245 1,181,601 Transaction Related Contingent Items 3,112,261 1,556,130 760,121 Short Term Self Liquidating Trade Related
Contingencies 3,410,309 682,062 178,621
Assets Sold With Recourse - - - Forward Asset Purchases - - - Obligations under an On-going Underwriting
Agreement 235,000 117,500 25,756
Lending of banks’ securities or the posting of
securities as collateral by banks, including
instances where these arise out of repo-style
transactions (i.e. repurchase/reverse repurchase
and securities lending/borrowing transactions)
- - -
Foreign Exchange Related Contracts
One year or less 177,640 - 621 225 Over one year to five years - - - - Over five years - - - -
OTC derivative transactions and credit derivative
contracts subject to valid bilateral netting
agreements
236,612,093 1,229,789 5,460,388 1,691,706
Other commitments, such as formal standby
facilities and credit lines, with an original maturity
of over one year
10,997,789 3,918,639 911,926
Other commitments, such as formal standby
facilities and credit lines, with an original maturity
of up to one year
202,479 - -
Any commitments that are unconditionally
cancellable at any time by the bank without prior
notice or that effectively provide for automatic
13,848,641 - -
Unutilised credit card lines 14,056,287 5,047,419 3,291,478 Off-balance sheet items for securitisation 5,050 2,525 21,759 Off-balance sheet expoures due to early
amortisation provisions
Total 284,109,792 1,229,789 18,237,528 8,063,193
The summation method is due to actual summation and rounded up to the nearest thousands.
BASEL II PILLAR 3 DISCLOSURES FOR 2010
34
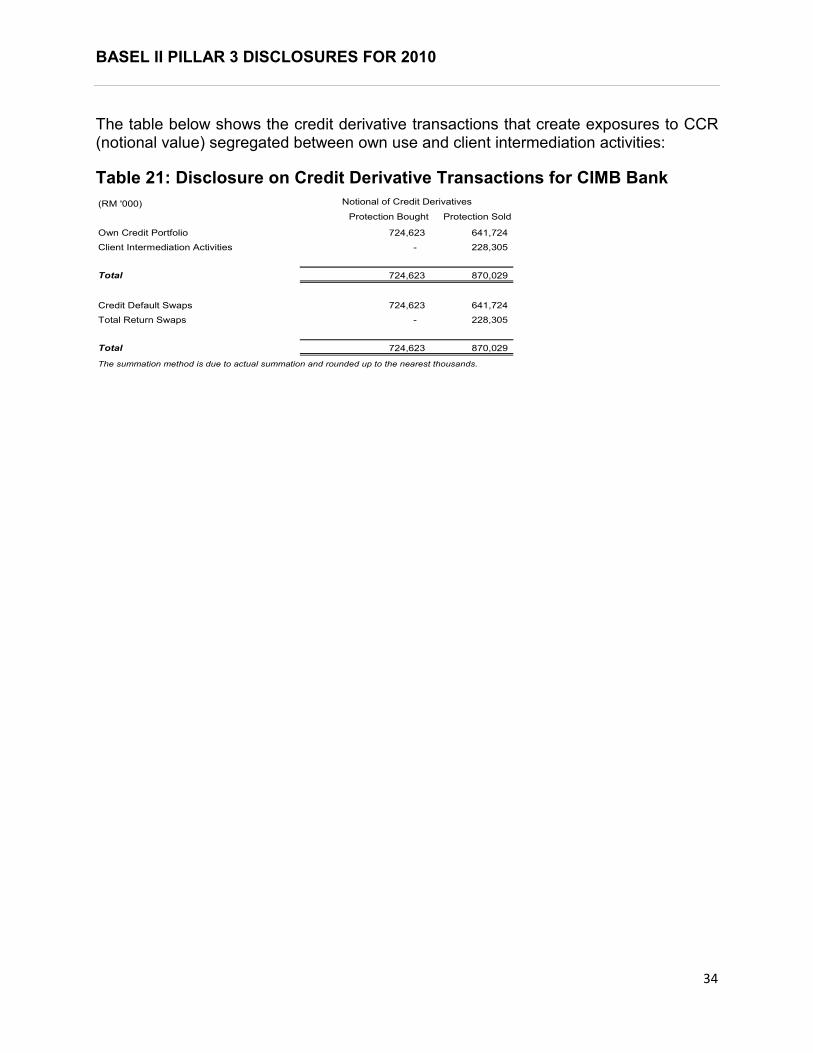
The table below shows the credit derivative transactions that create exposures to CCR (notional value) segregated between own use and client intermediation activities:
Table 21: Disclosure on Credit Derivative Transactions for CIMB Bank
(RM '000)
Protection Bought Protection Sold
Own Credit Portfolio 724,623 641,724
Client Intermediation Activities - 228,305
Total 724,623 870,029
Credit Default Swaps 724,623 641,724
Total Return Swaps - 228,305
Total 724,623 870,029
The summation method is due to actual summation and rounded up to the nearest thousands.
Notional of Credit Derivatives
BASEL II PILLAR 3 DISCLOSURES FOR 2010
35
SECURITISATION
The Role CIMB Plays In The Securitisation Process
In the course of its business, CIMB Group has undertaken securitisations of its own originated assets, as well as securitisations of third party assets as part of its debt capital markets services for external clients.
The Group securitises its own assets in order to manage credit risk and its capital position and to generate term funding for the Group balance sheet.
CIMB Group adopts the following roles in the securitisation activities in which it is involved:
• Originator and servicer of securitised assets
• Executor of securitisation trades including bond marketing and syndication
• Provider of liquidity facilities to self-originated and third-party transactions
• Purchaser of third-party securitisations (where CIMB is not originator or sponsor)
As at 31 December 2010, CIMB Bank has securitised corporate bonds and auto hire purchase receivables for its own account, and auto hire purchase receivables originated by a joint-venture company, in funded traditional securitisations. CIMB Group does not maintain or act as sponsor of any conduit for the securitisation of third-party receivables. CIMB advises, arranges and executes securitisations for third-party clients through special purpose vehicles sponsored by each such client.
CIMB’s Involvement in Securitisation in 2010
In 2010, CIMB Bank arranged and managed two securitisation issuances via Premium Commerce Berhad, a bankruptcy-remote special purpose vehicle established in 2005 pursuant to a securitisation programme arranged for the Tan Chong Group.
CIMBBG did not sell any assets pursuant to any securitisation in 2010. In 2007, PCSB (a 50% equity interest joint venture between CIMB Bank and Proton Edar Sdn Bhd) securitised RM500 million of auto hire purchase receivables through Class Auto Receivables Berhad, a special purpose vehicle established for the securitisation.
Every transaction involving securitisation of CIMB Bank’s asset is tabled to the Board of Directors of CIMB Bank for deliberation and approval. Todate, CIMB Bank has not used credit risk mitigation to mitigate the risk retained from any securitisation of its own assets.
BASEL II PILLAR 3 DISCLOSURES FOR 2010
36
In securitised its own assets, CIMB Bank continues to administer the assets as servicer for the relevant special purpose vehicle and monitors the credit and market risk inherent in the underlying assets using the same mechanism in place for non-securitised assets.
Summary of Accounting Policies for Securitisation Activities
CIMB has sponsored special purpose vehicles (SPVs) pursuant to securitisation activities involving assets of the Group. Such SPVs are consolidated when the substance of the relationship between the Group and that entity indicates control. Potential indicators of control include, inter alia, an assessment of the Group’s exposure to the risks and rewards of the assets of the SPV.
Assets that have been transferred wholly or proportionately to an unconsolidated entity will also remain on the Group balance sheet, with a liability recognised for the proceeds received, unless (a) substantially all risks and rewards associated with the assets have been transferred, in which case, they are derecognised in full; or (b) if a significant portion, but not all, of the risks and rewards have been transferred, the asset is derecognised entirely if the transferee has the ability to sell the financial asset, otherwise the asset continues to be recognised to the extent of the Group’s continuing involvement.
Other than (a) or (b) above, securitisations are treated as financing in the separate financial statements of these entities.
As of 1 January 2010, hire-purchase receivables belonging to PCSB were de-recognised from CIMB Bank’s loans, advances and financing as the risks and rewards relating to the cash flows of these hire purchase receivables have been substantially transferred to PCSB with the adoption of FRS139 Financial Instruments: Recognition and Measurement.
ECAIs Used For Securitisation Process
CIMB may employ external credit assessment institutions to provide ratings for its asset backed securities. CIMB has used RAM and MARC for securitisations of its own originated assets as well as securitisations for third-party clients. For securitisations of CIMB-originated assets, RAM has rated a securitisation of corporate bonds, and MARC has rated a securitisation of auto-hire purchase receivables. Both RAM Ratings and MARC have rated a securitisation programme for a joint-venture of auto-hire purchase receivables.

BASEL II PILLAR 3 DISCLOSURES FOR 2010
37
Table 22: Disclosure on Securitisation for Trading and Banking Book
(RM'000)
Underlying Asset
Total
Exposures
Securitised
Past Due Impaired
Gains / Losses
Recognised
during the
period
TRADITIONAL SECURITISATION (Banking Book)
Originated by the Banking Institution
Hire Purchase Exposure 225,840 44,801 7,413 168
CIMB Bank
BASEL II PILLAR 3 DISCLOSURES FOR 2010
38
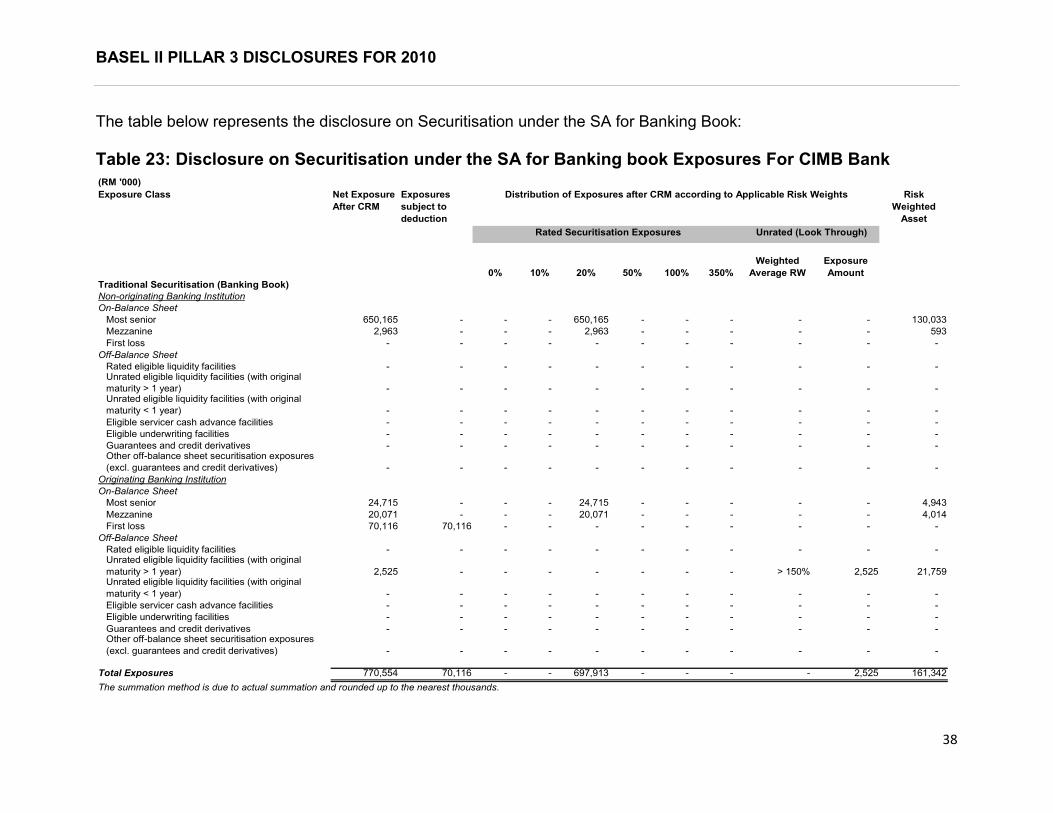
The table below represents the disclosure on Securitisation under the SA for Banking Book:
Table 23: Disclosure on Securitisation under the SA for Banking book Exposures For CIMB Bank
(RM '000)
Exposure Class Net Exposure
After CRM
Exposures
subject to
deduction
0% 10% 20% 50% 100% 350%
Weighted
Average RW
Exposure
Amount
Traditional Securitisation (Banking Book)
Non-originating Banking Institution
On-Balance Sheet
Most senior 650,165 - - - 650,165 - - - - - 130,033
Mezzanine 2,963 - - - 2,963 - - - - - 593
First loss - - - - - - - - - - -
Off-Balance Sheet
Rated eligible liquidity facilities - - - - - - - - - - - Unrated eligible liquidity facilities (with original
maturity > 1 year) - - - - - - - - - - - Unrated eligible liquidity facilities (with original
maturity < 1 year) - - - - - - - - - - -
Eligible servicer cash advance facilities - - - - - - - - - - -
Eligible underwriting facilities - - - - - - - - - - -
Guarantees and credit derivatives - - - - - - - - - - - Other off-balance sheet securitisation exposures
(excl. guarantees and credit derivatives) - - - - - - - - - - -
Originating Banking Institution
On-Balance Sheet
Most senior 24,715 - - - 24,715 - - - - - 4,943
Mezzanine 20,071 - - - 20,071 - - - - - 4,014
First loss 70,116 70,116 - - - - - - - - -
Off-Balance Sheet
Rated eligible liquidity facilities - - - - - - - - - - - Unrated eligible liquidity facilities (with original
maturity > 1 year) 2,525 - - - - - - - > 150% 2,525 21,759 Unrated eligible liquidity facilities (with original
maturity < 1 year) - - - - - - - - - - -
Eligible servicer cash advance facilities - - - - - - - - - - -
Eligible underwriting facilities - - - - - - - - - - -
Guarantees and credit derivatives - - - - - - - - - - - Other off-balance sheet securitisation exposures
(excl. guarantees and credit derivatives) - - - - - - - - - - -
Total Exposures 770,554 70,116 - - 697,913 - - - - 2,525 161,342
The summation method is due to actual summation and rounded up to the nearest thousands.
Distribution of Exposures after CRM according to Applicable Risk Weights Risk
Weighted
Asset
Rated Securitisation Exposures Unrated (Look Through)
BASEL II PILLAR 3 DISCLOSURES FOR 2010
39
MARKET RISK - SA
Market risk is defined as the potential change in market value of trading and investment securities held by the Group arising from adverse changes to market parameters such as interest rates, credit spreads, foreign exchange rates, equity prices, commodity prices and volatility.
Market Risk Management
The function of RMA Team in CIMB is to measure and control market risk of the Group through robust measurement and the setting of limits while facilitating business growth within a controlled and transparent risk management framework. Here, the CaR framework is employed to measure market risk where CaR represents the worst expected loss in portfolio value under normal market conditions over a specific time interval at a given confidence level. The Group has adopted a historical simulation approach to compute CaR. This approach assesses potential loss in portfolio value based on the last 500 daily historical movements of relevant market parameters and 99% confidence level at 1-day holding period.
Broadly, the Group is exposed to four major types of market risk namely equity risk, interest rate risk, foreign exchange risk and commodity risk. Each business unit is allocated CaR limits for each type of market risk undertaken for effective risk monitoring and control. These limits are approved by the GRC and utilisation of limits is monitored on a daily basis. Daily risk reports are sent to the relevant traders, Group Treasury’s Market Risk Team and RMO within GRM. The head of each business unit is accountable for all market risk under his/her purview. Any excession will be escalated to management in accordance to the Group's exception management procedures.
In addition to daily monitoring of CaR usage, on a monthly basis, all market exposures and CaR of the Group will be summarised and submitted to GRC and BRC for its perusal.
Although historical simulation provides a reasonable estimate of market risk, this approach relies heavily on historical daily price movements of the market parameter of interest. Hence, the resulting market CaR is exposed to the danger that price and rate changes over the stipulated time horizon might not be typical. Example, if the past 500 daily price movements were observed over a period of exceptionally low volatility, then the CaR computed would understate the risk of the portfolio and vice versa.
In order to ensure historical simulation gives an adequate estimation of market CaR, backtesting of the historical simulation approach is performed annually. Backtesting involves comparing the derived 1-day CaR against the hypothetical change in portfolio value assuming end-of-day positions in the portfolio were to remain unchanged. The

BASEL II PILLAR 3 DISCLOSURES FOR 2010
40
number of exceptions would be the number of times the difference in hypothetical value exceeds the computed 1-day CaR.
The Group also complements CaR with stress testing exercises to capture event risk that are not observed in the historical time period selected to compute CaR. Stress testing exercise at the group-wide level involves assessing potential losses to the Group’s market risk exposures under pre-specified scenarios. This type of scenario analysis is performed twice yearly. Scenarios are designed in collaboration with the Regional Research Team to reflect extreme and yet highly plausible stress scenarios. Stress test results are presented to the GRC to provide senior management with an overview of the impact to the Group if such stress scenarios were to materialise.
In addition to the above, RMO under GRM undertakes the monitoring and oversight process at Group Treasury and Equity Market & Derivatives trading floors, which include reviewing treasury trading strategy, analysing positions and activities vis-à-vis changes in the financial markets, monitoring limits usage, assessing limits adequacy and verifying transaction prices.
RMO also provides accurate and timely valuation of the Group’s position on a daily basis. Exposures are valued using market price (Mark-to-Market) or a pricing model (Mark-to-Model) (collectively known as ‘MTM’) where appropriate. The MTM process is carried out on all positions classified as Held for Trading as well as Available for Sale on a daily basis for the purpose of meeting independent price verification requirements, calculation of profits/losses as well as to confirm that margins required are met.
Treasury products approval processes will be led by RMO to ensure the bank is operational ready before launching. All new products are assessed by components and in totality to ensure financial risks are accurately identified, monitored and effectively managed.
All valuation methods and models used are validated by the Quantitative Analysts to assess its applicability to market conditions. The process includes verification of the inputs, assumptions used, programming codes and model reporting capability. Existing valuation models are reviewed at least on a yearly basis to ensure that they remain relevant to changing market conditions. Back-test of newly approved or revised models may be conducted to review the model and input data used.

BASEL II PILLAR 3 DISCLOSURES FOR 2010
41
Capital Treatment for Market Risk
At present, CIMB Bank adopts the Standardised Approach to compute market risk capital requirement under BNM’s guidelines on RWCAF - Risk-Weighted Assets Computation.
Details on RWA and capital requirements related to Market Risk are disclosed separately for CIMB Bank for the following in Table 2:
• Interest Rate Risk
• Foreign Currency Risk
• Equity Risk
• Commodity Risk
• Options Risk

BASEL II PILLAR 3 DISCLOSURES FOR 2010
42
OPERATIONAL RISK
Operational risk is the risk of loss resulting from inadequate or failed internal processes, people or systems, or from external events.
Operational Risk Management
CIMB Group recognises that the key determinant for a well managed universal banking operation is to cultivate an organisational wide discipline and risk management culture among its staff.
Operational risks arise from inadequate or failed internal processes, people and systems or from external events. These risks are managed by CIMB Group through the following key measures:
(i) Sound risk management practices in accordance with Basel II and regulatory guidelines;
(ii) Board and senior management oversight;
(iii) Well-defined responsibilities for all personnel concerned; and
(iv) Establishment of a risk management culture.
It encompasses legal risk that also carries a Shariah component but excludes strategic or reputational risks.
In pursuit of managing and controlling operational risk, the Group adopts the ORMF that have as its objectives the following:
(i) Provide guidance to the management teams towards establishing a common platform and consistent approach to ORM across the Group;
(ii) Ensure readiness and compliance to BNM as the home supervisor and other regulators’ requirements, including preparation towards the Basel II implementation; and
(iii) Assist in the integration of risk factors by providing a singular view of operational risk across the Group’s business/support units/entities for effective and efficient ORM.
The ORMF is premised on a set of pillars of Operational Risk Standards and employs various tools including control self-assessment, risk event management, key risk indicator monitoring and process risk mapping as measures of supervision.
A key structure of the ORMF is the Corporate Governance that is founded on the 3 Lines of Defense approach which underlines the participation of members of the Board of Directors; Senior Management and supported by every employee of the Group as the first line of defense.

BASEL II PILLAR 3 DISCLOSURES FOR 2010
43
The philosophy of the governance structure in the ORMF recognises the following:
(i) Ownership of the risk by the business/support areas (line management);
(ii) Oversight by independent risk management; and
(iii) Independent review by Internal Audit.
Consequently, the Group has strengthened its infrastructure and has applied several
techniques for the administration of its operational risks together with the use of rating
matrixes. These tools are constantly used to aid self assessments, controls and
monitoring. Moreover, in line with best practices, incidents on loss events are tracked
and captured for analytical risk profiling and to further enhance controls.
Escalation and reporting processes are well instituted through various management committees notably the ORC and GRC as well as the Board. The responsibilities of the committees and the Board include the following:
(i) Oversight and implementation of the ORMF;
(ii) Establish risk appetite and provide strategic and specific directions;
(iii) Review operational risks reports and profiles regularly;
(iv) Address operational risk issues; and
(v) Ensure compliance to regulatory and internal requirements including disclosures.
Group Internal Audit plays its role in ensuring an independent assurance of the
implementation of the ‘Framework’ through their conduct of regular reviews and report
to the Board.
Capital Treatment for Operational Risk
CIMB Bank adopts the Basic Indicator Approach to compute operational risk capital
requirement under BNM’s guidelines on RWCAF - Risk-Weighted Assets Computation.
Details on RWA and capital requirements related to Operational Risk are disclosed for
CIMB Bank in Table 2.
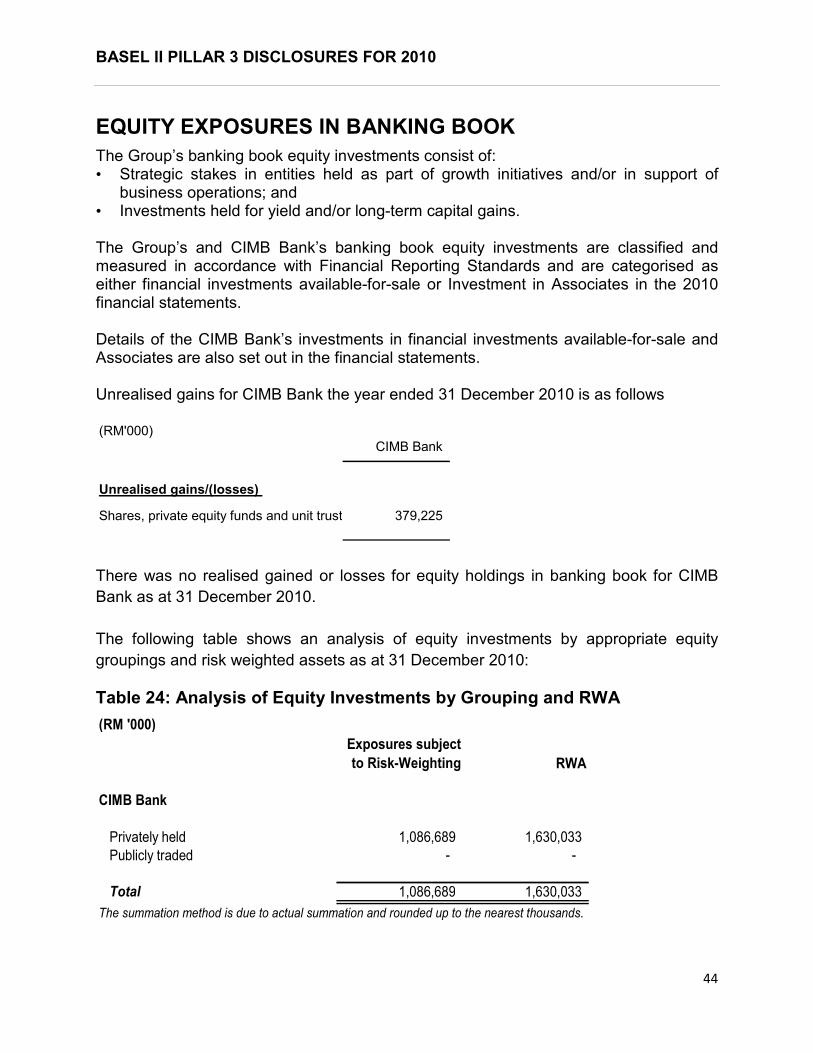
BASEL II PILLAR 3 DISCLOSURES FOR 2010
44
EQUITY EXPOSURES IN BANKING BOOK
The Group’s banking book equity investments consist of: • Strategic stakes in entities held as part of growth initiatives and/or in support of business operations; and
• Investments held for yield and/or long-term capital gains. The Group’s and CIMB Bank’s banking book equity investments are classified and measured in accordance with Financial Reporting Standards and are categorised as either financial investments available-for-sale or Investment in Associates in the 2010 financial statements. Details of the CIMB Bank’s investments in financial investments available-for-sale and Associates are also set out in the financial statements. Unrealised gains for CIMB Bank the year ended 31 December 2010 is as follows (RM'000)
CIMB Bank
Unrealised gains/(losses)
Shares, private equity funds and unit trusts 379,225
There was no realised gained or losses for equity holdings in banking book for CIMB
Bank as at 31 December 2010.
The following table shows an analysis of equity investments by appropriate equity
groupings and risk weighted assets as at 31 December 2010:
Table 24: Analysis of Equity Investments by Grouping and RWA
(RM '000)
Exposures subject
to Risk-Weighting RWA
CIMB Bank
Privately held 1,086,689 1,630,033
Publicly traded - -
Total 1,086,689 1,630,033
The summation method is due to actual summation and rounded up to the nearest thousands.
BASEL II PILLAR 3 DISCLOSURES FOR 2010
45
INTEREST RATE RISK IN THE BANKING BOOK (IRRBB)
Background
Interest Rate Risk is defined as the current and potential risk to the Group’s earnings and economic value arising from the adverse movements in interest rate. In the context of Pillar 2, this risk is confined to the Banking Book, given that the interest rate risk in the trading book is covered under the Pillar 1 market risk regulations. The principal sources of IRRBB are:
• Repricing risk: arises from the timing differences in the maturity and repricing of the Bank’s assets, liabilities and off-balance sheet positions.
• Yield curve risk: arises from the changes in the slope and the shape of the yield curve.
• Basis risk: arises from imperfect correlation in the adjustment of the rates earned and paid on different instruments with otherwise similar repricing characteristics.
• Optionality: arises from the rate of return related options embedded in banking book products.
IRRBB Framework
The Group’s objective is to manage interest rate risk within its risk appetite. The risk appetite is established by the BRC on behalf of the Board. BRC delegates the authority to GRC, which comprises senior management of CIMB Group and is supported by GRM, to oversee the asset liability management process including the management of IRRBB for the Group. The BSMC, which is chaired by the Group Chief Executive and comprises senior management of CIMB, is responsible for the review of the balance sheet and recommends strategies, including hedging activities to manage the overall interest rate risk. Group Treasury is responsible to execute the hedging strategies.
The framework is subject to a regular review by the Group.
Measurement of IRRBB
The movement of interest rate affects CIMB Bank’s reported earnings and its underlying economic value by changing the net interest income and market value of the bank’s balance sheet positions. Therefore, the management of IRRBB within CIMB Bank is from the:
• Earnings perspective: The Earnings perspective considers how interest rate changes affect CIMB Bank’s net interest income. It focuses on risk to net interest income in the near term. CIMB Bank adopts the EaR methodology for this purpose. EaR measures the impact of the changes in interest rate to CIMB Bank’s net interest income in the next 12 months. Repricing gap table forms the foundation for this

BASEL II PILLAR 3 DISCLOSURES FOR 2010
46
measure, where rate sensitive positions are slotted in the table according to their contractual repricing profile or remaining maturity, whichever is earlier. Sensitivity analysis is subsequently derived and the impact under various rate scenarios is measured. For the purpose of this disclosure, the impact under an instantaneous 100 bps parallel interest rate shock is applied. The treatments and assumptions applied are based on the contractual repricing maturity and remaining maturity of the products, whichever is earlier. Items with indefinite repricing maturity are treated based on the earliest possible repricing date. The actual dates may vary from the repricing profile allocated due to factors such as pre-mature withdrawals, prepayment and so forth.
Table 25 below illustrates CIMB Bank’s IRRBB under a 100 bps parallel upward interest rate shock from the earnings perspective.
Table 25: IRRBB as at 31 December 2010 for CIMB Bank – Impact on
Earnings
Currency +100bps
Increase (Decline) in Earnings
(RM ‘000, Value in RM Equivalent)
Ringgit Malaysia 18,522
US Dollar (66,979)
Singapore Dollar (38,462)
Others (1,269)
Total (88,188)
The summation method is due to actual summation and rounded up to the nearest thousands.
The sign reflects the nature of the rate sensitivity, with a negative number indicating exposure to increase in interest rates and vice versa.
• Economic value perspective:
The economic value perspective provides a measure of the underlying value of CIMB Bank’s current positions and evaluates the sensitivity of that value to changes in interest rate. It is a long term measure i.e. focuses on how the economic value of the assets, liabilities, and off balance sheet’s rate sensitive instruments change with movements in interest rate. CIMB Bank assesses the changes in the economic
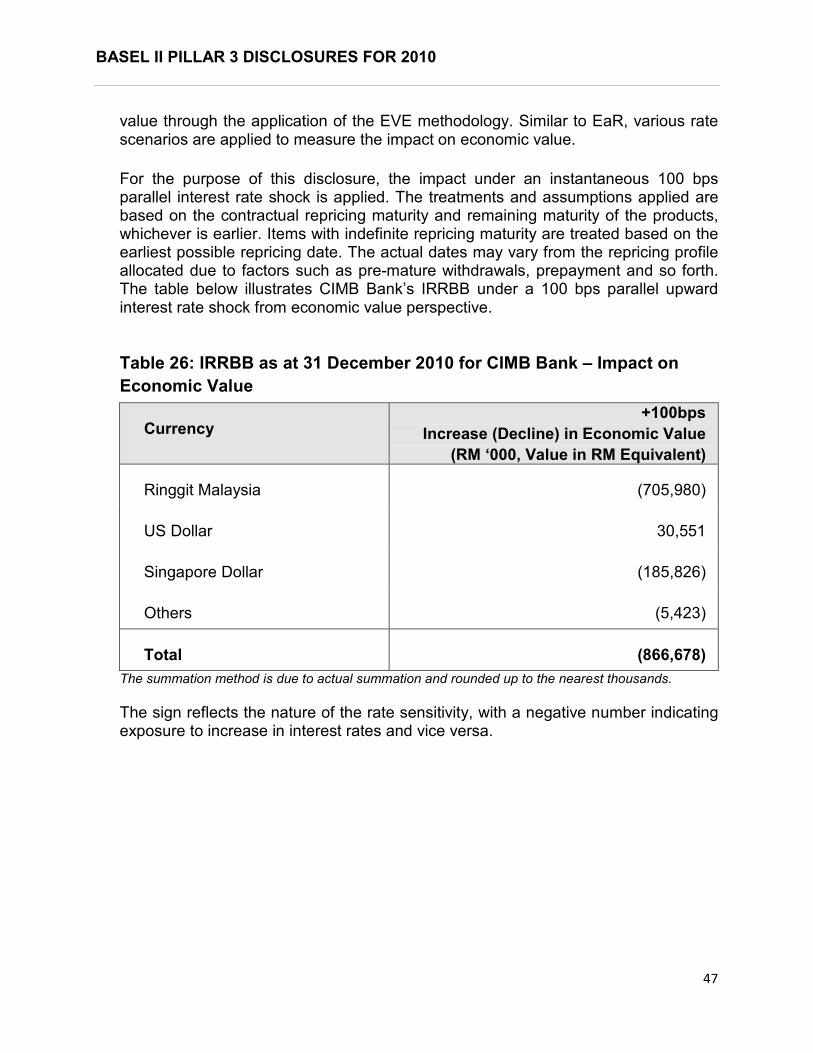
BASEL II PILLAR 3 DISCLOSURES FOR 2010
47
value through the application of the EVE methodology. Similar to EaR, various rate scenarios are applied to measure the impact on economic value.
For the purpose of this disclosure, the impact under an instantaneous 100 bps parallel interest rate shock is applied. The treatments and assumptions applied are based on the contractual repricing maturity and remaining maturity of the products, whichever is earlier. Items with indefinite repricing maturity are treated based on the earliest possible repricing date. The actual dates may vary from the repricing profile allocated due to factors such as pre-mature withdrawals, prepayment and so forth. The table below illustrates CIMB Bank’s IRRBB under a 100 bps parallel upward interest rate shock from economic value perspective.
Table 26: IRRBB as at 31 December 2010 for CIMB Bank – Impact on
Economic Value
Currency +100bps
Increase (Decline) in Economic Value
(RM ‘000, Value in RM Equivalent)
Ringgit Malaysia (705,980)
US Dollar 30,551
Singapore Dollar (185,826)
Others (5,423)
Total (866,678)
The summation method is due to actual summation and rounded up to the nearest thousands.
The sign reflects the nature of the rate sensitivity, with a negative number indicating exposure to increase in interest rates and vice versa.