baseline groundwater chemistry: the magnesian limestone of
TRANSCRIPT

Baseline groundwater chemistry: the Magnesian Limestone of County Durham and north Yorkshire
Groundwater Programme
Open Report OR/09/030


BRITISH GEOLOGICAL SURVEY
GROUNDWATER PROGRAMME
OPEN REPORT OR/09/030
Baseline groundwater chemistry: the Magnesian Limestone of County Durham and north Yorkshire
J Bearcock and P L Smedley
The National Grid and other Ordnance Survey data are used with the permission of the Controller of Her Majesty’s Stationery Office. Licence No:100017897/2009.
Keywords
Water quality, aquifer, geochemistry, pollution
Front cover
Magnesian Limestone outcrop at East Thickley Quarry [NZ 2407 2565]. Bedded dolomite and dolomitic limestone of Raisby Formation with Marl Slate at base, on Basal Permian Sandstone and breccia, unconformably overlying Lower Coal Measures sandstones (Photgraph: P Joyce)
Bibliographical reference
BEARCOCK, J. AND SMEDLEY, P.L. 2009. Baseline groundwater chemistry: the Magnesian Limestone of County Durham and north Yorkshire. British
Geological Survey Open Report, OR/09/030. 63 pp.
Copyright in materials derived from the British Geological Survey’s work is owned by the Natural Environment Research Council (NERC). You may not copy or adapt this publication without first obtaining permission. Contact the BGS Intellectual Property Rights Section, British Geological Survey, Keyworth,
e-mail [email protected]. You may quote extracts of a reasonable length without prior permission, provided a full acknowledgement is given of the source of the extract.
Maps in this report use topography based on Ordnance Survey mapping, with geological linework © NERC.
© NERC 2009. All rights reserved
Keyworth, Nottingham British Geological Survey 2009

The full range of our publications is available from BGS shops at Nottingham, Edinburgh, London and Cardiff (Welsh publications only) see contact details below or shop online at www.geologyshop.com
The London Information Office also maintains a reference collection of BGS publications including maps for consultation.
The Survey publishes an annual catalogue of its maps and other publications; this catalogue is available from any of the BGS Sales Desks.
The British Geological Survey carries out the geological survey of
Great Britain and Northern Ireland (the latter as an agency
service for the government of Northern Ireland), and of the
surrounding continental shelf, as well as its basic research
projects. It also undertakes programmes of British technical aid in
geology in developing countries as arranged by the Department
for International Development and other agencies.
The British Geological Survey is a component body of the Natural
Environment Research Council.
British Geological Survey offices
BGS Central Enquiries Desk
� 0115 936 3143 Fax 0115 936 3276 email [email protected]
Kingsley Dunham Centre, Keyworth, Nottingham NG12 5GG
� 0115 936 3241 Fax 0115 936 3488 email [email protected]
Murchison House, West Mains Road, Edinburgh EH9 3LA
� 0131 667 1000 Fax 0131 668 2683 email [email protected]
London Information Office at the Natural History Museum
(Earth Galleries), Exhibition Road, South Kensington, London
SW7 2DE
� 020 7589 4090 Fax 020 7584 8270 � 020 7942 5344/45 email [email protected]
Columbus House, Greenmeadow Springs, Tongwynlais,
Cardiff CF15 7NE
� 029 2052 1962 Fax 029 2052 1963
Forde House, Park Five Business Centre, Harrier Way,
Sowton EX2 7HU
� 01392 445271 Fax 01392 445371
Maclean Building, Crowmarsh Gifford, Wallingford
OX10 8BB
� 01491 838800 Fax 01491 692345
Geological Survey of Northern Ireland, Colby House,
Stranmillis Court, Belfast BT9 5BF
� 028 9038 8462 Fax 028 9038 8461 www.bgs.ac.uk/gsni/
Parent Body
Natural Environment Research Council, Polaris House,
North Star Avenue, Swindon SN2 1EU
� 01793 411500 Fax 01793 411501 www.nerc.ac.uk
Website www.bgs.ac.uk Shop online at www.geologyshop.com
BRITISH GEOLOGICAL SURVEY

i
Foreword
Although groundwater has long been seen as a relatively pure natural resource stored in subsurface aquifers, its quality is under an ever-increasing threat from human influences. Changes in chemical quality occur through direct inputs of anthropogenic substances, through groundwater abstraction and resultant change in groundwater flow regimes and through artificial recharge. Groundwater is an important resource for drinking, agricultural, industrial and domestic supply. About 35 per cent of public water supply in England and Wales and more than 70% in south and east England is provided by groundwater resources. Groundwater flows and seepages are also vital for maintaining summer flows in rivers, streams and wetland habitats, some of which rely solely on groundwater. Monitoring, management and protection of groundwater quantity and quality are therefore important economic and environmental priorities.
Characterisation and monitoring of groundwater chemistry is a critical component of management and protection. This provides the basis for defining the suitability of groundwater for its intended purpose, identifying pollution inputs and assessing any temporal change. The main European driver for the characterisation and monitoring of groundwater quality is European Union legislation in the form of the Water Framework Directive, Groundwater Directive, EC drinking-water regulations and environmental-quality standards. A key starting point for aquifer protection is defining the natural or ‘baseline’ chemistry of the groundwater body concerned. This sets the framework against which anthropogenic impacts and trends can be measured.
The concept of ‘baseline’ in the context of groundwater quality is difficult to define in detail and opinions differ on the meaning and application of the term. The presence of purely anthropogenic substances such as pesticides or CFCs indicates a departure from the natural condition, but for many solutes which can be derived either from pollution or natural sources, for example nitrate, phosphorus or arsenic, the distinction is less clear-cut. In addition, specific chemical constituents in a given groundwater body may be identified as pollutants while other component solutes may be entirely naturally-derived. For the purposes of this study, baseline is defined as:
“the range in concentration (within a specified system) of an element, species or
chemical substance present in solution which is derived by natural processes from
natural geological, biological, or atmospheric sources”.
The baseline chemistry of groundwater varies widely as a function of the many complex geological, geochemical, hydrogeological and climatic factors. These give rise to large spatial and temporal variations in chemical quality, at a range of scales. Hence, the baseline for a given element or compound will vary significantly both between and within aquifers. It is, therefore, scale-dependent and should be considered as a range rather than a single value.
Attempting to define the natural baseline chemistry of groundwater from a number of defined aquifers or aquifer regions in England and Wales has been the objective of the project ‘Baseline’. The project involves the characterisation of spatial and temporal variations in groundwater chemistry and interpretation of the dominant controlling processes within a given area, aquifer or aquifer block. For each study area, this has been achieved through collation of existing reliable groundwater, rainfall, land-use and host-aquifer mineralogical and geochemical data, as well as new strategic sampling of typically 25–30 groundwater sources for a comprehensive suite of inorganic constituents. Selected analysis of stable-isotopic compositions (e.g. O, H, C) and atmospheric tracers (CFCs, SF6) has also been undertaken where appropriate. Statistical methods, including statistical summaries (medians, arithmetic means, percentiles), together with box plots and cumulative-probability diagrams, provide some of the most valuable analytical tools for the assessment of chemical data and

ii
have been used in the Baseline report series. The Baseline reports provide a summary of the inorganic chemical status of groundwaters in a given study area and key pressures on water quality which should provide useful background information of value to water regulators and managers, environmental scientists and water users.
The current series of Baseline reports has been produced by the British Geological Survey with funding from the Natural Environment Research Council. This follows on from a previous series which was produced in collaboration with, and with co-funding from, the Environment Agency.
Previous published reports in the Baseline Series (British Geological Survey –
Environment Agency):
1. The Triassic Sandstone of the Vale of York 2. The Permo-Triassic Sandstones of West Cheshire and the Wirral 3. The Permo-Triassic Sandstones of South Staffordshire and North Worcestershire 4. The Chalk of Dorset 5. The Chalk of the North Downs 6. The Chalk of the Colne and Lee River Catchments 7. The Great and Inferior Oolite of the Cotswolds District 8. The Permo-Triassic Sandstones of Manchester and East Cheshire 9. The Lower Greensand of southern England 10. The Chalk of Yorkshire and North Humberside 11. The Bridport Sands of Dorset and Somerset 12. The Devonian aquifer of South Wales and Herefordshire 13. The Great Ouse Chalk aquifer 14. The Corallian of Oxfordshire and Wiltshire 15. The Palaeogene of the Wessex Basin 16. The Granites of South-West England 17. The Ordovician and Silurian meta-sedimentary aquifers of central and south-west Wales 18. The Millstone Grit of Northern England 19. The Permo-Triassic Sandstones of Liverpool and Rufford 20. The Permo-Triassic Sandstone aquifer of Shropshire 21. The Chalk and Crag of North Norfolk and the Waveney Catchment 22. The Carboniferous Limestone of Northern England 23. The Lincolnshire Limestone Synthesis: The natural (baseline) quality of groundwater in England and Wales
Reports in the current series:
The Carboniferous Limestone aquifer of the Derbyshire Dome The Chalk aquifer of Hampshire

iii
Acknowledgements
BGS laboratory staff, including Debbie Allen, Kate Breward, Simon Chenery, George Darling, Dan Lapworth, Chris Milne, Richard Shaw and Peter Williams are thanked for chemical and isotopic analysis of groundwater samples. Sarah Harman at the CEH laboratory carried out the analysis of total dissolved phosphorus (TDP). We would also like to thank Anthony Cooper (BGS) for Permian Geology advice. We also thank Liz Tighe (AES Ltd), James Pugh (Environment Agency) and Paul Newton and John Davidson (both Northumbrian Water) for providing access to sample public-supply sources and numerous landowners for allowing access to private sites. We also acknowledge Rob Ward (Environment Agency) for providing additional water-quality data and providing helpful comments on the finished document. Diane Steel (Environment Agency) and John Bloomfield (BGS) are thanked for their reviews, which helped to improve this report.

iv
Contents
Foreword i
Acknowledgements iii
Contents iv
Summary 1
1 Introduction 2
2 Geographical setting 3 2.1 Study location 3
2.2 Land use and physical features 4
3 Regional geology and hydrology 8 3.1 Regional geology 8
3.2 Regional hydrogeology 14
3.3 Aquifer mineralogy and chemistry 17
3.4 Rainfall chemistry 20
3.5 Current pressures on groundwater quality 21
4 Data availability and analytical methodology 23 4.1 Data sources 23
4.2 Sampling and analysis 23
4.3 Data handling 24
5 Regional Hydrogeochemistry 27 5.1 Major constituents 27
5.2 Minor and trace consituents 37
5.3 Sites of particular interest 49
5.4 Isotopic composition 50
5.5 Chemical variations with depth 51
5.6 Temporal variations 51
6 Baseline groundwater chemistry 56 6.1 Regional baseline characteristics 56
6.2 Extent of anthropogenic influences 57
7 Conclusions 58
8 References 60

v
FIGURES
Figure 2.1 Location of study area within the Magnesian Limestone outcrop............................ 3
Figure 2.2 Land use of the study area ........................................................................................ 4
Figure 2.3 Map of the study area showing the sample sites discussed in this study.................. 5
Figure 2.4 Location map of major urban areas and towns named in this study......................... 6
Figure 3.1 Geology of the study area and surrounding land. A-B gives line of cross section.. 8
Figure 3.2 Mapped formations within Magnesian Limestone. .................................................. 9
Figure 3.3 Cross section, east to west, across the Magnesian Limestone outcrop in Darlington.......................................................................................................................... 11
Figure 5.1 Regional variation of pH and temperature within the Magnesian Limestone aquifer.......................................................................................................................... 28
Figure 5.2 Piper diagram of Magnesian Limestone groundwaters .......................................... 29
Figure 5.3 Regional variation of Eh and SEC within the Magnesian Limestone aquifer ........ 30
Figure 5.4 Cumulative probability plots for the major ions in the Magnesian Limestone aquifer............................................................................................................... 31
Figure 5.5 Box plots for the major ions in the Magnesian Limestone aquifer......................... 31
Figure 5.6 Regional variation of Ca and Mg within the Magnesian Limestone aquifer.......... 32
Figure 5.7 Regional variation of Na and Cl within the Magnesian Limestone aquifer ........... 33
Figure 5.8 Regional distribution of K and SO4 within the Magnesian Limestone aquifer ...... 35
Figure 5.9 Regional distribution of NO3-N and NO2-N within the Magnesian Limestone aquifer............................................................................................................... 36
Figure 5.10 Box plots for minor and trace elements in the Magnesian Limestone groundwater........................................................................................................................... 37
Figure 5.11 Cumulative probability plots for selected trace elements in groundwater from the Magnesian Limestone aquifer. ......................................................................... 38
Figure 5.12 Regional distribution of F and Br within the Magnesian Limestone aquifer ....... 40
Figure 5.13 Regional variation of Sr and Sr/Ca within the Magnesian Limestone aquifer ..... 42
Figure 5.14 Regional distribution of Fe and Mn within the Magnesian Limestone aquifer. ... 43
Figure 5.15 Regional distribution of As and B within the Magnesian Limestone aquifer. ..... 45
Figure 5.16 Regional distribution of Cu and Mo within the Magnesian Limestone aquifer. .. 47
Figure 5.17 Regional distribution of Pb and Zn within the Magnesian Limestone aquifer. .... 48
Figure 5.18 O and H stable isotopic composition of the Magnesian Limestone. .................... 50
Figure 5.19 Regional variation of δ18O, δ2H, and δ13C within the Magnesian Limestone aquifer............................................................................................................... 51
Figure 5.20 Ba and SO4 concentration over time at a site approximately 3km northwest of Dalton Piercy [NZ 43 32]................................................................................. 52
Figure 5.21 Ca and SO4 concentrations over time at a site near Sedgefield [NZ 36 30] ......... 53
Figure 5.22 Sites where both Na and Cl concentrations show a change.................................. 54

vi
Figure 5.23 NO3-N concentration over time at one monitoring site [NZ 35 42] ..................... 54
TABLES
Table 3.1 Correlation of the Permian Groups and Formations (Smith et al., 1986; Smith, 1989; Cooper and Cornwell, 1995) ............................................................................ 10
Table 3.2 Summary of stratigraphy for the Magnesian Limestones and their hydrological significance (after Allen et al., 1997)............................................................... 15
Table 3.3 Rainfall chemistry from the Moor House monitoring site [NY 757 328]. The average rainfall composition was calculated from data provided by the Environmental Change Network (ECN) (www.ecn.ac.uk). The mean annual rainfall at this site is 2012 mm y–1 (1991–2007).............................................. 20
Table 4.1 Summary statistical parameters returned by the methods used in this study. (K-M is the Kaplan-Meier method and ROS is “regression-on-order statistics”; see text for details) ........................................................................................................ 25
Table 5.1 Statistical summary of field determined parameters, major ions, stable isotope compositions, and nitrogen species .................................................................. 27
Table 5.2 Statistical summary of data for minor and trace elements. ...................................... 39

1
Summary
This report describes the regional geochemistry of groundwater from the Magnesian Limestone aquifer of County Durham and North Yorkshire. The study aims to assess the likely natural baseline chemistry of the groundwater by identifying the dominant controlling processes. Data have been collected from strategic sampling of 36 groundwater sources, in conjunction with collation of existing groundwater, rainfall, mineralogical and geochemical data.
The Magnesian Limestone aquifer comprises a series of marine limestones and dolomites, marls and evaporites which reflect cycles of transgression, regression and evaporation of a shallow tropical sea. The depositional basin was divided by an area of high ground. As a result of this, the geology and hence groundwater are chemically different in regions known as the Durham Province and the Yorkshire Province. The aquifer is regionally important for public and domestic supply, agriculture and industry. It provides significant baseflow to the River Skerne, and minor baseflow contributions to the Rivers Wear and Tees.
The groundwaters have notable regional variation in chemistry. Groundwater in County Durham is mainly of Ca-Mg-HCO3 type with some mixing towards SO4, Na, and Cl compositions. In Yorkshire, groundwaters are most frequently of Ca-HCO3 type and show some mixing towards Ca-SO4 type. The differences in water type reflect differences in the strata in these two regions, most notably the presence of dissolving gypsum in Yorkshire.
Groundwaters with high salinity (Na up to 4600 mg L–1, Cl up to 9000 mg L–1) have been found in the coastal areas, particularly around Hartlepool. These are associated with saline intrusion. Relatively saline waters are also present in the area around the Durham coalfield in the central part of the study area. These waters have high concentrations of Ca, Cl, Ba, Fe, and SO4, and likely result from minewater rebound following closure of the mines in the 1970s.
Human impacts are mainly visible in the presence of indicator contaminants such as nitrate from agricultural or domestic sources or trace metals from urban or industrial sources. The widespread presence of nitrate and increasing concentrations indicates the extent to which the aquifer is influenced by modern farming practices. Concentrations of Cu, and Pb are relatively high around areas of industry and near major roads. Anomalous concentrations of a suite of trace metals (Fe, Co, Cr, Cu and Ni in particular) observed in groundwater from one site have been were attributed to contamination from the borehole metalwork.
Most of the sampled groundwaters from Magnesian Limestone aquifer of the study area are of relatively good inorganic quality, although concentrations of some solutes approach or exceed current national drinking-water limits in some areas. The most frequent exceedances above drinking-water limits are for nitrate, Mn and Fe with occasional exceedances for SO4 and F.

2
1 Introduction
This study concerns the Magnesian Limestone aquifer, which occupies a narrow north-south trending outcrop between South Shields in the north and Nottingham in the south. The aquifer consists of a series of limestones, magnesium-rich limestones and dolomites, marls and evaporites. These form a locally significant aquifer, important for both public and private supply as well as for agriculture and industrial use. The importance for public supply decreases southwards, and as such, there are limited abstractions in South Yorkshire and Nottinghamshire.
This report characterises the groundwater chemistry in the northern part of the Magnesian Limestone aquifer (South Shields to Knaresborough), outlining both spatial and temporal variability and assessing the likely main controls and likely ranges of baseline compositions.

3
2 Geographical setting
2.1 STUDY LOCATION
The Magnesian Limestone aquifer forms a north-south-trending escarpment which extends between South Shields in the north and Nottingham in the south (Figure 2.1). The study area of this report extends from County Durham (and surrounding metropolitan boroughs) to north Yorkshire, over an area of approximately 800 km2 between South Shields and Knaresborough (dashed area in Figure 2.1). The area to the north of Scotch Corner [NZ 23 05] is referred to as the Durham Province, and the area to the south of Scotch Corner is known as the Yorkshire Province.
Figure 2.1 Location of study area within the Magnesian Limestone outcrop

4
2.2 LAND USE AND PHYSICAL FEATURES
Differences in land use often relate to variations in topography, climate, soil fertility, and geology (Kelly and Panno, 2008), which in turn can have important implications for groundwater quality. The topography and land use in the area of the Magnesian Limestone generally reflects the underlying geology. The Magnesian Limestone outcrop is relatively low
Figure 2.2 Land use of the study area

5
lying and, along with the Triassic sandstones and mudstones, separates the upland areas of the Pennines from the North York Moors.
Land use in areas underlain by the Magnesian Limestone is dominated by arable farming, especially cereals. Non-arable vegetation is more abundant in the south of the study area (Yorkshire Province) than in the north (Durham Province). In the Durham Province, the Magnesian Limestone presents an escarpment that rises from sea level in the east to ca.150–180 m above sea level at its western extent. In the Yorkshire Province the outcrop is around 40 m above sea level. To the west of the Magnesian Limestone outcrop, the Carboniferous Coal Measures, Limestone and Millstone Grit rise to >800 m above sea level, forming the Pennines (see also Figure 3.1). Land use in these areas is dominated by grassland, woodland,
Figure 2.3 Map of the study area showing the sample sites discussed in this study

6
bog and shrub. To the east of the Magnesian Limestone outcrop, the Triassic Sandstone forms a belt of low-lying land ca. 50 m above sea level, where land use is indistinguishable from the area overlain by Magnesian Limestone.
The main urban areas on the Magnesian Limestone are located around the Durham coastline together with Darlington and Ripon, although the most extensive urban areas within the region (Newcastle and Middlesbrough) occur at the periphery of the study area. Much of the Magnesian Limestone groundwater abstraction from this area is used for the local drinking-water supply. Bare ground within the study area is mainly found along the coast. A map of land use is given in Figure 2.2.
Figure 2.4 Location map of major urban areas and towns
named in this study.

7
Average annual rainfall over the study area varies between 610 and 1340 mm year–1 (1961–1990). The greatest rainfall tends to occur around the south of Durham Province and north Yorkshire (NRFA, 2008).
The main rivers in the area (Rivers Tyne, Wear and Tees) flow eastwards towards the sea from their sources in the Pennines, where rainfall can reach almost 2000 mm year–1 (1961–1990 annual average) (NRFA, 2008). The other significant river in the area is the River Skerne. This rises in the Trimdon Hills [NZ 362 349] and flows in a south-south-westerly direction until its confluence with the River Tees [NZ 289 101], which then flows eastwards to the sea. The River Skerne flows almost entirely over Magnesian Limestone strata and has a good hydraulic connection with the groundwater (see Section 3.2.). A map showing the physical features of the study area and the location of the sampling sites used in this study is given in Figure 2.3. In addition Figure 2.4 shows the major urban areas and places named in this report for reference.

8
3 Regional geology and hydrology
3.1 REGIONAL GEOLOGY
3.1.1 Geological setting
The late Permian Magnesian Limestone aquifer of County Durham and northern Yorkshire comprises a series of marine limestones and dolomites, marls and evaporites which reflect the transgression, regression and evaporation of a shallow tropical sea (Powell et al., 1992; Smith, 1995b). The Magnesian Limestone forms a north-south-trending outcrop, seen between South Shields in the north and Nottingham in the south, which dips gently eastwards (Dearman and Coffey, 1981; Cooper and Burgess, 1993). An overview of the outcrop area and the surrounding strata is given in Figure 3.1, and Figure 3.2 presents the locations of the major mapped formations discussed below.. A cross section, marked on Figure 3.1 and Figure 3.2, is presented in Figure 3.3
The current nomenclature for the Permian stratigraphy was formalised by Smith et al. (1986) after extensive revisions of the Permian in England. This nomenclature was proposed to eliminate the misleading use of the same terms for rock units of varying ages found in separate provinces (Smith et al., 1986). Although the “traditional” nomenclature is most widely used by hydrogeologists (Allen et al., 1997), the more recent nomenclature is used here. A comparison with the traditional nomenclature is given in Table 3.1
Figure 3.1 Geology of the study area and surrounding land. A-B gives line of cross section
(Figure 3.3)

9
Three epochs are recognised in the Permian period, the Cisuralian, Guadalupian and Lopingian. The stratigraphy is difficult to correlate and sometimes the Cisuralian and Guadalupian epochs are grouped together as the early or Lower Permian and the Lopingian is known as the late or Upper Permian. The Cisuralian and Guadalupian epochs were characterised by erosion of Carboniferous strata and intermittent desert sedimentation; and the relatively brief Lopingian, was characterised by deposition of thick marine strata (Smith, 1994). During the Cisuralian and Guadalupian epochs Britain lay within the Laurasian supercontinent in the warm, arid subequatorial circum-tropical belt. The area was comparable to the present day Sahara Desert in terms of its position relative to the equator, topography and climate (Smith, 1995a; Allen et al., 1997).
The most significant earth movements in the Cisuralian and Guadalupian are thought to have been post orogenic extensional subsidence, which led to the formation of troughs and widespread sub-sea-level inland basins. Continued erosion and sedimentation occurred intermittently throughout the whole of the Permian period in Britain. Early Permian erosion, which began in the Carboniferous, during the Hercynian Orogeny, caused extensive peneplanation of large upland areas of Carboniferous rocks, namely Westphalian Coal Measures. Low-lying basins and subsiding areas subsequently accumulated extensive desert sediments, which rest unconformably on the widespread peneplanes. Dunes composed of desert strata are represented in the Yellow Sands of Lower Permian age (Smith, 1995a; Allen et al., 1997; Ruffell et al., 2006).
Figure 3.2 Mapped formations within Magnesian Limestone. A-B gives line of
cross section (Figure 3.3)
10
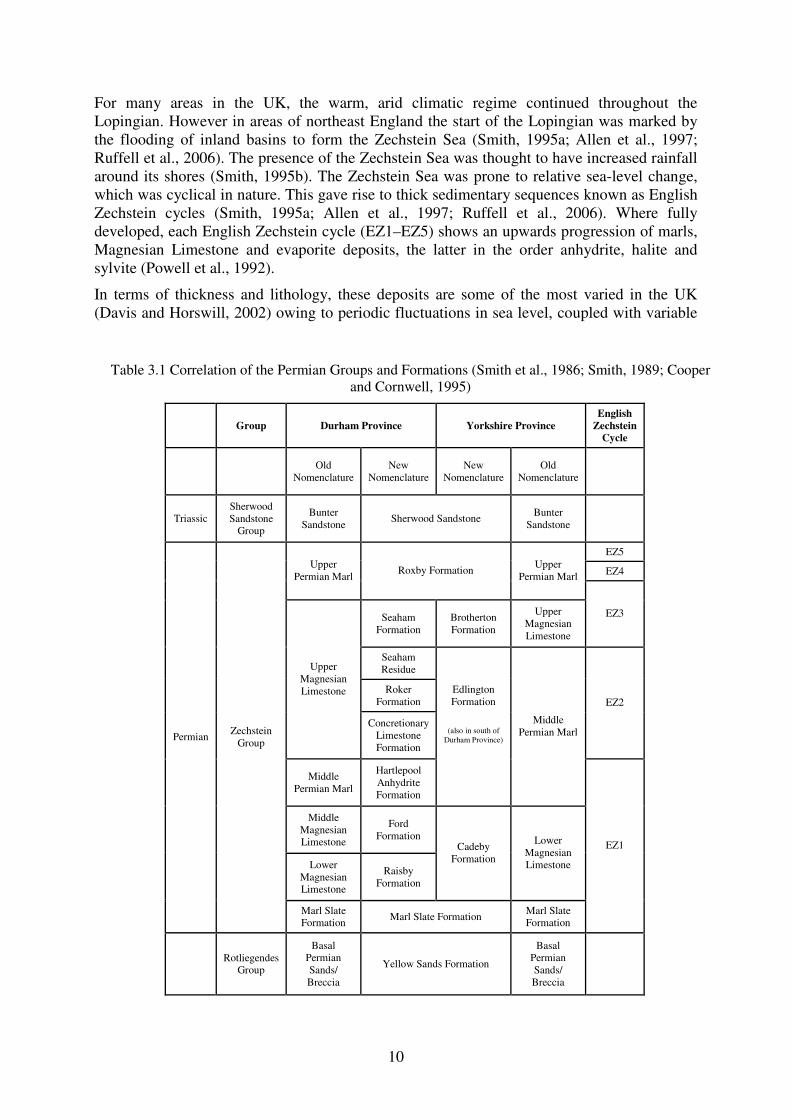
For many areas in the UK, the warm, arid climatic regime continued throughout the Lopingian. However in areas of northeast England the start of the Lopingian was marked by the flooding of inland basins to form the Zechstein Sea (Smith, 1995a; Allen et al., 1997; Ruffell et al., 2006). The presence of the Zechstein Sea was thought to have increased rainfall around its shores (Smith, 1995b). The Zechstein Sea was prone to relative sea-level change, which was cyclical in nature. This gave rise to thick sedimentary sequences known as English Zechstein cycles (Smith, 1995a; Allen et al., 1997; Ruffell et al., 2006). Where fully developed, each English Zechstein cycle (EZ1–EZ5) shows an upwards progression of marls, Magnesian Limestone and evaporite deposits, the latter in the order anhydrite, halite and sylvite (Powell et al., 1992).
In terms of thickness and lithology, these deposits are some of the most varied in the UK (Davis and Horswill, 2002) owing to periodic fluctuations in sea level, coupled with variable
Table 3.1 Correlation of the Permian Groups and Formations (Smith et al., 1986; Smith, 1989; Cooper and Cornwell, 1995)
Group Durham Province Yorkshire Province
English
Zechstein
Cycle
Old
Nomenclature New
Nomenclature New
Nomenclature Old
Nomenclature
Triassic Sherwood Sandstone
Group
Bunter Sandstone
Sherwood Sandstone Bunter
Sandstone
EZ5
EZ4 Upper
Permian Marl Roxby Formation
Upper Permian Marl
Seaham Formation
Brotherton Formation
Upper Magnesian Limestone
EZ3
Seaham Residue
Roker Formation
Edlington Formation
Upper Magnesian Limestone
Concretionary Limestone Formation
(also in south of Durham Province)
EZ2
Middle Permian Marl
Hartlepool Anhydrite Formation
Middle Permian Marl
Middle Magnesian Limestone
Ford Formation
Lower Magnesian Limestone
Raisby Formation
Cadeby Formation
Lower Magnesian Limestone
Permian Zechstein
Group
Marl Slate Formation
Marl Slate Formation Marl Slate Formation
EZ1
Rotliegendes
Group
Basal Permian Sands/ Breccia
Yellow Sands Formation
Basal Permian Sands/ Breccia

11
rates of regional subsistence. After deposition, the carbonates were dolomitised by circulating Mg-rich waters. This dolomitisation, along with subsequent de-dolomitisation, caused these deposits to vary in chemical composition considerably (Harrison, 1993).
The area of the Zechstein Sea was characterised by sub-basins separated by areas of high land. One such elevated area was the Cleveland High, which forms the division between two areas of marine depositional environments into the distinctly different Durham Province (to the north), and the Yorkshire Province (to the south) (Cooper and Cornwell, 1995; Smith, 1995a; Cooper and Gordon, 2000). The outcrop rocks in the Durham Province were formed further offshore than those that outcrop in the Yorkshire Province (Allen et al., 1997). The complicated correlation of the Permian groups and formations between the two provinces is presented in Table 3.1.
3.1.2 Yellow Sands Formation
The Yellow Sands Formation is the basal Permian deposit, which consists of sands, sandstone and breccias. These deposits cover about two thirds of the Carboniferous–Permian unconformity in north-east England (Smith, 1994; Cooper and Gordon, 2000). North and west of a line joining Rushyford [NZ 28 28] to Blackhall Colliery [NZ 46 39], the deposits are typically medium- to fine-grained sub-arkoses that form ridges, reflecting preserved lenticular wind-blown dunes. The deposit is thickest in the north of the region; it is up to 68 m thick in the area around Sunderland, thinning to ca. 0.3 m in the area around Ripon. However, the sands vary locally in thickness, owing to the preservation of dune ridges (Powell et al., 1992; Smith, 1994). The Yellow Sands mainly crop out to the north of the Durham Province, forming a thin discontinuous band between the Carboniferous Coal Measures and the marls at the base of the first Zechstein cycle (Smith and Francis, 1967; Smith, 1994, 1995b).
In the south of the Durham Province and the Yorkshire Province, the deposits are predominantly breccias which do not form dunes. The breccias contain fragments up to ca. 10 cm in length. The largest fragments are generally mudstone or sandstones, derived from the Carboniferous Coal Measures, although the most abundant fragments are composed of Carboniferous Limestone (Smith and Francis, 1967; Mills and Hull, 1976; Powell et al., 1992; Cooper and Burgess, 1993; Smith, 1994, 1995b).
Figure 3.3 Cross section, east to west, across the Magnesian Limestone outcrop in Darlington (from
Cooper and Gordon, 2000)
A B
12
3.1.3 The Marl Slate Formation
The Marl Slate is the first widespread deposit of the Zechstein Sea. It is an evenly laminated carbonaceous, dolomitic and calcareous siltstone. It is generally up to 1 m thick, but exceptionally reaches around 5 m thick in the west of the Durham Province (Smith and Francis, 1967; Powell et al., 1992; Cooper and Burgess, 1993; Smith, 1994, 1995b). The thickness and dip of this formation is influenced by the configuration of the Yellow Sands Formation rather than any tectonic deformation (Smith, 1994). The Marl Slate represents a period of rapid deposition in the newly formed Zechstein Sea, the lower parts of which are thought to have been anoxic, comparable with the modern Black Sea (Cooper and Burgess, 1993; Smith, 1994, 1995b). The Marl Slate is often differentiated in boreholes, but mapped with the Magnesian Limestone owing to its limited extent at outcrop (Powell et al., 1992; Cooper and Burgess, 1993).
3.1.4 The Raisby, Ford and Cadeby Formations
In the Durham Province the Raisby Formation (formerly the Lower Magnesian Limestone) overlies the Marl Slate. It is the first major carbonate rock unit of the English Zechstein and outcrops along a narrow belt forming a prominent west-facing escarpment (Smith, 1994). It extends eastwards beneath younger strata. The thickness of the formation is variable, being less than 10 m in the north of the Durham Province, increasing to 70 m west of Hartlepool in the central region, and about 30 m in the south of the province. The Raisby Formation accumulated on a gently eastwards-inclined marine slope (1º to 4º) (Smith and Francis, 1967; Mills and Hull, 1976; Smith, 1994).
The Ford Formation (formerly Middle Magnesian Limestone) overlies the Raisby Formation. This is a wedge-shaped carbonate shelf complex composed of dolomites, calcitic dolomites and dolomitic limestones (Smith and Francis, 1967; Mills and Hull, 1976). It is seen to crop out in a north-south belt up to 3–10 km wide, occupying most of the outcrop of Permian rocks north of Hartlepool (Smith and Francis, 1967; Smith, 1994). The formation is often considered together with the Raisby Formation as they are both dolomitic formations, which often cannot be distinguished in boreholes. Their combined thickness varies from 5–82 m (Cooper and Gordon, 2000). The top of these formations is topographically level and the different thicknesses of the formations (ca. 20 m) are caused by the topography of the underlying strata (Cooper and Gordon, 2000).
In the northern part of the Yorkshire Province, the equivalent strata to the Raisby and Ford Formations are mapped as one unit, the Cadeby Formation (formerly the Lower Magnesian Limestone) (Powell et al., 1992; Cooper and Gordon, 2000). The areas where the Cadeby Formation is found were marginal to the Zechstein Sea basin, so the sedimentation is laterally variable as deposition gradually covered the existing undulating diachronous topography. The formation mainly comprises dolomitic limestone and the thickness ranges from 0–103 m, with the distribution generally thickening eastwards (Powell et al., 1992; Cooper and Burgess, 1993). In the south of the Yorkshire Province (from Ripon to Nottingham), the Cadeby Formation is divided into two members (Powell et al., 1992; Cooper and Gordon, 2000). The Lower Subdivision of the Cadeby Formation (the Wetherby Member) is separated from the Upper Subdivision (the Sprotborough Member) by the Hampole Beds, which comprise a thin layer (0.3–0.6 m thick) of perforated dolomites and mudstones, which are typical of an intertidal environment, representing a marine regression. The Hampole Beds are split between the two members. These divisions do not form mappable units, but are often considered separately when describing the succession (Powell et al., 1992; Cooper and Burgess, 1993).

13
3.1.5 The Hartlepool Anhydrite, Concretionary Limestone and Roker Formations, and
the Seaham Residue
In the north-eastern areas of the Durham Province, the Ford Formation is overlain by the Hartlepool Anhydrite Formation, the Concretionary Limestone, the Roker Formation and the Seaham Residue (see Table 3.1). The Hartlepool Anhydrite Formation was previously known as the Middle Permian Marl, and the Concretionary Limestone, the Roker Formation and the Seaham Residue were formerly part of the Upper Magnesian Limestone. All these formations form the equivalent strata to the Edlington Formation (formerly known as the Middle Permian Marl), which is found in the south of the Durham Province and the Yorkshire Province (Smith et al., 1986). The Roker Dolomite and the Concretionary Limestone formations are some of the most complex strata in the UK (Davis and Horswill, 2002).
The Hartlepool Anhydrite Formation is regarded as the transition between the first and second English Zechstein cycles. The formation represents part of an almost continuous belt of anhydrite surrounding the Zechstein Sea basin, lying mainly within the EZ1 carbonates. The anhydrite can be found in offshore boreholes although it has been dissolved from the land areas, leaving a residue and foundered strata as evidence of its former presence. The thickness of the formation is variable (0–13m thick) owing to the dissolution of the deposit. The former onshore deposits probably exceeded 120 m thick (Smith, 1994, 1995b).
Overlying the Hartlepool Anhydrite Formation is the Concretionary Limestone Formation, which is the most varied of the English Zechstein deposits. This is mainly present as lithologically varied dolomite and is found at thicknesses of up to 100 m in the north of the region, around Marsden Bay. The Concretionary Limestone Formation thins to the south to around 45 m at Seaham, before dying out around Chordon Point. In the most northerly areas the Concretionary Limestone is present as a thin collapse breccia. Offshore, the Concretionary Limestone may exceed 100 m and locally makes up all of the EZ2 carbonate phase (Smith, 1994).
The Roker Formation is the dolomitic shelf facies of EZ2, which interweaves conformably with the Concretionary Limestone. Indeed these two formations are often grouped together as a single composite as they are best regarded as complementary parts of a single clinoform. When considered separately the Roker Formation thins northwards as the Concretionary Limestone deposits thicken, and is found at thicknesses of 15–20 m inland, increasing to >112 m in offshore boreholes. All onshore occurrences of the Roker Formation are foundered as a result of the complete dissolution of the underlying Hartlepool Anhydrite Formation (Smith, 1994, 1995b).
The Seaham Residue represents the insoluble remains of the Fordon Evaporites, which can be found in offshore boreholes. These formations represent the evaporite phase of EZ2. It is thought that the evaporite deposits of gypsum and anhydrite could have been up to some 90 m thick. However, the observed thicknesses of the evaporite deposits from offshore boreholes of around 25 m are atypically thin, owing to dissolution. The onshore residue is a heterogeneous mass, up to 9 m thick, comprising angular fragments of limestone and dolomite in a clayey dolomitic matrix (Smith, 1994, 1995b).
3.1.6 The Edlington Formation
The Edlington Formation (formerly the Middle Permian Marl) is found at depth in the southern areas of the Durham Province, and at outcrop in the Yorkshire Province as a belt of low ground to the east of the Cadeby Formation escarpment (Mills and Hull, 1976; Powell et al., 1992). The formation is equivalent to the Hartlepool Anhydrite, Concretionary Limestone and Roker formations, and the Seaham Residue found in the north of the Durham Province.

14
The Edlington Formation therefore represents the latter parts of the first Zechstein cycle and most of the second cycle (Table 3.1) (Powell et al., 1992; Cooper and Burgess, 1993).
The Edlington Formation incorporates the Hayton Anhydrite at the base, which does not form a mappable feature at outcrop. Boreholes downdip of the outcrop show that the anhydrite is up to 35 m thick. Overlying the Hayton Anhydrite is the Kirkham Abbey Formation, a thin sequence (≤5 m) of lenticular dolomitic limestone. This forms the carbonate phase of the EZ2 and does not form a separate mappable unit. The upper 20 m of the Edlington Formation is mainly siltstone and mudstone containing thin anhydrite and gypsum beds that are equivalent to the Fordon Evaporites in the northern Durham area (Powell et al., 1992; Cooper and Burgess, 1993).
3.1.7 The Seaham and Brotherton Formations
The Seaham Formation in the Durham Province and the Brotherton Formation in the Yorkshire Province were formerly known as the Upper Magnesian Limestone. They form the carbonate phase of EZ3, representing renewed marine incursion (Powell et al., 1992; Cooper and Burgess, 1993; Smith, 1994).
The limestones of the Seaham Formation are severely disrupted and brecciated in places as a result of significant dissolution of the underlying Fordon Evaporites. Although the Seaham Formation is locally variable, it is the most uniform of all the carbonate deposits of the English Zechstein sequences. It is around 30 m thick at outcrop in coastal cliffs at Seaham and thickens uniformly by 1–2 m per kilometre as it extends eastwards offshore (Smith, 1994).
The lithology of the Brotherton Formation is generally very similar to that of the Seaham Formation further north, and, like the Seaham Formation, the Brotherton Formation has foundered and brecciated as a result of dissolution of underlying evaporite formations. The dolomitic limestones in the Yorkshire Province are about 10 m thick at outcrop, thickening downdip to about 25 m thickness (Powell et al., 1992; Cooper and Burgess, 1993).
3.1.8 The Roxby Formation
The Roxby Formation (previously known as the Upper Marl) is the uppermost unit of the English Zechstein sequence. It is 10–18 m thick in the few outcrops that occur in the south of the Durham Province and the Yorkshire Province. The Roxby Formation is present as silty mudstones and fine-grained sandstones. Downdip, the sequence thickens to as much as 70 m owing to the presence of interbedded EZ3-EZ5 evaporites. The anhydrite/gypsum beds are banded with traces of dolomite which probably formed as lagoonal and salt-flat deposits (Smith and Francis, 1967; Powell et al., 1992; Cooper and Burgess, 1993; Smith, 1995b).
3.1.9 The Sherwood Sandstone
The Magnesian Limestone is overlain conformably by the Triassic Sherwood Sandstone. The junction between the Roxby Formation and the Sherwood Sandstone is an interbedded gradation extending over a few metres. The lithology becomes more arenaceous, marking the transition to terrigenous sedimentation (Powell et al., 1992; Cooper and Burgess, 1993).
3.2 REGIONAL HYDROGEOLOGY
Together with the Yellow Sands Formation, the Magnesian Limestone forms the most important aquifer in north-east England. These two units exhibit good hydraulic connectivity and are often regarded as a single aquifer, although the Marl Slate Formation acts locally as

15
an aquitard. The degree of hydraulic continuity has been demonstrated by an observed lack of distinction in water chemistry between the two units (Younger, 1995). Table 3.2 summarises the hydrological significance of each of the basic stratigraphical divisions within the Permian strata and overlying Tertiary sandstone.
3.2.1 Aquifer Properties
The physical properties of the Magnesian Limestone aquifer are extremely unpredictable as a result of the varied lithology (see Chapter 3.1) and extensive fracturing. The lithological differences result in variable hydraulic conductivities, hence transmissivities and yields. The groundwater flow in the Magnesian Limestone mainly follows fractures. In the Durham Province, the Ford Formation is considered to be the best prospect for groundwater development because of the presence of complex reef structures, which are commonly permeable. However, the Raisby and Seaham formations may also yield high quantities of water where they are extensively fractured (Younger, 1995; Allen et al., 1997). In the Yorkshire Province, the best prospects are where the Cadeby and Brotherton formations are faulted (Allen et al., 1997). Additionally, small dry caves have been reported in the Magnesian Limestone of the Yorkshire Province (Gibson et al., 1976) and if such caves develop below the water table they could locally influence aquifer characteristics (Allen et al., 1997). Locally, dissolution of gypsum has had a major impact on groundwater flow (Box 3.1).
Core data representing matrix properties for a limited number of sites in the Yorkshire Province show that the porosity of the Magnesian Limestone ranges between 1 and 30% (Allen et al., 1997). Although their data were very scattered, Allen et al. (1997) showed that the porosity of the Magnesian Limestone generally increases with increasing hydraulic conductivity.
Table 3.2 Summary of stratigraphy for the Magnesian Limestones and their hydrological significance (after Allen et al., 1997)
Stratigraphy
Durham Yorkshire
Hydrogeological
significance
Sherwood Sandstone Sandstone aquifer Roxby Formation Aquitard
Seaham Formation Seaham Residue Roker Formation
Concretionary Limestone Formation
Brotherton Formation Magnesian
Limestone aquifer
Hartlepool Anyhdrite Formation
Edlington Formation Leaky aquitard
Ford Formation Raisby Formation
Cadeby Formation Magnesian
Limestone aquifer Marl Slate Formation Aquitard
Yellow Sands Formation Sandstone aquifer
16
Transmissivity values within the Magnesian Limestone aquifer can range from 6–4300 m2 day–1, although in practice a more limited range of 60–800 m2 day–1 is generally encountered (Younger, 1995; Allen et al., 1997). The transmissivity values show very little spatial variation, and there is little difference between the transmissivity values encountered in Yorkshire from those in the Durham Province. The highest transmissivities are associated with fault zones; within the faulted blocks the transmissivities are generally lower but vary greatly owing to localised fracturing (Allen et al., 1997).
There is a good hydraulic connection between the Magnesian Limestone and the River Skerne in the south-westerly areas of the Durham Province outcrop, where the river drains water from the aquifer. With the exception of limited discharges to the Rivers Wear and Tyne the remaining outflow from the Magnesian Limestone is thought to be via submarine discharges to the North Sea (Younger, 1995). Groundwater head measurements have indicated that the groundwater flows from west to east (Neymeyer et al., 2007).
The Base Flow Index (BFI) can be used as an indication of the proportion of a river’s runoff that is derived from stored (groundwater) sources (Marsh and Hannaford, 2008). The BFI increases with permeability of the bedrock, superficial deposits and soils in a catchment. A high BFI indicates the dominance of baseflow, which will sustain the river’s flow during dry periods. The river Skerne is the only river to flow entirely over the Magnesian Limestone. The baseflow index of this river ranges from 0.39 in its upper reaches to 0.5 close to its confluence with the River Tees (Marsh and Hannaford, 2008), indicating increasing importance of groundwater inputs downstream. Younger (1995) indicated that the Skerne is the only river in the study area to receive significant inputs from the Magnesian Limestone. Where the Rivers Tees and Wear are monitored above the Magnesian Limestone the BFIs are 0.33 and 0.46 respectively(Marsh and Hannaford, 2008). These BFI values are of limited use
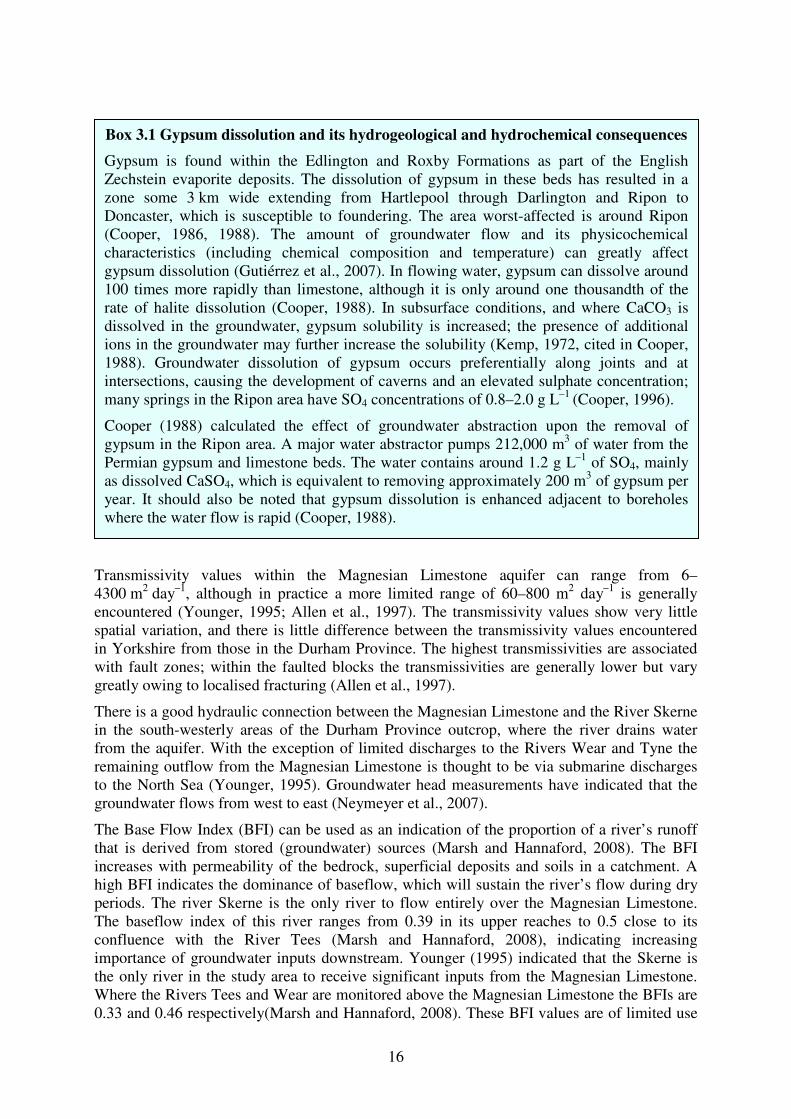
Box 3.1 Gypsum dissolution and its hydrogeological and hydrochemical consequences
Gypsum is found within the Edlington and Roxby Formations as part of the English Zechstein evaporite deposits. The dissolution of gypsum in these beds has resulted in a zone some 3 km wide extending from Hartlepool through Darlington and Ripon to Doncaster, which is susceptible to foundering. The area worst-affected is around Ripon (Cooper, 1986, 1988). The amount of groundwater flow and its physicochemical characteristics (including chemical composition and temperature) can greatly affect gypsum dissolution (Gutiérrez et al., 2007). In flowing water, gypsum can dissolve around 100 times more rapidly than limestone, although it is only around one thousandth of the rate of halite dissolution (Cooper, 1988). In subsurface conditions, and where CaCO3 is dissolved in the groundwater, gypsum solubility is increased; the presence of additional ions in the groundwater may further increase the solubility (Kemp, 1972, cited in Cooper, 1988). Groundwater dissolution of gypsum occurs preferentially along joints and at intersections, causing the development of caverns and an elevated sulphate concentration; many springs in the Ripon area have SO4 concentrations of 0.8–2.0 g L–1 (Cooper, 1996).
Cooper (1988) calculated the effect of groundwater abstraction upon the removal of gypsum in the Ripon area. A major water abstractor pumps 212,000 m3 of water from the Permian gypsum and limestone beds. The water contains around 1.2 g L–1 of SO4, mainly as dissolved CaSO4, which is equivalent to removing approximately 200 m3 of gypsum per year. It should also be noted that gypsum dissolution is enhanced adjacent to boreholes where the water flow is rapid (Cooper, 1988).

17
as the baseflow will also be affected by the upstream geologies. Indeed Younger (1995) suggests that the Rivers Wear and Tees receive limited discharge from the Magnesian Limestone aquifer and the hydraulic connection is generally poor
3.2.2 Aquifer Resources
The Magnesian Limestone aquifer is exploited for water resources in County Durham and Yorkshire. The importance of the aquifer for public supply decreases southwards, and as such, there are limited abstractions in South Yorkshire and Nottinghamshire (Allen et al., 1997). Total licensed abstractions from the Magnesian Limestone aquifer currently exceed 260,000 m3 day–1, two thirds of this volume being abstracted from the Durham Province (Environment Agency data, unpublished). In 1995, groundwater from these Permian strata met 30% of the demand for drinking water in the Sunderland area, and provided the entire public supply for Hartlepool (Younger, 1995).
Chemical quality of the groundwater can be affected by the rise in water levels caused by cessation of dewatering following the abandonment of mining operations (see Box 3.2). Water levels have also risen due to a change in pumping patterns in response to past problems of seawater intrusion in boreholes near to the coast (Younger, 1995).
The Ca and Mg carbonates of the Magnesian Limestone dissolve easily, producing groundwaters with high TDS (total dissolved solids) values. The high TDS values are predominantly related to increases in concentrations of Ca2+, Mg2+ and HCO3. The Ca2+ and Mg2+ give carbonate groundwaters their characteristic hardness, and the HCO3 gives the water a high alkalinity (Appelo and Postma, 2007; Younger, 2007). Besides its effects on the groundwater geochemical characteristics, dolomitisation, caused by circulating Mg-rich waters, may influence the hydrogeological properties of the Magnesian Limestone (after Machel, 1999). Dolomitisation can create secondary storage and therefore increase the yield within the dolomite areas (Machel, 1999; Shepley, 2007). Indeed the porosity increase is caused by the replacement of 2 moles of calcite with 1 mole of dolomite, which decreases the molar volume by 13% (Machel, 1999).
3.3 AQUIFER MINERALOGY AND CHEMISTRY
The Magnesian Limestone is a complex sequence of deposits and the lithology is varied (Dearman and Coffey, 1981; Davis and Horswill, 2002). Mineralogy and chemistry have significant short-range variability both within and between formations. Hence the predominant mineralogy or a generalisation is described here.
As noted above, the Marl Slate Formation forms the base of the Magnesian Limestone aquifer (Table 3.1). In the Durham Province this comprises dolomite, silty dolomite or dolomitic limestone. The remainder of this unit is mainly composed of sand, clay minerals, organic matter and pyrite. Typical bulk analyses of rocks in this formation give 20% CaO and 12% MgO (Smith and Francis, 1967; Smith, 1994, 1995b).
Base-metal concentrations of over 100 times the normal geochemical background have been found around Hartlepool (Deans, 1950 cited in Smith and Francis, 1967). Further South in the Yorkshire Province, the Marl Slate is present as a dolomitic calcareous siltstone sequence (Powell et al., 1992; Cooper and Burgess, 1993).
The Raisby Formation, which overlies the Marl Slate in the Durham Province, is described as a slightly calcitic dolomite in the north, and varies between an almost pure limestone to a dolomite in the south (Smith and Francis, 1967; Mills and Hull, 1976; Smith, 1994). Carbonate values are consistently high and concentrations of impurities are low (Harrison,

18
Box 3.2 Minewater rebound in the Durham Coalfield
Coal mining in the southern part of the Durham coalfield stopped in 1974. During the years of mining activity the mines had been dewatered. From 1976 pumping ceased altogether and groundwater levels were allowed to rise unhindered, in a process known as groundwater rebound. Water-levels rose in both the Coal Measures and the overlying Magnesian Limestone. A water-level rise of around 10 m was observed in the Limestone aquifer around Ferryhill [NZ 29 32], a town overlying abandoned coalmine workings (Younger, 1995; Neymeyer et al., 2007).
The water being pumped from the mines originated in the Coal Measures, probably as fossil seawater. Prior to coalmine dewatering, this discharged as brine springs around County Durham (Edmunds, 1975). Since the cessation of pumping in the southern portion of the coalfield the brine has been migrating upward through the Magnesian Limestone as a plume, characterised by a high conductivity and high concentrations of Ca, Cl, Ba, Fe, and SO4 (Edmunds, 1975; Neymeyer et al., 2007). The high concentrations of Ca, Cl and Ba are considered to represent a fossil seawater signature (Edmunds, 1975), while the Fe and SO4 are thought to have derived from the oxidation of pyrite in the Coal Measures during the period when the mine voids were force-ventilated (Younger and Adams, 1999, cited in Neymeyer et al., 2007). Concentrations of SO4 up to 800 mg L–1 have been found in the Magnesian Limestone groundwaters around Ferryhill (Younger, 1995; Neymeyer et al., 2007).
The migration of the plume into the Magnesian Limestone aquifer has obvious implications for the quality of the groundwater resource and its future potential for public supply. Groundwater SO4 concentrations greatly exceed the national limit for SO4 in drinking water locally. However, high concentrations of Fe and SO4 are sporadic, indicating a localised influence of pyrite oxidation (Neymeyer et al., 2007). The map below shows the approximate extent of the mine workings and SO4 plume of concentrations >100 mg L–1 (after Neymeyer et al., 2007).

19
1993). In the north of the province around Sunderland, the CaO composition varies between 54 and 58% and the MgO varies between 39 and 45% (Smith, 1994). Around Hartlepool, the
Raisby Formation is more variable and the strata comprise 29–54% CaO and 0.2–20% MgO (Smith and Francis, 1967; Harrison, 1993).
The Ford Formation, which overlies the Raisby Formation, contains a wide range of carbonate rock types including dolomites, dolomitised limestones and calcitic dolomites (Mills and Hull, 1976; Harrison, 1993; Smith, 1994, 1995b). These reef deposits present a variety of facies, which typically contain around 31–34% CaO and 16–25% MgO (Smith and Francis, 1967; Mills and Hull, 1976; Harrison, 1993; Smith, 1994).
The Cadeby Formation in Yorkshire is of equivalent age to the Raisby and the Ford Formations. This is composed of calcareous mudstones and dolomites (Powell et al., 1992; Cooper and Burgess, 1993). It has typical CaO and MgO compositions of 30 and 21% respectively (Harrison, 1993).
The Hartlepool Anhydrite in the Durham Province and the Edlington Formation in the Yorkshire Province divide the Magnesian Limestones and act as a leaky aquitard. In the Durham Province, this aquitard is present as almost pure anhydrite, which constitutes over 85% of the formation interdispersed by a fine network of disrupted and distorted dolomite (Smith, 1994, 1995b). The equivalent strata in the Yorkshire Province comprise anhydrite overlain by calcareous and gypsiferous siltstones and mudstones (Powell et al., 1992; Cooper and Burgess, 1993).
The Concretionary Limestone which overlies the Hartlepool Anhydrite, comprise mud- to silt-grade dolomite or dolomitic limestone (Smith, 1994, 1995b). This contains around 3–15% gypsum and anhydrite (Smith and Francis, 1967; Smith, 1994) and “bizarre” (Smith, 1995b) almost pure calcite concretions (>95% CaCO3) (Smith, 1994). The Concretionary Limestone laterally extends into the Roker Dolomite Formation, which, at its type locality has the same composition as the bulk composition of the complicated Concretionary Limestone (Smith, 1994). The Concretionary Limestone and the Roker Dolomite Formations are overlain by the
North of Hartlepool coal mining continued well beyond that in the southern portion of the coalfield. In the 1970s, in order to protect the active collieries, pumping commenced from a line of shafts along the junction of the Magnesian Limestone and Coal Measures. This meant that the strain on individual mines was lessened as each mine was only required to cope with its own localised water input. (ESI, 2009). By 1992 there were 11 pumping stations, protecting the 2 remaining collieries. Pumping ceased briefly around one station in 1993/1994 following colliery closures, but recommenced in 2004 following the water level recovery almost to sea level (ESI, 2009).
Currently mine waters are only managed in the central portion of the coalfield. Pumping is undertaken at 2 sites near Peterlee and near Seaham. The Coal Authority estimates that between 13 and 17 million litres per day will need to be abstracted to provide long-term control at water levels similar to present (ESI, 2009). In addition the Coal Authority has started working on a plan to pump the most northern region of the coalfield underlying Magnesian Limestone. It is thought this region will be affected by rebound within 6 years if no action is taken (P. Aldred, Environment Agency, pers. comm.).

20
Seaham Residue, which is composed of the insoluble remains of the Fordon Evaporites. The Seaham Residue is a sequence of limestone and dolomite in a clayey dolomitic matrix and is rich in quartz (Smith, 1995b).
The Seaham Formation (in the Durham Province) and the Brotherton Formation (in the Yorkshire Province) are the uppermost strata in the Magnesian Limestone aquifer. They are relatively uniform and composed of calcitic mudstones, calcitic dolomite and dolomite (Smith and Francis, 1967; Powell et al., 1992; Cooper and Burgess, 1993; Smith, 1994).
3.4 RAINFALL CHEMISTRY
Rainwater is the source of most groundwater and provides the primary inputs of many solutes (Abesser et al., 2005b; Appelo and Postma, 2007). Rain is dominated by marine vapour, and resembles strongly diluted seawater containing carbonic acid and a sea-salt aerosol with a mixture of HCl, HNO3, H2SO4 and usually some NH4 (Kinniburgh and Edmunds, 1986; Drever, 1997; Appelo and Postma, 2007). The sea-salt content of UK rainfall is greater than the global average because much of the UK is proximal to the sea. The Cl- content of rainfall is usually a good indication of the sea-salt composition, it is generally 3.5–10 mg L–1 in inland areas of the UK, which equates to a seawater solution of 0.02–0.05% (Kinniburgh and Edmunds, 1986).
The composition of rainwater is determined by the source of the water vapour and the ions that are acquired or lost in the atmosphere. Furthermore before the rain becomes groundwater it will be modified by various processes in the soil, including the dissolution of dust and gas particles, evapotranspiration, weathering of soil minerals and uptake by vegetation. Indeed the concentrations of trace elements in rainwater are often much higher than is attributable to a seawater influence. These concentrations result from the partial dissolution of particles of terrestrial and industrial origin by acidic rain (Kinniburgh and Edmunds, 1986; Appelo and Postma, 2007).
Throughfall is water that has been collected beneath a vegetation canopy. It is assumed that the solutes present represent rainwater, dry deposition of particle aerosols and atmospheric gases, and elements cycled through the trees, including evapotranspiration enrichment (Stumm and Morgan, 1996; Drever, 1997). Throughfall has been shown to increase the
Table 3.3 Rainfall chemistry from the Moor House monitoring site [NY 757 328]. The average rainfall composition was calculated from data provided by the Environmental Change Network (ECN)
(www.ecn.ac.uk). The mean annual rainfall at this site is 2012 mm y–1 (1991–2007)
Parameter Units Average rainfall
composition (2007)
Concentrated rainfall
composition (3 × enriched
by evapotranspiration)
pH 5.6 SEC µS cm–1 17 51 Ca mg L–1 0.19 0.57 Mg mg L–1 0.33 0.99 Na mg L–1 2.85 8.54 K mg L–1 0.10 0.31 Cl mg L–1 4.95 14.85 SO4 mg L–1 0.41 1.24 NO3–N mg L–1 0.09 0.73* NH4–N mg L–1 0.15
*Assuming all NH4-N is oxidised to NO3 on infiltration
21
concentrations of most solutes in rainfall. An increase by a factor of between 2 and 3 is typical of canopy-rain and evapotranspiration interactions (Kinniburgh and Edmunds, 1986). Evapotranspiration causes an increase in the concentration of dissolved salts. Simplified models of the concentration processes produce a first approximation indicating that in Europe, recharge waters are typically around three times more concentrated than rainwaters (Appelo and Postma, 2007). This enrichment is therefore considered reasonably representative of the minimum baseline inputs to groundwater (Abesser et al., 2005b).
The degree of rainwater infiltration into the Magnesian Limestone is variable, being very high on bare limestone dip slopes and low where the Magnesian Limestone is blanketed by poorly-permeable Quaternary diamicton deposits (Cooper, 1996). Where rainwater can readily infiltrate into the aquifer, it may provide an important source of solutes to the groundwater, especially if the concentrations are enriched because of evaporation and canopy-rain interactions (Kinniburgh and Edmunds, 1986). Table 3.3 shows the chemical composition of rainfall in the area from the Moor House monitoring site [NY 757 328], which is located approximately 55 km northwest of Darlington (www.ecn.ac.uk).
In the UK, rainfall chemistry varies in response to distance from the coast. Intermediate concentrations of Na and Cl in the Moor House analyses suggest that there are maritime influences. Nonetheless, the Moor House suite is located greater than 60 km from the coast in an area of open moorland. Somewhat higher concentrations of Na and Cl may be anticipated in the more north-easterly areas of the Durham Province which are coastal and hence likely to be influenced to a greater extent by airborne marine salts (Shand et al., 2007), and closer to industrial centres and thus potentially affected by industrial and road emissions (e.g. NOx, SOx species).
Rainwater is naturally acidic owing to the dissolution of atmospheric CO2, which forms a weak solution of carbonic acid with an equilibrium pH of around 5.7. The Moor House rain water is pH 5.6 indicating there are likely to be few airborne pollutants present that are capable of further acidification, such as NOx and SOx. Areas closer to industrial atmospheric sources are likely to have rainfall with higher concentrations of S and N species and to have a lower pH. If it is assumed that all the NH4 in rainfall oxidises to NO3 on infiltration to groundwater, baseline concentrations of dissolved NO3-N derived from rainfall alone are likely to be in the order of 0.73 mg L–1 or less. The pH of recharge may be even lower than that measured in the rainfall owing to the oxidation of NH4
+ ions to NO3 which results in the release of H+ ions and concentration by evapotranspiration. The pH of recharge is typically in the range 3–5 (Smedley and Allen, 2004; Shand et al., 2007).
3.5 CURRENT PRESSURES ON GROUNDWATER QUALITY
The Environment Agency Draft River Basin Management Plans for the Northumbria (EA, 2009b) and Humber (EA, 2009a) River Basin Districts assess the current status of groundwater quality in the study area. The chemical status of the groundwater in the Durham Province is assessed as poor, while the water quality in the Yorkshire Province is assessed as good.
The risks of not achieving quality objectives in the Durham Province by 2015 under the Water Framework Directive (WFD) are as follows:
• at risk for NO3, both in existing and increasing concentrations;
• at risk from hazardous pollutants and other substances as a result of mining in the area;

22
• at risk from saline intrusion because of abstraction and other artificial flow pressures.
The only anticipated risk of the groundwater in the Yorkshire Province not achieving WFD quality objectives by 2015 is in respect of high concentrations of NO3. Currently the concentrations of NO3 are not sufficient to cause failure of water quality objectives, but action needs to be taken to prevent or limit the inputs of NO3 to the groundwater. This will ensure there is no future deterioration of groundwater quality, and the increasing NO3 trends can be reversed. Actions to achieve this are by a combination of regulatory and voluntary measures. Nitrate vulnerable zones (NVZs) were first designated by the EA in 1996, and then updated in 2002 and 2008. Currently almost 70% of England is designated as an NVZ. Farms within NVZs have to comply with rules affecting their careful planning, storage and usage of NO3 rich substances. Voluntary measures, such as catchment sensitive farming (CSF), are also encouraged in order to protect the groundwater from NO3 contamination.
There is evidence to suggest that NO3-N concentrations are increasing in some groundwaters in both the Durham (Stuart et al., 2007) and Yorkshire Provinces (EA data, unpublished), and some sites demonstrated an exceedance of the drinking-water limit for nitrate (EA data, unpublished).
23
4 Data availability and analytical methodology
4.1 DATA SOURCES
Groundwater chemical data were acquired for the area by collection of 36 new groundwater samples and collation of available data from the Environment Agency (EA) WIMS database. The latter included monitoring data for 108 sites. The EA data include full analyses of the major elements and selected trace elements and field determined parameters. The data comprise time-series analyses, which span over around 10 years (generally between the years 1994–2003). The most recent data available from each EA monitoring site not visited in the BGS sampling campaign were added to the dataset in order to expand the spatial coverage. The EA datasets provided analyses for an additional 78 sites for evaluation of some elements in this study. In addition the full set of 108 EA sample sites was used to establish long-term trends in groundwater chemistry.
4.2 SAMPLING AND ANALYSIS
A total of 36 groundwater samples were collected by BGS between 29/9/08 and 3/10/08 from commercial abstraction and private boreholes exploiting the Magnesian Limestone. The sample locations are shown in Figure 2.1.
Samples were mostly collected from continuously pumping boreholes, although in the case of private boreholes this was not always possible. Where practical, the pumps at private sources were switched on at least 10 minutes prior to samples being taken. Efforts were made to sample the groundwater as close to the borehole as possible and with minimum transport through pipes or hoses. Sampling from storage tanks was mostly avoided. At one site this could not be avoided, although the rapid flush rate through the tank meant that a sample could be obtained that had only had a residence time in the tank of a few hours.
At each site, measurements were made of temperature, specific electrical conductance (SEC), alkalinity (by titration against H2SO4), pH, dissolved oxygen (DO) and redox potential (Eh). The latter three parameters were measured in an anaerobic flow cell to prevent contact with the atmosphere and parameters were monitored until stable readings were obtained. In a few cases, use of a flow cell was not possible and on-site parameters were measured rapidly in a bucket. In each case a note was made of the sampling conditions.
Groundwater samples were also taken at each site for laboratory analysis. Samples for major- and trace-element analysis were collected in rinsed polyethylene bottles and filtered to <0.2 µm. Filtration was performed using either an in-line reusable filter holder attached to the outflow of the anaerobic flow cell or a disposable filter and syringe. Those required for cation and trace-element analysis were acidified to 1% (v/v) HNO3 to prevent metal precipitation and minimise sorption onto the container walls. Aliquots of the sample filtered to <0.2 µm were also collected in polyethylene bottles preloaded with potassium persulphate for the determination of total dissolved phosphorus (TDP).
Samples for dissolved organic carbon (DOC) analysis were filtered through a 0.45 µm silver-impregnated filter and collected in glass vials pre-cleaned with chromic acid. Samples for the determination of stable isotopes (18O and 2H in water and 13C in dissolved inorganic carbon) were collected unfiltered in rinsed glass bottles.
Analysis of major cations and sulphate was carried out by inductively-coupled plasma optical emission spectrometry (ICP-OES); Cl, NO3, Br and F were determined by ion chromatography (IC), NH4, NO2 and I by automated colorimetry (AC), stable isotopes by
24
mass spectrometry and a range of trace elements by inductively-coupled plasma mass spectrometry (ICP-MS). With the exception of TDP, analyses were carried at the BGS laboratories in Wallingford and Keyworth. Total dissolved phosphorus was analysed by sample digestion followed by chromatography using the molybdenum blue method at the CEH laboratory in Wallingford.
4.3 DATA HANDLING
The data collected as a result of the sampling campaign and the archive EA data were combined into one set for the purposes of statistical handling and interpretation. For many trace elements, the concentrations were below the detection limits of the analytical techniques used. As the data reported were obtained from more than one laboratory source and by more than one method, the detection limits for any given determinand can vary, indeed detection limits can vary from day to day on a single instrument. This produces left-censored data sets that require special statistical analysis methods for calculating summary statistics.
Summary statistics were calculated in the R statistical computer environment (R Development Core Team, 2005) using the NADA package. This package is used to perform statistical analysis on censored data and uses the methods described in Helsel (2005). The methods used to summarise the combined BGS-EA dataset were the Kaplan-Meier (K-M) method and the robust approach of the “regression on order statistics” (ROS) method. These methods can both be used to summarise multiply-censored data sets (Lee and Helsel, 2005a, 2007).
The K-M method is commonly used in the medical sciences and is the standard method for estimating summary statistics of survival data. It is also recommended for environmental data, but is often overlooked for this purpose (Lee and Helsel, 2007). The K-M method neither needs, nor makes, any assumptions about the distribution of the data, making it suitable for summarising censored data (Helsel, 2005). It only accepts right-censored data but the method can be equally valid for left-censored detection-limit data if it is flipped. The K-M method calculates the rank of the flipped data, placing each non-detect at its detection limit prior to ranking. The method thus accounts for the censored data between the detected observations. The summary statistics are estimated using the empirical cumulative distribution function of the ranked data. Typically this method produces a small positive bias in the mean produced for environmental data. However the method is considered to be suitable for datasets where less than 50% of the data are censored (Abesser et al., 2005a; Helsel, 2005).
The ROS method used in the NADA package was originally called the Multiple-limit Regression (MR) method by Helsel and Cohn (1998, cited in Lee and Helsel, 2005a). It is a “robust” semi-parametric method which has been evaluated as one of the most reliable methods for producing summary statistics of multiply-censored data (Shumway et al., 2002). The method is particularly useful for small data sets (n<30) where other methods may become inaccurate. It is also particularly useful where the non-detects comprise up to 80% of the data set. Regression-on-order statistics is a probability-plotting and regression approach that models censored distributions using a linear regression of observed concentrations against their normal quantiles (or “order statistics”) (Lee and Helsel, 2005b). The method firstly computes Weibull-type probability distributions of the data set, which includes both the censored and non-censored data. The formula used is designed to account for multiply-censored data. The plotting positions of the uncensored observations and their normal quantiles define a linear regression. This regression model can then be used to estimate the concentrations of the censored observations as a function of their normal quantiles (Lee and Helsel, 2005b). The last stage in the algorithm is to combine the observed uncensored values with the modelled censored values to produce estimations of the summary statistics. This

25
combination of observed and modelled censored values creates a method that is more resistant to non-normality of errors and also reduces any transform biases that occur (Lee and Helsel, 2005b).
As noted by Lee and Helsel (2005a, b), where the data set has greater than 80% non-detects, the estimated summary statistics are very tenuous. They suggest that in such cases the data can only be summarised by presenting minimum and maximum values (Lee and Helsel, 2005b). The summary statistics in this report were calculated using each of the above methods. The most appropriate method for each analyte was taken following the recommendations of Helsel (2005), as given below:
non-detects <50% of analyte data K-M method
non-detects between 50% and 80% of analyte data ROS method
non-detects >80% ranges only quoted.
The summary statistics reported are therefore derived from a range of methods and do not all present the same parameters. Table 4.1 summarises the statistical parameters that each test can return. To produce the box plots in this report (Figure 5.5 and Figure 5.10), ROS statistics have been used as they can provide all of the statistical parameters required. In the boxplots given in this report, boxes are defined as the interquartile range, the horizontal white line depicts the median, whiskers are defined as no more than 1.5 times the interquartile range (Tukey, 1977) and open circles beyond the whiskers are defined as outliers. Boxplot widths are proportional to the square root of the number of observations
In the Baseline report series the 95th percentile of a data distribution has typically been used as an upper cut-off for outlier compositions. The choice of percentile is somewhat arbitrary and other percentiles have been used within the literature. The 90–95th percentile was used by Lee and Helsel (2005b) and the 97.7th percentile was used by Langmuir (1997). While using percentiles as an upper limit provides a simple definition of outliers, the method clearly has its limitations. For example, many UK groundwaters are contaminated by nitrate derived from long-term use of nitrogenous fertilisers in agriculture. Nitrate concentrations are therefore variable and the 95% threshold in unconfined aquifers rarely represents a cut-off between natural and anthropogenically-influenced compositions. Likewise, for some elements data presented above a given threshold are presented as anomalous, when they can in fact represent baseline concentrations. However, the 95th percentile represents a simplification to exclude the upper 5% of the data distribution and has been used in the Baseline report series as one
Table 4.1 Summary statistical parameters returned by the methods used in this study. (K-M is the Kaplan-Meier method and ROS is “regression-on-order statistics”; see text for details)
Met
hod
n*
n(c)
*
Min
imum
Mea
n
Max
imum
0th p
erce
ntil
e
25th p
erce
ntil
e
50th p
erce
ntil
e
75th p
erce
ntil
e
90th p
erce
ntil
e
95th p
erce
ntil
e
100th
per
cent
ile
K-M � � � � � � � � � � � �
ROS � � � � � � � � � � � �
Ranges only � � � � � � � � � � � �
*n denotes number of samples and n(c) denotes number of censored samples

26
measure for estimating likely upper limits to baseline concentrations. Concentrations above this threshold are unlikely to be exceeded in future samples unless conditions within the aquifer have changed. It should be emphasised that this is not the only factor used when attempting to characterise the baseline groundwater compositions. A combination of understanding of the hydrogeological and geochemical processes, rainfall compositions, land use and residence times, together with temporal variability observed through time-series data are also taken into consideration.
In addition to the statistical analysis, saturation indices were calculated for the newly collected groundwater samples using PHREEQCi and the wateq4f.dat database. Saturation indices will be discussed where appropriate in Section 5. It should be remembered that minerals which are predicted to dissolve or precipitate may not actually do so because of kinetic constraints (Zhu and Anderson, 2002).

27
5 Regional Hydrogeochemistry
Limestones and dolomites commonly form productive aquifers that yield favourable conditions for groundwater abstraction. The Magnesian Limestone is no exception to this as it is heavily abstracted for drinking water and other purposes. Mineral dissolution reactions within the Magnesian Limestone aquifer will be responsible for buffering pH values, indeed the pH of waters in calcareous soils and aquifers rarely occurs below 6.5 (Kinniburgh and Edmunds, 1986; Abesser et al., 2005b). When CO2 reacts with rainwater it produces H2CO3, which can speed the dissolution of Ca and Mg carbonates, which in turn can speed the dissolution of gypsum if present (Appelo and Postma, 2007). Most carbonate-bearing aquifers have Ca concentrations of up to ca. 200 mg L–1; this value reflects the equilibrium with calcite at the CO2 partial pressure typical of temperate latitudes (Shand et al., 2007).
5.1 MAJOR CONSTITUENTS
Statistical data for major ions, field-determined parameters and stable isotopes used in the present study are summarised in Table 5.1, and the data are presented in Figure 5.2, Figure 5.4 and Figure 5.5. In addition spatial variations are presented in Figure 5.1, Figure 5.3 and Figures 5.6-5.9. It must be noted that where an element or parameter was not included in the EA data set, only the 36 new BGS data points are presented.
The main minerals in the Magnesian Limestone aquifer are Ca- and Mg-carbonates that dissolve readily. This makes the groundwater characteristically hard and well-buffered (Appelo and Postma, 2007) with values in the neutral to alkaline range (6.93–8.22). As indicated in Section 3.4, recharge to the aquifer is weakly acidic (pH 5.6 at the Moor House monitoring site), but owing to the rapid kinetics of calcite dissolution the acidity is soon
Table 5.1 Statistical summary of field determined parameters, major ions, stable isotope compositions, and nitrogen species
units n n(c) min mean max P0 P5 P25 P50 P75 P90 P95
Temp ºC 95 0 8.9 10.7 13.7 9.3 10.0 10.6 11.3 12.1 12.7
pH 39 0 6.93 7.3 8.22 6.95 7.14 7.24 7.38 7.50 7.60
Eh mV 36 0 89.7 343 476 89.7 130 323 372 398 425 445
DO mg/L 36 0 0.09 3.24 9.32 0.09 0.40 2.04 5.71 7.70 8.51
SEC µs/cm 91 0 203 1190 24900 561 687 867 1080 1500 1580
δ2H ‰ 15 0 -55.7 -53.7 -52.1 -55.7 -55.6 -54.7 -53.6 -52.5 -52.1 -52.1
δ18O ‰ 15 0 -8.51 -8.16 -7.75 -8.51 -8.46 -8.25 -8.18 -8.06 -7.98 -7.89
δ13C ‰ 13 0 -14.5 -13.2 -11.7 -14.5 -14.3 -13.8 -13.0 -12.6 -12.1 -11.9
Ca mg/L 107 0 10.3 109 547 57.8 74.9 92.0 117 165 177
Mg mg/L 107 0 0.519 49.5 537 25.7 35.0 42.8 50.0 73.0 84.0
Na mg/L 106 0 8.45 80.4 4610 12.4 20.5 27.5 40.1 78.4 125
K mg/L 107 0 0.613 5.18 169 1.48 2.20 2.82 3.94 7.17 9.60
Cl mg/L 109 1 <2 138 9250 14.8 23.1 38.3 53.8 111 235
SO4 mg/L 107 0 1.18 160 1610 21.8 49.5 89.1 153 400 461
HCO3 mg/L 110 0 56 357 586 240 311 351 397 467 504
NO3-N mg/L 106 5 <0.005 3.32 20.5 0.02 0.257 1.36 5.21 9.24 12.8
NO2-N mg/L 109 80 <0.0023 0.0082 0.395 4.9x10⁻⁶ 2.0x10⁻⁵ 0.0002 0.001 0.005 0.010 0.029
DOC mg/L 36 0 0.52 2.05 1.11 0.53 0.96 1.36 2.51 4.08 4.93
Si mg/L 36 0 1.5 4.18 6.56 2.63 3.43 4.01 4.90 5.80 6.33
DO: dissolved oxygen; SEC: specific electrical conductance; DOC: dissolved organic carbon; P: percentile; n(c): number censored; min and max are observed values

28
buffered. There is relatively little pH variation, which is typical of groundwaters dominated by carbonate equilibrium reactions (see Table 5.1).
The temperatures of the ground waters range from 8.9–13.7ºC, with a median of 10.6ºC (Table 5.1, Figure 5.1). Temperature can be used as an indicator of depth, which in turn can be used as a proxy to indicate residence time (Shand et al., 2007). The temperatures of most are consistent with values for modern recharge.
The Piper diagram (Figure 5.2) confirms the dominance of Ca- and Mg-carbonates. Data for the Yorkshire and County Durham groundwaters have been distinguished, because these two areas are often considered to be geologically distinct (Section 3.1). Indeed the Piper plot
Figure 5.1 Regional variation of pH and temperature within the Magnesian Limestone aquifer

29
shows that in County Durham the groundwaters are predominantly Ca-Mg-HCO3 type, with some mixing towards SO4, Na, and Cl. By contrast, the Yorkshire groundwaters are most frequently of Ca-HCO3 type and show mixing towards Ca-SO4 type. The County Durham sites are spread over a larger area and include coastal sites and areas of former coal mining. The Yorkshire sites occupy a narrow strip of land and the variation seems to represent the relative importance of gypsum dissolution.
The dissolved-oxygen concentrations are in the range 0.09–9.3 mg L–1 and the redox potential in the range 88–480 mV. These represent a large variation in the redox status of the sampled waters. The interdependence of the pH and the Eh determine the stability of the minerals present, controlling solubility and speciation (Levinson, 1974). This will be discussed where relevant when discussing the elemental concentrations. The most oxidised waters are found in the east of the aquifer, and there is a general north-south trend, with groundwaters becoming more reducing towards the south (Figure 5.3). The most reducing groundwater sampled (lowest Eh value) was from a site near Archdeacon Newton in County Durham [NZ 25 17].
The range in specific electrical conductance (SEC) is large, ranging from 203 to 24,900 µS cm–1 and with a 5th to 95th percentile range of 561–1580 µS cm–1. The lowest value may represent a recently recharged groundwater. Where the SEC is in excess of 1000 µS cm–1 it could represent groundwater that contains a large concentration of highly soluble gypsum, (common in the Yorkshire Province), intrusion of seawater along the coast, or rising coalmine waters (around Ferryhill [NZ 29 32]). Ferryhill is a town overlying abandoned coalmine workings, where brines have been found upwardly migrating into the Magnesian Limestone
0
0.2
0.4
0.6
0.8
1
0
0.2
0.4
0.6
0.8
1
1 0.8 0.6 0.4 0.2 0 0 0.2 0.4 0.6 0.8 1
0
0.2
0.4
0.6
0.8
1
0
0.2
0.4
0.6
0.8
1
0
0.2
0.4
0.6
0.8
1
0
0.2
0.4
0.6
0.8
1
Na + K HCO3
SO4 + Cl Ca + Mg
Mg SO4
Ca Cl
Durham ProvinceYorkshire Province
Figure 5.2 Piper diagram of Magnesian Limestone groundwaters

30
(Neymeyer et al., 2007) (see Box 3.2). The highest values shown on Figure 5.3 could represent each of the examples given, but elemental concentrations are needed to interpret the SEC distribution more fully.
The major-ion data are presented as cumulative-probability distribution plots in Figure 5.4 and as box plots in Figure 5.5. Both represent useful graphical methods for characterising chemical data distributions (Shand et al., 2007). These plots are used to present the range of results from the combined BGS and EA data set.
Box plots are used to show data ranges of a population and identify outliers. They are hence useful graphical indicators of baseline ranges. Cumulative-probability plots are an efficient way of identifying distinct populations and defining anomalies. If the x-axis (concentration) scale is logarithmic, a log-normal distribution will plot as a straight line and bimodal or multimodal distributions will be curved. In cumulative-probability plots, flexure may be used to discriminate baseline concentrations from anomalous populations. However, when
Figure 5.3 Regional variation of Eh and SEC within the Magnesian Limestone aquifer

31
interpreting cumulative-probability plots, care must be taken as natural reactions, such as redox reactions, sorption and denitrification can introduce anomalous concentrations, which are of entirely natural origin (Shand et al., 2007).
Figure 5.4 and Figure 5.5 indicate the ranges and outliers for the major ions. Alkalinity (as HCO3) and Si have the most limited ranges, with few outliers. The limited HCO3 range indicates a well-buffered solution. Calcium and Mg also have limited ranges but with more
Concentration
Pro
ba
bili
ty
0.010.050.1
0.250.5
0.750.9
0.950.99
Ca (mg/L) Mg (mg/L) Na (mg/L) K (mg/L) Cl (mg/L)
0.010.050.1
0.250.5
0.750.9
0.950.99
0.1 1 10 100 1000
SO4 (mg/L)
0.1 1 10 100 1000
HCO3 (mg/L)
0.1 1 10 100 1000
NO3−N (mg/L)
0.1 1 10 100 1000
Si (mg/L)
Figure 5.4 Cumulative probability plots for the major ions in the Magnesian Limestone aquifer.
Ca Mg Na K Cl SO4 HCO3 NO3−N Si
0.01
1.00
100.00
10000.00
Concentr
ation (
mg/L
)
Figure 5.5 Box plots for the major ions in the Magnesian Limestone aquifer. For explanation of boxplots see Section 4.3

32
outliers. The NO3-N has the largest range, which can be related to the large variation in redox conditions, e.g. the population of low NO3-N concentrations could represent nitrate lost in reducing conditions through denitrification (Shand et al., 2007). With the exception of these lower outliers, the NO3-N cumulative-probability curve is regular, suggesting a near normal distribution. The remaining major ions are intermediate to these trends: the curves are steep, but there are some distinct upper outliers within the Mg, Na, K and Cl data sets as well as lower outliers within the Mg, Cl and NO3-N data sets.
Calcium has a 5th–95th percentile range of 57–177 mg L–1, with a median of 92 mg L–1. This range is more similar to many UK Chalk groundwaters (typically 100–200 mg L–1) than to those from Carboniferous or Corallian carbonate aquifers. The observed range suggests that the shallow groundwaters of the Magnesian Limestone have not undergone significant Ca-Na ion exchange (after Shand et al., 2007). The major source of Ca in the aquifer is calcite and dolomite. In the Yorkshire Province, the rapid dissolution of gypsum (CaSO4.2H2O) will also contribute to the Ca-rich groundwaters. There appear to be bands of similar Ca concentrations
Figure 5.6 Regional variation of Ca and Mg within the Magnesian Limestone aquifer

33
running parallel to the outcrop boundary (see Figure 5.6), which probably reflect the variable nature of the aquifer mineralogy (see Section 3.3). In addition there is a cluster of high Ca concentrations in the Ferryhill area, which could be derived from upwelling brines (see Box 3.2).
In the Yorkshire Province, the concentrations increase towards the east. Any local anthropogenic influences are likely to be insignificant in comparison to the geogenic sources. It is possible, however, that the Ca concentrations of the groundwater can have been enhanced by the infiltration of acid rain.
Magnesium has a similar distribution but a smaller range than Ca, the 5th–95th percentile range being 25–84 mg L–1. The control is most likely dominated by the dissolution of dolomite. Calcium and Mg have a strong correlation, as can be seen on Figure 5.6. The main differences occur in Yorkshire, where Ca is seen to dominate. This could be caused by CaSO4 dissolution.
Figure 5.7 Regional variation of Na and Cl within the Magnesian Limestone aquifer

34
Both calcite and dolomite are supersaturated in all but two sites sampled by BGS owing to the abundance of soluble Ca- and Mg- carbonates. This is reflected in their narrow concentration ranges. The highly soluble evaporites gypsum and anhydrite are undersaturated, indicating that, where these minerals are present, dissolution will occur. This process is evident from foundering and collapses around the Ripon area.
The major baseline source of Na and Cl (Figure 5.7) is usually rainfall, yet both of these ions have concentrations much in excess of the concentrated rainfall values (8.5 and 14.9 mg L–1 respectively, see Section 3.4). The 5th–95th percentile range for Na is 12.4–125 mg L–1, while that for Cl is 14.8–235 mg L–1. The Na and Cl show a strong correlation (r2 = 0.998). Some of the highest concentrations of Na and Cl are found clustered around Hartlepool, on the coast (Figure 5.7). Indeed, the highest concentrations of both Na and Cl were found at an abandoned works in Hartlepool. The sample was taken in 1998, while the plant was still operational. The site closed in 2005 (Anon, 2009). Groundwater at the site, along with other sites in the Hartlepool area, has likely suffered from saline intrusion.
Some of the highest Na and Cl concentrations (>95th percentile) are found at a site only 5 km south-east of Ferryhill. These elevated concentrations could be attributed to the upwelling of brines from the underlying Coal Measures (Box 3.2).
The observed K concentrations have a 5th–95th percentile range of 1.48–9.6. Like Na and Cl, the highest concentrations are found near the coast at Hartlepool and in the central area near to Ferryhill. There is no other distinct spatial trend (Figure 5.8). Even the lowest value (0.612 mg L–1) is twice the concentration of the expected rainfall concentration (see Section 3.4). Besides rainfall, the dominant sources of K are likely to be clays, present in the marls. Additional inputs from fertilisers are possible; the highest concentrations may originate from mine recharge water and in the coastal area, from saline intrusion.
Sulphate concentrations in the Magnesian Limestone aquifer have a 5th to 95th percentile range of 21.8–461 mg L–1. The maximum value is 1610 mg L–1. If used untreated for potable supplies, many of the waters would exceed the maximum value of 250 mg L–1 permissible in drinking waters (Water Supply (Water Quality) Regulations; OPSI, 2000). The spatial trends are similar to those for Na and Cl, with high concentrations being found at the coast at Hartlepool, and extending inland from this point (Figure 5.8). Combined with the other major-ion data discussed above, it appears probable that seawater intrusion occurs at this location. A cluster of sites with elevated SO4 concentrations (>75th percentile) is found in an area 5-10 km south-west of Ferryhill, which is likely to reflect the effect of rebounding coalmine waters. After cessation of mine dewatering in the area a plume of upwardly-migrating SO4-rich groundwater was identified by Neymeyer et al (2007)
Additionally, there are elevated concentrations of SO4 in the Yorkshire Province. These occur along the eastern edge of the north-south-trending outcrop and are most likely attributed to the dissolution of gypsum and/or anhydrite. The area around Ripon is greatly affected by foundering of strata caused by gypsum dissolution (Cooper, 1986, 1988).
As stated above, the HCO3 is a dominant constituent of the Magnesian Limestone groundwaters and the 5th–95th percentile range of 240–504 mg L–1 can be attributed to rapid dissolution and attainment of saturation with Ca- and Mg-carbonates. The high alkalinity buffers the pH. The HCO3 concentrations are similar to those found in UK Chalk aquifers (Shand et al., 2007) and it is unlikely that these concentrations would reflect anything other than baseline concentrations.

35
The 5th–95th percentile range of NO3-N in this study is 0.02–12.8 mg L–1. Values below 1.24 mg L–1 can probably be attributed to natural recharge alone. However many are in excess of this value, up to and exceeding an order of magnitude. Seven of the sites have concentrations exceeding the national drinking-water limit (11.3 mg L–1) (OPSI, 2000). There is no spatial trend in the Yorkshire Province, but concentrations in the Durham Province increase from south-east to north-west, as shown in Figure 5.9. One of the newly collected samples had a NO3-N concentration below detection limit. This was the most reducing sample in the population, with an Eh of 90 mV. Four sites from the EA dataset were also below detection limit. However, as the detection limit was almost 40 times higher than that for the BGS data and no Eh data are available for the corresponding sample, it is difficult to determine the controls on these concentrations.
Nitrite is produced as an intermediate meta-stable nitrogen species, and its presence can
Figure 5.8 Regional distribution of K and SO4 within the Magnesian Limestone aquifer

36
indicate the process of denitrification under strongly reducing conditions. The 5th–95th percentile range of NO2-N is 2×10⁻⁵–0.028 mg L–1. There is no spatial trend (Figure 5.9) and the sites with detectable NO2 are not necessarily reducing. Nitrite can also be an indicator of pollution from agriculture or domestic waste and such sources could be partially responsible for the detectable concentrations. However, it is difficult to distinguish such anthropogenic inputs, and hence to determine the likely range of baseline NO2 concentrations.
The 5th–95th percentile range of dissolved organic carbon (DOC) spans almost an order of magnitude, from 0.53–4.93 mg L–1. Dissolved organic carbon is derived from soil reactions but can also be enhanced by inputs from pollution sources (e.g. slurry pits, landfills). The highest concentrations are around the Stockton on Tees to Hartlepool area.
Figure 5.9 Regional distribution of NO3-N and NO2-N within the Magnesian Limestone aquifer
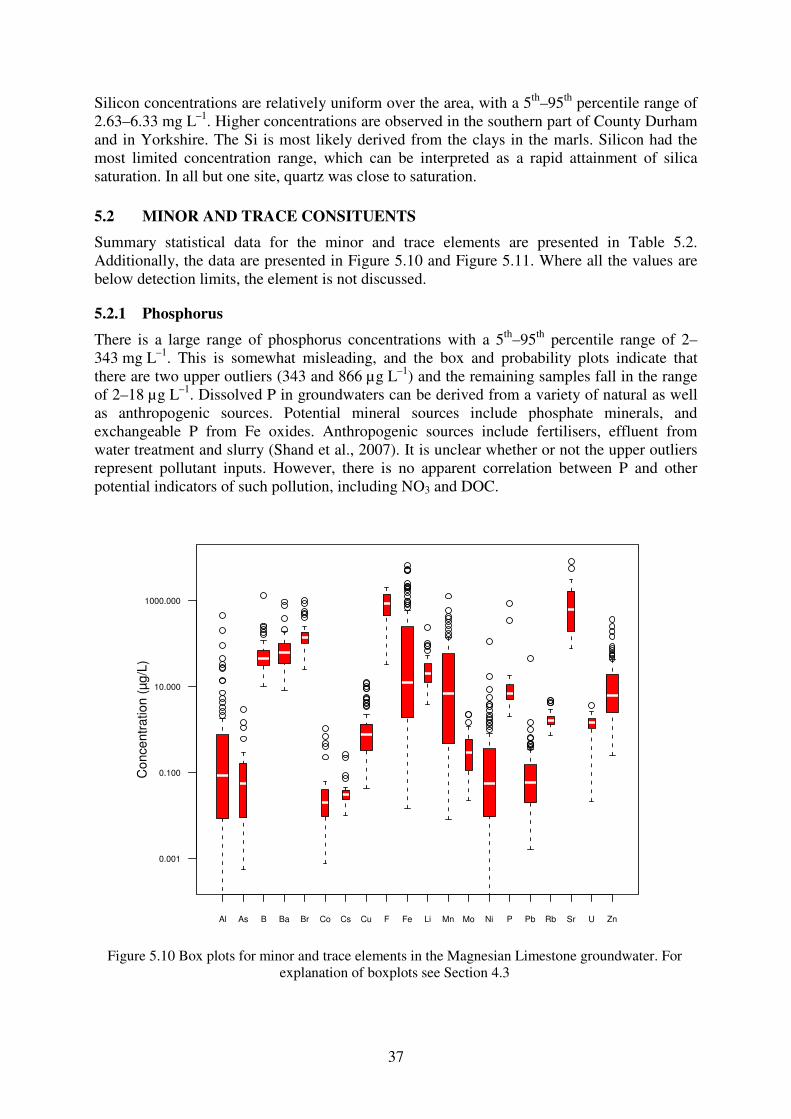
37
Silicon concentrations are relatively uniform over the area, with a 5th–95th percentile range of 2.63–6.33 mg L–1. Higher concentrations are observed in the southern part of County Durham and in Yorkshire. The Si is most likely derived from the clays in the marls. Silicon had the most limited concentration range, which can be interpreted as a rapid attainment of silica saturation. In all but one site, quartz was close to saturation.
5.2 MINOR AND TRACE CONSITUENTS
Summary statistical data for the minor and trace elements are presented in Table 5.2. Additionally, the data are presented in Figure 5.10 and Figure 5.11. Where all the values are below detection limits, the element is not discussed.
5.2.1 Phosphorus
There is a large range of phosphorus concentrations with a 5th–95th percentile range of 2–343 mg L–1. This is somewhat misleading, and the box and probability plots indicate that there are two upper outliers (343 and 866 µg L–1) and the remaining samples fall in the range of 2–18 µg L–1. Dissolved P in groundwaters can be derived from a variety of natural as well as anthropogenic sources. Potential mineral sources include phosphate minerals, and exchangeable P from Fe oxides. Anthropogenic sources include fertilisers, effluent from water treatment and slurry (Shand et al., 2007). It is unclear whether or not the upper outliers represent pollutant inputs. However, there is no apparent correlation between P and other potential indicators of such pollution, including NO3 and DOC.
Al As B Ba Br Co Cs Cu F Fe Li Mn Mo Ni P Pb Rb Sr U Zn
0.001
0.100
10.000
1000.000
Concentr
ation (
µg/L
)
Figure 5.10 Box plots for minor and trace elements in the Magnesian Limestone groundwater. For explanation of boxplots see Section 4.3
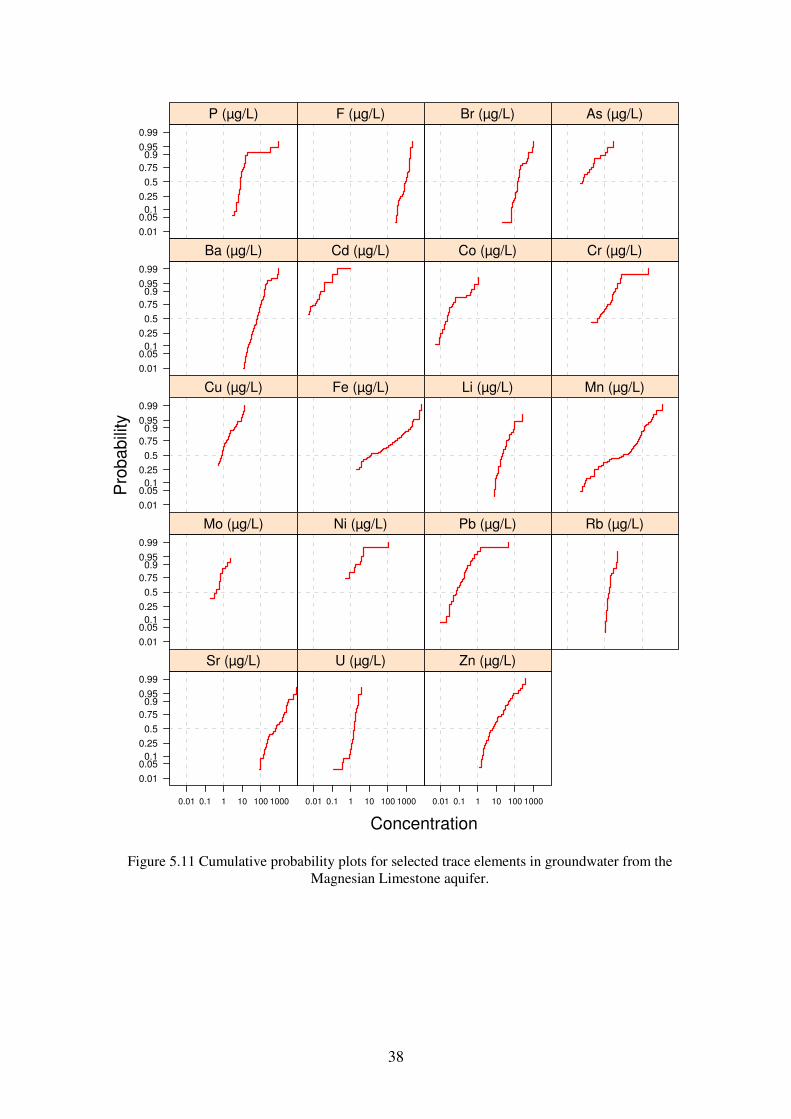
38
Concentration
Pro
ba
bili
ty
0.01
0.050.1
0.25
0.5
0.75
0.90.95
0.99
P (µg/L) F (µg/L) Br (µg/L) As (µg/L)
0.01
0.050.1
0.25
0.5
0.75
0.90.95
0.99
Ba (µg/L) Cd (µg/L) Co (µg/L) Cr (µg/L)
0.01
0.050.1
0.25
0.5
0.75
0.90.95
0.99
Cu (µg/L) Fe (µg/L) Li (µg/L) Mn (µg/L)
0.01
0.050.1
0.25
0.5
0.75
0.90.95
0.99
Mo (µg/L) Ni (µg/L) Pb (µg/L) Rb (µg/L)
0.01
0.050.1
0.25
0.5
0.75
0.90.95
0.99
0.01 0.1 1 10 100 1000
Sr (µg/L)
0.01 0.1 1 10 100 1000
U (µg/L)
0.01 0.1 1 10 100 1000
Zn (µg/L)
Figure 5.11 Cumulative probability plots for selected trace elements in groundwater from the Magnesian Limestone aquifer.

39
Table 5.2 Statistical summary of data for minor and trace elements.
units n n(c) min mean max P0 P5 P25 P50 P75 P90 P95 Ag µg/L 36 36 <0.05 <0.05
Al µg/L 104 83 <0.5 9.17 451 4.47×10⁻⁴ 4.00×10⁻⁴ 0.009 0.086 0.758 5.01 27.6
As µg/L 36 17 <0.05 0.249 2.96 0.05 0.15 0.61 1.46
B µg/L 102 59 <100 70.2 1320 10.4 17.6 31.7 45 69.7 104 161
Ba µg/L 104 0 8 90.4 939 16.1 34 62 100 160 177
Be µg/L 36 36 <0.01 <0.01
Br mg/L 36 1 <0.02 0.215 1.02 0.048 0.099 0.135 0.182 0.519 0.865
Cd µg/L 104 87 <0.005 0.193
Ce µg/L 36 30 <0.002 0.008
Co µg/L 36 4 <0.005 0.098 1.07 0.009 0.019 0.038 0.415 0.686
Cr µg/L 103 51 <0.2 3.26 222 0.2 1.39 2.77 4.9
Cs µg/L 36 0 0.01 0.044 0.262 0.014 0.023 0.031 0.039 0.073 0.22
Cu µg/L 104 35 <0.5 1.58 12.5 0.786 1.34 3.6 5.69
Dy µg/L 36 36 <0.002 <0.002
Er µg/L 36 36 <0.002 <0.002
Eu µg/L 36 2 <0.002 0.01 0.105 0.004 0.006 0.01 0.015 0.018
F mg/L 36 0 0.033 0.928 2.09 0.271 0.409 0.824 1.39 1.57 1.69
Fe µg/L 109 44 <2 444 6520 10 247 1560 2200
Ga µg/L 36 36 <0.05 <0.05
Gd µg/L 36 36 <0.002 <0.002
Ge µg/L 36 4 <0.01 0.539 5.68 0.04 0.2 0.64 1.33 1.41
Hf µg/L 36 31 <0.01 0.05
Ho µg/L 36 36 <0.002 <0.002
La µg/L 36 28 <0.002 0.00115 0.012 1.33×10⁻⁵ 3.01×10⁻⁵ 0.000118 0.000348 0.00104 0.0025 0.00425
Li µg/L 36 0 3.94 34.5 243 7.97 12.5 19.6 33.9 87.6 99.8
Lu µg/L 36 35 <0.002 0.003
Mn µg/L 109 35 <0.05 59.3 1290 0.05 0.28 8.04 58.1 136 270
Mo µg/L 36 14 <0.2 0.508 2.3 0.3 0.6 1.2
Nb µg/L 36 36 <0.05 <0.05
Nd µg/L 36 33 <0.004 0.006
Ni µg/L 104 93 <0.5 112
P µg/L 36 0 2 40.8 866 2 5 7 10 15 343
Pb µg/L 104 63 <0.01 0.56 45 0.00165 0.005 0.02 0.059 0.152 0.324 0.48
Pr µg/L 36 36 <0.002 <0.002
Rb µg/L 36 0 0.74 1.94 4.81 1.02 1.31 1.6 2.02 4.18 4.73
Sb µg/L 36 14 <0.01 0.02 0.11 0.01 0.02 0.05 0.08
Sm µg/L 36 35 <0.002 0.009
Sn µg/L 36 36 <0.5 <0.5
Sr µg/L 36 0 78 1230 8330 89 190 593 1640 2620 5650
Ta µg/L 36 36 <0.05 -0.05
Tb µg/L 36 36 <0.002 <0.002
Th µg/L 36 35 <0.02 0.031
Ti µg/L 36 33 <0.05 0.08
Tl µg/L 36 12 <0.01 0.064 0.269 0.017 0.074 0.211 0.253
Tm µg/L 36 36 <0.002 <0.002
U µg/L 36 0 0.021 1.5 3.7 0.118 1.04 1.47 1.75 2.45 2.6
V µg/L 36 32 <0.1 1.64
W µg/L 36 34 <0.1 0.129
Y µg/L 36 36 <0.05 <0.05
Yb µg/L 36 35 <0.002 0.007
Zn µg/L 104 36 <5 21.7 372 1.2 2.6 6.2 19.3 44.6 77.2
Zr µg/L 36 34 <0.05 0.126
P= percentile; n(c) = number censored; min and max are observed values

40
5.2.2 Halogen elements
Fluoride concentrations in rainfall are generally low, so the dominant inputs tend to be from interactions with the minerals within the aquifer. The 5th–95th percentile range is 0.271-1.69 mg L–1 and several samples are close to or exceed the national drinking-water limit of 1.5 mg L–1 (OPSI, 2000).
It is most likely that the source of F originates in the recrystallised remains of marine fossils in the form of fluorapatite. There is no correlation between Ca and F (r2 = 0.06), whereas Na and F are weakly correlated (r2 = 0.2). The highest concentrations of F appear in the east (see Figure 5.12), although there are limited data in the west to confirm this apparent association with the younging of the strata.
Data presented by Harrison (1993) indicated a source of F within the Magnesian Limestone aquifer (388–1054 mg kg–1 F in four analyses of dolomite). The Magnesian Limestone groundwaters are understaturated with respect to fluorite, although groundwater samples from
Figure 5.12 Regional distribution of F and Br within the Magnesian Limestone aquifer

41
two sites, both within the Yorkshire Province, are close to saturation.
The 5th–95th percentile range of Br is 48–865 µg L–1, which is a typical range for UK groundwaters (Edmunds, 1996). The baseline sources of Br tend to be from rainfall or organic matter (Shand et al., 2007). The box plot and probability plot (Figure 5.10 and Figure 5.11 respectively) show that there is a lower outlier, where one value is below the detection limit, and five upper outliers. This distribution is similar to that for Cl. Indeed, the geochemistry of Br is often very similar to Cl, and there is a strong correlation between Br and Cl (r2 0.93).
The ratio of Br/Cl can be a useful indicator of the source of salinity (Edmunds, 1996). An enrichment in Br/Cl over seawater has been found in brines of the NE England coalfield, and brines depleted relative to seawater (3.47 × 10⁻³) have been associated with water derived from Permian sediments. This is probably caused by the reaction with halite, which is Br-depleted (Edmunds, 1996). With the exception of the one site where Br was below the detection limit, the Br/ Cl ratios range between 2.34 × 10⁻³ and 6.13 × 10⁻³. Half of these are enriched above the seawater value. Unfortunately, Br data are not available for the whole study area. In particular, no Br determinations are available for the eastern area of the County Durham outcrop. This makes it difficult to determine spatial relationships, although in general the Br/Cl is higher in County Durham, which may be affected by brines from the NE England coalfield (Figure 5.12).
5.2.3 Alkaline earth elements
Barium has a wide range of concentrations with a 5th–95th percentile range of 16.1–177 µg L–1 and a median of 62 µg L–1. Groundwater from carbonate aquifers typically has relatively low concentrations of Ba. Carboniferous Limestone groundwaters have been found to be comparable with those from the Magnesian Limestone aquifer (Edmunds et al., 1989, cited in Shand et al., 2007). The most likely limiting control on Ba in most groundwaters is saturation with respect to barite (BaSO4) (Hem, 1992), as the solubility product is 10-9.97 (Drever, 1997). Sulphate concentrations of 10 or 100 mg L–1 would limit Ba concentration in solution to 140 µg L–1 or 14 µg L–1 respectively (Hem, 1992). Around half the newly-sampled groundwaters are saturated with respect to barite. There is no clear spatial distribution of the saturated groundwaters and SO4. There are few diffuse sources of anthropogenically-derived Ba and given the similarities to the Carboniferous Limestone concentrations reported in Shand et al (2007), the range is taken to represent baseline compositions.
Strontium is a fairly common trace element, with a similar chemistry to Ca (Hem, 1992). The 5th–95th percentile range in the groundwaters of the Magnesian Limestone aquifer is 89–5650 µg L–1. Highest concentrations occur in the Yorkshire Province; lower concentrations are found in the south-east of County Durham and the lowest concentrations observed are in the north (Figure 5.13). In County Durham, the highest concentrations are found in groundwaters from Hartlepool, likely as a result of saline intrusion.
The ratio of Sr/Ca has been taken as an indication of groundwater residence time. In the study area, the ratio generally increases towards the east (Figure 5.13), a distribution which supports the eastwards increase in groundwater residence time with flow direction.
5.2.4 Alkali metals
The 5th–95th percentile range of Li in the Magnesian Limestone aquifer is 7.97–99.8 µg L–1. The median is 19.6 µg L–1, and a few higher concentrations skew the mean to 24.5 µg L–1. Such a wide spread of concentrations is not unusual for UK groundwaters (Shand et al., 2007) as it is a mobile trace element and not readily sorbed (Hem, 1992).
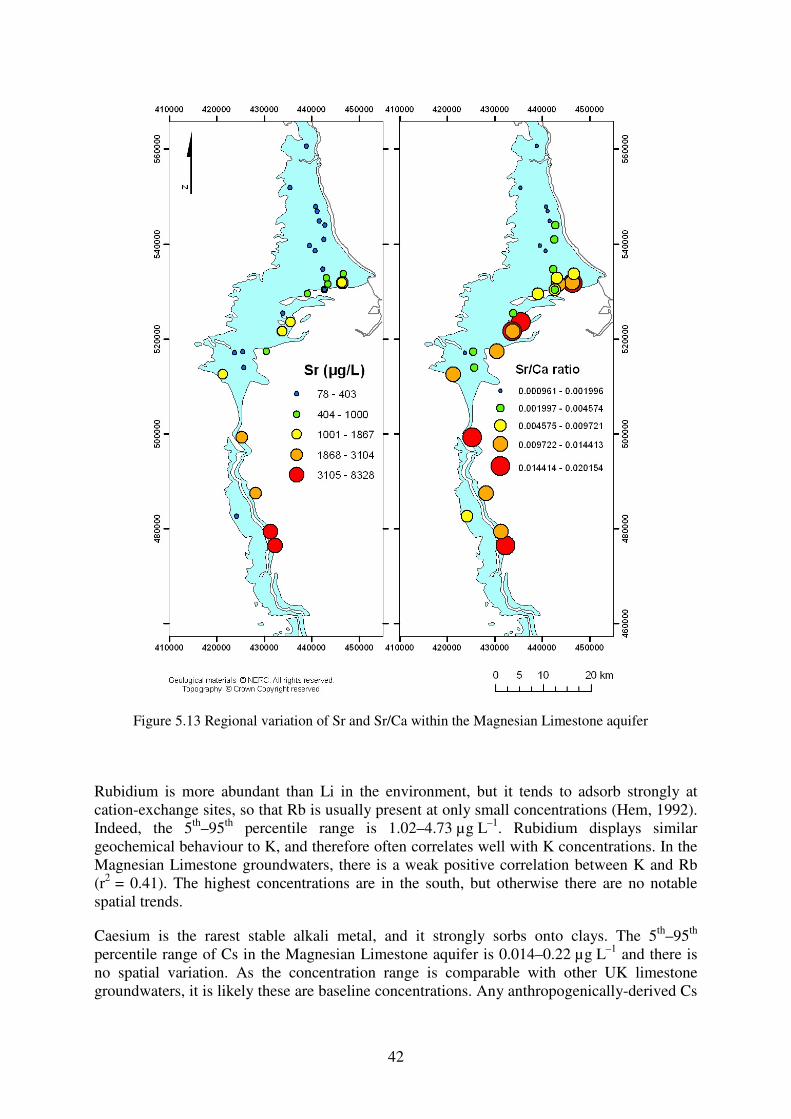
42
Rubidium is more abundant than Li in the environment, but it tends to adsorb strongly at cation-exchange sites, so that Rb is usually present at only small concentrations (Hem, 1992). Indeed, the 5th–95th percentile range is 1.02–4.73 µg L–1. Rubidium displays similar geochemical behaviour to K, and therefore often correlates well with K concentrations. In the Magnesian Limestone groundwaters, there is a weak positive correlation between K and Rb (r2 = 0.41). The highest concentrations are in the south, but otherwise there are no notable spatial trends.
Caesium is the rarest stable alkali metal, and it strongly sorbs onto clays. The 5th–95th percentile range of Cs in the Magnesian Limestone aquifer is 0.014–0.22 µg L–1 and there is no spatial variation. As the concentration range is comparable with other UK limestone groundwaters, it is likely these are baseline concentrations. Any anthropogenically-derived Cs
Figure 5.13 Regional variation of Sr and Sr/Ca within the Magnesian Limestone aquifer

43
would largely be expected to adsorb in the soil zone and not reach the saturated zone (Shand et al., 2007).
5.2.5 Iron and manganese
Iron and Mn show broadly similar geochemical behaviour as they are both redox-sensitive and their abundance and speciation are dependent on Eh-pH conditions. Iron exists in solution as Fe(II) (reduced) and Fe (III) (oxidised) forms. Iron oxides are soluble under moderately reducing and acidic conditions. Under oxidising conditions Fe(III) prevails. At circum-neutral pH it forms insoluble Fe oxyhydroxides, although in acidic oxic conditions (<pH 3, pe>12) Fe3+ can be stable in solution (Drever, 1997). Oxidised Fe is also mobile as an organic compound complexed up to pH values of ca. 6. (Langmuir, 1997).
Figure 5.14 Regional distribution of Fe and Mn within the Magnesian Limestone aquifer. <DL indicates sites below detection limit. The grey circles indicate a detection limit (stated in
parentheses) which exceeds measured analyses

44
Iron concentrations in the Magnesian Limestone groundwater range from below detection limit (<2 µg L–1) to 6500 µg L–1. The spatial distribution of the dataset as a whole does not correspond clearly to Eh (Figure 5.14), although a lack of Eh data and multiple detection limits makes this comparison difficult. The Fe concentrations that are below detection limit are evenly spread across the Magnesian Limestone outcrop. The highest concentrations are found around Hartlepool and the central part of County Durham. Many of the highest concentrations are found ca. 5 km south of Ferryhill [NZ 29 32], in the area affected by minewater rebound (Box 3.2). The rising waters in this area are known to have reacted with residues from the oxidative weathering of pyrite, which can give rise to increased concentrations of Fe and SO4.
Where both Fe and Eh data are available, the sites with the lowest Eh values have the highest Fe concentrations, and there is a negative correlation between Eh and Fe concentration (r2 = 0.53). Where Eh values exceed 300 mV, only one site has an Fe concentration above 10 µg L-1. This is due to the low solubility of Fe oxides under the oxic conditions.
Manganese is 50 times less abundant in nature than Fe, and exists in two main oxidation states: Mn(II) and Mn(IV). Under reducing conditions, dissolved Mn will occur as Mn2+, but in contrast to Fe, dissolved Mn remains stable under mildly oxidising conditions. Under more oxidising conditions Mn precipitates as Mn oxide (Shand et al., 2007).
The Mn concentration ranges from <0.05 µg L–1 to 1.2 mg L–1 and has a similar distribution to that of Fe (Figure 5.14). A number of groundwaters have concentrations below detection limits, one of which exceeds the concentrations of some of the measured data. The highest concentrations are also ca. 5 km south of Ferryhill.
5.2.6 Rare earth elements
Most of the La concentrations are below detection limit. The measurable concentrations range from 0.002 to 0.012 µg L–1. Additionally, there are measurable concentrations around Dalton Piercy, Hartlepool, and Archdeacon Newton.
Only six out of 36 sites have measurable Ce concentrations. The measurable concentrations range between 0.002 and 0.008 µg L–1 and, except for one site near Archdeacon Newton [NZ 25 17], are found in Yorkshire. Concentrations of Nd are generally below detection limit. Two out of the three measurable concentrations are also in Yorkshire. Europium is measurable in all but two of the samples. Measureable Eu concentrations are in the range 0.002–0.105 µg L–1. The cluster of highest concentrations is found around Archdeacon Newton. There are no spatial trends. Samarium, Yb and Lu were also detected at the site near Archdeacon Newton [NZ 25 17], at concentrations of 0.009, 0.007, and 0.003 µg L–1 respectively. The reason for the relatively high concentrations at this site is unclear: the pH value was near-neutral (7.40). It is possible that the REE are associated with colloidal material in the sample. This is supported by the observation that concentrations of Fe, Mn and Al were relatively high in the sample.
5.2.7 Other trace elements
The concentrations of Al are mostly below the detection limit (<0.5 µg L–1). There are a few measurable values in the south and east of the aquifer, which range up to 451 µg L–1. Aluminium is present at typically low concentrations in carbonate groundwaters because aluminosilicate minerals are poorly soluble at circum-neutral pH. As noted above however, some Al may be present in the colloidal fraction (<0.2 µm) of the sampled groundwaters.
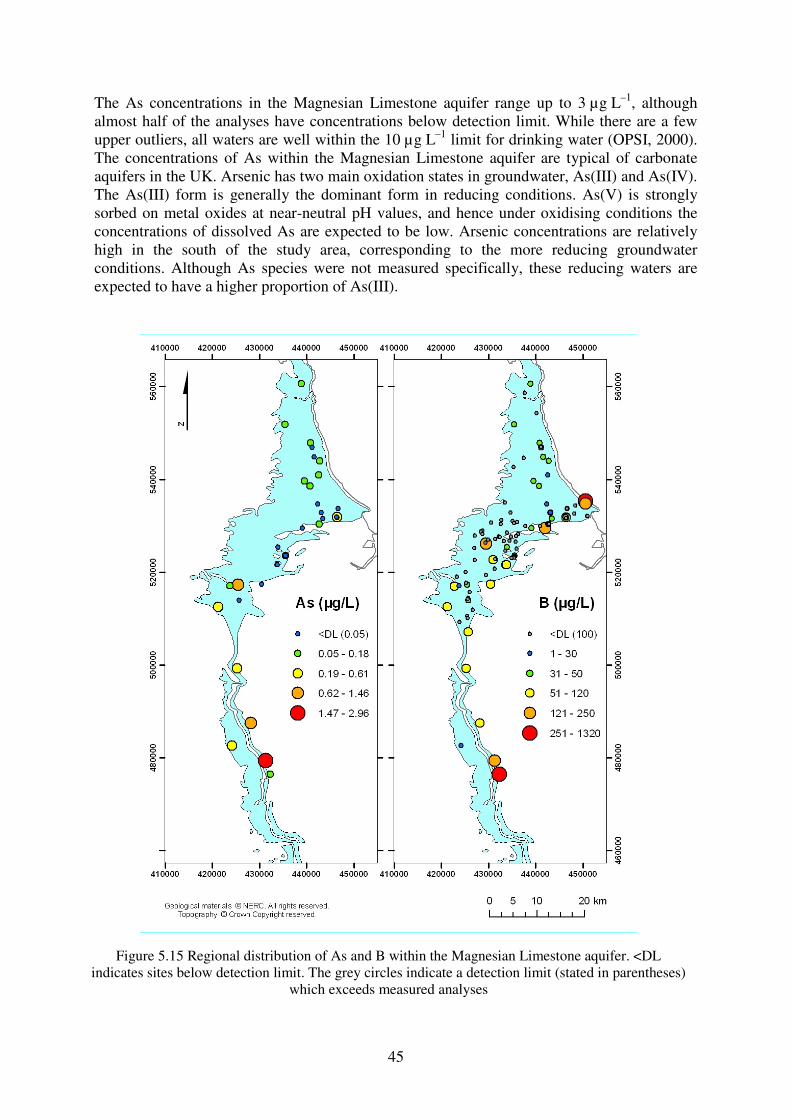
45
The As concentrations in the Magnesian Limestone aquifer range up to 3 µg L–1, although almost half of the analyses have concentrations below detection limit. While there are a few upper outliers, all waters are well within the 10 µg L–1 limit for drinking water (OPSI, 2000). The concentrations of As within the Magnesian Limestone aquifer are typical of carbonate aquifers in the UK. Arsenic has two main oxidation states in groundwater, As(III) and As(IV). The As(III) form is generally the dominant form in reducing conditions. As(V) is strongly sorbed on metal oxides at near-neutral pH values, and hence under oxidising conditions the concentrations of dissolved As are expected to be low. Arsenic concentrations are relatively high in the south of the study area, corresponding to the more reducing groundwater conditions. Although As species were not measured specifically, these reducing waters are expected to have a higher proportion of As(III).
Figure 5.15 Regional distribution of As and B within the Magnesian Limestone aquifer. <DL indicates sites below detection limit. The grey circles indicate a detection limit (stated in parentheses)
which exceeds measured analyses

46
There are no obvious sources of anthropogenic contamination within the study area. A lack of available trace-element data in the western part of the aquifer, including the area of the Durham coalfield, means that it is not possible to determine the concentration of As in the groundwaters affected by minewater recharge.
There is a wide range of B concentrations. Almost half the determinations are below detection (<100 µg L–1) although the measurable B ranges from 14–259 µg L–1. The dataset contains multiple detection limits for B determinations, dependent on the laboratory data source. The BGS data had a detection limit of 3 µg L–1 and all of the samples analysed had detectable B. The EA data had a detection limit of 100 µg L–1 which exceeds the concentration of some of the BGS observations. The highest concentrations of B occur near the coast at Hartlepool, around 5 km south of Ferryhill and to the south of the Yorkshire area (Figure 5.15). A combination of factors is likely to be responsible for this distribution, including mixing with seawater in the coastal Hartlepool area, contamination from mine drainage in the Ferryhill area and dissolution of gypsum further south in Yorkshire.
Most of the Cd determinations are below detection limits (<0.005, <0.1, or <1 µg L–1). The measurable concentrations are in the range 0.005–0.193 µg L–1 and have no particular spatial trend. The concentrations are typical of limestone groundwaters in the UK, and can be considered likely to represent baseline compositions.
The concentrations of Co range from below detection limit (<0.002 µg L–1) to 1.07 µg L–1. Most of the analyses are below 0.6 µg L–1. The highest concentration is from a site near Dalton Piercy [NZ 46 31], although samples taken from other boreholes at this locality are all below detection limit. There is no clear spatial distribution, and the maximum value is well within the range of Co in UK aquifers (up to 10 µg L–1) (Shand et al., 2007).
Around half the Cr determinations are below detection limit. The highest value is 222 µg L–1, and the second highest 7.73 µg L–1. A median value of 0.2 µg L–1 is less than the UK-wide typical median of 1 µg L–1. The highest concentration is also found at a site near Dalton Piercy [NZ 46 31], while the other boreholes at this location contain <1 µg L–1 Cr. This suggests there may be some contamination in the groundwater. This is supported by the prominent deflection in the cumulative-probability distribution at the upper end of the concentration range (Figure 5.11). The anomalous concentrations may be derived from contamination from the borehole metalwork.
Copper has a median concentration of 0.8 µg L–1 and ranges from <0.5 to 12.5 µg L–1. There is no clear spatial distribution, but there is a cluster of higher values (4–12.5 µg L–1) to the east of Darlington. These surround the junction of the A1M and the A66M. It is possible that this increased concentrations is derived from road traffic pollution (brake dust), which is rich in Cu (Thorpe and Harrison, 2008). However, there are some low concentrations (<2 µg L–1) in this same area. The high concentrations of Cu could also be naturally derived, for example from metal oxides (Figure 5.16).
Germanium is a relatively rare element in the Earth’s crust and concentrations are generally low in most terrestrial geological materials (Bernstein, 1985). In most UK groundwaters, it occurs at concentrations <1 µg L–1 and median concentrations are mostly below detection limits. In the Magnesian Limestone groundwaters, only four out of 36 sites have concentrations below detection. These are all found along the south-western boundary of the Magnesian Limestone outcrop. The majority of the Ge is found in the north of the area. It is possible that the Ge in the groundwaters is derived from coalmine drainage as coal is known to be enriched in Ge (Bernstein, 1985). Additionally it can be precipitated with Fe oxides and hydroxides (Bernstein, 1985) and the highest Ge concentration is found in a reducing water where the dissolved Fe concentration is high.

47
Almost one third of the Mo concentrations are below detection limit. Of the remainder, the highest is 2.3 µg L–1. Highest concentrations are found at sites near Dalton Piercy [NZ 46 31] and Archdeacon Newton [NZ 25 17]. The lowest observed values and non-detects tend to be in the north, and the measureable concentrations are in the south-east of County Durham and Yorkshire (Figure 5.16). The concentrations are well within the normal range for UK groundwater (Smedley et al., 2008).
Nickel concentrations were also mostly below detection limit. Measurable concentrations ranged from 0.6–113 µg L–1. At a site near Dalton Piercy [NZ 46 31], three of five boreholes had measurable Ni, ranging from 0.8–112.5 µg L–1. The sites with measurable Ni were all in the south of the study area.
Over half the Pb determinations were below detection limit, although with two detection limits, the results can be ambiguous as measurable determinations from one source are well
Figure 5.16 Regional distribution of Cu and Mo within the Magnesian Limestone aquifer. <DL indicates sites below detection limit. The grey circles indicate a detection limit (stated in parentheses)
which exceeds measured analyses
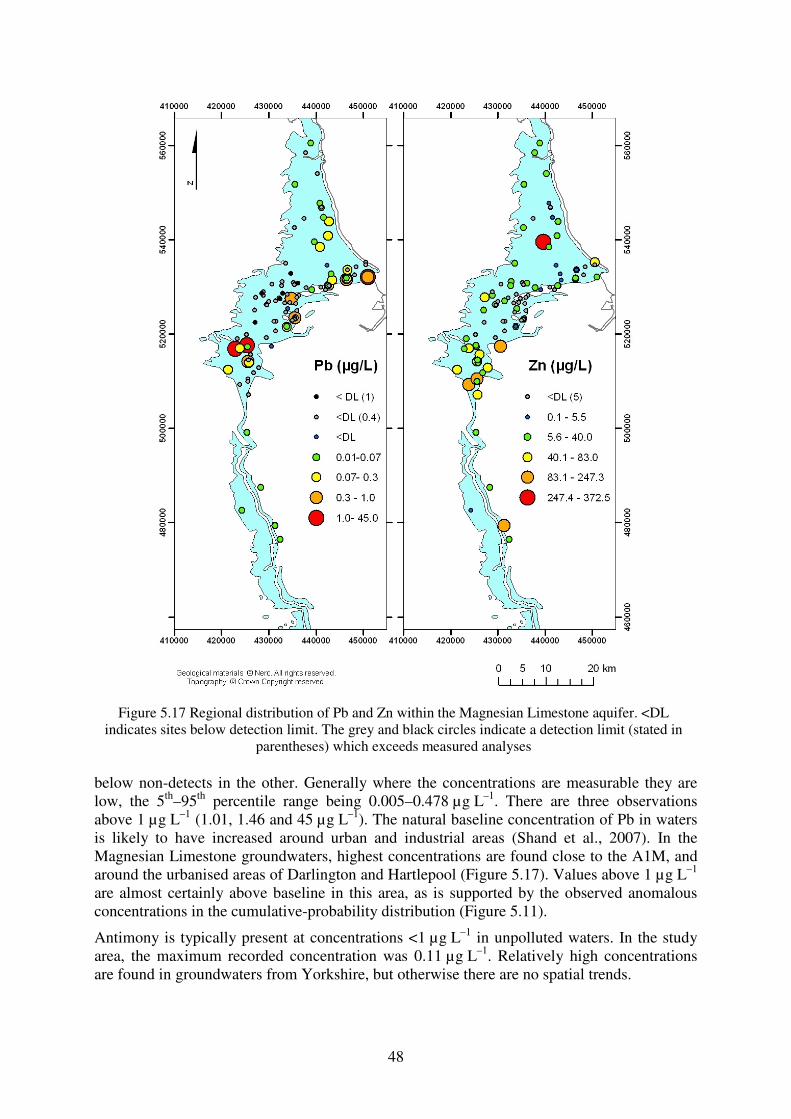
48
below non-detects in the other. Generally where the concentrations are measurable they are low, the 5th–95th percentile range being 0.005–0.478 µg L–1. There are three observations above 1 µg L–1 (1.01, 1.46 and 45 µg L–1). The natural baseline concentration of Pb in waters is likely to have increased around urban and industrial areas (Shand et al., 2007). In the Magnesian Limestone groundwaters, highest concentrations are found close to the A1M, and around the urbanised areas of Darlington and Hartlepool (Figure 5.17). Values above 1 µg L–1 are almost certainly above baseline in this area, as is supported by the observed anomalous concentrations in the cumulative-probability distribution (Figure 5.11).
Antimony is typically present at concentrations <1 µg L–1 in unpolluted waters. In the study area, the maximum recorded concentration was 0.11 µg L–1. Relatively high concentrations are found in groundwaters from Yorkshire, but otherwise there are no spatial trends.
Figure 5.17 Regional distribution of Pb and Zn within the Magnesian Limestone aquifer. <DL indicates sites below detection limit. The grey and black circles indicate a detection limit (stated in
parentheses) which exceeds measured analyses

49
Likewise, the concentrations of Tl are universally low. A third of the samples are below detection limit and the remainder are below 0.3 µg L–1. Where Tl is measurable, it is most concentrated in southern and eastern parts of the County Durham outcrop. This area is relatively urbanised and pollution sources may have had an effect on the concentrations.
The 5th–95th percentile range for U is 0.12–2.6 µg L–1 and the median is 1.5 µg L–1. Almost two thirds of the data are between 1–2 µg L–1 U. In comparison, median U concentrations in other UK limestone aquifers is 0.6 µg L–1 (after Smedley et al., 2006). The range of U concentrations is narrow and the spatial distribution is even. Uranium mobilisation is strongly controlled by its redox state. It is usually only the oxidised form (U(VI)) that occurs significantly in solution (Smedley et al., 2006). Where there are reducing conditions, the concentration of U is generally low. In this study, the lowest concentrations (<1 µg L–1) of U occurred at sites where the Eh was <300 mV. Uranium occurs naturally in soils and rock-forming minerals (Smedley et al., 2006). Uranium substitutes readily for Ca2+ in the calcite and dolomite crystal lattice (Bonotto and Andrews, 2000) and can be enriched in phosphate minerals (Smedley et al., 2006). Potential sources in the Magnesian Limestone therefore include carbonate minerals as well as phosphate minerals in the marl horizons. It is unlikely that the observed concentrations of U are impacted significantly by anthropogenic inputs.
Zinc has a fairly large range of concentrations as indicated on the box plot and cumulative- probability plot (Figure 5.10, Figure 5.11) and has a 5th–95th percentile range of 1.2–77.2 µg L–1. The highest concentration (372 µg L–1) is found at an industrial site near Peterlee. Zinc concentrations can be high in proximity to galvanised power cables and pylons (Alhiyaly et al., 1993; Bendomir and Jones, 1998; Smolders et al., 2004) and it is possible that this is a localised source of groundwater contamination. An alternative potential source could be borehole metalwork. Besides this industrial site, sources with Zn concentrations above the 95th percentile value are found to the south of Darlington (Figure 5.17).
5.3 SITES OF PARTICULAR INTEREST
Two sites are of particular interest as they contain elevated concentrations of many trace elements. Groundwater from the borehole near Dalton Piercy [NZ 46 31] has high concentrations of Fe (571 µg L–1), Co (1.07 µg L–1), Cr (221.7 µg L–1), Cu (2.1 µg L–1) and Ni (112.5 µg L–1) and relatively high concentrations of Hf (0.05 µg L–1), Mo (2.3 µg L–1), Th (0.031 µg L–1) and W (0.129 µg L–1). It is interesting to note that other boreholes in close proximity do not exhibit such elevated concentrations. This suggests that there may be some contamination, likely derived from the borehole metalwork, in the groundwater.
A site near Archdeacon Newton [NZ 25 17] has particularly high concentrations of Fe (1270 µg L–1) and Mn (145 µg L–1) and relatively high concentrations of REE (e.g. La 0.012 µg L–1), As (1.46 µg L–1), Co (0.69 µg L–1) and Mo (2.3 µg L–1). These are likely to be naturally-derived in this the most reducing of the newly sampled sites (Eh 90 mV).
One site near Masham [SE 24 82] represents the only sample in the Yorkshire Province taken along the western edge of the outcrop. Groundwater from this site appears to have very distinct water chemistry with very low specific electrical conductance (203 µS cm–1) and alkalinity (56 mg L–1 as HCO3). It also has very low concentrations of the major ions (Ca: 30.1 mg L–1, Mg: 2.62 mg L–1, Na: 8.45 mg L–1, K: 0.9 mg L–1, Cl: 10.5 mg L–1, SO4: 40.1 mg L–1) as well as the highest concentration of P in the study (866 µg L–1), and a high Al concentration (27.9 µg L–1). The distinctive unmineralised chemistry is indicative of a shallow, very young groundwater that has limited contact with aquifer minerals. The anomalously high concentration of P is most likely derived from localised domestic pollution as the borehole was located in a private garden.

50
5.4 ISOTOPIC COMPOSITION
Stable oxygen and hydrogen isotope ratios are extremely useful as tracers of physical processes in groundwater and can help to define recharge conditions. (Darling and Talbot, 2003). The rainfall in north-east England is depleted in the heavier isotopes of O and H relative to western parts of the country in response to the Rayleigh fractionation effect: the rain which falls first, over the west of the country, is relatively enriched isotopically (Darling and Talbot, 2003). Measured compositions of δ18O lie in the range -8.51 to -7.75 ‰ with an average of -8.16 ‰. The δ2H has a range of -55.7 to -53.7 ‰, with an average of -53.7 ‰. These values are consistent with compositions of recently recharged (Holocene) groundwaters analysed from north-east England (Darling et al., 2003). The δ18O values are also in agreement with rainfall data from Malaham (ca. 75 km south-east of the Magnesian Limestone aquifer). The average δ18O composition of rainfall over a two-year period was reported by Lawler (1987) to be -7.6 ‰. The relationship between δ18O and δ2H (Figure 5.18) shows a general correspondence with the world meteoric water line, indicating that the groundwaters represent recharged local modern rainfall. The highest observed δ18O and δ2H values are from a site near to the coast, indicating the impact of saline intrusion (Figure 5.19).
The spatial distribution of 13C can be an effective tracer of carbonate evolution (Clark and Fritz, 1997; Darling et al., 2005). Groundwater acquires dissolved inorganic carbon (DIC) through reaction with the carbonate aquifer, with CO2 derived from the overlying soil. The resulting C isotopic composition of the DIC represents a mixture of that of the soil (generally around -23 ‰) and that of the carbonate mineral source (ca. 0 ‰). Over time, excess CO2 is consumed and solution precipitation reactions fractionate the δ13C value towards the isotopic composition of the rock. Hence, more depleted values represent compositions less impacted by carbonate reaction. The compositions in the Magnesian Limestone groundwaters range between -14.5 and -11.7 ‰, with an average of -13.2 ‰. Most of the sites are therefore relatively depleted in δ13C, which suggests limited isotopic equilibration and short residence time. The relatively enriched sites are generally in the east, and the most depleted sites are in the west, reflecting the east to west flow of the groundwater (Figure 5.19).
δ18
O (‰)
-9.0 -8.5 -8.0 -7.5 -7.0
δ2H
(‰
)
-65
-60
-55
-50
-45
WMWL
Figure 5.18 O and H stable isotopic composition of the Magnesian Limestone. WMWL = world
meteroric water line.

51
5.5 CHEMICAL VARIATIONS WITH DEPTH
At the time of writing, no data could be found on groundwater chemical variations with depth.
5.6 TEMPORAL VARIATIONS
Data are available from the EA database with ca. 10 years of analytical results, with a sampling frequency of around twice a year. Where recorded, there are variations in temperature and pH. These follow no distinct temporal trend, as is unsurprising given the dynamic nature of these parameters. Many elemental determinations also show variations in concentration, but display no temporal trend. There are, however, some notable exceptions.
The elements showing temporal changes are mainly major elements: Ca, Cl, Na, K, NO3-N, and Ba, and to a lesser extent B, Fe and Mn. In many sites that show temporal changes in water chemistry, there are corresponding changes in the elements with behavioural similarities, i.e. Na and Cl, Ba and SO4, and Ca and SO4, although this is not always the case. Explanations for temporal changes in element concentrations are attributed to varying influences of mineral solubility, minewater rebound, saline intrusion and agricultural inputs. However, some changes in concentration over time have no clear explanation.
Barium shows a reduction in concentration over time at almost 40 out of 130 sites. Where the concentrations of Ba were high (e.g. 85–100 µg L–1) in the early part of the monitoring the concentrations tend to have fallen by around 20–25% over the 10-year period. Where the concentration is lower (e.g. <30 µg L–1) the concentration tends to have fallen by 30–35%
Figure 5.19 Regional variation of δ18O, δ2H, and δ13C within the Magnesian Limestone aquifer

52
over the 10-year period. The distribution of these sites is spatially irregular. In some cases, decreasing concentrations are accompanied by an increase in SO4 concentration, reflecting barite solubility (see Section 5.2.3). Figure 5.20 shows a decrease in Ba concentration as SO4 increases at a site some 2 km west of Elwick [NZ 43 32]. Not all sites which show a decrease in Ba concentration have an accompanying SO4 increase. In these cases, the cause of the reduction in Ba concentration is unclear.
At six sites, increasing concentrations of both Ca and SO4 are evident over the 10-year period. This could be controlled by increasing dissolution of gypsum, especially in the Yorkshire Province. However, it is interesting to note that of the seven sites monitored by the EA in the Yorkshire Province, where gypsum is known to be abundant, only one shows an increase in Ca and SO4. Aside from the unusual site near Masham discussed in Section 5.3, sites in the Yorkshire Province appear to be close to saturation with respect to gypsum (log SIgypsum values ranging up to -0.1). Again sites with increasing Ca and SO4 concentrations show no spatial pattern. At one site near Sedgefield [NZ 36 30], an observed increase in Ca and SO4 concentrations more likely represents minewater rebound the increases are accompanied by increasing concentrations of Na and, albeit to a lesser extent, Cl. Nonetheless, there is no evidence of an increase in Fe concentration at this site.
Within the Durham Province, Na and Cl concentrations increase over time at 11 sites and decrease at two. The distribution of the sites is shown in Figure 5.22. The location of the sites where Na and Cl increases implies either saline intrusion or minewater rebound into the Magnesian Limestone aquifer. The limited amounts of associated trace-element data for these sites preclude the distinction between these origins with certainty.
Year
87 88 89 90 91 92 93 94 95 96 97 98 99 00 01 02 03 04
Ba (
µg L
-1)
100
105
110
115
120
125
130
SO
4 (
mg L
-1)
30
40
50
60
70
80
Barium
Sulphate
Figure 5.20 Ba and SO4 concentration over time at a site approximately 3km northwest of Dalton Piercy [NZ 43 32]
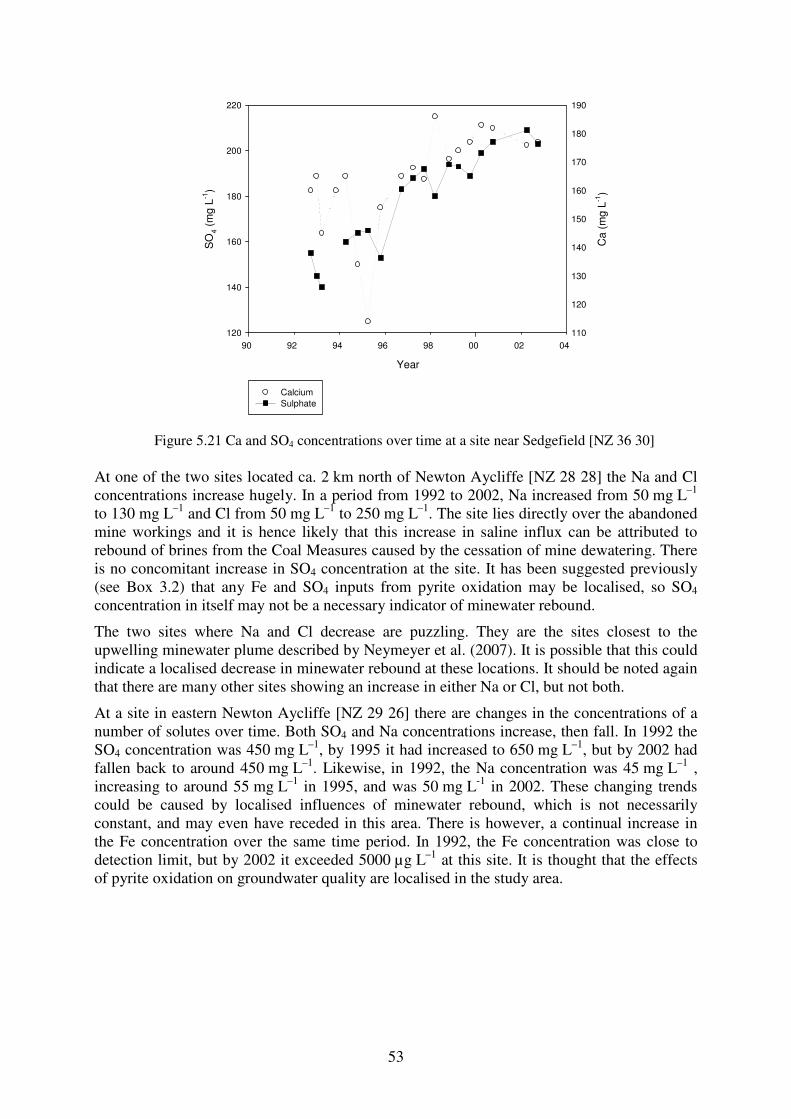
53
At one of the two sites located ca. 2 km north of Newton Aycliffe [NZ 28 28] the Na and Cl concentrations increase hugely. In a period from 1992 to 2002, Na increased from 50 mg L–1 to 130 mg L–1 and Cl from 50 mg L–1 to 250 mg L–1. The site lies directly over the abandoned mine workings and it is hence likely that this increase in saline influx can be attributed to rebound of brines from the Coal Measures caused by the cessation of mine dewatering. There is no concomitant increase in SO4 concentration at the site. It has been suggested previously (see Box 3.2) that any Fe and SO4 inputs from pyrite oxidation may be localised, so SO4 concentration in itself may not be a necessary indicator of minewater rebound.
The two sites where Na and Cl decrease are puzzling. They are the sites closest to the upwelling minewater plume described by Neymeyer et al. (2007). It is possible that this could indicate a localised decrease in minewater rebound at these locations. It should be noted again that there are many other sites showing an increase in either Na or Cl, but not both.
At a site in eastern Newton Aycliffe [NZ 29 26] there are changes in the concentrations of a number of solutes over time. Both SO4 and Na concentrations increase, then fall. In 1992 the SO4 concentration was 450 mg L–1, by 1995 it had increased to 650 mg L–1, but by 2002 had fallen back to around 450 mg L–1. Likewise, in 1992, the Na concentration was 45 mg L–1 , increasing to around 55 mg L–1 in 1995, and was 50 mg L-1 in 2002. These changing trends could be caused by localised influences of minewater rebound, which is not necessarily constant, and may even have receded in this area. There is however, a continual increase in the Fe concentration over the same time period. In 1992, the Fe concentration was close to detection limit, but by 2002 it exceeded 5000 µg L–1 at this site. It is thought that the effects of pyrite oxidation on groundwater quality are localised in the study area.
Year
92 94 96 98 02 04 90 00
Ca
(m
g L
-1)
110
120
130
140
150
160
170
180
190
SO
4 (
mg L
-1)
120
140
160
180
200
220
Calcium
Sulphate
Figure 5.21 Ca and SO4 concentrations over time at a site near Sedgefield [NZ 36 30]

54
There is interest in the increase of NO3-N concentration over time because this is one of the UK’s most widespread groundwater pollutants. Numerous sites in this study show an increase in NO3-N concentrations, but only two, one near Haswell [NZ 35 42] and one 4km north of Ripon [SE 29 75], show an increase sufficient to render the water unfit for drinking without
Figure 5.22 Sites where both Na and Cl concentrations show a change
Year
90 91 92 93 94 95 96 97 98 99 00 01 02 03 04
NO
3-N
(m
g L
-1)
5
6
7
8
9
10
11
Nitrate
Figure 5.23 NO3-N concentration over time at one monitoring site [NZ 35 42]

55
treatment (i.e. exceeding 11.3 mg L–1 NO3-N). At the former site, there has been a notable increase from 6 mg L–1 to over 10 mg L–1 NO3-N over a 10-year period, although data are missing between 1994 and 2000 (Figure 5.23). At the latter site, the concentration increases from 16 mg L–1 to over 20 mg L–1 between 2000 and 2003. Additionally, there are sites which consistently exceed 11.3 mg L–1 NO3-N. At sites where increases in NO3-N concentration occur, increases in K are also observed. The presence of K, a constituent of fertiliser strongly suggests that the NO3-N increases are mainly caused by agricultural inputs.

56
6 Baseline groundwater chemistry
6.1 REGIONAL BASELINE CHARACTERISTICS
The groundwaters in the study area can be divided between the Durham and the Yorkshire Provinces. The geology differs between the two provinces owing to the separation of the depositional environments by the Cleveland High (Cooper and Cornwell, 1995; Smith, 1995a; Cooper and Gordon, 2000). The outcrop rocks in the Durham Province were formed further offshore than those that outcrop in the Yorkshire Province (Allen et al., 1997). The distinctive geology is reflected in the distinct groundwater geochemical characteristics between the two areas. The groundwaters in the Durham Province are predominantly Ca-Mg-HCO3 type, with some mixing towards SO4, Na+K, and Cl. In contrast the Yorkshire groundwaters are most frequently of Ca-HCO3 type and show mixing towards Ca-SO4 type. This is a reflection of the dominance of calcite and greater importance of dolomite in the Durham Province and of gypsum in the Yorkshire Province.
The ‘baseline’ concentrations of the groundwaters in the study area can span several orders of magnitude for some determinands. For others the range is more limited. Both distributions may be a result of entirely natural processes. For most determinands, the 95th percentile has been taken as a first approximation of the upper limit of the baseline composition. This removes any obvious outliers for most elements.
A notable exception to this is NO3-N, for which the 95th percentile, 12.8 mg L–1, is in excess of the drinking-water limit and is highly unlikely to be naturally derived. The earliest date for which NO3-N data are available in the EA dataset at each site ranged from 1987 to 2001. Using the oldest NO3-N analyses in the dataset produced similar summary statistics, with a 95th percentile of 15 mg L–1. The time-series data did not go back far enough to establish NO3-N concentrations prior to intensive farming. It is difficult to assess the likely value of NO3-N in the groundwaters that represent an upper limit of natural concentrations. However the log probability plot (Figure 5.4) shows a stepped pattern that could represent populations equating to denitrified samples at the lowest extreme, through a medium range of concentrations, to polluted groundwaters at the upper extreme. A change in gradient occurs at around 1–3 mg L–1 N which is interpreted as a likely upper baseline limit. This range is consistent with data from the adjacent Triassic Sandstone of the Vale of York (Shand et al., 2002).
Rainfall chemistry is an important control influencing the chemistry of elements such as Cl. It provides an initial input of solutes into the groundwater. Groundwater Cl concentrations are much higher than the evaporated rainfall concentrations shown in Table 3.3. This suggests additional inputs of the solutes, or a higher concentration evaporation effect. The highest concentrations observed are consistent with an additional influence of saline intrusion in the Hartlepool area and minewater rebound in the central area (around Ferryhill).
Typically waters in a carbonate aquifer are dominated by Ca and HCO3. The Magnesian Limestone aquifer is rich in magnesium-rich limestones and dolomites, so both Ca and Mg dominate the cation content of the water. Variations in the dominant water type are dependent on the location. Those within the Yorkshire Province are affected by dissolution of evaporite deposits, particularly gypsum. This means the groundwater in this region is influenced by SO4, and the Ca dominates over the Mg. In the Durham Province there are influences from seawater and coalmine brine recharge. This means there are sites that are influenced by salt water and are dominated by Na and K, and Cl. While these variations depart from a typical carbonate aquifer, with the exception of the minewater brines (see Section 6.2, above), they

57
all represent natural processes and can arguably be considered baseline compositions. It is evident that the Magnesian Limestone groundwater is naturally variable with respect to its major chemical characteristics. This is not surprising, given the complex lithology and chemistry of the strata (see Section 3.1).
Trace elements tend to derive naturally from the varied strata, their distribution being dependent on abundance as well as speciation and local aquifer conditions, including Eh and pH. Observed concentrations in many cases represent baseline compositions but some anomalous concentrations have been linked to contamination, the source of which has been interpreted from geographic location, concentrations of accompanying solutes, local land-use and temporal variability.
There is a large variety in the redox conditions of the groundwater contained within the Magnesian Limestone aquifer. Many of the groundwaters are oxic, but some in the south are reducing with respect to Fe and Mn. Where reducing, for example at the site near Archdeacon Newton [NZ 25 17], a variety of redox-sensitive trace elements, including Fe and Mn, are present at higher concentrations. In contrast, a site with one of the most oxidising groundwaters contains very low concentrations of many trace elements. Iron for example is below detection limit and Mn concentration is well below the median value.
6.2 EXTENT OF ANTHROPOGENIC INFLUENCES
Human impacts are mainly visible in the presence of indicator contaminants such as nitrate from agriculture or trace metals from point-source contamination (urban or industrial sources).
Nitrate pollution is one of the largest problems facing unconfined groundwater in the UK; 60% of groundwater bodies in England may fail to meet the Water Framework Directive requirement of ‘good’ status by 2015 because of high NO3 concentrations (Rivett et al., 2007). The main cause of these high concentrations is the development of intensive agriculture, which uses NO3-rich fertilisers. Nitrate is extremely mobile and, while there are relatively few sites in the study area whose NO3 concentrations exceed the drinking-water limit, there are many more that are increasing, and could exceed this concentration in the future.
Anomalous concentrations of trace elements such as Zn, Cu, Cr, Mo, Mn and Ni can represent contamination from the wellhead pipework. One sample taken from a site near Dalton Piercy [NZ 46 31] is a particular example. This has some of the highest concentrations of these trace elements, yet other boreholes within a hundred meters distance have concentrations of these trace elements which are below detection limits.
While the rebound of saline coalmine water is of natural occurrence, it is the anthropogenic influence, i.e. changing pumping regime, which is responsible for its current upwelling into the Magnesian Limestone aquifer. There is evidence to suggest that a local saline plume exists, although the decrease in Na and Cl concentrations at the sites closest the known upwelling area suggests that the plume may be receding, have become diluted, or the decreases represent localised anomalies.

58
7 Conclusions
While the groundwater from the Magnesian Limestone aquifer of County Durham and North Yorkshire is variable in its natural character, it generally contains good-quality water. The natural baseline compositions of the groundwaters have been characterised by investigation of the statistical distributions in chemistry, mapping of the spatial variability, assessment of temporal changes, and interpretation of the predominant geochemical processes. For many analytes, the 95th percentile of the distributions has been taken as an approximation of an upper limit of baseline concentrations as this serves to eliminate the most extreme outlier concentrations that likely represent a distinct population.
The main properties of the groundwater are determined by rainwater recharge reacting with the carbonate rock and evaporite deposits. Variations in water chemistry are most strongly controlled by aquifer mineralogy. Mineral reactions involving calcite, dolomite and gypsum dominate the groundwater chemistry, resulting in Ca-Mg-HCO3 type waters in County Durham, and a continuum between Ca-HCO3 and Ca-SO4 types in Yorkshire. Reducing groundwaters are found towards the south of the Durham Province and in Yorkshire.
Increased concentrations of dissolved solids have occurred locally as a result of either saline intrusion in coastal areas or minewater rebound around the area of the abandoned Durham coalfield. These processes have both impacted on the quality of the groundwater resource in the aquifer, particularly with respect to potable supply. Saline intrusion is most evident around Hartlepool and careful groundwater management is required to mitigate the scale of the impact. Minewater rebound in the Ferryhill area has given rise to groundwaters with high concentrations of SO4 and Fe as well as Ca, Na and Cl. The original saline waters, derived respectively from evolved seawater and from the underlying Coal Measures are naturally-derived. However, local groundwater flow has been impacted significantly by modern and historical pumping regimes.
The most obvious impacts of anthropogenic inputs are seen in the spatial and temporal variations in NO3 derived mainly from modern intensive farming practices. Concentrations exceed the current drinking-water limit of 11.3 mg L–1 (as NO3-N) at seven of the sites, probably reflecting the intensification of agriculture in the study area over the last few decades. Indeed, the dominant land-use of the area is agriculture (Figure 2.2).
There was no evidence for widespread contamination by potentially harmful trace elements. Of those investigated, the element most frequently exceeding the drinking-water limit was Mn (28% of samples in the dataset had concentrations exceeding 50 µg L–1 and concentrations ranged up to 1300 µg L–1). For most trace elements, elevated concentrations tend to be localised, and probably represent either localised pollution, contamination of the sample from the head workings of the borehole, or are a natural localised anomaly. One sample had anomalously high concentrations of Cr (222 µg L–1) and Ni (113 µg L–1). Another had an anomalous concentration of Pb (45 µg L–1). In each of these cases, the concentrations were above the respective drinking-water limits and would require treatment before use as potable supplies. Concentrations of As range up to 3 µg L–1. Although relatively high compared to most Magnesian Limestone groundwaters, the concentration is well below the national drinking-water limit.
The complex lithology and variable chemistry of the strata mean that sites with groundwaters of a very different chemistry occur in close proximity. Concentrations of Fe, Mn and SO4 are particularly variable and (along with nitrate), potentially the most problematic from a supply point of view. Indeed, personal experiences of farmers using groundwater from the Magnesian Limestone aquifer have been mixed because of the highly variable compositions.

59
While one farmer in the study area owned a borehole with groundwater quality of sufficiently high quality that he was able to exploit and sell the mineral water pumped from his borehole, another encountered livestock health problems caused by the high concentrations of Fe, Mn, and SO4 present.
60
8 References
ABESSER, C, SHAND, P, and INGRAM, J. 2005a. The Carboniferous Limestone of Northern England. British Geological Survey and Environment Agency, BGS Report CR/05/076N; Environment Agency Report NC/99/74/22. ABESSER, C, SHAND, P, and INGRAM, J. 2005b. The Millstone Grit of Northern England. British Geological Survey and Environment Agency, BGS Report CR/05/015N; Environment Agency Report NC/99/74/22. ALHIYALY, S A K, MCNEILLY, T, BRADSHAW, A D, and MORTIMER, A M. 1993. The effect of zinc contamination from electricity pylons - genetic constraints on selection for zinc tolerance. Heredity, Vol. 70, 22-32. ALLEN, D J, BREWERTON, L M, COLEBY, L M, GIBBS, B R, LEWIS, M A, MACDONALD, A M, WAGSTAFF, S, and WILLIAMS, A T. 1997. The physical properties of major aquifers in England and Wales. British Geological Survey, WD/97/34. ANON. 2009. Hartlepool Magnesia Works. APPELO, C A J, and POSTMA, D. 2007. Geochemistry, Groundwater and Pollution, 2
nd Edition.
(Lieden: A. A. Balkema Publishers.) BENDOMIR, A M, and JONES, R. 1998. Zinc tolerance in Wavy Hairgrass, Deschampsia flexuosa growing in acid soil beneath a corroding galvanized electrical transmission tower. Canadian Field-Naturalist, Vol. 112, 536-538. BERNSTEIN, L R. 1985. Germanium geochemistry and mineralogy. Geochimica et
Cosmochimica Acta, Vol. 49, 2409-2422. BONOTTO, D M, and ANDREWS, J N. 2000. The transfer of uranium isotopes U-234 and U-238 to the waters interacting with carbonates from Mendip Hills area (England). Applied
Radiation and Isotopes, Vol. 52. CLARK, I, and FRITZ, P. 1997. Environmental Isotopes in Hydrogeology. (Boca Raton, USA: Lewise Publishers.) COOPER, A H. 1986. Subsidence and foundering of strata casued by the dissolution of Permian gypsum in the Ripon and Bedale areas, North Yorkshire. 127-139. In: The English Zechstein
and Related Topics. HARWOOD, G M, and SMITH, D B (editors). 22. (London: The Geological Society Special Publication). COOPER, A H. 1988. Subsidence resulting from the dissolution of Permian gypsum in the Ripon area; its relevance to mining and water abstraction. 387-390. In: Engineering Geology
of Underground Movements. BELL, F G, CULSHAW, M G, CRIPPS, J C, and LOVELL, M A (editors). 6. (London: Geological Society Engineering Geology Special Publication). COOPER, A H. 1996. Gypsum Karst of Great Britain. International Journal of Speleology, Vol. 25, 195-202. COOPER, A H, and BURGESS, I C. 1993. Geology of the Country around Harrogate. Memoirs of the British Geological Survey. No. Sheet 62 (England and Wales). (London: HMSO.) COOPER, A H, and CORNWELL, J D. 1995. The revision of the Richmond (41) 1:50 000
Provisional Geological Sheet: data sources, interpretation, additional geological and
geophysical information. British Geological Survey Technical Report. No. WA/95/111. COOPER, A H, and GORDON, J. 2000. Revised geological maps of Darlington based on new borehole information: explanation and description. British Geological Survey Technical Report CR/00/94. DARLING, W G, BATH, A H, and TALBOT, J C. 2003. The O & H stable isotope composition of fresh waters in the British Isles. 2. Surface waters and groundwater. Hydrology and Earth
System Sciences, Vol. 7, 183-195.
61
DARLING, W G, MORRIS, B L, STUART, M E, and GOODDY, D C. 2005. Groundwater indicators from public supplies tapping the Chalk aquifer of southern England. Journal of the Chartered
Institution of Water and Environmental Management, Vol. 19, 30-40. DARLING, W G, and TALBOT, J C. 2003. The O & H stable isotope composition of fresh waters in the British Isles. 1. Rainfall. Hydrology and Earth System Sciences, Vol. 7, 163-181. DAVIS, G M, and HORSWILL, P. 2002. Groundwater control and stability in an excavation in Magnesian Limestone near Sunderland, NE England. Engineering Geology, Vol. 66, 1-18. DEARMAN, W R, and COFFEY, J R. 1981. An engineering zoning map of the Permian limestones of NE England. Quarterly Journal of Engineering Geology, London, Vol. 14, 41-57. DREVER, J I. 1997. The Geochemistry of Natural Waters: Surface and Groundwater
Environments, 3rd
Edition. (Upper Saddle River: Prentice-Hall, Inc.) EA. 2009a. A Consultation on the Draft River Basin Management Plan Humber River Basin District, Environment Agency. EA. 2009b. A Consultation on the Draft River Basin Management Plan Northumbria River Basin District, Environment Agency. EDMUNDS, W M. 1975. Geochemistry of brines in the Coal Measures of northeast England. Transactions of the Institution of Mining & Metallurgy Section B: Applied Earth Sciences, Vol. 84, B39-B52. EDMUNDS, W M. 1996. Bromine geochemistry of British groundwaters. Mineralogical
Magazine, Vol. 60, 275-284. ESI. 2009. Northumbrian Magnesian Limestone Aquifer Hydrogeological Conceptual Model. GIBSON, R, BLISS, M, and SHACKLETON, R. 1976. Caves of the Magnesian Limestone. Yorkshire Subterranean Society Journal, Vol. 1, 9-22. GUTIÉRREZ, F, COOPER, A H, and JOHNSON, K S. 2007. Identification, prediction and mitigation of sinkhole hazards in evaporite karst areas. Environmental Geology, Vol. 53, 1007-1022. HARRISON, D J. 1993. High-purity limestones in England and Wales. Quarterly Journal of
Engineering Geology, Vol. 26, 293-303. HELSEL, D. 2005. Nondetects and Data Analysis: Statistics for Censored Environmental Data. (New York: Wiley & Sons.) HEM, J D. 1992. Study and Interpretation of the Chemical Characteristics of Natural Water. (Third Edition edition). US Geological Survey Water-Supply Paper 2254. (Washington: United StatesGovernment Printing Office.) KELLY, W R, and PANNO, S V. 2008. Some considerations in applying background concentrations to ground water studies. Ground Water, Vol. 46, 790-792. KINNIBURGH, D G, and EDMUNDS, W M. 1986. The susceptibility of UK groundwaters to acid deposition. Hydrogeological Report, British Geological Survey No. 86/3. LANGMUIR, D. 1997. Aqueous Environmental Geochemistry. (New Jersey: Prentice-Hall.) LAWLER, H A. 1987. Sampling for isotopic response in surface waters. Earth Surface
Processes and Landforms, Vol. 12, 551-559. LEE, L, and HELSEL, D. 2005a. Statistical analysis of water-quality data containing multiple detection limits: S-language software for regression on order statistics. Computers &
Geosciences, Vol. 31, 1241-1248. LEE, L, and HELSEL, D. 2005b. Baseline models of trace elements in major aquifers of the United States. Applied Geochemistry, Vol. 20, 1560-1570. LEE, L, and HELSEL, D. 2007. Statistical analysis of water-quality data containing multiple detection limits II: S-language software for nonparametric distribution modeling and hypothesis testing. Computers & Geosciences, Vol. 33, 696-704.

62
LEVINSON, A A. 1974. Introduction to Exploration Geochemistry. (Calgary: Applied Publishing Ltd.) MACHEL, H G. 1999. Effects of groundwater flow on mineral diagenesis, with emphasis on carbonate aquifers. Hydrogeology Journal, Vol. 7, 94-107. MARSH, T J, and HANNAFORD, J, (editors), 2008. UK Hydrometric Register. Hydrolgical data UK series. (Wallingford: Centre for Ecology and Hydrology). MILLS, D A C, and HULL, J H. 1976. Geology of the Country Around Barnard Castle. Memoirs of the British Geological Survey. No. Sheet 32 (England and Wales). (London: HMSO.) NEYMEYER, A, WILLIAMS, R T, and YOUNGER, P L. 2007. Migration of polluted mine water in a public supply aquifer. Quarterly Journal of Engineering Geology and Hydrogeology, Vol. 40, 75-84. NRFA. 2008. http://www.nwl.ac.uk/ih/nrfa/station_summaries/op/EA-NorthEast_map.html. OPSI. 2000. The Water Supply (Water Quality) Regulations 2000. Statutory Instrument 2000 No. 3184. POWELL, J H, COOPER, A H, and BENFIELD, A C. 1992. Geology of the Country around Thirsk. Memoirs of the British Geological Survey. No. Sheet 52 (England and Wales). (London: HMSO.) R DEVELOPMENT CORE TEAM. 2005. R: a language and environment for statistical computing. R Foundation for Statistical Computing. RIVETT, M O, SMITH, J W N, BUSS, S R, and MORGAN, P. 2007. Nitrate occurence and attenuation in the major aquifers of England and Wales. Quarterly Journal of Engineering
Geology and Hydrogeology, Vol. 40, 335-352. RUFFELL, A H, HOLLIDAY, D W, and SMITH, D B. 2006. Permian: arid basins and hypersaline seas. 269-293. In: The Geology of England and Wales (2nd edition). BRENCHLEY, P J, and RAWSON, P F (editors). (The Geological Society of London). SHAND, P, EDMUNDS, W M, LAWRENCE, A R, SMEDLEY, P L, and BURKE, S. 2007. The natural (baseline) quality of groundwater in England and Wales. British Geological Survey &
Environment Agency, RR/07/06 & NC/99/74/24. SHAND, P, TYLER-WHITTLE, R, MORTON, M, SIMPSON, E, LAWRENCE, A R, PACEY, J, and HARGREAVES, R. 2002. The Triassic Sandstones of the Vale of York. British Geological
Survey and Environment Agency, BGS Report CR/02/102N; Environment Agency Report NC/99/74/1. SHEPLEY, M G. 2007. Analysis of flows from a large Carboniferous Limestone drainage adit, Derbyshire, England. Quarterly Journal of Engineering Geology and Hydrogeology, Vol. 40, 123-135. SHUMWAY, R H, AZARI, R S, and KAYHANIAN, M. 2002. Statistical approaches to estimating mean water quality concentrations with detection limits. Environmental Science &
Technology, Vol. 36, 3345-3353. SMEDLEY, P L, and ALLEN, D. 2004. The Granites of south-west England. British Geological
Survey and Environment Agency, BGS Report CR/04/255; Environment Agency Report NC/99/74/16. SMEDLEY, P L, COOPER, D M, LAPWORTH, D J, and ANDER, E L. 2008. Molybdenum in British drinking water: a review of sources and occurrence and a reconnaissance survey of concentrations. British Geological Survey, OR/08/051. SMEDLEY, P L, SMITH, B, ABESSER, C, and LAPWORTH, D J. 2006. Uranium occurence and behaviour in British groundwater. British Geological Survey, BGS Report CR/06/050N. SMITH, D B. 1989. The late Permian paleogeography of north-east England. Proceedings of
the Yorkshire Geological Society, Vol. 47, 285-312.

63
SMITH, D B. 1994. Geology of the country around Sunderland. Memoir of the British Geological Survey. No. Sheet 21 (England and Wales). (London: HMSO.) SMITH, D B. 1995a. Marine Permian of England. Geological Conservation Review Series. No. 8. (London: Chapman and Hall.) SMITH, D B. 1995b. Permian and Triassic Rocks [in] Robson's Geology of North East England. 283-295. In: Transactions of the Natural History Society of Northumbria. JOHNSON, G A L (editor). 56. (Newcastle upon Tyne). SMITH, D B, and FRANCIS, E A. 1967. Geology of the Country Between Durham and West
Hartlepool. Memoirs of the Geological Survey of Great Britain. No. 27 (England and Wales). (London: HMSO.) SMITH, D B, HARWOOD, G M, PATTISON, J, and PETTIGREW, T H. 1986. A Revised Nomenclature for Upper Permian Strata in Eastern England. 9-18. In: The English Zechstein
and Related Topics. HARWOOD, G M, and SMITH, D B (editors). Geological Society Special Publication No22. (Oxford: Blackwell Scientific Publications). SMOLDERS, E, BUEKERS, J, OLIVER, I, and MCLAUGHLIN, M J. 2004. Soil properties affecting toxicity of zinc to soil microbial properties in laboratory-spiked and field-contaminated soils. Environmental Toxicology and Chemistry, Vol. 23, 2633-2640. STUART, M E, CHILTON, P J, KINNIBURGH, D G, and COOPER, D M. 2007. Screening for long-term trends in groundwater nitrate monitoring data. Quarterly Journal of Engineering
Geology and Hydrogeology, Vol. 40, 361-376. STUMM, W, and MORGAN, J J. 1996. Aquatic Chemistry: Chemical Equilibria and Rates in
Natural Waters, 3rd
Edition. (New York: John Wiley & Sons, inc.) THORPE, A, and HARRISON, R M. 2008. Sources and properties of non-exhaust particulate matter from road traffic: A review. Science of The Total Environment, Vol. 400, 270-282. TUKEY, J W. 1977. Exploratory Data Analysis. (Reading: Addison-Wesley.) YOUNGER, P L. 1995. Chapter 11: Hydrogeology 353-359. In: Robson's Geology of North
East England (Second edition). JOHNSON, G A L (editor). 56. (Newcastle upon Tyne: Transactions of the Natural History Society of Northumbria). YOUNGER, P L. 2007. Groundwater in the Environment: An Introduction. (Oxford: Blackwell Publishing Ltd.) ZHU, C, and ANDERSON, G. 2002. Environmental Applications of Geochemical Modeling. (Cambridge: Cambridge University Press.)