baseline monitoring of vsp parameters for spring chinook
TRANSCRIPT

Baseline Monitoring of VSP Parameters for Spring Chinook
Salmon and Steelhead Trout Above and Below Project Dams
Cameron SharpeOregon Department of Fish and Wildlife
Willamette Science ReviewJanuary 30 – February 1, 2012

Willamette Biological OpinionHatchery Research, Monitoring, and
Evaluation

– Hatchery RME Activities
– Monitoring hatchery operations and conducting research focused on hatchery programs
– Spawning ground surveys (upstream & downstream of dams),
• Distribution & abundance of redds, carcass sampling, proportion hatchery-origin spawners (PHOS) prespawn mortality, straying, diversity

North Santiam
South Santiam
Middle Fork
McKenzie
Steelhead
Chinook
Steelhead
Chinook
Chinook
Courtesy USACE
Chinook
MolallaSteelhead
CalapooiaSteelhead

VSP Monitoring Guidelines (Crawford and Rumsey 2011)
• VSP Adult Spawner Abundance– Incorporate a robust unbiased adult spawner abundance sampling
design with known precision and accuracy
– Monitor ratio of marked hatchery salmon and steelhead to unmarked natural origin fish in all adult spawner surveys
– Calculate the average coefficient of variation for all adult natural origin spawner databases for ESA populations and provide that information to all interested parties
– Provide adult spawner data with a coefficient of variation (CV) on average of 15% or less for all ESA population
– Conduct a power analysis for each natural population monitored within an ESU to determine the power of the data to detect a significant change in abundance and to provide that information to all interested parties
– Promote standardization of methodologies

VSP Monitoring Guidelines (Crawford and Rumsey 2011)
• VSP Productivity– Develop at least 12 brood years of accurate spawner
information as derived from cohort analysis in order that NOAA can use the geometric mean of recruits per spawner to develop strong productivity estimates
– Obtain estimates of juvenile migrants for at least one significant population for each major population group (MPG) within an ESU or distinct population segment (DPS)
VSP Monitoring Guidelines (Crawford and Rumsey 2011)
• VSP Spatial Distribution –Determine spatial distribution of listed
species with the ability to detect a change in distribution of ± 15% with 80% certainty
VSP Monitoring Guidelines (Crawford and Rumsey 2011)
• VSP Species Diversity – Short term strategy: use species distribution,
spawn timing, age distribution, fecundity, and sex ratios to determine status/trend in species diversity of natural populations
– Long term strategy: Directly monitor genetic diversity (SNPs baseline for each population within each MPG and ESU/DPS)

Additional Monitoring Guidelines (Crawford and Rumsey 2011)
• Threats Due To Hatchery Production – Determine annually the percent hatchery origin spawners
(PHOS) and natural origin spawners (PNOS) for each population. Estimates should be evaluated to determine their precision and ability to detect changes and to determine the trend toward reaching Hatchery and Genetic Management Plan (HGMP) targets
– Periodically calculate proportion of natural influence (PNI) for primary populations within the ESU for supplementation
– Every hatchery should monitor the spatial and temporal distribution of juvenile fish released from the program

Four Ongoing “Uncertainty Research” Projects
• Basinwide genetic diversity of spring Chinook
• Genetic stock identification and relative natural production of Willamette River steelhead
• Hatchery-wild crosses of spring Chinook salmon in the context of reintroduction
• Spring Chinook liberation strategies

Winter-run Steelhead Trout

Upper Willamette Steelhead
DPS

Methods
Video counts at Willamette Falls
Trap counts at Minto (N. Santiam) and Foster Dam (S. Santiam)
Peak redd counts in index reaches

Winter Steelhead Counts and Redd SurveysWillamette
FallsMinto Foster Molalla
North Santiam
South Santiam
Calapooia
1980 16097 1140 515 25.2 8.01981 9004 918 317 20.6 5.51982 6894 207 399 18.1 13.41983 4702 71 200 12.4 31.0 15.4 10.81984 10720 307 1497 17.51985 16043 303 984 24.4 51.6 29.2 15.81986 12776 523 8111987 8222 498 467 33.5 20.7 13.71988 15007 844 1079 21.5 18.1 20.0 12.51989 5361 187 284 17.2 35.0 13.4 5.21990 9229 208 2821991 2722 166 139 10.9 25.5 20.7 8.81992 3679 355 363 14.8 18.4 18.1 3.41993 2725 23 258 4.5 20.4 9.8 1.11994 4275 235 234 18.1 19.4 17.2 4.61995 2702 164 297 7.0 13.0 3.11996 1322 28 131 3.11997 3925 149 337 4.6 15.6 6.1 7.21998 2924 231 359 11.0 21.0 6.5 10.21999 5697 249 328 8.52000 3359 168 326 14.8 6.42001 10752 1156 783 12.9 25.0 23.6 12.72002 11092 436 1002 23.9 12.1 10.02003 6665 173 850 29.7 11.2 13.12004 8087 330 1015 31.6 28.6 24.0 19.52005 4623 662 626 12.2 8.5 3.82006 3251 225 419 9.4 13.1 6.6 6.32007 3388 77 210 10.0 14.4 5.22008 2589 253 2.32009 2110 192 1.12010 4856 143 426 5.7 1.5 4.82011 5.6 3.8
Brood YearDam/Trap/Ladder Counts Redds per Mile

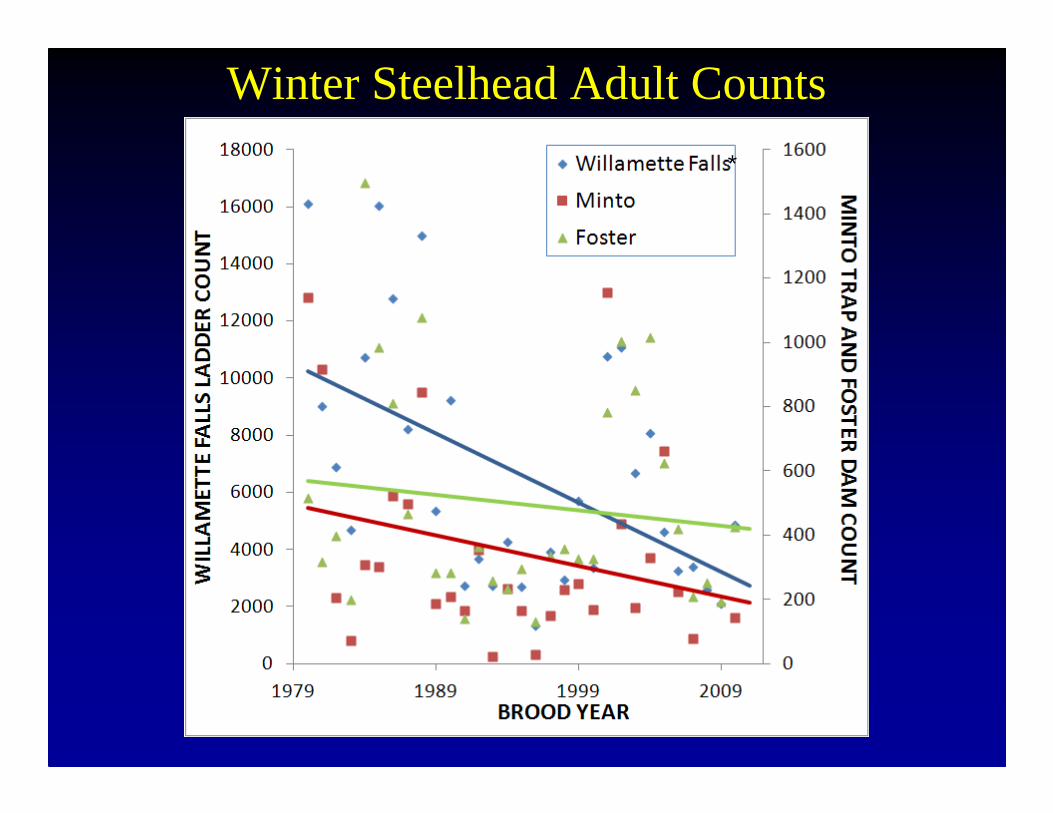
Winter Steelhead Adult Counts
Winter Steelhead Adult Counts
*

Winter Steelhead Redd Surveys
*
*

Summary
• For Steelhead…– Continued evidence for a decreasing trend in
abundance counterbalanced by evidence for resiliency within the populations
– Need for increased emphasis on expanding survey efforts throughout the DPS (at least)
• Needs to yield abundance, productivity, distribution AND diversity
– Very substantial issues with escapement of hatchery fish still exist (Teel and Vandoornik work on this issue is underway)

Spring Chinook Salmon

Methods
Redd Surveys
CarcassSampling

2011 Redds and DeadsBasin, section Redds mi d
Processed Carcasses
Unclipped Clipped PHOS PNOSSpawned Females
Unspawned Females
PSM
McKenzieabove forest Glen 868 46.2 18.8 253 223 30 12% 88% 165 3 2%
Leaburg - Forest Glen 300 18.1 16.6 102 63 39 38% 62% 48 7 13%below Leaburg Dam 220 6 36.7 197 79 118 60% 40% 95 23 19%
North Santiamabove Bennett Dam 568 23.5 24.2 777 288 489 63% 37% 336 121 26%below Bennett Dam 31 2 15.5 37 27 10 27% 73% 2 41 95%
Little North Santiam 53 9.3 5.7 52 22 30 58% 42% 11 5 31%Above Detroit 23 7.7 3.0 5 0 5 100% 0% 1 0 0%
South Santiamabove Lebanon Dam 542 15 36.1 750 185 565 75% 25% 441 72 14%below Lebanon Dam 3 9.5 0.3 9 1 8 89% 11% 1 5 83%
Above Foster 232 18 12.9 283 283 0 0% 100% 95 34 26%
Mid. Fk WillametteDexter–Jasper 99 9 11.0 137 41 96 70% 30% 70 24 26%
NF Middle Fork 115 18.1 6.4 56 2 54 96% 4% 8 32 80%Fall Creek 58 16.3 3.6 64 64 0 0% 100% 20 10 33%
Little Fall Cr 55 5.1 10.8 30 3 27 90% 10% 11 3 21%

North Santiam River 2011
N=31d=24.2PSM=59%-95%
N=53d=5.7PSM=31%
N=568d=24.2PSM=31%
N=23d=3.0PSM NA
W H

South Santiam River 2011
N=3d=0.3PSM=83%
N=542d=36.1PSM=14%
N=232d=12.9PSM=26%
W H

McKenzie River 2011
N=220d=36.7PSM=19%
N=300d=16.6PSM=13%
N=868d=18.8PSM=2%
N=241d=13.4PSM=5%
W H

Middle Fork Willamette River 2011
N=99d=11.0PSM=26%
N=55d=10.8PSM=21%
N=58d=3.6PSM=33%
N=115d=6.4PSM=81%
NoData
W H

Additional Monitoring Guidelines (Crawford and Rumsey 2011)
• Threats Due To Hatchery Production – Determine annually the percent hatchery origin spawners
(PHOS) and natural origin spawners (PNOS) for each population. Estimates should be evaluated to determine their precision and ability to detect changes and to determine the trend toward reaching Hatchery and Genetic Management Plan (HGMP) targets
– Periodically calculate proportion of natural influence (PNI) for primary populations within the ESU for supplementation
– Every hatchery should monitor the spatial and temporal distribution of juvenile fish released from the program
“Uncertainty Research” Addressing Additional Monitoring Guidelines
• Effect of size and time of hatchery Chinook releases on outmigration and adult returns
• Overarching Objectives– Rear and release hatchery spring Chinook salmon
to mimic size and behavior of naturally produced yearling migrants
– Investigate alternative rearing and release strategies to increase the proportion of fish returning.

Methods
• The proposed work combines an assessment of in-river performance of released fish by tracking migration and survival of individual releases with an assessment of smolt to adult return (SAR) following recovery of coded wire tagged fish in fisheries, at hatcheries, and during spawner surveys.

0
100
200
300
400
500
600
700
11/7/11 11/11/11 11/15/11 11/19/11 11/23/11 11/27/11
Num
ber
of J
uven
ile H
atch
ery
CH
S
Date
Outmigration Timing (Capture at Willamette Falls)

0
5
10
15
20
25
30
35
40
45
50
85 95 105 115 125 135 145 155 165 175 185
Fre
quen
cy
FK length mm
November Release
Falls
MFH
Willamette Falls
McKenzie Hatchery
Outmigrant Size

Summary• For Chinook…
– Alignment between NOAA Guidance and reality is imperfect
• Need to increase statistical rigor of abundance estimates
• Need to add a focus on juvenile production
• Estimates of diversity based on phenotypic variability is a reality now
• Work on direct estimates of genetic diversity underway
– Substantial issues with escapement of hatchery fish, PSM, the mechanics of introducing fish to depauperate habitat, and patterns of hatchery juvenile emigration still exist

Acknowledgments• Funding: US Army Corps of Engineers and
Federal Sport Fish Restoration Fund
• New Analyses and Archival Data– Juvenile Hatchery Outmigration: Craig Tinus
– Steelhead Survey Data: Steve Mamoyac
– Fall Cr Steelhead Counts: Greg Taylor
– Leaburg Steelhead Counts: Mike Hogansen
– Steelhead Status and Trends: Kevin Goodson
– Maps: Paul Olmsted and Erin Gilbert
• Field Staff: Awesome!

Questions?