baseline projections of european air quality up to 2020 m. amann, i. bertok, r. cabala, j. cofala,...
TRANSCRIPT

Baseline projections
of European air quality
up to 2020
M. Amann, I. Bertok, R. Cabala, J. Cofala, F. Gyarfas, C. Heyes,
Z. Klimont, K. Kupiainen, W. Winiwarter, W. Schöpp

Contents
• Driving forces
• Emission projections
• Air pollution impacts
• Uncertainties
• The wider context
• Conclusions

Driving forces
• CAFE baseline projections
– PRIMES energy projections with further climate measures
– CAPRI agricultural projections, pre-CAP reform

Economic driversassumed for the PRIMES “with climate measures” energy projection
0%
25%
50%
75%
100%
125%
150%
175%
2000 2005 2010 2015 2020
GDP
0%
25%
50%
75%
100%
125%
150%
175%
2000 2005 2010 2015 2020
GDP Primary energy use
0%
25%
50%
75%
100%
125%
150%
175%
2000 2005 2010 2015 2020
GDP Primary energy use Passenger km Freight ton-km
0%
25%
50%
75%
100%
125%
150%
175%
2000 2005 2010 2015 2020
GDP Primary energy use Passenger km Freight ton-km Sea transport
0%
25%
50%
75%
100%
125%
150%
175%
2000 2005 2010 2015 2020
GDP Primary energy use Passenger kmFreight ton-km Cattle lifestock Sea transport

Emissions
• Emission projections developed with the RAINS model
• Assuming implementation of present emission control legislation
• Ignoring implications of NEC and AQ Daughter directives
0%
25%
50%
75%
100%
125%
150%
175%
2000 2005 2010 2015 2020
GDP Primary energy use
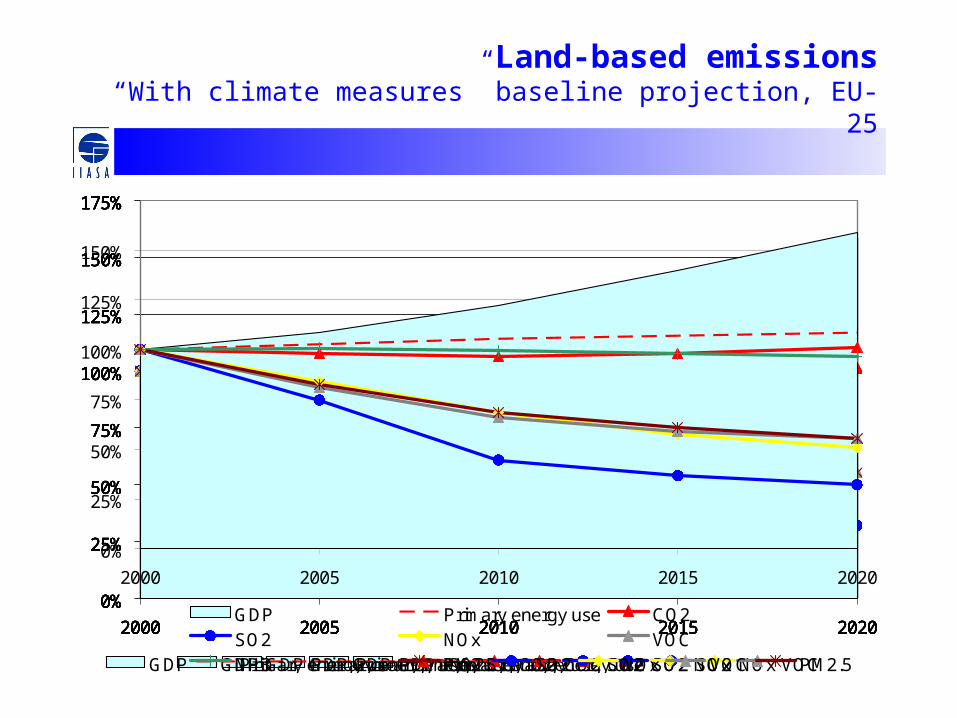
Land-based emissions “With climate measures” baseline projection, EU-25
0%
25%
50%
75%
100%
125%
150%
175%
2000 2005 2010 2015 2020
GDP Primary energy use CO2
0%
25%
50%
75%
100%
125%
150%
175%
2000 2005 2010 2015 2020
GDP Primary energy use CO2 SO2
0%
25%
50%
75%
100%
125%
150%
175%
2000 2005 2010 2015 2020
GDP Primary energy use CO2 SO2 NOx
0%
25%
50%
75%
100%
125%
150%
175%
2000 2005 2010 2015 2020
GDP Primary energy use CO2 SO2 NOx VOC
0%
25%
50%
75%
100%
125%
150%
175%
2000 2005 2010 2015 2020
GDP Primary energy use CO2 SO2 NOx VOC PM2.5
0%
25%
50%
75%
100%
125%
150%
175%
2000 2005 2010 2015 2020
GDP Primary energy use CO2SO2 NOx VOCNH3 PM2.5

Emissions from sea regions
0
1000
2000
3000
4000
5000
6000
7000
2000 2005 2010 2015 2020
0
1000
2000
3000
4000
5000
6000
7000
8000
9000
10000
2000 2005 2010 2015 2020
----- EU-15 ----- New Member States ---- Sea regions
SO2 NOx

Impacts
• Health impacts of PM
• Health impacts of O3
• Vegetation impacts of O3
• Acidification of forest soils
• Acidification of semi-natural ecosystems
• Acidification of lakes
• Eutrophication of terrestrial ecosystems

Loss in life expectancy attributable to anthropogenic PM2.5 [months]
0
3
6
9
12
15
Au
stri
a
Be
lgiu
m
De
nma
rk
Fin
lan
d
Fra
nce
Ge
rma
ny
Gre
ece
Ire
land
Italy
Lu
xem
bou
rg
Ne
ther
lan
ds
Po
rtu
ga
l
Sp
ain
Sw
ede
n
UK
To
tal E
U-1
5
Cze
ch R
ep
.
Est
on
ia
Hu
nga
ry
La
tvia
Lith
ua
nia
Ma
lta
Po
lan
d
Slo
vaki
a
Slo
ven
ia
To
tal N
MS
To
tal E
U-2
5
2000 2010 2020
Provisional calculations with generic assumptions on urban increments

Premature deaths attributable to ozone[cases/year]
0
1000
2000
3000
4000
5000
Au
stri
a
Be
lgiu
m
De
nm
ark
Fin
lan
d
Fra
nce
Ge
rma
ny
Gre
ece
Ire
lan
d
Ita
ly
Lu
xem
bo
urg
Ne
the
rla
nd
s
Po
rtu
ga
l
Sp
ain
Sw
ed
en
UK
Cze
ch R
ep
.
Est
on
ia
Hu
ng
ary
La
tvia
Lith
ua
nia
Po
lan
d
Slo
vaki
a
Slo
ven
ia
2000 2010 2020
Provisional calculations with 50*50 km grid average concentrations

Percent of forest area with acid deposition above critical loads
0%
20%
40%
60%
80%
100%
Aus
tria
Bel
giu
m
Den
mar
k
Fin
lan
d
Fra
nce
Ger
ma
ny
Gre
ece
Ire
lan
d
Italy
Luxe
mbo
urg
Net
her
land
s
Por
tuga
l
Spa
in
Sw
ede
n
UK
Tot
al E
U-1
5
Cze
ch R
ep.
Est
onia
Hun
gar
y
Latv
ia
Lith
uan
ia
Pol
and
Slo
vaki
a
Slo
ven
ia
Tot
al N
MS
Tot
al E
U-2
5
2000 2010 2020
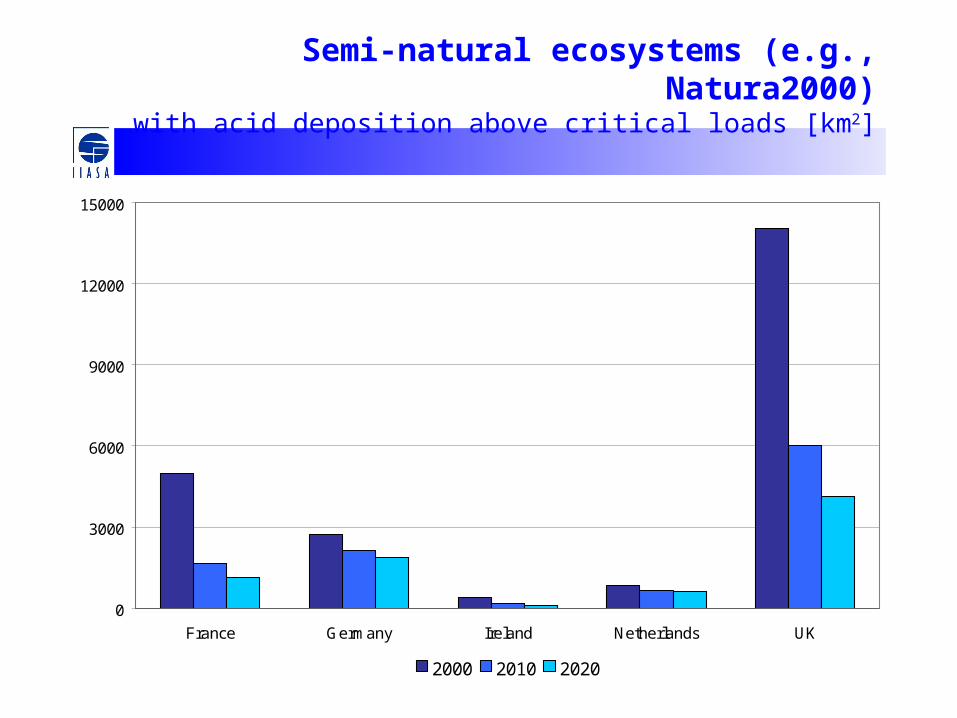
Semi-natural ecosystems (e.g., Natura2000)with acid deposition above critical loads [km2]
0
3000
6000
9000
12000
15000
France Germany Ireland Netherlands UK
2000 2010 2020

0%
4%
8%
12%
16%
20%
Finland Sweden UK
2000 2010 2020
Percent of lake catchments area with acid deposition above critical loads

0%
20%
40%
60%
80%
100%
Aus
tria
Bel
gium
Den
mar
k
Fin
land
Fra
nce
Ger
man
y
Gre
ece
Irel
and
Italy
Luxe
mbo
urg
Net
herla
nds
Por
tuga
l
Spa
in
Sw
eden UK
Tot
al E
U-1
5
Cze
ch R
ep.
Est
onia
Hun
gary
Latv
ia
Lith
uani
a
Pol
and
Slo
vaki
a
Slo
veni
a
Tot
al N
MS
Tot
al E
U-2
5
2000 2010 2020
Percent of ecosystems area with nitrogen deposition above critical loads for eutrophication

What will be the situation in 2020?
• Remaining air quality impacts
• Major sources of emissions

Remaining problem areas in 2020Light blue = no risk
Forests – acid dep. Semi-natural – acid dep. Freshwater – acid dep.
Health - PM Health+vegetation - ozone Vegetation – N dep.

Sources of primary PM2.5 emissions “With climate measures” scenario, EU-15
Industrial combustionIndustrial combustion
Industrial processesIndustrial processes
Diesel exhaust, cars
Diesel exhaust, carsDiesel exhaust, HDT
Non-exhaust Non-exhaust
Off-road Off-road
Agriculture Agriculture
Domestic, wood stoves
Domestic, wood stoves
0%
25%
50%
75%
100%
2000 2020
Sources of NOx emissions“With climate measures” scenario, EU-25
Power generationPower generation
Industrial combustion Industrial combustion
Industrial processesIndustrial processes
Domestic
DomesticGasoline cars
Gasoline cars
Diesel carsDiesel cars
Off-road
Diesel heavy duty veh.
Diesel heavy duty veh.
Off-road
0%
25%
50%
75%
100%
2000 2020

Sources of VOC emissions“With climate measures” scenario, EU-25
Industry
Industry
Households
Households
TransportTransport
Solvents
Solvents
0%
25%
50%
75%
100%
2000 2020

Sources of SO2 emissions “With climate measures” scenario, EU-25
Power generation
Power generation
Industrial combustion
Industrial combustion
Industrial processes
Industrial processes
HouseholdsHouseholds
Transport Transport
0%
25%
50%
75%
100%
2000 2020

Uncertainties
Four types of uncertainties highlighted by the RAINS review team:
• Lack of scientific understanding
• Assumptions, simplifications etc. in the handling of data and the
design of the RAINS compartment models
• Statistical variance in input data, etc.
• Socio-economic and technological development

(1) Lack in scientific understanding PM Health impacts
Coal, oil Wood Diesel, gasoline Other
Total PM2.5 emissions Black carbon
0
300
600
900
1200
1500
2000 2005 2010 2015 2020
0
300
600
900
1200
1500
2000 2005 2010 2015 2020
CAFE baseline emission projections for PM EU-15 [kt]
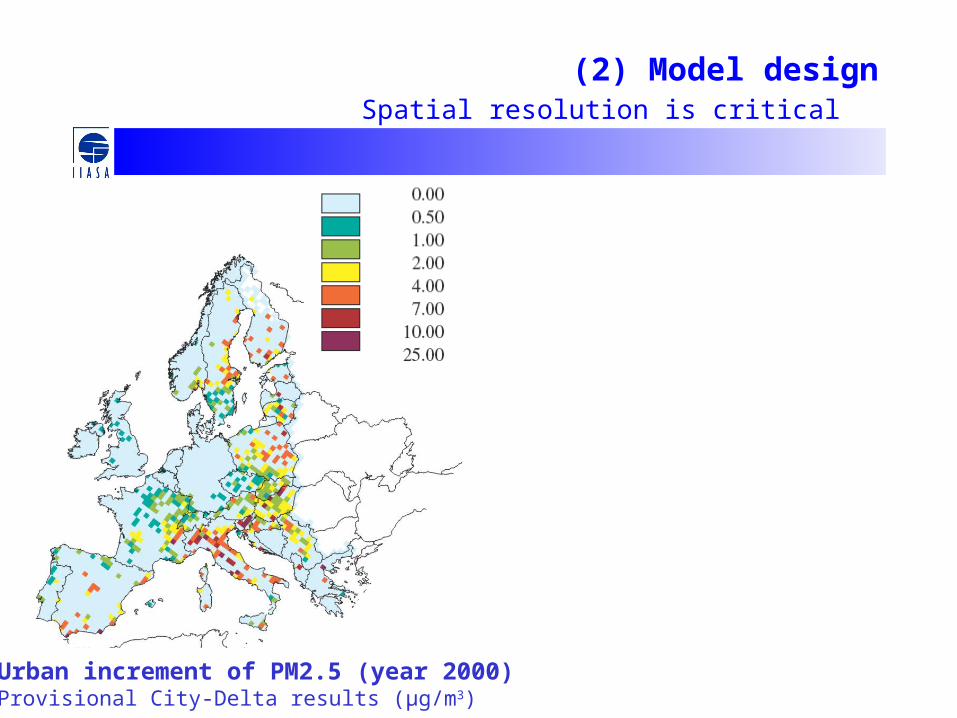
(2) Model designSpatial resolution is critical
Urban increment of PM2.5 (year 2000)Provisional City-Delta results (µg/m3)
Industry (50%)
Diesel exhaust,
cars
Diesel exhaust,
HDT
Domestic, wood stoves
Non-exhaust
0%
25%
50%
75%
100%
Urban low-level PM2.5 emissions

(3) Statistical variance in data Inter-annual meteorological variability of PM2.5
19991997
2000 2003
Grid average concentrations,
annual mean [µg/m3]from known
anthropog. sources excluding
sec. org. aerosols. Calculations
with emissions for the year 2000

(4) Uncertainties in socio-economic developmentRange of the 3 CAFE baseline emission projections [kt]
0
1000
2000
3000
4000
5000
6000
7000
2000 2005 2010 2015 2020
0
2000
4000
6000
8000
10000
2000 2005 2010 2015 2020
----- EU-15 ---- New Member States

The wider context
• Long-term trends
• Hemispheric background

Long-term trends of EU-25 emissions“with climate measures”, relative to year 2000 [= 100%]
0%
50%
100%
150%
200%
250%
300%
1990 1995 2000 2005 2010 2015 2020 2025 2030
SO2 NOx VOC NH3 PM2.5
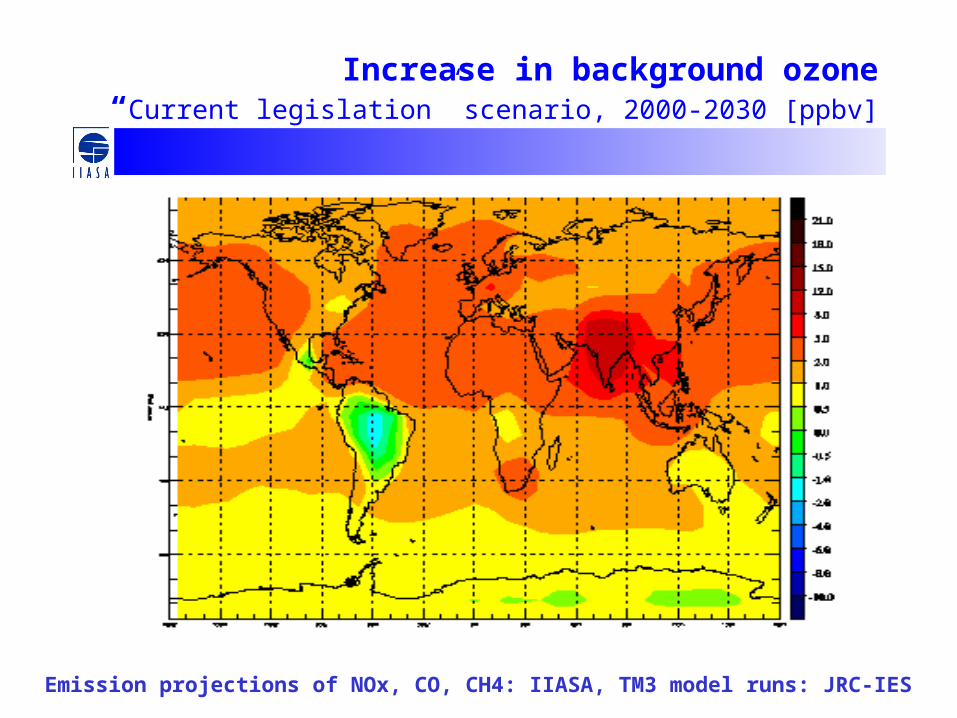
Increase in background ozone“Current legislation” scenario, 2000-2030 [ppbv]
Emission projections of NOx, CO, CH4: IIASA, TM3 model runs: JRC-IES

Conclusions
• Emissions will further decline
• But: Air quality remains threat to human health
• Sustainable conditions for vegetation will not be reached
• Relevance of sources will change
• Ship emissions will surpass those from land-based EU sources
• Energy projections will influence future emissions and emission control costs
