baseline report of karnali province - un
TRANSCRIPT

K A R N A L I P R O V I N C E 1
Karnali Province Planning Commission
September 2020
SUSTAINABLEDEVELOPMENT GOALSBASELINE REPORT OF KARNALI PROVINCE

S D G B A S E L I N E R E P O R T2
PUBLISHER
Karnali Province Planning Commission Government of Karnali Province Birendranagar, Surkhet, Nepal TEL: 083-521676 EMAIL: [email protected]
www.ppc.karnali.gov.np
COPYRIGHT ©
Karnali Province Planning Commission
PHOTO CREDIT: Bharat Bandhu Thapa
This report was prepared with the support of United Nations Development Programme in Nepal.

K A R N A L I P R O V I N C E 3
SUSTAINABLEDEVELOPMENT GOALSBASELINE REPORT OF KARNALI PROVINCE

S D G B A S E L I N E R E P O R T4
Sinja Valley

K A R N A L I P R O V I N C E 5


Mahendra Bahadur Shahi Honorable Chief Minister, Chairperson
Prof. Dr. Punya Prasad Regmi Honorable Vice Chairperson
Dr. Deependra Rokaya Honorable Member
Yogendra Bahadur Shahi Honorable Member
Laxmi Kumari Basnet For Principal Secretary, Member
Ghanashyam Upadhyaya Member Secretary, Secretary of
Ministry of Economic Affairs and Planning
Karnali Province Planning Commission

CONTENTS
1. Provincial Context 1
2. Normative Roots and Characteristics of SDGs 42.1. SDGs: expansive development notion 82.2. SDGs: complex system 92.3. SDGs: synergies and trade-offs 10
3. SDG Baseline Indicator 12
4. Data Gaps 24
5. Implementation and Policy Direction 285.1. Identification 315.2. Instruments 325.3. Investment 355.4. Institutions 37
Data Annex 40Acronyms 70List of Fiqures & Tables 71References 72

S D G B A S E L I N E R E P O R T10
1CHAPTER
One of the most popular tourist destinations in Karnali province, Phoksundo Lake is located in Dolpa district at an elevation of 3,611.5 m (11,849 ft) above sea level, with a maximum depth of 145 m (476 ft).

PROVINCIAL CONTEXT

S D G B A S E L I N E R E P O R T2
Karnali province borders China to the north, Sudurpaschim province to the west and Gandaki province and
Province 5 to the east. The province consists of 54 rural and 25 urban municipalities, and has about 300,000
households. By geographical spread, it is the country’s largest province with an area of 30,211 sq. km., covering
nearly one-fifth of Nepal’s total area. However, it is sparsely populated with over 1.5 million people, accounting
for six percent of the national population and the lowest provincial density according to census 2068 total
population is 1,570,478 in the country (56 persons per sq. km).
Despite major improvements over the past few decades, the province lags behind on several development
fronts. Some 28.9 percent of its people live below the poverty line with a per capita income of $606, which is
substantially below the national average. The literacy rate is 62 percent (72 percent for males and 53 percent
for females).1 Likewise, 51.2 percent of people are multidimensionally poor; and the Human Development
Index (HDI) of the province is just 0.427, both of which are below the national average of 28 percent and 0.49,
respectively.
The average life expectancy in Karnali is 67 years: the lowest of all provinces.2 Malnutrition in children under five
years is 58 percent. Furthermore, 35.9 percent of the total population do not have access to safe water, and only
50 percent of the households have proper toilet facilities. There are 439 public health institutions in the province.
These represent up six percent and eight percent of Nepal’s total, respectively.3
On infrastructure, the strategic road network covers 1,132 km, of which 51 percent is black topped, 35 percent
is earthen, and 13 percent is gravelled. The village road network covers only 857.3 km, of which only three
percent is black topped.4 The province produces 8.25 Mega watt electricity connected to the national grid,
likewise projects under construction: the 48 MW (megawatt) Bheri-Babai diversion (irrigation) project and the
900 MW Upper Karnali hydropower and other projects Nalsinghgad, Fukot, Betan, Jagadulla, Tila are also under
construction.
By socio-ethnic composition, the province is home to a large share of Brahmins and Chettris (62 percent),
followed by Dalits (23 percent), Janajati (13 percent), Tharus (0.5 percent), Madhesis (0.24 percent) and Muslims
(0.18 percent). Nepali is the most common language, used by 95 percent of people, followed by the Magar
language. Most people in this province are Hindus (95 percent), followed by Buddhists (three percent), Christians
(one percent) and others (0.27 percent).
The province contributes less than four percent of Nepal’s GDP, which is not surprising given the rough terrain
and limited number of registered industries (only 39 as of March 2019).5 Public administration and defence (11
percent) dominates its contribution to the provincial GDP, followed by education (seven percent), health and
social work (seven percent), hotels and restaurants (five percent) and other community, social and personal
service activities (five percent). The contribution of other sectors, such as agriculture and forestry, manufacturing
and financial intermediation, is meagre at 4 percent, 0.7 percent and 0.9 percent, respectively.6
Of the 4,202 branches of banks and financial institutions in Nepal (in mid-July 2018), the province has only 3
percent of the total, the least of all provinces. The province contributes just 1 percent to overall deposit collection
and credit mobilization of banks in Nepal.
In agriculture, the top categories of production include 119,500.54 metric tonnes (MT) of potatoes, 152,577 MT
of maize and 160,772 KL of milk. out of total arable land only 31.5% has complete and partial irrigation facility,
which is the lowest of all provinces. The region also faces a basic food availability deficit of 16.8 thousand MT.
1 Nepal in Data (2019)2 Ministry of Finance (2018)3 Ministry of Finance (2019)4 Ministry of Federal Affairs and Local Development (2016)5 Ministry of Finance (2019)6 CBS (2019)

K A R N A L I P R O V I N C E 3
Karnali province has a number of notable tourist attractions, such as the pristine Rara and Shey Phuksundo
lakes. The rennovated Kankre Bihar in Surkhet resemble the Angkor Wat temples of Cambodia. Other places of
cultural significance include Badimalika, Deuti Bajai and Chandannath temples. A number of high mountain
peaks; Churen Himal, Nalakankar, Bej Chuchuro, Saipal Himal and Kanjirowa Himal are among the highest peaks
in Karnali.
Karnali province has the potential to become an international trade and tourist conduit to Western China being
a part of western silkroad of trans-Himalayas. It has been a fertile ground for publicly funded socio-economic
programmes. The Karnali Employment Guarantee Programme, for example, has inspired a national version. The
province’s geographical vastness increases the cost of providing infrastructure.
Karnali province has major prospects in eco-tourism, high value organic agriculture, and hydropower. But a
number of hurdles inhibit realization of these opportunities, such as clarifying the roles of national, provincial
and local governments in the federal context; investment in hard and soft infrastructure; attraction of domestic
and foreign investment; and creation of quality human resources.
The province is at a stage in its development where, with a proactive institutional push and improved public
administration, the seeds of many economic opportunities can be planted. In other words, while the productivity
of firms and enterprises drives long-term prosperity, public inputs to firms’ production – such as infrastructure,
workforce, export-oriented quality certification – will play a major role in lifting the economic prospects of this
province.
Women from high hills in a traditional attire

S D G B A S E L I N E R E P O R T4
2CHAPTER

K A R N A L I P R O V I N C E 5
NORMATIVE ROOTS ANDCHARACTERISTICS OF SDGS
Settled in the lap of massive mountains is Limtang village, Humla.

S D G B A S E L I N E R E P O R T6
The Sustainable Development Goals (SDGs) were born of the need to pursue socially inclusive and
environmentally sustainable economic growth in an integrated manner. The normative basis of sustainable
development is the pursuit of a good global society supported by these three core beliefs.
n There should not be poverty amidst plenty;
n The global community of nations must foster social cohesion and mobility, reduce inequalities, and end all
forms of discrimination within and across societies; and
n Humans have a moral obligation to preserve planet Earth.
Before adopting the SDGs, the world agreed to implement the Millennium Development Goals from 2001 to
2015. They were largely successful because they were time-bound, quantified and simple to monitor. However,
on several issues, they did not go into the root causes of development. The SDGs are not just an enlargement of
the MDGs in terms of the number of goals and targets, they also seek to address complex issues like inequality
and human rights. They take a more holistic approach to development. The ambition, however, is so high that
many governments see several goals and targets as aspirational.
For a better conceptual appreciation as seen from Nepal’s present development stage, the 17 SDGs can be
grouped as follows.
Basic mark of civilization: Given the technologies on offer and the available finance, the world is now
equipped to meet the minimum requirements of every citizen to lead fulfilling lives free from want and fear.
These set the physical standards for a basic mark of civilization in the 21st century. This can be linked with
the human development notion of empowerment that addresses people’s capability to shape the processes
and events that affect their lives. Going beyond notions of ‘basic needs’ for the poor, often with an accent
just on commodity possession, the human development paradigm downplays this as being paternalistic. The
paradigm attaches importance to issues of dignity and self-respect, which has a serious bearing on how people
engage in processes that lead to higher incomes and capabilities, and political voice.
It may be argued that the SDGs in this grouping be
pursued as a civilizational imperative. They call for an end
to poverty in all its forms everywhere (Goal 1); ending
hunger, achieving food security and improved nutrition,
and promoting sustainable agriculture (Goal 2); ensuring
availability and sustainable management of water and
sanitation for all (Goal 6); and ensuring access to affordable,
reliable, sustainable and modern energy for all (Goal 7).
Exercise of human capabilities and agency: Healthy lives
and access to knowledge are worthy development goals for
their intrinsic merit, not just their instrumental contribution
to a more productive economy. Reducing all forms of
inequality is a reflection of the higher aspirations of modern,
democratic nation-states. Equity requires an enlargement
of people’s choices to access opportunities fairly. This often
implies that the prevailing power structures must improve
to ensure better distribution of assets, such as land and
credit, transfer of public incomes through fiscal measures,
and socio-political reforms that enhance opportunities for
the participation of groups that lag behind others, ethnicity
and gender.
SDGs in this grouping seek to maximize the exercise of capabilities that human beings have acquired. They
are about ensuring healthy lives and promoting well-being for all at all ages (Goal 3), and ensuring inclusive
and equitable quality education and promoting lifelong learning opportunities for all (Goal 4). While complete
Going beyond the notions of ‘basic needs’ for the poor, often with an accent just on commodity possession, the human development paradigm downplays this as being paternalistic.

K A R N A L I P R O V I N C E 7
equality may be difficult to pursue in a time-bound manner, they are goals worthy of pursuit on an ongoing
basis, such as the achievement of gender equality and empowerment of all women and girls (Goal 5); reduction
of inequality within and among countries (goal 10); and the promotion of peaceful and inclusive societies,
access to justice for all, and the building of effective, accountable and inclusive institutions at all levels (Goal 16).
Means for sustained progress: Economic growth is about generating and sustaining resources to improve the
quality of life. It embeds a constant quest to upgrade productivity. Human development is a means to higher
productivity -- a well-nourished, educated, and alert labour force is an important productive asset. But rather
than viewing humans as mere inputs into the production process, this paradigm views them broadly as ends
of development itself.
SDGs in this grouping include the promotion of inclusive and sustainable economic growth, full and productive
employment and decent work for all (Goal 8); building resilient infrastructure, promoting industrialization, and
fostering innovation (Goal 9); making cities and human settlements inclusive, safe, and resilient (Goal 11); and
ensuring sustainable consumption and production patterns (Goal 12).
Threats to future prosperity: From climate change to the changing chemistry of oceans and degradation of
marine resources, land and forests, and biodiversity, they remind us that as economic growth is pursued, the
natural heritage of the planet needs to be protected. Physical development does not need to be secured at
an environmental cost. Sustainability, however, is not just about the renewal of natural resources. In human
development terms it means that the physical, human, financial and environmental resources are governed
by the current generation in a way that does not prevent the next generation from improving its own welfare.
SDGs in this grouping include urgent action to combat climate change (Goal 13); conserving and using the seas
and marine resources sustainably (Goal 14); protecting, restoring and promoting sustainable use of terrestrial
ecosystems, managing forests, combating desertification, and halting and reversing land degradation and
halting biodiversity loss (Goal 15).
All these goals have a national, regional and global dimension. SDG 17 calls for strengthening the means of
implementation and revitalizing global partnerships.
The clustering of the SDGs above is for ease of thematic reference. Three characteristics bind them together
indivisibly. First, they embody an expansive notion of development as broadening of freedoms, widening of
choices and human flourishing. Second, they exhibit traits of a ‘complex system’. And third, the goals exhibit
synergies as well as trade-offs. We elaborate in turn.
Wooden planks make do as a bridge; such bridges can be seen aplenty in the mountains of rural Nepal. This is on the way to Limi valley, Humla.

S D G B A S E L I N E R E P O R T8
2.1 SDGS: EXPANSIVE DEVELOPMENT NOTIONThe premise that people are the real wealth of nations, and the real end of development, led the UN to define
human development as a “process of enlarging people’s choices.” These choices can be infinite, but the three
essential ones are for people to lead a long and healthy life, to acquire knowledge, and have access to resources
needed for a decent standard of living. Additional choices range from socio-economic and political freedoms
to opportunities for being creative and productive, and enjoying personal self-respect and guaranteed human
rights.7
Drawing on the works of Amartya Sen, among others, the paradigm of human development views poverty as
a deprivation of capabilities, and not just incomes. It is broadly seen as a denial of choices and opportunities to
lead the kind of life that people have reason to choose and value. The notion of human capabilities thus focuses
on what people are actually able to do and what people are able to be. Incomes are only important for their
instrumental roles in expanding opportunities. The paradigm thus rests on two pillars:
n Formation of human capabilities, such as being educated, healthy and in a position to command control
over resources;
n People make use of these acquired capabilities for leisure, production, political-economic liberties, and
participation in socio-cultural affairs.
A corollary of the above is that while an important focus of development lies on the pursuit of increased
incomes, quality of life captures a broader set of achievements, from better education and nutrition, to cleaner
environment, and even realization of greater individual freedoms. Because higher income is seen as a necessary,
but not sufficient, condition to achieving many of these broader goals, the issue of economic growth is central
to the study of development, as is the concern about how this may or may not translate into reduced poverty
and decreased inequality between the sexes, within and among groups and nations, and across generations;
and whether all these processes to generate and share prosperity adversely impact environmental sustainability
and planetary boundaries.
Another corollary of the approach to viewing people as the end of development supports the principle of ‘no
one left behind’. This requires a conscious policy response to review and act on all instances of multi-faced
discrimination (based on gender, class, ethnicity, caste, among others). Geographical isolation, shocks and
vulnerability, too, require the state to step up to reach the last mile. Prevailing governance structures, through
sheer inertia of history, often exclude people by design or otherwise. This needs radical measures to correct
historical injustices through affirmative action, for example. All these aspects are salient to Karnali province,
which is socio-culturally variegated, topographically remote, and was historically deprived of development
opportunities by the levers of centralized governance.
The notion of viewing development as augmenting capabilities and expanding choices meshes with the
triumph of the Enlightenment. As articulated by Pinker (2018), the world is getting better in almost all measures
of development. Human flourishing has been enabled by the ideals of the Enlightenment through knowledge,
reason, and science. The gift of the Enlightenment has been the moral commitment to humanism, in which the
ultimate good is the well-being of people.
7 HDR (1990, p.10).
The notion of viewing development as augmenting of capabilities and expanding of choices meshes with the triumph of the Enlightenment.

K A R N A L I P R O V I N C E 9
2.2 SDGS: COMPLEX SYSTEMSustainable development is not just a normative concept. It is a science of complex systems involving four
elements, namely economic, social, environmental and governance. The interaction between the elements
has emergent properties of a complex system, that produces something more than the sum of its parts.8 For
example, youth employment is linked to skills and education, but also has a more complex relationship with
accessibility to transportation, which is linked to school enrolment rates.
As Sachs (2015) notes, complex systems represented by a global economy, social connectedness, and Earthly
climate and ecosystems exhibit non-linear responses to shocks, i.e. a modest change in the components of the
system can cause a large change in the performance of the system (as a whole).
Such complex relations can be understood using a systems approach. Under this approach, sustainable
development is characterized by attainment of goals across environment, economic and social systems.9 More
recently, another element – governance – has become paramount. According to Sachs (2015), sustainable
development involves understanding complex systems of an integrated global economy. It highlights the role
of trust, ethics, inequality and social support network both locally and in communities engendered by the ICT
revolution (social networks). It examines the changes in ecology and environment, focusing on issues such as
climate change and biodiversity. And it investigates the problems in governance, as well as the performance of
governments and businesses.
The systems approach can be illustrated using a Venn diagram (Figure 2.1).10 The four sets are economic, social,
environmental and governance. The intersection of the sets represents goals that are directly or indirectly linked
to others. For example, SDG 1 (no poverty) is socio-economic in nature while gender inequality comes under
the social set. The set – economic social represents the linkage that higher income (earned by women) reduces
not just poverty, but also promotes women’s empowerment and therefore gender equality.
Likewise, the intersection of the four sets represents
ideas that are related to all four systems. For example,
higher income would not only reduce poverty (Goal 1),
but will also improve education opportunities for the
poor (Goal 4), produce environmentally aware citizens
who take climate change action (Goal 13), and raise a
conscious public to ensure accountable and effective
institutions.
It is important for policy makers to realize that attaining
all goals at one time will not be possible. In such cases,
economies should try to prioritize reduction in human
deprivation, while taking into consideration the impact
on biological productivity and ecological resilience, all
while factoring in social justice and good governance.11
Holmberg and Sandbrook (1992) contend that
improving just one goal does not entail sustainable
development, as its impact on other systems are
ignored. For example, exploitation of resources as
inputs in factories might improve the economy, but will
have environmental and social ramifications.
8 Sachs (2015)9 Babier (1987)10 Adapted from Barbier and Burgess (2017)11 Barbier and Burgess (2017)
ECONOMIC SOCIAL
GOVERNANCEENVIRONMENT
Figure 2.1: Overlapping of sectors

S D G B A S E L I N E R E P O R T10
Several papers have identified and highlighted linkages across SDGs. For example, TWI2050 (2018) points out
that concentrating on human capital such as education, health and gender equality are vital to help people live
a self-determined life by enabling them to find decent work, generate income, and encourage them to tackle
environment problems.
The government should be mindful of a complex system of SDGs for two major reasons. First, because of an
interconnected system, uncoordinated efforts in one system might have negative ramification in the other.
Second, because goals are related, there exists some forms of synergy and trade-off. This presents both
opportunities and challenges in achieving SDGs. For synergies, the government can combine policies to
maximize gains from two or more goals, whereas for trade-off it should remember to strike a balance between
the two.
2.3 SDGS: SYNERGIES AND TRADE-OFFSGiven the complex and non-linear relation among the SDGs, and the holistic approach to development that
these goals entail, there exist synergies and trade-offs among SDGs. While it is implicitly assumed that the SDGs
are linked, a consensus on the links and the degree thereof does not exist. Some links can be direct. For example,
greater access to clean energy (Goal 7) will reduce the chances of attaining goal 13 and 14 (climate change and
oceans), in addition to health problems (Goal 3) that it may bring along. Meanwhile, some are more complex in
nature, such as attaining food security (Goal 2) while preserving life on land (Goal 15).
Pradhan et al. (2017) analyse the interaction between SDGs and identify synergies and trade-offs. They classify
the relation to be positive (synergy) if there is a positive correlation, while a negative correlation between SDGs
is represented by a trade-off. They find that most countries have more synergies than trade-offs. They also
conclude that SDG 1 has synergistic relationships with most goals, while SDG 12 has trade-off relationships with
other goals. However, they warn that their analysis entails correlation analysis and thus the relationship cannot
be classified as being causal.
A woman in Jumla drying black beans (lentil), locally known as Kalo Simi.

K A R N A L I P R O V I N C E 11
The existence of trade-offs should not discourage policy makers. For example, in the context of agriculture
and land use, one possible trade-off may exist between preserving biodiversity and ecosystems (SDG 15) and
producing sufficient food (SDG 2).12 The trade-off can be minimized through agriculture intensification and
modernization technologies that use smaller amounts of land to produce larger amounts of food. In addition,
changing to less meat-intensive diets and reducing food wastage (SDG 12) can lower land pressure.13 This also
has an impact on CO2 emissions from changes in land use (SDG 13).14
Sachs (2015) challenges the trade-off that “society can aim to be rich, or it can aim to be equal.” He argues that
if tax on the rich is used on productive investments, such as in education and health, it will enable them to be
more productive. If the incentive of the rich to work is less affected by tax, compared to the boost in productivity
that the poor receive, it can lead to higher efficiency and equity.
In the context of urbanization, if the synergies are acknowledged, it provides massive opportunities to hit
multiple SDG targets efficiently (low funds and in shorter time). For example, urbanization through delivery
of utilities such as electricity and energy services, along with the promotion of urban mobility via use of
electrically powered mass transport system (avoid air pollution), offer synergies between SDGs 3, 7, 11 and
13. On a tangential note, Grubler et al. (2018) and Parkinson et al. (2018) point out that improving responsible
consumption and production (SDG 12) has co-benefits with other SDGs, offering an ideal synergistic entry point.
Nilsson et al. (2016) suggest that policy makers should map out, score and filter interactions between SDGs,
while pondering on four questions. First, is the interaction reversible? For instance, loss of species due to
inadequate action on tackling climate change (Goal 13) is irreversible. But changing land use from agriculture to
bioenergy production (Goal 7) can result in poorer food security, which can be reversed. Second, the direction
of the interaction, i.e. is it is one way or two way? For example, improved access to energy such as electricity
can improve education scores, but improving education scores does not directly provide energy. Third, the
strength of the interaction, or the magnitude of the effect one goal has on the other is another consideration
that policy makers should remember. Trade-offs of low magnitude are tolerable. For instance, the impact of
transport infrastructure and land resources are comparatively tolerable. Fourth, are interactions between two
or more SDGs possible or have they happened before? In other words, research should guide policy makers in
realizing the direction and magnitude of the linkages.
The magnitude of these linkages is not necessarily universal as it also depends on the geography, governance,
technology and the level of development of countries.15 For example, unlike other countries where the primary
source of electricity is coal, in Nepal electricity is generated through hydropower. This lowers the magnitude of
the linkage between energy and climate change. Similarly, weak institutions, legal rights and governance also
affects SDGs. Poorly governed industrialization and infrastructure development (Goal 9) can counteract efforts
to reduce inequality (Goal 10).
The complex interconnectedness among the SDGs demands a whole-of-government (WoG) approach. This
means coordination not only among tiers of government, but with national stakeholders outside government
such as the private sector, community groups, civil society and households. Many SDGs require a multi-sectoral
ecosystem of a response with financial and human resources pooled and coordination streamlined. Take the
example of nutrition (SDG 2). The Multi-sectoral Nutrition Plan (2018-2022), through a secretariat at the National
Planning Commission, brings together six ministries of the Government of Nepal – health; education; agriculture
and livestock; water and sanitation; local development; and women, children and social welfare. It also pools the
resources of three major development partners.
12 Humpenoder et al. (2018); Popp et al. (2011)13 Humpenoder et al. (2018)14 Springmann et al. (2016)15 Nilsson et al. (2016)

S D G B A S E L I N E R E P O R T12
3CHAPTER
Traditional folk musicians playing damaha, a drum made from leather, brass or wood. The Dalit community has been playing this instrument for generations. The damaha is used during a range of different events – from the sad to the joyful to the religious.

K A R N A L I P R O V I N C E 13
SDG BASELINE INDICATORS

S D G B A S E L I N E R E P O R T14
Despite improvements in recent decades, the baseline SDG indicators of Karnali Province are dismal. A
significant share of the population, especially women, are poor and illiterate; agriculture production is meagre;
infrastructure is inadequate; and there is low access to opportunities, resulting in substandard performance in
health, education and command over resources.
Karnali is the poorest of all provinces, with the nationally defined headcount rate of consumption-based poverty
at 25.1 percent. Child poverty rate stands at 35.3 percent16 while the international poverty line, measured as
people living under US$1.9 per day, is 27.5 percent (Table 1).
The multi-dimensional poverty index (MPI), at 0.23, is the highest in Nepal. MPI is a product of H (Headcount),
the percentage of people who are multidimensionally poor, and A (Intensity of Deprivation), the average
percentage of dimensions in which poor people are deprived. In terms of headcount, more than half of the
province are multi-dimensionally poor. Those who are identified as multidimensionally poor are deprived, on
average, in 44.9 percent of the weighted indicators. Nationally, on average, poor people are deprived in 44.2
percent of the indicators.17
16 Households with children under 5 years, and below the poverty line17 NPC and Oxford (2018)18 The World Bank staff calculations from the survey datasets (except for MPI which is reported in the NPC/Oxford report) (should we not cite the NPC/Oxford Report only)19 Food includes rice, wheat, millet, barley, buckwheat20 CBS (2011)
With only 31.5% of arable land has complete and partial irrigation facility, the region faces recurring food
shortages. There is an annual deficit of 16.8 thousand MT. Per capita food19 production in Karnali is 185 kg,
while the national per capita food production stands at 197 kg. The average annual income of small-scale food
producers is on the lower side, standing at Rs.28,10220; and about 63.1 percent of the population spend two-
thirds of their consumption on food (nationally, it is 44 percent).
Table 3.1: Prevalence of Poverty
Province a. Poverty at $1.9 b. MPI Headcount c. Headcount rate d. Children below the per day (PPP value) ratio at National Poverty national poverty line (% of population) Line (% of Population) (Under 5 years of age %)
National 14.9 - 25.2 36
Province 1 7.49 0.09 16.74 24.48
Province 2 15.43 0.22 26.69 35.12
Bagmati Province 13.87 0.05 20.59 34.63
Gandaki Province 11.09 0.06 20.87 28.37
Province 5 14.17 0.13 24.52 29.21
Karnali Province 27.54 0.23 38.83 48.05
Sudurpashchim Province 27.03 1.15 45.61 59.38
Source18: a, c, d (Central Bureau of Statistics, 2011); b (Central Bureau of Statistics, 2014)

K A R N A L I P R O V I N C E 15
Source: Ministry of Health and Population (2016)
21 Named after a statistician, Engel’s law is an observation that as incomes rise, the proportion of income spent on food falls, even if absolute expenditure on food rises. In other words, the income elasticity of demand for food is between 0 and 1.
22 De Walque (2007)
40
35
30
25
20
15
10
5
0
19
National
Prevalence of malnutrition (Weight for height >+ or <-2 standard deviation from the median of the WHO childGrowth Standards among children under 5 years of age (SDG 2.2.1)
% of women attending three PNC as per protocol (SDG 3.8.1)
Province 1 Province 2 Province 3 Gandaki Province 5 Karnali Sudurpaschim
9.7
20
7.5
According to Engel’s Law, the higher the household income, the lower the proportion of income spent on food.21
From a policy perspective, this reflects the average living standard in the province, as well as its vulnerability to
increases in food prices.
The affordability and availability of food reinforce the health and well-being of people. For example, about 29.4
percent of the women of reproductive age in Karnali province suffer from anaemia; the national average is 33.5
percent. Anaemia is understood to be hidden hunger, which results in poor pregnancy outcomes as well as
impaired physical and cognitive development in newborns.
The prevalence of malnutrition (underweight malnutrition) in children under 5 years of age stands at 7.5 percent
in the province. Malnutrition is approximately two percent points lower than the national average.
Despite improvements in female literacy, the province has a relatively lower share of women attending PNC as
per protocol (Figure 3.1). Karnali also has the third lowest percent of institutional delivery, standing at 36 percent.
Nevertheless, increasing literacy of women has improved health outcomes as more than two out of four women
receive care through a prescribed number of ante-natal visits. It has emerged as a stylized fact across all provinces
that higher literacy rates are associated with a greater share of women seeking PNC as per protocol (Figure 3.2).
Some 83.3 percent of infants receive three doses of (DPT-HepB-Hib) vaccine. Female education has tended to
have a positive relation with health outcomes of family members, especially children.22 Approximately seven
percent of the population spend a large portion of household income on health.
Figure 3.1: Malnutrition and PNC
S D G B A S E L I N E R E P O R T16
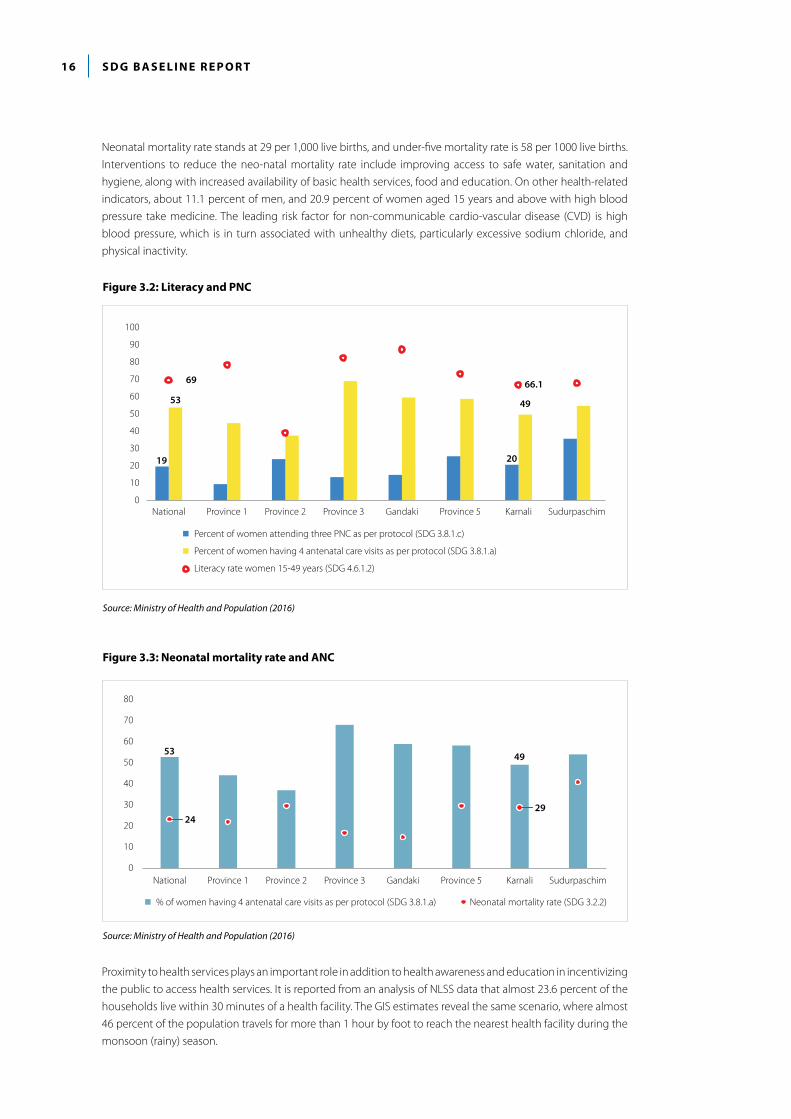
Neonatal mortality rate stands at 29 per 1,000 live births, and under-five mortality rate is 58 per 1000 live births.
Interventions to reduce the neo-natal mortality rate include improving access to safe water, sanitation and
hygiene, along with increased availability of basic health services, food and education. On other health-related
indicators, about 11.1 percent of men, and 20.9 percent of women aged 15 years and above with high blood
pressure take medicine. The leading risk factor for non-communicable cardio-vascular disease (CVD) is high
blood pressure, which is in turn associated with unhealthy diets, particularly excessive sodium chloride, and
physical inactivity.
Proximity to health services plays an important role in addition to health awareness and education in incentivizing
the public to access health services. It is reported from an analysis of NLSS data that almost 23.6 percent of the
households live within 30 minutes of a health facility. The GIS estimates reveal the same scenario, where almost
46 percent of the population travels for more than 1 hour by foot to reach the nearest health facility during the
monsoon (rainy) season.
Figure 3.2: Literacy and PNC
Figure 3.3: Neonatal mortality rate and ANC
National
100
90
80
70
60
50
40
30
20
10
0
69
53 49
66.1
19
Percent of women attending three PNC as per protocol (SDG 3.8.1.c)
Percent of women having 4 antenatal care visits as per protocol (SDG 3.8.1.a)
Literacy rate women 15-49 years (SDG 4.6.1.2)
Province 1 Province 2 Province 3 Gandaki Province 5 Karnali Sudurpaschim
20
National
80
70
60
50
40
30
20
10
0
53 49
24
% of women having 4 antenatal care visits as per protocol (SDG 3.8.1.a) Neonatal mortality rate (SDG 3.2.2)
Province 1 Province 2 Province 3 Gandaki Province 5 Karnali Sudurpaschim
29
Source: Ministry of Health and Population (2016)
Source: Ministry of Health and Population (2016)

K A R N A L I P R O V I N C E 17
Literacy is a necessary condition for advanced education and critical thinking. It augments the capabilities
of people to lead the kind of life they have reason to value. The literacy profile of Karnali is encouraging. For
example, among the younger cohort aged 15-24, the literacy rate is 98 percent and 92 percent for men and
women aged between 15 and 24 respectively (Figure 3.5). While the literacy rate of men23 aged 15-49 years
stands at 91.5 percent, women in the same cohort lag behind considerably, with literacy of just 66.2 percent.
Figure 3.4: Travel time estimates to health facilities (rainy season)
Figure 3.5: Literacy rate
Source: The World Bank estimates
Source: World Bank estimates from the Ministry of Health and Population (2016) survey data
National
120
100
80
60
40
20
0
94.4
69.1
84.589
.1 98.0
66.2
91.9
91.5
Literacy rate men 15-49 (%) (SDG 4.6.1)
Province 1 Province 2 Province 3 Gandaki Province 5 Karnali Sudurpaschim
Literacy rate men 15-49 (%) (SDG 4.6.1.1)
Literacy rate women 15-49 (%) (SDG 4.6.2) Literacy rate women 15-49 (%) (SDG 4.6.2.1)
18.07%
14.42%
25.5%
12.19%
2.5%
0.84%
0.07%
0 5% 10% 15% 20% 25% 30%
0-30 minutes
30 Minutes to 1 hour
1 to 2 hours
2 to 4 hours
4 to 8 hours
8 to 16 hours
16 to 32 hours
More than 32 hours
Percentage of Population
28.36%
23 Refers to men with an SLC or higher and men who can read a whole sentence or part of a sentence

S D G B A S E L I N E R E P O R T18
Lower literacy rate of females, among other reasons, is associated with poor economic participation and
performance of women in the economy. For example, for every 100 men, there are 44 women in the labour
force. In addition, women spend about 24 percent of time on unpaid domestic work and care. With regards
to ownership of assets, only about 8.5 percent of women own land. This is the lowest figure in the country.
Ownership of assets is found to positively relate to women’s participation in household and community decision-
making. It also shapes economic independence and provides the means to engage further in production and
employment. The availability of credit and the opportunity to start a business is highly determined by the
ownership of fixed assets. Effective women’s participation in the labour force leads to job creation and reinforces
productivity in the economy, which has a direct implication for Goal 8.
Access to sexual and reproductive rights are indivisible from the goal of reducing maternal mortality, which
reinforces the decline in the incidence of communicable diseases. In Karnali province, it is reported that
44.5 percent of women in the 15-49 age group make their own informed decisions regarding the use of
contraceptives. On a tangential note, the proportion of child marriage remains lower in this province than the
national level in two categories – at 31.5 percent (before 18), and 3.1 (before 15).
Figure 3.6: Women aged 20-24 years who were married or in a union
40.6
7.2
51.1
14.7
National
70
60
50
40
30
20
10
0
Province 1 Province 2 Province 3 Gandaki Province 5 Karnali Sudurpaschim
Proportion of women aged 20-24 years who were married or in a union before age 18 (SDG 5.3.1)
Proportion of women aged 20-24 years who were married or in a union before age 15 (SDG 5.3.2)
Source: Ministry of Health and Population (2016)

K A R N A L I P R O V I N C E 19
Table 3.2: Measures of inequality24
24 Shade of color represents different province, and not the magnitude of inequality. 25 0.20= Low inequality; 0.25 = Inequality; High inequality = 0.35; Extreme inequality = 0.50 and above26 This stat is calculated from NDHS 2016 data set where population age group is 15-49.
Karnali province is relatively less unequal, but that is, arguably, due to the modest size of its economy. The share
of the bottom 40 percent of the population in total consumption stands at 21.3 percent, whereas the share of
the bottom 20 percent is 7.97 percent. The Gini coefficient – defined as a ratio with values between 0 and 1, with
a coefficient less than 0.2 expressing low inequality – stands at 0.27. The Gini coefficient for Karnali province is
the lowest in the country.25 Similarly in another measure of inequality – the Palma index – which measures the
ratio of the shares of the top 10 percent and the bottom 40 percent in national consumption, Karnali province
scores 0.92, implying that the top decile of income earners does not earn more than the bottom four deciles
(Table 2). The percentage of people living below US$1.9 per day in total employment is 25.6 percent.
Karnali has low access to services and utilities compared to other provinces. For instance, a mere 67.5 percent of
the population26 have access to electricity. This is starkly lower than the national average, which stands at 90.8
percent.
The proportion of the population with primary reliance on clean fuel technology is 10.3 percent, those using
solid fuel as a primary source of energy for cooking is 89.5 percent, 9.54 percent of the population relies on LPG
for cooking. When access to electricity is overlaid against the use of clean fuel and solid fuel for cooking, it is
seen that provinces with higher access to electricity have a higher percent of households using clean fuel for
cooking (Figure 3.7).
Province a. Measured by b. Palma Index c. Share of bottom d. Share of bottom Gini-coefficient 40% of population 40% of population in total income in total consumption
National 0.328 1.3 5.3 18.7
Province 1 28.93 1.06 9.34 20.95
Province 2 29.50 1.11 10.85 19.52
Bagmati Province 35.33 1.45 5.48 16.25
Gandaki Province 34.66 1.41 7.81 18.92
Province 5 32.49 1.28 4.57 20.28
Karnali Province 27.01 0.93 2.86 21.38
Province 30.22 1.13 1.73 21.04
Source: World Bank estimates from Central Bureau of Statistics (2011)

S D G B A S E L I N E R E P O R T20
Figure 3.7: Access to clean fuel, solid fuel and electricity
Source: Ministry of Health and Population (2016)
67.46
89.50
90.83
65.69
National Province 1 Province 2 Province 3 Gandaki Province 5 Karnali Sudurpaschim
Households with primary reliance on clean fuels and technology (%) (SDG 7.1.2)
Households using solid fuel as primary source of energy for cooking (%) (SDG 7.1.2.1)
Proportion of population with access to electricity (%) (SDG 7.1.1)
100
90
80
70
60
50
40
30
20
10
0
Clean fuels and technologies are also critical for achieving the goals set by SDGs that pertain to poverty
alleviation, good health, gender equality, and action against climate change. As such, interventions linking
poverty reduction, good health and sustainable development will be instrumental as technologies improve and
prices fall. In the province, it is understood that marginalized communities remain underserved by appropriate
technologies and delivery models. Therefore, solutions will have to integrate scale and inclusiveness.
As the province does not yet produce its own hydroelectricity, alternate energy sources will have to be explored
to meet shortfalls.27 Urbanization through delivery of utilities such as electricity and energy services, along
with the promotion of urban mobility via use of an electrically powered mass transport system, would create
synergies across multiple SDGs.
The state of youth underemployment is higher than the overall underemployment rate (Figure 3.8). A successful
transition of the province’s growth towards sustainable development will require reversal of outward-migration,
and decline in youth underemployment. This would require promoting small and medium enterprises,
increasing manufacturing employment in total employment from the current level of 4.5 percent (Figure 3.8),
and generating options and opportunities for value creation in new sources of economic growth, such as high-
end tourism and agro-processing.
27 However, there are two big hydro-power projects in the pipeline.
The proportion of the population with primary reliance on clean fuel technology is 10.3 percent, those using solid fuel as a primary source of energy for cooking is 89.5 percent, and the population relying on LPG for cooking is 9.54 percent.

K A R N A L I P R O V I N C E 21
Figure 3.8: Unemployment and underemployment
Figure 3.9: Manufacturing employment as a proportion of total
Figure 3.10: Households with improved sanitation, piped water and thatched roof
Source: Central Bureau of Statistics (2011)
Source: Central Bureau of Statistics (2011)
Source: Ministry of Health and Population (2016)
National Province 1 Province 2 Province 3 Gandaki Province 5 Karnali Sudurpaschim
50
45
40
35
30
25
20
15
10
5
0
29.927.7
22.1
29.1
Underemployment rate (15-49yr) (%) (SDG 8.5.2.1) Youth (15-49yr) underemployment rate (%) (SDG 8.6.1.1)
National Province 1 Province 2 Province 3 Gandaki Province 5 Karnali Sudurpaschim
18
16
14
12
10
8
6
4
2
0
4.6
National Province 1 Province 2 Province 3 Gandaki Province 5 Karnali Sudurpaschim
90
80
70
60
50
40
30
20
10
0
74.6
64.6
33.3
9.6
21.3
5.6
Household using improved sanitation facilities which are not shared (%) (SDG 6.2.1.1)
Household with access to piped water supply (%) (SDG 6.1.1.2)
Household units roofed with thatched/straw roof (%) (SDG 11.1.2)

S D G B A S E L I N E R E P O R T22
With regard to roads and proximity to services, the total local road network is approximately 3,132 km, and the
road density is 8.72 km/100 sq. km.. Only 19 percent of households in the province have access to paved roads
within 30 minutes’ walking distance. Only 11 percent of the population have access to financial services. The
northern parts of the province still have almost 13 percent of population that travel more than two hours by foot
to reach the nearest financial institution even in the dry season (figure 3.11).
In terms of WASH infrastructure, the population with access to safely managed drinking water stands at 86.1
percent,28 which is the highest among all provinces. In terms of ease of access to water supply, almost 36.1
percent of households have piped water supply. In the same population, 15.4 percent of households have
thatched or straw roofs (Figure 3.10). Provinces with higher access to piped water supply have a higher
proportion of households using improved sanitation facilities. It is understood that households with access to
piped water supply might have a higher proportion of households using improved sanitation facilities.29
Figure 3.11: Travel time estimates to financial institution (dry season)
Source: The World Bank estimates
28 Safely managed drinking water: “the percentage of de jure population whose main source of drinking water is a household connection (piped), public tap or standpipe, tube well or borehole, protected dug well, protected spring, or rainwater collection.”
29 Improved sanitation facilities: “the percentage of de jure population whose household has a flush or pour flush toilet to a piped water system, septic tank or pit latrine; ventilated improved pit latrine; pit latrine with a slab; or composting toilet and does not share this facility with other households.”
0-30 minutes
30 Minutes to 1 hour
1 to 2 hours
2 to 4 hours
4 to 8 hours
8 to 16 hours
16 to 32 hours
More than 32 hours
13.73%
8.47%
16.34%
26.17%
23.25%
10.53%
1.45%
0.39%
0 5% 10% 15% 20% 25% 30%
Percentage of Population

K A R N A L I P R O V I N C E 23
Some 69.2 percent of women aged 15-49 own a mobile phone, and almost 7.1 percent of the women use the
internet (Figure 3.12). For men, the figures are 83.6 percent and 28 percent respectively. Mobile penetration
continues to grow in the province as operators develop solutions to extend affordable services. This has, in turn,
created a platform of opportunity for people to use their devices to access the internet, which has presented
immense opportunities for people to access a range of life-enhancing services.
Source: Ministry of Health and Population (2016)
Figure 3.12: Mobile phones and internet (women)
National Province 1 Province 2 Province 3 Gandaki Province 5 Karnali Sudurpaschim
74.672.63
23.29
7.19
Proportion of women age 15-49 who own mobile phone (SDG 5.b.1.1)
Proportion of women age 15-49 using internet (SDG 17.8.1.1)
90
80
70
60
50
40
30
20
10
0
Under digital infrastructure and use of ICT, the proportion of women aged 15-49 who own mobile phone stands at 69.2 percent, and almost 7.1 percent of the women use internet. On the other side, the proportion of men aged 15-49 who own mobile phone stands at 83.6 percent, and almost 28 percent of men use the internet.

S D G B A S E L I N E R E P O R T24
4CHAPTER
Inquisitive eyes: local people of Kaike rural municipality, Dolpa

K A R N A L I P R O V I N C E 25
DATA GAPS

S D G B A S E L I N E R E P O R T26
DATA GAP AND AVAILABILITY- PROVINCIAL SDGS INDICATORS
A cursory assessment of the available data for this baseline report estimates almost 230 indicators do not have
data available for SDG reporting. Altogether, there are 350 indicators finalized by the province of which only 120
have data readily available for reporting.
Most data are estimated from NLSS (2011), NDHS (2016) and population census (2010). Approximately 29
percent from NDHS, and 32 percent from NLSS are analysed for the provincial baseline report. The paucity of data
comes from a disconnect in the survey calendar as household and other surveys are conducted infrequently
and without coherence. Filling in the gap in data should be a priority, because to understand what it means to
achieve sustainable development, we need to start with fully understanding who is left behind, for which data
points are imperative.
A dynamic data ecosystem is imperative for the success of the SDGs. To provide continuous feedback for
economic growth, incentivize the progress towards SDGs, and to improve efficiency in delivering the basic
services, establishing transparency require a broad array of data. Developing and strengthening the provincial
statistical system to monitor and evaluate the progress of the SDGs is crucial.
Table 4.1 Availability of data for SDGs indicator- Province level
SDGs Indicators that are included Indicators which will be reported for the reporting purpose but no data available
1 18 7
2 21 7
3 48 25
4 50 39
5 35 16
6 13 6
7 10 5
8 21 15
9 9 6
10 12 8
11 14 9
12 14 13
13 10 8
15 23 22
16 24 20
17 28 24
Total 35030 230
Source: Calculated for the report based on the Nepal SDGs Status and Roadmap, 2016-30 and http://sdg.npc.gov.np/data/
30 These exclude global indicators, and those indicators that repeat across the 17 Goals.

K A R N A L I P R O V I N C E 27
Filling in the gap in data should be a priority, because to understand what it means to achieve sustainable development, we need to start with fully understanding who is left behind, for which data points are imperative.
Women of Limi valley, Humla, attired in their traditional outfits.

S D G B A S E L I N E R E P O R T28
5CHAPTER

K A R N A L I P R O V I N C E 29
31 This section draws on, and adapts for the province, issues covered in NPC (2017)
IMPLEMENTATION AND POLICY DIRECTION31
A vehicle plies through a rocky, winding road. Such roads can be seen throughout Karnali province.

S D G B A S E L I N E R E P O R T30
There are several implementation challenges related to the
goals, targets and indicators of the 2030 Agenda for Sustainable
Development at the provincial level. First, the targets are highly
ambitious for several goals and need to be negotiated to
make them more realistic. Second, some of the targets within
the SDGs are less relevant for Nepal, while additional targets
would be necessary to address province-specific challenges.
For instance, in SDG 5, targets related to untouchability during
menstruation would be more important in Karnali province
and across Nepal than other harmful practices specified in the
global list of targets. Third, global targets for some SDGs are
insufficient. Some are only proximate. They rely more on the
markets than on state interventions, and they may not work
properly in LDCs like Nepal. Fourth, one goal related to oceans,
seas, and marine resources (SDG 14)32 is less relevant for Nepal
while in some other goals like combating climate change (Goal
13), action is more dependent on other countries. Some goals,
including sustainable consumption and production (Goal 12)
and reducing inequality among countries (part of Goal 10),
concern the developed world much more. Finally, as the goals
and targets overlap, one indicator may serve more than one
target. There is, therefore, a possibility of duplication.
It has been suggested that SDG indicators be disaggregated, where relevant, by income, sex, age, race, ethnicity,
migratory status, disability and geographic location.33 There would be at least six types of disaggregations
necessary to monitor the progress in detail. Many targets and indicators require heavy data, which the country
will take years to generate.
In laying a framework for implementing the SDGs, there are four pillars to grapple with. First, identification of
priorities; second, intervention of policy instruments; third, investment of resources; and fourth, institutional
readiness. These ‘I’s – Identification, Instruments, Investment and Institutions – provide a coherent guide for the
fifth ‘I’ – the Implementation of the SDGs.
Much of the burden of SDG implementation will be
borne by sub-national governments. Localization of
SDGs is, therefore, important for several reasons. First,
vital public services, which form a social core of the
SDGs, are now the responsibility of local governments,
such as basic and secondary education, primary health
care, water supply and sanitation, agriculture, basic
infrastructure, and social security. Second, mandated
transfer of revenue and other resource mobilization
authority given by the constitution to the provincial
and local governments means that they will have
increased resources to fund SDGs. Third, given the
uneven development achievements, prioritization
and sequencing of SDGs can now be better tailored
to local contexts. Fourth, local people’s participation,
Localization of SDGs is, therefore, important for several reasons. First, vital public services, which form a social core of the SDGs, are now the responsibility of local governments, such as basic and secondary education, primary health care, water supply and sanitation, agriculture, basic infrastructure, and social security.
32 SDG 14 deals with life below water, with the goal of managing and protecting marine and coastal ecosystems. This has salience for landlocked countries insofar as it covers the protection of inland water resources and river ecosystems. Karnali province has major river systems of Nepal with implications for hydropower, irrigation, fisheries, and tourism. Over-fishing is not yet a concern, but they must be safeguarded from excessive pollution and anthropic degradation of dependent biodiversity.
33 UN General Assembly Resolution 68/261, United Nations.
Weaving rugs--locally known as Raadi and Paakhi--in Humla.

K A R N A L I P R O V I N C E 31
and the maxim of ‘leaving no one behind’ requires targeted interventions at pockets of deprivation. This is a task
best handled when information and peer-monitoring is leveraged locally.
5.1 IDENTIFICATIONIn the face of limited resources, a key challenge is to identify an implicit order of priorities for the numerous
goals. A logical point to start with is the country’s recently-approved approach paper of the 15th periodic plan
covering 2019-2023. This should guide the preparation of both the federal and provincial budget priorities.
Although all SDGs are important, indivisible, and common for all countries, their priorities are country- and
region-specific.
The primary areas of priority will be sectors where the
MDG agenda is still unfinished. Goals with the potential to
trigger inclusive economic growth through job creation,
strengthened social protection systems, and reductions
in disaster risks are also significant priorities in today’s
Nepal. However, the SDGs are not stand-alone goals,
and achievement of one goal has implications for others.
They are intertwined. For example, reduction of poverty
depends on the reduction of hunger, gender disparities,
outcomes in education and health, and environmental
stresses.
Prioritization will also be guided by financing and the
availability of other resources. These are better determined
after a thorough needs assessment exercise. When
priorities are determined, their sequencing will be vital.
Those goals and targets deserve early attention if (i)
new legislative mandate or organizational set-up is not
necessary; (ii) they deliver low-hanging fruits in terms of
development outcomes; and (iii) the delivery of other top
priorities is contingent upon their prior achievement.
For effective monitoring of outputs and outcomes, a results framework will need to be devised. Beyond the financial outlay, SDG priorities also need to factor in the managerial, institutional and allied capacity constraints.
Women hold their babies at Jiuka Birth Center in Jiuka village, Mugu.

S D G B A S E L I N E R E P O R T32
Once the SDGs are built into periodic plans and annual budgets, there is a need for an annual budget audit from
an SDG perspective by the Provincial Planning Commission (to prevent a conflict of interest, this should not be
an implementing agency).
For effective monitoring of outputs and outcomes, a results framework will need to be devised. Beyond the
financial outlay, SDG priorities also need to factor in the managerial, institutional and allied capacity constraints.
Ambitious implementation of the SDGs demands a heightened culture of evidence-based policymaking. An
SDGs dashboard could be created to provide open source information on the state of SDG implementation and
progress made throughout the 2019-2030 period.
Karnali province is prone to disasters such as earthquakes, floods and landslides. Disasters halt and reverse
development achievements accrued over decades. This implies that adequate disaster risk reduction interventions
must be identified during an SDG needs assessments. An emerging consensus on effective disaster response is
that provinces need a coordinated plan, nimble decision-making and flexible financing on standby. Pre-agreed,
pre-financed, rules-based arrangements work. Where there is no prior plan or financing, chaos reigns. A better
balance of ex-ante risk management (preparation) and ex-post risk management (coping) requires knowledge
of risks, protection to lower the probabilities of risks, and insurance schemes when protection cannot eliminate
risks.34 Slow disasters in the making, such as climate change, can be factored into plans that have a longer
horizon. For instance, droughts exacerbated by climate change have far-reaching implications on livelihoods.
Contingency planning for disasters also demands unconventional forms of human resources, such as large
networks of volunteers across the province.
5.2 INSTRUMENTSAfter identifying and prioritizing major goals and targets, what will be decided is the nature of intervention
of policy instruments. Do these instruments entail capital investments, human resources, or simple stroke-of-
the pen policy reforms? What kind of synergies and consistencies need to be sought or forged? What roles
should be apportioned to the state, private sector and civil society? Will there be incentives for collaboration and
partnership in pursuit of shared goals? Are they to be front-loaded or back-loaded?
The nature of interventions will vary by sector. Post-disaster reconstruction (such as the 2017 floods) is timebound;
hence, investment is front-loaded. In agriculture, too, investment peters off, because large investments in major
irrigation and agricultural infrastructure like roads, electricity and market infrastructure are anticipated in the
initial SDG period. But in a sector like health, expenditure will grow over time because of gradual ageing of the
population and the rollout of the universal health insurance scheme. The energy sector will also be backloaded.
Large hydro-power projects are implemented during the later years of the SDG period. Certain sectors will need
constant attention, such as transport and industry, forestry, gender, tourism, and climate change.
SDGs are not a government responsibility alone, they are a national undertaking. Strategic partnerships between
government, the private sector, NGOs and community sectors would, therefore, be required. Importantly,
34 World Bank (2013).
An SDGs dashboard
could be created to
provide open source
information on the state
of SDGs implementation
and progress made
throughout the
2019-2030 Period.
Karnali province is prone to disasters
such as earthquakes,
floods and landslides.
Disasters halt and reverse
past development
achievements accrued over
decades.
The media will continue
to be an ally to
disseminate innovatively
about the
2030 Agenda.

K A R N A L I P R O V I N C E 33
there needs to be sufficient political buy-in of the agenda,
in provincial parliaments as well as across all major political
parties.
Relative to the MDG period, the role of the private sector
has increased substantially. For partnerships to be credible,
there needs to be a mechanism whereby the private sector
participates in policy formulation, implementation and
monitoring of the SDGs. Effective implementation of the SDGs
demands meaningful participation of non-governmental
actors. They were instrumental in helping deliver several
MDGs, and this should continue in the SDG era.
Nepal’s constitution envisages a special role for cooperatives.
The government expects cooperatives to complement
public and private sector activities. Social organizations, such
as trades unions and youth organizations, will also need to
be engaged in SDG implementation. The media will continue
to be an ally in disseminating information innovatively about
the 2030 Agenda. Their creativity in capturing the attention
of lay audiences will greatly determine the political capital
that the state expends on the SDGs.
Some SDGs have an international dimension, for which collaboration will need to be forged with sub-regional
and international organizations to address SDGs that have cross-border implications such as trade, investment,
tourism, capital flows, trans-boundary pollution, migration, disasters, and social protection. Regional cooperation
frameworks, such as China’s Belt and Road Initiative and India’s infrastructural outreach embedded in the
Neighbourhood First policy, must be utilized for the benefit of Nepal’s lagging provinces, including Karnali.
SDGs also require a rigorous, data-driven campaign. Mapping SDG data and their existing quality shows large
gaps in monitoring targets and indicators. Large investments will, therefore, be required to undertake new
surveys jointly by CBS and provincial statistical wings, utilizing new internet-enabled ICT technologies to
educate the public.
Effective implementation of the SDGs demands meaningful participation of non-governmental actors. They were instrumental in helping deliver several MDGs, and this should continue in the SDG era.
No better location to work on his weaving! In the background is the scenic Rara lake. The main feature of Rara National Park, located in Jumla and Mugu districts, it is the biggest and deepest fresh water lake in Nepal.

S D G B A S E L I N E R E P O R T34
Against this backdrop, what specific policy instruments will the different goals demand? What follows are
illustrative excerpts from an NPC study on needs assessment, costing and financing of SDGs.
Take poverty reduction, possibly the most important challenge of this generation. How shall it be achieved?
Informed by existing literature, the interventions include (i) income generation activities to directly solve “the
problem of the last mile” and to serve the hard-to-reach; (ii) concessional micro-credit, with subsidized interest
to small and medium enterprises expected to generate jobs; (iii) location-specific infrastructure; (iv) prevention
and mitigation of disasters that could worsen poverty; and (v) widening of social protection coverage.
In agriculture, relevant interventions include (i) improvements in food and nutrition security of the most
disadvantaged groups; (ii) strengthened agricultural extension system; (iii) expansion of year-round irrigation; (iv)
improvements in the distribution of seeds and fertilizers; (v) expansion of rural roads; and (vi) commercialization
and modernization of agriculture.
The interventions envisioned in education are (i) improved management of pre-primary, basic and secondary
education; (ii) literacy and lifelong learning; (iii) teachers’ professional development; (iv) disaster risk reduction
and physical safety of schools; (v) promotion of youth in sports; (vi) higher education and research; (vii) technical
and vocational education; (viii) promoting equity and quality across all levels of education; and (ix) better
nutrition programmes through the school meals and incentive grants.
In water and sanitation, interventions planned include (i) universal and equitable access to safe and affordable
drinking water and adequate sanitation and hygiene for all; (ii) addressing water quality concerns, including
waste water treatment and recycling; (iii) better water efficiency to avoid water scarcity; and (iv) improvements
in water resource management and protection of ecosystems.
Interventions in energy include (i) the generation of power through large hydro projects, micro hydro off-grid,
and grid-connected solar system; (ii) transmission and distribution systems; (iii) improved energy efficiency; and
(iv) O&M expenses to maintain a steady quality of power supply.
Interventions related to inclusive growth and productive employment include (i) creation of jobs in labour
intensive sectors like agriculture, construction, manufacturing, and tourism; (ii) promotion of small and medium
enterprises and access of small business to financial services; (iii) skills’ development; (iv) an employment
information system; (v) elimination of child labour; (vi) protection from work place injuries; and (vii) enforcement
of labour laws.
Too engrossed to look around: a school girl doing her homework.

K A R N A L I P R O V I N C E 35
Under tourism, interventions include construction of hotel rooms, development of tourism products, and
marketing for tourist inflows. Interventions planned under physical infrastructure include new construction
of roads, railways, bridges and airports, maintenance, upgrading and new construction of the strategic road
network and local road network. The investment requirement for industry needs to be based on the target set
for increasing the share of manufacturing in provincial GDP.
Interventions in urban development and housing include (i) safe urban road construction; (ii) storm drainage
and sewerage; (iii) housing for the poor and slum up-gradation; (iv) post-disaster reconstruction and pre-disaster
mitigation; and (v) construction of urban utilities like piped water supply and electricity connection. Climate change related interventions include (i) building resilience and adaptive capacity; (ii) reducing emissions; (iii)
strengthening data and monitoring of climate change; and (iv) climate-proofing technology for infrastructure.
Forest and ecosystem related interventions include (i) conservation of forests, lakes, wetlands, wild life,
biodiversity, and land; (ii) integration of ecosystem and biodiversity values into national and local planning; and
(iii) conservation of watershed. Interventions related to governance include (i) access to justice; (ii) capacity
building for anticorruption; (iii) improvements in the provisioning of public services; (iv) capacity development
for planning, budgeting and implementation; (v) electoral awareness; and (vi) data systems for monitoring SDGs.
Several SDG indicators are qualitative in nature and, thus, cannot be costed to derive the investment requirement.
They have to be achieved through policies, regulations and administrative enforcement. Furthermore, indicators
related to inequality, injustice, exclusion, or insecurity are best addressed through both policies and institutions
designed and mandated to work specifically on these issues.
of bank credit is
expected to flow into
SDG areas, including five
percent that is already
mandated to cover
“deprived sectors.
Almost
50%
annually nationwide.
The incremental
financing resources of
cooperatives available
for SDGs are estimated
at about
Rs. 25bannually for spending
in social and economic
activities.
The NGOs
also mobilize about
Rs. 20b
A farmer in Dailekh ploughing the paddy fields to plant rice.

S D G B A S E L I N E R E P O R T36
5.3 INVESTMENT At the national level, a preliminary estimate of the annual investment requirement for the entire SDG period,
2016-2030, ranges between 42 to 54 percent of GDP. The average requirement is estimated to be about Rs1,770
billion per year,35 or nearly 49 percent of GDP over the entire duration of the SDGs. In view of its economic clout
and population, Karnali province is likely to account for up to 15 percent of the national share.
This scale of investment needs a full mobilization of all national and international sources – public and private.
Households are probably the least appreciated group of investors. They already spend a large portion of their
incomes on basic social and economic services offered by both the public and private sectors. Households vary
by income. If segregated by their position relative to the national poverty line, and under varying assumptions
of their marginal propensity to consume or spend, households could finance up to five percent of the total SDG
investment requirement.
The private sector is expected to invest more heavily in industry, energy, physical infrastructure, housing, urban
infrastructure, and tourism. It is expected to contribute nearly three-fifths of the investment needs in tourism,
industrial and transport infrastructure. The public sector is expected to shoulder about 55 percent of the SDG
investment requirement nationally, starting with sectors like poverty reduction and followed by agriculture,
health, education, gender, water and sanitation, transport infrastructure, climate action, and governance. The
public investment requirement is expected to be the lowest in tourism, followed by energy, industry, and urban
infrastructure (mainly housing).
Nationally, domestic financing through revenue mobilization and internal borrowing could finance about 62
percent of the public sector SDG investment requirement while official aid would finance another 20 percent
of the public sector financing need under the assumption that the overall foreign aid pie grows by at least 10
percent during 2016-2020, five percent during 2021-25 and two percent thereafter. The amount of ODA inflow
will have to double from existing levels. It is estimated that about two-thirds of domestically raised resources
and about 90 percent of official development assistance will need to be directed to the SDGs.
The sources of private finance are equity generated through domestic savings; foreign equity mobilized through
foreign direct investment; debt financing through domestic and foreign banks; and resources shared with the
public sector through public-private partnerships (including viability gap funding). Almost 50 percent of bank
credit is expected to flow into SDG areas, including five percent that is already mandated to cover deprived
sectors. The financing gap in the private sector will have to be met by reorienting non-SDG investments towards
the SDGs; mobilizing larger volumes of equity; bank financing; and attracting large foreign direct investment,
especially for industry and the physical infrastructure.
The incremental financing resources of cooperatives available for SDGs are estimated at about Rs.25 billion
annually nationwide. The NGOs also mobilize about Rs.20 billion annually for spending in social and economic
activities. The cooperative and NGO sector are not expected to face a financing gap, because their investment
portfolios are constricted by the funds they raise.
35 Subsequently revised to exceed Rs. 2000 billion per year.
of bank credit is
expected to flow into
SDG areas, including five
percent that is already
mandated to cover
“deprived sectors.
Almost
50%
annually nationwide.
The incremental
financing resources of
cooperatives available
for SDGs are estimated
at about
Rs. 25bannually for spending
in social and economic
activities.
The NGOs
also mobilize about
Rs. 20b

K A R N A L I P R O V I N C E 37
Overall, as a share of the GDP, the national financing gap ranges between nine percent in the 2016-2019 period
to a high of about 15 percent in the last leg, 2025-2030. The average financing gap is about 12 percent of GDP,
assuming real economic growth of a steady 6.6 percent throughout 2016-2030.
Nepal’s nascent local governments will need to step up and raise substantial new resources to finance the SDGs
locally. Transfers from central government will remain a principal source of financing for most local governments.
Local borrowing is needed to enhance the flexibility of long-term infrastructure planning. There are at least
two windows that local governments can use for borrowing: Town Development Funds for municipalities, and
banks and financial institutions for all local governments. As the need for local financing is much higher than
their present income, legal arrangements have been made to enable them to finance public spending through
borrowing.
Public-private partnership as a concept needs to be operationalized much more seriously in the era of federalism
to finance local infrastructure. Private sector participation can take a variety of forms that provide opportunities
for local governments to expand their scope of operations and revenue generation such as out-contracting,
issuing concessions and franchising. Several additional financing mechanisms would need to be introduced.
Land-pooling, for example, can enable the promotion of shared infrastructure with the communities incentivized
with arguments that the value of land appreciates after it is linked with modern infrastructure.
There is considerable scope for enhancing fiscal space in the public sector through pro-poor expenditure
switching. Yet switching government resources from one sector to another requires a strong mixture of political
drive and bureaucratic cooperation. During the MDG era, it was easy to earmark a larger percentage of the
government budget to basic social services. But for the SDGs, it is difficult (and perhaps not credible) to switch
resources from economic sectors to social sectors, as the former is as important as the latter in the SDG menu.
Increasing expenditure efficiency is also often suggested as the main instrument for enhancing fiscal space for
the SDGs.
Provinces have to make an extra effort to raise the revenue that the constitution permits. For a sustainable rise
over the long haul, the tax base – GDP – needs to broaden. Indirect taxes are by their very nature regressive;
widening such a tax base to cover basic goods and services could exclude access by the poor. Provinces will not
be expected to meet the financing needs on the non-SDG front (such as debt servicing and national security).
Beyond finance, a critical constraint in Nepal is the capacity deficit at the institutional level. This has crippled
the quality delivery of services even when the will exists, and funds are allocated. Unless capacity development
interventions are mainstreamed into the provincial planning and budgeting process, they will not get the
requisite priority and resources for expedited implementation. The capacity assessment exercise undertaken in
the context of MDGs implementation provides a lot of tools, knowledge and experience within the UN system
and they could be adapted for SDG-related capacity assessment.
A woman digs into the soil at her farm in Dho village, upper Dolpa.

S D G B A S E L I N E R E P O R T38
5.4 INSTITUTIONSWhen governance is characterized by lack of transparency, accountability or competence, the poor and
vulnerable people suffer most. When income inequality is high, economic growth does not reduce poverty.
When state policies and programmes are captured by the elite, the poor do not have access to resources;
opportunities shrink, and voices are excluded. The SDGs are rightly concerned with these issues, and they lay a
powerful emphasis on building effective, accountable and inclusive institutions at all levels.
As Nepal implements a federal form of governance for the first time in its 250-year history, this is the right time
to redesign grassroots institutions to deliver more effective services promoting community participation and
downward accountability. Reformed public agencies at the federal level also need to focus much more on the
design and coordination of policies and facilitate private sector investment, among others, which are critical to
realizing the SDGs.
A strong monitoring system with credible data is crucial for the success of the SDGs. Only an effective government
with a strong statistical system can measure and incentivize progress across the goals.
Other challenges in data are disaggregation (by sex, age, ethnicity, disability, location, administrative units of the
state, and income or wealth) and standardization (definition, unit of measurement, method of computation).
Data for more than 100 global SDG indicators are not available. There is also much qualitative information to
be collected – such as citizens’ perceptions of public services, corruption and wellbeing. There is also a big
difference between data recorded by government and those compiled by NGOs. This is particularly the case for
crime, human trafficking, and violation of human rights.
The rapidly evolving innovation in data collection techniques and technologies, and the capacity to distribute
data widely and freely, has expanded the horizon of possibilities. The current statistical system in Nepal is,
however, yet to evolve that way. In particular, access to public and even private sector data is a major challenge
for independent monitoring agencies outside the government. Major surveys are often financed by donors,
which are subject to delays in aid mobilization. The government will make necessary legal, organizational and
operational changes in the existing data system to generate and share large, high quality and timely data to
monitor the progress of the SDGs.

K A R N A L I P R O V I N C E 39
All the institutions of the state need to be on the same page to advance the sustainable development agenda.
Only a proper institutional mechanism among state and non-state actors can ensure that interventions related
to the SDGs are executed in a coordinated, coherent and complementary way. The role of the parliament,
federal and provincial, will be crucial, particularly in creating and reforming laws facilitating and governing SDG
implementation and monitoring. Parliamentary committees will also be instrumental in monitoring progress.
The provincial ownership of the SDGs ought to be manifested in the institutional set-up of the High-level
Steering Committee, ideally chaired by the Chief Minister. Below this lies a Coordination and Implementation
Committee chaired by the Vice-Chair of the Provincial Planning Commission (PPC), followed by thematic
committees led by members of the PPC.
Nepal has an Integrated Evaluation Action Plan for 2016- 2020 that incorporates the activities of government
agencies, Voluntary Organizations of Professional Evaluators (VOPEs) and UN agencies under the leadership
of the NPC. This equity-focused and gender-responsive evaluation action plan aims to generate, share and
use evaluation-based evidence in policy processes and to help build capacity of evaluation commissioners,
evaluators and evaluation users. These efforts aim not only to track SDGs, but also to institutionalize EVALSDGs.
The NPC at the central level is gradually shifting from a narrow monitoring of processes to results-based
monitoring and evaluation.
Like the NDAC at the centre, high-level provincial development action committees (PDAC) could be formed
to relieve coordination bottlenecks and redress problems that cannot be solved at the ministerial level.
This committee reviews the implementation of programmes and projects and establishes inter-ministerial
coordination on development related issues. The PDACs are preceded by the Ministerial Development Action
Committee (MDAC) in each line ministry. These committees organize meetings every trimester to review the
implementation status of programmes and projects.
Before the provincial administrations were set up under the new constitution, M&E was carried out at the regional
level by regional directorates and regional administration offices. Regional directorates reported directly to their
line ministries, while regional administration offices report to the Office of the Prime Minister. The old M&E
systems at the regional and district levels will now need to be restructured into appropriate mechanisms at the
sub-national levels, helping track the local achievement of the SDGs.
The old M&E systems at the regional and district levels will now need to be restructured into appropriate mechanisms at the sub-national levels, helping track the local achievement of SDGs.
It’s time to eat!: A man in Humla prepares cake.

S D G B A S E L I N E R E P O R T40
ANNEXES

K A R N A L I P R O V I N C E 41
SDG
#1:
End
pov
erty
in a
ll it
s fo
rms
ever
ywhe
re
TA
RGET
S A
ND
IND
ICAT
ORS
B
ASE
LIN
E FI
GU
RE (2
015)
NAT
ION
AL
KA
RNA
LI
PRO
VIN
CE
PRO
POSE
D
DAT
A S
OU
RCE
DAT
A Y
EAR
DIS
AG
GRE
GAT
ION
FR
EQU
ENC
Y RE
SPO
NSI
BLE
D
ATA
SO
URC
E PR
OV
IDED
AG
ENC
Y
IN T
HE
REPO
RT
SD
G 1
. EN
D P
OV
ERTY
IN A
LL IT
S FO
RMS
EVER
YW
HER
E M
ON
ITO
RIN
G F
RA
MEW
ORK
Targ
et 1
.1 B
y 20
30, e
radi
cate
ext
rem
e po
vert
y fo
r all
peop
le e
very
whe
re, c
urre
ntly
mea
sure
d as
peo
ple
livin
g on
less
than
$1.
25 a
day
1.1
.1
Prop
ortio
n of
pop
ulat
ion
belo
w th
e in
tern
atio
nal p
over
ty li
ne,
by s
ex, a
ge, e
mpl
oym
ent s
tatu
s an
d ge
ogra
phic
al lo
catio
n
(urb
an/r
ural
)
1
Pove
rty
$1.9
Per
day
(Pur
chas
ing
Pow
er P
arity
val
ue)
15
27.4
N
LSS
NLS
S-W
B es
timat
e 20
11
Prov
ince
5
year
s CB
S
Targ
et 1
.2 B
y 20
30, r
educ
e at
leas
t by
half
the
prop
orti
on o
f men
, wom
en a
nd c
hild
ren
of a
ll ag
es li
ving
in p
over
ty in
all
its
dim
ensi
ons
acco
rdin
g to
nat
iona
l defi
niti
ons
1.2
.1
Prop
ortio
n of
pop
ulat
ion
livin
g be
low
the
natio
nal p
over
ty li
ne
25.2
38
.8
NLS
S N
LSS-
WB
estim
ate
2011
Pr
ovin
ce
5 ye
ars
CBS
(per
cent
)
1
Wom
en o
f all
ages
bel
ow n
atio
nal p
over
ty li
ne (p
erce
nt)
25.3
39
.3
NLS
S N
LSS-
WB
estim
ate
2011
Pr
ovin
ce
5 ye
ars
CBS
1.2
.2
Prop
ortio
n of
men
, wom
en a
nd c
hild
ren
of a
ll ag
es li
ving
in
pove
rty
in a
ll its
dim
ensi
ons
acco
rdin
g to
nat
iona
l defi
nitio
ns
1
Mul
tidim
ensi
onal
Pov
erty
Inde
x (M
PI)
28.6
51
.2
PMIC
S N
PC
2014
D
istr
ict
5 ye
ars
PPC
2
Child
ren
belo
w n
atio
nal p
over
ty li
ne
35.4
48
N
LSS
NLS
S-W
B es
timat
e 20
11
Prov
ince
5
year
s CB
S
(u
nder
5 y
ears
of a
ge, p
erce
nt)
Targ
et 1
.3 Im
plem
ent n
atio
nally
app
ropr
iate
soc
ial p
rote
ctio
n sy
stem
s an
d m
easu
res
for a
ll, in
clud
ing
floor
s, a
nd b
y 20
30 a
chie
ve s
ubst
anti
al c
over
age
of th
e po
or a
nd th
e vu
lner
able
1
Soci
al p
rote
ctio
n ex
pend
iture
in to
tal b
udge
t (pe
rcen
t)
11
Re
port
Pr
ovin
ce
Ann
ual
PPC/
MO
EAP
2
Empl
oyed
peo
ple
with
inco
me
less
than
US$
1.9
in P
urch
asin
g 16
.5
25.6
N
LSS
NLS
S-W
B es
timat
e 20
11
Prov
ince
5
year
s CB
S
Po
wer
Par
ity (P
PPs)
val
ue p
er d
ay (p
erce
nt)
Targ
et 1
.4 B
y 20
30, e
nsur
e th
at a
ll m
en a
nd w
omen
, in
part
icul
ar, t
he p
oor a
nd th
e vu
lner
able
, hav
e eq
ual r
ight
s to
eco
nom
ic re
sour
ces,
as
wel
l as
acce
ss to
bas
ic s
ervi
ces,
ow
ners
hip
and
cont
rol o
ver l
and
and
othe
r for
ms
of p
rope
rty,
inhe
rita
nce,
nat
ural
reso
urce
s, a
ppro
pria
te n
ew te
chno
logy
and
fina
ncia
l ser
vice
s, in
clud
ing
mic
rofin
ance
1.4
.1
Prop
ortio
n of
pop
ulat
ion
livin
g in
hou
seho
lds
with
acc
ess
to
basi
c se
rvic
es
1
Hou
seho
lds
havi
ng a
cces
s to
mar
ket c
entr
e w
ithin
30
min
wal
k 44
.7
18.8
N
LSS
NLS
S-W
B es
timat
e 20
11
Prov
ince
5
year
s CB
S
(p
erce
nt o
f tot
al)
2
Hou
seho
ld h
avin
g ba
nk a
ccou
nt (p
erce
nt o
f tot
al)
68.3
48
.1
NLS
S N
DH
S-W
B es
timat
e 20
16
Prov
ince
5
year
s CB
S
3
Hou
seho
lds
cove
red
by fo
rmal
fina
ncia
l ser
vice
s (p
erce
nt o
f tot
al)
40i
N
LSS
Prov
ince
5
year
s CB
S
1.4
.2
Prop
ortio
n of
tota
l adu
lt po
pula
tion
with
sec
ure
tenu
re ri
ghts
to
land
, with
lega
lly re
cogn
ized
doc
umen
tatio
n an
d w
ho p
erce
ive
thei
r rig
hts
to la
nd a
s se
cure
, by
sex
and
by ty
pe o
f ten
ure

S D G B A S E L I N E R E P O R T42
TA
RGET
S A
ND
IND
ICAT
ORS
B
ASE
LIN
E FI
GU
RE (2
015)
NAT
ION
AL
KA
RNA
LI
PRO
VIN
CE
PRO
POSE
D
DAT
A S
OU
RCE
DAT
A Y
EAR
DIS
AG
GRE
GAT
ION
FR
EQU
ENC
Y RE
SPO
NSI
BLE
D
ATA
SO
URC
E PR
OV
IDED
AG
ENC
Y
IN T
HE
REPO
RT
SD
G 1
. EN
D P
OV
ERTY
IN A
LL IT
S FO
RMS
EVER
YW
HER
E M
ON
ITO
RIN
G F
RA
MEW
ORK
1
Shar
e of
bot
tom
qui
ntile
in n
atio
nal c
onsu
mpt
ion
(per
cent
) 7
7.9
NLS
S N
LSS-
WB
estim
ate
2011
Pr
ovin
ce
5 ye
ars
CBS
2
Prop
ortio
n of
the
urba
n po
pula
tion
in th
e lo
wes
t qui
ntile
s th
at
NLS
S
P
rovi
nce
5 y
ears
C
BS
spen
ds m
ore
than
30
perc
ent o
f its
inco
me
on a
ccom
mod
atio
n
3
Prop
ortio
n of
the
popu
latio
n in
the
low
est q
uint
iles
that
spe
nds
NLS
S
Pr
ovin
ce
5 ye
ars
CBS
mor
e th
an [1
0 pe
rcen
t] o
f its
inco
me
on b
asic
ser
vice
s
(w
ater
, san
itatio
n, e
nerg
y, e
duca
tion,
hea
lth, t
rans
port
)
Targ
et 1
.5 B
y 20
30, b
uild
the
resi
lienc
e of
the
poor
and
thos
e in
vul
nera
ble
situ
atio
ns a
nd re
duce
thei
r exp
osur
e an
d vu
lner
abili
ty to
clim
ate-
rela
ted
extr
eme
even
ts a
nd o
ther
eco
nom
ic, s
ocia
l and
en
viro
nmen
tal s
hock
s an
d di
sast
ers
1.5
.1
Num
ber o
f dea
ths,
mis
sing
per
sons
and
dire
ctly
affe
cted
per
sons
at
trib
uted
to d
isas
ters
per
100
,000
pop
ulat
ion
1
Loss
of l
ives
from
dis
aste
r (nu
mbe
r)
8891
j 1
57
Adm
in d
ata
Dis
tric
t A
nnua
l M
OH
A/M
OIA
L
2
Mis
sing
per
sons
and
per
sons
affe
cted
by
disa
ster
per
100
,000
41
5j
Adm
in d
ata
Dis
tric
t A
nnua
l M
OH
A/M
OIA
L
(n
umbe
r)
1.5
.4
Prop
ortio
n of
loca
l gov
ernm
ents
that
ado
pt a
nd im
plem
ent l
ocal
Ad
min
dat
a
D
istr
ict
Ann
ual
MO
IAL/
di
sast
er ri
sk re
duct
ion
stra
tegi
es in
line
with
nat
iona
l dis
aste
r ris
k
MO
ITFE
re
duct
ion
stra
tegi
es
Cont
inue
d...

K A R N A L I P R O V I N C E 43
SDG
#2:
End
hun
ger,
achi
eve
food
sec
urit
y an
d im
prov
ed n
utri
tion
and
pro
mot
e su
stai
nabl
e ag
ricu
ltur
e
TA
RGET
S A
ND
IND
ICAT
ORS
B
ASE
LIN
E FI
GU
RE (2
015)
NAT
ION
AL
KA
RNA
LI
PRO
VIN
CE
PRO
POSE
D
DAT
A S
OU
RCE
DAT
A Y
EAR
DIS
AG
GRE
GAT
ION
FR
EQU
ENC
Y RE
SPO
NSI
BLE
D
ATA
SO
URC
E PR
OV
IDED
AG
ENC
Y
IN T
HE
REPO
RT
SD
G 2
: EN
D H
UN
GER
, ACH
IEV
E FO
OD
SEC
URI
TY A
ND
IMPR
OV
ED N
UTR
ITIO
N A
ND
PRO
MO
TE
MO
NIT
ORI
NG
FR
AM
EWO
RK
SU
STA
INA
BLE
AG
RICU
LTU
RE
Targ
et 2
.1 B
y 20
30, e
nd h
unge
r and
ens
ure
acce
ss b
y al
l peo
ple,
in p
arti
cula
r, th
e po
or a
nd p
eopl
e in
vul
nera
ble
situ
atio
ns, i
nclu
ding
infa
nts,
to s
afe,
nut
riti
ous
and
suffi
cien
t foo
d al
l yea
r rou
nd
2.1
.1
Prev
alen
ce o
f und
erno
uris
hmen
t 38
55
.6
PLSS
N
LSS-
WB
estim
ate
2011
Pr
ovin
ce
5 ye
ars
PSO
1
Popu
latio
n sp
endi
ng m
ore
than
two-
third
s of
tota
l con
sum
ptio
n 44
.1
63.1
N
LSS
NLS
S-W
B es
timat
e 20
11
Prov
ince
5
year
s CB
S
on
food
(per
cent
)
2
Per c
apita
food
gra
in p
rodu
ctio
n (k
g)
197
185
MIS
/rep
ort
Agric
ultu
re s
tatis
tics
2017
D
istr
ict
Ann
ual
MO
ALC
3
Acce
ss to
dry
ing,
sto
rage
, and
pro
cess
ing
faci
litie
s
Ad
min
dat
a
D
istr
ict
Ann
ual
MO
ALS
C
Targ
et 2
.2 B
y 20
30, e
nd a
ll fo
rms
of m
alnu
trit
ion,
incl
udin
g ac
hiev
ing,
by
2025
, the
inte
rnat
iona
lly a
gree
d ta
rget
s on
stu
ntin
g an
d w
asti
ng in
chi
ldre
n un
der 5
yea
rs o
f age
, and
add
ress
the
nutr
itio
nal n
eeds
of
adol
esce
nt g
irls
, pre
gnan
t and
lact
atin
g w
omen
and
old
er p
erso
ns
2.2
.1
Prev
alen
ce o
f stu
ntin
g (h
eigh
t for
age
<-2
sta
ndar
d de
viat
ion
36
54.5
PM
ICS
ND
HS-
WB
estim
ate
2016
D
istr
ict
5 ye
ars
MO
SD/P
SO
from
the
med
ian
of th
e W
orld
Hea
lth O
rgan
izat
ion
(WH
O) C
hild
G
row
th S
tand
ards
) am
ong
child
ren
unde
r 5 y
ears
of a
ge
2.2
.2
Prev
alen
ce o
f mal
nutr
ition
(wei
ght f
or h
eigh
t >+2
or <
-2 s
tand
ard
9.7
7.5
PMIC
S N
DH
S-W
B es
timat
e 20
16
Dis
tric
t 5
year
s M
OSD
/PSO
de
viat
ion
from
the
med
ian
of th
e W
orld
Hea
lth O
rgan
izat
ion
(WH
O)
Child
Gro
wth
Sta
ndar
ds) a
mon
g ch
ildre
n un
der 5
yea
rs
of a
ge, b
y ty
pe (w
astin
g an
d ov
erw
eigh
t)
1
Pro
port
ion
of c
hild
ren
unde
r age
5 y
ears
who
are
und
erw
eigh
t 30
.1
35.5
PM
ICS
Dis
tric
t 5
year
s M
OSD
/PSO
(-2
SD
) (pe
rcen
t of t
otal
)
2
Prev
alen
ce o
f ana
emia
am
ong
wom
en o
f rep
rodu
ctiv
e ag
e 33
.5
29.4
PM
ICS
ND
HS
20
16
Dis
tric
t 5
year
s M
OSD
/PSO
(p
erce
nt)
3
Prev
alen
ce o
f ana
emia
am
ong
child
ren
unde
r 5 y
ears
(per
cent
) 46
4
8.4
PMIC
S
D
istr
ict
5 ye
ars
MO
SD/P
SO
4
Sick
le c
ell a
naem
ia in
fect
ed p
opul
atio
n
PMIC
S
D
istr
ict
5 ye
ars
MO
SD/P
SO
Targ
et 2
.3 B
y 20
30, d
oubl
e th
e ag
ricu
ltur
al p
rodu
ctiv
ity
and
inco
mes
of s
mal
l-sca
le fo
od p
rodu
cers
, in
par
ticu
lar w
omen
, ind
igen
ous
peop
les,
fam
ily fa
rmer
s, p
asto
ralis
ts a
nd fi
sher
s, in
clud
ing
thro
ugh
sec
ure
and
equa
l acc
ess
to la
nd, o
ther
pro
duct
ive
reso
urce
s an
d in
puts
, kno
wle
dge,
fina
ncia
l ser
vice
s, m
arke
ts a
nd o
ppor
tuni
ties
for v
alue
add
itio
n an
d no
n-fa
rm e
mpl
oym
ent
2.3
.1
Volu
me
of p
rodu
ctio
n pe
r lab
our u
nit b
y cl
asse
s of
fa
rmin
g/pa
stor
al/f
ores
try
ente
rpris
e si
ze
2.3
.2
Aver
age
annu
al in
com
e of
sm
all-s
cale
food
pro
duce
rs, b
y se
x
and
indi
geno
us s
tatu
s
1
Aver
age
inco
me
of s
mal
l-sca
le fo
od p
rodu
cers
in N
Rs.
3556
0 28
102
NLS
S N
LSS-
WB
estim
ate
2016
Pr
ovin
ce
5 ye
ars
CBS
2
Aver
age
inco
me
of s
mal
l-sca
le fo
od p
rodu
cers
in N
Rs.:
Mal
e 40
148
2927
1 N
LSS
NLS
S-W
B es
timat
e 20
11
Prov
ince
5
year
s CB
S

S D G B A S E L I N E R E P O R T44
TA
RGET
S A
ND
IND
ICAT
ORS
B
ASE
LIN
E FI
GU
RE (2
015)
NAT
ION
AL
KA
RNA
LI
PRO
VIN
CE
PRO
POSE
D
DAT
A S
OU
RCE
DAT
A Y
EAR
DIS
AG
GRE
GAT
ION
FR
EQU
ENC
Y RE
SPO
NSI
BLE
D
ATA
SO
URC
E PR
OV
IDED
AG
ENC
Y
IN T
HE
REPO
RT
SD
G 2
. EN
D H
UN
GER
, ACH
IEV
E FO
OD
SEC
URI
TY A
ND
IMPR
OV
ED N
UTR
ITIO
N A
ND
PRO
MO
TE S
UST
AIN
AB
LE A
GRI
CULT
URE
M
ON
ITO
RIN
G F
RA
MEW
ORK
3
Aver
age
inco
me
of s
mal
l-sca
le fo
od p
rodu
cers
NRs
: Fem
ale
3983
7 28
022
NLS
S N
LSS-
WB
estim
ate
2011
Pr
ovin
ce
5 ye
ars
CBS
4
Aver
age
inco
me
of s
mal
l-sca
le fo
od p
rodu
cers
NRs
: Ind
igen
ous
3338
7 23
928
NLS
S N
LSS-
WB
estim
ate
2011
Pr
ovin
ce
5 ye
ars
CBS
5
Aver
age
inco
me
of s
mal
l-sca
le fo
od p
rodu
cers
NRs
: Non
-indi
geno
us
4320
6 32
232
NLS
S N
LSS-
WB
estim
ate
2011
Pr
ovin
ce
5 ye
ars
CBS
6
Land
pro
duct
ivity
(AG
PA/h
a) U
SD
3278
Adm
in. D
ata
Dis
tric
t A
nnua
l M
OA
LC
Targ
et 2
.4 B
y 20
30, e
nsur
e su
stai
nabl
e fo
od p
rodu
ctio
n sy
stem
s an
d im
plem
ent r
esili
ent a
gric
ultu
ral p
ract
ices
that
incr
ease
pro
duct
ivit
y an
d pr
oduc
tion
, tha
t hel
p m
aint
ain
ecos
yste
ms,
that
str
engt
hen
capa
city
fo
r ada
ptat
ion
to c
limat
e ch
ange
, ext
rem
e w
eath
er, d
roug
ht, fl
oodi
ng a
nd o
ther
dis
aste
rs a
nd th
at p
rogr
essi
vely
impr
ove
land
and
soi
l qua
lity
2.4
.1
Prop
ortio
n of
agr
icul
tura
l are
a un
der p
rodu
ctiv
e an
d su
stai
nabl
e ag
ricul
ture
1
Tota
l agr
icul
tura
l lan
d at
the
pres
ent l
evel
(000
hec
tare
) 25
48
Ad
min
dat
a N
RB
2017
D
istr
ict
Ann
ual
MO
ALC
2
Roun
d th
e ye
ar ir
rigat
ed la
nd in
tota
l ara
ble
land
(per
cent
) 29
.2
31.5
Ad
min
dat
a N
LSS-
WB
estim
ate
2011
D
istr
ict
Ann
ual
MO
ALC
3
Culti
vate
d la
nd in
the
tota
l agr
icul
ture
land
(per
cent
)
Ag
ri. C
ensu
s
D
istr
ict
10 y
ear
CBS
Cont
inue
d...

K A R N A L I P R O V I N C E 45
SDG
#3:
Ens
ure
heal
thy
lives
and
pro
mot
e w
ell-b
eing
for a
ll at
all
ages
TA
RGET
S A
ND
IND
ICAT
ORS
B
ASE
LIN
E FI
GU
RE (2
015)
NAT
ION
AL
KA
RNA
LI
PRO
VIN
CE
PRO
POSE
D
DAT
A S
OU
RCE
DAT
A Y
EAR
DIS
AG
GRE
GAT
ION
FR
EQU
ENC
Y RE
SPO
NSI
BLE
D
ATA
SO
URC
E PR
OV
IDED
AG
ENC
Y
IN T
HE
REPO
RT
G
OA
L 3:
EN
SURE
HEA
LTH
Y LI
VES
AN
D P
ROM
OTE
WEL
L-B
EIN
G F
OR
ALL
AT
ALL
AG
ES
Targ
et 3
.1 By
203
0, re
duce
the
glob
al m
ater
nal m
orta
lity
rati
o to
less
than
70
per 1
00,0
00 li
ve b
irth
s
3.1
.1
Mat
erna
l mor
talit
y ra
tio p
er 1
0000
0 liv
e bi
rths
25
8
PMIC
S
U
rban
-rur
al (P
rov)
5
year
s M
OSD
/PSO
3.1.
2
Prop
ortio
n of
birt
hs a
tten
ded
by s
kille
d he
alth
per
sonn
el
58
59
PMIC
S N
DH
S, K
arna
li Pr
ovin
ce
2016
D
istr
ict
5 ye
ars
MO
SD/P
SO
Five
yea
rs P
lann
ing:
A
ppro
ach
pape
r
3.1.
3
Num
ber o
f Ute
rine
prol
apse
cas
es
HM
IS
Dis
tric
t A
nnua
l M
OSD
/PSO
Targ
et 3
.2 B
y 20
30, e
nd p
reve
ntab
le d
eath
s of
new
born
s an
d ch
ildre
n un
der 5
yea
rs o
f age
, wit
h al
l cou
ntri
es a
imin
g to
redu
ce n
eona
tal m
orta
lity
to a
t lea
st a
s lo
w a
s 12
per
1,0
00 li
ve b
irth
s an
d un
der-
5 m
orta
lity
to a
t lea
st a
s lo
w a
s 25
per
1,0
00 li
ve b
irth
s
3.2
.1
Und
er-fi
ve m
orta
lity
rate
per
100
0 liv
e bi
rths
39
58
PM
ICS
ND
HS
2016
D
istr
ict
5 ye
ars
MO
SD/P
SO
3.2
.2
Neo
nata
l mor
talit
y ra
te p
er 1
000
live
birt
hs
24
29
PMIC
S N
DH
S 20
16
Dis
tric
t 5
year
s M
OSD
/PSO
Targ
et 3
.3 B
y 20
30, e
nd th
e ep
idem
ics
of A
cqui
red
Imm
une
Defi
cien
cy S
yndr
ome
(AID
S), t
uber
culo
sis,
mal
aria
and
neg
lect
ed tr
opic
al d
isea
ses
and
com
bat h
epat
itis
, wat
er-b
orne
dis
ease
s an
d ot
her
com
mun
icab
le d
isea
ses
a. N
umbe
r of n
ew H
IV in
fect
ions
17
81
9 H
MIS
D
OH
S 20
17
Dis
tric
t A
nnua
l M
OSD
/PSO
b. T
uber
culo
sis
inci
denc
e (p
er 1
00,0
00 p
opul
atio
n)
111
98
HM
IS
DO
HS
2017
D
istr
ict
Ann
ual
MO
SD/P
SO
c. M
alar
ia in
cide
nce
(per
100
,000
pop
ulat
ion)
10
13
H
MIS
D
OH
S 20
17
Dis
tric
t A
nnua
l M
OSD
/PSO
d. H
epat
itis
B pr
eval
ence
(per
100
,000
pop
ulat
ion)
26
54
H
MIS
D
istr
ict
Ann
ual
MO
SD/P
SO
3.3.
5
Num
ber o
f peo
ple
requ
iring
inte
rven
tions
aga
inst
neg
lect
ed
trop
ical
dis
ease
s
a. L
epro
sy in
cide
nce
rate
per
1,0
00 p
opul
atio
n 11
7
HM
IS
DO
HS
2017
D
istr
ict
Ann
ual
MO
SD/P
SO
b. K
ala-
azar
(Lei
shm
ania
sis)
cas
es*
325
H
MIS
D
istr
ict
Ann
ual
MO
SD/P
SO
c. L
ymph
atic
Fila
riasi
s ca
ses
1,35
4 56
H
MIS
D
OH
S 20
17
Dis
tric
t A
nnua
l M
OSD
/PSO
d. D
engu
e ca
ses
931
7 H
MIS
D
OH
S 20
17
Dis
tric
t A
nnua
l M
OSD
/PSO
e. T
rach
oma
case
s 22
421
251
HM
IS
DO
HS
2017
D
istr
ict
Ann
ual
MO
SD/P
SO
f. N
o of
Ute
rine
prol
apse
d ca
ses
H
MIS
D
istr
ict
Ann
ual
MO
SD/P
SO
Targ
et 3
.4 B
y 20
30, r
educ
e by
one
-thi
rd p
rem
atur
e m
orta
lity
from
non
-com
mun
icab
le d
isea
ses
thro
ugh
prev
enti
on a
nd tr
eatm
ent a
nd p
rom
ote
men
tal h
ealt
h an
d w
ell-b
eing
a. P
erce
nt o
f chi
ldre
n un
der a
ge 5
with
dia
rrho
ea in
the
last
2 w
eeks
7.
6 6
PMIC
S N
DH
S 20
16
Dis
tric
t A
nnua
l M
OSD
/PSO
b. N
umbe
r of l
abor
ator
y co
nfirm
ed c
ases
of i
nflue
nza
(H1N
1)
204
H
MIS
D
istr
ict
Ann
ual
MO
SD/P
SO
3.4.
1
Mor
talit
y ra
te a
ttrib
uted
to c
ardi
ovas
cula
r dis
ease
, can
cer,
di
abet
es o
r chr
onic
resp
irato
ry d
isea
se

S D G B A S E L I N E R E P O R T46
TA
RGET
S A
ND
IND
ICAT
ORS
B
ASE
LIN
E FI
GU
RE (2
015)
NAT
ION
AL
KA
RNA
LI
PRO
VIN
CE
PRO
POSE
D
DAT
A S
OU
RCE
DAT
A Y
EAR
DIS
AG
GRE
GAT
ION
FR
EQU
ENC
Y RE
SPO
NSI
BLE
D
ATA
SO
URC
E PR
OV
IDED
AG
ENC
Y
IN T
HE
REPO
RT
SD
G 3
. EN
SURE
HEA
LTH
Y LI
VES
AN
D P
ROM
OTE
WEL
L-B
EIN
G F
OR
ALL
AT
ALL
AG
ES
MO
NIT
ORI
NG
FR
AM
EWO
RK
a. M
orta
lity
betw
een
30 a
nd 7
0 ye
ars
of a
ge fr
om C
ardi
ovas
cula
r 2.
8
CRVS
/HM
IS
Dis
tric
t A
nnua
l M
OSD
/LG
s
di
seas
e, C
ance
r, D
iabe
tes
or C
hron
ic re
spira
tory
dis
ease
(p
er 1
000
popu
latio
n)
a. C
ardi
ovas
cula
r dis
ease
1.
44
CR
VS/H
MIS
D
istr
ict
Ann
ual
MO
SD/L
Gs
b. C
ance
r 0.
67
CR
VS/H
MIS
D
istr
ict
Ann
ual
MO
SD/L
Gs
c. D
iabe
tes
0.27
CRVS
/HM
IS
Dis
tric
t A
nnua
l M
OSD
/LG
s
d. C
hron
ic re
spira
tory
dis
ease
0.
8
CRVS
/HM
IS
Dis
tric
t A
nnua
l M
OSD
/LG
s
3.4.
2
Suic
ide
mor
talit
y ra
te (
per 1
00,0
00 p
opul
atio
n)
16.5
Adm
in d
ata
Dis
tric
t A
nnua
l M
OH
A/M
OIA
L
Perc
ent o
f har
d dr
ug u
sers
who
eve
r vis
ited
reha
bilit
atio
n
40
H
ard
Dru
g
D
istr
ict
3 ye
ars
PSO
/MO
IAL
cent
res
for c
ompr
ehen
sive
ser
vice
s
U
sers
’ Sur
vey
Targ
et 3
.6 B
y 20
20, h
alve
the
num
ber o
f glo
bal d
eath
s an
d in
juri
es fr
om ro
ad tr
affic
acci
dent
s
D
istr
ict
3.6
.1
Dea
th ra
te d
ue to
road
traffi
c in
jurie
s 19
.86
Tr
affic
polic
e
D
istr
ict
Ann
ual
Nep
al p
olic
e
repo
rts
Targ
et 3
.7 B
y 20
30, e
nsur
e un
iver
sal a
cces
s to
sex
ual a
nd re
prod
ucti
ve h
ealt
h-ca
re s
ervi
ces,
incl
udin
g fo
r fam
ily p
lann
ing,
info
rmat
ion
and
educ
atio
n, a
nd th
e in
tegr
atio
n of
repr
oduc
tive
hea
lth
into
nat
iona
l st
rate
gies
and
pro
gram
s
3.7.
1
a. P
ropo
rtio
n of
wom
en o
f rep
rodu
ctiv
e ag
e 15
-49
year
s) w
ho
56
57.9
PM
ICS
ND
HS
2016
D
istr
ict
5 ye
ars
MO
SD/P
SO
have
thei
r nee
d fo
r fam
ily p
lann
ing
satis
fied
with
mod
ern
m
etho
ds
b. C
ontr
acep
tive
prev
alen
ce ra
te (m
oder
n m
etho
ds) (
perc
ent)
42
.8
44.5
PM
ICS
ND
HS
2016
D
istr
ict
5 ye
ars
MO
SD/P
SO
c. To
tal F
ertil
ity R
ate
(TFR
) (bi
rths
per
wom
en a
ged
15-4
9 ye
ars)
2.
3 19
PM
ICS
ND
HS
2016
D
istr
ict
5 ye
ars
MO
SD/P
SO
3.7.
2
Adol
esce
nt b
irth
rate
(age
d 10
-14
year
s; a
ged
15-1
9 ye
ars)
71
PMIC
S
D
istr
ict
5 ye
ars
MO
SD/P
SO
per 1
,000
wom
en in
that
age
gro
up
Targ
et 3
.8 A
chie
ve u
nive
rsal
hea
lth
cove
rage
, inc
ludi
ng fi
nanc
ial r
isk
prot
ecti
on, a
cces
s to
qua
lity
esse
ntia
l hea
lth-
care
ser
vice
s an
d ac
cess
to s
afe,
eff
ecti
ve, q
ualit
y an
d aff
orda
ble
esse
ntia
l med
icin
es a
nd
vacc
ines
for a
ll
3.8.
1
a. P
erce
ntag
es o
f wom
en h
avin
g 4
ante
nata
l car
e vi
sits
as
53
49
PM
ICS/
HM
IS
ND
HS
2016
D
istr
ict
5 ye
ars
MO
SD/P
SO
per p
roto
col (
amon
g liv
e bi
rths
)
b. P
erce
ntag
es o
f ins
titut
iona
l del
iver
y
54.6
36
PM
ICS/
HM
IS
MO
HP
2017
D
istr
ict
5 ye
ars
MO
SD/P
SO
c. P
erce
ntag
es o
f wom
en a
tten
ding
thre
e PN
C as
per
pro
toco
l 20
20
PM
ICS/
HM
IS
ND
HS
2016
D
istr
ict
5 ye
ars
MO
SD/P
SO
d. P
erce
ntag
es o
f inf
ants
rece
ivin
g 3
dose
s of
Hep
atiti
s B
vacc
ine
86
83
.3
PMIC
S/H
MIS
N
DH
S 20
16
Dis
tric
t 5
year
s M
OSD
/PSO
e. P
erce
ntag
es o
f wom
en a
ged
30-4
9 ye
ars
scre
ened
for
16.6
PMIC
S/H
MIS
D
istr
ict
5 ye
ars
MO
SD/P
SO
cerv
ical
can
cer
Cont
inue
d...

K A R N A L I P R O V I N C E 47
TA
RGET
S A
ND
IND
ICAT
ORS
B
ASE
LIN
E FI
GU
RE (2
015)
NAT
ION
AL
KA
RNA
LI
PRO
VIN
CE
PRO
POSE
D
DAT
A S
OU
RCE
DAT
A Y
EAR
DIS
AG
GRE
GAT
ION
FR
EQU
ENC
Y RE
SPO
NSI
BLE
D
ATA
SO
URC
E PR
OV
IDED
AG
ENC
Y
IN T
HE
REPO
RT
SD
G 3
. EN
SURE
HEA
LTH
Y LI
VES
AN
D P
ROM
OTE
WEL
L-B
EIN
G F
OR
ALL
AT
ALL
AG
ES
MO
NIT
ORI
NG
FR
AM
EWO
RK
f. P
erce
ntag
e of
peo
ple
livin
g w
ith H
IV re
ceiv
ing
39
.9
PM
ICS/
HM
IS
Dis
tric
t 5
year
s M
OSD
/PSO
A
ntire
trov
iral c
ombi
natio
n th
erap
y
g. P
erce
ntag
e of
pop
ulat
ion
aged
15
year
s an
d ab
ove
with
PM
ICS/
HM
IS
Dis
tric
t 5
year
s M
OSD
/PSO
ra
ised
blo
od p
ress
ure
who
are
cur
rent
ly ta
king
med
icat
ion
g.1.
Per
cent
age
of m
ale
popu
latio
n ag
ed 1
5 ye
ars
and
abov
e
33.4
11
PM
ICS/
HM
IS
ND
HS
2016
D
istr
ict
5 ye
ars
MO
SD/P
SO
with
rais
ed b
lood
pre
ssur
e w
ho a
re c
urre
ntly
taki
ng m
edic
atio
n
g.2.
Per
cent
age
of fe
mal
e po
pula
tion
aged
15
year
s an
d ab
ove
34
.3
20.9
PM
ICS/
HM
IS
ND
HS
2016
D
istr
ict
7 ye
ars
MO
SD/P
SO
with
rais
ed b
lood
pre
ssur
e w
ho a
re c
urre
ntly
taki
ng m
edic
atio
n
h. P
erce
ntag
e of
pop
ulat
ion
aged
15
year
s an
d ab
ove
with
25
PMIC
S/H
MIS
D
istr
ict
5 ye
ars
MO
SD/P
SO
rais
ed b
lood
glu
cose
who
are
cur
rent
ly ta
king
med
icat
ion
i. Pe
rcen
tage
of h
ouse
hold
s w
ithin
30
min
utes
trav
el ti
me
49
23
N
LSS
NLS
S-W
B es
timat
e 20
11
Prov
ince
5
year
s M
OSD
/PSO
to
hea
lth fa
cilit
y
j. Pe
rcen
tage
of p
oor p
eopl
e en
rolle
d in
hea
lth in
sura
nce
0
N
LSS/
HM
IS
Prov
ince
5
year
s CB
S
3.8.
2
1. P
ropo
rtio
n of
pop
ulat
ion
with
larg
e ho
useh
old
expe
nditu
res
10
.7
6.9
N
LSS
Prov
ince
5
year
s CB
S
on
hea
lth a
s a
shar
e of
tota
l hou
seho
ld e
xpen
ditu
re o
r
in
com
e (p
erce
nt)
2. P
erce
ntag
e of
out
of p
ocke
t exp
endi
ture
in to
tal
53
N
LSS
Prov
ince
5
year
s CB
S
he
alth
exp
endi
ture
Targ
et 3
.9 B
y 20
30, s
ubst
anti
ally
redu
ce th
e nu
mbe
r of d
eath
s an
d ill
ness
es fr
om h
azar
dous
che
mic
als
and
air,
wat
er a
nd s
oil p
ollu
tion
and
con
tam
inat
ion
3.9.
1
Mor
talit
y at
trib
uted
to h
ouse
hold
s an
d am
bien
t air
pollu
tion
(%)
GBD
Stu
dy
Prov
ince
A
nnua
l M
OH
P
3.9.
2
Mor
talit
y at
trib
uted
to u
nsaf
e w
ater
, uns
afe
sani
tatio
n
GBD
Stu
dy
Prov
ince
A
nnua
l M
OH
P
and
hygi
ene
for a
ll W
ASH
Ser
vice
(%)
3.9.
3
Dea
ths
from
haz
ardo
us c
hem
ical
s (t
oxic
sub
stan
ces,
G
BD S
tudy
P
rovi
nce
Ann
ual
MO
HP
pest
icid
es, e
tc.)
(num
ber)
3b.
Su
ppor
t the
rese
arch
and
dev
elop
men
t of v
acci
nes
and
med
icin
es fo
r the
com
mun
icab
le a
nd n
on-c
omm
unic
able
dis
ease
s th
at p
rimar
ily a
ffect
dev
elop
ing
coun
trie
s, pr
ovid
e ac
cess
to a
fford
able
ess
entia
l med
icin
es
and
vacc
ines
, in
acco
rdan
ce w
ith th
e D
oha
Dec
lara
tion
on th
e TR
IPS
Agre
emen
t and
Pub
lic H
ealth
, whi
ch a
ffirm
s th
e rig
ht o
f dev
elop
ing
coun
trie
s to
use
to th
e fu
ll th
e pr
ovis
ions
in th
e Ag
reem
ent o
n Tr
ade-
Rela
ted
A
spec
ts o
f Int
elle
ctua
l Pro
pert
y Ri
ghts
rega
rdin
g fle
xibi
litie
s to
pro
tect
pub
lic h
ealth
, and
, in
part
icul
ar, p
rovi
de a
cces
s to
med
icin
es fo
r all
3b.1
a.
Pro
port
ion
of th
e ta
rget
pop
ulat
ion
cove
red
by a
ll va
ccin
es
88
H
MIS
/ PM
ICS
Dis
tric
t 5
year
s M
OSD
/PSO
in
clud
ed in
thei
r nat
iona
l pro
gram
me
b. P
erce
ntag
es o
f hea
lth s
ecto
r bud
get i
n th
e to
tal
Budg
et b
ook
Prov
ince
A
nnua
l M
OSD
/MO
EAP
gove
rnm
ent b
udge
t
c. P
erce
ntag
es o
f hea
lth s
ecto
r bud
get f
or re
sear
ch
n.a.
Budg
et b
ook
Prov
ince
A
nnua
l M
OSD
/MO
EAP
and
deve
lopm
ent
Cont
inue
d...

S D G B A S E L I N E R E P O R T48
TA
RGET
S A
ND
IND
ICAT
ORS
B
ASE
LIN
E FI
GU
RE (2
015)
NAT
ION
AL
KA
RNA
LI
PRO
VIN
CE
PRO
POSE
D
DAT
A S
OU
RCE
DAT
A Y
EAR
DIS
AG
GRE
GAT
ION
FR
EQU
ENC
Y RE
SPO
NSI
BLE
D
ATA
SO
URC
E PR
OV
IDED
AG
ENC
Y
IN T
HE
REPO
RT
SD
G 3
. EN
SURE
HEA
LTH
Y LI
VES
AN
D P
ROM
OTE
WEL
L-B
EIN
G F
OR
ALL
AT
ALL
AG
ES
MO
NIT
ORI
NG
FR
AM
EWO
RK
3b.3
Pr
opor
tion
of h
ealth
faci
litie
s th
at h
ave
a co
re s
et o
f rel
evan
t
es
sent
ial m
edic
ines
ava
ilabl
e an
d aff
orda
ble
on a
sus
tain
able
bas
is
a. P
erce
ntag
e of
gov
ernm
ent h
ealth
faci
litie
s w
ith n
o st
ock
out
70
LM
IS
Dis
tric
t A
nnua
l M
OH
P/M
OSD
of
ess
entia
l dru
gs
3c S
ubst
antia
lly in
crea
se h
ealth
fina
ncin
g an
d th
e re
crui
tmen
t, de
velo
pmen
t, tr
aini
ng a
nd re
tent
ion
of th
e he
alth
wor
k fo
rce
in d
evel
opin
g co
untr
ies,
espe
cial
ly in
the
leas
t dev
elop
ed c
ount
ries
and
smal
l isl
and
de
velo
ping
Sta
tes
a. H
ealth
wor
ker d
ensi
ty a
nd d
istr
ibut
ion
(per
100
0 po
pula
tion)
1.
05
Ad
min
dat
a
D
istr
ict
Ann
ual
MO
HP/
MO
SD
Cont
inue
d...
Not
e: N
DH
S an
d N
MIC
S do
n’t p
rovi
de re
liabl
e es
timat
es b
elow
pro
vinc
e le
vel d
ue to
thei
r sm
all s
ampl
e si
zes.
As
such
, a
tailo
red-
mad
e su
rvey
con
sist
ing
of th
e fe
atur
es o
f ND
HS
and
NM
ICS
is re
quire
d to
mon
itor S
DG
3 an
d pe
rfor
man
ce o
f the
hea
lth-r
elat
ed p
rogr
ams
for t
he p
rovi
ncia
l gov
ernm
ent.
The
Prov
inci
al M
ultip
le In
dica
tor C
lust
er S
urve
y (P
MIC
S) w
ith a
dequ
ate
sam
ple
size
whi
ch c
an p
rovi
de re
liabl
e es
timat
es u
p to
dis
tric
t lev
el is
des
ired
to fi
ll th
e da
ta g
ap a
t the
pro
vinc
e.

K A R N A L I P R O V I N C E 49
SDG
#4:
Ens
ure
incl
usiv
e an
d eq
uita
ble
qual
ity
educ
atio
n an
d pr
omot
e lif
elon
g le
arni
ng o
ppor
tuni
ties
for a
ll
TA
RGET
S A
ND
IND
ICAT
ORS
B
ASE
LIN
E FI
GU
RE (2
015)
NAT
ION
AL
KA
RNA
LI
PRO
VIN
CE
PRO
POSE
D
DAT
A S
OU
RCE
DAT
A Y
EAR
DIS
AG
GRE
GAT
ION
FR
EQU
ENC
Y RE
SPO
NSI
BLE
D
ATA
SO
URC
E PR
OV
IDED
AG
ENC
Y
IN T
HE
REPO
RT
SD
G 4
: EN
SURE
INCL
USI
VE
AN
D E
QU
ITA
BLE
QU
ALI
TY E
DU
CAT
ION
AN
D P
ROM
OTE
LIF
ELO
NG
M
ON
ITO
RIN
G F
RA
MEW
ORK
LEA
RNIN
G O
PPO
RTU
NIT
IES
FOR
ALL
Targ
et 4
.1 B
y 20
30, e
nsur
e th
at a
ll gi
rls
and
boys
com
plet
e fr
ee, e
quit
able
and
qua
lity
prim
ary
and
seco
ndar
y ed
ucat
ion
lead
ing
to re
leva
nt a
nd e
ffec
tive
lear
ning
out
com
es
4.1.
1
Prop
ortio
n of
chi
ldre
n an
d yo
ung
peop
le: (
a) in
gra
des
2/3;
(b)
at th
e en
d of
prim
ary;
and
(c) a
t the
end
of l
ower
sec
onda
ry
achi
evin
g at
leas
t a m
inim
um p
rofic
ienc
y le
vel i
n (i)
read
ing
and
(ii
) mat
hem
atic
s, by
sex
1
Net
enr
olm
ent r
ate
in p
rimar
y ed
ucat
ion
(per
cent
) 97
.2
97.9
EM
IS
Dep
artm
ent
2017
D
istr
ict
Ann
ual
MO
SD
of e
duca
tion
2
Prim
ary
scho
ol c
ompl
etio
n ra
te (p
erce
nt)
80.6
PMIC
S
D
istr
ict
5- y
ears
M
OSD
/PSO
3
Prop
ortio
n of
pup
ils e
nrol
led
in g
rade
one
who
reac
h gr
ade
76
.6
PM
ICS
Dis
tric
t 5-
yea
rs
MO
SD/P
SO
eigh
t (pe
rcen
t)
4
Ratio
of g
irls
(to
boys
) enr
olle
d in
gra
de o
ne w
ho re
ach
grad
e ei
ght
1.04
PMIC
S
D
istr
ict
5- y
ears
M
OSD
/PSO
5
Ratio
of g
irls
(to
boys
) enr
olle
d in
gra
de o
ne w
ho re
ach
1.
1
PMIC
S
D
istr
ict
5- y
ears
M
OSD
/PSO
gr
ade
twel
ve
6
Gro
ss E
nrol
men
t in
seco
ndar
y ed
ucat
ion
(gra
de 9
to 1
2) (p
erce
nt)
80.3
81
.8
Flas
h re
port
D
epar
tmen
t 20
17
Dis
tric
t A
nnua
l M
OSD
of
edu
catio
n
Targ
et 4
.3 B
y 20
30, e
nsur
e eq
ual a
cces
s fo
r all
wom
en a
nd m
en to
aff
orda
ble
and
qual
ity
tech
nica
l, vo
cati
onal
and
tert
iary
edu
cati
on, i
nclu
ding
uni
vers
ity
4.3.
1
Par
ticip
atio
n ra
te o
f you
th a
nd a
dults
in fo
rmal
and
non
-form
al
educ
atio
n an
d tr
aini
ng in
the
prev
ious
12
mon
ths,
by s
ex
1
Ratio
of g
irls
enro
lmen
t in
tech
nica
l and
voc
atio
nal e
duca
tion
0.53
EMIS
D
istr
ict
Ann
ual
MO
SD
2
Ratio
of g
irls
enro
lmen
t in
tert
iary
edu
catio
n (g
radu
ate
leve
l)
0.88
EMIS
D
istr
ict
Ann
ual
MO
SD
3
Scho
lars
hip
cove
rage
(per
cent
of t
otal
stu
dent
s)
37
EM
IS
Dis
tric
t A
nnua
l M
OSD
Targ
et 4
.4 B
y 20
30, i
ncre
ase
the
num
ber o
f you
th a
nd a
dult
s w
ho h
ave
rele
vant
ski
lls, i
nclu
ding
tech
nica
l and
voc
atio
nal s
kills
, for
em
ploy
men
t, de
cent
jobs
and
ent
repr
eneu
rshi
p
4.4.
1
Prop
ortio
n of
you
th a
nd a
dults
with
info
rmat
ion
and
co
mm
unic
atio
ns te
chno
logy
(IC
T) s
kills
, by
type
of s
kill
1
Yout
h &
adu
lts w
ith te
chni
cal &
voc
atio
nal t
rain
ing
50
EMIS
D
istr
ict
Ann
ual
MO
SD
(num
ber i
n ‘0
00, a
nnua
l)
2
Wor
king
age
pop
ulat
ion
with
tech
nica
l and
voc
atio
nal t
rain
ing
25
EM
IS
Dis
tric
t A
nnua
l M
OSD
(p
erce
nt)
3
Inte
rnet
use
rs (p
erce
nt o
f adu
lt po
pula
tion)
46
.6
M
IS
Dis
tric
t A
nnua
l N
TA

S D G B A S E L I N E R E P O R T50Co
ntin
ued.
..
TA
RGET
S A
ND
IND
ICAT
ORS
B
ASE
LIN
E FI
GU
RE (2
015)
NAT
ION
AL
KA
RNA
LI
PRO
VIN
CE
PRO
POSE
D
DAT
A S
OU
RCE
DAT
A Y
EAR
DIS
AG
GRE
GAT
ION
FR
EQU
ENC
Y RE
SPO
NSI
BLE
D
ATA
SO
URC
E PR
OV
IDED
AG
ENC
Y
IN T
HE
REPO
RT
SD
G 4
: EN
SURE
INCL
USI
VE
AN
D E
QU
ITA
BLE
QU
ALI
TY E
DU
CAT
ION
AN
D P
ROM
OTE
LIF
ELO
NG
M
ON
ITO
RIN
G F
RA
MEW
ORK
LEA
RNIN
G O
PPO
RTU
NIT
IES
FOR
ALL
Targ
et 4
.5 B
y 20
30, e
limin
ate
gend
er d
ispa
riti
es in
edu
cati
on a
nd e
nsur
e eq
ual a
cces
s 4.
5.1
Pa
rity
indi
ces
(fem
ale/
mal
e, ru
ral/u
rban
, bot
tom
/top
wea
lth
quin
tile
and
othe
rs s
uch
as d
isab
ility
sta
tus,
indi
geno
us p
eopl
es
and
confl
ict-
affec
ted,
as
data
bec
ome
avai
labl
e) fo
r all
educ
atio
n
indi
cato
rs o
n th
is li
st th
at c
an b
e di
sagg
rega
ted
1
Gen
der p
arity
inde
x (G
PI) i
n pr
imar
y ed
ucat
ion
(gra
de 1
-5)
1.02
1.
02
Flas
h re
port
D
epar
tmen
t 20
17
Dis
tric
t A
nnua
l M
OSD
of
edu
catio
n
2
Gen
der p
arity
inde
x (G
PI) i
n ba
sic
educ
atio
n (g
rade
6-8
) 1
.02
Fl
ash
repo
rt
Dep
artm
ent
2017
D
istr
ict
Ann
ual
MO
SD
of e
duca
tion
3
Gen
der P
arity
Inde
x (G
PI) (
seco
ndar
y sc
hool
) 1
Fl
ash
repo
rt
Dis
tric
t A
nnua
l M
OSD
4
Gen
der P
arity
Inde
x (G
PI) b
ased
on
liter
acy
(abo
ve 1
5 ye
ars)
0.
62
Po
p. C
ensu
s
LG
s 10
yea
r M
OSD
/PSO
Targ
et 4
.6 B
y 20
30, e
nsur
e th
at a
ll yo
uth
and
at le
ast 9
5 pe
rcen
t of a
dult
s, b
oth
men
and
wom
en, a
chie
ve li
tera
cy a
nd n
umer
acy
4.6.
1
Prop
ortio
n of
pop
ulat
ion
in a
giv
en a
ge g
roup
ach
ievi
ng a
t lea
st
a fix
ed le
vel o
f pro
ficie
ncy
in fu
nctio
nal (
a) li
tera
cy a
nd (b
)
nu
mer
acy
skill
s, by
sex
1
Lite
racy
rate
of 1
5-24
yea
rs o
ld (p
erce
nt)
88.6
Pop.
Cen
sus
Dep
artm
ent
LG
s 10
yea
rs
CBS
of E
duca
tion
2
Fem
ale
liter
acy
rate
of 1
5-24
yea
rs o
ld p
opul
atio
n (p
erce
nt)
84.5
91
.9
Pop.
Cen
sus
Dep
artm
ent
2017
LG
s 10
yea
rs
CBS
of E
duca
tion
3
Mal
e lit
erac
y ra
te o
f 15-
24 y
ears
old
pop
ulat
ion
(per
cent
) 94
.4
98
Pop.
Cen
sus
Dep
artm
ent
2017
LG
s 10
yea
rs
CBS
of
Edu
catio
n
4
Lite
racy
rate
of 1
5-49
yea
rs o
ld p
opul
atio
n (p
erce
nt)
Pop.
Cen
sus
LGs
10 y
ears
CB
S
5
Fem
ale
liter
acy
rate
of 1
5-49
yea
rs o
ld p
opul
atio
n (p
erce
nt)
69.1
66
.1
Pop.
Cen
sus
Dep
artm
ent
2017
LG
s 10
yea
rs
CBS
of E
duca
tion
6
Mal
e lit
erac
y ra
te o
f 15-
49 y
ears
old
pop
ulat
ion
(per
cent
) 89
.1
91.5
Po
p. C
ensu
s D
epar
tmen
t 20
17
LGs
10 y
ears
CB
S
of
Edu
catio
n
7
Lite
racy
rate
of 5
yea
rs a
nd a
bove
pop
ulat
ion
(per
cent
)
Po
p. C
ensu
s
LG
s 10
yea
rs
CBS
8
Lite
racy
rate
of 5
yea
rs a
nd a
bove
pop
ulat
ion
(per
cent
) - M
ale
Pop.
Cen
sus
LGs
10 y
ears
CB
S
9
Lite
racy
rate
of 5
yea
rs a
nd a
bove
pop
ulat
ion
(per
cent
) - F
emal
e
Po
p. C
ensu
s
LG
s 10
yea
rs
CBS
10
Li
tera
cy ra
te o
f 5 y
ears
and
abo
ve p
opul
atio
n (p
erce
nt)
65.9
Pop.
Cen
sus
Pop.
Cen
sus
2010
LG
s 10
yea
rs
CBS

K A R N A L I P R O V I N C E 51
Cont
inue
d...
TA
RGET
S A
ND
IND
ICAT
ORS
B
ASE
LIN
E FI
GU
RE (2
015)
NAT
ION
AL
KA
RNA
LI
PRO
VIN
CE
PRO
POSE
D
DAT
A S
OU
RCE
DAT
A Y
EAR
DIS
AG
GRE
GAT
ION
FR
EQU
ENC
Y RE
SPO
NSI
BLE
D
ATA
SO
URC
E PR
OV
IDED
AG
ENC
Y
IN T
HE
REPO
RT
SD
G 4
: EN
SURE
INCL
USI
VE
AN
D E
QU
ITA
BLE
QU
ALI
TY E
DU
CAT
ION
AN
D P
ROM
OTE
LIF
ELO
NG
M
ON
ITO
RIN
G F
RA
MEW
ORK
LEA
RNIN
G O
PPO
RTU
NIT
IES
FOR
ALL
11
M
ale
liter
acy
rate
of 5
yea
rs a
nd a
bove
pop
ulat
ion
(per
cent
) 75
.1
Po
p. C
ensu
s Po
p. C
ensu
s 20
10
LGs
10 y
ears
CB
S
12
Fe
mal
e lit
erac
y ra
te o
f 5 y
ears
and
abo
ve p
opul
atio
n (p
erce
nt)
57.4
Pop.
Cen
sus
Pop.
Cen
sus
2010
LG
s 10
yea
rs
CBS
13
Pu
blic
spe
ndin
g pe
r stu
dent
(Bas
ic e
duca
tion
in ‘0
00)
15
EM
IS
Dis
tric
t A
nnua
l M
OSD
Targ
et 4
.a B
uild
and
upg
rade
edu
cati
on fa
cilit
ies
that
are
chi
ld, d
isab
ility
and
gen
der s
ensi
tive
and
pro
vide
saf
e, n
on-v
iole
nt, i
nclu
sive
and
eff
ecti
ve le
arni
ng e
nvir
onm
ents
for a
ll
4.a.
1
Prop
ortio
n of
sch
ools
with
acc
ess
to: (
a) e
lect
ricity
; (b)
the
inte
rnet
fo
r ped
agog
ical
pur
pose
s; (c
) com
pute
rs fo
r ped
agog
ical
pur
pose
s;
(d) a
dapt
ed in
fras
truc
ture
and
mat
eria
ls fo
r stu
dent
s w
ith
disa
bilit
ies;
(e) b
asic
drin
king
wat
er; (
f) s
ingl
e-se
x ba
sic
sani
tatio
n
faci
litie
s; a
nd (g
) bas
ic h
andw
ashi
ng fa
cilit
ies
(a
s pe
r the
WA
SH in
dica
tor d
efini
tions
)
4.a.
1
Scho
ols
with
acc
ess
to e
lect
ricity
(per
cent
)
EM
IS
Dis
tric
t A
nnua
l M
OSD
/PPC
4.a.
2
Scho
ols
with
acc
ess
to in
tern
et (p
erce
nt)
3.9
EM
IS
Dis
tric
t A
nnua
l M
OSD
/PPC
4.a.
3
Basi
c sc
hool
s w
ith a
cces
s to
WA
SH fa
cilit
ies
(per
cent
) 80
EMIS
D
istr
ict
Ann
ual
MO
SD/P
PC
4.a.
4
Dis
abili
ty fr
iend
ly s
choo
ls (p
erce
nt)
EMIS
D
istr
ict
Ann
ual
MO
SD/P
PC
Targ
et 4
.b B
y 20
20, e
xpan
d gl
obal
ly th
e nu
mbe
r of s
chol
arsh
ips
avai
labl
e to
dev
elop
ing
coun
trie
s, in
par
ticu
lar,
leas
t dev
elop
ed c
ount
ries
, sm
all i
slan
d de
velo
ping
sta
tes
and
Afr
ican
cou
ntri
es, f
or e
nrol
men
t in
high
er e
duca
tion
, inc
ludi
ng v
ocat
iona
l tra
inin
g an
d in
form
atio
n an
d co
mm
unic
atio
ns te
chno
logy
, tec
hnic
al, e
ngin
eeri
ng a
nd s
cien
tific
pro
gram
mes
, in
deve
lope
d co
untr
ies
and
othe
r dev
elop
ing
coun
trie
s
4.c.
1
Prop
ortio
n of
teac
hers
in: (
a) p
re-p
rimar
y; (b
) prim
ary;
(c) l
ower
se
cond
ary;
and
(d) u
pper
sec
onda
ry e
duca
tion
who
hav
e re
ceiv
ed
at le
ast t
he m
inim
um o
rgan
ized
teac
her t
rain
ing
(e.g
. ped
agog
ical
tr
aini
ng) p
re-s
ervi
ce o
r in-
serv
ice
requ
ired
for t
each
ing
at th
e
rele
vant
leve
l in
a gi
ven
coun
try
4.c1
P
ropo
rtio
n of
teac
hers
in b
asic
edu
catio
n w
ho h
ave
rece
ived
at
95.5
5
0 EM
IS
Karn
ali P
rovi
nce
Dis
tric
t A
nnua
l M
OSD
/PPC
le
ast t
he m
inim
um o
rgan
ized
teac
her t
rain
ing,
(per
cent
)
Five
Yea
rs P
lan:
A
ppro
ach
pape
r
4.c2
Pr
opor
tion
of te
ache
rs in
sec
onda
ry e
duca
tion
who
hav
e re
ceiv
ed
95.4
58
EM
IS
Dis
tric
t A
nnua
l M
OSD
/PPC
at
leas
t the
min
imum
org
aniz
ed te
ache
r tra
inin
g, (p
erce
nt)

S D G B A S E L I N E R E P O R T52SD
G #
5: A
chie
ve g
ende
r equ
alit
y an
d em
pow
er a
ll w
omen
and
gir
ls
TA
RGET
S A
ND
IND
ICAT
ORS
B
ASE
LIN
E FI
GU
RE (2
015)
NAT
ION
AL
KA
RNA
LI
PRO
VIN
CE
PRO
POSE
D
DAT
A S
OU
RCE
DAT
A Y
EAR
DIS
AG
GRE
GAT
ION
FR
EQU
ENC
Y RE
SPO
NSI
BLE
D
ATA
SO
URC
E PR
OV
IDED
AG
ENC
Y
IN T
HE
REPO
RT
SDG
5: A
CHIE
VE
GEN
DER
EQ
UA
LITY
AN
D E
MPO
WER
ALL
WO
MEN
AN
D G
IRLS
M
ON
ITO
RIN
G F
RA
MEW
ORK
Targ
et 5
.1 E
nd a
ll fo
rms
of d
iscr
imin
atio
n ag
ains
t all
wom
en a
nd g
irls
eve
ryw
here
5.1.
1
Whe
ther
or n
ot le
gal f
ram
ewor
ks a
re in
pla
ce to
pro
mot
e, e
nfor
ce
and
mon
itor e
qual
ity a
nd n
on d
iscr
imin
atio
n on
the
basi
s of
sex
1
Wag
e eq
ualit
y fo
r sim
ilar w
ork
(rat
ion
of w
omen
’s w
age
to
0.62
NLS
S
Pr
ovin
ce
5 ye
ars
CBS
that
of m
en)
Targ
et 5
.2 E
limin
ate
all f
orm
s of
vio
lenc
e ag
ains
t all
wom
en a
nd g
irls
in th
e pu
blic
and
pri
vate
sph
eres
, inc
ludi
ng tr
affick
ing
and
sexu
al a
nd o
ther
type
s of
exp
loit
atio
n
5.2.
1
Prop
ortio
n of
eve
r-pa
rtne
red
wom
en a
nd g
irls
aged
15
year
s an
d
olde
r sub
ject
ed to
phy
sica
l, se
xual
or p
sych
olog
ical
vio
lenc
e by
a
curr
ent o
r for
mer
intim
ate
part
ner i
n th
e pr
evio
us 1
2 m
onth
s, by
fo
rm o
f vio
lenc
e an
d by
age
1
Life
time
Phys
ical
and
/or S
exua
l vio
lenc
e (p
erce
nt)
28.4
PMIC
S
D
istr
ict
5 Ye
ars
MO
SD/P
SO
2
Child
ren
age
1-14
yea
rs w
ho e
xper
ienc
ed p
sych
olog
ical
81
.7
PM
ICS
Dis
tric
t 5
Year
s M
OSD
/PSO
ag
gres
sion
or p
hysi
cal p
unis
hmen
t dur
ing
the
last
one
mon
th
(per
cent
)
5.2.
2
Prop
ortio
n of
wom
en a
nd g
irls
aged
15
year
s an
d ol
der s
ubje
cted
to
sex
ual v
iole
nce
by p
erso
ns o
ther
than
an
intim
ate
part
ner i
n th
e
prev
ious
12
mon
ths,
by a
ge a
nd p
lace
of o
ccur
renc
e
1
Wom
en a
ged
15-4
9 ye
ars
who
exp
erie
nce
sexu
al v
iole
nce
6.
9
PMIC
S N
DH
S 20
16
Dis
tric
t 5
Year
s M
OSD
/PSO
(p
erce
nt)
2
Wom
en a
nd G
irls T
raffi
ckin
g (in
num
ber)
16
97
Ad
min
. Dat
a
D
istr
ict
5 Ye
ars
MO
HA
/NH
RC
Targ
et 5
.3 E
limin
ate
all h
arm
ful p
ract
ices
, suc
h as
chi
ld, e
arly
and
forc
ed m
arri
age
and
fem
ale
geni
tal m
utila
tion
1
Prop
ortio
n of
wom
en a
ged
20-2
4 ye
ars
who
wer
e m
arrie
d or
in
7.1
14.6
Po
p. c
ensu
s N
DH
S 20
16
LGs
10 y
ears
CB
S
a
unio
n be
fore
age
15
Prop
ortio
n of
wom
en a
ged
20-2
4 ye
ars
who
wer
e m
arrie
d or
in
40.5
N
DH
S 20
16
a un
ion
befo
re a
ge 1
8
2
Wom
en a
ged
15-1
9 ye
ars
who
are
mar
ried
or in
uni
on (p
erce
nt)
Pop.
cen
sus
LGs
10 y
ears
CB
S
Targ
et 5
.4 R
ecog
nize
and
val
ue u
npai
d ca
re a
nd d
omes
tic
wor
k th
roug
h th
e pr
ovis
ion
of p
ublic
ser
vice
s, in
fras
truc
ture
and
soc
ial p
rote
ctio
n po
licie
s an
d th
e pr
omot
ion
of s
hare
d re
spon
sibi
lity
wit
hin
the
hous
ehol
d an
d th
e fa
mily
as
nati
onal
ly a
ppro
pria
te
5.4.
1
Prop
ortio
n of
tim
e sp
ent o
n un
paid
dom
estic
and
car
e w
ork,
by
sex
, age
and
loca
tion

K A R N A L I P R O V I N C E 53
TA
RGET
S A
ND
IND
ICAT
ORS
B
ASE
LIN
E FI
GU
RE (2
015)
NAT
ION
AL
KA
RNA
LI
PRO
VIN
CE
PRO
POSE
D
DAT
A S
OU
RCE
DAT
A Y
EAR
DIS
AG
GRE
GAT
ION
FR
EQU
ENC
Y RE
SPO
NSI
BLE
D
ATA
SO
URC
E PR
OV
IDED
AG
ENC
Y
IN T
HE
REPO
RT
SDG
5: A
CHIE
VE
GEN
DER
EQ
UA
LITY
AN
D E
MPO
WER
ALL
WO
MEN
AN
D G
IRLS
M
ON
ITO
RIN
G F
RA
MEW
ORK
1
Ratio
of w
omen
to m
en p
artic
ipat
ion
in la
bour
forc
e
65.8
44
.6
NLS
S N
LSS-
WB
estim
ate
2011
Pr
ovin
ce
5 Ye
ars
PSO
2
Prop
ortio
n of
tim
e sp
ent o
n un
paid
dom
estic
wor
k an
d ca
re
16.5
18
.9
NLS
S N
LSS-
WB
estim
ate
2011
Pr
ovin
ce
5 Ye
ars
PSO
(p
erce
nt)
3
Prop
ortio
n of
tim
e sp
ent b
y m
en o
n un
paid
dom
estic
wor
k
10.3
13
.2
NLS
S N
LSS-
WB
estim
ate
2011
Pr
ovin
ce
5 Ye
ars
PSO
an
d ca
re (p
erce
nt)
4
Prop
ortio
n of
tim
e sp
ent b
y w
omen
pop
ulat
ion
on u
npai
d
21.9
24
N
LSS
NLS
S-W
B es
timat
e 20
11
Prov
ince
5
Year
s PS
O
dom
estic
wor
k an
d ca
re (p
erce
nt)
5
Prop
ortio
n of
tim
e sp
ent b
y pe
ople
age
d 19
-64
year
s in
unp
aid
25
.6
33.2
N
LSS
NLS
S-W
B es
timat
e 20
11
Prov
ince
5
Year
s CB
S
do
mes
tic w
ork
and
care
(per
cent
)
6
Prop
ortio
n of
tim
e sp
ent b
y pe
ople
age
d 65
yea
rs a
nd a
bove
16
.8
17.7
N
LSS
NLS
S-W
B es
timat
e 20
11
Prov
ince
5
Year
s CB
S
in
unp
aid
dom
estic
wor
k an
d ca
re (p
erce
nt)
Targ
et 5
.5 E
nsur
e w
omen
’s fu
ll an
d eff
ecti
ve p
arti
cipa
tion
and
equ
al o
ppor
tuni
ties
for l
eade
rshi
p at
all
leve
ls o
f dec
isio
n-m
akin
g in
pol
itic
al, e
cono
mic
and
pub
lic li
fe
5.5.
1
Prop
ortio
n of
sea
ts h
eld
by w
omen
in (a
) nat
iona
l par
liam
ents
an
d (b
) loc
al g
over
nmen
ts
(a) p
rovi
ncia
l par
liam
ent (
perc
ent)
El
ectio
n re
cord
s
Pr
ovin
cial
5
Year
s N
EC
(b) l
ocal
gov
ernm
ent b
odie
s (p
erce
nt)
Elec
tion
reco
rds
LGs
5 Ye
ars
NEC
5.5
.2
Pro
port
ion
of w
omen
in m
anag
eria
l pos
ition
s
1
Wom
en’s
part
icip
atio
n in
dec
isio
n m
akin
g le
vel i
n th
e pr
ivat
e
25
N
LSS
Dis
tric
t 5
Year
s CB
S
se
ctor
(per
cent
)
2
Wom
en’s
part
icip
atio
n in
coo
pera
tive
sect
or (p
erce
nt)
50
N
LSS
Dis
tric
t 5
Year
s CB
S
3
Wom
en in
pub
lic s
ervi
ce d
ecis
ion
mak
ing
posi
tions
11
NLS
S
D
istr
ict
5 Ye
ars
CBS
(per
cent
of t
otal
em
ploy
ees)
4
Ratio
of w
omen
to m
en in
pro
fess
iona
l and
tech
nica
l wor
kers
24
NLS
S
D
istr
ict
5 Ye
ars
CBS
(per
cent
)
Targ
et 5
.6 E
nsur
e un
iver
sal a
cces
s to
sex
ual a
nd re
prod
ucti
ve h
ealt
h an
d re
prod
ucti
ve ri
ghts
as
agre
ed in
acc
orda
nce
wit
h th
e Pr
ogra
mm
e of
Act
ion
of th
e In
tern
atio
nal C
onfe
renc
e on
Pop
ulat
ion
and
Dev
elop
men
t and
the
Beiji
ng P
latf
orm
for A
ctio
n an
d th
e ou
tcom
e do
cum
ents
of t
heir
revi
ew c
onfe
renc
es
5.6
.1
Prop
ortio
n of
wom
en a
ged
15-4
9 ye
ars
who
mak
e th
eir o
wn
PM
ICS
Dis
tric
t 5
Year
s M
OSD
/PSO
in
form
ed d
ecis
ions
rega
rdin
g se
xual
rela
tions
, con
trac
eptiv
e us
e
and
repr
oduc
tive
heal
th c
are
Cont
inue
d...

S D G B A S E L I N E R E P O R T54Co
ntin
ued.
..
TA
RGET
S A
ND
IND
ICAT
ORS
B
ASE
LIN
E FI
GU
RE (2
015)
NAT
ION
AL
KA
RNA
LI
PRO
VIN
CE
PRO
POSE
D
DAT
A S
OU
RCE
DAT
A Y
EAR
DIS
AG
GRE
GAT
ION
FR
EQU
ENC
Y RE
SPO
NSI
BLE
D
ATA
SO
URC
E PR
OV
IDED
AG
ENC
Y
IN T
HE
REPO
RT
SDG
5: A
CHIE
VE
GEN
DER
EQ
UA
LITY
AN
D E
MPO
WER
ALL
WO
MEN
AN
D G
IRLS
M
ON
ITO
RIN
G F
RA
MEW
ORK
1
Awar
enes
s ab
out r
epro
duct
ive
right
s am
ong
girls
and
wom
en
19
17
PMIC
S N
DH
S 20
16
Dis
tric
t 5
Year
s M
OSD
/PSO
(p
erce
nt)-
Prop
ortio
n of
wom
en a
ged
15-4
9 ye
ars
who
mak
e th
eir
own
info
rmed
dec
isio
ns re
gard
ing
sexu
al re
latio
ns, c
ontr
acep
tive
us
e an
d re
prod
uctiv
e he
alth
car
e.
2
Rece
ivin
g sp
ecifi
c su
ppor
t and
ser
vice
pro
visi
ons
rela
ted
to s
exua
l
he
alth
car
e to
the
poor
, dis
crim
inat
ed a
nd m
argi
naliz
ed g
roup
s
(per
cent
)
PM
ICS
Dis
tric
t 5
Year
s M
OSD
/PSO
Targ
et 5
.a U
nder
take
refo
rms
to g
ive
wom
en e
qual
righ
ts to
eco
nom
ic re
sour
ces,
as
wel
l as
acce
ss to
ow
ners
hip
and
cont
rol o
ver l
and
and
othe
r for
ms
of p
rope
rty,
fina
ncia
l ser
vice
s, in
heri
tanc
e an
d na
tura
l re
sour
ces,
in a
ccor
danc
e w
ith
nati
onal
law
s
5.a
.1
(a) P
ropo
rtio
n of
tota
l agr
icul
tura
l pop
ulat
ion
with
ow
ners
hip
or
secu
re ri
ghts
ove
r agr
icul
tura
l lan
d, b
y se
x; a
nd (b
) sha
re o
f
w
omen
am
ong
owne
rs o
r rig
hts-
bear
ers
of a
gric
ultu
ral l
and,
by
type
of t
enur
e
1
Num
ber o
f ent
erpr
ises
ow
ned
by w
omen
Ec
o. c
ensu
s
LG
s 10
yea
rs
CBS
2
Prop
ortio
n of
hou
seho
ld w
ith w
omen
’s ow
ners
hip
of p
rope
rty
22
.2
8.57
Po
p. c
ensu
s Po
p.ce
nsus
20
10
LGs
10 y
ears
CB
S
on
land
(per
cent
)
3
Prop
ortio
n of
hou
seho
ld w
ith w
omen
’s ow
ners
hip
of p
rope
rty
11
.7
4.5
Pop.
cen
sus
Pop.
cens
us
2010
LG
s 10
yea
rs
CBS
hous
e (p
erce
nt)
4
Prop
ortio
n of
hou
seho
ld w
ith w
omen
’s ow
ners
hip
of p
rope
rty
11
.8
4.5
Pop.
cen
sus
Pop.
cens
us
2010
LG
s 10
yea
rs
CBS
(land
and
hou
se) (
perc
ent)
Targ
et 5
.b E
nhan
ce th
e us
e of
ena
blin
g te
chno
logy
, in
part
icul
ar in
form
atio
n an
d co
mm
unic
atio
ns te
chno
logy
, to
prom
ote
the
empo
wer
men
t of w
omen
5.b.
1
Prop
ortio
n of
indi
vidu
als
who
ow
n a
mob
ile te
leph
one,
by
sex
1
Prop
ortio
n of
wom
en a
ged
15-4
9 ye
ars
who
use
mob
ile p
hone
72
.6
69.2
PM
ICS
ND
HS
2016
D
istr
ict
5 ye
ars
MO
SD/P
SO
2
Prop
ortio
n of
men
age
d 15
-49
year
s w
ho u
se m
obile
pho
ne
89.3
83
.6
PMIC
S N
DH
S 20
16
Dis
tric
t 5
year
s M
OSD
/PSO
3
Use
of I
nter
net b
y w
omen
age
d 15
-24
year
s (p
erce
nt)
19.6
d
PMIC
S
D
istr
ict
5 ye
ars
MO
SD/P
SO
Targ
et 5
.c A
dopt
and
str
engt
hen
soun
d po
licie
s an
d en
forc
eabl
e le
gisl
atio
n fo
r the
pro
mot
ion
of g
ende
r equ
alit
y an
d th
e em
pow
erm
ent o
f all
wom
en a
nd g
irls
at a
ll le
vels
1
Prop
ortio
n of
bud
get a
lloca
ted
by th
e go
vern
men
t for
gen
der
Budg
et b
ook
Prov
ince
A
nnua
l M
OEA
P
eq
ualit
y an
d w
omen
’s em
pow
erm
ent (
perc
ent)

K A R N A L I P R O V I N C E 55
SDG
#6:
Ens
ure
avai
labi
lity
and
sust
aina
ble
man
agem
ent o
f wat
er a
nd s
anit
atio
n fo
r all
TA
RGET
S A
ND
IND
ICAT
ORS
B
ASE
LIN
E FI
GU
RE (2
015)
NAT
ION
AL
KA
RNA
LI
PRO
VIN
CE
PRO
POSE
D
DAT
A S
OU
RCE
DAT
A Y
EAR
DIS
AG
GRE
GAT
ION
FR
EQU
ENC
Y RE
SPO
NSI
BLE
D
ATA
SO
URC
E PR
OV
IDED
AG
ENC
Y
IN T
HE
REPO
RT
SD
G 6
: EN
SURE
AVA
ILA
BIL
ITY
AN
D S
UST
AIN
AB
LE M
AN
AG
EMEN
T O
F W
ATER
AN
D S
AN
ITAT
ION
FOR
ALL
M
ON
ITO
RIN
G F
RA
MEW
ORK
Targ
et 6
.1 B
y 20
30, a
chie
ve u
nive
rsal
and
equ
itab
le a
cces
s to
saf
e an
d aff
orda
ble
drin
king
wat
er fo
r all
6.1.
1
Prop
ortio
n of
pop
ulat
ion
usin
g sa
fely
man
aged
drin
king
94
.9
86.2
Po
p. C
ensu
s N
DH
S 20
16
LGs
10 y
ears
CB
S
w
ater
ser
vice
s
1
Popu
latio
n us
ing
safe
drin
king
wat
er (p
erce
nt)
15
Ex
p. R
esea
rch
LGs
Ann
ual
MO
SD
2
Hou
seho
ld w
ith a
cces
s to
pip
ed w
ater
sup
ply
(per
cent
) 33
.3
36.1
Po
p. C
ensu
s N
DH
S 20
16
LGs
10 y
ears
CB
S
4
Perc
enta
ge o
f pop
ulat
ion
in th
e po
ores
t qui
ntile
who
se
NLS
S
Pr
ovin
ce
5 ye
ars
CBS
finan
cial
exp
endi
ture
on
wat
er, s
anita
tion
and
hygi
ene
is b
elow
3
perc
ent o
f the
nat
iona
l pov
erty
line
.
Targ
et 6
.2 B
y 20
30, a
chie
ve a
cces
s to
ade
quat
e an
d eq
uita
ble
sani
tati
on a
nd h
ygie
ne fo
r all
and
end
open
def
ecat
ion,
pay
ing
spec
ial a
tten
tion
to th
e ne
eds
of w
omen
and
gir
ls a
nd th
ose
in v
ulne
rabl
e si
tuat
ions
6.2.
1
Prop
ortio
n of
pop
ulat
ion
usin
g sa
fely
man
aged
san
itatio
n
serv
ices
, inc
ludi
ng a
han
d-w
ashi
ng fa
cilit
y w
ith s
oap
and
wat
er
1
Hou
seho
lds
usin
g im
prov
ed s
anita
tion
faci
litie
s w
hich
are
64
.6
77.6
Po
p. C
ensu
s N
DH
S 20
16
LGs
10 y
ears
CB
S
no
t sha
red
(per
cent
)
2
Prop
ortio
n of
pop
ulat
ion
usin
g la
trin
e (p
erce
nt)
67.6
Pop.
Cen
sus
ND
HS
2016
LG
s 10
yea
rs
CBS
3
Sani
tatio
n co
vera
ge (p
erce
nt)
82
Po
p. C
ensu
s
LG
s 10
yea
rs
CBS
4
Urb
an h
ouse
hold
s w
ith to
ilets
con
nect
ed to
sew
er s
yste
ms/
30
Pop.
Cen
sus
LGs
10 y
ears
CB
S
pr
oper
FSM
(per
cent
)
Targ
et 6
.3 B
y 20
30, i
mpr
ove
wat
er q
ualit
y by
redu
cing
pol
luti
on, e
limin
atin
g du
mpi
ng a
nd m
inim
izin
g re
leas
e of
haz
ardo
us c
hem
ical
s an
d m
ater
ials
, hal
ving
the
prop
orti
on o
f unt
reat
ed w
aste
wat
er a
nd
incr
easi
ng re
cycl
ing
and
safe
reus
e.
Targ
et 6
.b S
uppo
rt a
nd s
tren
gthe
n th
e pa
rtic
ipat
ion
of lo
cal
com
mun
ities
in im
prov
ing
wat
er a
nd s
anita
tion
man
agem
ent
6.b.
1
Prop
ortio
n of
loca
l adm
inis
trat
ive
units
with
est
ablis
hed
and
Ad
min
dat
a
LG
s A
nnua
l M
OSD
op
erat
iona
l pol
icie
s an
d pr
oced
ures
for p
artic
ipat
ion
of lo
cal
com
mun
ities
in w
ater
and
san
itatio
n m
anag
emen
t

S D G B A S E L I N E R E P O R T56SD
G #
7: E
nsur
e ac
cess
to a
ffor
dabl
e, re
liabl
e, s
usta
inab
le a
nd m
oder
n en
ergy
for a
ll
TA
RGET
S A
ND
IND
ICAT
ORS
B
ASE
LIN
E FI
GU
RE (2
015)
NAT
ION
AL
KA
RNA
LI
PRO
VIN
CE
PRO
POSE
D
DAT
A S
OU
RCE
DAT
A Y
EAR
DIS
AG
GRE
GAT
ION
FR
EQU
ENC
Y RE
SPO
NSI
BLE
D
ATA
SO
URC
E PR
OV
IDED
AG
ENC
Y
IN T
HE
REPO
RT
SDG
7: E
NSU
RE A
CCES
S TO
AFF
ORD
AB
LE, R
ELIA
BLE
, SU
STA
INA
BLE
AN
D M
OD
ERN
EN
ERG
Y FO
R A
LL
MO
NIT
ORI
NG
FR
AM
EWO
RK
Targ
et 7
.1 B
y 20
30, e
nsur
e un
iver
sal a
cces
s to
aff
orda
ble,
relia
ble
and
mod
ern
ener
gy s
ervi
ces
7.1.
1
Prop
ortio
n of
pop
ulat
ion
with
acc
ess
to e
lect
ricity
90
.8
67.4
Po
p. C
ensu
s N
DH
S 20
16
LGs
10 y
ears
CB
S
1
Per c
apita
ene
rgy
(fina
l) co
nsum
ptio
n (in
gig
ajou
les)
16
Adm
in. D
ata
Dis
tric
t A
nnua
l M
OEW
RI/ N
EA
7.1.
2
Prop
ortio
n of
pop
ulat
ion
with
prim
ary
relia
nce
on c
lean
fu
els
and
tech
nolo
gy
1
Hou
seho
lds
usin
g so
lid fu
el a
s pr
imar
y so
urce
of e
nerg
y
65.7
89
.5
Pop.
Cen
sus
ND
HS
2016
LG
s 10
yea
rs
CBS
for c
ooki
ng (p
erce
nt)
2
Prop
ortio
n of
pop
ulat
ion
with
prim
ary
relia
nce
on c
lean
fuel
s an
d
33.9
10
.3
Pop.
Cen
sus
ND
HS
2016
LG
s 11
yea
rs
CBS
tech
nolo
gy fo
r coo
king
3
Peop
le u
sing
liqu
id p
etro
leum
gas
(LPG
) for
coo
king
and
hea
ting
30
9.
5 Po
p. C
ensu
s N
DH
S 20
16
LGs
10 y
ears
CB
S
(p
erce
nt)
4
Elec
tric
ity c
onsu
mpt
ion
(KW
h pe
r cap
ita)
80
28
Adm
in. D
ata
LGs
Ann
ual
NEA
Targ
et 7
.2 B
y 20
30, i
ncre
ase
subs
tant
ially
the
shar
e of
rene
wab
le e
nerg
y in
the
glob
al e
nerg
y m
ix
7.2.
1
Rene
wab
le e
nerg
y sh
are
in th
e to
tal fi
nal e
nerg
y co
nsum
ptio
n 11
.9
39.5
Ad
min
. Dat
a
LG
s A
nnua
l M
OEW
RI
1
Inst
alle
d ca
paci
ty o
f hyd
ropo
wer
(Meg
awat
t)
990
8.25
Ad
min
. Dat
a M
inis
try
of F
inan
ce
2017
Su
bnat
iona
l A
nnua
l M
OEW
RI
Targ
et 7
.3 B
y 20
30, d
oubl
e th
e gl
obal
rate
of i
mpr
ovem
ent i
n en
ergy
effi
cien
cy
7.3.
1
Ener
gy in
tens
ity m
easu
red
in te
rms
of p
rimar
y en
ergy
and
G
ross
Dom
estic
Pro
duct
(GD
P)
4
Elec
tric
veh
icle
s in
pub
lic tr
ansp
ort s
yste
ms
(per
cent
) 1
Ad
min
dat
a
Pr
ovin
ce
Ann
ual
DO
TM

K A R N A L I P R O V I N C E 57
SDG
#8:
Pro
mot
e su
stai
ned,
incl
usiv
e an
d su
stai
nabl
e ec
onom
ic g
row
th, f
ull a
nd p
rodu
ctiv
e em
ploy
men
t and
dec
ent w
ork
for a
ll
TA
RGET
S A
ND
IND
ICAT
ORS
B
ASE
LIN
E FI
GU
RE (2
015)
NAT
ION
AL
KA
RNA
LI
PRO
VIN
CE
PRO
POSE
D
DAT
A S
OU
RCE
DAT
A Y
EAR
DIS
AG
GRE
GAT
ION
FR
EQU
ENC
Y RE
SPO
NSI
BLE
D
ATA
SO
URC
E PR
OV
IDED
AG
ENC
Y
IN T
HE
REPO
RT
SD
G 8
: PRO
MO
TE S
UST
AIN
ED, I
NCL
USI
VE
AN
D S
UST
AIN
AB
LE E
CON
OM
IC G
ROW
TH, F
ULL
AN
D
MO
NIT
ORI
NG
FR
AM
EWO
RK
PR
OD
UC
TIV
E EM
PLO
YMEN
T A
ND
DEC
ENT
WO
RK F
OR
ALL
Targ
et 8
.1 Su
stai
n pe
r cap
ita
econ
omic
gro
wth
in a
ccor
danc
e w
ith
nati
onal
cir
cum
stan
ces
and,
in p
arti
cula
r, at
leas
t 7 p
erce
nt g
ross
dom
esti
c pr
oduc
t gro
wth
per
ann
um in
the
leas
t dev
elop
ed c
ount
ries
8.1.
1
Ann
ual g
row
th ra
te o
f rea
l Gro
ss D
omes
tic P
rodu
ct (G
DP)
pe
r cap
ita
1
Per c
apita
Gro
ss D
omes
tic P
rodu
ct (G
DP)
gro
wth
(per
cent
) 2.
3
Nat
iona
l
Pr
ovin
ce
Ann
ual
CBS
Ac
coun
t
Stat
istic
s
Targ
et 8
.3 P
rom
ote
deve
lopm
ent-
orie
nted
pol
icie
s th
at s
uppo
rt p
rodu
ctiv
e ac
tivi
ties
, dec
ent j
ob c
reat
ion,
ent
repr
eneu
rshi
p, c
reat
ivit
y an
d in
nova
tion
, and
enc
oura
ge th
e fo
rmal
izat
ion
and
grow
th o
f mic
ro-,
smal
l- an
d m
ediu
m-s
ized
ent
erpr
ises
, inc
ludi
ng th
roug
h ac
cess
to fi
nanc
ial s
ervi
ces
8.3.
1
Pro
port
ion
of in
form
al e
mpl
oym
ent i
n no
n ag
ricul
ture
70
NLS
S
Pr
ovin
ce
5 ye
ars
CBS
empl
oym
ent,
by s
ex
1
Prop
ortio
n of
pop
ulat
ion
in in
form
al e
mpl
oym
ent i
n
38.3
41
.2
NLS
S Po
p.Ce
nsus
20
10
Prov
ince
5
year
s CB
S
no
n-ag
ricul
ture
2
Prop
ortio
n of
mal
e po
pula
tion
in in
form
al e
mpl
oym
ent i
n
31.3
30
.8
NLS
S Po
p.Ce
nsus
20
10
Prov
ince
5
year
s CB
S
no
n-ag
ricul
ture
sec
tor (
perc
ent)
3
Prop
ortio
n of
fem
ale
popu
latio
n in
info
rmal
em
ploy
men
t in
54
.1
64.5
N
LSS
Pop.
Cens
us
2010
Pr
ovin
ce
5 ye
ars
CBS
non-
agric
ultu
re (p
erce
nt)
4
Acce
ss to
Fin
anci
al S
ervi
ces
(per
cent
) 21
11
N
LSS
ND
HS
2016
Pr
ovin
ce
5 ye
ars
CBS
5
Acce
ss to
Coo
pera
tives
(per
cent
of h
ouse
hold
s w
ithin
30
min
wal
k)
53.6
30
.7
NLS
S N
LSS-
WB
estim
ate
2010
Pr
ovin
ce
5 ye
ars
CBS
Targ
et 8
.5 B
y 20
30, a
chie
ve fu
ll an
d pr
oduc
tive
em
ploy
men
t and
dec
ent w
ork
for a
ll w
omen
and
men
, inc
ludi
ng fo
r you
ng p
eopl
e an
d pe
rson
s w
ith
disa
bilit
ies,
and
equ
al p
ay fo
r wor
k of
equ
al v
alue
8.5.
1
Aver
age
hour
ly e
arni
ngs
of fe
mal
e an
d m
ale
empl
oyee
s, by
N
LSS
Prov
ince
5
year
s CB
S
oc
cupa
tion,
age
and
per
sons
with
dis
abili
ties
8.5.
2
Une
mpl
oym
ent r
ate,
by
sex,
age
and
per
sons
with
dis
abili
ties
1
Und
erem
ploy
men
t rat
e (1
5-59
y) (
perc
ent)
27
.7
22.0
8 N
LSS
NLS
S-W
B es
timat
e 20
11
Prov
ince
5
year
s CB
S
Targ
et 8
.6 B
y 20
20, s
ubst
anti
ally
redu
ce th
e pr
opor
tion
of y
outh
not
in e
mpl
oym
ent,
educ
atio
n or
trai
ning
8.6.
1
Prop
ortio
n of
you
th (a
ged
15-2
4 ye
ars)
not
in e
duca
tion,
em
ploy
men
t or t
rain
ing
1
Prop
ortio
n of
you
th a
ged
15-2
4 ye
ars
not i
n ed
ucat
ion
(per
cent
) 47
.2
44.7
Po
p. C
ensu
s N
LSS-
WB
estim
ate
2011
LG
s 10
yea
rs
CBS
2
Yout
h un
dere
mpl
oym
ent r
ate
(age
d 15
-24
year
s) (p
erce
nt)
29.9
29
.1
NLS
S N
LSS-
WB
estim
ate
2011
Pr
ovin
ce
5yea
rs
CBS
3
Prop
ortio
n of
you
th a
ged
15-2
4 ye
ars
not i
n em
ploy
men
t (pe
rcen
t)
60.5
53
.8
NLS
S N
LSS-
WB
estim
ate
2011
Pr
ovin
ce
5yea
rs
CBS

S D G B A S E L I N E R E P O R T58Co
ntin
ued.
..
TA
RGET
S A
ND
IND
ICAT
ORS
B
ASE
LIN
E FI
GU
RE (2
015)
NAT
ION
AL
KA
RNA
LI
PRO
VIN
CE
PRO
POSE
D
DAT
A S
OU
RCE
DAT
A Y
EAR
DIS
AG
GRE
GAT
ION
FR
EQU
ENC
Y RE
SPO
NSI
BLE
D
ATA
SO
URC
E PR
OV
IDED
AG
ENC
Y
IN T
HE
REPO
RT
SD
G 4
: EN
SURE
INCL
USI
VE
AN
D E
QU
ITA
BLE
QU
ALI
TY E
DU
CAT
ION
AN
D P
ROM
OTE
LIF
ELO
NG
M
ON
ITO
RIN
G F
RA
MEW
ORK
LEA
RNIN
G O
PPO
RTU
NIT
IES
FOR
ALL
Targ
et 8
.10
Stre
ngth
en th
e ca
paci
ty o
f dom
esti
c fin
anci
al in
stit
utio
ns to
enc
oura
ge a
nd e
xpan
d ac
cess
to b
anki
ng, i
nsur
ance
and
fina
ncia
l ser
vice
s fo
r all
8.10
.1 1
. Num
ber o
f com
mer
cial
ban
k br
anch
es p
er 1
00,0
00 a
dults
and
18
a
Adm
in d
ata
Dis
tric
t A
nnua
l N
RB/P
SO
2. A
utom
ated
telle
r mac
hine
s pe
r 100
000
adul
t pop
ulat
ion
11
a
Adm
in d
ata
Dis
tric
t A
nnua
l N
RB/P
SO
(num
ber)
3. L
ife in
sura
nce
cove
rage
(per
cent
) 5d
NLS
S
D
istr
ict
5 ye
ars
CBS
8.10
.2 P
ropo
rtio
n of
adu
lts (1
5 ye
ars
and
olde
r) w
ith a
n ac
coun
t at a
34
d
NLS
S
D
istr
ict
5 ye
ars
CBS
bank
or o
ther
fina
ncia
l ins
titut
ion
or w
ith a
mob
ile-m
oney
-ser
vice
pr
ovid
er
SDG
#9:
Bui
ld re
silie
nt in
fras
truc
ture
, pro
mot
e in
clus
ive
and
sust
aina
ble
indu
stri
aliz
atio
n an
d fo
ster
inno
vati
on
TA
RGET
S A
ND
IND
ICAT
ORS
B
ASE
LIN
E FI
GU
RE (2
015)
NAT
ION
AL
KA
RNA
LI
PRO
VIN
CE
PRO
POSE
D
DAT
A S
OU
RCE
DAT
A Y
EAR
DIS
AG
GRE
GAT
ION
FR
EQU
ENC
Y RE
SPO
NSI
BLE
D
ATA
SO
URC
E PR
OV
IDED
AG
ENC
Y
IN T
HE
REPO
RT
SD
G 8
: BU
ILD
RES
ILIE
NT
INFR
AST
RUC
TURE
, PRO
MO
TE IN
CLU
SIV
E A
ND
SU
STA
INA
BLE
M
ON
ITO
RIN
G F
RA
MEW
ORK
IND
UST
RIA
LIZA
TIO
N A
ND
FO
STER
INN
OVA
TIO
N
Targ
et 9
.1 D
evel
op q
ualit
y, re
liabl
e, s
usta
inab
le a
nd re
silie
nt in
fras
truc
ture
, inc
ludi
ng re
gion
al a
nd tr
ans-
bord
er in
fras
truc
ture
, to
supp
ort e
cono
mic
dev
elop
men
t & h
uman
wel
l-bei
ng, w
ith
a fo
cus
on a
ffor
dabl
e &
equ
itab
le a
cces
s fo
r all
9.1.
1
Prop
ortio
n of
the
rura
l pop
ulat
ion
who
live
with
in 2
km
of a
n
78.8
47
.5
NLS
S N
LSS
Dis
tric
t 5
year
s CB
S
al
l-sea
son
road
1
Road
den
sity
(km
/100
sq.
km
) 39
.2
8.72
Ad
min
dat
a
D
istr
ict
Ann
ual
MO
PID
9.1.
2
Pass
enge
r and
frei
ght v
olum
es, b
y m
ode
of tr
ansp
ort
1
Pave
d ro
ad d
ensi
ty (k
m/s
q. k
m)
0.01
Adm
in d
ata
Dis
tric
t A
nnua
l M
OPI
D
2
Pass
enge
r, by
mod
e of
tran
spor
t (Ro
ad) (
perc
ent)
90
Adm
in d
ata
Dis
tric
t A
nnua
l M
OPI
D
Targ
et 9
.2 P
rom
ote
incl
usiv
e an
d su
stai
nabl
e in
dust
rial
izat
ion
and,
by
2030
, sig
nific
antl
y ra
ise
the
indu
stry
’s sh
are
of e
mpl
oym
ent &
gro
ss d
omes
tic
prod
uct,
in li
ne w
ith
nati
onal
cir
cum
stan
ces,
& d
oubl
e it
s sh
are
in th
e le
ast d
evel
oped
cou
ntri
es
1
Man
ufac
turin
g em
ploy
men
t as
a pr
opor
tion
of to
tal e
mpl
oym
ent
10.5
4.
5 Ec
onom
ic c
ensu
s
D
istr
ict
10 y
ears
CB
S
2
Prop
ortio
n of
pop
ulat
ion
cove
red
by a
mob
ile n
etw
ork,
94
.5
Ad
min
. Dat
a
LG
s A
nnua
l M
OIC
T/N
TA
by te
chno
logy

K A R N A L I P R O V I N C E 59
SDG
#10
: Red
uce
ineq
ualit
y w
ithi
n an
d am
ong
coun
trie
s
TA
RGET
S A
ND
IND
ICAT
ORS
B
ASE
LIN
E FI
GU
RE (2
015)
NAT
ION
AL
KA
RNA
LI
PRO
VIN
CE
PRO
POSE
D
DAT
A S
OU
RCE
DAT
A Y
EAR
LEV
EL O
F FR
EQU
ENC
Y RE
SPO
NSI
BLE
D
ATA
SO
URC
E PR
OV
IDED
DIS
AG
GRE
GAT
ION
AG
ENC
Y
IN T
HE
REPO
RT
SDG
10:
RED
UCE
INEQ
UA
LITY
WIT
HIN
AN
D A
MO
NG
CO
UN
TRIE
S M
ON
ITO
RIN
G F
RA
MEW
ORK
Targ
et 1
0.1
By 2
030,
pro
gres
sive
ly a
chie
ve a
nd s
usta
in in
com
e gr
owth
of t
he b
otto
m 4
0 pe
rcen
t of t
he p
opul
atio
n at
a ra
te h
ighe
r tha
n th
e na
tion
al a
vera
ge
10.1
.1 G
row
th ra
tes
of h
ouse
hold
exp
endi
ture
or i
ncom
e pe
r cap
ita
NLS
S
Pr
ovin
ce
5 ye
ars
CBS
amon
g th
e bo
ttom
40
perc
ent o
f the
pop
ulat
ion
and
the
to
tal p
opul
atio
n
1
Cons
umpt
ion
ineq
ualit
y (m
easu
red
by th
e G
ini c
oeffi
cien
t)
0.33
NLS
S
Pr
ovin
ce
5 ye
ars
CBS
2
Inco
me
ineq
ualit
y (m
easu
red
by th
e G
ini c
oeffi
cien
t)
0.32
8 0.
27
NLS
S N
LSS
2011
Pr
ovin
ce
5 ye
ars
CBS
3
Shar
e of
bot
tom
40p
erce
nt o
f pop
ulat
ion
in to
tal c
onsu
mpt
ion
18
.7
21.3
N
LSS
NLS
S 20
11
Prov
ince
5
year
s CB
S
(p
erce
nt)
4
Shar
e of
bot
tom
40p
erce
nt o
f pop
ulat
ion
in to
tal i
ncom
e (p
erce
nt)
5.3
2.8
NLS
S N
LSS
2011
Pr
ovin
ce
5 ye
ars
CBS
5
PALM
A In
dex
1.
3 0.
9 N
LSS
NLS
S 20
11
Prov
ince
5
year
s CB
S
6
Perc
enta
ge o
f urb
an h
ouse
hold
s w
ith in
com
e be
low
50p
erce
nt o
f
Ad
min
istr
ativ
e
M
oUD
m
edia
n in
com
e
da
ta
Targ
et 1
0.2
By 2
030,
em
pow
er a
nd p
rom
ote
the
soci
al, e
cono
mic
and
pol
itic
al in
clus
ion
of a
ll, ir
resp
ecti
ve o
f age
, sex
, dis
abili
ty, r
ace,
eth
nici
ty, o
rigi
n, re
ligio
n or
eco
nom
ic o
r oth
er s
tatu
s
10.2
.1 P
ropo
rtio
n of
peo
ple
livin
g be
low
50
perc
ent o
f med
ian
inco
me,
N
LSS
Prov
ince
5
year
s CB
S
by
sex
, age
and
per
sons
with
dis
abili
ties
Targ
et 1
0.3
Ensu
re e
qual
opp
ortu
nity
and
redu
ce in
equa
litie
s of
out
com
e, in
clud
ing
by e
limin
atin
g di
scri
min
ator
y la
ws,
pol
icie
s an
d pr
acti
ces
and
prom
otin
g ap
prop
riat
e le
gisl
atio
n, p
olic
ies
and
acti
on
in th
is re
gard
10.3
.1 P
ropo
rtio
n of
pop
ulat
ion
repo
rtin
g ha
ving
per
sona
lly fe
lt
Spec
ial S
urve
y
D
istr
ict
5 ye
ars
PSO
di
scrim
inat
ed a
gain
st o
r har
asse
d in
the
prev
ious
12
mon
ths
on
the
basi
s of
a g
roun
d of
dis
crim
inat
ion
proh
ibite
d un
der
inte
rnat
iona
l hum
an ri
ghts
law
Targ
et 1
0.5
Im
prov
e th
e re
gula
tion
and
mon
itor
ing
of g
loba
l fina
ncia
l mar
kets
and
inst
itut
ions
and
str
engt
hen
the
impl
emen
tati
on o
f suc
h re
gula
tion
s
10.5
.1 F
inan
cial
Sou
ndne
ss In
dica
tors
1
Prop
ortio
n of
farm
hou
seho
lds
cove
red
by m
icro
finan
ce (p
erce
nt)
20.9
10
.8
NLS
S N
LSS
2011
Pr
ovin
ce
5 ye
ar
CBS

S D G B A S E L I N E R E P O R T60SD
G #
11: M
ake
citi
es a
nd h
uman
set
tlem
ents
incl
usiv
e, s
afe,
resi
lient
and
sus
tain
able
TA
RGET
S A
ND
IND
ICAT
ORS
B
ASE
LIN
E FI
GU
RE (2
015)
NAT
ION
AL
KA
RNA
LI
PRO
VIN
CE
PRO
POSE
D
DAT
A S
OU
RCE
DAT
A Y
EAR
LEV
EL O
F FR
EQU
ENC
Y RE
SPO
NSI
BLE
D
ATA
SO
URC
E PR
OV
IDED
DIS
AG
GRE
GAT
ION
AG
ENC
Y
IN T
HE
REPO
RT
SD
G 1
1: M
AK
E CI
TIES
AN
D H
UM
AN
SET
TLEM
ENTS
INCL
USI
VE,
SA
FE, R
ESIL
IEN
T A
ND
SU
STA
INA
BLE
M
ON
ITO
RIN
G F
RA
MEW
ORK
Targ
et 1
1.1
By 2
030,
ens
ure
acce
ss fo
r all
to a
dequ
ate,
saf
e an
d aff
orda
ble
hous
ing
and
basi
c se
rvic
es a
nd u
pgra
de s
lum
s
11.1
.1 P
ropo
rtio
n of
urb
an p
opul
atio
n liv
ing
in s
lum
s, in
form
al
sett
lem
ents
or i
nade
quat
e ho
usin
g
1
Popu
latio
n liv
ing
in s
lum
and
squ
atte
rs (‘
000)
50
0
Pop.
Cen
sus
LGs
10 y
ears
CB
S
2
Hou
seho
ld u
nits
roof
ed w
ith th
atch
ed/s
traw
roof
(per
cent
) 9.
5 15
.5
Pop.
Cen
sus
ND
HS
2016
LG
s 10
yea
rs
CBS
3
Prop
ortio
n of
urb
an p
opul
atio
n liv
ing
in in
adeq
uate
hou
sing
67
.8
78
Pop.
Cen
sus
ND
HS
2016
LG
s 10
yea
rs
CBS
4
Hou
seho
lds
livin
g in
saf
e ho
uses
(per
cent
) 29
.8
Po
p. C
ensu
s
LG
s 10
yea
rs
CBS
Targ
et 1
1.2
By 2
030,
pro
vide
acc
ess
to s
afe,
aff
orda
ble,
acc
essi
ble
and
sust
aina
ble
tran
spor
t sys
tem
s fo
r all,
impr
ovin
g ro
ad s
afet
y, n
otab
ly b
y ex
pand
ing
publ
ic tr
ansp
ort,
wit
h sp
ecia
l att
enti
on to
the
need
s of
th
ose
in v
ulne
rabl
e si
tuat
ions
, wom
en, c
hild
ren,
per
sons
wit
h di
sabi
litie
s an
d ol
der p
erso
ns
11.2
.1 P
ropo
rtio
n of
pop
ulat
ion
that
has
con
veni
ent a
cces
s to
pub
lic
tran
spor
t, by
sex
, age
and
per
sons
with
dis
abili
ties
1
Avai
labi
lity
of s
afe
publ
ic tr
ansp
ort (
perc
ent)
0.
1
NLS
S
Pr
ovin
ce
5 ye
ars
CBS
2
Acce
ss to
pav
ed ro
ad w
ithin
30
min
utes
of w
alki
ng (p
erce
nt)
50.5
19
.03
NLS
S N
LSS-
WB
estim
ate
2011
Pr
ovin
ce
5 ye
ars
CBS
Targ
et 1
1.3
By 2
030,
enh
ance
incl
usiv
e an
d su
stai
nabl
e ur
bani
zati
on a
nd c
apac
ity
for p
arti
cipa
tory
, int
egra
ted
and
sust
aina
ble
hum
an s
ettl
emen
t pla
nnin
g an
d m
anag
emen
t in
all c
ount
ries
11.3
.2 P
ropo
rtio
n of
citi
es w
ith a
dire
ct p
artic
ipat
ion
stru
ctur
e of
civ
il
soci
ety
in u
rban
pla
nnin
g an
d m
anag
emen
t tha
t ope
rate
regu
larly
an
d de
moc
ratic
ally
1
Plan
ned
new
citi
es (n
umbe
r)
10
Pl
an d
oc.
Prov
ince
A
nnua
l PP
C
2
Hou
seho
lds
with
5 a
nd m
ore
pers
ons
resi
ding
(per
cent
) 55
.3
62.2
Po
p. C
ensu
s Po
p. C
ensu
s 20
10
LGs
10 y
ears
CB
S
Targ
et 1
1.4
Stre
ngth
en e
ffor
ts to
pro
tect
and
saf
egua
rd th
e w
orld
’s cu
ltur
al a
nd n
atur
al h
erit
age
1
Budg
et a
lloca
ted
for t
he p
rote
ctio
n of
nat
ural
and
cul
tura
l 1.
15
Bu
dget
boo
k
Pr
ovin
ce
Ann
ual
PPC
herit
age
(per
cent
)
Targ
et 1
1.5
By 2
030,
sig
nific
antl
y re
duce
the
num
ber o
f dea
ths
and
the
num
ber o
f peo
ple
affec
ted
and
decr
ease
the
eco
nom
ic lo
sses
rela
tive
to g
ross
dom
esti
c pr
oduc
t cau
sed
by d
isas
ters
, inc
ludi
ng w
ater
-re
late
d di
sast
ers,
wit
h a
focu
s on
pro
tect
ing
the
poor
and
peo
ple
in v
ulne
rabl
e si
tuat
ions
11.5
.1 N
umbe
r of d
eath
s, m
issi
ng p
erso
ns a
nd d
irect
ly a
ffect
ed p
erso
ns
attr
ibut
ed to
dis
aste
rs p
er 1
00,0
00 p
opul
atio
n
Ad
min
. Dat
a
D
istr
ict
Ann
ual
MO
IAL
1
Dea
ths
due
to n
atur
al d
isas
ter (
num
ber)
Ad
min
. Dat
a
D
istr
ict
Ann
ual
MO
IAL
2
Inju
ries
due
to d
isas
ter (
num
ber)
22
300
h
Adm
in. D
ata
Dis
tric
t A
nnua
l M
OIA
L

K A R N A L I P R O V I N C E 61
Cont
inue
d...
TA
RGET
S A
ND
IND
ICAT
ORS
B
ASE
LIN
E FI
GU
RE (2
015)
NAT
ION
AL
KA
RNA
LI
PRO
VIN
CE
PRO
POSE
D
DAT
A S
OU
RCE
DAT
A Y
EAR
LEV
EL O
F FR
EQU
ENC
Y RE
SPO
NSI
BLE
D
ATA
SO
URC
E PR
OV
IDED
DIS
AG
GRE
GAT
ION
AG
ENC
Y
IN T
HE
REPO
RT
SD
G 1
1: M
AK
E CI
TIES
AN
D H
UM
AN
SET
TLEM
ENTS
INCL
USI
VE,
SA
FE, R
ESIL
IEN
T A
ND
SU
STA
INA
BLE
M
ON
ITO
RIN
G F
RA
MEW
ORK
Targ
et 1
1.6
By 2
030,
redu
ce th
e ad
vers
e pe
r cap
ita
envi
ronm
enta
l im
pact
of c
itie
s, in
clud
ing
by p
ayin
g sp
ecia
l att
enti
on to
air
qua
lity
and
mun
icip
al a
nd o
ther
was
te m
anag
emen
t 11
.6.1
Pro
port
ion
of u
rban
sol
id w
aste
regu
larly
col
lect
ed a
nd w
ith
Adm
in d
ata
Mun
icip
ality
A
nnua
l LG
s
ad
equa
te fi
nal d
isch
arge
out
of t
otal
urb
an s
olid
was
te g
ener
ated
,
by
citi
es
Targ
et 1
1.7
By 2
030,
pro
vide
uni
vers
al a
cces
s to
saf
e, in
clus
ive
and
acce
ssib
le, g
reen
and
pub
lic s
pace
s, in
par
ticu
lar f
or w
omen
and
chi
ldre
n, o
lder
per
sons
and
per
sons
wit
h di
sabi
litie
s.
1
Num
ber o
f pub
lic s
pace
s by
type
s w
ith a
reas
(pla
ygro
unds
, ope
n
Repo
rt
Prov
ince
A
nnua
l PP
C
sp
aces
, gar
dens
, par
ks, e
xhib
ition
cen
tres
etc
.)
Targ
et 1
1.b
By 2
020,
incr
ease
the
num
ber o
f cit
ies
and
hum
an s
ettl
emen
ts a
dopt
ing
and
impl
emen
ting
inte
grat
ed p
olic
ies
and
plan
s to
war
ds in
clus
ion,
reso
urce
effi
cien
cy, m
itig
atio
n an
d ad
apta
tion
to c
limat
e ch
ange
, res
ilien
ce to
dis
aste
rs, d
evel
op a
nd im
plem
ent,
in li
ne w
ith
the
fort
h-co
min
g H
yogo
Fra
mew
ork,
hol
isti
c di
sast
er ri
sk m
anag
emen
t at a
ll le
vels
1
Prop
ortio
n of
loca
l gov
ernm
ents
that
ado
pt a
nd im
plem
ent l
ocal
di
sast
er ri
sk re
duct
ion
stra
tegi
es in
line
with
nat
iona
l dis
aste
r ris
k
redu
ctio
n st
rate
gies
Re
cord
LG
S A
nnua
l PP
C/M
OIT
FE
SDG
#12
: Ens
ure
sust
aina
ble
cons
umpt
ion
and
prod
ucti
on p
atte
rns
TA
RGET
S A
ND
IND
ICAT
ORS
B
ASE
LIN
E FI
GU
RE (2
015)
NAT
ION
AL
KA
RNA
LI
PRO
VIN
CE
PRO
POSE
D
DAT
A S
OU
RCE
DAT
A Y
EAR
LEV
EL O
F FR
EQU
ENC
Y RE
SPO
NSI
BLE
D
ATA
SO
URC
E PR
OV
IDED
DIS
AG
GRE
GAT
ION
AG
ENC
Y
IN T
HE
REPO
RT
SD
G 1
2: E
NSU
RE S
UST
AIN
AB
LE C
ON
SUM
PTIO
N A
ND
PRO
DU
CTI
ON
PAT
TERN
S
MO
NIT
ORI
NG
FR
AM
EWO
RK
Targ
et 1
2.2
By 2
030,
ach
ieve
the
sust
aina
ble
man
agem
ent a
nd e
ffici
ent u
se o
f nat
ural
reso
urce
s
12.2
.2 D
omes
tic m
ater
ial c
onsu
mpt
ion,
dom
estic
mat
eria
l con
sum
ptio
n
per c
apita
, and
dom
estic
mat
eria
l con
sum
ptio
n pe
r
G
ross
Dom
estic
Pro
duct
(GD
P)
1
Land
use
for a
gric
ultu
ral p
rodu
ctio
n (c
erea
l as
perc
ent o
f 80
Agri.
cen
sus
Dis
tric
t 10
yea
r CB
S
cu
ltiva
ted
land
)
2
Per c
apita
cer
eal f
ood
cons
umpt
ion
(in K
G) a
nnua
l
Ag
ricul
ture
D
istr
ict
5 ye
ar
PSO
stat
istic
s

S D G B A S E L I N E R E P O R T62SD
G #
13: T
ake
urge
nt a
ctio
n to
com
bat C
limat
e ch
ange
and
its
impa
cts
TA
RGET
S A
ND
IND
ICAT
ORS
B
ASE
LIN
E FI
GU
RE (2
015)
NAT
ION
AL
KA
RNA
LI
PRO
VIN
CE
PRO
POSE
D
DAT
A S
OU
RCE
DAT
A Y
EAR
DIS
AG
GRE
GAT
ION
FR
EQU
ENC
Y RE
SPO
NSI
BLE
D
ATA
SO
URC
E PR
OV
IDED
AG
ENC
Y
IN T
HE
REPO
RT
SD
G 1
3: T
AK
E U
RGEN
T A
CTI
ON
TO
CO
MB
AT C
LIM
ATE
CHA
NG
E A
ND
ITS
IMPA
CTS
M
ON
ITO
RIN
G F
RA
MEW
ORK
Targ
et 1
3.1
Stre
ngth
en re
silie
nce
and
adap
tive
cap
acit
y to
clim
ate-
rela
ted
haza
rds
and
natu
ral d
isas
ters
in a
ll co
untr
ies
13.1
.1 1
. Num
ber o
f dea
ths,
mis
sing
per
sons
and
dire
ctly
affe
cted
0.
0236
Adm
in d
ata
Dis
tric
t A
nnua
l M
OH
A/M
OIA
L
pe
rson
s at
trib
uted
to d
isas
ters
per
100
,000
pop
ulat
ion
2.
Ec
onom
ic lo
ss d
ue to
dis
aste
r (in
mill
ion
Rs.)
13.1
.3 P
ropo
rtio
n of
loca
l gov
ernm
ents
that
ado
pt a
nd im
plem
ent l
ocal
Ad
min
dat
a
D
istr
ict
Ann
ual
MO
ITFE
di
sast
er ri
sk re
duct
ion
stra
tegi
es in
line
with
nat
iona
l dis
aste
r ris
k
redu
ctio
n st
rate
gies
Targ
et 1
3.2
Inte
grat
e cl
imat
e ch
ange
mea
sure
s in
to n
atio
nal p
olic
ies,
str
ateg
ies
and
plan
ning
13.2
.1 N
umbe
r of c
ount
ries
that
hav
e co
mm
unic
ated
the
esta
blis
hmen
t
or
ope
ratio
naliz
atio
n of
an
inte
grat
ed p
olic
y/st
rate
gy/p
lan
whi
ch
incr
ease
s th
eir a
bilit
y to
ada
pt to
the
adve
rse
impa
cts
of c
limat
e
chan
ge, a
nd fo
ster
clim
ate
resi
lienc
e an
d lo
w g
reen
hous
e ga
s
emis
sion
s de
velo
pmen
t in
a m
anne
r tha
t doe
s no
t thr
eate
n fo
od
prod
uctio
n (in
clud
ing
a na
tiona
l ada
ptat
ion
plan
, nat
iona
lly
dete
rmin
ed c
ontr
ibut
ion,
nat
iona
l com
mun
icat
ion,
bie
nnia
l
up
date
repo
rt o
r oth
er)
a
) Lo
cal a
dapt
atio
n pl
an p
repa
ratio
n (n
umbe
r of L
Gs)
4
Ad
min
dat
a
D
istr
ict
Ann
ual
MO
ITFE
b)
Co
mm
unity
leve
l ada
ptat
ion
plan
31
Adm
in d
ata
Dis
tric
t A
nnua
l M
OIT
FE
c)
Im
plem
enta
tion
of a
dapt
atio
n pl
an
0
Adm
in d
ata
Dis
tric
t A
nnua
l M
OIT
FE
d)
Cl
imat
e sm
art v
illag
es
0
Adm
in d
ata
Dis
tric
t A
nnua
l M
OIT
FE
e)
Cl
imat
e sm
art f
arm
ing
0
Adm
in d
ata
Dis
tric
t A
nnua
l M
OIT
FE
Targ
et 1
3.3
Impr
ove
educ
atio
n, a
war
enes
s-ra
isin
g an
d hu
man
and
inst
itut
iona
l cap
acit
y on
clim
ate
chan
ge m
itig
atio
n, a
dapt
atio
n, im
pact
redu
ctio
n an
d ea
rly
war
ning
13.3
.1 N
umbe
r of c
ount
ries
that
hav
e in
tegr
ated
miti
gatio
n, a
dapt
atio
n,
impa
ct re
duct
ion
and
early
war
ning
into
prim
ary,
sec
onda
ry a
nd
tert
iary
cur
ricul
a
1
Prop
ortio
n of
sch
ools
cov
ered
by
clim
ate
chan
ge e
duca
tion
(per
cent
) 80
Flas
h re
port
D
istr
ict
Ann
ual
MO
SD
13.3
.2 N
umbe
r of c
ount
ries
that
hav
e co
mm
unic
ated
the
stre
ngth
enin
g
of in
stitu
tiona
l, sy
stem
ic a
nd in
divi
dual
cap
acity
-bui
ldin
g to
im
plem
ent a
dapt
atio
n, m
itiga
tion
and
tech
nolo
gy tr
ansf
er, a
nd
deve
lopm
ent a
ctio
ns
1
Num
ber o
f tra
ined
per
sons
in c
limat
e ch
ange
miti
gatio
n
Ad
min
dat
a
D
istr
ict
Ann
ual
MO
ITFE
2
Num
ber o
f tra
ined
per
sons
(lo
cal p
lann
ers)
in c
limat
e ch
ange
ad
apta
tion
79
1
Adm
in d
ata
Dis
tric
t A
nnua
l M
OIT
FE

K A R N A L I P R O V I N C E 63
SDG
#14
: Con
serv
e an
d su
stai
nabl
y us
e th
e oc
eans
, sea
s an
d m
arin
e re
sour
ces
for s
usta
inab
le d
evel
opm
ent
TA
RGET
S A
ND
IND
ICAT
ORS
B
ASE
LIN
E FI
GU
RE (2
015)
NAT
ION
AL
KA
RNA
LI
PRO
VIN
CE
PRO
POSE
D
DAT
A S
OU
RCE
DAT
A Y
EAR
DIS
AG
GRE
GAT
ION
FR
EQU
ENC
Y RE
SPO
NSI
BLE
D
ATA
SO
URC
E PR
OV
IDED
AG
ENC
Y
IN T
HE
REPO
RT
SD
G 1
4: C
ON
SERV
E A
ND
SU
STA
INA
BLY
USE
TH
E O
CEA
NS,
SEA
S A
ND
MA
RIN
E RE
SOU
RCES
FO
R
MO
NIT
ORI
NG
FR
AM
EWO
RK
SUST
AIN
AB
LE D
EVEL
OPM
ENT
Less
rele
vant
for N
epal

S D G B A S E L I N E R E P O R T64SD
G #
15: P
rote
ct, r
esto
re a
nd p
rom
ote
sust
aina
ble
use
of te
rres
tria
l eco
syst
ems,
sus
tain
ably
man
age
fore
sts,
com
bat d
eser
tific
atio
n, a
nd h
alt a
nd re
vers
e la
nd d
egra
dati
on
and
halt
bio
dive
rsit
y lo
ss
TA
RGET
S A
ND
IND
ICAT
ORS
B
ASE
LIN
E FI
GU
RE (2
015)
NAT
ION
AL
KA
RNA
LI
PRO
VIN
CE
PRO
POSE
D
DAT
A S
OU
RCE
DAT
A Y
EAR
DIS
AG
GRE
GAT
ION
FR
EQU
ENC
Y RE
SPO
NSI
BLE
D
ATA
SO
URC
E PR
OV
IDED
AG
ENC
Y
IN T
HE
REPO
RT
SD
G 1
5: P
ROTE
CT,
RES
TORE
AN
D P
ROM
OTE
SU
STA
INA
BLE
USE
OF
TERR
ESTR
IAL
ECO
SYST
EMS,
M
ON
ITO
RIN
G F
RA
MEW
ORK
SUST
AIN
AB
LY M
AN
AG
E FO
REST
S, C
OM
BAT
DES
ERTI
FIC
ATIO
N, A
ND
HA
LT A
ND
REV
ERSE
LA
ND
DEG
RA
DAT
ION
AN
D H
ALT
BIO
DIV
ERSI
TY L
OSS
Targ
et 1
5.1
By 2
030,
ens
ure
the
cons
erva
tion
, res
tora
tion
and
sus
tain
able
use
of t
erre
stri
al a
nd in
land
fres
hwat
er e
cosy
stem
s an
d th
eir s
ervi
ces,
in p
arti
cula
r for
ests
, wet
land
s, m
ount
ains
and
dry
land
s, in
line
w
ith
oblig
atio
ns u
nder
inte
rnat
iona
l agr
eem
ents
15.1
.1 F
ores
t are
a as
a p
ropo
rtio
n of
tota
l lan
d ar
ea (p
erce
nt)
44.7
38
.57
Fo
rest
Sur
vey
Prov
ince
Sta
tus
pape
r 20
17
Dis
tric
t 10
yea
rs
MO
FSC
1
Fore
st a
rea
unde
r com
mun
ity-b
ased
man
agem
ent (
perc
ent)
39
Adm
in. D
ata
Dis
tric
t A
nnua
l M
OIT
FE
2
Fore
st b
y ty
pe o
f man
agem
ent p
ract
ices
Ad
min
. Dat
a
D
istr
ict
Ann
ual
MO
FSC
15.1
.2 P
ropo
rtio
n of
impo
rtan
t site
s fo
r ter
rest
rial a
nd fr
eshw
ater
bi
odiv
ersi
ty th
at a
re c
over
ed b
y pr
otec
ted
area
s, by
ec
osys
tem
type
1
Prot
ecte
d ar
ea (i
nclu
ding
fore
st, i
n pe
rcen
t of t
otal
land
are
a)
23.2
1
7.9
Adm
in. D
ata
Dis
tric
t A
nnua
l M
OIT
FE
2
Cons
erva
tion
of la
kes,
wet
land
s, an
d po
nds
(num
ber)
17
27
2
Adm
in. D
ata
Dis
tric
t A
nnua
l M
OIT
FE
3
Are
a un
der l
akes
, wet
land
s an
d po
nds
Adm
in. D
ata
Dis
tric
t A
nnua
l M
OIT
FE
Targ
et 1
5.2
By 2
020,
pro
mot
e th
e im
plem
enta
tion
of s
usta
inab
le m
anag
emen
t of a
ll ty
pes
of fo
rest
s, h
alt d
efor
esta
tion
, res
tore
deg
rade
d fo
rest
s an
d in
crea
se a
ffor
esta
tion
and
refo
rest
atio
n
15.2
.1 P
rogr
ess
tow
ards
sus
tain
able
fore
st m
anag
emen
t
1
Han
dove
r of f
ores
ts to
leas
ehol
d fo
rest
gro
ups
(000
hec
tare
) 44
.6
Ad
min
. Dat
a
D
istr
ict
Ann
ual
MO
ITFE
2
Def
ores
tatio
n re
plac
emen
t pla
ntat
ion
rate
(per
cent
)
Ad
min
. Dat
a
D
istr
ict
Ann
ual
MO
ITFE
3
Addi
tiona
l pla
ntat
ion
(see
dlin
gs in
mill
ion
per a
nnum
) -
Ad
min
. Dat
a
D
istr
ict
Ann
ual
MO
ITFE
Targ
et 1
5.4
By 2
030,
ens
ure
the
cons
erva
tion
of m
ount
ain
ecos
yste
ms,
incl
udin
g th
eir b
iodi
vers
ity,
in o
rder
to e
nhan
ce th
eir c
apac
ity
to p
rovi
de b
enefi
ts th
at a
re e
ssen
tial
for s
usta
inab
le d
evel
opm
ent
15.4
.1 C
over
age
by p
rote
cted
are
as o
f im
port
ant s
ites
for m
ount
ain
bi
odiv
ersi
ty
1
Pote
ntia
lly d
ange
rous
lake
s (p
erce
nt)
0.37
Adm
in. D
ata
Prov
ince
A
nnua
l M
OIT
FE
Targ
et 1
5.5
Tak
e ur
gent
and
sig
nific
ant a
ctio
n to
redu
ce th
e de
grad
atio
n of
nat
ural
hab
itat
s, h
alt t
he lo
ss o
f bio
dive
rsit
y an
d, b
y 20
20, p
rote
ct a
nd p
reve
nt th
e ex
tinc
tion
of t
hrea
tene
d sp
ecie
s
15.5
.1 R
ed L
ist I
ndex
1
Thre
aten
ed fl
ora
(med
icin
al &
aro
mat
ic p
lant
s) (p
erce
nt)
0.48
Rese
arch
D
istr
ict
5 ye
ar
MO
ITFE
2
Thre
aten
ed fa
una
(mam
mal
s, bi
rds,
rept
iles,
amph
ibia
ns, fi
shes
, i
nsec
ts, P
laty
helm
inth
es, m
ollu
sks,
etc.
) (pe
rcen
t)
0.81
Rese
arch
D
istr
ict
5 ye
ar
MO
ITFE
3
Wild
tige
rs (n
umbe
r)
198
Ce
nsus
P
rovi
nce
5 ye
ar
MO
ITFE
4
Rhin
o (n
umbe
r)
534
Ce
nsus
P
rovi
nce
5 ye
ar
MO
ITFE

K A R N A L I P R O V I N C E 65
TA
RGET
S A
ND
IND
ICAT
ORS
B
ASE
LIN
E FI
GU
RE (2
015)
NAT
ION
AL
KA
RNA
LI
PRO
VIN
CE
PRO
POSE
D
DAT
A S
OU
RCE
DAT
A Y
EAR
DIS
AG
GRE
GAT
ION
FR
EQU
ENC
Y RE
SPO
NSI
BLE
D
ATA
SO
URC
E PR
OV
IDED
AG
ENC
Y
IN T
HE
REPO
RT
SD
G 1
5: P
ROTE
CT,
RES
TORE
AN
D P
ROM
OTE
SU
STA
INA
BLE
USE
OF
TERR
ESTR
IAL
ECO
SYST
EMS,
M
ON
ITO
RIN
G F
RA
MEW
ORK
SUST
AIN
AB
LY M
AN
AG
E FO
REST
S, C
OM
BAT
DES
ERTI
FIC
ATIO
N, A
ND
HA
LT A
ND
REV
ERSE
LA
ND
DEG
RA
DAT
ION
AN
D H
ALT
BIO
DIV
ERSI
TY L
OSS
5
Com
mun
ity le
d an
ti-po
achi
ng u
nits
mob
ilize
d (n
umbe
r)
400
Ad
min
dat
a
P
rovi
nce
Ann
ual
MO
ITFE
Targ
et 1
5.9
By 2
020,
inte
grat
e ec
osys
tem
and
bio
dive
rsit
y va
lues
into
nat
iona
l and
loca
l pla
nnin
g, d
evel
opm
ent p
roce
sses
, pov
erty
redu
ctio
n st
rate
gies
and
acc
ount
s
15.9
.1 P
rogr
ess
tow
ards
nat
iona
l tar
gets
est
ablis
hed
in a
ccor
danc
e w
ith
Aic
hi B
iodi
vers
ity T
arge
t 2 o
f the
Str
ateg
ic P
lan
for B
iodi
vers
ity
2011
-202
0
1
Plan
t (flo
ral)
spec
ies
unde
r con
serv
atio
n pl
an (n
umbe
r)
3
Rese
arch
D
istr
ict
5 ye
ar
MO
ITFE
2
Ani
mal
(fau
nal)
spec
ies
unde
r con
serv
atio
n pl
an (n
umbe
r)
5
Rese
arch
D
istr
ict
5 ye
ar
MO
ITF
Cont
inue
d...

S D G B A S E L I N E R E P O R T66
SDG
#16
: SD
G 1
6: P
rom
ote
peac
eful
and
incl
usiv
e so
ciet
ies
for s
usta
inab
le d
evel
opm
ent,
prov
ide
acce
ss to
just
ice
for a
ll an
d bu
ild e
ffec
tive
, acc
ount
able
and
incl
usiv
e in
stit
utio
ns a
t all
leve
ls
TA
RGET
S A
ND
IND
ICAT
ORS
B
ASE
LIN
E FI
GU
RE (2
015)
NAT
ION
AL
KA
RNA
LI
PRO
VIN
CE
PRO
POSE
D
DAT
A S
OU
RCE
DAT
A Y
EAR
DIS
AG
GRE
GAT
ION
FR
EQU
ENC
Y RE
SPO
NSI
BLE
D
ATA
SO
URC
E PR
OV
IDED
AG
ENC
Y
IN T
HE
REPO
RT
SS
DG
16:
PRO
MO
TE P
EACE
FUL
AN
D IN
CLU
SIV
E SO
CIET
IES
FOR
SUST
AIN
AB
LE D
EVEL
OPM
ENT,
M
ON
ITO
RIN
G F
RA
MEW
ORK
PRO
VID
E A
CCES
S TO
JU
STIC
E FO
R A
LL A
ND
BU
ILD
EFF
ECTI
VE,
ACC
OU
NTA
BLE
AN
D IN
CLU
SIV
E I
N
STIT
UTI
ON
S AT
ALL
LEV
ELS
Targ
et 1
6.1
Sign
ifica
ntly
redu
ce a
ll fo
rms
of v
iole
nce
and
rela
ted
deat
h ra
tes
ever
ywhe
re
16.1
.3 P
ropo
rtio
n of
pop
ulat
ion
subj
ecte
d to
phy
sica
l, ps
ycho
logi
cal
6.5
PM
ICS
ND
HS
2016
D
istr
ict
5 ye
ars
MO
SD/P
SO
or s
exua
l vio
lenc
e in
the
prev
ious
12
mon
ths
16.1
.4 P
ropo
rtio
n of
pop
ulat
ion
that
feel
saf
e w
alki
ng a
lone
aro
und
PM
ICS
Dis
tric
t 5
year
s M
OSD
/PSO
th
e ar
ea th
ey li
ve
Targ
et 1
6.2
End
abus
e, e
xplo
itat
ion,
traffi
ckin
g an
d al
l for
ms
of v
iole
nce
agai
nst a
nd to
rtur
e of
chi
ldre
n
16.2
.1 P
ropo
rtio
n of
chi
ldre
n ag
ed 1
-17
year
s w
ho e
xper
ienc
ed a
ny
phys
ical
pun
ishm
ent a
nd/o
r psy
chol
ogic
al a
ggre
ssio
n by
ca
regi
vers
in th
e pa
st m
onth
1
Child
ren
age
1-14
yea
rs w
ho e
xper
ienc
ed p
sych
olog
ical
81
.7
PM
ICS
Dis
tric
t 5
year
s M
OSD
/PSO
ag
gres
sion
or p
hysi
cal p
unis
hmen
t dur
ing
the
last
one
mon
th)
(per
cent
)
16.2
.2 N
umbe
r of v
ictim
s of
hum
an tr
affick
ing
per 1
00,0
00 p
opul
atio
n,
by s
ex, a
ge a
nd fo
rm o
f exp
loita
tion
1
Child
ren
traffi
ckin
g to
abr
oad
(incl
udin
g In
dia)
per
ann
um
64
Re
port
D
istr
ict
5 ye
ars
MO
SD/N
HRC
(re
port
ed n
umbe
r)
16.2
.3 P
ropo
rtio
n of
you
ng w
omen
and
men
age
d 18
29
year
s w
ho
PMIC
S
D
istr
ict
5 ye
ars
MO
SD/P
SO
expe
rienc
ed s
exua
l vio
lenc
e by
age
18
Targ
et 1
6.3
Prom
ote
the
rule
of l
aw a
t the
nat
iona
l and
inte
rnat
iona
l lev
els
and
ensu
re e
qual
acc
ess
to ju
stic
e fo
r all
16.3
.1 P
ropo
rtio
n of
vic
tims
of v
iole
nce
in th
e pr
evio
us 1
2 m
onth
s w
ho
PMIC
S
D
istr
ict
5 ye
ars
MO
SD/P
SO
repo
rted
thei
r vic
timiz
atio
n to
com
pete
nt a
utho
ritie
s or
oth
er
offici
ally
reco
gniz
ed c
onfli
ct re
solu
tion
mec
hani
sms
1
Tran
spar
ency
, acc
ount
abili
ty, a
nd c
orru
ptio
n in
pub
lic
3
ISD
ES
Dis
tric
t 5
year
s PS
O
(sco
re o
ut o
f 6)
16.3
.2 U
nsen
tenc
ed d
etai
nees
as
a pr
opor
tion
of o
vera
ll pr
ison
pop
ulat
ion
Adm
in. D
ata
Dis
tric
t A
nnua
l N
epal
Pol
ice
2
Goo
d go
vern
ance
(Rep
orte
d al
ong
a sc
ale
of -2
.5 to
2.5
. Hig
her
valu
es c
orre
spon
d to
goo
d go
vern
ance
) for
con
trol
of c
orru
ptio
n -0
.78
IS
DES
D
istr
ict
5 ye
ars
PSO
/MO
IAL

K A R N A L I P R O V I N C E 67
TA
RGET
S A
ND
IND
ICAT
ORS
B
ASE
LIN
E FI
GU
RE (2
015)
NAT
ION
AL
KA
RNA
LI
PRO
VIN
CE
PRO
POSE
D
DAT
A S
OU
RCE
DAT
A Y
EAR
DIS
AG
GRE
GAT
ION
FR
EQU
ENC
Y RE
SPO
NSI
BLE
D
ATA
SO
URC
E PR
OV
IDED
AG
ENC
Y
IN T
HE
REPO
RT
SS
DG
16:
PRO
MO
TE P
EACE
FUL
AN
D IN
CLU
SIV
E SO
CIET
IES
FOR
SUST
AIN
AB
LE D
EVEL
OPM
ENT,
M
ON
ITO
RIN
G F
RA
MEW
ORK
PRO
VID
E A
CCES
S TO
JU
STIC
E FO
R A
LL A
ND
BU
ILD
EFF
ECTI
VE,
ACC
OU
NTA
BLE
AN
D IN
CLU
SIV
E I
N
STIT
UTI
ON
S AT
ALL
LEV
ELS
Targ
et 1
6.5
Subs
tant
ially
redu
ce c
orru
ptio
n an
d br
iber
y in
all
thei
r for
ms
IS
DES
D
istr
ict
5 ye
ars
PSO
/MO
IAL
16.5
.1 P
ropo
rtio
n of
per
sons
who
had
at l
east
one
con
tact
with
a p
ublic
IS
DES
D
istr
ict
5 ye
ars
PSO
/MO
IAL
offici
al a
nd w
ho p
aid
a br
ibe
to a
pub
lic o
ffici
al, o
r wer
e as
ked
for a
br
ibe
by th
ose
publ
ic o
ffici
als,
durin
g th
e pr
evio
us 1
2 m
onth
s
1
Peop
le’s
perc
eptio
n of
cor
rupt
ion
(per
cent
of p
eopl
e w
ith a
t lea
st
10
2 IS
DES
N
ASC
20
17
Dis
tric
t 5
year
s PS
O/M
OIA
L
on
e in
stan
ce in
the
past
12
mon
ths
that
requ
ire to
giv
e a
br
ibe/
pres
ent)
16.5
.2 P
ropo
rtio
n of
bus
ines
ses
that
had
at l
east
one
con
tact
with
a
ISD
ES
Dis
tric
t 5
year
s PS
O/M
OIA
L
pu
blic
offi
cial
and
that
pai
d a
brib
e to
a p
ublic
offi
cial
or w
ere
as
ked
for a
brib
e by
thos
e pu
blic
offi
cial
s du
ring
the
prev
ious
12
mon
ths
Targ
et 1
6.6
Dev
elop
eff
ecti
ve, a
ccou
ntab
le a
nd tr
ansp
aren
t ins
titu
tion
at a
ll le
vels
.
PS
O/M
OIA
L
16.6
.2 P
ropo
rtio
n of
pop
ulat
ion
satis
fied
with
thei
r las
t exp
erie
nce
IS
DES
D
istr
ict
5 ye
ars
PSO
/MO
IAL
of p
ublic
ser
vice
s
Targ
et 1
6.7
Ensu
re re
spon
sive
, par
tici
pato
ry a
nd re
pres
enta
tive
dec
isio
n m
akin
g at
all
leve
ls
16.7
.1 P
ropo
rtio
ns o
f pos
ition
s (b
y se
x, a
ge, p
erso
ns w
ith d
isab
ilitie
s an
d
Adm
in. D
ata
Dis
tric
t A
nnua
l M
OFA
GA
po
pula
tion
grou
ps) i
n pu
blic
inst
itutio
ns (n
atio
nal a
nd lo
cal
legi
slat
ures
, pub
lic s
ervi
ce, a
nd ju
dici
ary)
com
pare
d to
nat
iona
l
di
strib
utio
ns
16.7
.2 P
ropo
rtio
n of
pop
ulat
ion
who
bel
ieve
dec
isio
n-m
akin
g is
incl
usiv
e
and
resp
onsi
ve, b
y se
x, a
ge, d
isab
ility
and
pop
ulat
ion
grou
p
1
Prop
ortio
ns o
f dec
isio
n-m
akin
g po
sitio
ns h
eld
by w
omen
in
15
W
omen
and
D
istr
ict
5 ye
ars
PSO
/MO
IAL
publ
ic in
stitu
tions
M
en in
Dec
isio
n
Mak
ing
Surv
ey
(WA
MID
MS)
Targ
et 1
6.9
By 2
030,
pro
vide
lega
l ide
ntit
y fo
r all,
incl
udin
g bi
rth
regi
stra
tion
16.9
.1 P
ropo
rtio
n of
chi
ldre
n un
der 5
yea
rs o
f age
who
se b
irths
hav
e
56.2
64
.9
CRVS
N
DH
S 20
16
LGS
Ann
ual
MO
SD/P
SO
been
regi
ster
ed w
ith a
civ
il au
thor
ity, b
y ag
e
Targ
et 1
6.b
Prom
ote
and
enfo
rce
non-
disc
rim
inat
ory
law
s an
d po
licie
s fo
r sus
tain
able
dev
elop
men
t
16.b
.1 P
ropo
rtio
n of
pop
ulat
ion
repo
rtin
g ha
ving
per
sona
lly fe
lt
ISD
ES
Dis
tric
t 5
year
s PS
O/M
OIA
L
di
scrim
inat
ed a
gain
st o
r har
asse
d in
the
prev
ious
12
mon
ths
on
the
basi
s of
a g
roun
d of
dis
crim
inat
ion
proh
ibite
d un
der
inte
rnat
iona
l hum
an ri
ghts
law
Cont
inue
d...

S D G B A S E L I N E R E P O R T68SD
G #
17: S
tren
gthe
n th
e m
eans
of i
mpl
emen
tati
on a
nd re
vita
lize
the
Glo
bal P
artn
ersh
ip fo
r Sus
tain
able
Dev
elop
men
t
TA
RGET
S A
ND
IND
ICAT
ORS
B
ASE
LIN
E FI
GU
RE (2
015)
NAT
ION
AL
KA
RNA
LI
PRO
VIN
CE
PRO
POSE
D
DAT
A S
OU
RCE
DAT
A Y
EAR
DIS
AG
GRE
GAT
ION
FR
EQU
ENC
Y RE
SPO
NSI
BLE
D
ATA
SO
URC
E PR
OV
IDED
AG
ENC
Y
IN T
HE
REPO
RT
SD
G 1
7. S
TREN
GTH
EN T
HE
MEA
NS
OF
IMPL
EMEN
TATI
ON
AN
D R
EVIT
ALI
ZE T
HE
GLO
BA
L
MO
NIT
ORI
NG
FR
AM
EWO
RK
PA
RTN
ERSH
IP F
OR
SUST
AIN
AB
LE D
EVEL
OPM
ENT
Targ
et 1
7.1
Stre
ngth
en d
omes
tic
reso
urce
mob
iliza
tion
, inc
ludi
ng th
roug
h in
tern
atio
nal s
uppo
rt to
dev
elop
ing
coun
trie
s, to
impr
ove
dom
esti
c ca
paci
ty fo
r tax
and
oth
er re
venu
e co
llect
ion
1
Prop
ortio
n of
pro
vinc
ial b
udge
t fun
ded
by p
rovi
ncia
l tax
taxe
s
Budg
et B
ook
Prov
ince
A
nnua
l M
OEA
P
(p
erce
nt)
17.6
.2 F
ixed
Inte
rnet
bro
adba
nd s
ubsc
riptio
ns p
er 1
00 in
habi
tant
s,
by s
peed
1
Inte
rnet
Den
sity
(per
100
per
son)
49
.8
M
IS/P
op.c
ensu
s
LG
s A
nnua
l/10
yrs
MO
ICT/
CBS
Targ
et 1
7.8
Fully
ope
rati
onal
ize
the
tech
nolo
gy b
ank
and
scie
nce,
tech
nolo
gy a
nd in
nova
tion
cap
acit
y-bu
ildin
g m
echa
nism
for l
east
dev
elop
ed c
ount
ries
by
2017
and
enh
ance
the
use
of e
nabl
ing
tech
nolo
gy, i
n pa
rtic
ular
info
rmat
ion
and
com
mun
icat
ions
tech
nolo
gy
1
Prop
ortio
n of
indi
vidu
als
usin
g th
e In
tern
et
MIS
/Pop
.cen
sus
LGs
Ann
ual/1
0 yr
s M
OIC
T/CB
S
2
Prop
ortio
n of
wom
en a
ged
15-4
9 ye
ars
usin
g in
tern
et
23.3
7.
1 M
IS/P
op.c
ensu
s N
DH
S 20
16
LGs
Ann
ual/1
0 yr
s M
OIC
T/CB
S
3
Prop
ortio
n of
men
age
d 15
-49
year
s us
ing
inte
rnet
48
.5
28.1
M
IS/P
op.c
ensu
s N
DH
S 20
16
LGs
Ann
ual/1
0 yr
s M
OIC
T/CB
S
Targ
et 1
7.18
By
2020
, enh
ance
cap
acit
y-bu
ildin
g su
ppor
t and
incr
ease
sig
nific
antl
y th
e av
aila
bilit
y of
hig
h-qu
alit
y, ti
mel
y an
d re
liabl
e da
ta d
isag
greg
ated
by
inco
me,
gen
der,
age,
race
, eth
nici
ty, m
igra
tory
st
atus
, dis
abili
ty, g
eogr
aphi
c lo
cati
on a
nd o
ther
cha
ract
eris
tics
.
1
Prop
ortio
n of
sus
tain
able
dev
elop
men
t ind
icat
ors
prod
uced
with
M
eta
data
Pr
ovin
ce
Ann
ual
PSO
fu
ll di
sagg
rega
tion
rele
vant
to th
e ta
rget
, in
acco
rdan
ce w
ith th
e
Fund
amen
tal P
rinci
ples
of O
ffici
al S
tatis
tics
2
Dev
elop
ed a
nd e
nfor
ced
stat
istic
al le
gisl
atio
n th
at c
ompl
ies
with
Ye
s
Law
Pr
ovin
ce
2019
PP
C/M
OIA
L
th
e Fu
ndam
enta
l Prin
cipl
es o
f Offi
cial
Sta
tistic
s
3
Dev
elop
ed a
nd im
plem
ente
d a
stat
istic
al p
lan
that
is fu
lly fu
nded
Ye
s
Plan
Pr
ovin
ce
2019
PP
C/PS
O
4
Prop
ortio
n of
bud
get a
lloca
ted
to s
tren
gthe
n st
atis
tical
cap
acity
Bu
dget
boo
k
Pr
ovin
ce
Ann
ual
MO
EAP
(per
cent
of t
otal
bud
get)
5
Prop
ortio
n of
chi
ldre
n un
der 5
yea
rs o
f age
who
se b
irths
hav
e
58.1
CRVS
N
DH
S 20
16
LGs
Ann
ual
MO
SD/P
SO
been
regi
ster
ed

K A R N A L I P R O V I N C E 69

S D G B A S E L I N E R E P O R T70
ACRONYMS
AIDS Acquired Immune Deficiency Syndrome
ANC Antenatal Care
CBS Central Bureau of Statistics
CRVS Civil Registration and Vital Statistics
CVD Cardiovascular Disease
DPT Diphtheria Pertussis and Tetanus
DoHS Department of Health Services
GER Gross Enrolment Rate
GoGP Government of Gandaki Province
GoN Government of Nepal
GPI Gender Parity Index
Hib Haemophilus influenza type b
LPG Liquefied petroleum gas
MICS Multiple Indicators Cluster Survey
MDGs Millennium Development Goals
MoSD Ministry of Social Development
MoWS Ministry of Water Supply
MPI Multidimensional Poverty Index
MW Megawatt
NCDs Non-communicable Diseases
NDHS Nepal Demographic and Health Survey
NLSS Nepal Living Standard Survey
NLFS Nepal Labour Force Survey
NPC National Planning Commission
OWG Open Working Group
PNC Post-Natal Care
PPC Province Planning Commission
PSO Provincial Statistical Office
SDGs Sustainable Development Goals
TB Tuberculosis
UN United Nations
UNGA United Nations General Assembly
WB The World Bank

K A R N A L I P R O V I N C E 71
LIST OF FIGURES & TABLES
FIGURES CONTENT PAGE NO
Figure 2.1 Overlapping of sectors 9
Figure 3.1 Malnutrition and pnc 15
Figure 3.2 Literacy and pnc 16
Figure 3.3 Neonatal mortality rate and anc 16
Figure 3.4 Travel time estimates to health facilities (rainy season) 17
Figure 3.5 Literacy rate 17
Figure 3.6 Women aged 20-24 years who were married or in a union 18
Figure 3.7 Access to clean fuel, solid fuel and electricity 20
Figure 3.8 Unemployment and underemployment 21
Figure 3.9 Manufacturing employment as a proportion of total 21
Figure 3.10 Households with improved sanitation,
piped water and thatched roof 21
Figure 3.11 Travel time estimates to financial institution (dry season) 22
Figure 3.12 Mobile phone and internet (women) 23
TABLES CONTENT PAGE NO
Table 3.1 Prevalence of poverty 14
Table 3.2 Measures of inequality 19
Table 4.1 Availability of data at the province level 26

S D G B A S E L I N E R E P O R T72
REFERENCES
Barbier, E. B. (1987). The concept of sustainable economic development. Environmental conservation, 14(2), 101-110.
Barbier, E. B., & Burgess, J. C. (2017). The Sustainable Development Goals and the systems approach to sustainability. Economics: The Open-Access, Open-Assessment E-Journal, 11(2017-28), 1-23.
Central Bureau of Statistics and UNICEF. (2014). Nepal Multiple Indicator Cluster Survey (MICS) 2014. Government of Nepal.
Central Bureau of Statistics. (2011). National Living Standard Survey 2010/11. Government of Nepal.
Central Bureau of Statistics. (2011). Poverty in Nepal. Government of Nepal.
Central Bureau of Statistics. (2019). Economic Census. Government of Nepal.
Grubler, A., Wilson, C., Bento, N., Boza-Kiss, B., Krey, V., McCollum, D. L., ... & Cullen, J. (2018). A low energy demand scenario for meeting the 1.5 C target and sustainable development goals without negative emission technologies. Nature Energy, 3(6), 515.
Holmberg, J., & Sandbrook, R. (1992). Sustainable development: What is to be done? In J. Holmberg (Ed.), Policies for a small planet (pp. 19-38). London: Earthscan
Humpenöder, F., Popp, A., Bodirsky, B. L., Weindl, I., Biewald, A., Lotze-Campen, H., ... & Rolinski, S. (2018). Large-scale bioenergy production: how to resolve sustainability trade-offs?. Environmental Research Letters, 13(2), 024011.
Liu, L., Oza, S., Hogan, D., Chu, Y., Perin, J., Zhu, J., ... & Black, R. E. (2016). Global, regional, and national causes of under-5 mortality in 2000–15: an updated systematic analysis with implications for the Sustainable Development Goals. The Lancet, 388(10063), 3027-3035.
Ministry of Federal Affairs and Local Development. (2016). Statistics of Local Road Network (SLRN) 2016. Kathmandu: Ministry of Federal Affairs and Local Development.
Ministry of Finance. (2018). Economic Survey 2017/18. Kathmandu: Ministry of Finance.
Ministry of Finance. (2019). Economic Survey 2018/19. Kathmandu: Ministry of Finance.
Ministry of Health and Population. (2016). Nepal Demographic and Health Survey 2016. Government of Nepal.
National Planning Commission. (2017). Nepal’s Sustainable Development Goals, Baseline Report. Government of Nepal.

K A R N A L I P R O V I N C E 73
National Planning Commission and Oxford Poverty and Human Development Initiative (2018). Multidimensional Poverty Index: Analysis Towards Action. Government of Nepal and University of Oxford.
Nepal in Data (2019). Retrieved June 10, 2019 fromhttps://nepalindata.com/insight/provincial-profile-karnali-province/
Nilsson, M., Griggs, D., & Visbeck, M. (2016). Policy: map the interactions between Sustainable Development Goals. Nature News, 534(7607), 320.
Parkinson, S., Krey, V., Huppmann, D., Kahil, T., McCollum, D., Fricko, O., ... & Raptis, C. (2019). Balancing clean water-climate change mitigation trade-offs. Environmental Research Letters, 14(1), 014009.Pinker, S. (2018). Enlightenment Now: The Case for Reason. Science, Humanism, and Progress, 47.
Popp, A., Dietrich, J. P., Lotze-Campen, H., Klein, D., Bauer, N., Krause, M., ... & Edenhofer, O. (2011). The economic potential of bioenergy for climate change mitigation with special attention given to implications for the land system. Environmental Research Letters, 6(3), 034017.
Pradhan, P., Costa, L., Rybski, D., Lucht, W., & Kropp, J. P. (2017). A systematic study of Sustainable Development Goal (SDG) interactions. Earth’s Future, 5(11), 1169-1179.
Ricardo, D. (1887). Letters of David Ricardo to Thomas Robert Malthus, 1810-1823. Clarendon Press.
Sachs, J. D. (2015). The age of sustainable development. Columbia University Press.
Springmann, M., Godfray, H. C. J., Rayner, M., & Scarborough, P. (2016). Analysis and valuation of the health and climate change co-benefits of dietary change. Proceedings of the National Academy of Sciences, 113(15), 4146-4151.
TWI2050 - The World in 2050 (2018). Transformations to Achieve the Sustainable Development Goals. Report prepared by The World in 2050 initiative. International Institute for Applied Systems Analysis (IIASA), Laxenburg, Austria. Ul Haq, M. (1995). Reflections on human development. oxford university Press.United Nations Development Programme. (1990). Human Development Report 1990. Washington, D.C.
World Bank. (2013). World Development Report 2014: Risk and Opportunity—Managing Risk for Development. Washington, DC.

S D G B A S E L I N E R E P O R T74
Karnali Province Planning Commission
Hum
an
Goo
d
Resourc
es
Gov
erna
nce
Tourism Agriculture Energy
Industry Infrastructure
Natu
ral Beauty
Biodiversity
D
emog
raph
ic D
ivid
end Se
ven
Key Drivers of Prosperity
Five Key Enablers of Prosperity
Cultural Prosperity,
Co-existence & Identity
Unity Betw
eenSocial D
iversity