baseline survey report - educationinnovations.org · who patiently answered our questions at short...
TRANSCRIPT
BASELINE SURVEY REPORT Active Inclusion in Education for Most
Vulnerable Children (MVC)
by
Lucas Othuon & Julius Chavene Millennium School of Business Studies
P.O. Box 454-40100 KISUMU KENYA
© 31st October, 2012

1 | P a g e
ACKNOWLEDGEMENTS The Baseline Survey on Active Inclusion in Education for Most Vulnerable Children (MVC) conducted in five informal settlements of Kisumu Municipality was a fulfilling exercise. It has enabled us to unearth important issues that can be used to help retain MVC in school. This undertaking would not have been possible without a number of people who played key roles during the inception and conduct of the survey. We give special thanks to the Co-ordinator of Manyatta Faith & Hope Centre, Municipal Education Officer, Project Officer of Child Fund, UNICEF, Headteacher of Ring Road Orphanage, Chief of Nyalenda, Deputy Quality Assurance Officer at the Kisumu County Education Office, Officers in charge of Millenium Cities Initiative and CADIF for accepting to participate in the survey. We also sincerely acknowledge the different roles played by the staff at K-MET, research supervisors, research assistants, mobilizers and facilitators who gave their support from the humble beginnings of the study to its successful conclusion. Our gratitude goes to all household heads and children from the five informal settlements who patiently answered our questions at short notice. We recognize the important role played by Focus Group Discussants in raising pertinent issues during the conduct of the survey. To Duncan Gumba, we say thank you so much for tirelessly helping the consultants with transcription. Last but not least, our thanks go to the Technical Team made up of Verah Akinyi, Harold Ochieng‟ and Rowney Omondi who ensured that the massive quantity of field data was accurately keyed into the computer for data analysis.

2 | P a g e
LIST OF ACRONYMS
ACTs Access to Care, Treatment and Support
AIDS Acquired Immunodeficiency Syndrome
AMREF African Medical and Research Foundation APHIA II AIDS, Population and Health Integrated Assistance II APHIAPlus AIDS, Population and Health Integrated Assistance Plus
ASAL Arid and Semi-Arid Lands
CBOs Community Based
CCF Christian Child Fund CDC Centers for Disease Control
CDF Constituency Development Fund
CPAP Country Program Action Plan
CRC Committee on the Rights of the Child
CSHP Comprehensive School Health Program
CSOs Civil Society Organizations
CWDs Children with Disabilities
CWSN Children With Special Needs
CWSNs Children with Special Needs
DCAH Division of Child and Adolescent Health
DCAH Division of Child and Adolescent Health
DEO District Education Office
DEV Deprived, Excluded or Vulnerable
ECD Early Childhood Development
3 | P a g e
ECDE Early Childhood Development and Education (ECDE
EFA Education for All
ERSWEC Economic Recovery Strategy for Wealth and Employment Creation
FBOs Faith Based Organizations
FGD Focus Group Discussion
FGM Female Genital Mutilation
FPE Free Primary Education
GOK Government of Kenya
HIV Human Immunodeficiency Virus
IEC Information Education and Communication
IGAs Income Generating Activity
IMCI Integrated Management of Childhood Illnesses
IMCI Integrated Management of Childhood Illnesses
KDA Kenya National Disability Act
KEMRI Kenya Medical Research Institute
K-MET Kisumu Medical and Education Trust
KWFT Kenya Women Finance Trust
MEO Municipal Education Office
MGCSS Ministry of Gender Children and Social Services
MHA Ministry of Home Affairs
MoEST Ministry of Education, Science and Technology
MOF Ministry of Finance
MOLG Ministry of Local Government
MOWI Ministry of Water and Irrigation
MPHS Ministry of Public Health and Sanitation
4 | P a g e
MVC Most Vulnerable Children
NFEs Non-formal Education Schools/centers
NGOs Non-governmental organizations
ORS Oral Rehydration Salts
ORT Oral Rehydration Therapy
PE Primary Education
PESP Poverty Eradication Strategy Paper
PWD People with Disabilities
RH Reproductive Health
SMA Social Mobilization and Advocacy
SOPs Standard Operating Procedures
STIs Sexual Transmitted Infections
TB Tuberculosis
TIVET Technical, Industrial Vocational and Entrepreneurship Training
UNCRC United Nations Convention on the Rights of the Child
UN-HABITAT United Nations Human Settlements Program
UNICEF United Nations Children‟s Funds
UPE Universal Primary Education
WEDCO Women's Economic Development Company
5 | P a g e
TABLE OF CONTENTS
ACKNOWLEDGEMENTS ................................................................................................................................. 1
LIST OF ACRONYMS ....................................................................................................................................... 2
TABLE OF CONTENTS ..................................................................................................................................... 5
LIST OF FIGURES ............................................................................................................................................ 8
LIST OF TABLES .............................................................................................................................................. 9
EXECUTIVE SUMMARY ................................................................................................................................ 10
1.0 INTRODUCTION ..................................................................................................................................... 13
1.1 Background information ................................................................................................................... 13
1.2 Informal Settlements in Kisumu Municipality................................................................................... 14
1.3 The Provision of Education in Kisumu Municipality .......................................................................... 16
1.4 Programs offered by Kisumu Medical and Education Trust (K-MET)................................................ 17
1.5 Staffing and Enrolment in ECDE Centres in Kisumu Municipality ..................................................... 17
1.6 Understanding Early Childhood Development (ECD)........................................................................ 18
1.7 MVC Issues and ECD .......................................................................................................................... 20
1.8 Policies and Guidelines ..................................................................................................................... 23
1.9 Objectives of the study ..................................................................................................................... 27
1.10 Structure of the Report ................................................................................................................... 27
2.0 METHODOLOGY .................................................................................................................................... 28
2.1 Research Design ................................................................................................................................ 28
2.2 Training of Researchers..................................................................................................................... 28
2.3 Population ......................................................................................................................................... 29
2.4 Sample and Sampling Procedure ...................................................................................................... 29
2.5 Instruments for data collection ........................................................................................................ 30

6 | P a g e
2.5.1 Baseline Survey Questionnaire .................................................................................................. 30
2.5.2 Key Informant Interview Guide .................................................................................................. 31
2.5.3 Focus Group Discussion Guide ................................................................................................... 31
2.5.4 Children Interview Guide ........................................................................................................... 31
2.6 Validity of research instruments ....................................................................................................... 31
2.7 Methods for data collection.............................................................................................................. 31
2.8 Methods of data analysis .................................................................................................................. 32
3.0 STUDY FINDINGS ................................................................................................................................... 33
3.1 Background information on households........................................................................................... 33
3.1.1 Demographic characteristics of children respondents .............................................................. 33
3.1.2 Gender distribution of household participants ......................................................................... 34
3.1.3 Age and Marital status of household respondents .................................................................... 34
3.1.4 Occupation of respondents........................................................................................................ 37
3.1.5 Respondents’ and spouses’ level of education .......................................................................... 38
3.1.6 Members within households (excluding respondent and spouse) ............................................ 38
3.1.7 Household members in school ................................................................................................... 39
3.1.8 Reasons for children not going to school ................................................................................... 40
3.1.9 Girls below age 18 years with children ...................................................................................... 41
3.2 MVC identification criteria ................................................................................................................ 41
3.3 Quality, accessibility and cost of education ...................................................................................... 43
3.4 Services offered to schools ............................................................................................................... 45
3.5 Policies on Children ........................................................................................................................... 46
3.6 Challenges to children’s education ................................................................................................... 47
3.7 Care and development of household members ............................................................................... 48
3.7.1 Primary caregivers to children ................................................................................................... 48
3.7.2 Where children sleep ................................................................................................................. 49
7 | P a g e
3.7.3 Chores performed by children ................................................................................................... 50
3.7.4 Childrens’ plays .......................................................................................................................... 51
3.7.5 Issues on child abuse.................................................................................................................. 52
3.7.6 Household health and sanitation ............................................................................................... 53
3.8 Household nutrition .......................................................................................................................... 57
3.9 Household economic indicators ....................................................................................................... 59
3.9.1 Assets owned by households ..................................................................................................... 59
3.9.2 Sources of income ...................................................................................................................... 59
3.10 Involvement of parents, government and community ................................................................... 61
3.11 Preferred ECDE Centres .................................................................................................................. 61
3.12 Organizations in the Settlements.................................................................................................... 63
4.0 CONCLUSIONS AND RECOMMENDATIONS ........................................................................................... 64
4.1 Conclusions ....................................................................................................................................... 64
4.2 Recommendations ............................................................................................................................ 64
APPENDICES ................................................................................................................................................ 66
Appendix 1: Respondents’ and spouses’ level of education across location ......................................... 66
Appendix 2: Where children get treated ................................................................................................ 67
Appendix 3: Types of toilets used by households ................................................................................... 68
Appendix 4: Sources of income............................................................................................................... 69
Appendix 5: Baseline Survey Questionnaire ........................................................................................... 71
Appendix 6: MVC-Key Informant Interview Guide ................................................................................. 85
Appendix 7: Focus Group Discussion Guide............................................................................................ 90
Appendix 8: Children Interview Guide .................................................................................................... 92
8 | P a g e
LIST OF FIGURES
Figure 1: Age of household respondents………………………………………………………………………………………………. 35
Figure 2: Age of household respondents per settlement ........................................................................... 35
Figure 3: Occupation of respondents.......................................................................................................... 38
Figure 4: Households with at least 1 member in Nursery School ............................................................... 39
Figure 5: Households with at least 1 member in Primary School ............................................................... 40
Figure 6: Primary caregiver of children in the past 6 months .................................................................... 49
Figure 7: Household members not able to eat preferred foods in past 30 days ........................................ 57
Figure 8: Frequency of not eating in a day in the past year ....................................................................... 58
Figure 9: Assets owned by households ....................................................................................................... 59
Figure 10: Sources of credit for households ............................................................................................... 61
9 | P a g e
LIST OF TABLES
Table 1: Pupil enrolment and staffing across types of ECDE centres ......................................................... 18
Table 2: Grouping of ECD children .............................................................................................................. 24
Table 3: Sampling frame ............................................................................................................................. 30
Table 4: Distribution of children respondents by age ................................................................................. 33
Table 5: Distribution of children respondents by academic class .............................................................. 34
Table 6: Gender distribution of participants ............................................................................................... 34
Table 7: Age of spouses of household heads .............................................................................................. 36
Table 8: Marital status of respondents ....................................................................................................... 37
Table 9: Where children slept ..................................................................................................................... 50
Table 10: Where children play .................................................................................................................... 52
Table 11: Types of medical services accessed ........................................................................................... 53
Table 12: Types of diseases affecting children ........................................................................................... 55
Table 13: Households belonging to saving or loan group ........................................................................... 60
Table 14: Preferred ECDEs and their location ............................................................................................ 63

10 | P a g e
EXECUTIVE SUMMARY This report discusses the findings of a baseline survey conducted in five informal settlements in Kisumu Municipality. The settlements are Bandani, Manyatta, Manyatta Arab, Nyalenda and Obunga. Through a process that included desk study of secondary data and key informant interviews, data were assembled for further analysis. Focus group discussions held in each of the respective settlements were particularly informative. The final draft of the report was then subjected to a consultative forum, which brought together representatives of residents of the informal settlements and other key stakeholders to build consensus on the emerging issues before a final report was written and submitted to K-MET. The findings show that the majority of households in the five informal settlements engage in small scale business and are in the low socio-economic bracket. They therefore face a lot of challenges, particularly with regard to retaining their children in school. Although multiple methods were suggested for identifying MVC, the most important one is by looking at the way a child is dressed. They also considered weak and feeble looking children as deprived, excluded or vulnerable (DEV). Children who did not go or could not go to school were also described as most vulnerable. Lack of school fees was mentioned as the most important reason for children not going to school. With regard to where children slept, the most typical place was the sitting room. Children reported that they were safe enough where they slept. This indicates that most children felt comfortable with their sleeping arrangements despite having inadequate shelter. In terms of household chores, children mainly washed utensils and clothes within their own households. They also helped their families in performing household chores. Almost all household heads reported that children participated in play. This is consistent with what the children also reported. The majority of children played at home, followed by at school then open fields. This is positive as the World Health Organization recommends play for the psychological, physical and social development of a child.
The most important perception of household heads regarding what constitutes child abuse was physical maltreatment. Verbal attack ranked second followed by sexual exploitation. Most households indicated that they had access to medical services. The types of medical services accessed, from most accessed to least accessed, were immunization services, antenatal/PMTCT services family planning and counseling services. The types of illnesses that affected household members in order of importance were malaria, depression, typhoid, pneumonia, diarrhoea, tuberculosis (TB) and HIV/AIDS. Typhoid, pneumonia and diarrhoea were more rampant in Obunga than in the other informal settlements. All the children who were interviewed indicated that they had fallen sick. Most of them had experienced headache and stomach ache which were probably indicative of malaria and diarrhoea, respectively. In all the cases except one, the children were treated in established medical facilities. The most typical type of toilet in the informal settlements was pit latrine. However, use of open pit was reported in Manyatta, Manyatta Arab and Nyalenda. Children indicated that they bathed daily and washed their hands before eating and after using the toilet.

11 | P a g e
The main source of water in the five informal settlements was tap water. This was followed by water from boreholes, piped water and springs/streams. The majority of households worried about food, suggesting that most households were not sure of what they were going to eat. Apart from worrying about food, most respondents could not eat preferred foods once or twice a month. In the past one year, more than half the respondents had at least one day in which they had to go without eating anything all day. The most important reason for going without food in the past one year was lack of money. Other reasons included high food prices and lack of the preferred food in the market. In case of food shortage in the family in the past one year, slightly below half of the respondents indicated that parents/caregivers sacrificed for the children to eat. Thus, parents/caregivers tended to sacrifice for their children to eat much more than any other method whenever there was food shortage in the family. Corn meal and rice were the most common sources of carbohydrate fed to children. These were eaten with vegetables, eggs, fish, and green grams. Most children reported that they got satisfied every time they ate a meal. Not a single child among those interviewed mentioned having been fed with fruits, a rather worrying observation. Overall, the most commonly owned assets were tables and chairs which are basic household furniture. This was followed by radios, TVs, refrigerators and shops/stalls. This outcome depicts low income levels in the settlements. In general, the most important source of income was small scale business. Savings group within individual communities was the most important source of credit. It was found that Most Vulnerable Children (MVC) may be identified by the way they dress (This may be an outcome of poverty or orphanhood), how weak and feeble they are, whether they go to school or not, idleness, being isolated, neglected and dull. More subtle signs were being dirty, looking sickly, sleepy or malnourished as well as begging or showing excessive rudeness. Findings indicated that DEV issues are generally addressed through partnerships and not by individual entities. Access to education was a problem to many because of the high costs involved. Poverty at the household level affected participation of learners in class and hence the quality of educational performance. There were very few extra services offered in ECDE centres and primary schools. The few that were offered were affected by corruption and nepotism during the selection phase of the beneficiaries. Food and family conflict came up as major challenges to children‟s education.
12 | P a g e
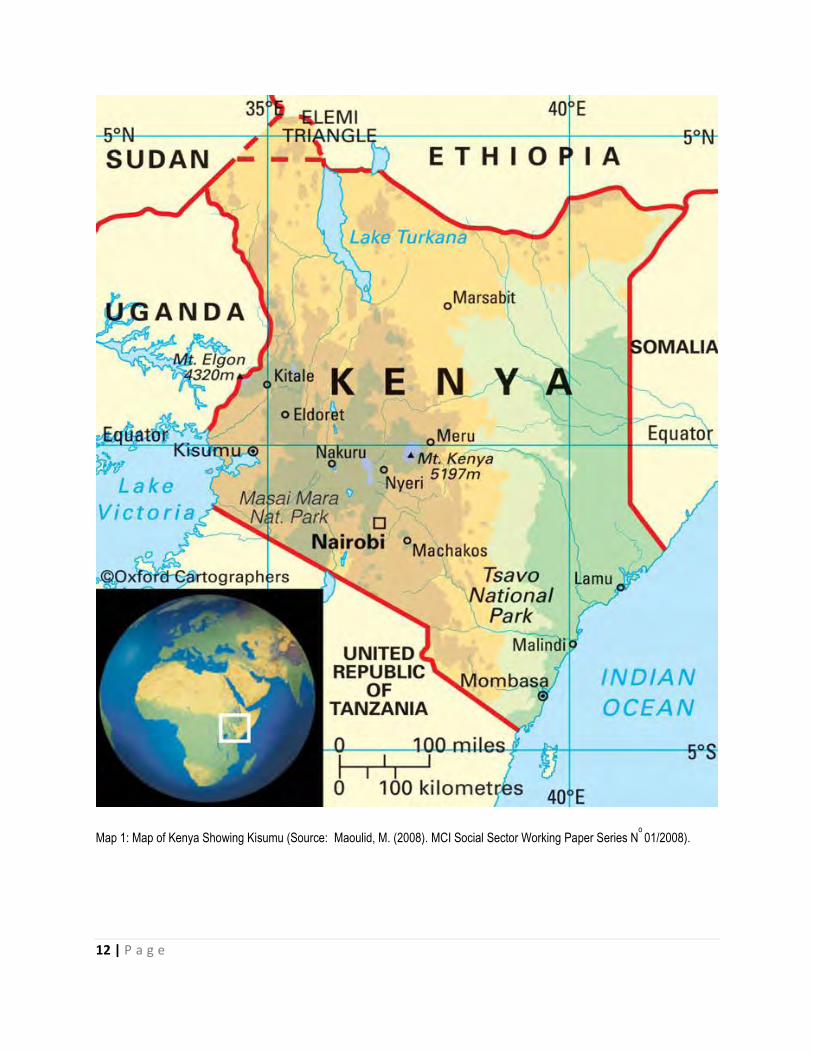
Map 1: Map of Kenya Showing Kisumu (Source: Maoulid, M. (2008). MCI Social Sector Working Paper Series No 01/2008).

13 | P a g e
1.0 INTRODUCTION
1.1 Background information The Kisumu Medical and Education Trust (K-MET) is a not for profit and non-partisan civil society organization based in Kisumu. It was founded in 1995 and registered under the Trustees Act in 1996. It was formed to create, establish and manage health, education and development programs; promote and manage medical institutions to provide and sustain comprehensive clinical and educational facilities and services of the highest quality throughout Kenya. K-MET is managed through a Board of Trustees which ensures that the project runs according to sound policies and procedures that are in tandem with the laws of Kenya.The organization‟s vision is to empower communities to access quality, sustainable reproductive health (RH) and education information and services that promote human rights. Its mission is to promote sustainable development among undeserved communities through innovative health and education programs. Its goal is to integrate reproductive health into the core community development activities. The United Nations Children‟s Funds (UNICEF) is an integral part of the United Nations (UN) which works together with governments, communities, civil society organizations (CSOs) and other partners to advance the rights of children globally. UNICEF Kenya program is accountable to the government of Kenya and the UNICEF Executive Board. The implementation of the program is detailed in the Country Program Action Plan (CPAP) which establishes a collaboration framework for UNICEF and its prospective partners. As part of its activities, K-MET in collaboration with UNICEF is implementing the Active Inclusion Project to ensure that most vulnerable children (MVC) living in 5 informal settlements in Kisumu Municipality are able to access and complete 9 years of basic education at early childhood development (ECDE) and primary school levels. K-MET is implementing the Active Inclusion in Education for Most Vulnerable Children (MVC) with United Nations Children‟s Funds (UNICEF) who provides the funds and technical support. Therefore the Active Inclusion in Education for Most Vulnerable Children is a component of the UNICEF Kenya program. The program‟s strategic objective is to ensure that vulnerable children in five informal settlements in Kisumu Municipality are able to access and complete nine years of basic education at early childhood development (ECDE) and primary school levels. The informal settlements are Bandani, Manyatta, Manyatta Arab, Nyalenda and Obunga. The Active Inclusion Project has 3 components: 1) Early Childhood Development and Education (ECDE); 2) Primary Education; and 3) Social Mobilization and Advocacy (SMA). The goal of the ECDE component is to improve access in early childhood development and education for all children ages 4-5 years living in 5 informal settlements in Kisumu Municipality. The ECDE component will target identification and enrolment of 3,900 of the most vulnerable children. The primary education (PE) component targets 3,900 MVC for identification, enrolment/re-enrolment. In addition the PE component will facilitate retention of 4,900 children who constitute the number retained during the pilot phase in 2011. The total beneficiaries of the PE component will thus be 8,800 children (5,460 girls and 3,340 boys). Furthermore, the PE component will
14 | P a g e
facilitate identification, re-enrolment and retention of girls and teenage mothers who had dropped out of school. The ECDE component will work with 30 centres to facilitate increased access to ECDE. Of the 30 centres, 19 are attached to schools where K-MET is already working. The remaining 11 are model centres. To achieve the ECDE component, it is planned that the project will work closely with the local community, local leadership and Kisumu Municipal Education Office. The project‟s implementation strategy is aligned with the Millennium Development Goal No. 2.
1.2 Informal Settlements in Kisumu Municipality The subtle beginnings of today‟s Kisumu Municipality can be traced back to 1898 when Kisumu (then known as Port Florence) was identified as a railway terminus for the Uganda railway and as a port. Today, Kisumu is the third largest city in Kenya, located in Western Kenya on the shores of Lake Victoria. It covers a total area of 417 sq. km, of which 297 sq. km is land and 120 sq. km is water mass1. The central part of the municipality hosts government offices, the port that is hardly used because of hyacinth growth, an industrial area and housing for the middle and high-income residents in a well-planned area. Surrounding the central part is a belt of informal settlements that has developed as a complete semi-circle around the old city. This semi-circular pattern of informal settlement is, however, breaking as the city extends to new areas. Kisumu faces several challenges as it endeavors to achieve the MDGs in education. It is a city with high poverty levels, high HIV/AIDS prevalence rates and a rapidly growing urban population. It is estimated that in 2006, about half of the city inhabitants were poor, 15 percent were HIV-positive and over 60 percent lived in peri-urban informal settlements.2 In addition to HIV/AIDS, malaria, cholera, typhoid and diarrhoea are also major health threats. Other challenges the city faces include housing shortages, lack of adequate water and sanitation facilities and high levels of unemployment. Map 2 shows informal settlements in Kisumu Municipality. These are Bandani, Manyatta, Manyatta Arab, Nyalenda, Obunga, Kaloleni and Nyamasaria.To offer some light on what a typical informal settlement looks like, consider Manyatta as an example. A UN-HABITAT report3 observed that although Manyatta is an informal settlement, it is occupied by an emerging middle class. The settlement has grown as a residential area for the lower segment of middle-income earners. Whereas public transport in Manyatta is readily available, connecting roads suffer the fate of all roads in the informal settlements of Kisumu; they are narrow, muddy, waterlogged in the rainy season and devoid of both drainage systems and street lighting. There is encroachment on road reserves due to negligent development control by the council. Soils block connections to the sewers in the rainy season and many owners have resorted to use of septic and conservancy tanks. Soil and rock structure in lower Manyatta “A” and “B” restrict the construction of pit latrines; as a result, developers put up toilets that fill up quite rapidly, spewing waste into the neighbourhood. There are isolated instances of flying toilets (called “atonga waindi”), although most people
1Maoulid,M. (2008). MCI Social Sector Working Paper Series N
o
01/2008). 2UN-HABITAT (2006). “Managing the HIV/AIDS Pandemic at the Local Level: Experience from Kisumu.”
Availablehttp://www.unhabitat.org/downloads/docs/4058_85367Kisumu.pdf 3UN-HABITAT (2005). Situation analysis of informal settlements in Kisumu: Cities without slums sub-regional programme for
Eastern and Southern Africa, Kenya Slum Upgrading Programme., Nairobi.
15 | P a g e
resort to sharing toilets in the neighbouring plots when their own compound has none. In 2005, water sources in the Manyatta area included boreholes, shallow wells, unprotected water springs, piped water and water vendors. It would be worthwhile to establish the current sanitation situation in the informal settlements as it impacts on household health in general and the health of children in particular.
Map 2: Informal settlements in Kisumu Municipality (Source: Maoulid, M. (2008). MCI Social Sector Working Paper Series
No 01/2008).
The UN-HABITAT report further observes that a lot of effort has been put in place to improve the quality of facilities and schools in Manyatta. International organizations like World Vision have not only improved classrooms, but also put up toilets and provided school furniture. However, these schools still need basic facilities to cater for the large numbers of students. Crowded classrooms, inadequate desks and inappropriate learning material are commonplace, especially in the lower classes. Most people in Manyatta have to walk long distances to the provincial or district hospital, or to the Lumumba health centre. The economic cost of taking care of a sick person for an extended period is likely to reduce household resources. For this reason, a situation analysis of where residents of Manyatta seek for medical help, particularly for children, is necessary. Light industries such as Posho mills, tailoring, carpentry and welding have sprouted in the area. Service industries such as salons, barbers, shade restaurants also benefit from the availability of electricity. Many organisations in the area are also making low interest credit available to residents in order to enable them

16 | P a g e
improve incomes; they include KADET, WEDCO, KWFT and UNDUGU. Understanding challenges faced by residents in accessing such credit is crucial if MVC are to benefit from external support. The other informal settlements generally fit into the description of Manyatta given above. Obunga for instance is characterized by overcrowding, poor nutritional status of children, poverty, poor sanitation facilities, insecurity, inflation and poor infrastructure. Obunga residents mainly suffer from malaria, HIV/AIDs, tuberculosis(TB) and other respiratory infections as well as diarrhoea.4
1.3 The Provision of Education in Kisumu Municipality In Kenya, the Ministry of Education, Science and Technology (MoEST) is responsible for the provision of administrative and professional services in education at the national, provincial and district levels. However, the MoEST delegates the management of primary schools and Early Childhood Development Education (ECDE)centers in Kisumu to the Municipal Council of Kisumu. As a result, the Municipal Education Office (MEO) is in charge of all ECDE centres and primary schools in the city. The District Education Office (DEO) is responsible for all secondary schools in the municipality and the district, as well as all Early Childhood Development (ECD) programs and primary schools lying within the district but outside the municipality. The MEO and DEO are housed in different locations and operate independently from each other.5 The formal education system in Kisumu, as in the whole country, is commonly referred to as the 8-4-4 system (eight years of primary education, four years of secondary education and four years at a university). This system was introduced in Kenya in 1985 to meet the increasing demands of the economy for technically and professionally qualified personnel. There are different types of educational institutions in Kisumu. These are pre-primary institutions, primary and secondary schools, non-formal education schools/centers (NFEs), technical institutions serving students who fail to qualify for secondary schools and tertiary institutions. Pre-primary education lasts for three years and prepares children for primary schooling. The primary education cycle has eight grades, commonly called „Standards.‟ Secondary education lasts for four years, and grades are referred to as „Forms.‟ The duration of tertiary education is two to four years, depending on whether a student enrolls in a Technical, Industrial Vocational and Entrepreneurship Training (TIVET) institution or a university, and whether a student pursues a certificate, a diploma or a bachelor‟s degree.6 Trends indicate that since 2003, the abolition of primary school fees has led to improvements in enrollment rates and increases in the ratio of girls to boys in primary and secondary schools. However, free primary education by itself will not result in the attainment of the Millennium Development Goals (MDGs) in education. Additional classrooms and other facilities have to be built, new teachers must be recruited, existing teachers need to be trained and strategies to mitigate the effects of poverty and HIV/AIDS on the education sector, such as school feeding programs, should be implemented.7
4Okeyo, D.O. (2012). Baseline Survey of Livelihood Situation of Vulnerable Households in Obunga Informal Settlement in Kisumu
City. Page 5ff. 5Maoulid, M. (2008). MCI Social Sector Working Paper Series No 01/2008).
6 UN-HABITAT (2005). Situation analysis of informal settlements in Kisumu: Cities without slums sub-regional programme for
Eastern and Southern Africa, Kenya Slum Upgrading Programme., Nairobi. 7UN-HABITAT (2006). “Managing the HIV/AIDS Pandemic at the Local Level: Experience from Kisumu.” Available
http://www.unhabitat.org/downloads/docs/4058_85367Kisumu.pdf

17 | P a g e
1.4 Programs offered by Kisumu Medical and Education Trust (K-MET)8 Kisumu Medical and Education Trust (K-MET), is a civil society organization that shares the values and principles of UNICEF. It is a not for profit and non-partisan organization based in Kisumu, founded in 1995 and registered under the Trustees Act in 1996. It was formed to create, establish and manage health, education and development programs; promote and manage medical institutions to provide and sustain comprehensive clinical and educational facilities and services of the highest quality throughout Kenya. K-MET is managed through a Board of Trustees which ensures that the project is run according to their policies and procedures and the laws of Kenya. K-MET‟s mission is to promote development in underserved communities through innovative health and education programs hence the mantra promoting health and education. K-MET has three main programs; Maternal and Child Health Program, Socio-Economic Empowerment Program, and Youth Empowerment Program. The fourth program is a Cross-cutting Program. The Youth Empowerment Program has four sub-programs, namely, The Youth-for-Youth Program (Sisterhood for Change), The Safe Space Project, Youth Network/Kisumu Brain Trust and Access to Basic Education for the Most Vulnerable Children, a project under which this baseline survey falls. The Access to Basic Education for the Most Vulnerable Children is a partnership project with UNICEF and the Ministry of Education, Science and Technology through the Municipal Education Office. Its goal is to ensure that Most Vulnerable Children in Kisumu Municipality access and complete 9 years of basic education (ECDE & primary education). The project has 3 components, the first one being to ensure improved access for 3,900 MVC (2,780 girls and 1,170 boys) in early childhood development and education living in 5 informal settlements in Kisumu. One of the outputs for this component is a participatory baseline survey to map out 11 new centres as well as developing criteria for identifying MVC to be enrolled in school. This is what this report is about. Subsequent to this, an MVC database will be developed and shared with the MEO‟s office and other relevant stakeholders. As planned, K-MET has already launched the ECDE component at a ceremony involving stakeholders and target communities for the purposes of awareness creation, dissemination of the baseline results and clarification of roles and responsibilities.
1.5 Staffing and Enrolment in ECDE Centres in Kisumu Municipality There exist two types of ECDE Centres in Kisumu Municipality; public and private. Table 1 shows staffing levels and pupil enrolment across types of ECDE Centres in Kisumu Municipality in 2012. At the time of the survey, the municipality had a total of 609 ECDE centres. Among these, 123 centres (20.2%) were public and 486 centres (79.8%) were private. This indicates that the private sector continues to play a more pivotal role in the establishment of functional ECDE centres as compared to the public sector within Kisumu Municipality. It is no wonder, therefore, that there were more teachers in private ECDE centres than public ones. Trained teachers were also more than untrained ones regardless of type of ECDE centre.
8 These facts were drawn from official K-MET brochures

18 | P a g e
Table 1: Pupil enrolment and staffing across types of ECDE Centres9
Type of ECDE centre
No. of teachers Enrolment
No. of ECDE centres (%)
Trained (%) UT* (%) Boys’ enrolment (%)
Girls’ enrolment (%)
Total enrolment (%)
Public 123 (20.2) 278 (24.2) 108 (23.5) 5,104 (28.4) 4,974 (29.0) 10,078 (28.7) Private 486 (79.8) 870 (75.8) 351 (76.5) 12,856 (71.6) 12,187 (71.0) 24,983 (71.3) Total 609 (100.0) 1,148 (100.0) 459 (100.0) 17,960 (100.0) 17,161 (100.0) 35,061 (100.0)
*UT=Untrained
Source: MEOs Office, Kisumu Municipality
Overall, enrolment was more in private ECDE centres (71.3%) than public ones (28.7%). Boys‟ enrolment in private centres was 12,856 (71.6%) compared to 5,104 (28.4%) in public centres. Girls‟ enrolment in private centres was 12,187 (71.0%) compared to 4,974 (29.0%) in public centres. Thus, enrolment of boys and girls across the two types of centres was not remarkably different.
1.6 Understanding Early Childhood Development (ECD) The Consultative Group on Early Childhood Care and Development defines early childhood development (ECD) as a field of endeavour that focuses on supporting young children‟s development. In their definition, early childhood encompasses the period of human development from prenatal through the transition from home or ECD centre into the early primary grades (prenatal – 8 years of age). They assert that based on research, ECD links the young child‟s cognitive, social, emotional, and physical processes with the care (by families, communities, and the nation) required to support their development. Thus, in accordance with the UN Convention on the Rights of the Child, ECD field is interdisciplinary in its focus. It includes health, nutrition, education, social science, economics, child protection, and social welfare. The ECD field strives to ensure young children‟s overall well-being during the early years, thereby providing the foundation for the development of adults who are healthy, socially and environmentally responsible, intellectually competent, and economically productive10. Children in the ECD age group experience the most rapid period of growth and change during the human lifespan. Their maturing minds and bodies and nervous systems support increasing mobility, communication skills, intellectual capacities, socio-emotional development, and cultural and personal identity. These changes result in rapid shifts in the kinds of supports young children require. The Group notes that research has highlighted the particular risks to young children from malnutrition, disease, poverty, neglect, social exclusion, violence, and lack of a socially stimulating environment. Research also indicates that well-designed promotion, prevention, and intervention strategies during early childhood have the potential to impact positively on young children‟s well-being and future prospects. They conclude that ECD therefore seeks to ensure convergent and coordinated quality services – health, nutrition, sanitation, education, and protection – within a safe and enriched environment.
9 These figures were derived from official records received from MEOs office, Kisumu
10(see www.ecdgroup.com)
19 | P a g e
The Consultative Group on Early Childhood Care and Development further observes that within the early childhood continuum from conception to age 8, there are three main age periods. These are prenatal through age 3, ages 3-6 (pre-school years) and ages 6-8 (moving into primary school). Each of these main age periods offers differing risks and opportunities as explained below:
a) Prenatal through age 3 This period is critical for ensuring survival and immediate growth and development, as well as establishing a trajectory for future development and growth. Research indicates that during the first three years the brain undergoes rapid and complex development, characterized by key sensitive periods, along with declining plasticity after this period. In addition, delays are increasingly difficult to reverse after age 3. It has also been demonstrated that convergent and coordinated quality services during the period of rapid brain growth can prevent an increase in developmental delays and even reverse them. To achieve optimal development, infants and young children need nurturing by at least one consistent parent or caregiver; good health care; six months of exclusive breastfeeding, if possible; balanced nutrition including essential micronutrients; early exposure to language; opportunities for playful exploration and interaction with other children and adults; and a clean, safe environment. A young child‟s well-being may be put at risk by adverse living conditions, neglect, insensitive or abusive treatment, and restricted opportunities for exploring and learning. Young children growing up in especially difficult circumstances, such as severe poverty, malnutrition, wars, and disease, require particular attention. Strategies must include effective involvement of parents, families, and/ or primary caregivers that emphasizes the quality of the adult-child interaction.
b) The preschool years: ages 3-6 In addition to the support suggested above, children aged 3 to 6 benefit from experiences and programs that provide increased opportunities for learning through play and exploration in groups. Safe, welcoming programs can be provided within the home, through community-based activities, and within more formal preschools. To develop confident learners, early childhood programs should provide children with opportunities to interact with responsive adults; active learning methodologies; enriched curricula; and access to a variety of play, learning materials, and books. Such programs should be provided in the child‟s mother tongue or home language except when the setting includes a number of children whose home languages are different.8 Critical to the success of these programs is the strong involvement of parents and primary caregivers to help children build the skills needed to make effective transitions into varied environments and increasing activity with larger and more diverse groups of people.
c) Moving into primary school: ages 6-8 Early childhood programs, while of value in and of themselves, can also help children become ready for school and to make a successful transition to school. And, while children need to be ready for schools, it is equally important that schools be ready for children. They can do this by implementing specific strategies to support the ways that children in the lower grades of primary school learn best (e.g., through small class size, experienced teachers who have child development knowledge, active learning opportunities, use of mother tongue as the language of instruction, bilingual classes if necessary, and adequate learning materials).Parental “readiness” to be involved and supportive both before and after children enter school is

20 | P a g e
also recognized as key among the supports children need for successful transition, retention, and success in school. The Consultative Group on Early Childhood Care and Development have set out ECD strategies that need to be observed. Across the ECD continuum, the recognition of and support for the interrelatedness of all aspects of a child‟s growth and development is vital. This requires that the ministries and other agencies, including nongovernment groups that govern health, nutrition, water, sanitation, and hygiene; education; social welfare; protection; and the environment communicate and work together with families and communities to provide appropriate policies, programs, and operational guidance. The defining framework for ECD presented above, and which this baseline survey was hinged on, suggests a few leading strategies and appropriate lines of action. Such strategies include but are not limited to support to the family, services that focus on the environment, health service provision, disease prevention, and health promotion. These strategies are in tandem with those of K-MET.
1.7 MVC Issues and ECD In Kenya high mortality rate is brought about by malaria, acute lower respiratory infections, diarrhoea, dehydration, measles, HIV/AIDS, poor hygiene, inadequate access to clean water and lack of breast feeding, as well as iron deficiency which leads to anaemia and malnutrition.11 According to the Kenya National Aids Indicator Survey of 2009, 1.4 million people in Kenya were infected with HIV virus in that year. The national HIV prevalence rate was 7.4% with Nyanza province doubling the national rate. High HIV/AIDS prevalence in Kisumu and its surrounding interferes with child care as it contributes to child headed families. According to the Kenya Demographic Household Survey of 2003, 11% of children below 15 years in Kenya were orphans at that time. Nationally, 2% of children below 15 years had lost both parents in 2010, with Nyanza tripling the national figure. Almost half of the orphan cases in Kenya can be linked to HIV/AIDs. In order to take care of orphans and vulnerable children there is need to mobilize resources and efforts aimed at strengthening the community and supporting children.12 Mainstreaming AIDS issues into ECD programs – for children, parents, teachers and caregivers – can raise awareness of AIDS prevention and treatment issues and provides an entry point for working with affected children and their families.13 Malnutrition is rampant in areas where malaria tropica (plasmodium falciparum) is highly endemic such as Kisumu. Most deaths of under 5 year old children in developing countries are linked to malnutrition as malnourished children become vulnerable to various infections.14 The Ministry of Public Health and Sanitation in collaboration with the Ministry of Medical Services designed national guidelines for diagnosis, treatment and prevention of malaria. The two ministries of health took cognizance of the fact that malaria caused by plasmodium falciparum is one of the leading causes of under-five morbidity and mortality. They therefore came up with the guidelines to provide information and recommendations targeting risk groups such as children and pregnant mothers as well as travelers on how to control and manage the disease. The guidelines recommend the use of co-formulated ACTs and child friendly formulations for treatment of adults
11
MoEST (2006). National Early Childhood Development Policy Framework. June 2006. P.19 12
Plan (2010). Breaking barriers for orphans and vulnerable children in Kenya, November 2010 p.1 13
Social Protection in Eastern and Southern Africa: A Framework and Strategy for UNICEF. pg41 14
Kwena, A. & Wakhisi, J.: Protein-energy malnutrition and malaria antibody profiles in pre-school children in western Kenya. A
potential diagnostic tool.
21 | P a g e
and children but only after thorough diagnosis. Areas around Lake Victoria and the Indian Ocean are described as endemic epidemiological zones and are extremely prone to malaria due to suitable climatic conditions for the vector, that is, high temperatures and humidity. There are seasonal transmissions during rainfalls in Arid and Semi-Arid (ASAL) areas and areas of western highlands of Kenya. The central highlands are low risk malaria areas due to low temperatures which are not conducive for vector survival.15 Child development is affected by changing child rearing practices which are as a result of changes in the economy and society. As an example, the Luo community which constitutes the largest proportion of the population in Kisumu Municipality, is no exception. Traditionally, Luo children belonged to the extended family or the community.16 However, because of community and family disintegration due to rapid modernization, more children today are taken care of by the nuclear family. In the absence of the nuclear family, caregivers such as house helps and guardians take care of children. Most women also no longer act as housewives because they go to search for jobs to fend for their families. Families also stay apart as some members migrate or settle far away from home. The introduction of Free Primary Education in Kenya has increased primary school enrolment thus children who used to take care of their younger children go to school.17 These factors have created a gap in child development as children become either deprived of their basic needs, excluded from participation or vulnerable to threats posed by their environment. Day care centres or home based care of children is taking centre stage in the modern world. Children are vulnerable due to poverty, poor health, malnutrition, and inadequate care. MVC lack the nurturing, care, and stimulation they will need to fully benefit from primary education. ECDE sets stage for primary and secondary education by increasing access to schooling, reducing repetition of classes and dropout rate and the cost of child education and promoting both equity and efficiency.18 Child development and growth is rapid at ECDE level. Eighty five percent of the human brain develops at age 5 whereas 50% of a child‟s cognitive ability is determined by the surrounding. Children need to maintain good health and nutrition to develop physically, linguistically, cognitively and socially. It is easier to address children‟s issues when they are still young than much later.19 Provision of ECDE helps reduce costs of remedial studies in future as well as health costs and parents have time to work. It reduces social and economic inequalities as all children are given the same chance to access education. It also provides an opportunity for children to learn together and bond with families and the community in general. ECDE centres are needed to ameliorate the negative effects of risks in the early years of life; to prevent irreversible losses in capacity; and to address the young child‟s needs for cognitive stimulation, early learning, nutrition, and basic health care. ECD goes beyond child survival to address parenting, cognitive development and readiness for learning. Most children in Africa do not have access to ECD. However, children from poorer homes are even less likely to be exposed to ECD programs. Higher income families are much more likely to have paid adults assisting them with childcare while the parents
15
MPHS Division of Malarial Control and Ministry of Medical Services. National Guidelines for the diagnosis, treatment and prevention of Malaria in Kenya. http://www.nmcp.or.ke.Edition (May 2010). p.1ff
16 Othuon, L. A., McOnyango, O. Ang’awa, F & Ayieko, M. (2006). Growing up and sexual maturation among the Luo of Kenya:
Removing barriers to quality education. Nairobi: Phoenix Publishers Page 3. 17
See Ong’ang’a, H. (2010).Socio-Economic Changes and Their Effects on Child Rearing Practices. Community Development. Longhorn Publishers Page 53-56
18 See. http://www.worldbank.org/children. The Africa ECCD Initiative.
19 FAQs: Early Childhood Development. The World Bank. July 2010.
22 | P a g e
worked. Moreover, parents with lower incomes and less education are the most likely to leave their children in the care of other children. Promoting more equal access to ECD means working to ensure that the most disadvantaged are included and this is a social protection function. A child‟s development also depends critically on caregiving practices. Parents (or caregivers) need to understand the importance of parenting for development.20 It is important to invest in children early through prompt identification of Children With Special Needs (CWSN) so that they can maximize their potential. To increase primary school enrolment, children need to be well prepared so that they can optimally gain when they go to primary schools. Investing on children means supporting parents in raising healthy and successful children for the future. This also saves costs of treatment and reduces dropout and repetition. Other benefits of ECD programs include poverty reduction as children gain skills for survival in the future, reduced inequalities as disabled children and more girls attend school, and inculcating moral values to children which subsequently translates to community empowerment.21 Children need to grow physically and psychologically so as to contribute optimally to their nation„s development. Unhealthy or vulnerable children do not just develop abnormally but require attention and diversion of resources to their developmental needs.22 The Ministry of Public Health and Sanitation (MPHS) through the Division of Child and Adolescent Health (DCAH) developed a strategy called the Integrated Management of Childhood Illnesses (IMCI) to deal with child mortality and disability and to improve their growth and development. The national guideline for identification and referral of children with disabilities and special needs aligns to the strategy by enhancing the early identification, referrals, care, rehabilitation and management of children with disabilities (CWDs) and those with special needs (CWSNs) without discrimination. This is done in partnership with various stakeholders such as Non-governmental organizations (NGOs), Community Based and Faith Based Organizations (CBOs and FBOs) service providers, health facilities and relevant government ministries. According to the Kenya National Survey for Persons with Disability of 2007, around 4.6% of Kenyans are People with Disabilities (PWD) half of which are children under 14 years. The survey also revealed that a large number of vulnerable children who need health services do not actually access them.23 The MPHS recognizes the importance of early childhood development as a determinant of health, wellbeing and skills acquisition. It is therefore necessary that the environment of children is geared towards physical, social and cognitive development. This not only helps in the brain and physical development of a child but also increases the child‟s success in future.24 Disability has diverse definitions depending on agencies dealing with it. In the Kenya National Disability Act of 2003, it is noted that disability could be any impairment that is physical, mental, sensory, visual or hearing that affects one‟s ability to carry out usual activities. Disability could therefore be classified as mental, physical, emotional, sensory, speech, seizure disorder, congenital disorder or multiple disability.
20
Social Protection in Eastern and Southern Africa: A Framework and Strategy for UNICEF p. 37 21
MOEST (2006): National Early Childhood Development Policy Framework. June 2006.p.2ff 22
Ministry of Public Health and Sanitation: National Guidelines for identification and referral of children with disabilities and special needs. April 2010 P.1
.
23Ibid.p.1f
.
24Ibid.p.4
.
23 | P a g e
CWDs need to be screened, identified and rehabilitated early so as to increase their development and self-reliance. Disability is not just determined by the health of a person but also by the environment. All CWDs have a right to „proper upbringing‟ and a conducive environment for growth. However, in most cases they are isolated since they are unable to cope with their biological and contextual challenges.25 Children with special needs (CWSN) cannot develop optimally health wise because of their environmental circumstances. They include children living in especially difficult circumstances such as orphans and vulnerable children, drug abusers and physically, sexually and emotionally abused children. Such children are affected by lack of compassion from parents and guardians, hostility, death of one or both parents, family conflicts, disability and background of parent or caregiver. Other CWSN are children with emotional and behavioral disturbances, gifted and talented children, disadvantaged children and children with chronic or mental illnesses. 26 Malnutrition has adverse effects on child education as it interferes with class attention and performance as well as school enrollment and attendance. Nutrition interventions such as micronutrient supplementation should also be integrated in schools. This involves linking health and nutrition services, availing referrals, counseling and feeding services, involving the communities and training of food handlers. School feeding programmes help increase attention and concentration of learners by reducing hunger. These should involve provision of Vitamin A, iodine, iron and folic acids.27 Measures to control or prevent diseases in school should be taken to improve learning and development of a child. These include prevention of HIV/AIDs and STIs, non-discrimination of HIV/AIDS positive people, availing antiretroviral therapy and Voluntary Counseling and Testing centres, prevention of tuberculosis through creation of space and referrals and treatment of TB patients. Measures should also be taken to control malaria, worms and other diseases. All children should be fully immunized and educated on non-communicable and other diseases.28 Other Measures to protect the health of a child include controlling substance and drug use and abuse, ensuring oral health, promoting eye care and mental health, promoting physical health and early identification and surveillance for diseases services. First Aid facilities and training should also be provided as well as a conducive environment for CWSN and CWDs.29
1.8 Policies and Guidelines The government‟s commitment to children can be seen in the initiatives that it is involved in both internationally and locally. For instance the Kenyan government has signed the United Nations Convention on the Rights of the Child (CRC, 1989) and the African Charter on the Rights and Welfare of the Child. It endorsed the Jomtien World Conference on Education for All (EFA) and the Dakar World Education Forum. Locally it has enacted the 2001 Children Act and started the Poverty Eradication Strategy Paper (PESP, 2004) and the Economic Recovery Strategy for Wealth and Employment Creation (ERSWEC).30
25
Ibid p.8ff.
26Ibid p.20.
27National School Health Policy.Ministry of Public Health and Sanitation and Ministry of Education, Science and Technology.
2009.p.27f.
28Ibid. p.29ff
29Ibid.p.33ff.
30MOEST (2006): National Early Childhood Development Policy Framework. June 2006. P.4
24 | P a g e
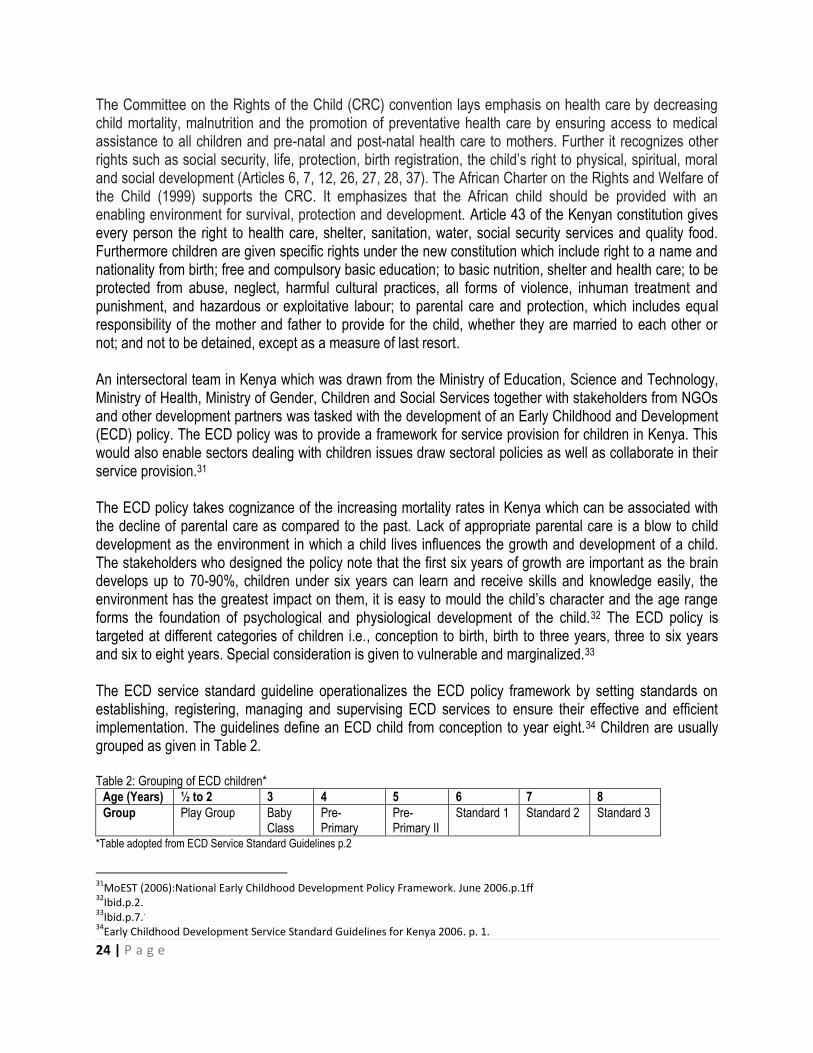
The Committee on the Rights of the Child (CRC) convention lays emphasis on health care by decreasing child mortality, malnutrition and the promotion of preventative health care by ensuring access to medical assistance to all children and pre-natal and post-natal health care to mothers. Further it recognizes other rights such as social security, life, protection, birth registration, the child‟s right to physical, spiritual, moral and social development (Articles 6, 7, 12, 26, 27, 28, 37). The African Charter on the Rights and Welfare of the Child (1999) supports the CRC. It emphasizes that the African child should be provided with an enabling environment for survival, protection and development. Article 43 of the Kenyan constitution gives every person the right to health care, shelter, sanitation, water, social security services and quality food. Furthermore children are given specific rights under the new constitution which include right to a name and nationality from birth; free and compulsory basic education; to basic nutrition, shelter and health care; to be protected from abuse, neglect, harmful cultural practices, all forms of violence, inhuman treatment and punishment, and hazardous or exploitative labour; to parental care and protection, which includes equal responsibility of the mother and father to provide for the child, whether they are married to each other or not; and not to be detained, except as a measure of last resort. An intersectoral team in Kenya which was drawn from the Ministry of Education, Science and Technology, Ministry of Health, Ministry of Gender, Children and Social Services together with stakeholders from NGOs and other development partners was tasked with the development of an Early Childhood and Development (ECD) policy. The ECD policy was to provide a framework for service provision for children in Kenya. This would also enable sectors dealing with children issues draw sectoral policies as well as collaborate in their service provision.31 The ECD policy takes cognizance of the increasing mortality rates in Kenya which can be associated with the decline of parental care as compared to the past. Lack of appropriate parental care is a blow to child development as the environment in which a child lives influences the growth and development of a child. The stakeholders who designed the policy note that the first six years of growth are important as the brain develops up to 70-90%, children under six years can learn and receive skills and knowledge easily, the environment has the greatest impact on them, it is easy to mould the child‟s character and the age range forms the foundation of psychological and physiological development of the child.32 The ECD policy is targeted at different categories of children i.e., conception to birth, birth to three years, three to six years and six to eight years. Special consideration is given to vulnerable and marginalized.33 The ECD service standard guideline operationalizes the ECD policy framework by setting standards on establishing, registering, managing and supervising ECD services to ensure their effective and efficient implementation. The guidelines define an ECD child from conception to year eight.34 Children are usually grouped as given in Table 2. Table 2: Grouping of ECD children*
Age (Years) ½ to 2 3 4 5 6 7 8
Group Play Group Baby Class
Pre-Primary
Pre- Primary II
Standard 1 Standard 2 Standard 3
*Table adopted from ECD Service Standard Guidelines p.2
31
MoEST (2006):National Early Childhood Development Policy Framework. June 2006.p.1ff 32
Ibid.p.2.
33Ibid.p.7.
.
34Early Childhood Development Service Standard Guidelines for Kenya 2006. p. 1.
25 | P a g e
Children are grouped as very young children (0-3 years), pre-school age (4-5 years), children in the lower primary school (6-8 years) and Children with Special Needs. Each group of children requires special attention and support.35 ECD service standard guidelines also include standards for quality and inclusion. These are divided into standards for quality services from conception to 3 years; standards for quality services for children with special needs; standards for establishment and registration of ECD centres and training institutions; standards for ECD service providers; standards for ECD curriculum and pedagogy and standards to ensure effective partnership and networking. Highlights of these quality standards include accessibility of ante- and post-natal services to expectant mothers, participation of men in childcare, provision of quality services, maternal leave regulations, development of screening tools for identification of CWD, training of personnel on use of the tools, conducive environment and facilities for CWD, provision of affordable assistive aids and devices and equal treatment of all children. On registration the standards require registration of all early childhood services but no registration of boarding facilities for children under 8 years. ECD centre compounds should range from between 0.125 to 0.5 acre. The classes should be 8 by 6 metres and should accommodate not more than 25 children, well lit and ventilated. Toilet to child ratio shall be 1:25 and the toilet to teacher ratio shall be 1:12. Teacher to child ratio is also defined for different age groups as follows: below 2 years (1:4),2 to 3 years (1:10), 3 to 4 years (1:25), 4 to 5 years (1:25), 5 to 6 years (1:30) and 6-8 years (1:40) as well as ratios for different categories of CWSNs.36 To implement the policy the government works together with partners such as parents, the community and other development partners. Each of the partners have specific roles to play. The parents are the primary caretakers of the children and are responsible for all their needs and rights. The community supports the parents, sets norms and values and mobilizes resources for the children. The Ministry of Education, Science and Technology (MOEST) is in charge of registration, supervision of ECDEs and capacity building of the personnel, identification of CWD and CWSNs, monitoring and evaluation among other duties. The Ministry of Health (MOH) promotes maternal and child health, hygiene, sanitation and the implementation of the Integrated Management of Childhood Illnesses (IMCI). The ministries also carry out advocacy, community mobilization and capacity building among other activities. Other stakeholders include the Ministry of Home Affairs (MHA) represented by the provincial administration, Ministry of Water and Irrigation (MOWI), Ministry of Planning and Vision 2030, Ministry of Finance (MOF), Ministry of Gender Children and Social Services (MGCSS), Ministry of Local Government (MOLG) and other ministries. Non-governmental organizations (NGOs), Community Based Organization(CBOs) and Faith Based organizations (FBOs) also support and provide ECD services.37 The Ministry of Public Health and Sanitation in collaboration with the Ministry of Education, Science and Technology has come up with a policy to ensure children in school are healthy. The policy aims at achieving Millennium Development Goals such as Universal Primary Education (UPE), reducing HIV/AIDS, Malaria and other diseases, improving environmental sustainability, gender equity and global partnerships.
35
Ibid. p. 2f 36
Ibid p. 3-18.
37MoEST (2006):National Early Childhood Development Policy Framework. June 2006.p.7ff

26 | P a g e
To enforce the National School Health Policy it was important to develop National School Health Guidelines.38 The policy introduces comprehensive school health program (CSHP) which handles health and education needs of children and their caretakers.39 Kenyan children, who constitute about half the country‟s population, are susceptible to ill health due to poor hygiene, sanitation, nutrition and other factors. Some of the impediments to good health and quality education include diseases, early pregnancies, substance abuse, physical and other forms of abuse and risky environments. Improved health has positive effects on education as children develop physically, mentally and psychologically and are able to contribute to the nations development.40 The National School Health Policy is guided by principles such as the right to quality nutritional services; the right to access safe drinking water, sanitation and improved hygiene; the right to privacy and confidential treatment of childrens„ health; the right to safe and accessible environments and the right to access quality education especially for vulnerable children. It further highlights the importance of zero tolerance to discrimination against children; ensuring open access to relevant health and education information; upholding the principle of equality and equity when handling issues that affect children; being gender responsive and ensuring easy accessibility to learning.41 The policy further stresses that a gender responsive skill based curriculum which addresses health needs will be implemented through appropriate strategies. More specifically, the strategies will ensure that, [i] children gain positive values and life skills; [ii] appropriate sanitary facilities are provided accordingly; [iii] schools and communities are sensitized to do away with harmful cultural practices such as Female Genital Mutilation (FGM) and early marriages; [iv] children are provided with equal opportunities and learning materials for boys and girls; [v] adolescents are supported through information provision on puberty and counseling; [vi] necessary measures are put in place to reduce early and unprotected sex activities; [vii] the youth, parents and the community are enlightened on harmful practices and habits, and [viii] pregnant girls are supported and later on re-admitted to school as young mothers.42 The last strategy on supporting pregnant girls who are later on to be re-admitted to school is part of what K-MET plans to implement through its Access to Basic Education for the Most Vulnerable Children sub-program. The policy also addresses the issues of water supply, water safety, sanitation and hygiene. It recommends the provision of safe drinking water as well as appropriate sanitation and hygiene. It emphasizes the importance of establishing adequate and appropriate ablution services, handwashing facilities, proper waste management as well as relevant and adequate sanitation facilities, pupil centred hygiene promotion, treatment of hygiene related complications and effective monitoring and evaluation of the learning environment.43
38
National School Health Policy. Ministry of Public Health and Sanitation and Ministry of Education, Science and Technology.
2009.p.6.
39Ibid.p.13f..
40Ibid.p.14.
41National School Health Policy. Ministry of Public Health and Sanitation and Ministry of Education, Science and Technology.
2009.p.16f
42Ibid.p.24ff.
43Ibid.p.26
.
27 | P a g e
Apart from Malaria, diarrhoea is one of the top five leading causes of mortality and morbidity for children under five in Kenya. Poor case management, reduced use of oral rehydration therapy (ORT), low coverage of trained workers on Integrated Management of Childhood Illness (IMCI) and lack of policy statement on diarrheal diseases necessitated the development of a policy framework. Some of the objectives are to reduce by half deaths due to diarrhoea among under five years by 2013 and mortality by two thirds by 2015 as in the Millennium Development Goals. This is done through the Division of Child and Adolescent Health (DCAH) in the Ministry of Public Health and Sanitation (MPHS). The policy strategies include capacity building of health human resource, empowering caretakers to carry out home based case management, prompt and effective case management at health facilities, prevention, advocacy, Information Education and Communication (IEC) and behavior change communication and logistic management. The policy recommends frequent breastfeeding, use of cereal gruel (uji), milk, fresh fruit juices, soups, low osmolarity oral rehydration salts (ORS), immunization, Vitamin A and zinc supplementation, intravenous therapy, clean, safe water, and proper hygiene and sanitation.44
1.9 Objectives of the study The objectives of the baseline survey in the five informal settlements in Kisumu Municipality were to:
1. Establish background information on households, household care and development, household health and sanitation, household nutrition and household economic indicators.
2. Identify the location of 11 model ECDE centres with support from the community members. 3. Develop criteria for identifying the MVC with support from the community.
1.10 Structure of the Report The main part of this report is divided into four sections. These are Introduction, Methodology, Study findings, Conclusions and Recommendations. The Introduction section has Background information; Informal settlements in Kisumu Municipality; The provision of education in Kisumu Municipality; Staffing and Enrolment in ECDE Centres; Understanding Early Childhood Development; MVC issues and ECD; Policies and Guidelines and Objectives of the study. The Methodology section has eight sub-sections. These are Research Design, Tranining of Researchers, Population, Sample and Sampling Procedure, Instruments for data collection, Validity of research instruments, Methods of data collection and Methods of data analysis. The section on Study Findings has twelve sub-sections, namely, Background information on households; MVC identification criteria; Quality, accessibility and cost of education; Services offered to schools; Policies on children; Challenges to children‟s education; Care and development of households; Household nutrition; Household economic indicators; Involvement of parents, government and community; Preferred ECDEs and Organizations in the settlements. The last section of the report has Conclusions and Recommendations.
44
Policy Guidelines on control and management of diarrheal diseases in children below five years in Kenya. Division of Child and Adolescent Health. March 2010. P.1ff

28 | P a g e
2.0 METHODOLOGY 2.1 Research Design Through a K-MET Project Proposal, it was planned that an appropriate and a coordinated baseline survey be conducted as part of a number of activities. Guided by the Project Proposal in general and the Logical Framework in particular, a cross-sectional survey research design was used in this study as this was the most appropriate approach for conducting study of this nature.
2.2 Training of Researchers Training of 5 supervisors, 5 Focus Group Discussion (FGD) facilitators, 3 transcribers, 3 data entry clerks and 10 research assistants took place at Millennium School of Business Studies from 24th August 2012 to 26th August 2012. The purpose of this activity was to ensure that the entire research team consisting of consultants, research supervisors, research assistants and facilitators understood the basic principles of social science research. Such principles included interviewing skills, data quality management and standard operating procedures (SOPs) during field work. Plate 1 shows one of the training sessions for researchers.
Plate 1: A training session for researchers
An evaluation of the training exercise was conducted on the last day using an instrument with 27 Likert type 5 point scale ranging from Strongly Disagree (SD), Disagree (D), Neutral (N), Agree (A) to Strongly Agree (SA). The instrument measured quality of training (10 items), quality of instructors (6 items),quality of training environment (5 items), benefit of training (3 items) and overall quality of training (3 items). It yielded Chronbach‟s alpha coefficient, a measure of the instruments internal consistency, of 0.861 indicating that it
was reliable. Overall, the training was meaningful to all those who participated.

29 | P a g e
2.3 Population The population consisted 42,740 household heads in the five informal settlements. This number includes 12,525 from Manyatta A, 7,808 from Manyatta B, 8,070 from Nyalenda A, 8,561 from Nyalenda B, approximately 2,000 from Obunga, 1,921 from Bandani and approximately 1,855 from Manyatta Arab.Nine key informants and 100 FGD participants (20 from each settlement, 10 males and 10 females) also took part in the study.Nine key informants participated in the study. Also, twenty children age 0-8 years (10 boys and 10 girls) formed part of the study.
2.4 Sample and Sampling Procedure The five informal settlements used in this survey were Manyatta, Nyalenda, Obunga, Bandani and Manyatta Arab. The settlements had seven sublocations, namely, Manyatta A, Manyatta B, Nyalenda A, Nyalenda B, Obunga, Bandani and Manyatta Arab. Based on the population for each sub-location, proportionate sampling was used to select 370 housesholds. In addition to this, 35 households were selected to take care of possible non-response, giving a total of 405 households from which household heads responded to a survey questionnaire. A representative and non-biased household quantitative survey was used. The sample size was calculated at household level using Creative Research Systems‟ (2003) formula given by:
2
2 )1(
c
ppZSS
Where: SS=sample size Z=1.96 (for 95% confidence level) p=percentage picking a choice, expressed as decimal (p=0.5 in this case as this yields the maximum possible sample size required) c=confidence interval, expressed as decimal (0.05 in this case giving an interval of ±5). Subsequent to this, a correction for finite population will be made as follows:
New SS=
pop
SS
SS
11
Where pop=population. The formula gives a sample size of 370. This sample size, when drawn randomly from a finite population size is such that the sample proportion p will be within ±.05 of the population proportion P with a 95% level of confidence. To take care of possible non-response, a total of 405 households was used in the survey which was proportioned in different strata based on the number of households in each of the 5 informal settlements (See Table 3). Households were selected using systematic random sampling. Individual participants were selected conveniently depending on who was present in the household at the time of data collection.
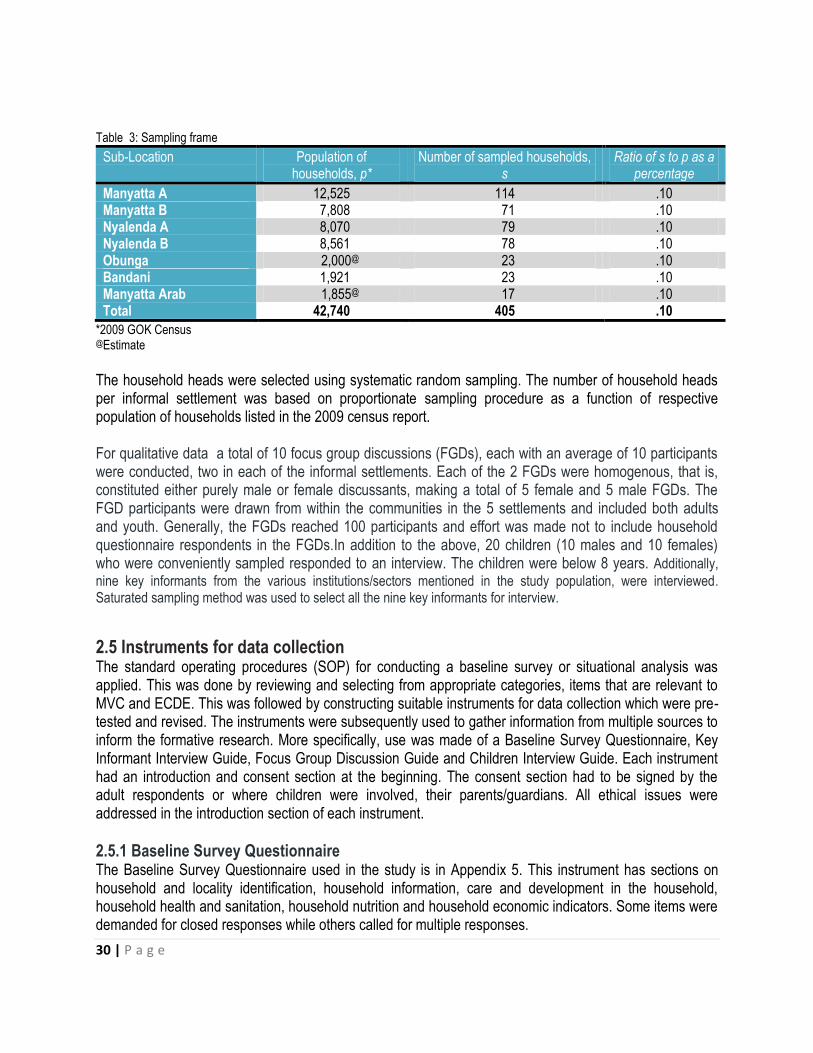
30 | P a g e
Table 3: Sampling frame
Sub-Location Population of households, p*
Number of sampled households, s
Ratio of s to p as a percentage
Manyatta A 12,525 114 .10 Manyatta B 7,808 71 .10 Nyalenda A 8,070 79 .10 Nyalenda B 8,561 78 .10 Obunga 2,000@ 23 .10 Bandani 1,921 23 .10 Manyatta Arab 1,855@ 17 .10 Total 42,740 405 .10
*2009 GOK Census @Estimate
The household heads were selected using systematic random sampling. The number of household heads per informal settlement was based on proportionate sampling procedure as a function of respective population of households listed in the 2009 census report. For qualitative data a total of 10 focus group discussions (FGDs), each with an average of 10 participants were conducted, two in each of the informal settlements. Each of the 2 FGDs were homogenous, that is, constituted either purely male or female discussants, making a total of 5 female and 5 male FGDs. The FGD participants were drawn from within the communities in the 5 settlements and included both adults and youth. Generally, the FGDs reached 100 participants and effort was made not to include household questionnaire respondents in the FGDs.In addition to the above, 20 children (10 males and 10 females) who were conveniently sampled responded to an interview. The children were below 8 years. Additionally,
nine key informants from the various institutions/sectors mentioned in the study population, were interviewed. Saturated sampling method was used to select all the nine key informants for interview.
2.5 Instruments for data collection The standard operating procedures (SOP) for conducting a baseline survey or situational analysis was applied. This was done by reviewing and selecting from appropriate categories, items that are relevant to MVC and ECDE. This was followed by constructing suitable instruments for data collection which were pre-tested and revised. The instruments were subsequently used to gather information from multiple sources to inform the formative research. More specifically, use was made of a Baseline Survey Questionnaire, Key Informant Interview Guide, Focus Group Discussion Guide and Children Interview Guide. Each instrument had an introduction and consent section at the beginning. The consent section had to be signed by the adult respondents or where children were involved, their parents/guardians. All ethical issues were addressed in the introduction section of each instrument.
2.5.1 Baseline Survey Questionnaire The Baseline Survey Questionnaire used in the study is in Appendix 5. This instrument has sections on household and locality identification, household information, care and development in the household, household health and sanitation, household nutrition and household economic indicators. Some items were demanded for closed responses while others called for multiple responses.

31 | P a g e
2.5.2 Key Informant Interview Guide The Key Informant Interview Guide used in the study is in Appendix 6. This instrument has items on
general understanding of MVCs and DEV; issues regarding access, quality and relevance of service
delivery; policy at community, provincial and national levels; socio-cultural, geographical and economic
factors that affect education for boys and girls and community organizations and participation in MVC
issues in their respective areas of jurisdiction.
2.5.3 Focus Group Discussion Guide The Focus Group Discussion Guide in Appendix 7 was prepared to gather information on MVC identification criteria, quality, accessibility and cost of education, services offered to schools and their effects, involvement of parents in schools, government and community contributions, preferred ECDEs, challenges to children‟s education and organizations in the settlements.
2.5.4 Children Interview Guide The Children Interview Guide in Appendix 8 has items that captured the three important dimensions of the Baseline Survey Questionnaire but with specific reference to the children themselves. These are Health and Sanitation, Food and Nutrition and Care and Development. The last section is an item that calls for Direct Observation of characteristics of the child by the researcher.
2.6 Validity of research instruments Pretesting of the research instruments was conducted and those participants involved in pretesting were excluded from the sample. The feedback from the pretest was used to improve the content validity of the instruments.
2.7 Methods for data collection The approaches used for data collection were as follows:
a) Administration of baseline questionnaire to four hundred and five household heads in the five informal settlements. This was done by research assistants who had supervsors to oversee the quality of their work. In addition, KMET provided mobilizers who were acquainted with the informal settlements to guide the researchers.
b) Nine key informant interviews, conducted by facilitators, were carried out with various stakeholders. The stakeholders, who were selected in consultation with K-MET, were:
o Co-ordinator, Manyatta Faith & Hope o Municipal Education Officer o Project Officer of Child Fund o UNICEF o Headteacher of Ring Road Orphanage o Chief of Nyalenda o Deputy Quality Assurance Officer at the Kisumu County Education Office o Millenium Cities Initiative o CADIF.

32 | P a g e
c) Ten Focus Group Discussions were conducted by facilitators, two in each settlement. Distribution of adults and youth was taken into account. The number of participants in each FGD was 10 except in Bandani where only 5 were available.
d) Twenty children aged 0-8 years were also involved in the survey. The children were conveniently sampled, two per informal settlement (1 male and 1 female).They were interviewed by research assistants.
2.8 Methods of data analysis Lastly, data collected through the different sources were analyzed to determine what the findings meant
with regard to the needs and services within the communities. For quantitative data, use was made of
frequencies, percentages and graphical plots. For qualitative data, emerging themes were reported
following transcription of the data.

33 | P a g e
3.0 STUDY FINDINGS
Specific analysis of the five informal settlements under study is provided in this Chapter, namely, Bandani,
Manyatta, Manyatta Arab, Nyalenda and Obunga.In particular, background information on households,
issues on household care and development, household health and sanitation and household economic
indicators are provided, with comparisons across location where necessary. In addition, identified locations
for 11 new ECDE Centres are provided. Lastly, criteria for identifying the MVC as suggested by community
members through Focus Group Discussions are presented.
3.1 Background information on households In this section, demographic characteristics of the children respondents; gender distribution of household
participants, their age and marital status; occupation for household respondents and their spouses; number
of members within households; household members in school; reasons for children not going to school and
number of girls below age 18 years with children, are presented.
3.1.1 Demographic characteristics of children respondents The survey managed to interview 10 boys and 10 girls, largely maintaining the children‟s sample size as
originally designed. The youngest child was 4 years old (girl). while the oldest children were 8 year olds (2
boys and 2 girls). The mean age was 6.4 years and the modal age (the age with the highest frequency)
was 7 years. Table 4 shows the distribution of the children respondents.
Table 4: Distribution of children respondents by age
Age (years) Frequency Percentage
4 1 5.0
5 1 5.0
5 5 25.0
6 1 5.0
7 8 40.0
8 4 20.0
Total 20 100.0
Overall, half the children (50%) were in ECD. Only one child (a boy) was not in school and the others were
spread out in Std 1 to Std 3 as shown in Table 5.

34 | P a g e
Table 5: Distribution of children respondents by academic class
Frequency Percentage
Not in school 1 5.0
Nursery 10 50.0
Std1 4 20.0
Std2 2 10.0
Std3 3 15.0
Total 20 100.0
All the 10 girls were in school, the majority of whom (60%) were in ECD. However, only 4 boys were in ECD.
3.1.2 Gender distribution of household participants Table 4 shows gender distribution of household participants. Overall, 61 males (15.3%) and 337 females (84.7%) constituted the sample in the 398 households. Considering that 405 baseline questionnaires were administered, the non-response rate was only 1.7%. The proportions differed across location because of relative numbers of households in each location. There were more females in the sample than males in each location, an outcome that indicates that in most households, it is females who are left behind to undertake household chores. This was more particularly so in Bandani and Manyatta Arab. Table 6: Gender distribution of participants
Location
Sample size
Male Female TOTAL
frequency % Frequency % Frequency % Bandani 1 4.5 21 95.5 22 5.5 Manyatta 30 16.7 150 83.3 180 45.2 Manyatta Arab 0 0.0 17 100.0 17 4.3 Nyalenda 24 15.3 133 84.7 157 39.5 Obunga 6 27.3 16 72.7 22 5.5 TOTAL 61 15.3 337 84.7 398 100.0
3.1.3 Age and Marital status of household respondents Figure 1 shows the age of household respondents. 24% of the survey„s household respondents interviewed were aged 25-29 years; 21% 30-34 years; 18% were above 45 years of age; 16% were 18-24 years old; 14% 35-39 years; 7% were aged 40-44 years while at least 1% of the respondents did not know their age bracket. Generally, majority of the household respondents (61%) were of youthfull age between 18 – 34 years, depicting an active popoulation with respect to productive and reproductive dimensions. Regionally, the modal age of household heads in Bandani and Obunga was above 45 years while that of Manyatta was 25 to 29 years, with the majority generally falling in the lower age range. The modal age range for

35 | P a g e
Manyatta Arab was 30 to 34 years and that of Nyalenda was 25 to 29 years. It is evident that in terms of proportions, Nyalenda and Manyatta had a substantial number of younger household heads compared to the other locations. It is worth noting that Bandani and Obunga had 59.1% and 31.8% of their household heads aged above 45 years, respectively. Bandani had the largest proportion of elderly household heads. Figure 2 shows the regional variations in age brackets of spouses of the respondents.
Figure 1: Age of household respondents
Figure 2: Age of household respondents per settlement

36 | P a g e
Table 7 shows the age of respondents‟ spouses. Regardless of location, the modal age for spouses of
household heads was 30 to 34 representing 16.8% of the responses. This was followed closely by spouses
whose ages were above 45 years. In general most of the spouses were above 18 years old with only two
households having spouses who were minors.
Table 7: Age of spouses of Household Heads
Age of spouse Frequency Percent Valid Percent Cumulative Percent
Below 18 years 2 .5 .6 .6
18 to 24 years 25 6.3 8.0 8.6
25 to 29 years 47 11.8 15.0 23.6
30 to 34 years 67 16.8 21.3 44.9
35 to 39 years 52 13.1 16.6 61.5
40 to 44 years 31 7.8 9.9 71.3
Above 45 years 60 15.1 19.1 90.4
Don't know 30 7.5 9.6 100.0
Total 314 78.9 100.0
Missing 84 21.1
Total 398 100.0
Table 8 shows marital status of respondents. Whereas the predominant marital status was monogamous marriage, Bandani had the highest proportion of widowed respondents, followed by Obunga.
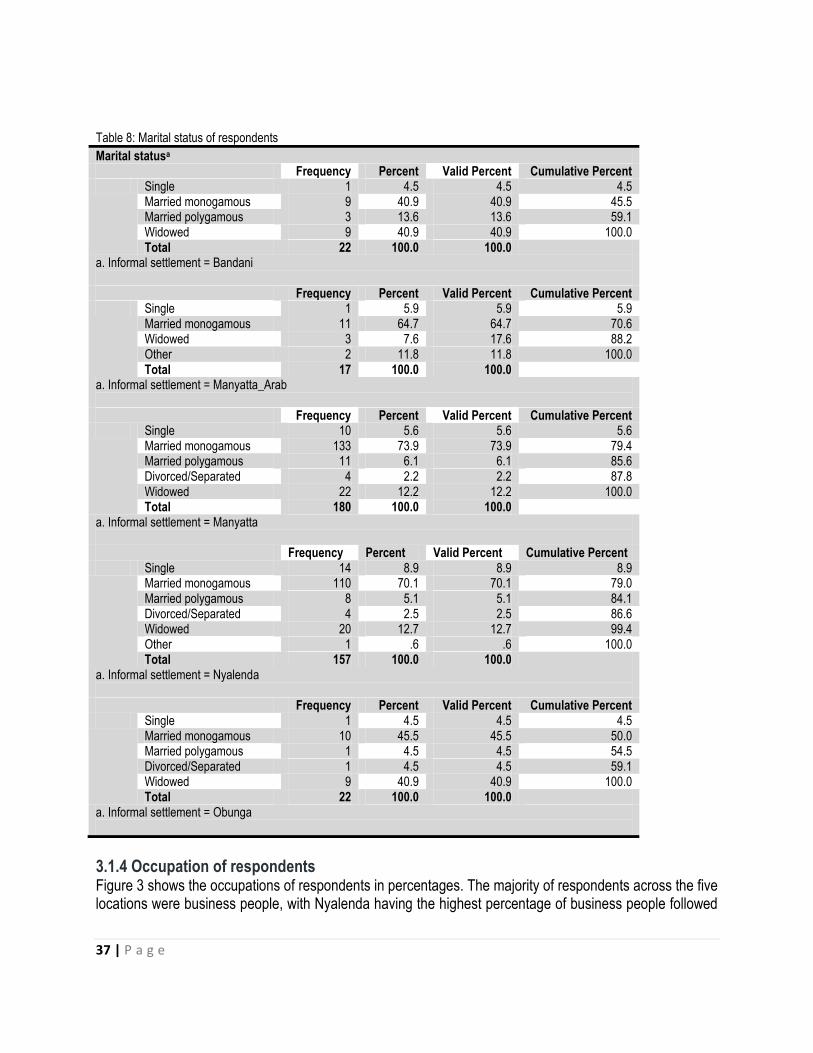
37 | P a g e
Table 8: Marital status of respondents
Marital statusa Frequency Percent Valid Percent Cumulative Percent Single 1 4.5 4.5 4.5
Married monogamous 9 40.9 40.9 45.5 Married polygamous 3 13.6 13.6 59.1 Widowed 9 40.9 40.9 100.0 Total 22 100.0 100.0
a. Informal settlement = Bandani Frequency Percent Valid Percent Cumulative Percent Single 1 5.9 5.9 5.9
Married monogamous 11 64.7 64.7 70.6 Widowed 3 7.6 17.6 88.2 Other 2 11.8 11.8 100.0 Total 17 100.0 100.0
a. Informal settlement = Manyatta_Arab Frequency Percent Valid Percent Cumulative Percent Single 10 5.6 5.6 5.6
Married monogamous 133 73.9 73.9 79.4 Married polygamous 11 6.1 6.1 85.6 Divorced/Separated 4 2.2 2.2 87.8 Widowed 22 12.2 12.2 100.0 Total 180 100.0 100.0
a. Informal settlement = Manyatta Frequency Percent Valid Percent Cumulative Percent Single 14 8.9 8.9 8.9
Married monogamous 110 70.1 70.1 79.0 Married polygamous 8 5.1 5.1 84.1 Divorced/Separated 4 2.5 2.5 86.6 Widowed 20 12.7 12.7 99.4 Other 1 .6 .6 100.0 Total 157 100.0 100.0
a. Informal settlement = Nyalenda Frequency Percent Valid Percent Cumulative Percent Single 1 4.5 4.5 4.5
Married monogamous 10 45.5 45.5 50.0 Married polygamous 1 4.5 4.5 54.5 Divorced/Separated 1 4.5 4.5 59.1 Widowed 9 40.9 40.9 100.0 Total 22 100.0 100.0
a. Informal settlement = Obunga
3.1.4 Occupation of respondents Figure 3 shows the occupations of respondents in percentages. The majority of respondents across the five locations were business people, with Nyalenda having the highest percentage of business people followed
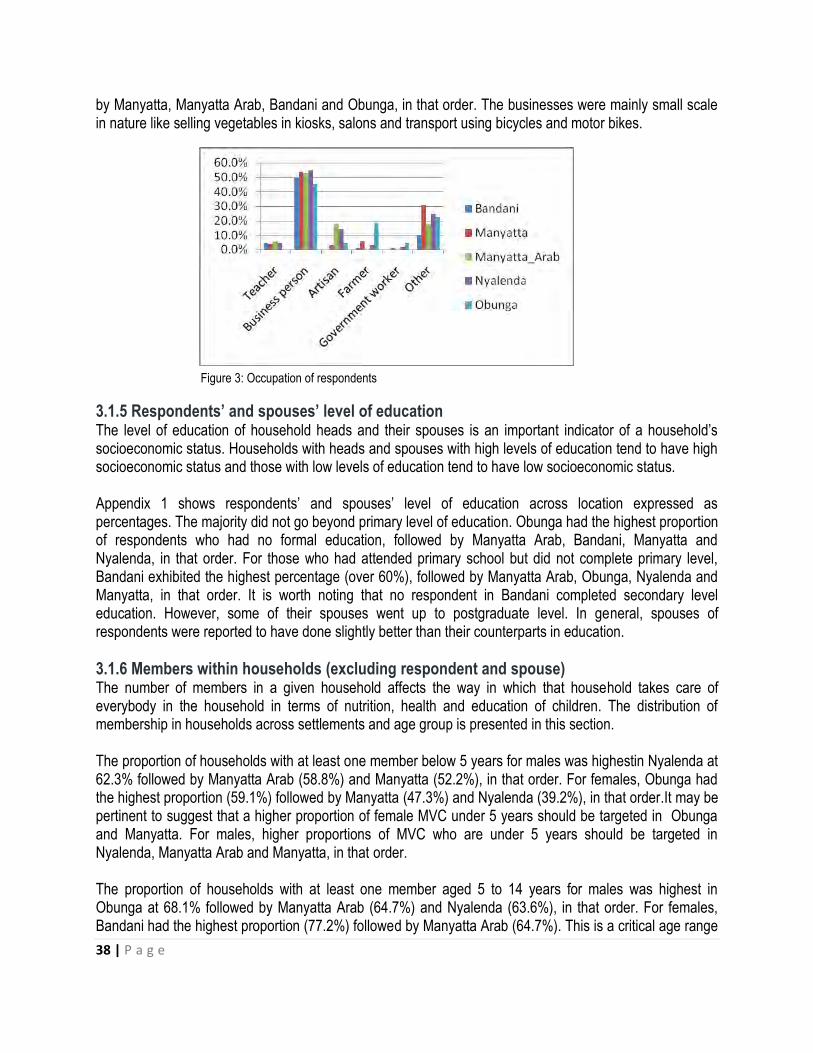
38 | P a g e
by Manyatta, Manyatta Arab, Bandani and Obunga, in that order. The businesses were mainly small scale in nature like selling vegetables in kiosks, salons and transport using bicycles and motor bikes.
Figure 3: Occupation of respondents
3.1.5 Respondents’ and spouses’ level of education The level of education of household heads and their spouses is an important indicator of a household‟s socioeconomic status. Households with heads and spouses with high levels of education tend to have high socioeconomic status and those with low levels of education tend to have low socioeconomic status. Appendix 1 shows respondents‟ and spouses‟ level of education across location expressed as percentages. The majority did not go beyond primary level of education. Obunga had the highest proportion of respondents who had no formal education, followed by Manyatta Arab, Bandani, Manyatta and Nyalenda, in that order. For those who had attended primary school but did not complete primary level, Bandani exhibited the highest percentage (over 60%), followed by Manyatta Arab, Obunga, Nyalenda and Manyatta, in that order. It is worth noting that no respondent in Bandani completed secondary level education. However, some of their spouses went up to postgraduate level. In general, spouses of respondents were reported to have done slightly better than their counterparts in education.
3.1.6 Members within households (excluding respondent and spouse) The number of members in a given household affects the way in which that household takes care of everybody in the household in terms of nutrition, health and education of children. The distribution of membership in households across settlements and age group is presented in this section. The proportion of households with at least one member below 5 years for males was highestin Nyalenda at 62.3% followed by Manyatta Arab (58.8%) and Manyatta (52.2%), in that order. For females, Obunga had the highest proportion (59.1%) followed by Manyatta (47.3%) and Nyalenda (39.2%), in that order.It may be pertinent to suggest that a higher proportion of female MVC under 5 years should be targeted in Obunga and Manyatta. For males, higher proportions of MVC who are under 5 years should be targeted in Nyalenda, Manyatta Arab and Manyatta, in that order. The proportion of households with at least one member aged 5 to 14 years for males was highest in Obunga at 68.1% followed by Manyatta Arab (64.7%) and Nyalenda (63.6%), in that order. For females, Bandani had the highest proportion (77.2%) followed by Manyatta Arab (64.7%). This is a critical age range
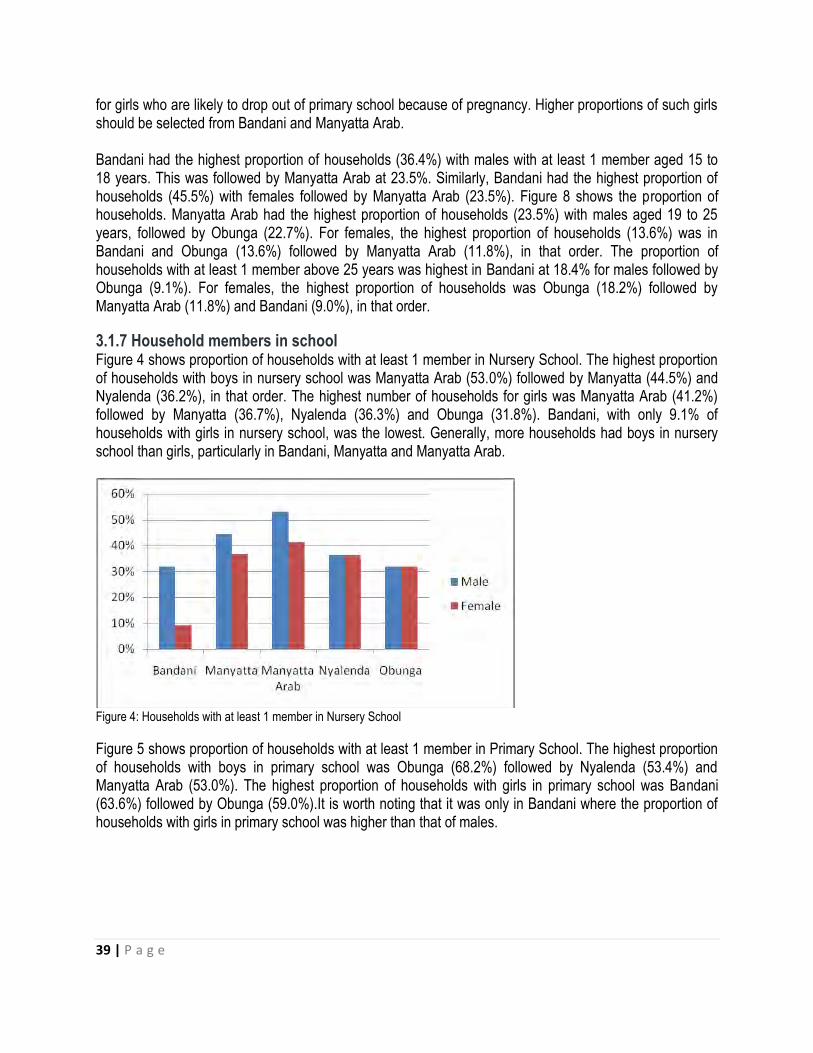
39 | P a g e
for girls who are likely to drop out of primary school because of pregnancy. Higher proportions of such girls should be selected from Bandani and Manyatta Arab. Bandani had the highest proportion of households (36.4%) with males with at least 1 member aged 15 to 18 years. This was followed by Manyatta Arab at 23.5%. Similarly, Bandani had the highest proportion of households (45.5%) with females followed by Manyatta Arab (23.5%). Figure 8 shows the proportion of households. Manyatta Arab had the highest proportion of households (23.5%) with males aged 19 to 25 years, followed by Obunga (22.7%). For females, the highest proportion of households (13.6%) was in Bandani and Obunga (13.6%) followed by Manyatta Arab (11.8%), in that order. The proportion of households with at least 1 member above 25 years was highest in Bandani at 18.4% for males followed by Obunga (9.1%). For females, the highest proportion of households was Obunga (18.2%) followed by Manyatta Arab (11.8%) and Bandani (9.0%), in that order.
3.1.7 Household members in school Figure 4 shows proportion of households with at least 1 member in Nursery School. The highest proportion of households with boys in nursery school was Manyatta Arab (53.0%) followed by Manyatta (44.5%) and Nyalenda (36.2%), in that order. The highest number of households for girls was Manyatta Arab (41.2%) followed by Manyatta (36.7%), Nyalenda (36.3%) and Obunga (31.8%). Bandani, with only 9.1% of households with girls in nursery school, was the lowest. Generally, more households had boys in nursery school than girls, particularly in Bandani, Manyatta and Manyatta Arab.
Figure 4: Households with at least 1 member in Nursery School
Figure 5 shows proportion of households with at least 1 member in Primary School. The highest proportion of households with boys in primary school was Obunga (68.2%) followed by Nyalenda (53.4%) and Manyatta Arab (53.0%). The highest proportion of households with girls in primary school was Bandani (63.6%) followed by Obunga (59.0%).It is worth noting that it was only in Bandani where the proportion of households with girls in primary school was higher than that of males.
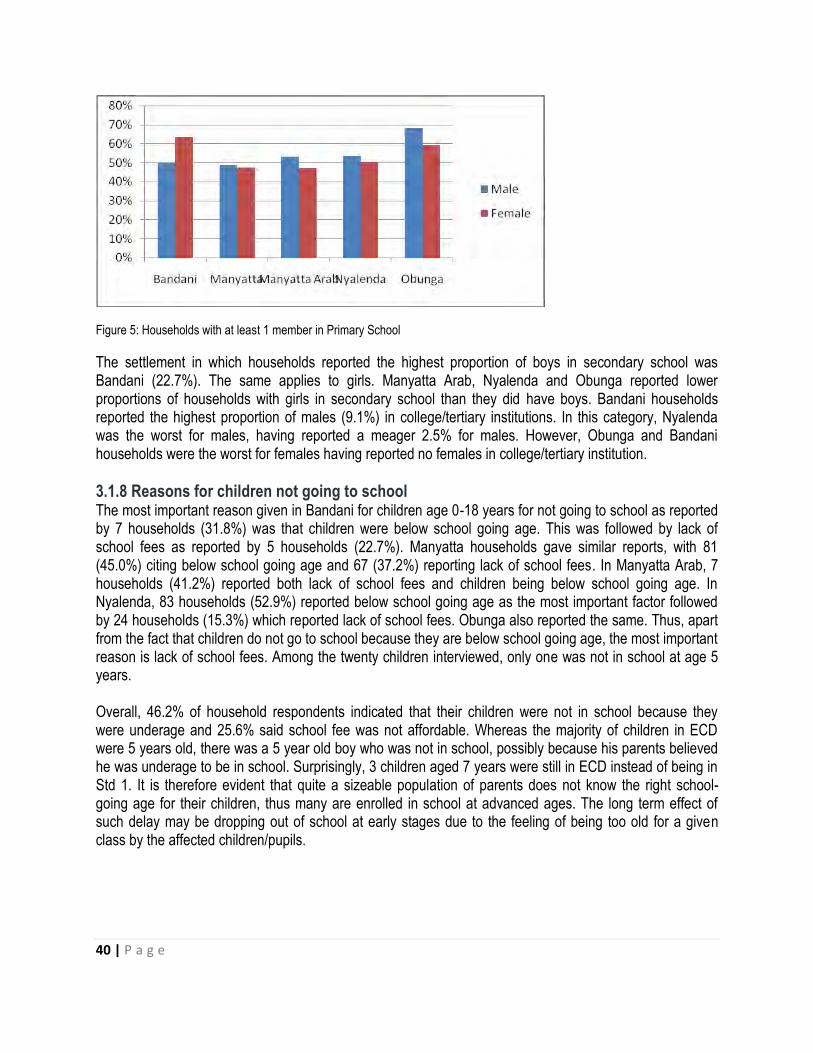
40 | P a g e
Figure 5: Households with at least 1 member in Primary School
The settlement in which households reported the highest proportion of boys in secondary school was Bandani (22.7%). The same applies to girls. Manyatta Arab, Nyalenda and Obunga reported lower proportions of households with girls in secondary school than they did have boys. Bandani households reported the highest proportion of males (9.1%) in college/tertiary institutions. In this category, Nyalenda was the worst for males, having reported a meager 2.5% for males. However, Obunga and Bandani households were the worst for females having reported no females in college/tertiary institution.
3.1.8 Reasons for children not going to school The most important reason given in Bandani for children age 0-18 years for not going to school as reported by 7 households (31.8%) was that children were below school going age. This was followed by lack of school fees as reported by 5 households (22.7%). Manyatta households gave similar reports, with 81 (45.0%) citing below school going age and 67 (37.2%) reporting lack of school fees. In Manyatta Arab, 7 households (41.2%) reported both lack of school fees and children being below school going age. In Nyalenda, 83 households (52.9%) reported below school going age as the most important factor followed by 24 households (15.3%) which reported lack of school fees. Obunga also reported the same. Thus, apart from the fact that children do not go to school because they are below school going age, the most important reason is lack of school fees. Among the twenty children interviewed, only one was not in school at age 5 years. Overall, 46.2% of household respondents indicated that their children were not in school because they were underage and 25.6% said school fee was not affordable. Whereas the majority of children in ECD were 5 years old, there was a 5 year old boy who was not in school, possibly because his parents believed he was underage to be in school. Surprisingly, 3 children aged 7 years were still in ECD instead of being in Std 1. It is therefore evident that quite a sizeable population of parents does not know the right school-going age for their children, thus many are enrolled in school at advanced ages. The long term effect of such delay may be dropping out of school at early stages due to the feeling of being too old for a given class by the affected children/pupils.
41 | P a g e
3.1.9 Girls below age 18 years with children Of the five informal settlements, 6 Bandani households (27.3%) reported the highest proportion of girls below age 18 years with children. This was followed by 23 households (14.6%) in Nyalenda and 20 (11.1%) in Manyatta. Obunga had only 2 (9.1%) and Manyatta Arab 1 (5.9%). Six households (27.5%) in Bandani reported that they had mothers below age 18 years with children age 0-2 years. This was the highest proportion of households reported followed by 16 (10.2%) in Nyalenda and 12 (6.7%) in Manyatta. Obunga had 2 (9.1%) and Manyatta Arab had only 1 (5.9%). Among the 3-5 year olds whose mothers were below age 18 years, the worst situation was reported in 1 Bandani household (4.5%) followed by 6 Nyalenda households (3.8%). Only Manyatta and Nyalenda reported 1 case each in the 6-8 year range. Thus, young mothers and their children in Bandani seem to be the most vulnerable, followed by those in Nyalenda and Manyatta, in that order.
3.2 MVC identification criteria Findings from Focus Group Discussions indicated that most male participants in the five settlements described Most Vulnerable Children (MVC) by the way they dressed. To them MVCs lacked proper clothing or had tattered clothes at home and in school. They also considered weak and feeble looking children as deprived, excluded or vulnerable (DEV). Children who did not go or could not go to school were also described as most vulnerable. Other signs that were mentioned frequently in the Male Focus Group Discussions (FGDs) include: Starving or hungry, idle or roams, isolated or neglected and dull or sad looking. The least mentioned signs of DEV were being dirty, sickly, sleepy, malnourished, begs or rude. The female participants on the other hand gave precedence to orphan-hood, body weakness, stress, tattered clothing, hungry, emaciated, stressed and a child being sad as signs of vulnerability. They also mentioned not going to school, idling and lack of shelter as ways of identifying MVCs. It is worth noting that whereas female participants stressed on opharnhood as the most prominent indicator of MVCs, male participants did not mention it. This may be attributed to the traditional gendered roles where males are regarded as household heads thus the sole breadwinners for their families whereas women are supposed to take care of children. Due to this perception, it is quite difficult for males to reflect on the challenges faced by orphans in the absence of the moter. Possibly too, is the fact thatwomen carry a heavier burden of taking care of orphans when their spouses pass on.Widows(mond liete) hardly remarry while widowers remarry and proceed smoothly with child rearing. When asked how to identify a deprived, excluded and vulnerable child, a key informant said:
“A child who has been denied the chance and the opportunity to get their basic needs is deprived. They are not able to access basic needs which include clothes, food, shelter and education. An excluded child is one who has been put aside from getting what is rightfully his or hers, like the right to education. A vulnerable child is a child who is in a state where anything can happen to him or her. That child is in danger of being harmed.”
Another key informant said:
42 | P a g e
“A deprived child is one who lives under shortages of major human wants. An excluded child is one who is not given the opportunity to join others in their priorities. A vulnerable child has no means and is stranded.”
These responses are in tandem with those from the Focus Group Discussions. Thus, a deprived child generally lacks basic needs like food, clothing and love, an excluded child has little or no opportunity to participate in what his/her contemporaries are doing and a vulnerable child is that child who is at risk of being abused, sleeping hungry or dropping out of school. Based on FGDs, it seems availability of food and good health are key requirements for ensuring that children are not DEV. For children to have good food and to be in good health there must be a reasonable financial resource base in the households. When asked to name causes of deprivation, exclusion and vulnerability among children, a key informant said:
“Deprivation, exclusion and vulnerability come about as a result of poverty. Poor people are not able to provide basic needs for their children and ensure that they enjoy their rights. Diseases such as HIV/AIDs affect children as the parents die leaving them as orphans. So HIV/AIDs is a cause of deprivation, exclusion and vulnerability as children are left to fend for themselves when the parents die.”
Another key informant said:
“Maybe you can say that one of the major causes of DEV is poverty, poverty index in Kisumu is very high and secondly the community lacks safety net for children, yeah, you find that social fabric especially for children is not very well taken care of in the community. Yeah…the children do not get enough protection from the caregivers, because the caregivers are engaged in certain issues like how to fend the household, at the expense of the children.”
When asked to rank the causes of vulnerability, the male respondents across the five settlements considered the importance of food, health and education first. They said food was a priority because it prevents diseases and children could only concentrate in class or go to school if they had eaten or were healthy. The men also put value to needs such as clothing, shelter, love and security. To the women participants, education and health were a priority followed by food, shelter and love. To amplify some of the above, a male FGD participant made the following observation:
“A child can be sick and weak without food. Without food the child is vulnerable to all manners of sicknesses. If you eat well, your body will be able to fight some diseases, so you have to give your child food to have good health then you can prepare the child for school. Without food a child cannot be in school because the body will be weak and vulnerable to diseases. If you tell the child to go to school on an empty stomach even with very good uniform they will be unable to learn in school. So we need to give the child food so that he or she is satisfied, we have to see how the child lives, so that even after school he or she knows he or she is going to a good place. In all the three the first is food. Secondly, food and health are complementary, then school. All the school uniform and other requirements then follow. If all that is ready, the child can stay in school.“ [Translated from Dholuo language].

43 | P a g e
It therefore seems that one of the main causes of deprivation, exclusion and vulnerability among children is poverty. Key informants were also asked to explain how their organizations were addressing DEV issues. One responded as follows:
“Our organization partners with other community based organizations, NGOs and other groups like the National Aids [Control] Council to make sure children in Manyatta get the necessary requirements for education by building schools and ensuring education is affordable. We also create awareness in the community on children issues as well as on HIV/AIDs.“
Another key informant had this to say:
“Apart from partnering, my office sometimes gets directly involved, like, one, in the identification, of these vulnerable children, yes that one my office does. Because, I know,…..I’m in the society, I know those who are vulnerable, those who have lost the parents etc., two, my office has also ohh, done or has also been involved in the distribution of relief food, at times the government gives us, we get direct food aid from our government for the vulnerable ones, so that is, such food, we do the identification of vulnerable children and then distribute this food, that is another way in which we do it. I also get involved because I protect their rights because you know these children are vulnerable, they are prone to a lot of abuse, yeah, and when such an issue comes up my office takes the lead in trying to curb out such a problem amongst these vulnerable children.”
It is apparent that DEV issues are generally addressed through partnerships. It is an outcome of a deliberate effort of various stakeholders with a common interest, and not of a single entity.
3.3 Quality, accessibility and cost of education Through Focus Group Discussions, it was found that a lot of value is attached to education in all the informal settlements under study. The respondents reckoned that those who go to school can communicate better; be more knowledgeable and in turn, have a better future. They observed, however, that there are charges which are prohibitive such as tuition (remedial) fees which range from Ksh 300/= to 500/= a month per child. Respondents decried the cost of paying for tuition saying they are unable to meet this excessive cost. An FGD participant had this to say:
“The cost of schools in this town is very high. For example, you are asked to pay Ksh.300 per month when a parent has three children and sometimes even more in secondary. So you will find children being sent home every now as the costs are too high for parents to keep up.” [Translated from Dholuo language].
Another FGD participant in a different settlement from the above observed as follows:
“Those schools that pay less fee [sic] you will realize that the teachers there have no interest in teaching the children. But where the fee is high, the teacher will take
44 | P a g e
her time in seeing every child’s work. Public schools are becoming poor in terms of giving out proper education since the costs are low so no keen interest in making sure the child gets anything. So long as their times for lessons are over they just get out of class without caring.” [Translated from Dholuo language].
The above quotations paint a picture of dilemma among caregivers. Whereas cheap schools are rare to come by, taking children to such schools compromises quality and going for quality demands for higher fees. It is worth noting, however, that extra tuition has so far been banned by the government and is therefore an illegal activity. Whether the ban will be fully realized is a matter of conjecture. Admission fee which remains at around KSh.5000/= was also considered high and therefore a hindrance to access to Early Childhood and Development Centres. Children reported that most schools are near to the households. The female participants praised the local ECDEs saying their children gained by learning to read, talk and write. According to the female respondents, quality education can be seen in the good performance of children in examinations; availability of facilities for learning; respect for elders and the ability to read, write and communicate. They noted that whereas some ECDE centres were exemplary, primary schools did not receive many accolades because performance level of their children seemed to drop at primary level. They said at that level, many pupils are put in one class and tuition fee is charged which reduces quality of education as teachers become less attentive. Most of the participants said apart from tuition fees they could not pay admission fees as they had low incomes. Whereas most schools are close to the households and despite Free Primary Education, the cost of education remains high (Tuition fee between Ksh.200/= to 300/= per month in public schools and over Ksh.1000/= per month in private schools) and infrastructure is poor. In addition, it was reported that poor parenting style and role modeling, indiscipline, drug and alcohol abuse and insecurity in Bandani and Obunga prevent access to education. On factors that affect quality education, one FGD participant noted:
“You will find that most children stay with their grandmothers, the parents died and left them with the grandmothers. But you know some of these grandmothers have no income. Thus she cannot tailor or make the child’s clothing, she cannot buy food and she cannot pay the levies required in school. So that child cannot easily get quality education like the others since he or she might just attend school once in a week. Yet the others go to school regularly. That child cannot get proper education.” [Translated from Dholuo language].
Thus orphanhood leads to poverty and poverty affects children‟s participation in school which subsequently affects performance. Nyalenda female respondents went a step further and gave suggestions on how to improve education: by having a clean and friendly learning environment, introducing school feeding programs, maintaining good teacher-pupil relationship and ratio, equal treatment, no caning of children, love and care of children at home and in school and proper clothing. Other recommendations include employing qualified teachers and having adequate learning facilities.
45 | P a g e
3.4 Services offered to schools According to UNICEF,
Establishing good early childhood programmes in poor urban communities is essential to supporting children’s survival, growth and learning. Early childhood programmes contribute to children’s cognitive, social and emotional development and promote their health, nutrition and hygiene. In addition, they can free mothers and other female caregivers from their traditional roles, enabling them to participate in the public sphere.45
From the key informant interviews it was noted that the government, through the MoEST and MEO, offer ECDE services. They focus on training of ECDE teachers although they do not employ them. It is the responsibilities of parents and guardians to pay these teachers. ECDE services are also supported by efforts from NGOs and CBOs particularly through provision of supplements and school feeding programs. Some NGOs support parents by building their capacities to enable them to take their children to the centres. For instance one Key Informant said,
What we do in food and nutrition program in our community under health program, we work with 21 ECD Centres within Winam division, we have tried to build the capacity of care givers to have kitchen gardens within the ECDs, we have also instituted feeding programs in these centres and trained management committees in these centres, within these areas we work in.
Apart from education services, the FGD respondents in all locations said there were very few extra services offered in ECDE and primary schools. The male participants said there were a few Non-Governmental Organizations (NGOs) who distributed school uniforms; bags; shoes and books. KMET and World Vision were mentioned as the major contributors of services in the settlements. Sponsors and volunteers also help most vulnerable families to meet costs of education. However, corruption and nepotism seem to be affecting the selection of beneficiaries where rich people and relatives of sponsors tend to benefit more. The following is an illustration from one of the FGD participants:
“There are some NGOs who provide services to children, like clothing, shoes and food. So these are some services they have been receiving. For example in Kudho there is some support, I don’t know it by name but they can provide children with school uniform, shoes, bags. There are days when they can be put together and given food. That aside, somehowly [sic], there is a group called World Vision they also help children, they take care of children by giving them clothes, bags and uniforms. So there are some assistance, however they are reduced by corruption
45
United Nations Children’s Fund (UNICEF, 2012): Children’s rights in urban settings: The state of the world’s children. Children in an Urban World. February 2012 Page 29
46 | P a g e
amongst leaders, such that when they bring help and it’s not used properly they leave.” [Translated from Dholuo language].
Another FGD participant made the following observation: “KMET through the school gave some sponsored children shoes and bags.”[Translated from Dholuo language].
Medical services like free immunization and deworming services are also provided in schools. Feeding services are few and parents have to pay for them. Tuition is also provided in schools in the settlements at a cost which most parents cannot meet. Other services include first aid. The following is an observation by an FGD participant regarding medical services:
“In some cases they receive health services like polio vaccination for those in ECDE and deworming for those in primary level.”[Translated from Dholuo language].
In a similar token, a key informant said the following regarding free services offered to MVC:
“For health services I know the Voluntary Male Circumcision component, I know the free treatment of children under five in government hospitals, I know that TB treatment is free, I know that children HIV services is a free service. That’s what I know I don’t know if they are actually free but I know they are policy issues. Then eeh one of the programs which I should have added on the other side for vulnerable children is the cash transfer program. So we have a social protection program that offers cash to most vulnerable children, so they receive cash services so that’s also free. Most of the water provision services are free.“
Like their male counterparts most female respondents have not heard of other services besides education. The few include games or physical education, food (e.g. porridge) provided at a cost and mostly in private schools, security, singing lessons, provision of books, uniforms and bags, sponsorships, awards for success, sanitation services and care giving like cleaning; putting on shoes; etiquette, referrals for sick children, immunization and deworming exercises and provision of vitamin supplements. Medicine is given too according to a female discussant in Nyalenda. According to the female participants, the services ease the cost burden for parents; they motivate children to go to school; children are fed and healthy; children gain knowledge and learn to be respectful. NGOs offering some of the services were named: UNICEF was mentioned in Obunga while K-MET was mentioned in Manyatta and Bandani.
It is evident from the above that various organizations offer services in support of ECDE centres and primary schools, but only to a limited extent. Information gathered indicates that such support is sometimes marred by lack of transparency and accountability at the school/community level.
3.5 Policies on Children The Key informants mentioned some of the policies addressing MVC and ECD issues as: The Constitution,
Free Primary Education, the Children‟s Act (2001), inclusive ECD policy and Child Protection Policy.
One Key Informant said the following:
47 | P a g e
That is in the constitution of Kenya. There was a time they were saying all parents will be arrested for not taking their children to school. In the Bill of Rights. The Minister talks of Article 43 of the Constitution, he keeps on quoting Article 43, Articles 43 and 51 of the Constitution. Those are the ones I can remember.
FPE is marred by inadequate funds leading to poor quality and in some cases industrial actions by
teachers. According to a key informant,
So well funded is not an answer that I can give, but maybe what we are looking at is the commitment especially in the payment of those wages and to mainstream them in the system. I don’t think they are well funded. Especially with the free primary education, I didn’t even mention the free primary education, you can see how much constraint it has, the large populations attending school and the inability of government to fund, as we are speaking people are on strike, which means we don’t have adequate funds. (Cough)
On policy barriers another Key Informant said,
Of course funding is one of them, dissemination, sometimes you go to government facilities for example, they are the custodians of these things, if you ask them about them, they don’t even know that they exist, so you go in there and find they are flouting the policies. So lack of knowledge of the policies themselves and eeh commitment is also one of them, they may know it is there and what is to be done but the commitment is lacking. For example the case of under 5 free services, it is there but they don’t know it is there, so you will find a family struggling to take their child to a private hospital and the implementers will not even tell them that you go to a government facility, this is a free service.
While there exists policies on children and ECDs both internationally and nationally, their implementation faces a number of challenges. Some of the policies are not effectively enforced, poorly funded and lack commitment. Many beneficieries as well as implementers of the policies are not aware of the existence of these policies. There is therefore need for strong advocacy campaigns and capacity building.
3.6 Challenges to children’s education Food came up as a major challenge to children‟s education in the male FGDs. It was indicated in majority of the areas that children who do not get adequate food or starve could not learn. However most parents do odd jobs in the slum areas and have low income and therefore are unable to provide basic needs for their families. The poor families may also not be able to pay school fees, buy books or school uniforms for their children. Other challenges mentioned were family conflicts which are brought about by alcoholism and which can lead to parents neglecting their children. Most challenges mentioned by the male respondents were related to parents. They include single parenting, inadequate involvement in children‟s education, lack of family planning and wrong attitudes towards education. Other challenges were associated with children who bow down to peer pressure, who get pregnant too early and who take drugs or are indisciplined.

48 | P a g e
Challenges affecting child education as per the female FGDs included low income which makes it difficult for parents to buy costly learning material for their children, pay school fees and guarantee them basic needs like food. Bad weather conditions can also interfere with the accessibility of schools. When it rains some roads become impassable. Transport that may enable children to get to school and in good time is a challenge. In most schools there is overcrowding in classrooms against a backdrop of few teachers. The main cause of these challenges is only one according to a male respondent in Manyatta; poverty. But others include laziness of parents or orphan hood. According to female respondents, high cost of living, poverty and low income contribute to the inability of parents to take children to school. The male respondents suggested solutions as follows: Peer talks with the youth to appreciate education; economic empowerment for adults; business and other forms of income generating activities (IGAs); link to donors to support the MVCs; creating awareness amongst parents through forums such as barazas46; giving parents job opportunities; capacity building for community members; link to loaning institutions, increasing accessibility to the Youth and Women Enterprise Fund; Urban agriculture to increase income; close relationships between parents and teachers; forming SHGs; different groups to work together to address these issues instead of waiting for the government; guiding and counseling children and formation of children‟s support groups. The female respondents gave the following as solutions to problems facing the education of MVC: Reduced inflation which will ease the economic burden on parents, introduction of welfare services by the government and NGOs to support poor families, capacity building/training on IGAs and entrepreneurship, cooperation with development organizations and linkage with sponsors who can pay fees. The right to education is provided for in the Convention on the Rights of the Child (Article 28). Learning for children starts after birth as they interact with others and their caregivers. This however is hampered by poverty, malnutrition and lack of motivation which hinder optimal child development.47 While universal primary education has been introduced in many countries, basic education still remains inaccessible to many children from poor families. Most of the classes are overcrowded leading to poor teaching. Free primary education has been made difficult through introduction of ancillary costs such as examination fees, cost of uniforms and other requirements.48 Children who were interviewed indicated that they walked to school and back, and that this is normally a problem during bad weather conditions or in situations where schools were far removed from where they stayed.
3.7 Care and development of household members 3.7.1 Primary caregivers to children For a child to develop normally and participate actively in school, the primary caregiver should be a very close member of the family, preferably the mother or the father. It is therefore important to investigate who the primary caregivers were in the five informal settlements.
46
These are public gatherings normally organized by Chiefs to discuss issues affecting communities. 47
United Nations Children’s Fund (UNICEF,2012): Children’s rights in urban settings. The state of the world’s children 2012.Children in an Urban World. February 2012Page 28
48United Nations Children’s Fund (UNICEF,2012):Children’s rights in urban settings. The state of the world’s children
2012.Children in an Urban World. February 2012 Page 30
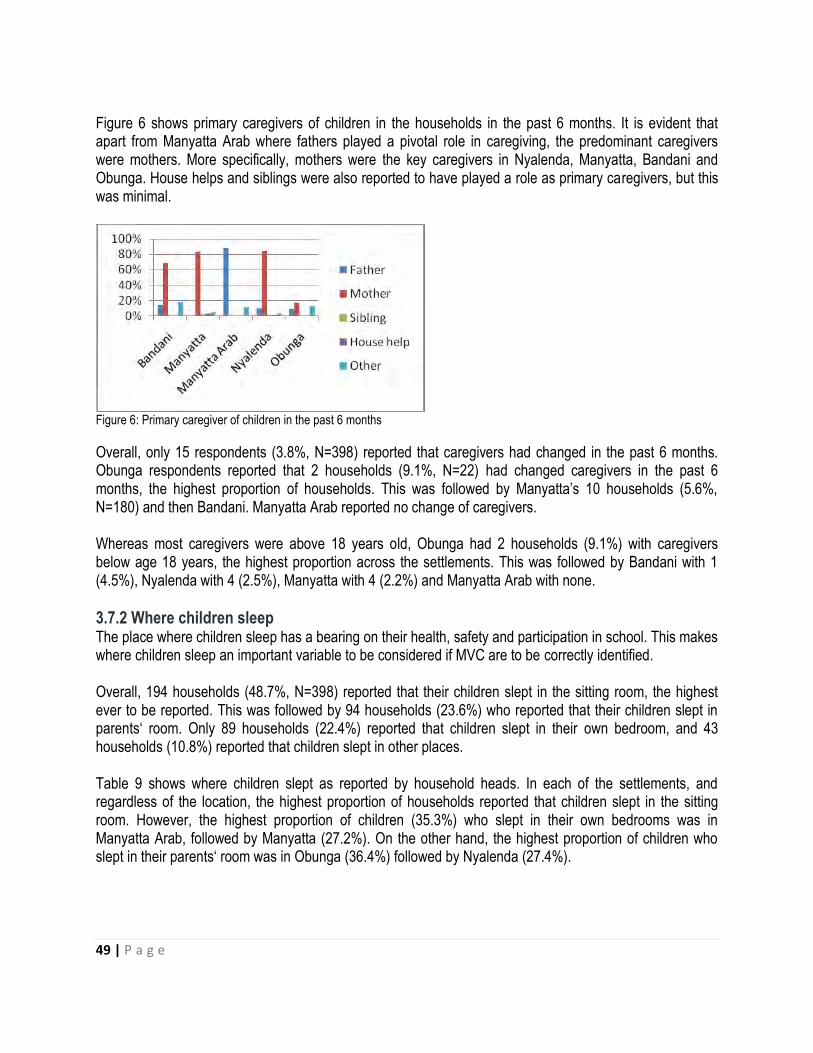
49 | P a g e
Figure 6 shows primary caregivers of children in the households in the past 6 months. It is evident that apart from Manyatta Arab where fathers played a pivotal role in caregiving, the predominant caregivers were mothers. More specifically, mothers were the key caregivers in Nyalenda, Manyatta, Bandani and Obunga. House helps and siblings were also reported to have played a role as primary caregivers, but this was minimal.
Figure 6: Primary caregiver of children in the past 6 months
Overall, only 15 respondents (3.8%, N=398) reported that caregivers had changed in the past 6 months. Obunga respondents reported that 2 households (9.1%, N=22) had changed caregivers in the past 6 months, the highest proportion of households. This was followed by Manyatta‟s 10 households (5.6%, N=180) and then Bandani. Manyatta Arab reported no change of caregivers. Whereas most caregivers were above 18 years old, Obunga had 2 households (9.1%) with caregivers below age 18 years, the highest proportion across the settlements. This was followed by Bandani with 1 (4.5%), Nyalenda with 4 (2.5%), Manyatta with 4 (2.2%) and Manyatta Arab with none.
3.7.2 Where children sleep The place where children sleep has a bearing on their health, safety and participation in school. This makes where children sleep an important variable to be considered if MVC are to be correctly identified. Overall, 194 households (48.7%, N=398) reported that their children slept in the sitting room, the highest ever to be reported. This was followed by 94 households (23.6%) who reported that their children slept in parents„ room. Only 89 households (22.4%) reported that children slept in their own bedroom, and 43 households (10.8%) reported that children slept in other places. Table 9 shows where children slept as reported by household heads. In each of the settlements, and regardless of the location, the highest proportion of households reported that children slept in the sitting room. However, the highest proportion of children (35.3%) who slept in their own bedrooms was in Manyatta Arab, followed by Manyatta (27.2%). On the other hand, the highest proportion of children who slept in their parents„ room was in Obunga (36.4%) followed by Nyalenda (27.4%).

50 | P a g e
Table 9: Where children slept
Location
Own bedroom Parents room Sitting room Other
No. of households
% No. of households
% No. of households
% No. of households
%
Bandani 4 18.2 1 4.5 12 54.5 5 22.7 Manyatta 49 27.2 38 21.1 88 48.9 14 7.8 Manyatta Arab 6 35.3 4 23.5 7 41.2 2 11.8 Nyalenda 28 17.8 43 27.4 77 49.0 17 10.8 Obunga 2 9.1 8 36.4 10 45.5 5 22.7
Regardless of where children sleep, their safety is of paramount importance. Overall, 250 households (62.8%), the highest proportion of households, reported that their children slept in safe places. This was followed by 75 households (18.8%) who reported that their children slept in very safe places. The next were 42 households (10.6%) who reported that their children were unsafe where they slept. However, 26 households (6.5%) were not sure of the safety of their children and only 3 (0.8%) reported that their children were very unsafe. The highest proportion of very safe children at their places of sleep was reported in Manyatta followed by Nyalenda and Obunga, in that order. No household in Bandani and Manyatta Arab reported this level of safety. In the category of “safe”, the highest proportion was in Nyalenda followed by Manyatta Arab. Most of the households in Bandani were not sure of their children‟s‟ safety wherever they slept, followed by Manyatta Arab. It was in Obunga where the highest proportion of children who were unsafe was reported, followed by Manyatta. Based on the interview conducted with 20 children, 8 (40.0%) slept in the sitting room, 5 (25.0%) in own bedroom, 5 (25.0%) in parents‟ bedroom and 1 (5.0%) in neighbours‟ houses. The majority indicated that they were safe enough where they slept and this is consistent with report from household heads.
3.7.3 Chores performed by children Very often, children get engaged in performing household chores. The extent to which this happens may have positive or negative consequences on a child‟s education. Overall, 72.6% of households (N=398) reported that their children washed utensils and clothes within their own households. This was followed by cleaning the house which was reported by 197 households (49.5%). Cleaning the compound and babysitting were reported by a paltry 11.3% and 7.3% of the households, respectively. Some households also reported that their children were engaged in work outside their households. Such children who got engaged in hawking/vending constituted 2.5%; those engaged elsewhere as hired house helps were 1.5%and these were from Manyatta, Nyalenda and Obunga. It is worth noting that Bandani and Manyatta Arab did not report that their children were hired as house helps.
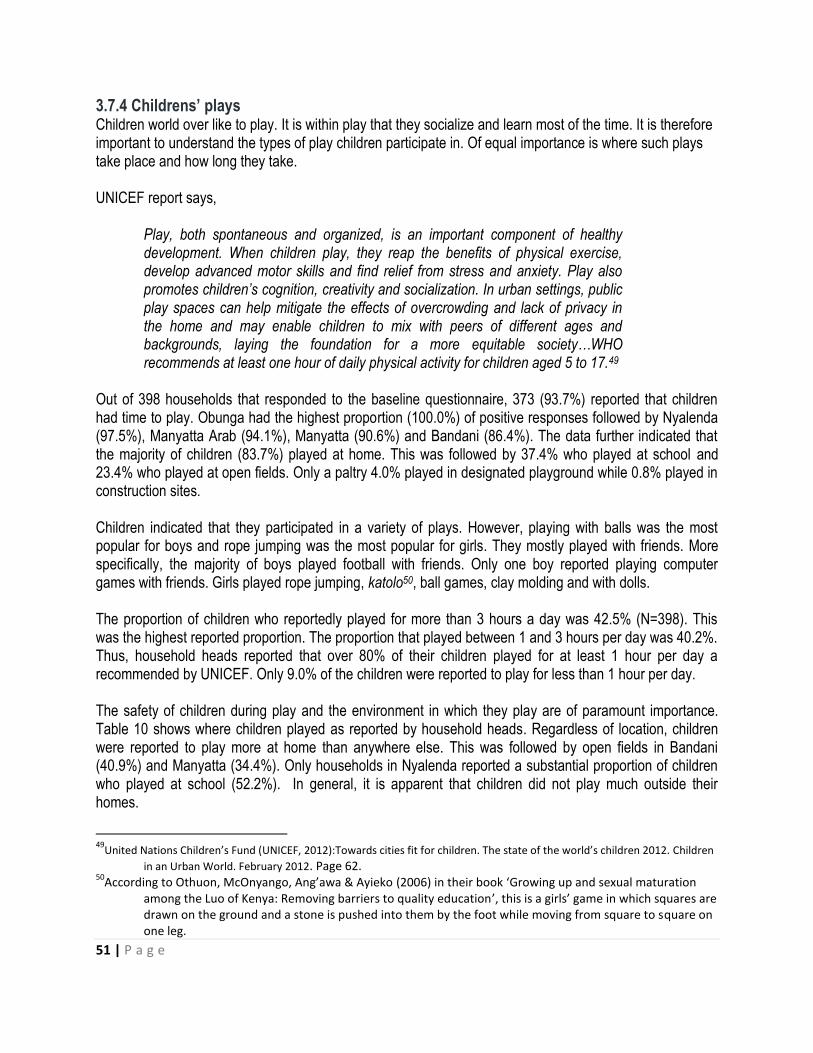
51 | P a g e
3.7.4 Childrens’ plays Children world over like to play. It is within play that they socialize and learn most of the time. It is therefore important to understand the types of play children participate in. Of equal importance is where such plays take place and how long they take. UNICEF report says,
Play, both spontaneous and organized, is an important component of healthy development. When children play, they reap the benefits of physical exercise, develop advanced motor skills and find relief from stress and anxiety. Play also promotes children’s cognition, creativity and socialization. In urban settings, public play spaces can help mitigate the effects of overcrowding and lack of privacy in the home and may enable children to mix with peers of different ages and backgrounds, laying the foundation for a more equitable society…WHO recommends at least one hour of daily physical activity for children aged 5 to 17.49
Out of 398 households that responded to the baseline questionnaire, 373 (93.7%) reported that children had time to play. Obunga had the highest proportion (100.0%) of positive responses followed by Nyalenda (97.5%), Manyatta Arab (94.1%), Manyatta (90.6%) and Bandani (86.4%). The data further indicated that the majority of children (83.7%) played at home. This was followed by 37.4% who played at school and 23.4% who played at open fields. Only a paltry 4.0% played in designated playground while 0.8% played in construction sites. Children indicated that they participated in a variety of plays. However, playing with balls was the most popular for boys and rope jumping was the most popular for girls. They mostly played with friends. More specifically, the majority of boys played football with friends. Only one boy reported playing computer games with friends. Girls played rope jumping, katolo50, ball games, clay molding and with dolls. The proportion of children who reportedly played for more than 3 hours a day was 42.5% (N=398). This was the highest reported proportion. The proportion that played between 1 and 3 hours per day was 40.2%. Thus, household heads reported that over 80% of their children played for at least 1 hour per day a recommended by UNICEF. Only 9.0% of the children were reported to play for less than 1 hour per day. The safety of children during play and the environment in which they play are of paramount importance. Table 10 shows where children played as reported by household heads. Regardless of location, children were reported to play more at home than anywhere else. This was followed by open fields in Bandani (40.9%) and Manyatta (34.4%). Only households in Nyalenda reported a substantial proportion of children who played at school (52.2%). In general, it is apparent that children did not play much outside their homes.
49
United Nations Children’s Fund (UNICEF, 2012):Towards cities fit for children. The state of the world’s children 2012. Children
in an Urban World. February 2012. Page 62. 50
According to Othuon, McOnyango, Ang’awa & Ayieko (2006) in their book ‘Growing up and sexual maturation among the Luo of Kenya: Removing barriers to quality education’, this is a girls’ game in which squares are drawn on the ground and a stone is pushed into them by the foot while moving from square to square on one leg.

52 | P a g e
Table 10: Where children play
Location
At home At school In open fields In designated playground
In construction site
No. of households
% No. of households
% No. of households
% No. of households
% No. of households
%
Bandani 17 77.3 1 4.5 9 40.9 4 18.2 2 9.1 Manyatta 144 80.0 61 33.9 62 34.4 4 2.2 1 0.6 Manyatta Arab
13 76.5 3 17.6 6 35.3 4 23.5 0 0.0
Nyalenda 143 91.1 82 52.2 8 5.1 1 0.6 0 0.0 Obunga 22 100.0 2 9.1 8 36.4 3 13.6 0 0.0
3.7.5 Issues on child abuse Child abuse is becoming a major household problem in Kenyan communities. An abused child may suffer psychological trauma, stress, lack of confidence and concentration. These can lead to poor attainment of educational performance. In this section, understanding of what constitutes child abuse, how households identify and handle abused children and the challenges that households face in helping an abused child are presented. The most important perception of household heads regarding what constitutes child abuse was physical maltreatment (69.1%, N=397). Verbal attack ranked second (23.6%, N=397) followed by sexual exploitation (19.1%, N=397). Signs for identifying a child who has been abused ranged from observation of marks and bruises (56.0%), withdrawal (36.9%) and a child looking scared (31.4%). Household heads indicated that they addressed cases of child abuse by reporting to the chief (50.3%), counseling the child (18.6%) and reporting to the police (14.6%). Thus, the area chief in respective informal settlements plays the most important role in addressing cases of child abuse. Reporting child abuse cases to the area chief (provincial administration) is an effort to address the cases through the local administrative structures as opposed to perceived lengthy, often unfriendly legal mechanisms like reporting to the police. However, a confluence of other factors may predicate such decisions; probably this is happening because the Chief, unlike the Police, is a community member who understands the social dynamics of the community and is therefore more trusted. In this regard, he/she is the best arbitrator on such issues. He/she is ready to listen to such cases more than the Police, who rarely act on reported cases of child abuse. Additionally, issues of child abuse tend to revolve around family members and that is probably why they prefer not to go to the Police because if they did so, the matter would go to court. Jailing a relative seems to be a worse outcome to them than negotiating such matters out of court. More so, because of the stigma associated with child abuse, the parties involved would rather go to the Chief for arbitration because the aggrieved may get compensated out of court since court cases drag for years on end albeit without compensation. It is worth noting that children indicated that they feared their fathers most because they caned them as a mode of punishment. The biggest challenge in addressing child abuse was non-willingness to disclose abuse (49.0%) followed by inaccessibility to legal protection services (26.9%). Unfriendly redress services came third (8.8%) with non-existence of redress services trailing fourth (5.8%).
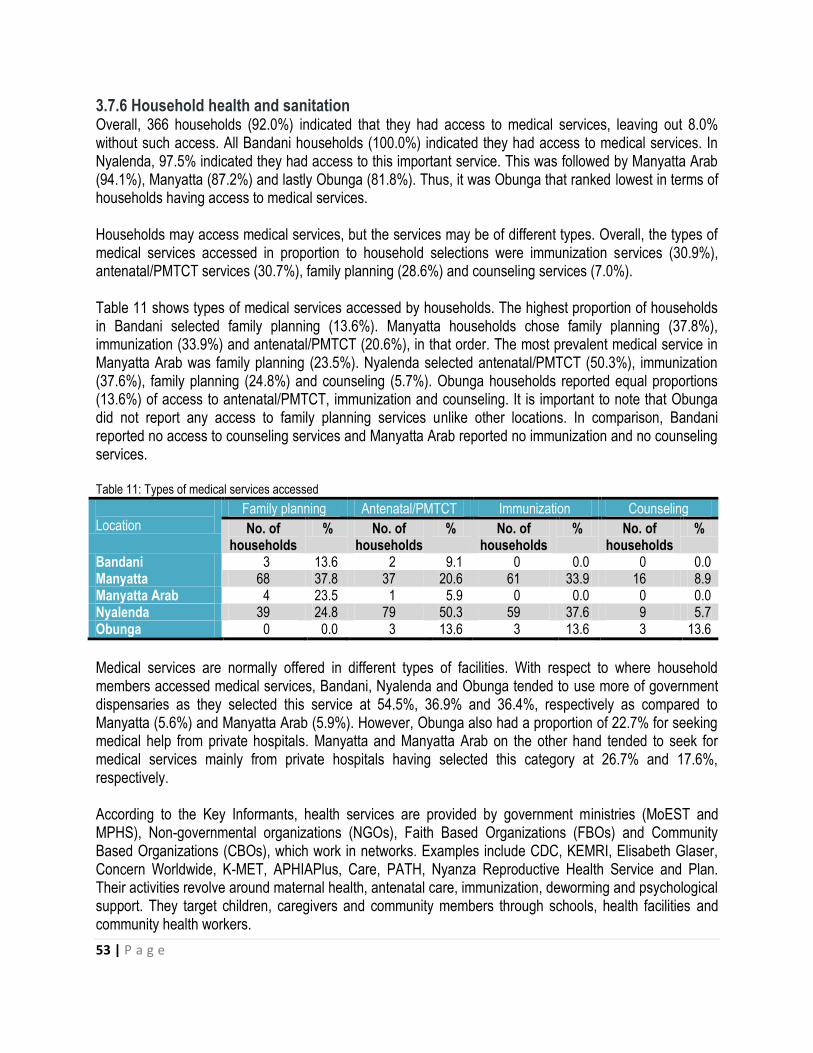
53 | P a g e
3.7.6 Household health and sanitation Overall, 366 households (92.0%) indicated that they had access to medical services, leaving out 8.0% without such access. All Bandani households (100.0%) indicated they had access to medical services. In Nyalenda, 97.5% indicated they had access to this important service. This was followed by Manyatta Arab (94.1%), Manyatta (87.2%) and lastly Obunga (81.8%). Thus, it was Obunga that ranked lowest in terms of households having access to medical services. Households may access medical services, but the services may be of different types. Overall, the types of medical services accessed in proportion to household selections were immunization services (30.9%), antenatal/PMTCT services (30.7%), family planning (28.6%) and counseling services (7.0%). Table 11 shows types of medical services accessed by households. The highest proportion of households in Bandani selected family planning (13.6%). Manyatta households chose family planning (37.8%), immunization (33.9%) and antenatal/PMTCT (20.6%), in that order. The most prevalent medical service in Manyatta Arab was family planning (23.5%). Nyalenda selected antenatal/PMTCT (50.3%), immunization (37.6%), family planning (24.8%) and counseling (5.7%). Obunga households reported equal proportions (13.6%) of access to antenatal/PMTCT, immunization and counseling. It is important to note that Obunga did not report any access to family planning services unlike other locations. In comparison, Bandani reported no access to counseling services and Manyatta Arab reported no immunization and no counseling services. Table 11: Types of medical services accessed
Location
Family planning Antenatal/PMTCT Immunization Counseling
No. of households
% No. of households
% No. of households
% No. of households
%
Bandani 3 13.6 2 9.1 0 0.0 0 0.0 Manyatta 68 37.8 37 20.6 61 33.9 16 8.9 Manyatta Arab 4 23.5 1 5.9 0 0.0 0 0.0 Nyalenda 39 24.8 79 50.3 59 37.6 9 5.7 Obunga 0 0.0 3 13.6 3 13.6 3 13.6
Medical services are normally offered in different types of facilities. With respect to where household members accessed medical services, Bandani, Nyalenda and Obunga tended to use more of government dispensaries as they selected this service at 54.5%, 36.9% and 36.4%, respectively as compared to Manyatta (5.6%) and Manyatta Arab (5.9%). However, Obunga also had a proportion of 22.7% for seeking medical help from private hospitals. Manyatta and Manyatta Arab on the other hand tended to seek for medical services mainly from private hospitals having selected this category at 26.7% and 17.6%, respectively. According to the Key Informants, health services are provided by government ministries (MoEST and MPHS), Non-governmental organizations (NGOs), Faith Based Organizations (FBOs) and Community Based Organizations (CBOs), which work in networks. Examples include CDC, KEMRI, Elisabeth Glaser, Concern Worldwide, K-MET, APHIAPlus, Care, PATH, Nyanza Reproductive Health Service and Plan. Their activities revolve around maternal health, antenatal care, immunization, deworming and psychological support. They target children, caregivers and community members through schools, health facilities and community health workers.

54 | P a g e
The ChildFund Key Informant said:
Our main focus in this area is maybe strengthening the community strategy, the communities come up with ideas and then we support them, we try to empower them, like the community health workers, ok we reach more to the community health workers so that they can take charge at the community level to maybe institute things like referrals to the nearest facilities. You see in the communities we have facilities but we find that most of the parents or caregivers don’t go to those facilities, so we try to build the capacity of community health workers so that they do the mobilization in the community and identify cases that need referral and so they refer those who are in need.
UNICEF however does not implement directly but works closely with health facilities in level one, two and three. The Ministry of Public Health and Sanitation collaborates with MoEST to offer deworming and immunization services in schools. MoEST also monitors the implementation of school health policy.
It’s like when we go for our assessments… we ensure that those students have adequate toilets, the ratio for girls is 1:25, the ratio for boys is 1:30. So when we go to schools, we take note of that whether it is observed. Then you know the other day when the students got burnt at Asumbi, the ministry was talking about safety. There is a way the buildings should be built. Like the door should be opened outwards, if you see mine is opening inwards so if we have to move away from here then it is locked, it can’t open, then if you push it is just tightening. But if it is just outwards then you can easily open. Then, the windows should not have grills so those are the safety and health precautions we are taking. When we have the deworming we collaborate with the Ministry of Health. Our officers are just involved in the training maybe but in the administration it is the Ministry of Health. (Key Informant in MoEST).
Overall, a total of 316 households (79.4%) admitted to the fact that at least one household member had fallen ill during the last three months. At location level, Bandani reported that 19 households (86.4%) had fallen ill, Manyatta reported 132 (73.3%), Manyatta Arab reported 14 (82.4%), Nyalenda reported 131 (83.4%) and Obunga reported 20 (90.9%). Thus, Obunga reported the highest proportion of at least one household member having fallen ill in the last 3 months. This was followed by Bandani, Nyalenda, Manyatta Arab and Manyatta, in that order. The types of illnesses that affected household members in the last 3 months, in order of importance, were 171 households for malaria (43.0%), 30 for depression (7.5%), 24 for typhoid (6.0%), 10 for pneumonia and diarrhoea (2.5%), 7 for tuberculosis (1.8%) and 5 for HIV/AIDS (1.3%). Thus, malaria was the most commonly reported illness across the 5 locations, with Bandani registering the highest proportion (54.5%) followed by Obunga (50.0%), Nyalenda (42.7%), Manyatta (41.7%) and Manyatta Arab (35.3%), in that order. Depression was reported in Nyalenda only (19.1%). HIV/AIDS, tuberculosis and diabetes were reported in Manyatta and Nyalenda only. Typhoid, pneumonia and diarrhoea were more rampant in Obunga than anywhere else. The primary caregivers had suffered acute or chronic illnesses in the past one month with Bandani reporting 15 (68.2%), Obunga 14 (63.6%), Nyalenda 99 (63.1%), Manyatta Arab 7 (41.2%) and Manyatta 66 (36.7%).

55 | P a g e
Households that reported diseases that affect their children were 310 (77.9%) for malaria, 51 (12.8%) for diarrhoea, 15 (3.8%), 37 (9.3) for respiratory tract infection and 7 (1.8%) for urinary tract infection. This means that in general, children were mostly attacked by malaria followed by diarrhoea. Table 12 shows types of diseases affecting children in the five informal settlements. Again, malaria ranked highest across the five settlements. Diarrhoea was mostly common in Obunga, Manyatta and Nyalenda, in that order. Pneumonia seems to have been a rare ailment for children, the highest incidence having been reported in Obunga. Respiratory tract infections mostly affected children in Obunga and Manyatta, in that order. However, urinary tract infections were rare among children in all the five settlements. Table 12: Types of diseases affecting children
Location
Malaria Diarrhoea Pneumonia RTI UTI
No. of households
% No. of households
% No. of households
% No. of households
% No. of households
%
Bandani 11 50.0 1 4.5 0 0.0 0 0.0 0 0.0 Manyatta 145 80.6 27 15.0 2 1.1 22 12.2 2 1.1 Manyatta Arab
10 58.8 1 5.9 1 5.9 0 0.0 0 0.0
Nyalenda 128 81.5 16 10.2 10 6.4 9 5.7 5 3.2 Obunga 16 72.7 6 27.3 2 9.1 6 27.3 0 0.0
Appendix 2 shows where children got treated whenever they fell seek. The majority of children were treated
in hospitals. Obunga households also preferred treating their children in clinics. Apart from Obunga, a small
proportion of households treated their children in chemists. It was only in Bandani where use of traditional
doctors was reported.
All the 20 children who were interviewed indicated that they had fallen sick. Most of them had experienced headache and stomach ache. Only one indicated having had an eye problem and only one had nose bleeding. In all the cases except one, the children were treated in established medical facilities. Other researchers have found that diarrhoea as a result of lack of safe water, good sanitation and proper hygiene is one of the leading causes of child mortality and morbidity. Most poor urban settings suffer from inadequate provision and access to improved water. Most people in slums get water from vendors or collect it from far off places. Due to inadequate sanitation facilities many people in the slums practice open defection which can cause cholera.51 In cases where the facilities exist they are shared and unhygienic. Appendix 3 shows types of toilets used in the 5 settlements. The most typical type of toilet was pit latrine. Manyatta, Nyalenda and Obunga reported isolated cases of use of flushed toilets. Use of open pit was reported in Manyatta, Manyatta Arab and Nyalenda. It was only in Manyatta Arab where use of containers (buckets) was reported. Manyatta, Nyalenda and Obunga households mainly used toilets outside the house but within the compound, although there were also a few households that had flushable toilets within the house. Bandani and Manyatta Arab mainly used toilets outside the compound. The most typical usage was where a toilet was shared by more than three households. This was followed by three households sharing a toilet facility. Whereas the use of toilet facilities by one household was rare, Bandani had the largest
51
United Nations Children’s Fund (UNICEF,2012):Children’s rights in urban settings. The state of the world’s children 2012. Children in an Urban World.February 2012Page 25.

56 | P a g e
proportion of single households using a single toilet facility. Children indicated that they bathed daily and washed their hands before eating and after using the toilet. The main source of water in the 5 settlements was tap water which was reported by 310 households (77.9%). This was followed by water from boreholes, piped water and spring/streams. Water from vendors was only mentioned by 1.8% of the respondents. In Bandani, 11 households (50.0%) used boreholes followed by 5 households (22.7%) which used piped water and then 4 households (18.2%) which used tap water. Manyatta‟s water sources were the most varied, with tap water (68.3%) being the most important source followed by piped water (12.2%) and then boreholes (10.6%). Manyatta Arab had only one source of water; tap water. Nyalenda and Obunga mainly used tap water.
Plate 2: A water vendor in Manyatta
Whereas 20 households (5.0%) reported not washing their hands after toilet use, the rest did wash their hands. Of those who washed their hands after toilet use, 252 households (63.3%) reported doing so in a basin with soap and water. A total of 99 households (24.9%) washed their hands after toilet use in a container with water but without soap. This outcome is comparable to hand washing after eating where 263 households (66.1%) reported that they did so in a basin with soap and water. This was followed by 107 households (26.9%) who washed their hands in a container with water after eating. Only 4 households (1.0%) reported not washing their hands after eating.
Household heads were asked what their members usually do to make water safe for drinking or cooking. A total of 215 households (54.0%) reported that they used water guard or aqua tab. This was followed by 98 respondents (24.6%) who used water the way it was i.e., those who did nothing to the water. Only 86 households (21.6%) boiled water before use and 22 (5.5%) used other methods which included placing
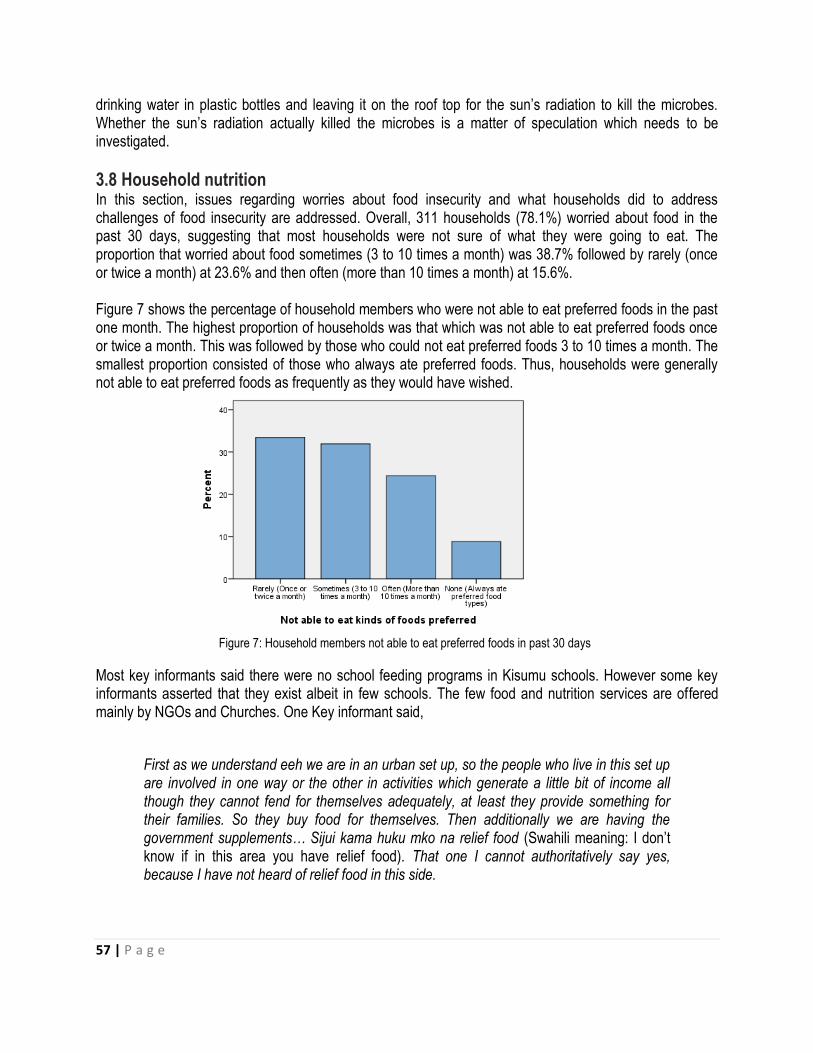
57 | P a g e
drinking water in plastic bottles and leaving it on the roof top for the sun‟s radiation to kill the microbes. Whether the sun‟s radiation actually killed the microbes is a matter of speculation which needs to be investigated.
3.8 Household nutrition In this section, issues regarding worries about food insecurity and what households did to address challenges of food insecurity are addressed. Overall, 311 households (78.1%) worried about food in the past 30 days, suggesting that most households were not sure of what they were going to eat. The proportion that worried about food sometimes (3 to 10 times a month) was 38.7% followed by rarely (once or twice a month) at 23.6% and then often (more than 10 times a month) at 15.6%. Figure 7 shows the percentage of household members who were not able to eat preferred foods in the past one month. The highest proportion of households was that which was not able to eat preferred foods once or twice a month. This was followed by those who could not eat preferred foods 3 to 10 times a month. The smallest proportion consisted of those who always ate preferred foods. Thus, households were generally not able to eat preferred foods as frequently as they would have wished.
Figure 7: Household members not able to eat preferred foods in past 30 days
Most key informants said there were no school feeding programs in Kisumu schools. However some key informants asserted that they exist albeit in few schools. The few food and nutrition services are offered mainly by NGOs and Churches. One Key informant said,
First as we understand eeh we are in an urban set up, so the people who live in this set up are involved in one way or the other in activities which generate a little bit of income all though they cannot fend for themselves adequately, at least they provide something for their families. So they buy food for themselves. Then additionally we are having the government supplements… Sijui kama huku mko na relief food (Swahili meaning: I don‟t know if in this area you have relief food). That one I cannot authoritatively say yes, because I have not heard of relief food in this side.

58 | P a g e
The informant asserted that families had to fend for themselves when it comes to food. However these families seem unable to meet this obligation.
In the past one year, 202 households (50.8%) had at least one day in which they had to go without eating anything all day. The frequency of not eating in a day in the past one year is given in Figure 8. The frequency with the highest proportion was for those who could not eat once or twice in a year followed by 3 to 10 times in a year and then more than 10 times in a year. The most important reason for going without food in the past one year was lack of money to buy food (74.1%) as compared to high food prices (3.8%) and lack of the preferred food in the market (3.3%). Only 1.5% substituted food with school fees. Availability of food is influenced by the levels of poverty in an area. In the informal settlements majority of families worry about food and go without eating their preferred food due to lack of money to buy the food.
Figure 8: Frequency of not eating in a day in the past year
In case of food shortage in the family in the past one year, 193 households (48.5%) responded that parents/caregivers sacrificed for the children to eat, 81 households (20.4%) reported that someone went to find work, 37 households (9.3%) reported that every household member went hungry and 27 households (6.8%) reported that money for business was used for food. Thus, parents/caregivers tended to sacrifice for their children to eat much more than any other method whenever there was food shortage in the family. From the interviews with children, it was evident that corn meal and rice were the most common sources of carbohydrate fed to children. These were eaten with vegetables, eggs, fish, green grams. A worrying observation is that not a single child mentioned having been fed with fruits as part of their meals. All except two children indicated that they were satisfied every time they ate a meal. Only one child had slept hungry for 3 days, the majority having not slept hungry any single day. Undernutrition is a big contributor to child death globally. Children who are undernourished reside in rural areas and poor urban settings. Undernutrition is seen through stunted growth or children being
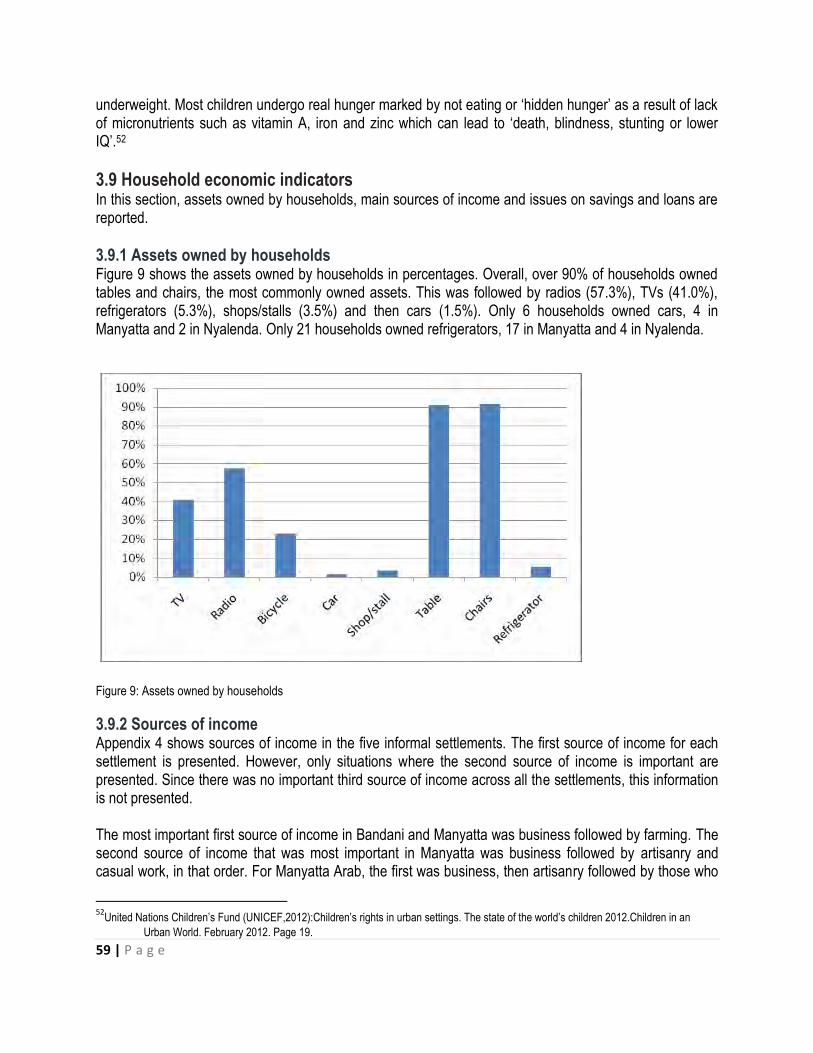
59 | P a g e
underweight. Most children undergo real hunger marked by not eating or „hidden hunger‟ as a result of lack of micronutrients such as vitamin A, iron and zinc which can lead to „death, blindness, stunting or lower IQ‟.52
3.9 Household economic indicators In this section, assets owned by households, main sources of income and issues on savings and loans are reported.
3.9.1 Assets owned by households Figure 9 shows the assets owned by households in percentages. Overall, over 90% of households owned tables and chairs, the most commonly owned assets. This was followed by radios (57.3%), TVs (41.0%), refrigerators (5.3%), shops/stalls (3.5%) and then cars (1.5%). Only 6 households owned cars, 4 in Manyatta and 2 in Nyalenda. Only 21 households owned refrigerators, 17 in Manyatta and 4 in Nyalenda.
Figure 9: Assets owned by households
3.9.2 Sources of income Appendix 4 shows sources of income in the five informal settlements. The first source of income for each settlement is presented. However, only situations where the second source of income is important are presented. Since there was no important third source of income across all the settlements, this information is not presented. The most important first source of income in Bandani and Manyatta was business followed by farming. The second source of income that was most important in Manyatta was business followed by artisanry and casual work, in that order. For Manyatta Arab, the first was business, then artisanry followed by those who
52
United Nations Children‟s Fund (UNICEF,2012):Children‟s rights in urban settings. The state of the world‟s children 2012.Children in an
Urban World. February 2012. Page 19.
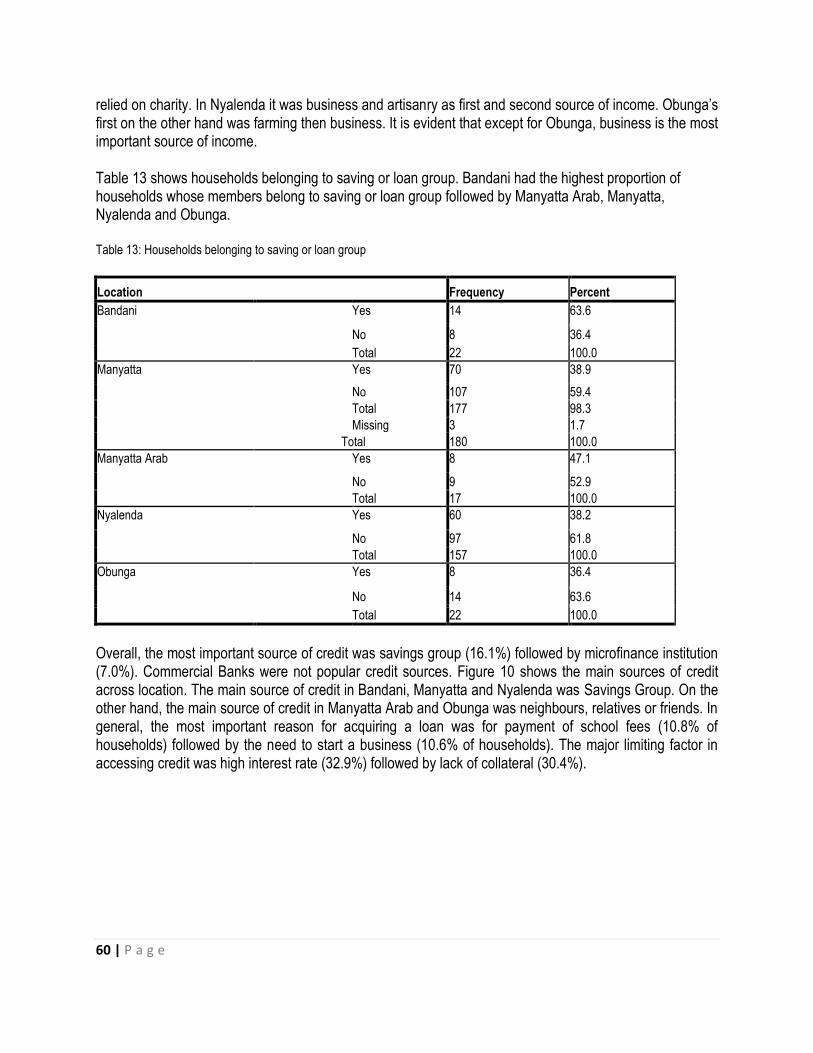
60 | P a g e
relied on charity. In Nyalenda it was business and artisanry as first and second source of income. Obunga‟s first on the other hand was farming then business. It is evident that except for Obunga, business is the most important source of income. Table 13 shows households belonging to saving or loan group. Bandani had the highest proportion of households whose members belong to saving or loan group followed by Manyatta Arab, Manyatta, Nyalenda and Obunga. Table 13: Households belonging to saving or loan group
Location Frequency Percent
Bandani Yes 14 63.6
No 8 36.4
Total 22 100.0
Manyatta Yes 70 38.9
No 107 59.4
Total 177 98.3
Missing 3 1.7
Total 180 100.0
Manyatta Arab Yes 8 47.1
No 9 52.9
Total 17 100.0
Nyalenda Yes 60 38.2
No 97 61.8
Total 157 100.0
Obunga Yes 8 36.4
No 14 63.6
Total 22 100.0
Overall, the most important source of credit was savings group (16.1%) followed by microfinance institution (7.0%). Commercial Banks were not popular credit sources. Figure 10 shows the main sources of credit across location. The main source of credit in Bandani, Manyatta and Nyalenda was Savings Group. On the other hand, the main source of credit in Manyatta Arab and Obunga was neighbours, relatives or friends. In general, the most important reason for acquiring a loan was for payment of school fees (10.8% of households) followed by the need to start a business (10.6% of households). The major limiting factor in accessing credit was high interest rate (32.9%) followed by lack of collateral (30.4%).
61 | P a g e
Figure 10: Sources of credit for households
3.10 Involvement of parents, government and community Male respondents said that school fees is normally paid by parents and guardians. In some cases, children get sponsors or receive bursary from the government. According to the respondents, FPE does not really exist as teachers earn through charging tuition fees. They said the Teachers Service Commission (TSC) is in charge of teacher salaries in primary schools. They also said that NGOs like World Vision, SOS and K-MET support MVCs by providing school requirements such as books and uniforms and other forms of support. Few CBOs also help pay for fees. Others include Churches and self-help groups (SHGs) e.g. Kogony Young Farmers in Bandani. Some parents run income generating activities so as to meet education costs. However, low income hinders parent and guardian involvement. When the female respondents were asked about who pays for the children to go to school, they said parents do. Some said it is the father, but most of the mothers took the bigger burden. In private ECDE it is parents who pay teachers‟ salaries; the government pays teachers in public primary schools, the government pays. Parents are required to buy uniforms and food. Some schools admit or retain children from poor backgrounds Thy also mentioned UNICEF, World Vision, K-MET, NEEMA, Aphia-II; CDF as organizations which support or sponsor children. Some MVCs are supported in Orphanages. Parents visit their children in school to follow up on their progress. Community members can also visit schools to inquire about the children.
3.11 Preferred ECDE Centres Most male respondents from Obunga expressed a desire for their children to go to Bridge International which is a private institution with ECD services. It is affordable and easily accessible according to them. Other ECD centres mentioned include Temudo (Private); Kudho (Public) and Salem (Private). Kudho is one of the preferred model centres. The respondents claimed that the teachers and the administration at Kudho are friendly and the centre has good learning facilities. However, it is not easily accessible due to poor infrastructure and children are prone to attack en route to school. According to a female respondent in Obunga, Salem has quality education but the distance from Obunga to the centre is rather prohibitive.
62 | P a g e
In Nyalenda there were divergent views depending on where the participants came from. A male respondent who was a board member of Nanga expressed a liking for it. Most of the male respondents wanted their children to go to Joel Omino because it was near their homes. One respondent recommended Ring Road, saying the teachers there taught well and children fed in school. Bridge International was also proposed because of its accessibility and because it offers a one month fees amnesty. Other schools mentioned include Pandpieri and St.Marks Primary school. As model centres, Joel Omino followed by Bridge and Nanga are preferred by the male respondents. The focus group discussion with female participants in Nyalenda revealed that Joel Omino was a favorite school because it had open and friendly teachers. Xaverian and Victoria were also mentioned in the discussions. Private schools were preferred because of the close attention teachers give to the pupils. Magadi is the most preferred school by the male respondents in Manyatta A. The reasons given were that it is easily accessible and has good management. Also given priority were Manyatta and Kosawo. One male respondent said he would like to take his child to a public school as primary school pupils get easy access to top secondary schools. Female discussants in Manyatta B preferred to take their children to ECDE centres within public primary schools because their fees are affordable unlike those in private schools. The school preferred was Tido because it is close to the road and that there is good learning. Most male focus group participants in Manyatta Arab like Manyatta Arab Primary due to its accessibility and good learning facilities. The female respondents also had preference for Manyatta Arab with one saying that porridge is offered in the school. One respondent would like to see a model centre that is close to Manyatta Arab. Another one recommended Singh Sabha, a private ECD centre, because it has good foundation and near to Manyatta Arab. In Bandani, male respondents wanted their children to go to a private school such as Bridge and Jans Academy. They said that public schools have no feeding programs. However, Kanyamedha, which is a public school, was proposed because it had good buildings and was accessible. As a model centre, Kanyamedha is preferred. However, the participants wanted more facilities in the schools similar to what is found at Okore Ogonda primary school. Female respondents also showed preference for Kanyamedha due to easy continuity into primary school and its central location. One respondent suggested that K-MET should start an ECD in Obunga as their operations have been effective and transparent and because they support children. Table 14 is a summary of preferred ECDEs, whether they should be model centres or not and their location. The information suggests that 11 model ECDEs should be distributed such that 3 are in Manyatta, 1 in Manyatta Arab, 1 in Bandani, 4 in Nyalenda and 2 in Obunga.
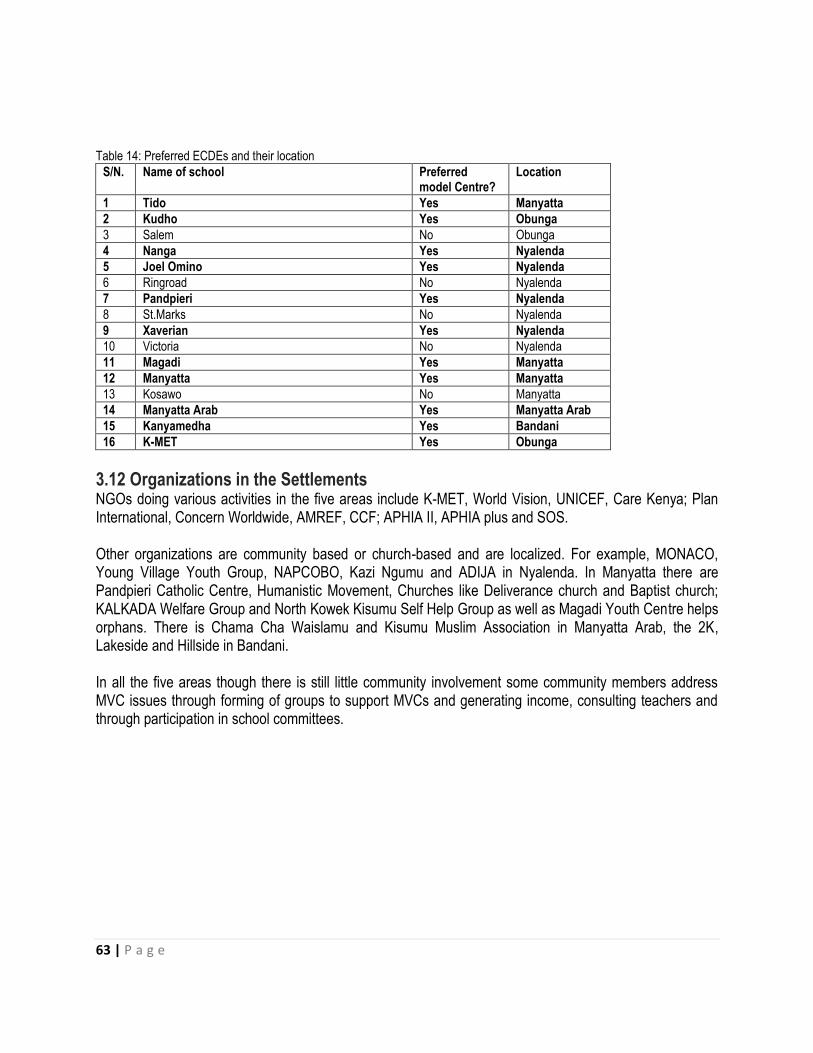
63 | P a g e
Table 14: Preferred ECDEs and their location
S/N. Name of school Preferred model Centre?
Location
1 Tido Yes Manyatta
2 Kudho Yes Obunga
3 Salem No Obunga
4 Nanga Yes Nyalenda
5 Joel Omino Yes Nyalenda
6 Ringroad No Nyalenda
7 Pandpieri Yes Nyalenda
8 St.Marks No Nyalenda
9 Xaverian Yes Nyalenda
10 Victoria No Nyalenda
11 Magadi Yes Manyatta
12 Manyatta Yes Manyatta
13 Kosawo No Manyatta
14 Manyatta Arab Yes Manyatta Arab
15 Kanyamedha Yes Bandani
16 K-MET Yes Obunga
3.12 Organizations in the Settlements NGOs doing various activities in the five areas include K-MET, World Vision, UNICEF, Care Kenya; Plan International, Concern Worldwide, AMREF, CCF; APHIA II, APHIA plus and SOS. Other organizations are community based or church-based and are localized. For example, MONACO, Young Village Youth Group, NAPCOBO, Kazi Ngumu and ADIJA in Nyalenda. In Manyatta there are Pandpieri Catholic Centre, Humanistic Movement, Churches like Deliverance church and Baptist church; KALKADA Welfare Group and North Kowek Kisumu Self Help Group as well as Magadi Youth Centre helps orphans. There is Chama Cha Waislamu and Kisumu Muslim Association in Manyatta Arab, the 2K, Lakeside and Hillside in Bandani. In all the five areas though there is still little community involvement some community members address MVC issues through forming of groups to support MVCs and generating income, consulting teachers and through participation in school committees.
64 | P a g e
4.0 CONCLUSIONS AND RECOMMENDATIONS
4.1 Conclusions The conclusions in this study are as follows:
1) Households in the five settlements mainly belong to low socio-economic status.
2) Considering that Bandani had the highest concentration of widowed respondents as well as the highest propotion of girls below age 18 years with children, young mothers and their children in Bandani seem to be the most vulnerable followed by those in Nyalenda and Manyatta.
3) There is a misconception among caregivers about what exactly constitutes child abuse as majority of caregivers considered it mainly as physical maltreatment.
4) Most common diseases among children in the informal settlements affect their heads and stomachs. This could be due to the fact that children do not sleep under mosquito nets, hence they contract malaria, and children do not observe the right hygiene which makes them suffer diarrhoea/dysentry. It seems that although most children indicated that they washed their hands after using a toilet, it is probably the method of washing that is a problem.
5) The fact that children played more at home rather than at school is a clear indication of the type of curriculum that our schools offer; an academic curriculum. Very little play is incorporated in the curriculum and this may have adverse consequences on the physical, mental and emotional development of the young children.
6) Whereas fruits have important nutritional value, they do not seem to be part of the daily dietary retinue in households.
7) Small scale business is a key income generating activity for households in the informal settlements.
8) Of all the methods for identifying MVC, the most important one is by looking at the manner in which a child is dressed. Other indicators are hunger, health condition, whether they go to school or not, how idle they are, and their behavior. The more tattered the clothing, the more likely it is that the child is a MVC. Body weakness is an indication of lack of food or poor health. Children who do not go to school or participate fully in class are likely to be deprived, excluded and vulnerable. These are obviously signs of poverty.
9) The fact that DEV issues are generally addressed through partnerships and not by individual entities is a sign that individuals have tended to ignore this important issue.
4.2 Recommendations The following are recommendations based on the outcome of the study:
1) There is need to educate caregivers in informal settlements that child abuse goes beyond physical maltreatment.
2) ECDE and primary school teachers in the informal settlements should be reminded, particularly through in-service courses, of the importance of play at school for children age 0-8 years.
3) Caregivers and children should be sensitized on the importance of sleeping under mosquito nets and how to effectively wash hands before eating and after using the toilet.
4) Caregivers and children in informal settlements should be taught the importance of eating fruits. Organizations which offer community support should focus more in this area.

65 | P a g e
5) Child development agencies and the government should implement school feeding and health programs such as immunization, provision of supplements and deworming. This should be done in close collaboration with the community.
6) Individuals who are well endowed financially and who do not necessarily live in the informal settlements should be sensitized more on DEV issues to enhance their participation and support.
7) In order to reduce the number of MVC, poverty reduction strategies should be put in place to support communities in the five informal settlements. The economic status of households need to be improved. This can be done by empowering adult household members through entrepreneurial training and offering financial support so that they can start viable businesses.
8) Accurate identification of MVC should be done by involving members of the community. In so doing, the characteristics which should be looked for include the type of clothing a child is putting on, the child‟s health and the child‟s participation in school. These should then be followed by other considerations like orphanhood.
9) In view of the alleged corruption and nepotism in the distribution of benefits to MVC at the grassroots, its recommended that, community leaders, schools and members of the community at large should be sensitized about the detrimental effects of corruption. A participatory approach should be adopted in identifying the MVCs which should take cognizance of the diverse sections of the community. It would also be imperative to have vetting commitees made up of members drawn from the community, more so if appointed in a participatory process.
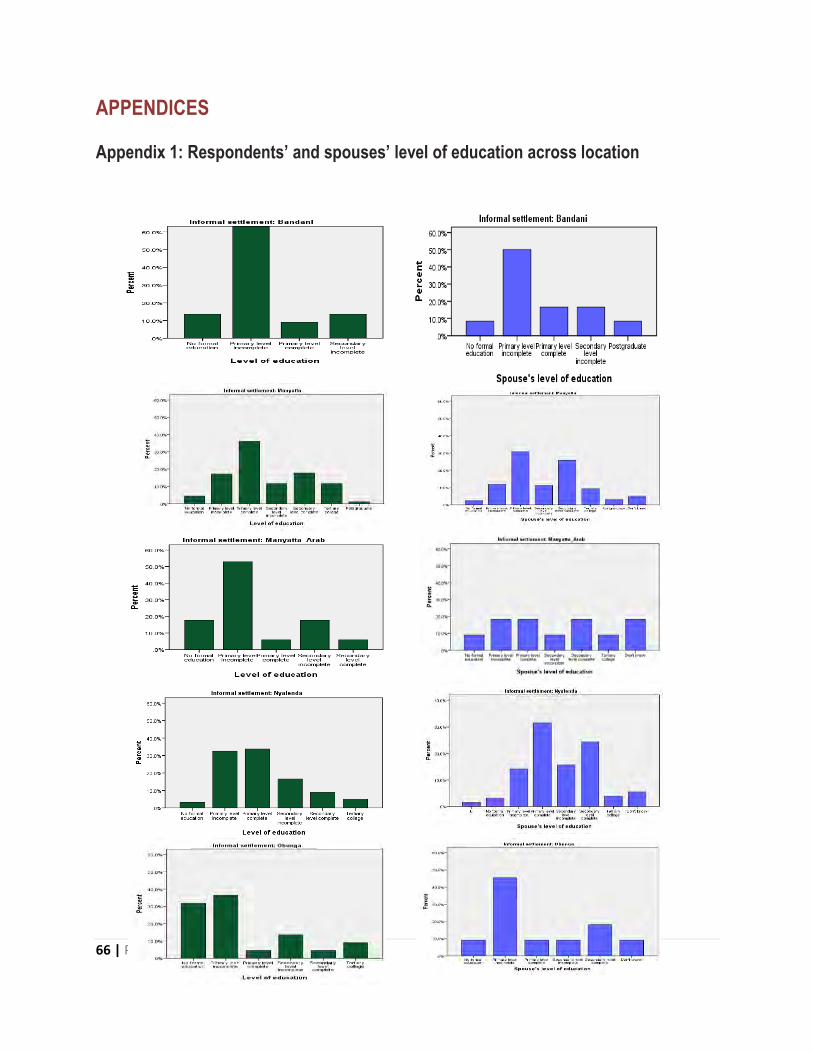
66 | P a g e
APPENDICES
Appendix 1: Respondents’ and spouses’ level of education across location

67 | P a g e
Appendix 2: Where children get treated
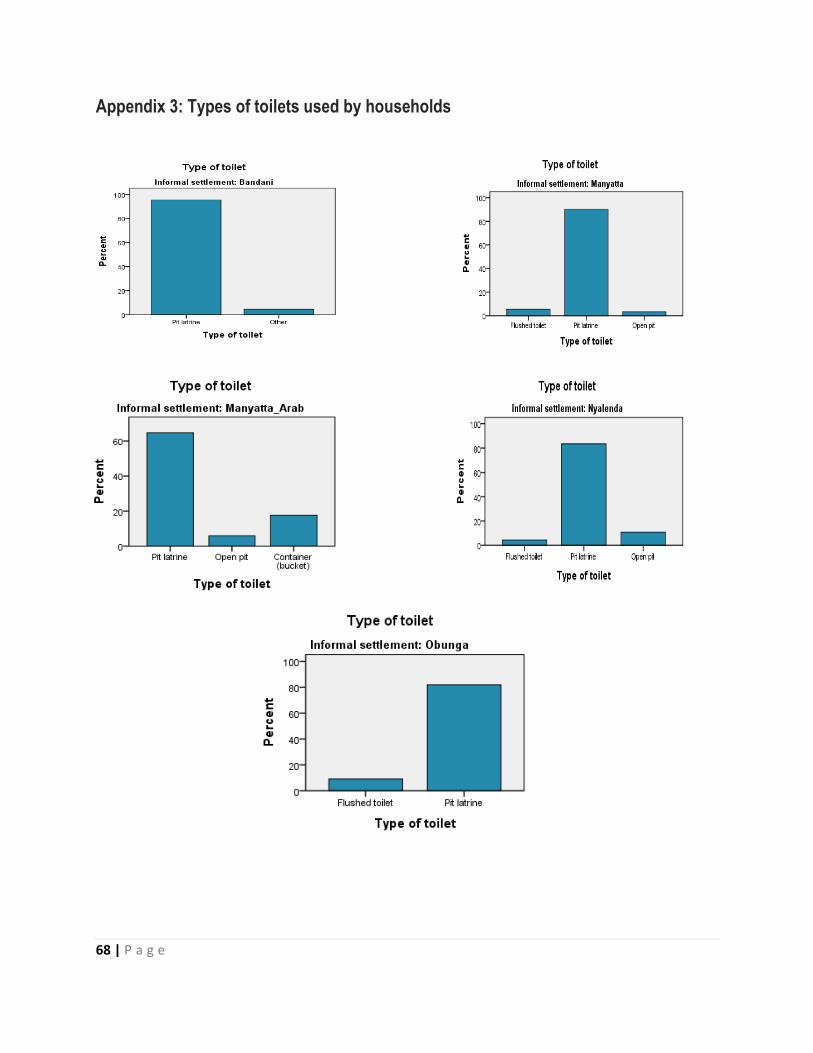
68 | P a g e
Appendix 3: Types of toilets used by households
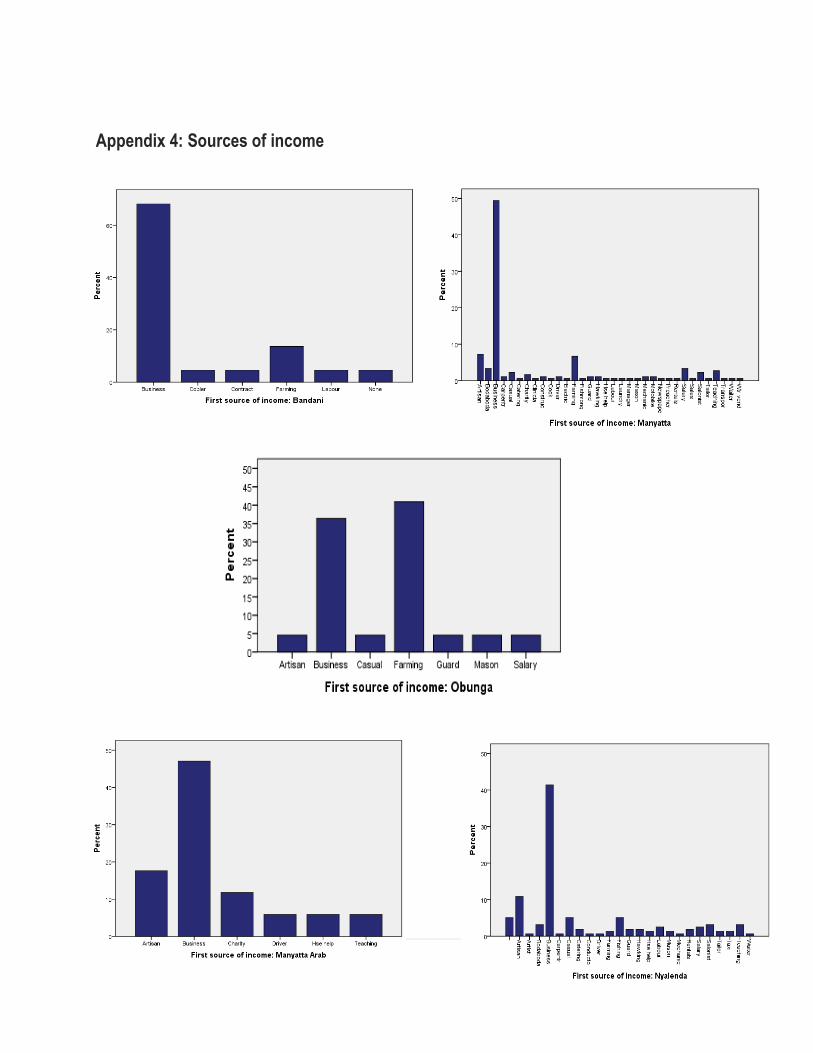
69 | P a g e
Appendix 4: Sources of income
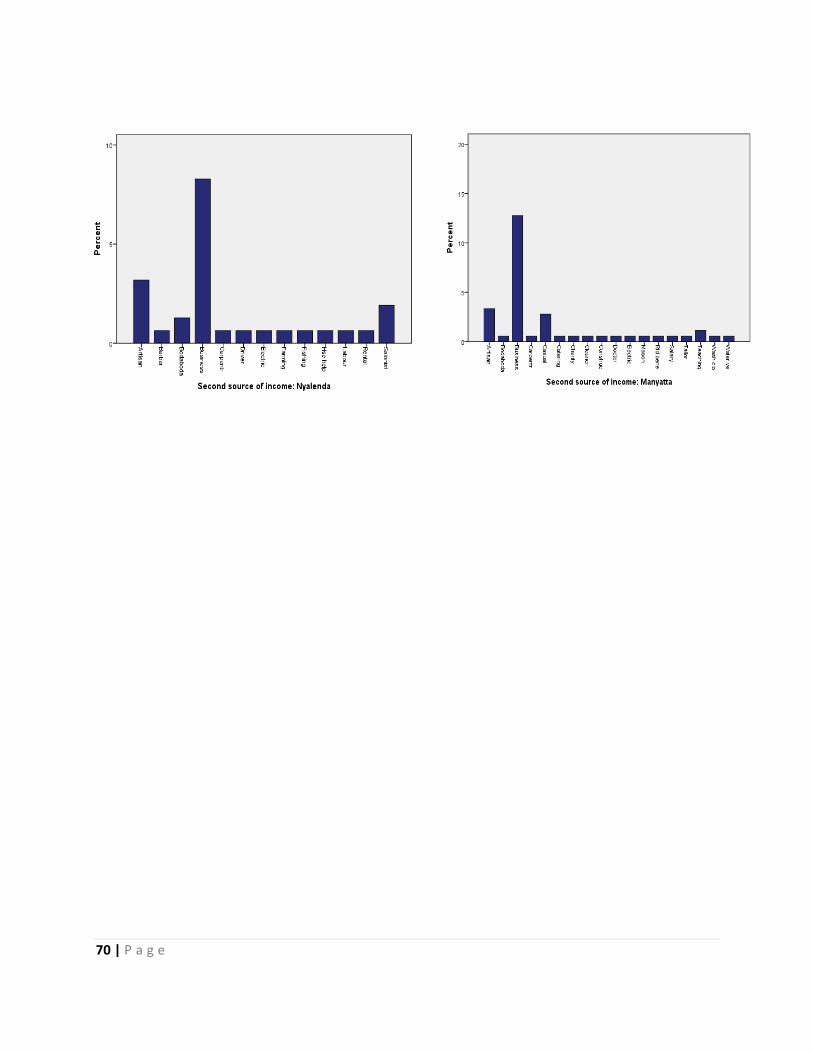
70 | P a g e

71 | P a g e
Appendix 5: Baseline Survey Questionnaire
BASELINE SURVEY QUESTIONNAIRE
SECTION 1: INTRODUCTION AND CONSENT
Hello. My name is _______________________. (Introduce your team and give time for the respondent to introduce his/her self and HH members). I am working with K-MET which is collaborating with United Nations Children’s Funds (UNICEF) and the Municipal Education Office (MEO) to implement the project ‘Active Inclusion in Education for the Most Vulnerable Children (MVC)’. The project’s strategic objective is to ensure that vulnerable children in five informal settlements in Kisumu Municipality are able to access and complete nine years of basic education at early childhood development (ECDE) and primary school levels. The informal settlements are Obunga, Nyalenda, Manyatta, Bandani and Manyatta Arab. In order to get more information about the MVCs and the status of livelihood in this area, we are conducting a survey of households. Your household has been selected by chance from all households in the area. I would like to ask you some questions related to general livelihood of your household. The information you provide will be useful to find out the status of household livelihoods and in turn be used to plan further development of the area especially by supporting MVCs in the area.
Participation in the survey is voluntary, and you can choose not to take part. If you have any question
please feel free to ask otherwise if you accept to participate please sign below.
Signature______________________________________ (Your signature means you have understood
and accepted to participate in this survey.
Date_________________________________________
Note.
Survey is for the Household Head or spouse.
Please inform the respondent that his/her responses will be confidential. The information
will be used to prepare general reports, but will not include any specific names. There will be no
way to identify the one who gave this information.
Be polite and courteous.
The survey should take between 40 to 60 minutes.
Questionnaire
No._________

72 | P a g e
SECTION 2: HOUSEHOLD AND LOCALITY IDENTIFICATION
S/No Subject Response (Enumerator)
Response (Supervisor)
2.1 Village / Cluster
2.2 Household Identification Number
2.3 Telephone contact
Name Sign / Date
2.4 Enumerator
2.5 Field Supervisor
2.6 Data entry clerk
SECTION 3: HOUSEHOLD INFORMATION
S/No Subject Response(s) Supervisor’s Comment(s)
3.1 Respondent’s gender? 1. Male 2. Female
3.2 What is your relationship with the household head?
1. Self 2. Spouse 3. Son/Daughter 66. Other (Specify)
3.3 What is your marital status? 1. Single 2. Married monogamous 3. Married polygamous 4. Divorced/Separated 5. Widowed 66. Other (Specify)
3.4 How old are you? 1. Below 18 Years 2. 18 to 24 Years 3. 25 to 29 Years 4. 30 to 34 Years 5. 35 to 39 Years 6. 40 to 44 Years 7. Above 45 Years
88. Don't know
73 | P a g e
3.5 How old is your spouse? 1. Below 18 Years 2. 18 to 24 Years 3. 25 to 29 Years 4. 30 to 34 Years 5. 35 to 39 Years 6. 40 to 44 Years 7. Above 45 Years
88. Don't know
3.6 What is the nature of your occupation?
1. Teacher 2. Business Person 3. Artisan 4. Farmer 5. Government worker 66. Other (Specify)
3.7 What is the level of your education? 1. No formal education 2. Primary level incomplete 3. Primary level complete 4. Secondary level incomplete 5. Secondary level complete 6. Tertiary College 7. University graduate 8. Postgraduate
88. Don't know
3.8 What is your spouse's level of education?
1. No formal education 2. Primary level incomplete 3. Primary level complete 4. Secondary level incomplete 5. Secondary level complete 6. Tertiary College 7. University graduate 8. Postgraduate
88. Don't know
3.9 How many members of your household are (everybody excluding respondent and spouse): Male Female Total
Below 5 years old?
5 to 14 years old?
15 to 18 years old?
19 to 25 years old?
Above 25 years old?

74 | P a g e
3.10 How many members in your household are in: Male Female Total
Nursery School?
Primary?
Secondary?
College/University?
3.11 For children (0-18) not going to
school, what are the reasons?
1. School fees is not affordable
2. They are below school age
3. They are disabled
4. They lack school uniform
5. They are taking care of other
children
6. They are expectant(female)
66. Other (Specify)
3.12 Is there a girl in your household below the age of 18 with child/children?
1. Yes 2. No
If No, Skip to 3.14
3.13 What is the age of the child? 1. 0 to 2 Years 2. 3 to 5 Years 3. 6 to 8 Years 4. Older than 8 years
3.14 Is there a girl in your household below the age of 18 who is expecting a child within the next nine months?
1. Yes 2. No
75 | P a g e
SECTION 4: CARE & DEVELOPMENT
S/No Subject Response(s) Supervisor’s Comment(s)
4.1 Who has been the primary caregiver of children in the household in the past six months?
1. Father 2. Mother 3. Sibling 4. House help 5. Caregiver at a baby care
centre 6. No caregiver
66. Other (Specify) NOTE: The caregiver is the person primarily responsible for physically taking care of child’s needs (e.g., dressing, bathing, feeding, getting to school, etc.); not necessarily the breadwinner.
4.2 Has the caregiver changed in the past six months?
1. Yes 2. No
If No, Skip to 4.4
4.3 Who is the current caregiver? 1. Father 2. Mother 3. Sibling 4. House help 5. Caregiver at a baby care
centre 6. No caregiver
66. Other (Specify)
4.4 How old is the child caregiver? 1. Below 18 Years 2. Above 18 Years
88. Don't know
76 | P a g e
4.5 Where do children in the household sleep?
1. In their own bedroom 2. In their parents’ room 3. In the sitting room 66. Other (Specify)
4.6 How safe is the place where children in the household sleep?
1. Very Safe 2. Safe 3. Not Sure 4. Unsafe 5. Very Unsafe
4.7 Which chores do the children in this household get involved in?
1. Washing utensils/clothing 2. Cleaning the house 3. Cleaning the compound 4. Babysitting
66. Other (Specify)
4.8 Apart from household chores which other work do children in this household get involved in?
1. Hired out as house helps 2. Work in quarries/stone
breaking 3. Porters 4. Vending/hawking 66. Other (Specify)
4.9 Do children in this household have time to play?
1. Yes 2. No If No, Skip to 4.12
4.10 Where do children in your household play?
1. At home 2. At school 3. Open fields 4. In designated play ground 5. Construction sites
66. Other (Specify)

77 | P a g e
4.11 Approximately how long do they play in a day?
1. Less than 1 hour 2. Between 1 and 3 hours 3. More than 3 hours
66. Other (Specify)
4.12 Why don’t children in your household play?
1. They are often unwell 2. They spend their time
working 3. They spend play time doing
school work 66. Other (Specify)
4.13 In your view, what constitutes child abuse?
1. Physical maltreatment 2. Verbal attack 3. Sexual exploitation 66. Other (Specify)
4.14 How can you identify a child who has been abused?
1. Through observation of marks and bruises
2. A withdrawn child 3. Looks scared 66. Other (Specify)
4.15 How do you address cases of child abuse?
1. Report to the Chief 2. Report to the Police 3. Take the child to a medical
facility 4. Counsel the child 66. Other (Specify)
4.16 What challenges do you face in helping an abused child?
1. Non-willingness by the child to disclose abuse
2. Inaccessibility to legal protection services
3. Non-existence of redress services
4. Unfriendly redress services 66. Other (Specify)
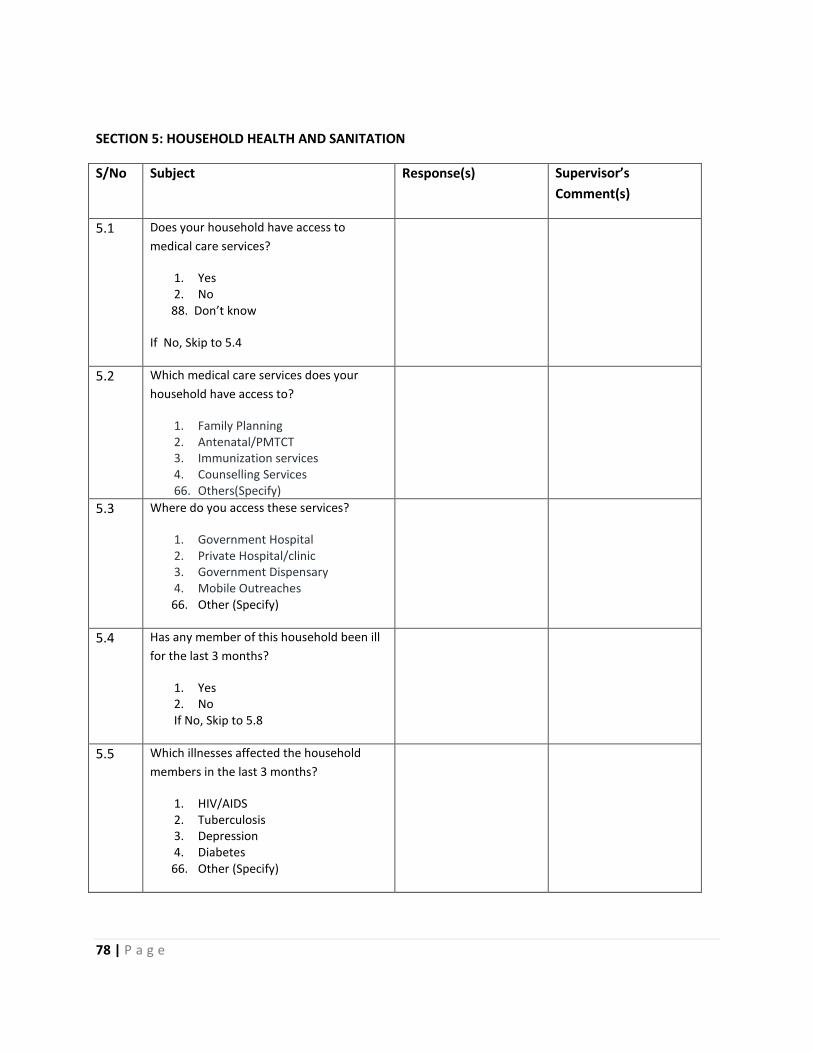
78 | P a g e
SECTION 5: HOUSEHOLD HEALTH AND SANITATION
S/No Subject Response(s) Supervisor’s
Comment(s)
5.1 Does your household have access to
medical care services?
1. Yes 2. No
88. Don’t know
If No, Skip to 5.4
5.2 Which medical care services does your
household have access to?
1. Family Planning 2. Antenatal/PMTCT 3. Immunization services 4. Counselling Services 66. Others(Specify)
5.3 Where do you access these services?
1. Government Hospital 2. Private Hospital/clinic 3. Government Dispensary 4. Mobile Outreaches
66. Other (Specify)
5.4 Has any member of this household been ill
for the last 3 months?
1. Yes 2. No If No, Skip to 5.8
5.5 Which illnesses affected the household
members in the last 3 months?
1. HIV/AIDS 2. Tuberculosis 3. Depression 4. Diabetes
66. Other (Specify)

79 | P a g e
5.6 In the past month, has the primary
caregiver suffered from any acute or
chronic illness (e.g., flu, malaria, asthma,
etc.)?
1. Yes 2. No
88. Don't know
5.7 Does the primary caregiver have access to
health care services?
1. Yes 2. No
88. Don't know
5.8 Which disease(s) affect(s) your children?
1. Malaria 2. Diarrhea 3. Pneumonia 4. Respiratory Tract Infection 5. Urinary Tract Infection
66. Other (Specify)
5.9 Where do you usually seek medical
attention for your children’s treatment?
1. Hospital 2. Clinics 3. Traditional Doctors 4. Chemists
66. Other (Specify)
5.10 Which type of toilet facility does your
household use?
1. Flushed toilet 2. Pit latrine 3. Open pit 4. Container (bucket)
66. Other (Specify)
5.11 Where is the toilet facility?
1. Inside the house 2. Outside the house but within the
compound 3. Outside the compound
66. Other (Specify)
80 | P a g e
5.12 How many households use the toilet
facilities?
1. One household 2. Two households 3. Three households 4. More than three households
5.13 What is the main source of drinking and
cooking water for your household
members?
1. Piped water 2. Tap water 3. Borehole 4. Shallow well 5. Spring, river or stream 6. Harnessed Rainwater 7. Pond 8. Water vendor
5.14 How do you or your household members
wash your/their hands after visiting the
toilet?
1. In a container with water 2. In a basin with soap and water 3. With running water 4. With running water and soap 5. No hand washing
66. Other (Specify)
5.15 How do you or your household members
wash your hands before eating?
1. In a container with water 2. In a basin with soap and water 3. With running water 4. With running water and soap 5. No hand washing
66. Other (Specify)
81 | P a g e
5.16 How do you or your household members
wash your hands after eating?
1. In a container with water 2. In a basin with soap and water 3. With running water 4. With running water and soap 5. No hand washing
66. Other (Specify
5.17 What do you or your household members
usually do to make water safe for drinking
or cooking?
1. Boil 2. Add Chlorine 3. Add water guard 4. Nothing
66. Other (Specify)
SECTION 6: HOUSEHOLD NUTRITION
S/No Subject Response(s) Supervisor’s Comment(s)
6.1 In the past 30 days did you worry that your household would not have enough food?
1. Yes 2. No
88. Don't know If No, Skip to 6.3
6.2 How often did you worry that your household would not have enough food?
1. Rarely (Once or twice in a month) 2. Sometimes (3 to 10 times in a
month) 3. Often (More than 10 times in a
month)
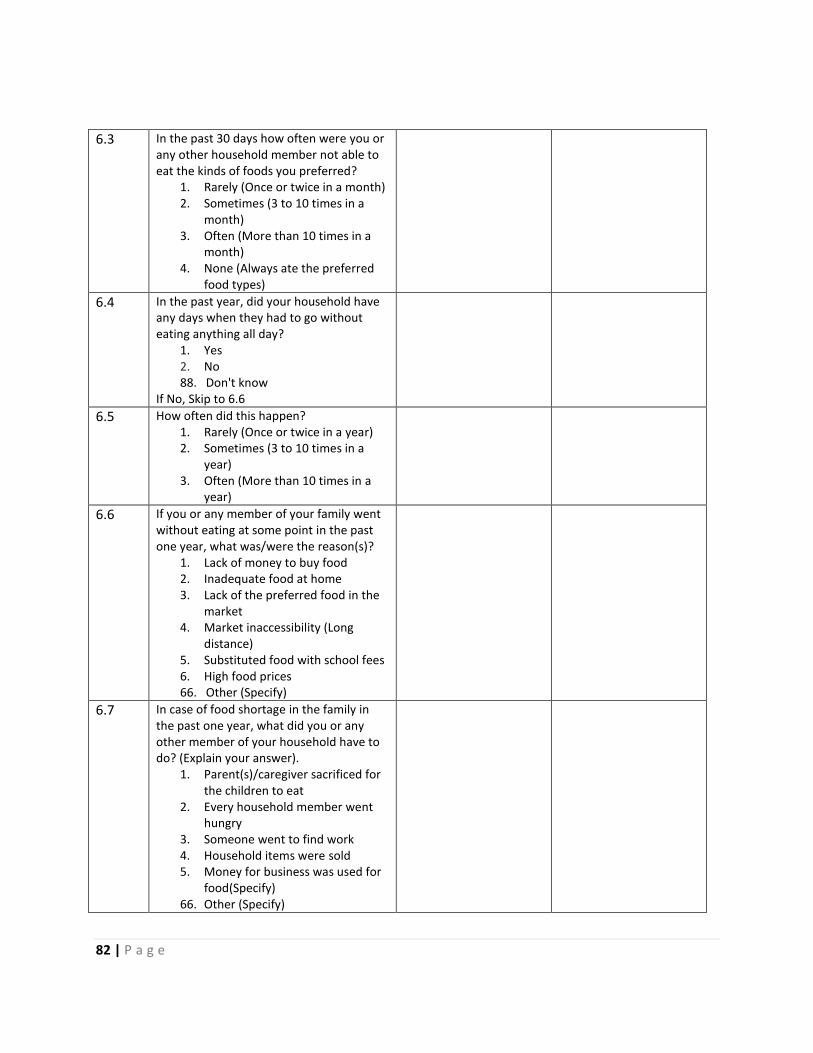
82 | P a g e
6.3 In the past 30 days how often were you or any other household member not able to eat the kinds of foods you preferred?
1. Rarely (Once or twice in a month) 2. Sometimes (3 to 10 times in a
month) 3. Often (More than 10 times in a
month) 4. None (Always ate the preferred
food types)
6.4 In the past year, did your household have any days when they had to go without eating anything all day?
1. Yes 2. No 88. Don't know
If No, Skip to 6.6
6.5 How often did this happen? 1. Rarely (Once or twice in a year) 2. Sometimes (3 to 10 times in a
year) 3. Often (More than 10 times in a
year)
6.6 If you or any member of your family went without eating at some point in the past one year, what was/were the reason(s)?
1. Lack of money to buy food 2. Inadequate food at home 3. Lack of the preferred food in the
market 4. Market inaccessibility (Long
distance) 5. Substituted food with school fees 6. High food prices 66. Other (Specify)
6.7 In case of food shortage in the family in the past one year, what did you or any other member of your household have to do? (Explain your answer).
1. Parent(s)/caregiver sacrificed for the children to eat
2. Every household member went hungry
3. Someone went to find work 4. Household items were sold 5. Money for business was used for
food(Specify) 66. Other (Specify)

83 | P a g e
SECTION 7: HOUSEHOLD ECONOMIC INDICATORS
7.1 Which assets do you own? Asset (Include others not in the list.)
Quantity
Value in KSh.(optional)
Television
Radio
Bicycle
Car
Shop
Table
Chair
Refrigerator
Livestock (Sheep, Goats, Cattle, Poultry)
7.2 What are the three main sources of income in this household?(List from most to least important) Source of income.
7.3 What are the expenditures in the household? Expenditure Daily Monthly
Staple foods (Maize, Fish, Vegetables etc)
Other foods(Milk etc)
Clothing
Utilities (Household items, Electricity, Water and Fuel)
Rent
Education
Transport
Communications
Medical care
Other (Specify)
7.4 Do you or any member of your household belong to any Savings and Loans Group?
1. Yes 2. No

84 | P a g e
7.5 Have you or has any member of your household received any Loan from an institution or person?
1. Yes 2. No
If No Skip to 7.8
7.6 What were/are the sources of credit? 1. Commercial Bank 2. Savings Group 3. Microfinance Institution 4. Neighbors/relatives/friends 5. Shylocks/brokers
66. Other (Specify)
7.7 What was the reason for acquiring the Loan? 1. To pay school fees 2. To buy a car 3. To buy a house 4. To start a business 5. To pay medical fees
66. Other (Specify)
7.8 What are the major limiting factors in accessing credit?
1. High interest rates 2. Lack of collateral 3. Lack of information on credit products
66. Others(specify)
Any comments/questions/remarks concerning issues raised in this questionnaire.
The End!!!!
Thank you.

85 | P a g e
Appendix 6: MVC-Key Informant Interview Guide
MVC-Key Informant Interviews Guide
Kisumu Medical and Education Trust
Tom Mboya Estate,
P.O. Box 6805-40103, Kisumu
INTRODUCTION AND CONSENT:
Be courteous and friendly.
Hello. My name is _______________________. (Introduce yourself and the record keeper and state
the use of the tape recorder). I am working with K-MET which is collaborating with United Nations
Children’s Funds (UNICEF) in implementing the project Active Inclusion in Education for Most Vulnerable
Children (MVC.). The program’s strategic objective is to ensure that vulnerable children in five informal
settlements in Kisumu Municipality are able to access and complete nine years of basic education at
early childhood development (ECDE) and primary school levels. The informal settlements are Obunga,
Nyalenda, Manyatta, Bandani and Manyatta Arab. The objectives of the baseline survey in the 5
informal settlements in Kisumu City include mapping out new ECDE centres and developing criteria for
identifying Most Vulnerable Children (MVCs) with support from the community members. The criteria
will be used to identify and enroll MVCs in early childhood development and education and primary
schools living in the 5 informal settlements as well as 60 teenage mothers. This interview will assist us
meet these objectives.
Remind participants this is voluntary and they are free to leave at the start or any time during the
discussion.
If you accept the continuation of this interview please give your consent by signing below.
Signature________________________________
Date____________________________________
Note
- Interview should take approximately 30 Minutes. - Stress that there are no right or wrong answers. - Ask participants to feel free to say what they think.
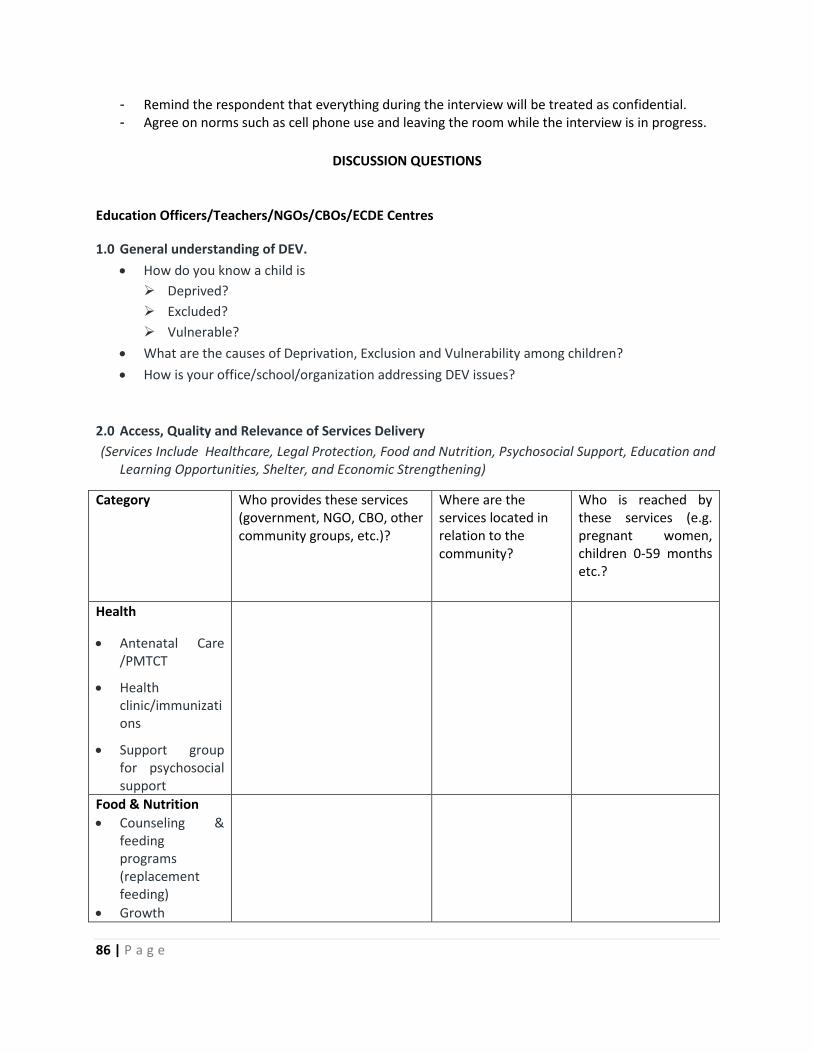
86 | P a g e
- Remind the respondent that everything during the interview will be treated as confidential. - Agree on norms such as cell phone use and leaving the room while the interview is in progress.
DISCUSSION QUESTIONS
Education Officers/Teachers/NGOs/CBOs/ECDE Centres
1.0 General understanding of DEV.
How do you know a child is
Deprived?
Excluded?
Vulnerable?
What are the causes of Deprivation, Exclusion and Vulnerability among children?
How is your office/school/organization addressing DEV issues?
2.0 Access, Quality and Relevance of Services Delivery
(Services Include Healthcare, Legal Protection, Food and Nutrition, Psychosocial Support, Education and Learning Opportunities, Shelter, and Economic Strengthening)
Category Who provides these services (government, NGO, CBO, other community groups, etc.)?
Where are the services located in relation to the community?
Who is reached by these services (e.g. pregnant women, children 0-59 months etc.?
Health
Antenatal Care /PMTCT
Health clinic/immunizations
Support group for psychosocial support
Food & Nutrition
Counseling & feeding programs (replacement feeding)
Growth
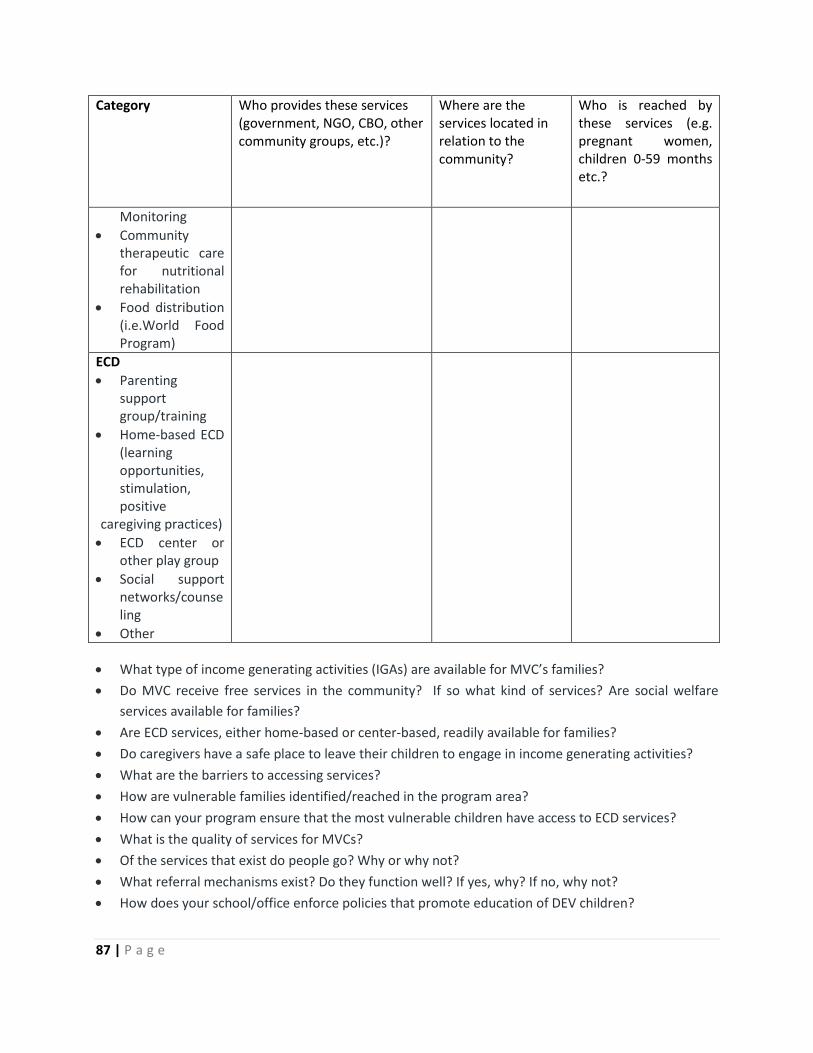
87 | P a g e
Category Who provides these services (government, NGO, CBO, other community groups, etc.)?
Where are the services located in relation to the community?
Who is reached by these services (e.g. pregnant women, children 0-59 months etc.?
Monitoring
Community therapeutic care for nutritional rehabilitation
Food distribution (i.e.World Food Program)
ECD
Parenting support group/training
Home-based ECD (learning opportunities, stimulation, positive
caregiving practices)
ECD center or other play group
Social support networks/counseling
Other
What type of income generating activities (IGAs) are available for MVC’s families?
Do MVC receive free services in the community? If so what kind of services? Are social welfare
services available for families?
Are ECD services, either home-based or center-based, readily available for families?
Do caregivers have a safe place to leave their children to engage in income generating activities?
What are the barriers to accessing services?
How are vulnerable families identified/reached in the program area?
How can your program ensure that the most vulnerable children have access to ECD services?
What is the quality of services for MVCs?
Of the services that exist do people go? Why or why not?
What referral mechanisms exist? Do they function well? If yes, why? If no, why not?
How does your school/office enforce policies that promote education of DEV children?

88 | P a g e
In what ways do school management committees deal with MVCs? (structure, training, composition
and decision making?
Which mentoring program14 exist for teachers to mentor MVCs?
3.0 Policy at community, provincial and national levels
Is there a National Plan of Action for MVC? Is it well funded? Does it place a specific emphasis on
young children 0 to 8?
Is there a National ECD Policy Framework that may be used to guide local decision-making including
issues relating to provision, management, accountability, and monitoring of outcomes?
What kind of support does your organization/office/department provide for MVC/ECD?
Are MVC/ECD programs included in your organization’s/office’s/department’s investment plans or
budgets?
What are existing policies (national/regional/local levels) relative to MVC/ECD?
Are there policies in place to protect children? If so what are these polices at the national, district
and community levels?
How open is your department to NGO interventions/collaboration to MVC/ECD issues?
Are there policy barriers (national/regional/local levels) preventing successful MVC/ECD activities
and programs (e.g. labor laws accommodating parents/caregivers, health standards of 0 – 8 year
olds etc.)? If yes, what are these barriers?
4.0 Socio-cultural, Geographical and Economic Factors
How does sexual and gender based violence affect education of MVCs?
Which challenges affect the following groups of children with respect to access to education?
Children with disabilities, Girls and Boys.
5.0 Community Organizations and Participation
Which organizations or institutions support MVCs in this area? How do they support MVCs? What
are your impressions on the organizations and their activities?
89 | P a g e
6.0 Personal Questions
Questions Responses
Are you male or female?
What is your position?
Kindly indicate your age?
What is your highest level of education at
present?
For how long have you worked here?
Focus areas
Key Informants: MEO,UNICEF,CADIF; Leonard Cheshire Disability, Ministry of Gender and Children
Affairs, Child Fund, World Vision, WFP, CDF, MPHS, Private Sector, ILO, MPs and Provincial
Administration (Chiefs) etc. Religious leaders, Teachers and Guardian/Parents.
90 | P a g e
Appendix 7: Focus Group Discussion Guide
Focus Group Discussion Guide
Hello. My name is _______________________. (Introduce your team and give time for the respondent to introduce themselves). I am working with K-MET which is collaborating with United Nations Children’s Funds (UNICEF) in implementing a program called; ‘the Active Inclusion in Education for Most Vulnerable Children (MVC)’. The program’s strategic objective is to ensure that vulnerable children in five informal settlements in Kisumu Municipality are able to access and complete nine years of basic education at early childhood development (ECDE) and primary school levels. The informal settlements are Obunga, Nyalenda, Manyatta, Bandani and Manyatta Arab. The objectives of the baseline survey in the 5 informal settlements in Kisumu City include mapping out new ECDE centres and developing criteria for identifying Most Vulnerable Children (MVCs) with support from the community members. The criteria will be used to identify and enroll MVCs in early childhood development and education and primary schools living in the 5 informal settlements as well as 60 teenage mothers. To do this we will use focus group discussions.
Remind participants this is voluntary and they are free to leave at the start or any time during the discussion.
Key Discussion Questions:
1.0 MVC Identification Criteria
How does a Deprived, Excluded and Vulnerable (DEV) child look like? (Rank the indicators/signs
of a DEV child. (Ask the group to rank these signs/indicators/criteria according to their
importance).
Explain why you have given more importance to one problem/criterion than to another?
2.0 Children’s Education
Describe the quality, accessibility and cost of education in the local ECDE and Primary Schools?
What services (care, feeding etc) are provided in the ECDE and Primary Schools?
How do these services affect children and their parents?
Who pays for the children to go to nursery and primary schools? Who pays for the teachers?
How are parents/community members involved in the children’s education?
91 | P a g e
To which ECDE centres would you like your children in this area go and why?
Where would you like to see a model ECDE centre
and Why?
What are the major challenges affecting children’s
education?
What are the causes of these challenges?
How would you address the challenges identified?
(With what help/resources? Who is supposed to help/provide the resources?)
3.0 Other Organizations involved
Which institutions are involved in helping MVCs?
(NGOs, CBOs, and Government Institutions)?
How is the community involved in addressing issues of MVCs?
Documentation Sheet
Name of location Date
Name of note-taker Number of Participants
Name of facilitator(s)
Method used
92 | P a g e
Appendix 8: Children Interview Guide
Children Interview Guide
Kisumu Medical and Education Trust
Tom Mboya Estate,
P.O. Box 6805-40103, Kisumu
INTRODUCTION AND CONSENT:
Be courteous and friendly.
Hello. My name is _______________________. (Introduce yourself and the record keeper and state
the use of the tape recorder). I am working with K-MET which is collaborating with United Nations
Children’s Funds (UNICEF) in implementing the project Active Inclusion in Education for Most Vulnerable
Children (MVC.). The program’s strategic objective is to ensure that vulnerable children in five informal
settlements in Kisumu Municipality are able to access and complete nine years of basic education at
early childhood development (ECDE) and primary school levels. The informal settlements are Obunga,
Nyalenda, Manyatta, Bandani and Manyatta Arab. The objectives of the baseline survey in the 5
informal settlements in Kisumu City include mapping out new ECDE centres and developing criteria for
identifying Most Vulnerable Children (MVCs) with support from the community members. The criteria
will be used to identify and enroll MVCs in early childhood development and education and primary
schools living in the 5 informal settlements as well as 60 teenage mothers. This interview will assist us
meet these objectives.
Remind participants this is voluntary and they are free to leave at the start or any time during the
discussion.
If you accept the continuation of this interview please give your consent by signing below
(guardian/parent to sign for child).
Signature________________________________
Date____________________________________
Note
- Interview should take approximately 30 Minutes. - Stress that there are no right or wrong answers. - Ask participants to feel free to say what they think.
93 | P a g e
- Remind the respondent that everything during the interview will be treated as confidential. - Agree on norms such as cell phone use and leaving the room while the interview is in progress.
1.0 Personal Questions
How old are you?
In which class are you?
Sex of the child?
2.0 Health and Sanitation
Have you ever fallen sick?
Which part of your body was painful?
Were you treated?
Where were you treated?
If you were not treated? What was the reason?
When do you wash your hands?
When did you bathe last? (Probe for frequency of bathing)
3.0 Food and Nutrition
What type of food do you eat regularly?
Do you get satisfied when you eat this food?
How many times have you slept hungry this month?
4.0 Care and Development
Who cooks for you everyday?
Who bathes you and changes your clothes?
What types of play do you often engage in?
With whom do you play?
Where do you sleep? (Probe for safety and Hygiene)
Who do you fear most? Why?
When you make a mistake what type of punishment do you get?
Who punishes you?
Where do you go to school
How do you reach your school?
5.0 Direct Observation
Describe: Body shape/size, height, skin characteristics, clothing, speech, general child behaviour.