baseload solar power: near-term prospects for load following solar thermal electricity
TRANSCRIPT
Baseload solar power
Near-term prospects for load following solar thermal electricity
David Mills and Bill Keepin
We explore prospects for future improvements in solar thermal electricity generation, focusing in particular on advanced parabolic trough tech- nology, coupled with natural gas back up and potential developments in thermal energy stor- age. Based on recent developments achieved at the University of Sydney, Australia, and else- where, it appears that the performance and eco- nomics of solar thermal technology could be improved beyond the unprecedented results already achieved by the now defunct Luz Inter- national Limited. I f such improvements are real- ized, solar thermal power could become com- petitive within this decade as a principal source of electricity (rather than just peaking power) over much of the USA, including large portions of the Mid-west and the South-east. Coupled with natural gas back up and potential develop- ments in thermal energy storage, baseload solar plants may be feasible with solar fractions ex- ceeding 80%. While much engineering and eco- nomic refinement remains to be done, prelimin- ary economic estimates suggest that a hybrid solar~storage~gas plant could produce load fol- lowing solar electricity around the clock for a levelized real cost of five to seven cents per kilowatt hour over large regions of the USA.
Keywords: Solar power; Solar thermal; Thermal energy storage
Solar thermal energy has proven itself to be a viable means for generating electricity from the sun on a large scale. The Luz Corporation installed 354 MW of generating capacity in California, utilizing para-
David Mills is with the Department of Applied Physics, University of Sydney, Camperdown, NSW 2006, Austra- lia; Bill Keepin is consultant to The Energy Foundation, San Francisco, USA.
bolic trough solar thermal systems backed up by natural gas. These plants generate 90% of the world's solar electricity, enough to meet the residen- tial needs of a community of 385 000 people.1
The potential for utility-scale applications of solar thermal electricity in large regions of the USA is explored below. We begin with a review of current parabolic trough technology, followed by a discus- sion of various advances in solar thermal technology and thermal energy storage. Next, we simulate the combined performance of these advances in a case study of a hybrid solar thermal/storage/gas power plant, using actual utility load data. Finally, we give a preliminary analysis of the economics of such a plant.
The major conclusion of this study is that the future of solar thermal technology for large-scale electricity generation appears very bright (despite the recent demise of Luz International Ltd). Signifi- cant technological improvement is possible for para- bolic trough designs, which could reduce the cost of solar thermal electricity considerably. Coupled with back up fuel and potential improvements in thermal energy storage, load following solar electric power plants may become feasible and economic in the near-term future. While this paper focuses primarily on parabolic trough designs, the findings are broadly consistent with expectations for the future perform- ance of other solar thermal technologies such as parabolic dishes.
Current commercial solar thermal technology
Solar thermal electricity relies on the collection of solar heat at temperatures sufficiently high to pro- duce steam of a quality suitable for electric turbo- generators. The operating temperature of current parabolic trough solar thermal electric plants ex- ceeds 390 °C. The largest and most effective current
0301-4215/93/080841-17 © 1993 Butterworth-Heinemann Ltd 841
Baseload solar power
commercial projects were installed in southern Cali- fornia by Luz International Ltd.2 These plants utilize single-axis parabolic trough collectors that track the sun with a north-south axis of rotation. The collec- tors are mounted parallel to the ground, which allows the use of big reflector units (because they are not elevated high into the air). Luz reflectors are large; the LS-3 collector has an aperture area of 545 m z and uses 224 glass mirror segments. An 80 MW plant utilizes nearly 900 such collectors.
The Luz collector utilizes an evacuated annulus receiver consisting of an inner stainless steel tube mounted in a concentric cylindrical glass envelope. The glass envelope is evacuated, which serves to minimize convective and conductive losses. To limit radiative losses, the outer surface of the inner (steel) tube is coated with a special wavelength-selective material - commonly known as a selective surface - that readily absorbs visible sunlight while emitting comparatively little in the infrared spectrum. The Luz selective surfaces have an emittance of about 15-19% at operating temperature. 3 The Luz collec- tor is designed to minimize the surface area available for such losses, which means that relatively high concentration is utilized. The concentration ratio of Luz collectors varies from about 23:1 for the initial collectors to more than 25:1 for the newest collectors. 4 The use of high concentration cuts radia- tive losses in practice to a few per cent. Relatively large diameter absorber tubes are necessary to allow adequate flow rates and pressures in the heat trans- fer fluid (oil), and thus to obtain the high concentra- tion; the Luz reflector aperture is necessarily quite large, equal to about 80 times the diameter of the tubular absorber. This large reflector is one reason why Luz opted for the ground hugging north-south collector orientation (although there are other reasons eg larger reflector designs have shallower curvature, which makes for easier manufacturing of the glass mirror surface).
The north-south orientation gives a high summer bias to annual electricity output, because the winter sun is low in the sky in temperate latitudes, which reduces the effective aperture of the collector. Sum- mer bias is favourable for summer peaking utilities such as those in California, but for electric utilities which do not have a strong summer peak in their annual load pattern, the north-south orientation would be less practical. The high concentration factor also limits the collection of diffuse radiation to very insignificant levels. 5
The Luz collector requires expensive low-iron glass mirrors with highly accurate tracking, sophisti- cated heat transfer and a high pressure oil pumping
infrastructure, all of which demand high engineering standards to achieve good performance. 6 The net cost of this sophisticated system is about US$360 per square metre for a large US$230 million 80 MW collector field, including electric conversion equipment. 7 It appears that the necessity to reduce radiative losses from the absorbing surface ultimate- ly has a strong influence on collector design and cost.
In regions where fossil fuel costs are low, Luz designs are not currently considered to be competi- tive. A recent report to the Victorian government in Australia found that this technology might be marginally cost effective only in high cost, high solar insolation inland areas if costs could be reduced by 30% or more, depending upon array size. 8 How- ever, Luz anticipated that the next major improve- ment in their technology would result in electricity generation costs of 5.5 cents per kilowatt hour (C/kWh, levelized real) in areas of high solar insola- tion. This is less than the projected cost of electricity generated from clean coal technology in the USA. 9 For perspective, it is interesting to note that 8C/kWh has been mentioned in recent US Department of Energy (DOE) analyses as a threshold for likely 'explosive growth' in solar photovoltaic (PV) tech- nology (although solar PV is a more versatile tech- nology than large-scale solar thermal technology). 1°
Today a significant overcapacity persists for most US utilities, and this may continue as demand man- agement programmes proliferate. Nevertheless, by the time new capacity is needed, advanced Luz technology could prove attractive.
Solar thermal energy has several advantages com- mon to most renewable energy technologies. Luz has demonstrated that construction periods for solar thermal plants can be relatively short eg less than a year for an 80 MW plant. Furthermore, solar ther- mal plants can be installed cost effectively in re- latively small sizes (100-200 MW). Purchasing smal- ler plants allows utilities to better track an uncertain demand future, as well as helping to minimize grid losses and long-range transmission costs.
The Luz solar plants brought a dream into reality: large-scale solar thermal electricity generation is now fact, not fiction. Ironically - despite this crucial technological success story - Luz International filed for bankruptcy on 25 November 1991 and termin- ated plans for building further power plants. 11 Ex- isting plants are still fully operational. The reasons for the demise of Luz are varied and complex, having much to do with institutional biases against renewable energy technologies. Regulatory restric- tions on plant size, inconsistent tax policies, lack of access to inexpensive capital, barriers to utility own-
842 ENERGY POLICY August 1993

Polar tracking trough
Baseload solar power
North-South tracking trough
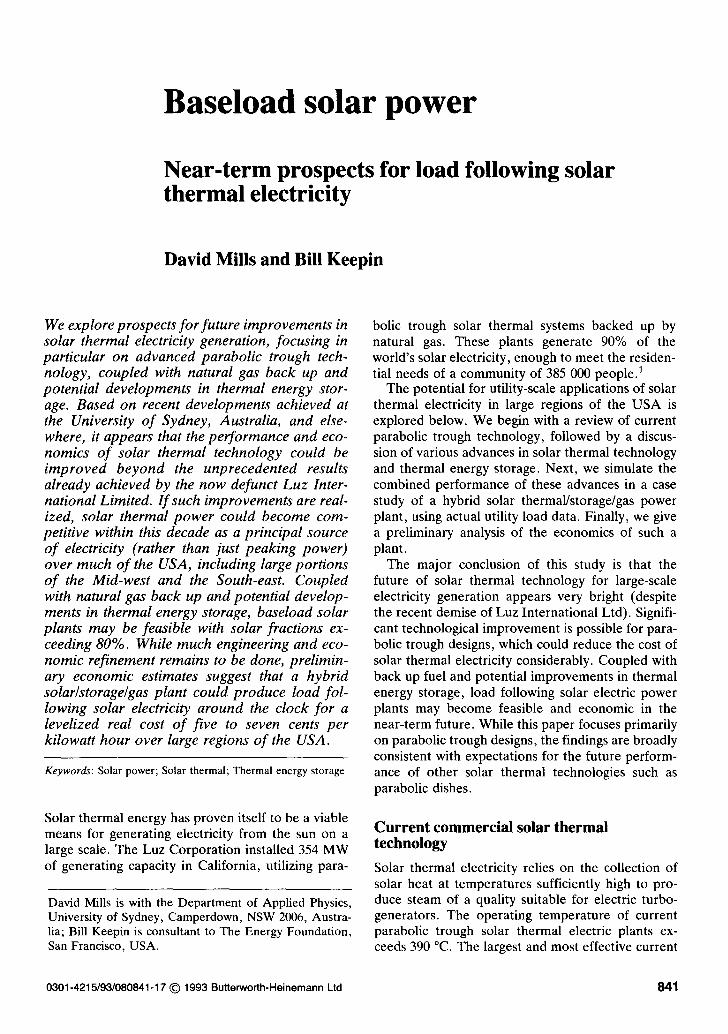
Figure 1. Orientation of single-axis tracking parabolic trough collectors for both north-south and polar axes of rotation, and a schematic two-axis trough which always faces the sun.
ership and participation, falling fossil fuel prices, and lack of financial accounting for environmental benefits all contributed to the downfall of Luz. ~2 Most of these factors could be corrected by govern- ment policies at regional and federal levels. Detailed consideration of these crucial issues is beyond the scope of this study; for further information, consult the sources cited in this paragraph, especially the last. Luz has recently been reconstituted as Solel Ltd in Jerusalem.
Advanced solar thermal technology
Despite the tremendous success of the Luz technolo- gy, current solar thermal electric plants are limited in potential. The next generation of Luz plants would probably have been considerably less expen- sive, but they were still designed as peaking plants. Although many utilities would initially require only peaking plants, ultimately we will require inexpen- sive 'baseload solar' electricity if we are to truly supplant today's polluting energy supply technolo- gies.
What are the prospects for solar baseload electric- ity in the future? Technical improvements in solar thermal technology have recently occurred at a rapid pace, despite very meagre R&D funding, and they
seem to be continuing. This raises the question of whether there are sufficient technical and economic improvements on the horizon to suggest that solar thermal technology might become a comprehensive electricity supply option in the future. The remain- der of this paper examines this question, focusing in particular on prospects in the USA.
While the Luz systems represent a major tech- nological leap forward, there are several ways in which the cost and performance of parabolic trough technologies could potentially be improved. A brief review of these is given below.
Alternative collector types
On an annual basis, the tracking configuration of Luz plants delivers significantly less solar radiation to the solar absorber than other more sophisticated tracking configurations, such as polar-axis tracking or two-axis tracking configurations, as depicted in Figure 1. Luz did not employ such sophisticated tracking systems because the Luz plants were designed primarily as peaking facilities for summer- time operation, when the added performance from more sophisticated tracking systems is minimal. Furthermore, sophisticated tracking systems are more expensive, although there may be a way around this, as discussed below.
ENERGY POLICY August 1993 843
Baseload solar power
Two-axis tracking collectors such as solar para- boloidal dishes achieve much higher concentration than Luz north-south axis technology, and could be constructed to collect about 28% more energy per unit of collector area because they exhibit very low losses and face the sun directly at all times. How- ever, like the Luz system, they also require very demanding engineering standards to achieve good performance. In Australia, Kaneff suggests that electricity costs equivalent to about 5C/kWh may be possible using large dishes in large numbers, and development of that approach is continuing in that country. 13 Power Kinetics Inc of Troy, NY also quote future costs in the range of 5C/kWh for two-axis technology. It seems therefore that the high concentration, large reflector approach offers a roughly similar cost of electricity, using either the next generation Luz design, or a two-axis tracking dish design. In either case, performance in regions with less favourable solar insolation is reduced, resulting in increased costs.
Polar-axis tracking trough collectors are similar to the Luz collectors, except that the axis of rotation is tilted upright, at an angle equal to the latitude angle from vertical. This means that the focal axis of the collector is nearly normal to the sun's rays for much of the year, improving performance considerably (especially in winter, or for higher latitudes). 14
Surprisingly, this polar tracking configuration actually collects 97% as much annual solar radiation as a two-axis tracking dish of the same effective aperture (before thermal losses), yet it is still only a single-axis tracker and therefore utilizes simpler engineering. 15
An advanced large Luz-style collector could in principle be mounted in a polar-axis tracking con- figuration in order to collect more solar radiation, but it would cost significantly more because of the increased structural costs associated with the tilted attitude, and the high loadings in strong winds. Hence polar tracking is not practical with Luz tech- nology. However, the advantages of polar axis track- ing can potentially be exploited in much smaller collectors with the assistance of a new technical development, an advanced selective absorber sur- face, described in the next section.
New selective surfaces New wavelength selective surfaces for solar evacu- ated tubes have recently been developed at the University of Sydney in Australia. 16 These new surfaces have broken a world performance record, and they could reduce the future cost and complexity of solar thermal systems substantially below current
levels. Although solar collectors utilizing these new selective surfaces will not be available in demonstra- tion quantities for at least two years, it is possible at this time to estimate the performance of collector systems using this new technology.
An important measure of the performance of a selective surface is the solar absorptance (0t) divided by radiative thermal emittance (e), or the so-called ode ratio. This ratio provides a measure of how well the surface is able to absorb visible light from the sun, while retaining heat that would otherwise be radiated away in the infrared spectrum. For the new Sydney University selective surfaces, the ode has been measured in the laboratory to be 46 at room temperature, compared with the previous world record of 32.17 Moreover, there are indications that this could be improved upon further, although all results in this paper assume a ratio of 46.18 Perhaps even more importantly, the radiative losses of this selective surface at 400 °C are calculated to be about 4.3% of a black-body surface at the same tempera- ture, and measured losses of 5.5% have already been observed with early prototypes in the labora- tory. This suggests that the radiative losses from the new surface will be three to five times lower than from the Luz selective surface at 400 °C. It is likely that the proposed selective surface can be made from several combinations of suitable materials that will remain stable for extended periods of time in a vacuum tube environment at temperatures ranging from 400-700 °C. Although this remains to be de- monstrated empirically, the new surfaces use cera- mic metal composite (cermet) construction, and extended operation of cermet selective surfaces at high temperatures has already been demonstrated by Luz. In addition, several new combinations of materials may offer superior durability compared to the materials utilized by Luz.
Use of such low loss selective surfaces at high temperatures would permit the use of low concentra- tion: four to twelve times, rather than the much higher concentration of 25 that Luz utilized. This means that the parabolic trough mirrors can be considerably smaller, and that exacting engineering standards can be relaxed to some extent (eg in mirror forming accuracy and tracking accuracy). The overall result is that costs should be considerably reduced for a given electricity output. (Preliminary economic calculations are included toward the end of this paper.)
Simplified heat transfer systems In an additional cost saving improvement, Sydney University has developed an inexpensive passive
844 ENERGY POLICY August 1993
heat transfer system that requires no pumps. The system consists of a water supply tank located at a higher level than the array, and the water drains by gravity into the collector array. If the system is properly designed, steam and water flow naturally at precisely the correct rate to maintain a steady energy flow, and the temperature of the array automatically remains slightly higher than the storage (conden- sing) temperature. The condensate drains by gravity into the collector, so the array is flooded when not in operation. This system is currently deployed for low concentration solar thermal systems using water/ steam thermosyphon; these allow a low cost sealed pipe collector array that contains no moving parts. By installing these collector systems in parallel, this design can be utilized for large-scale electricity gen- eration at a temperature up to about 370 °C.19 Such a system would be unsuitable for higher concentra- tion systems such as Luz, because flow rate demands are too high for natural thermosyphon.
Vacuum insulation
Steam pipes that connect the solar collector array to a central power block can be a significant source of heat loss. Vacuum insulated header manifolds of a simple design can be used to increase net output by 13-15% in polar-axis tracking and two-axis tracking dish configurations. Vacuum insulation would also be helpful in Luz-type arrays, though the benefits would be less pronounced because Luz configura- tions are relatively efficient in terms of pipework utilization. Vacuum insulation is not expected to cost more than conventional insulation.
Low concentration enhancement of diffuse radiation acceptance
As discussed above, the new selective surface can be utilized in a polar tracking collector of relatively low concentration, which in itself represents a significant cost advantage. However, performance simulation models reveal yet another benefit that results from using low concentration. In addition to the sun's direct rays, the sky is filled with diffuse radiation, which is light that is scattered by the earth's atmos- phere. It turns out that most of this diffuse solar radiation is circumsolar, coming from the general direction of the solar corona. For parabolic trough systems with concentrations of 8:1 or less, much of this solar diffuse radiation can be collected, and the result is that total radiation collected increases by roughly 10%. 20
Sophisticated computer simulation models have been developed to analyse and compare various
Baseload solar power
solar collector configurations, thermal systems, and selective surfaces. 21 Part of the input data for these models is long-term solar radiation data, collected at numerous key sites around the world for more than a decade. One of us (D.M.) has utilized these simula- tion models to assess the performance of a hypothet- ical solar thermal collector that incorporates some of the advances discussed in this paper. Specifically, this hypothetical system consists of a parabolic trough collector mounted in a polar-axis tracking configuration, utilizing the new selective surfaces recently developed at the University of Sydney. The collector would measure approximately 1 × 2 m 2, which means that the wind loading problems associ- ated with the tilted orientation would not be difficult or expensive to handle. For convenience, we call this hypothetical system the polar collector below.
Performance o f advanced solar thermal collectors
We have compared the performance of our prop- osed polar collector (with concentration 8:1) against a simulated estimate for a north-south axis Luz-type collector (with concentration 25:1) under similar conditions. The annual solar collection for the polar collector is found to be about 23% greater than that of the Luz-type collector. The improved perform- ance is attributed to roughly equal contributions from diffuse radiation and polar axis tracking, both of which are made possible by the use of the new low loss selective surface and low concentration con- figuration.
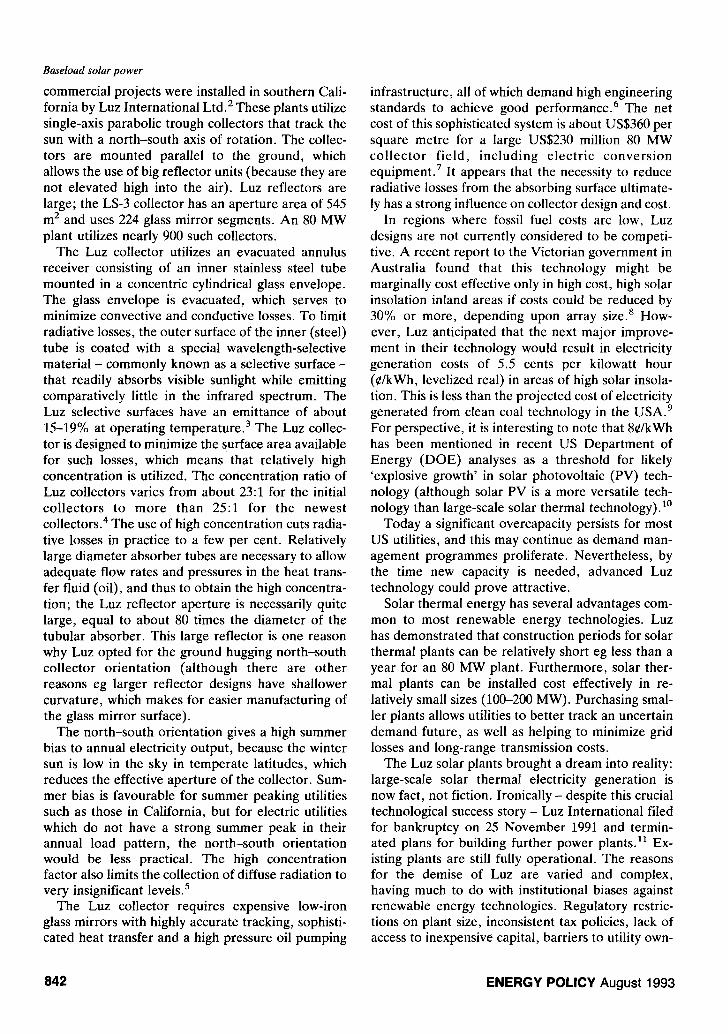
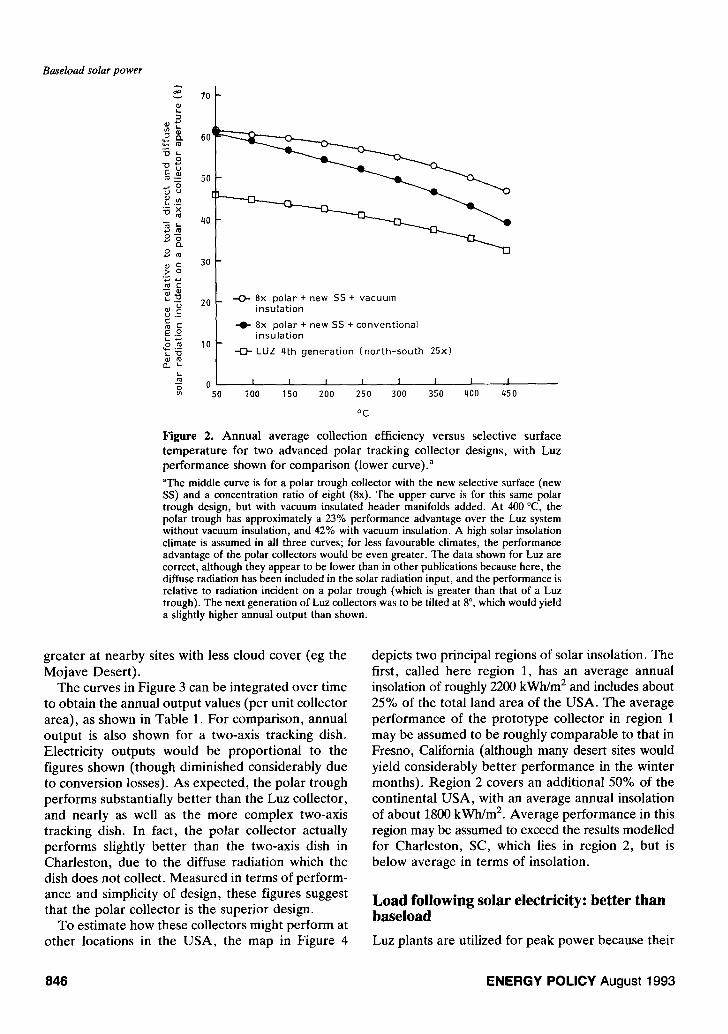
The calculated performance of polar collectors is compared with Luz performance in Figure 2, mea- sured in terms of annual average collection efficien- cy. The figure shows the cumulative improvement in efficiency resulting from changing the orientation, the selective absorbing surface, and the efficiency of insulation of header pipes. All of these are signifi- cant, and together would allow a possible perform- ance increase of up to 23% without vacuum insula- tion and 42% with vacuum insulation at 400 °C.
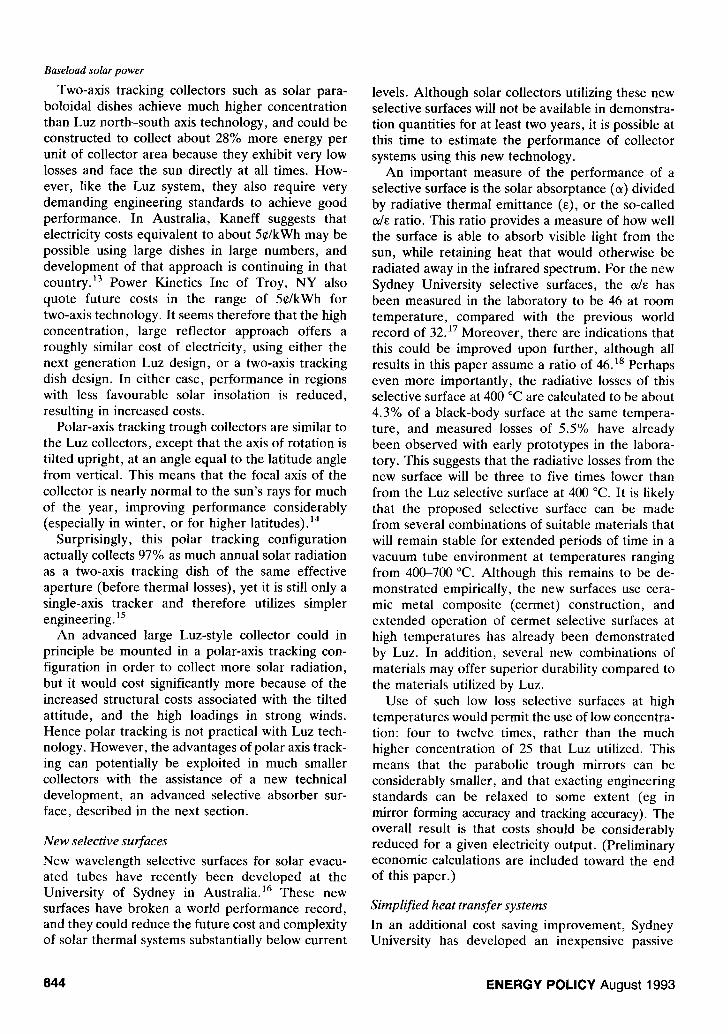
The resulting thermal energy outputs for the different collectors are calculated on a seasonal basis, as shown in Figure 3 for two representative sites in the USA for which detailed solar radiation data are available (US SOLMET data)fl 2 The curves show average daily energy output at 350 °C over the course of the year. The polar collector exhibits a clear improvement over the Luz collector. The per- formance drops off sharply in the winter months in Fresno, due to local fog and cloud cover at that time of year. Winter performance would be substantially
ENERGY POLICY August 1993 845
Baseload solar power
~ 70
60 t
~ 50
~5 40
=o 30
~ 20 ~._~
~.~
- 0 - 8x p o l a r + n e w S S + vacuum i nsu la t i on
--0- 8x po la r + new SS + c o n v e n t i o n a l i nsu la t i on
- 0 - LUZ 4th g e n e r a t i o n ( n o r t h - s o u t h 25x)
0 I I 50 100 150
Figure 2. Annual average
I I I I I I 200 250 300 350 400 450
oc
collection efficiency versus selective surface temperature for two advanced polar tracking collector designs, with Luz performance shown for comparison (lower curve), a aThe middle curve is for a polar trough collector with the new selective surface (new SS) and a concentration ratio of eight (8x). The upper curve is for this same polar trough design, but with vacuum insulated header manifolds added. At 400 °C, the polar trough has approximately a 23% performance advantage over the Luz system without vacuum insulation, and 42% with vacuum insulation. A high solar insolation climate is assumed in all three curves; for less favourable climates, the performance advantage of the polar collectors would be even greater. The data shown for Luz are correct, although they appear to be lower than in other publications because here, the diffuse radiation has been included in the solar radiation input, and the performance is relative to radiation incident on a polar trough (which is greater than that of a Luz trough). The next generation of Luz collectors was to be tilted at 8 °, which would yield a slightly higher annual output than shown.
greater at nearby sites with less cloud cover (eg the Mojave Desert) .
The curves in Figure 3 can be integrated over t ime to obtain the annual output values (per unit collector area), as shown in Table 1. For comparison, annual output is also shown for a two-axis tracking dish. Electricity outputs would be proport ional to the figures shown (though diminished considerably due to conversion losses). As expected, the polar trough performs substantially bet ter than the Luz collector, and nearly as well as the more complex two-axis tracking dish. In fact, the polar collector actually performs slightly bet ter than the two-axis dish in Charleston, due to the diffuse radiation which the dish does not collect. Measured in terms of perform- ance and simplicity of design, these figures suggest that the polar collector is the superior design.
To estimate how these collectors might per form at other locations in the USA, the map in Figure 4
depicts two principal regions of solar insolation. The first, called here region 1, has an average annual insolation of roughly 2200 kWh/m 2 and includes about 25% of the total land area of the USA. The average performance of the prototype collector in region 1 may be assumed to be roughly comparable to that in Fresno, California (although many desert sites would yield considerably bet ter per formance in the winter months). Region 2 covers an additional 50% of the continental USA, with an average annual insolation of about 1800 kWh/m 2. Average performance in this region may be assumed to exceed the results modelled for Charleston, SC, which lies in region 2, but is below average in terms of insolation.
Load following solar electricity: better than baseload Luz plants are utilized for peak power because their
846 ENERGY POLICY August 1993

2s I Baseload solar power
20
c~
H E
.~ a0
-0-- Vacuum polar, Fresno ~ ~ -0- Polar, Fresno
I ~ Two axis, Fresno -{]- Luz, Fresno ---0- Polar, Charleston - I - Luz, Charleston b -~- Two axis, Charleston
0 I I I I I I I I I I I I
i
4" k ok ~ ok
Figure 3. Average daily energy collection for advanced polar trough collector designs at 350 °C in Fresno, CA and Charleston, SC (by month of year), a aFor comparison, performance of the Luz collector is also shown. The advanced trough collector (polar) uses the new selective surface with a concentration of 8:1, and in the uppermost curve includes vacuum insulated header manifolds (vac polar). Winter performance in Fresno is very poor because of cloud cover, whereas some desert locations in California would be much superior at this time of year.
electricity costs are competi t ive during peak periods only. The peak power marke t is currently the most attractive marke t for commercial solar energy in California and elsewhere in the south-western USA. The potential for solar peaking plants is quite large, and near- term solar thermal development will natur- ally be aimed at this market . Eventually, however, if solar thermal energy is ever to become a major power source, it must be capable of supplying elec- tricity not only during periods of peak demand, but at all t imes of day and night. Indeed, one of the often-cited arguments against solar energy is that it is intermittent , and at night it disappears altogether. In utility parlance, a solar power plant has poor dispatchability (ie it cannot be switched on at will), and solar energy cannot deliver baseload power. In
this section we examine a few approaches to tackling this problem.
We first suggest that dispatchability and baseload power are perhaps somewhat overrated virtues. Just as renewable power plants are decried for not being dispatchable, conventional baseload power plants suffer f rom undispatchabili ty - they cannot be
Table 1. Expected solar collector output (MJ thermal)/m 2 pa).
SOLMET North-south Polar Two-axis site (Luz) trough tracking dish Fresno, CA 3592 4419 a 4893 Charleston, SC 2392 3117 2933
"Rises to 4995 if design includes vacuum insulation of feed pipes. Vacuum insulation would also similarly assist point focus tech- nology and, to a lesser extent, Luz technology.
ENERGY POLICY August 1993 847

Baseload solar power
[ ] Region I [ ] Region 2
ston
Figure 4. Direct normal solar insolation in the USA. a aRegion 1 (average 2200 kWh/m 2) includes most of the south-western USA, and is comparable to the Australian mainland. Region 2 (average 1800 kWh/m 2) includes most of the Great Plains and south-eastern USA, and is comparable to coastal Australia. Together regions 1 and 2 account for about three-quarters of the USA continental land area.
turned off very easily or run efficiently at low power outputs. Hence utilities sell off-peak power at bar- gain prices, which creates artificially high night-time loads. This is a form of load management in which the utility seeks to flatten a natural diurnal load variation to match the flat output profile of its baseload power plants. In an analogous manner, the utility could instead use market incentives to adjust its load profile to better suit the outputs from solar power plants. In fact, the solar output often has a built in diurnal variation with the same frequency and a not-dissimilar amplitude from that of the load itself. Moreover, even though the power output from solar and other renewable plants is intermit- tent, it often conforms to highly predictable pat- terns, which can be readily incorporated into utility planning.
Despite the tenacious myth that baseload is beautiful, the ideal power plant would produce an output that was as flexible as possible. A flexible output load profile assists the utility in meeting its demand requirements at all times, accounting for diurnal variations in demand as well as changes in the availability of other generating plants on the utility grid. Such an ideal flexible plant can be approached by combining solar thermal electricity with back-up fuel and energy storage, as considered below.
Solar thermal~natural gas hybrid electricity Like the Luz plants, the proposed polar tracking
systems would most probably be operated as solar/ fossil hybrids, in which the solar system was backed up by an available alternative fuel. Back up fuel could be used routinely for superheating steam before it entered the turbine, and also for generating steam at night or during cloudy periods. Natural gas appears to be the preferred fuel for this purpose today, owing to wide availability, low cost and relatively lower pollution emissions compared to coal and oil. Luz uses natural gas as a back up fuel, and has also used gas for superheating steam to give higher turbine input temperatures.
For the proposed low concentration polar tracking system, the optimal operating temperature may be about 310 °C, with a storage output temperature 291 °C, and a small section of the array running near 360 °C for some solar superheating. Natural gas could be used for superheating on a sunny day, raising the temperature of the solar system steam output from about 360 °C to 480°C, which is the preferred tempera- ture for conventional steam turbines operating at up to 40% conversion efficiency, average efficiencies being somewhat lower depending upon load pat- terns. This would yield a net annual solar to electric- ity conversion efficiency of more than 20% in region 1, and the energy contribution from natural gas for superheating would be only 13%.23 A lower temper- ature turbine could also be utilized eg Luz uses a more expensive turbine capable of 38% peak effi- ciency at 390 °C, and they currently use solar super- heating from 370 °C to 390 °C, minimizing emissions
848 ENERGY POLICY August 1993
Baseload solar power
14
12
tO
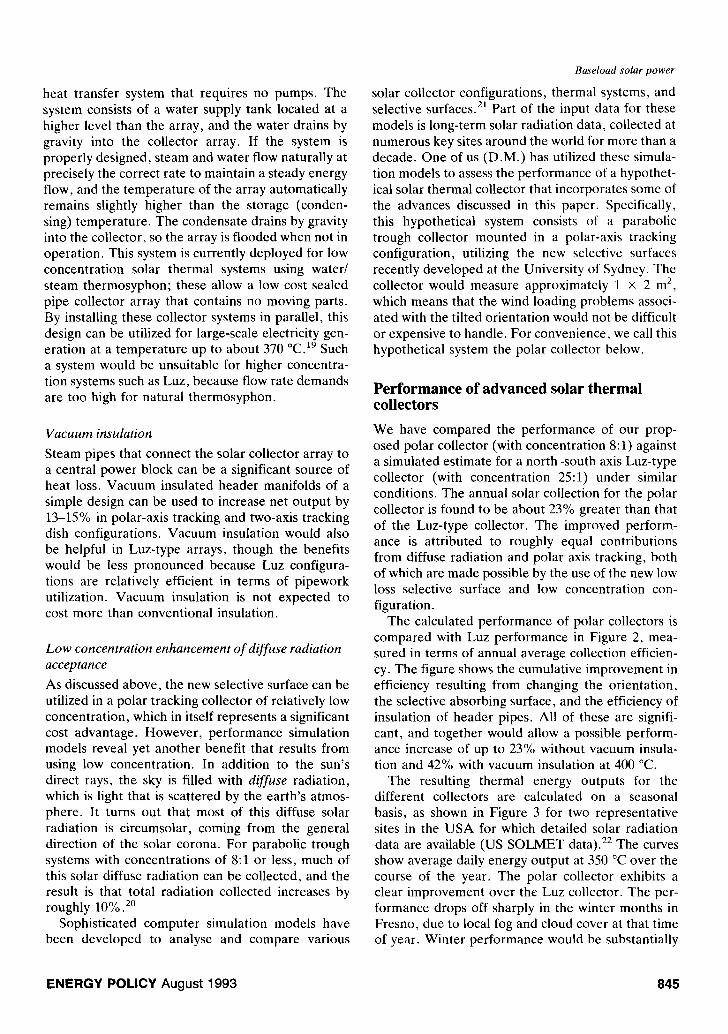
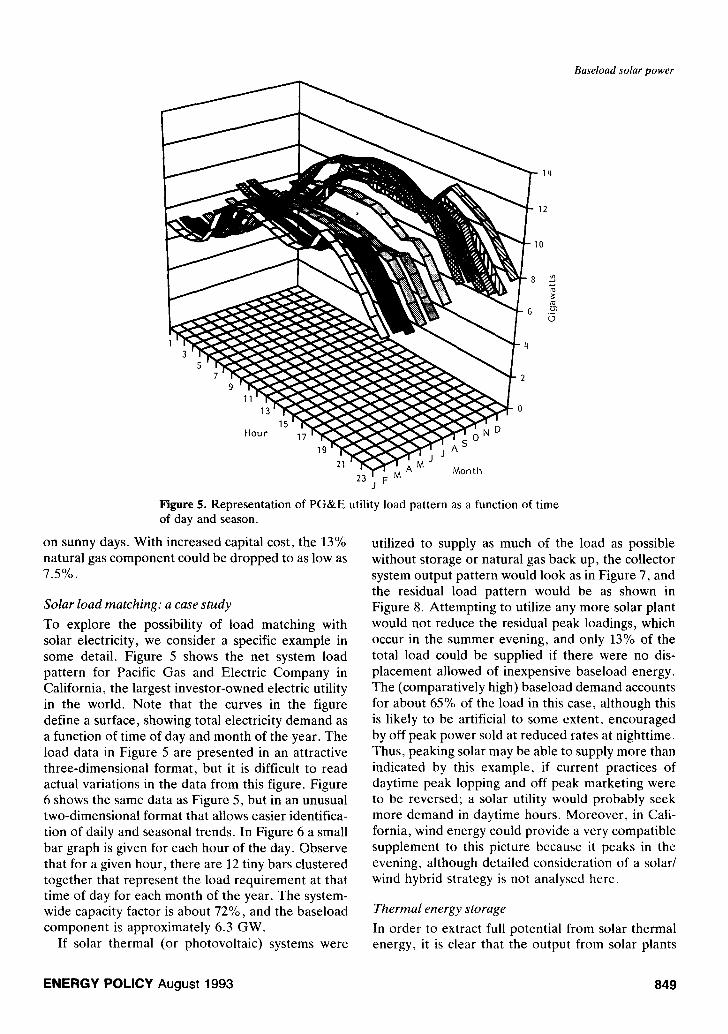
Figure 5. Representation of PG&E utility load pattern as a function of time of day and season.
on sunny days. With increased capital cost, the 13% natural gas component could be dropped to as low as 7.5%.
Solar load matching: a case study
To explore the possibility of load matching with solar electricity, we consider a specific example in some detail. Figure 5 shows the net system load pattern for Pacific Gas and Electric Company in California, the largest investor-owned electric utility in the world. Note that the curves in the figure define a surface, showing total electricity demand as a function of time of day and month of the year. The load data in Figure 5 are presented in an attractive three-dimensional format, but it is difficult to read actual variations in the data from this figure. Figure 6 shows the same data as Figure 5, but in an unusual two-dimensional format that allows easier identifica- tion of daily and seasonal trends. In Figure 6 a small bar graph is given for each hour of the day. Observe that for a given hour, there are 12 tiny bars clustered together that represent the load requirement at that time of day for each month of the year. The system- wide capacity factor is about 72%, and the baseload component is approximately 6.3 GW.
If solar thermal (or photovoltaic) systems were
utilized to supply as much of the load as possible without storage or natural gas back up, the collector system output pattern would look as in Figure 7, and the residual load pattern would be as shown in Figure 8. Attempting to utilize any more solar plant would not reduce the residual peak loadings, which occur in the summer evening, and only 13% of the total load could be supplied if there were no dis- placement allowed of inexpensive baseload energy. The (comparatively high) baseload demand accounts for about 65% of the load in this case, although this is likely to be artificial to some extent, encouraged by off peak power sold at reduced rates at nighttime. Thus, peaking solar may be able to supply more than indicated by this example, if current practices of daytime peak lopping and off peak marketing were to be reversed; a solar utility would probably seek more demand in daytime hours. Moreover, in Cali- fornia, wind energy could provide a very compatible supplement to this picture because it peaks in the evening, although detailed consideration of a solar/ wind hybrid strategy is not analysed here.
Thermal energy storage
In order to extract full potential from solar thermal energy, it is clear that the output from solar plants
ENERGY POLICY August 1993 849

Baseload solar power
14
12
10
8
6
4
2
0
1 2 3 4 5 6 7 8 9 10 11 12 13 14 15 16 17 18 19 20 21 22 23 24
Hour
Figure 6. Load profile for PG&E in a two-dimensional representation, a aThe tiny bars within each hour indicate the 12 monthly load variations, showing seasonal load trends at a glance. Observe that although PG&E has a summer peaking load pattern, daily excursions are larger than seasonal variations.
must be available around the clock. One way to accomplish this is with thermal energy storage, which has the potential to allow for precise load matching at reasonable cost. While much work has been done on energy storage at low temperatures, less effort has been devoted to high temperature storage, in part because the cost of electricity gen- eration with storage has traditionally been too high to compete with baseload power. Hence the emph- asis for solar thermal electricity thus far has been on peaking plants. 24
Considerable R&D attention has been focused on the further development of electrical or mechanical means of storage (batteries, fuel cells, flywheels), apparently to the neglect of some simpler, more economic approaches. For example, at the Universi- ties of Sydney and New South Wales in Australia, a currently confidential engineering study suggests
14
12
10
8
6
that highly cost-effective thermal energy storage may be feasible. 25 The design involves an extremely simple high-temperature rock bed sensible heat stor- age system. Earlier studies carried out by the Solar Energy Research Institute (SERI) in 1981 and 1983 suggest that rock beds of a similar configuration utilizing air as the internal rock bed heat transfer fluid would be the most economical methods for large-scale high temperature storage of duration longer than a few hours. 26 Rock beds have been used for reliable solar energy storage at lower tempera- tures for many years. 27 The basic principles are well understood and remain the same at higher tempera- tures, and systems can be designed to efficiently maintain temperatures in the range of 400 °C for periods sufficient to provide a 24 hour service. A recent workshop conducted by SERI and Luz Inter- national found that advanced two-phase storage
2
0 1 2 3 q 5 6 7 8 9 I0 I I 12 13 14 15 16 17 18 19 20 21 22 23 24
Hour
Figure 7. Polar collector output pattern as a function of time of day and season, showing the maximum allowed input into the grid before peak lopping intrudes into baseload, a aThe solar fraction is about 13% of total load.
850 ENERGY POLICY August 1993
lq
Baseload solar power
12
10
8
6
o
I 2 3 4 5 6 7 8 9 10 11 12 13 14 15 16 17 18 19 20 21 22 23 24
Hour
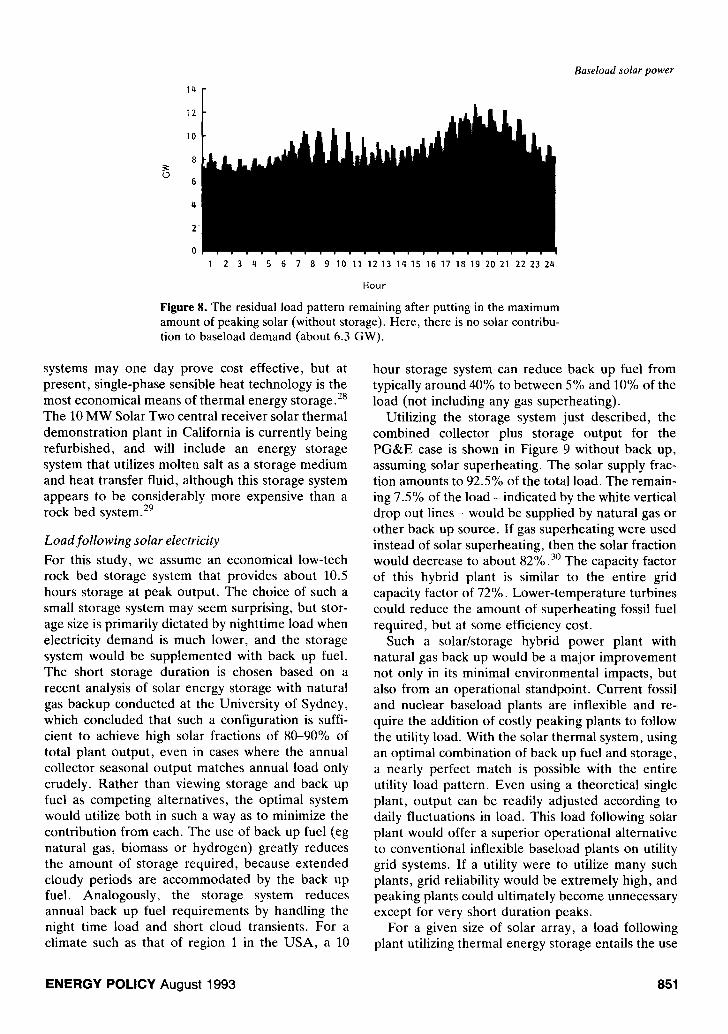
Figure 8. The residual load pattern remaining after putting in the maximum amount of peaking solar (without storage). Here, there is no solar contribu- tion to baseload demand (about 6.3 GW).
systems may one day prove cost effective, but at present, single-phase sensible heat technology is the most economical means of thermal energy storage. 28 The 10 MW Solar Two central receiver solar thermal demonstration plant in California is currently being refurbished, and will include an energy storage system that utilizes molten salt as a storage medium and heat transfer fluid, although this storage system appears to be considerably more expensive than a rock bed system. 29
Load following solar electricity For this study, we assume an economical low-tech rock bed storage system that provides about 10.5 hours storage at peak output. The choice of such a small storage system may seem surprising, but stor- age size is primarily dictated by nighttime load when electricity demand is much lower, and the storage system would be supplemented with back up fuel. The short storage duration is chosen based on a recent analysis of solar energy storage with natural gas backup conducted at the University of Sydney, which concluded that such a configuration is suffi- cient to achieve high solar fractions of 80-90% of total plant output, even in cases where the annual collector seasonal output matches annual load only crudely. Rather than viewing storage and back up fuel as competing alternatives, the optimal system would utilize both in such a way as to minimize the contribution from each. The use of back up fuel (eg natural gas, biomass or hydrogen) greatly reduces the amount of storage required, because extended cloudy periods are accommodated by the back up fuel. Analogously, the storage system reduces annual back up fuel requirements by handling the night time load and short cloud transients. For a climate such as that of region 1 in the USA, a 10
hour storage system can reduce back up fuel from typically around 40% to between 5% and 10% of the load (not including any gas superheating).
Utilizing the storage system just described, the combined collector plus storage output for the PG&E case is shown in Figure 9 without back up, assuming solar superheating. The solar supply frac- tion amounts to 92.5% of the total load. The remain- ing 7.5% of the load - indicated by the white vertical drop out lines - would be supplied by natural gas or other back up source. If gas superheating were used instead of solar superheating, then the solar fraction would decrease to about 82% .3o The capacity factor of this hybrid plant is similar to the entire grid capacity factor of 72%. Lower-temperature turbines could reduce the amount of superheating fossil fuel required, but at some efficiency cost.
Such a solar/storage hybrid power plant with natural gas back up would be a major improvement not only in its minimal environmental impacts, but also from an operational standpoint. Current fossil and nuclear baseload plants are inflexible and re- quire the addition of costly peaking plants to follow the utility load. With the solar thermal system, using an optimal combination of back up fuel and storage, a nearly perfect match is possible with the entire utility load pattern. Even using a theoretical single plant, output can be readily adjusted according to daily fluctuations in load. This load following solar plant would offer a superior operational alternative to conventional inflexible baseload plants on utility grid systems. If a utility were to utilize many such plants, grid reliability would be extremely high, and peaking plants could ultimately become unnecessary except for very short duration peaks.
For a given size of solar array, a load following plant utilizing thermal energy storage entails the use
ENERGY POLICY August 1993 851

Baseload solar power
14
12
10
8
6
4
2
0 I 2 3 4 5 6 7 8 9 10 11 12 13 14 15 16 17 18 19 20 21 22 23 24
Hour
Figure 9. The resulting solar contribution to the load pattern using maximum solar with storage (including solar superheating)? aThe solar fraction is about 92.5% of the total load, and the natural gas back up requirement is 7.5% (indicated by the vertical thin white areas). If superheating were done by natural gas, the solar fraction would still be about 82%. Observe the striking match between this solar supply profile and the load profile shown in Figure 6.
of a smaller power block (ie conversion turbine and generation equipment) than a peaking plant, be- cause the installed capacity is less. In peaking and load matched plants, the relative sizes of the associ- ated power block varies, in a first approximation, as the ratio of the capacity factors of the peaking and load matched hybrid plants. Thus, for peaking and load following plants of 23% and 72% capacity factors respectively, the turbine of the load following plant is only 23/72 = 32% of the size of the turbine utilized in a peaking plant of similar annual electric- ity production or array area. 3l In the load following case, the plant has a smaller installed capacity but generates output around the clock, whereas in the peaking case, the plant has a higher installed capac- ity but produces power only when the sun shines.
Curiously, this factor can lead to cheaper electric- ity from a load following solar plant than from a peaking solar plant of the same annual output. The smaller power block in a load following plant re- duces capital cost substantially, which offsets the added cost of building the storage system. If thermal energy storage proves to be sufficiently economical, then the load following plant could be less expensive to build. Initial estimates indicate that in Australia, load following solar electricity may be about 0.5¢/ kWh cheaper than peaking solar electricity for this reason. Of course, this may have little immediate relevance for many of today's utilities. Given the prevalence of inflexible plants on today's supply grid, the higher cost of peak electricity may be more than offset by its greater value to the utility, which is why near-term solar plants are most likely to be peaking plants.
Summary To summarize the major points of the paper thus far, it appears that the full benefits of solar thermal technology can be reaped by making several impor- tant improvements. These include:
• incorporating significant cost saving technical im- provements such as better selective surfaces and vacuum insulated header pipes;
• polar tracking orientat ion using parabolic troughs;
• low concentration, which allows for smaller collectors, less stringent engineering tolerances, and higher diffuse radiation acceptance;
• use of passive heat transfer techniques; and • incorporation of thermal storage and natural gas
back up to greatly enhance solar energy dispatch- ability, and possibly reduce overall conversion costs.
Preliminary economic and environmental analysis
The economic costs and environmental impact of solar/natural gas hybrid plants are considered briefly below. The calculations offered here are preliminary approximations which will require eventual refine- ment and full validation in a comprehensive econo- mic and environmental analysis. Nevertheless, this analysis suggests that the economics of advanced solar thermal plants with storage and natural gas back up could be quite favourable.
Sample calculations are presented below for the cost of electricity generated from an advanced solar/
852 ENERGY POLICY August 1993
storage hybrid plant, with natural gas back up and incorporating the technological improvements dis- cussed above. CO2 emissions are compared to two other technological options: natural gas combined cycle (NGCC), which is the lowest emission fossil fuel competi tor currently available; and a technolo- gy still under development, the solid oxide fuel cell (SOFC) running a steam cycle second stage, which is often touted as a promising option for the future. 32 The thermal to electric conversion efficiency is assumed to be 0.45 for NGCC, and 0.80 for SOFC beyond the year 2005. For solar, this is taken to be 0.37. A conservative solar scenario using natural gas for superheating is used, but the gas consumption could almost be cut in half in region 1 (see Figure 4) using solar superheating, with a corresponding re- duction in CO2 emissions.
Although the electricity cost estimated below is higher than some polluting baseload coal fired gen- eration, it is much closer to the utility generation cost when the replacement of expensive peaking plant is accounted for, and it is less than the current average of new US generation costs. Distributed grid benefits would also be significant, but have not been accounted for. Infrastructure charges would be minimal, compared to, say, nuclear electricity.
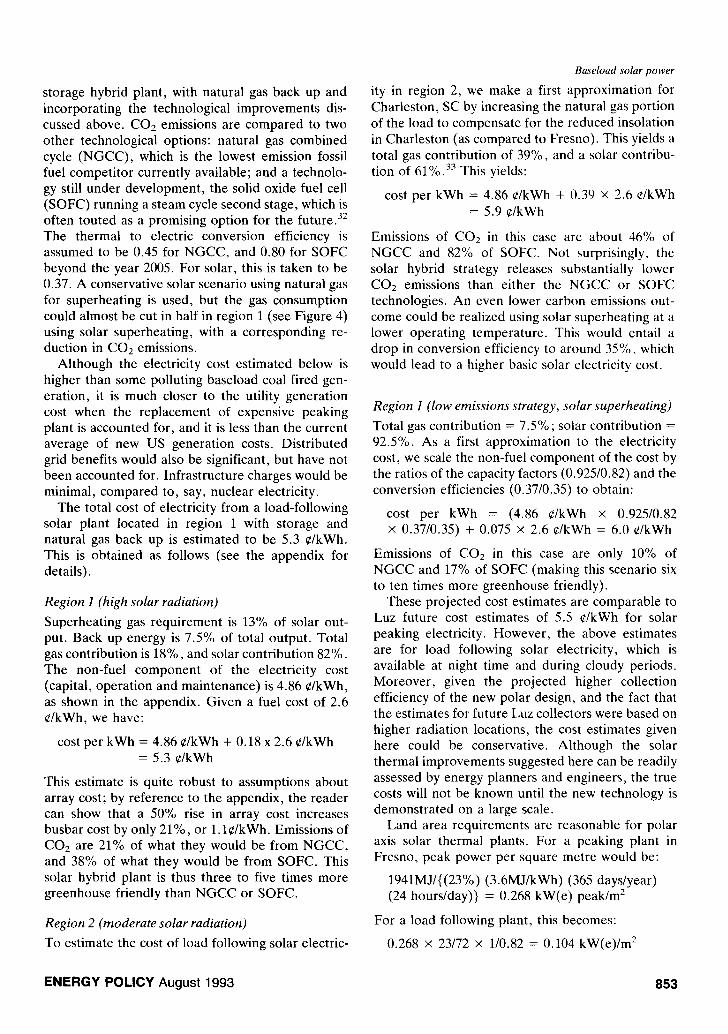
The total cost of electricity from a load-following solar plant located in region 1 with storage and natural gas back up is estimated to be 5.3 C/kWh. This is obtained as follows (see the appendix for details).
Region I (high solar radiation)
Superheating gas requirement is 13% of solar out- put. Back up energy is 7.5% of total output. Total gas contribution is 18%, and solar contribution 82%. The non-fuel component of the electricity cost (capital, operation and maintenance) is 4.86 C/kWh, as shown in the appendix. Given a fuel cost of 2.6 C/kWh, we have:
cost per kWh = 4.86 c/kWh + 0.18 x 2.6 C/kWh = 5.3 C/kWh
This estimate is quite robust to assumptions about array cost; by reference to the appendix, the reader can show that a 50% rise in array cost increases busbar cost by only 21%, or 1.1C/kWh. Emissions of CO2 are 21% of what they would be from NGCC, and 38% of what they would be from SOFC. This solar hybrid plant is thus three to five times more greenhouse friendly than NGCC or SOFC.
Region 2 (moderate solar radiation)
To estimate the cost of load following solar electric-
Baseload solar power
ity in region 2, we make a first approximation for Charleston, SC by increasing the natural gas portion of the load to compensate for the reduced insolation in Charleston (as compared to Fresno). This yields a total gas contribution of 39%, and a solar contribu- tion of 61%. 33 This yields:
cost per kWh = 4.86 C/kWh + 0.39 x 2.6 c/kWh = 5.9 C/kWh
Emissions of CO2 in this case are about 46% of NGCC and 82% of SOFC. Not surprisingly, the solar hybrid strategy releases substantially lower CO2 emissions than either the NGCC or SOFC technologies. An even lower carbon emissions out- come could be realized using solar superheating at a lower operating temperature. This would entail a drop in conversion efficiency to around 35%, which would lead to a higher basic solar electricity cost.
Region 1 (low emissions strategy, solar superheating)
Total gas contribution = 7.5% ; solar contribution = 92.5%. As a first approximation to the electricity cost, we scale the non-fuel component of the cost by the ratios of the capacity factors (0.925/0.82) and the conversion efficiencies (0.37/0.35) to obtain:
cost per kWh = (4.86 C/kWh x 0.925/0.82 x 0.37/0.35) + 0.075 x 2.6 C/kWh = 6.0 c/kWh
Emissions of CO2 in this case are only 10% of NGCC and 17% of SOFC (making this scenario six to ten times more greenhouse friendly).
These projected cost estimates are comparable to Luz future cost estimates of 5.5 C/kWh for solar peaking electricity. However, the above estimates are for load following solar electricity, which is available at night time and during cloudy periods. Moreover , given the projected higher collection efficiency of the new polar design, and the fact that the estimates for future Luz collectors were based on higher radiation locations, the cost estimates given here could be conservative. Although the solar thermal improvements suggested here can be readily assessed by energy planners and engineers, the true costs will not be known until the new technology is demonstrated on a large scale.
Land area requirements are reasonable for polar axis solar thermal plants. For a peaking plant in Fresno, peak power per square metre would be:
1941MJ/{(23%) (3.6MJ/kWh) (365 days/year) (24 hours/day)} = 0.268 kW(e) peak/m 2
For a load following plant, this becomes:
0.268 x 23/72 x 1/0.82 = 0.104 kW(e)/m 2
ENERGY POLICY August 1993 853

Baseload solar power
Thus, each 100 MW(e) load-following plant would require about 1 km 2 of collector aperture area and about 4 km z of total land area at 72% capacity factor. The entire electricity generation of PG&E, the largest investor-owned utility in the world, could in principle be supplied from a square area of land 23 km a side - smaller yet if the best solar sites were utilized. Of course in practice, numerous smaller arrays spread around the grid would be much more beneficial and practical.
By utility standards, the foregoing economic analysis is admittedly rather crude. In particular, it is a single-level analysis, focusing on the cost of power while neglecting the value of that power to utilities. In part, this limited perspective is justified at this stage, because the value analysis would vary for different utilities having different load profiles and supply grid characteristics. In fact, PG&E's load profile is unusual, because for most summer peaking utilities, the peak continues well into the evening, which further strengthens the case for storage. In any case, it is clear that extensive engineering refine- ment, more field experience, and detailed economic and operational analysis will be needed before what we propose here could become a reality. Neverthe- less, from the above analysis it appears that in the relatively near future, solar thermal electricity in the USA could cost considerably less than electricity generated from conventional technologies. In par- ticular, load following solar thermal electricity may eventually be generated for 5-7 C/kWh in many areas of the USA. These bright prospects for the relative economics of solar thermal electricity are enhanced further if environmental externalities are taken into account, as these will favour renewable energy technologies.
Conclusions
Significant technical improvement in large-scale electricity generation from solar thermal technology appears feasible within the current decade. The performance of parabolic trough solar thermal pow- er plants may be increased by incorporating signifi- cant cost-saving technical improvements such as better selective surfaces; polar tracking orientation; and low concentration for higher diffuse radiation acceptance. Moreover, incorporating thermal ener- gy storage with solar thermal energy can greatly enhance solar energy availability and dispatchability to the utility. These improvements are relatively straightforward in engineering terms, and even further improvements may be possible. In addition to the designs discussed here, advanced two-axis
dish systems and Luz-type systems may also be competitive in high solar radiation areas (where diffuse radiation is less pronounced).
Preliminary economic estimates suggest that advancements in solar thermal technology could eventually produce load following solar thermal electricity for 5-7 C/kWh over large areas of the USA, an estimate which is relatively insensitive to assumptions about solar array cost. This busbar cost includes on site thermal energy storage and natural gas back up, which means that solar electricity would be available around the clock - closely following the utility's load profile. Although the economics of advanced solar thermal systems still await detailed analysis by energy planners, engineers and utility economists, the preliminary results here suggest that solar thermal technology could become highly com- petitive for new electricity supply relatively soon, possibly before the year 2000. Even if the estimated electricity cost were to be increased beyond these estimates, solar thermal technology would still be competitive in many areas, particularly as environ- mental externalities become incorporated into utility planning.
An interesting result that emerges from this study is that the optimal economic configuration for pro- ducing solar thermal electricity may be a power plant that has both storage and back up fuel. While at first glance it may seem that storage and back up capabi- lities are redundant, there may be an optimal mix of the two for plants located in sunny regions. For example, with a storage system that is capable of full rated output for just 8 to 12 hours, the night-time load and short interruptions due to clouds can be handled with ease, thereby minimizing the use of back up fuel. By the same token, for cloudy periods lasting a few days or longer, the back up fuel is utilized, thereby avoiding the need to build a huge storage facility to cover these relatively infrequent periods of extended cloudiness.
In the future, inexpensive load following solar thermal electricity could provide the baseload com- ponent that would allow other renewable energy supply options such as wind energy and photovoltaic power to increase their market share. Solar thermal plants also offer design flexibility. A plant installed today as a peaking or shoulder load plant with limited storage could easily be turned into a load following plant by adding more collector area and storage capacity. Thus early installations, which will most probably be peaking plants, can be adapted as the need for load following plants grows. Solar repowering of conventional plants is also an option.
The potential of solar thermal technologies is
854 ENERGY POLICY August 1993
enormous. The solar resource is geographically widely exploitable, and the plant construction time is relatively short. In view of the substantial US power plant retirements scheduled over the next two de- cades, now is the time to develop solar thermal technologies so that they can be a major indigenous supply option by the late 1990s. The US Department of Energy estimates that during the 1990s, over 100 GW of new capacity will be required in the USA, and some 600 GW will be required worldwide. 34 Solar thermal technologies are poised to compete for
Baseload solar power
large shares of this capacity in the USA and many other countries throughout the world that have sufficient solar insolation. Coupled with an unwaver- ing commitment to improving end-use energy effi- ciency, rapidly advancing technologies such as solar thermal, wind, and photovoltaic power can lead us out of our myopic dependence on old fashioned polluting technologies from the 20th and 19th cen- turies to a clean renewable energy future in the 21st century.
Appendix Example calculation: projected I00 MW(e) hybrid plant costs with storage and natural gas back up for a public utility
Economic calculations
In one existing Australian utility, the levelized real cost of generating baseload coal fired electricity is 2.85 C/kWh in US dollarsY Of this, black coal fuel cost is 1.04¢, opera- tion and maintenance cost is about 0.4¢, and levelized capital cost is 1.41¢ (the latter figure assumes a capital cost for large coal plants of US$1000 per kilowatt, a capacity factor of 70%, and typical utility finance terms eg 20 years' amortization and 7% real discount rate). Thus US$1000 of utility capital will be assumed to result in a levelized cost of 1.41C/kWh in a plant with 70% capacity factor. The cost of capital for private utilities may be higher, which would increase c o s t s . 36 Costs below are based on a conversion rate of AS1 = US$0.75.
Collector field cost
Electricity output from a polar-axis solar thermal plant located in Fresno (with vacuum insulated header tubes) is calculated to be 4995 x 0.37 x 1.05 = 1941 MJ(e) per m a per year (in mixed saturated and superheat operation, performance is 5% higher than in Table 1). Estimated installed collector field cost is US$161 per square metre, 37 equivalent to $602 per kW(e) for a peaking solar plant in Fresno with a capacity factor of 23% (no storage or back up). 38 For a load following solar plant with 72% capacity factor, the corresponding collector field cost is US$1885/ kW(e). The larger capacity factor requires a prop- ortionately larger energy input, hence a greater collector area is required for the load following plant (per unit capacity installed). Note that with solar technology, the capital cost per kilowatt (electric) can be highly misleading without knowledge of the capacity factor. In a solar hybrid plant, since gas provides some of the peak output, the actual cost of the solar field is somewhat less than just indicated. Under peak solar conditions, gas superheating supplies 13% of the output, while solar provides 87%. The collector field for the load following plant therefore costs 0.87 x US$1885 = US$1640 per peak kW(e).
Power block (turbine, conversion equipment)
The estimated cost is US$700 per kW(e).
Natural gas superheater
Small superheaters capable of superheating to 480°C can be purchased for US$485/peak kW(e), 39 but for a 100 MW(e) solar/gas hybrid peak plant these would only need to be designed to deliver about 13 MW(e) peak so the net cost would be 0.13 x US$485 = US$63 per peak kilowatt. For a load following solar plant with storage, natural gas will at times supply a significantly larger share of the load. Assuming that natural gas never has to supply more than half the peak load, the cost of the gas superheater is 0.50 x US$485 = US$243 per peak kilowatt. This figure is assumed to be the total cost of the gas back up system and superheater, although the true cost may actually be smal- ler for large units. 4°
Storage
Computer simulations show that for the PG&E load pattern, storage to about 34% of average load is sufficient to achieve the performance given. A 100 MW power plant operating at 72% capacity factor develops:
100 MW × 24 hours × 0.72 = 1728 MWh(e) per day
We thus need to store:
(0.34 x 1728)/0.37 (conversion efficiency) = 1588 MWh (thermal) per day (for each 100 MW of capacity instal- led).
Rock bed storage was estimated to cost US$39 293 per MWh(th) for a total of US$39 293 × 1588 = US$62 397, which is equivalent to US$624 kW(e). Heat losses in the storage unit would require a 3% enlargement of the solar array in compensation, which amounts to an extra US$49/ kW(e).
ENERGY POLICY August 1993 855
Baseload solar power
Total capital cost
Total for the load following plant at 72% cap factor is given as the sum of the various components = US$1640/ kW (solar array) + US$700/kW (power block) + US$243/ kW (gas back up and superheater) + US$624 ( thermal energy storage) + US$49/kW (storage loss allowance) = US$3256/kW(e). The capital cost per kilowatt hour of electricity is given as follows (using the same accounting as the Austral ian utility):
(3256/1000) × (0.70/0.72) × 1.41 cents = 4.46 ¢ per kWh
Thus capital costs of less than 5C/kWh seem to be achiev- able with near- term technology. Other utilities will have different load profiles, solar insolation, accounting tech- niques, and discount rates, so this cost has to be recalcu- lated for each utility. The cost of fuel and operat ion and maintenance is still to be added to the above figure, as indicated below.
Back up fuel and operation and maintenance (O&M) costs
For a load following storage plant in Fresno with 72% capacity factor and natural gas for superheat and back up fuel, about 82% of the output is supplied by solar and 18% by gas. Assuming that the price of natural gas translates into a fuel cost of 2.6 C/kWh(e) after conversion losses, 41 then the cost of gas fuel is 0.18 × 2.6C/kWh(e) = 0.47C/kWh. O & M is assumed to be 0.4C/kWh, the same as in an Austral ian coal fired plant. While this is substantially lower than in current Luz plants, there are several reasons to expect US O & M costs to be much lower: the evacuated tubes do not have bellows or glass to metal seals, and they are easy to replace (requiring no welding). No shutdown of any part of the plant is required for reflector or evacuated tube maintenance. There are no pumps in the collector field circuit, and the tracking technology is simpler. Thus we feel the low capital cost is justified because the collector technology is simpler and more durable.
Total electricity generation cost
The non-fuel component of electricity would cost 4.46 + 0.40 = 4.86C/kWh. Adding in fuel cost, the total busbar cost is 4.86 + 0.47 = 5.33C/kWh for load following electricity. This could drop below 5C/kWh in excellent solar regimes.
The authors gratefully acknowledge support for this work pro- vided by the Joyce Mertz Gilmore Foundation and The Energy Foundation. Basic research reported herein was supported by the Science Foundation for Physics of the University of Sydney, His Royal Highness Prince Nawaf of Saudi Arabia, and the Energy Research and Development Corporation of Australia. Grateful thanks are also due to Anthony Monger for his valuable assistance with calculations. We are grateful to Carl Weinberg of Pacific Gas and Electric Company for his encouraging feedback on an early draft, and to Michael Lotker and David Kearney (formerly with Luz International Ltd) for their very helpful and thorough reviews. Finally, we thank Pacific Gas and Electric Company for granting us permission to utilize their load data.
1Luz: Tomorrow's Energy Today (Luz International corporate literature), Kearney and Associates, 14022 Condesa Drive, Del Mar, CA 92014. 2D. Jaffe, S. Friedlander and D. Kearney, 'The Luz solar electric generating systems in California', Advances in Solar Energy, Proceedings ISES Congress, Hamburg, September 1987, Work- shop 2.W3, p 519. 3Radiative losses are proportional to the product and emittance and the fourth power of absolute temperature. 4Luz reports a much higher concentration ratio, which results from their use of a non-standard definition of concentration. The usual definition is the ratio of aperture area to receiver area, which for Luz collectors is 23 to 25. 5Diffuse radiation must be collected from a much larger angular segment of the sky than direct beam. There is an inverse relationship between the size of the angular acceptance angle and the concentration factor. An upper bound on the concentration C is given by C= 1/sin(0) where 0 is the half angle of acceptance. For a parabolic trough, C is less than this. 6Next generation Luz plants were designed for direct steam generation, rather than using oil as a heat transfer fluid. A consortium of European and US utilities is exploring the possibil- ity of continuing the development of direct steam generation technology. 7Luz International Ltd, Newsletter, Vol 5, No 1 and Publications FM16, FM20, Communications Dept, April 1989. SD. Wilson, Study of the Potential for a Solar Thermal Power Station in Victoria, Report for the State Electricity Commission of Victoria, Australia, August 1990. 9National Energy Strategy, US Government, Washington DC, February 1991, Figure 29, p 100. 1°The Potential of Renewable Energy: An Interlaboratory White Paper, US Department of Energy, SERI/TP-260-3674, DE90000322, March 1990, p G-10. 11N.D. Becker, 'The demise of Luz: a case study', Solar Today, January/February 1992, pp 24-26. lZM. Lotker, Barriers to Commercialization of Large-Scale Solar Electricity: Lessons Learned from the Luz Experience, SAND91- 7014, Sandia National Laboratories, US Department of Energy, November 1991. 13S. Kaneff, Solar Thermal Process Heat and Electricity Genera- tion Performance and Costs for the ANU 'Big Dish" Technology: A Comparison with Luz System costs, Report EP-RR-57, Energy Research Centre, Australian National University, 1991. 14At the equator the collector would be ground mounted, much like the Luz collector. 15This is true for polar-axis orientation, but if any bias toward one season or another were undertaken for seasonal load matching, then annual performance would decrease. 16D.R. Mills, High Temperature Solar Evacuated Tube for Ap- plications above 300 °C, Energy Research and Development Corporation final grant report No 1368, Department of Primary Industries and Energy, Canberra, ACT 2601, Australia, 1991; Q.C. Zhang and D.R. Mills, 'Very low emittance solar selective surface using new film structures', Journal of Applied Physics Letters, January 1992. ~7W. Pekruhn, L.K. Thomas, I. Broser, A. Schroder and U. Wenning, Solar Energy Materials, Vol 13, No 199, 1986. lSAs this article goes to press, the best laboratory specimen has yielded a preliminary measurement of 58. Hence, the perform- ance of advanced solar collectors summarized in this article may be superseded by substantial improvements in the near future. 19Water reaches the triple point above 370 °C under saturation conditions, and assumes a single phase, not suitable for boiling heat transfer. The pumpless system should be transferable to large systems. 2°The quantity of diffuse radiation depends on the cloud cover, and varies by region. The associated performance increase is more pronounced in regions of lower insolation. 2~System modelling method described in D.R. Mills, A. Monger and G.L. Morrison, 'Comparison of asymmetrical and symmetric- al reflectors for east-west circular cylindrical solar receivers',
856 ENERGY POLICY August 1993
presented to the International Solar Energy Society Congress, Denver, 1991; Qi-Chu Zhang, J.C. Kelly and David R. Mills, Journal of Applied Physics, Vol 68, No 4788, 1990. 22SOLMET, Hourly Insolation-Surface Meteorological Observa- tions, TD 9724, 1979, National Climate Center, Asheville, NC 28801. 23Annual system conversion efficiency from solar energy to steam would be around 54-60% (on an annual basis) in region 1 with vacuum insulated polar designs operating near 300°C. 24Storage plants must compete with overall energy supply costs, whereas peaking plants compete only against high peak rates. 25D.R. Mills and G.L. Morrison, Solid Energy Storage System For Industrial Heat Applications, Engineering feasibility study for the Local Government Electricity association of NSW, Australia, May 1991. The authors wish to apologize for citing a currently confidential report, but this is the only recent work known. This steam/air/steam rock bed system may be regarded as related to that described in the following two references, but was indepen- dently developed as the most cost effective and practical system and does not utilize sodium coolant or large temperature varia- tions. 26L.j. Dubberly, J. Gormley, W. Lang, D. Liffengren, A. McKenzie and R. Porter, Cost and Performance of Thermal Storage Concepts in Solar Thermal Systems Phase 2, SERI/TR- XP-0-9001-1-B, Golden, CO, Solar Energy Research Institute, 1981; L.J. Dubberly, J. Gormley, W. Lang, D. Liffengren, A. McKenzie and R. Porter, Comparative Ranking Solar Thermal Systems, Volume H Cost and Performance of Thermal Storage Concepts in Storage Systems, Phase 1, SERI/TR-631-1283. Gol- den, CO, Solar Energy Research Institute, 1983. These sodium/ air/sodium systems use much larger temperature swings than in the previous reference, and would not be suitable for polar axis trough storage. 27C.j. Swet, 'Energy storage for solar systems', Chapters 14-19 in E. de Winter, ed, Solar Collectors, Energy Storage, and Materials, MIT Press, Cambridge, MA, 1990. 28phase-Change Thermal Energy Storage, SERI/STR-250-3516, DE89009426, Solar Energy Research Institute (SERI), Golden, CO, November, 1989. 29L.L. Hull, 'Solar thermal electricity: an environmentally benign and viable alternative', Proceedings of the World Clean Energy Conference, November 1991, p 350. Available from CMDC, Kellerweg, 38, POB 928, CH 8055, Zurich. 3°This is obtained as follows: to 92.5 units of solar must be added 7.5 units of gas backup and 13 units of gas superheat. Solar fraction is 92.5/113 = 0.82 of total energy supplied. 31This is a first approximation only, as this calculation implicitly
Baseload solar power
assumes a given shape for the load curve, which in this case is the PG&E load curve in Figures 5 and 6. 32Mostly laboratory models running at present, second stage steam cycle undemonstrated. Longevity and cost are uncertain, although some estimates of US4-5 C/kWh have been recently made for the CSIRO fuel cell in Australia. 3aThis procedure is acceptable as a first approximation, which is adequate for these preliminary calculations. This assumes that the exact same plant would be built in Charleston as in Fresno, although the Charleston plant may actually require somewhat more gas-fired capital equipment because a larger share of the energy is produced from gas. Also, gas is not necessarily available or inexpensive in all parts of region 2. A more accurate estimate would include several other refinements eg the replacement of PG&E's load profile with correct load profiles for utilties in region 2. 34Solar 2000: A Collaborative Strategy, Office of Solar Energy Conversion, US Department of Energy, Washington, DC, Febru- ary 1992, p 1. 35In levelized real terms, the average electricity generation cost - including intermediate and peak load electricity - is of course much higher than this. 36Capital for solar power plants in the USA is currently quite expensive, if indeed it can be obtained at all. However, as political sentiment and environmental concerns mount to favour renewable energy development, these conditions could change in the relatively near future. 37Variations in exchange rates would affect estimates. 38Based on estimates carried out by the University of Sydney, Australia for an assumed 100 MW plant. Installed collector capital cost A$215 per square metre, using imported US stainless steel tubing (at 30% higher cost than in the USA), imported glass stock for evacuated tubes, and imported reflector material. This includes a 35% markup on large collector array sales. Costs in the USA may be lower because much of this material could be supplied locally. The power block would also be imported. It is believed that significant reductions in insulation costs and other components can be achieved. 39price quotation from Maxitherm Ltd, Sydney, Australia. 4°In practice, depending on detailed design considerations and the share of plant output from natural gas, other ways to incorporate gas backup could be utilized (eg combined cycle technology) if they led to better overall heat rates. 41Securing America's Energy and Environmental Future: A Least Cost Strategy, Union of Concerned Scientists, Washington, DC, p 19.
ENERGY POLICY August 1993 857