basf q4 fy2016
TRANSCRIPT
Analyst Conference Call Full Year 2016
Ludwigshafen, February 24, 2017
BASF FY 2016 Analyst Conference Call, February 24, 2017 2
Cautionary note regarding
forward-looking statements
This presentation contains forward-looking statements. These statements are based on
current estimates and projections of BASF management and currently available
information. Future statements are not guarantees of the future developments and results
outlined therein. These are dependent on a number of factors; they involve various risks
and uncertainties; and they are based on assumptions that may not prove to be accurate.
Such factors include those discussed in the Opportunities and Risks Report from pages
111 to 118 of the BASF Report 2016. We do not assume any obligation to update the
forward-looking statements contained in this presentation.
BASF FY 2016 Analyst Conference Call, February 24, 2017 3
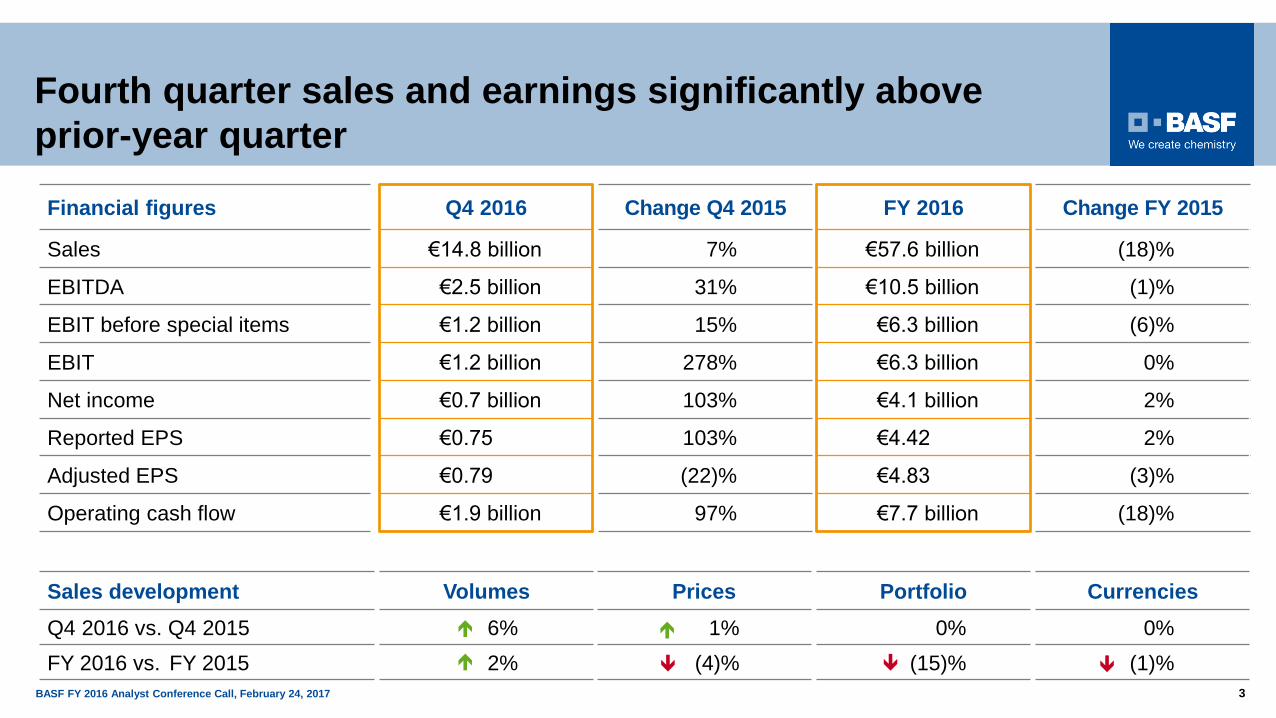
Fourth quarter sales and earnings significantly above
prior-year quarter
Financial figures Q4 2016 Change Q4 2015 FY 2016 Change FY 2015
Sales €14.8 billion 7% €57.6 billion (18)%
EBITDA €2.5 billion 31% €10.5 billion (1)%
EBIT before special items €1.2 billion 15% €6.3 billion (6)%
EBIT €1.2 billion 278% €6.3 billion 0%
Net income €0.7 billion 103% €4.1 billion 2%
Reported EPS €0.75 103% €4.42 2%
Adjusted EPS €0.79 (22)% €4.83 (3)%
Operating cash flow €1.9 billion 97% €7.7 billion (18)%
Sales development Volumes Prices Portfolio Currencies
Q4 2016 vs. Q4 2015 6% 1% 0% 0%
FY 2016 vs. FY 2015 2% (4)% (15)% (1)%
BASF FY 2016 Analyst Conference Call, February 24, 2017 4
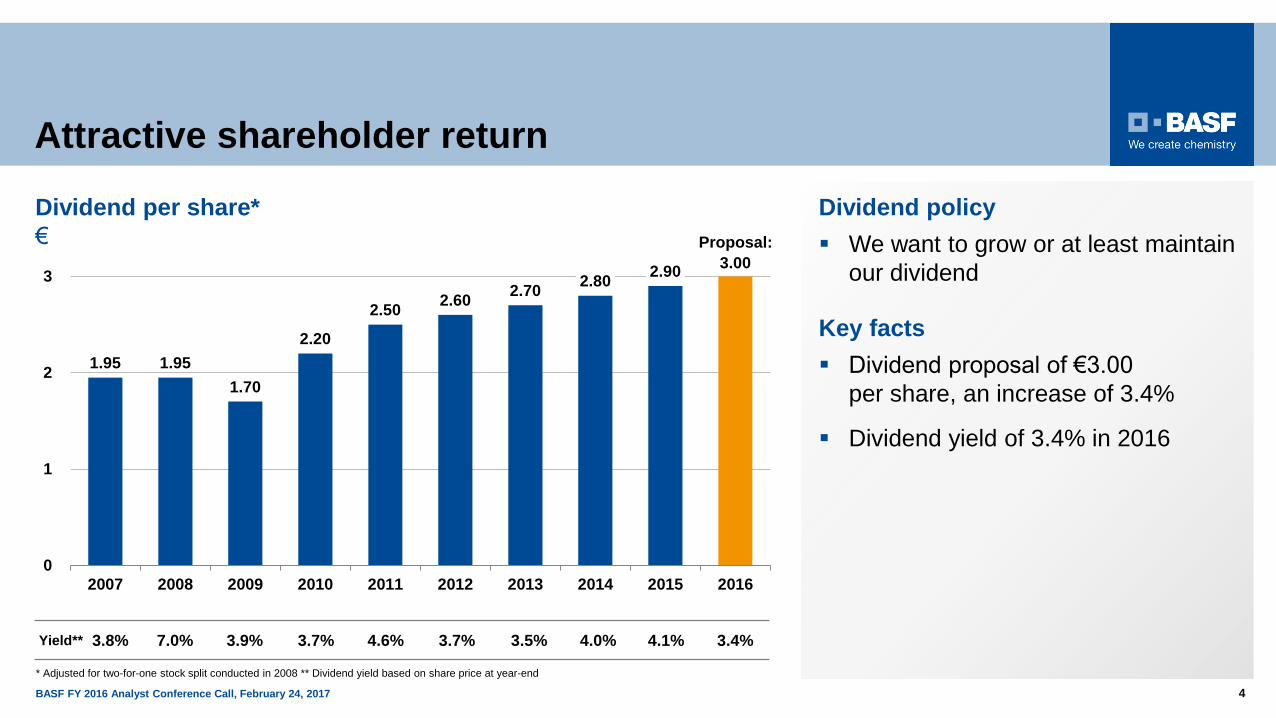
Attractive shareholder return
Dividend policy
We want to grow or at least maintain
our dividend
Key facts
Dividend proposal of €3.00
per share, an increase of 3.4%
Dividend yield of 3.4% in 2016
Dividend per share*
€
1.95 1.95
1.70
2.20
2.502.60
2.702.80
2.903.00
0
1
2
3
2007 2008 2009 2010 2011 2012 2013 2014 2015 2016
Yield** 3.8% 7.0% 3.9% 3.7% 4.6% 3.7% 3.5% 4.0% 4.1% 3.4%
Proposal:
* Adjusted for two-for-one stock split conducted in 2008 ** Dividend yield based on share price at year-end
BASF FY 2016 Analyst Conference Call, February 24, 2017 5
Milestones Q4 2016
Acquisition of
Chemetall closed
Divestiture of
industrial coatings
business completed
BASF to increase
MDI capacity in
North America
BASF to increase
capacity of
plastic additives
production network
BASF FY 2016 Analyst Conference Call, February 24, 2017 6
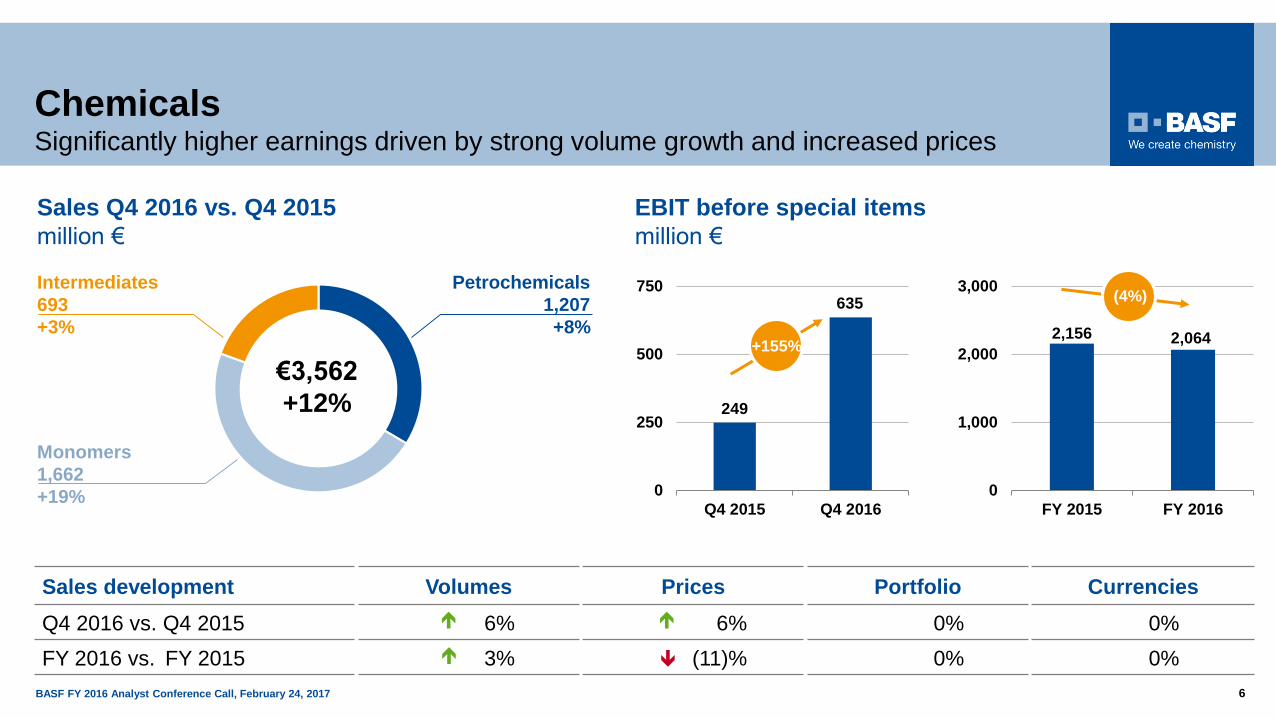
ChemicalsSignificantly higher earnings driven by strong volume growth and increased prices
Intermediates
693
+3%
Monomers
1,662
+19%
Petrochemicals
1,207
+8%
€3,562
+12%
Sales Q4 2016 vs. Q4 2015
million €
Sales development Volumes Prices Portfolio Currencies
Q4 2016 vs. Q4 2015 6% 6% 0% 0%
FY 2016 vs. FY 2015 3% (11)% 0% 0%
EBIT before special items
million €
249
635
0
250
500
750
Q4 2015 Q4 2016
+155%
2,156 2,064
0
1,000
2,000
3,000
FY 2015 FY 2016
(4%)
BASF FY 2016 Analyst Conference Call, February 24, 2017 7
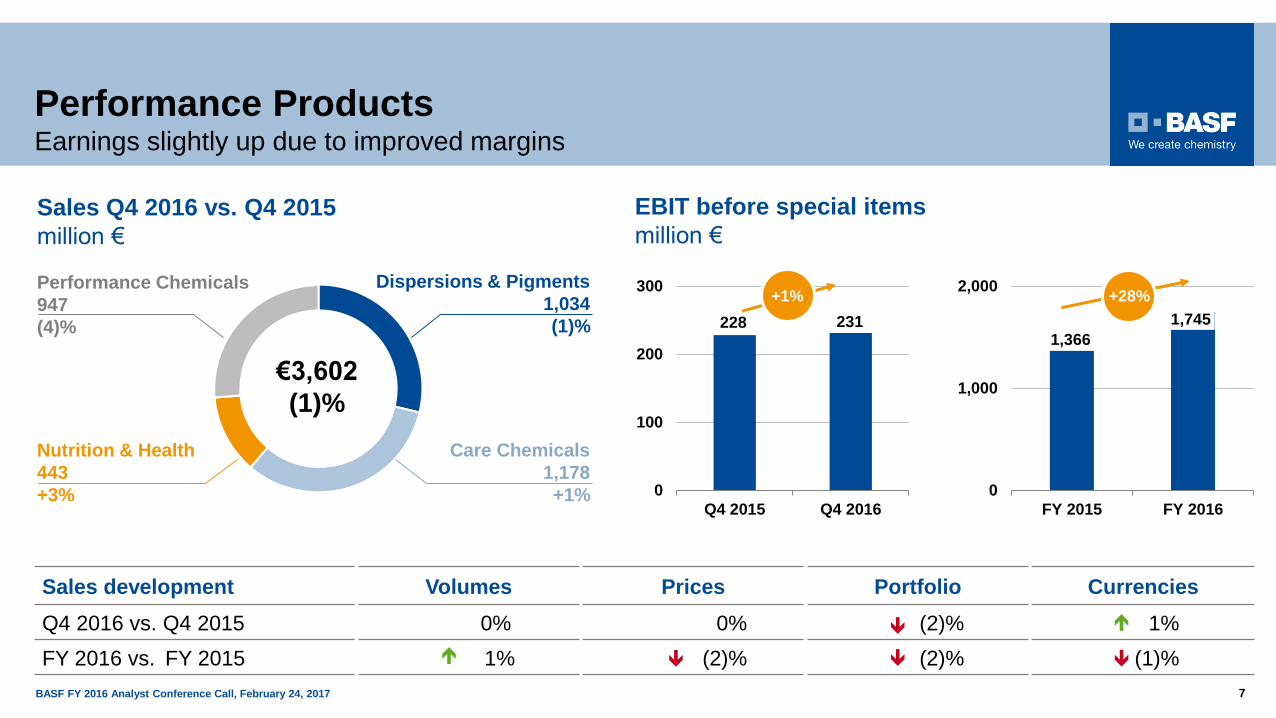
Performance ProductsEarnings slightly up due to improved margins
Performance Chemicals
947
(4)%
Nutrition & Health
443
+3%
Dispersions & Pigments
1,034
(1)%
€3,602
(1)%
Sales development Volumes Prices Portfolio Currencies
Q4 2016 vs. Q4 2015 0% 0% (2)% 1%
FY 2016 vs. FY 2015 1% (2)% (2)% (1)%
Care Chemicals
1,178
+1%
228 231
0
100
200
300
Q4 2015 Q4 2016
+1%
Sales Q4 2016 vs. Q4 2015
million €
EBIT before special items
million €
1,366
1,745
0
1,000
2,000
FY 2015 FY 2016
+28%
BASF FY 2016 Analyst Conference Call, February 24, 2017 8
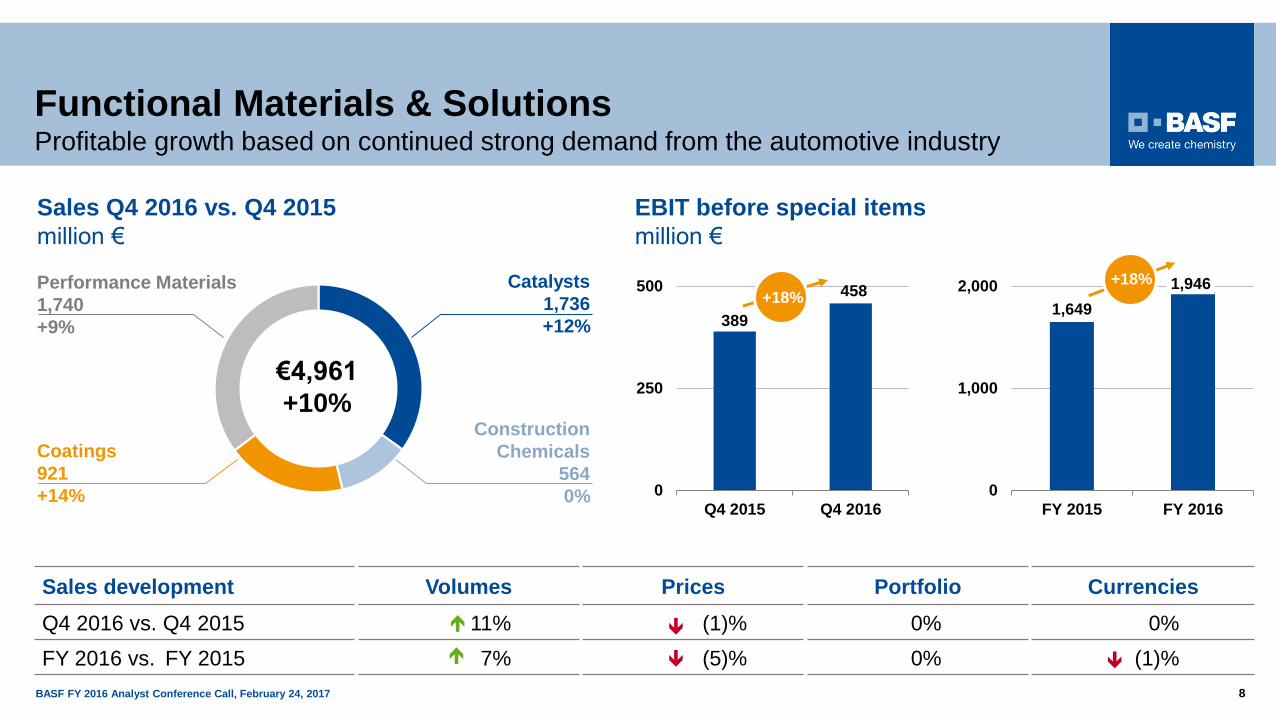
1,649
1,946
0
1,000
2,000
FY 2015 FY 2016
Functional Materials & Solutions Profitable growth based on continued strong demand from the automotive industry
Coatings
921
+14%
Catalysts
1,736
+12%
Sales development Volumes Prices Portfolio Currencies
Q4 2016 vs. Q4 2015 11% (1)% 0% 0%
FY 2016 vs. FY 2015 7% (5)% 0% (1)%
389
458
0
250
500
Q4 2015 Q4 2016
+18%
Construction
Chemicals
564
0%
Performance Materials
1,740
+9%
€4,961
+10%
Sales Q4 2016 vs. Q4 2015
million €
EBIT before special items
million €
+18%
BASF FY 2016 Analyst Conference Call, February 24, 2017 9
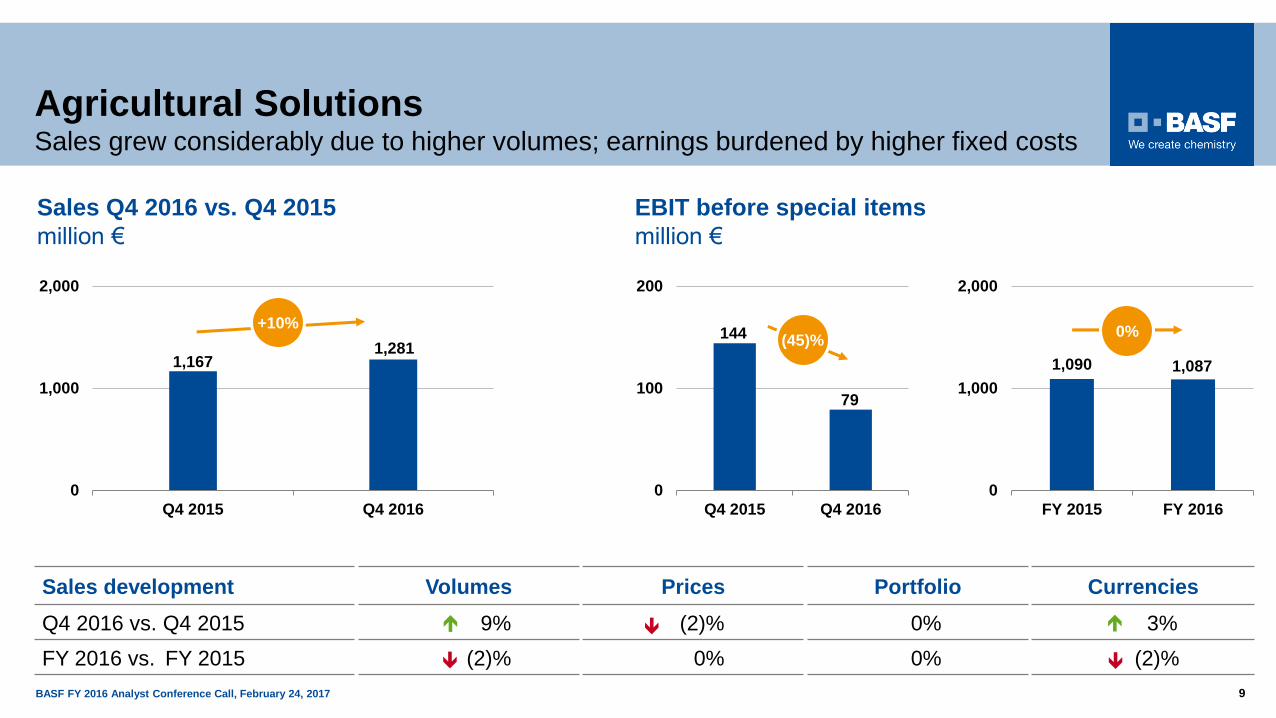
1,090 1,087
0
1,000
2,000
FY 2015 FY 2016
Agricultural SolutionsSales grew considerably due to higher volumes; earnings burdened by higher fixed costs
Sales development Volumes Prices Portfolio Currencies
Q4 2016 vs. Q4 2015 9% (2)% 0% 3%
FY 2016 vs. FY 2015 (2)% 0% 0% (2)%
144
79
0
100
200
Q4 2015 Q4 2016
(45)%
+10%
Sales Q4 2016 vs. Q4 2015
million €
EBIT before special items
million €
0%
1,1671,281
0
1,000
2,000
Q4 2015 Q4 2016
BASF FY 2016 Analyst Conference Call, February 24, 2017 10
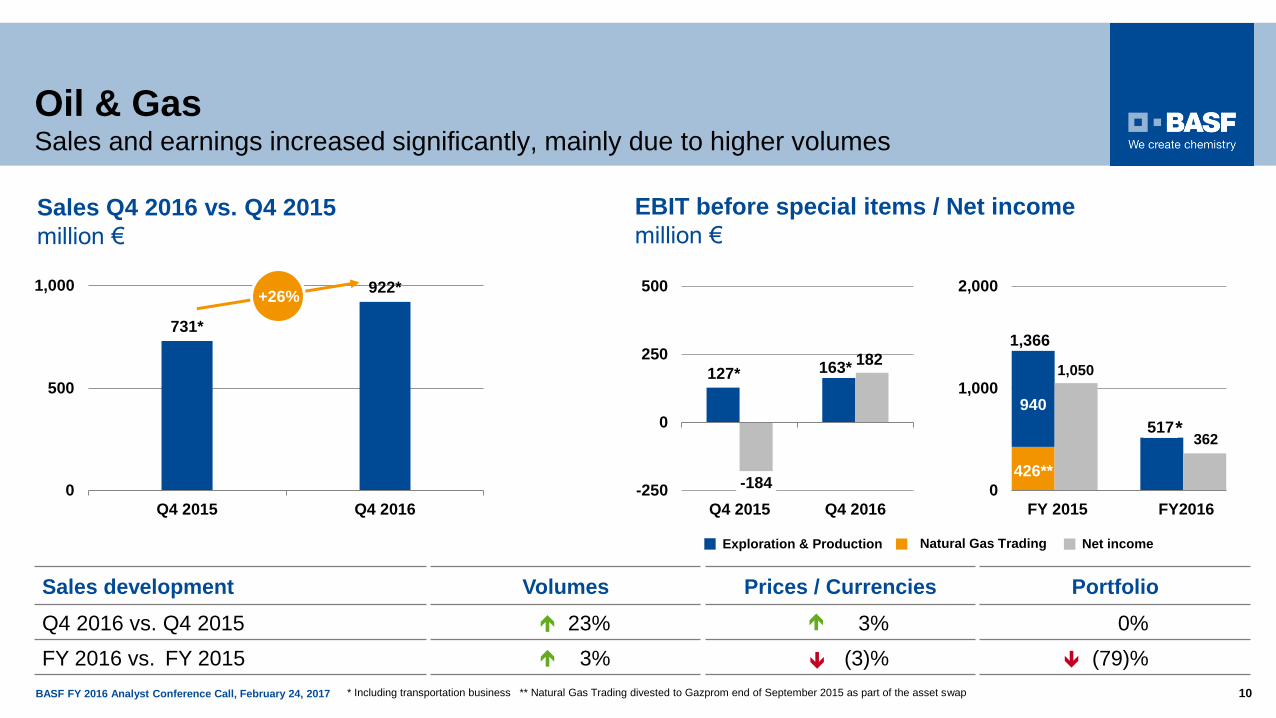
Oil & GasSales and earnings increased significantly, mainly due to higher volumes
Sales development Volumes Prices / Currencies Portfolio
Q4 2016 vs. Q4 2015 23% 3% 0%
FY 2016 vs. FY 2015 3% (3)% (79)%
EBIT before special items / Net income
million €
731*
922*
0
500
1,000
Q4 2015 Q4 2016
+26%
127* 163*
-184
182
-250
0
250
500
Q4 2015 Q4 2016
Natural Gas TradingExploration & Production Net income
* Including transportation business ** Natural Gas Trading divested to Gazprom end of September 2015 as part of the asset swap
Sales Q4 2016 vs. Q4 2015
million €
1,000
426**
940
517
1,050
362
0
1,000
2,000
FY 2015 FY2016
1,366
*
BASF FY 2016 Analyst Conference Call, February 24, 2017 11
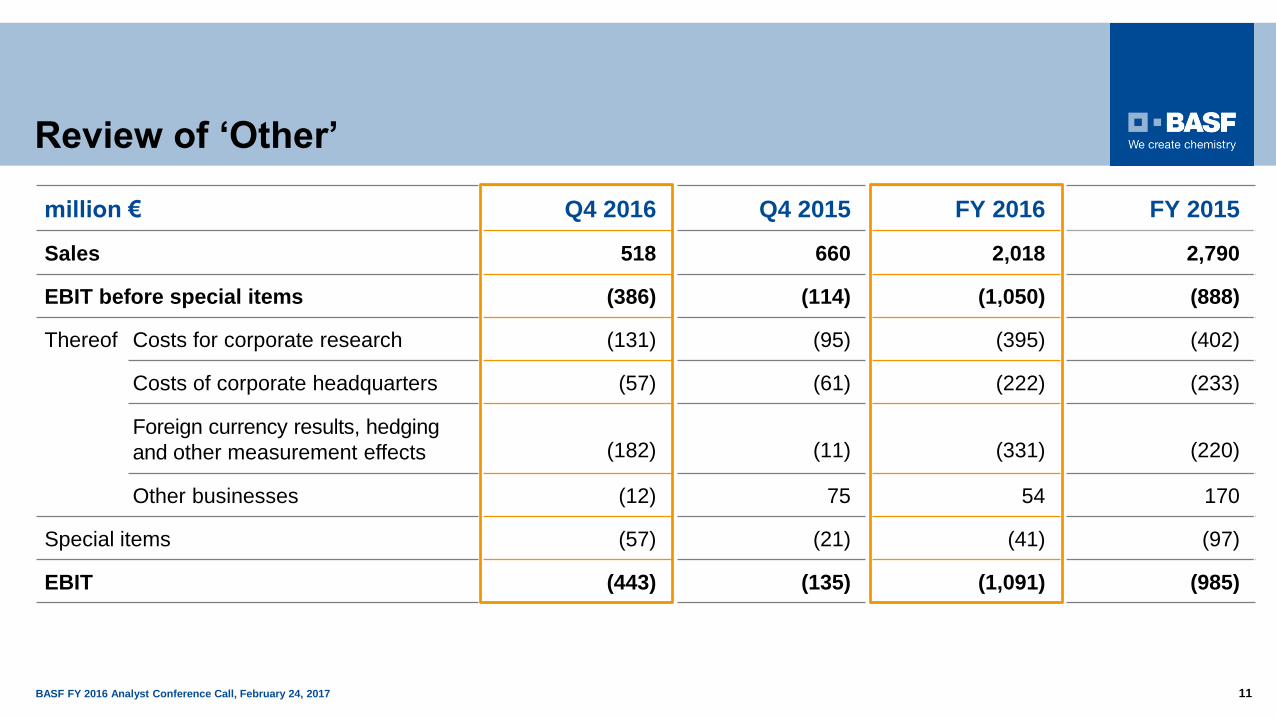
Review of ‘Other’
million € Q4 2016 Q4 2015 FY 2016 FY 2015
Sales 518 660 2,018 2,790
EBIT before special items (386) (114) (1,050) (888)
Thereof Costs for corporate research (131) (95) (395) (402)
Costs of corporate headquarters (57) (61) (222) (233)
Foreign currency results, hedging
and other measurement effects (182) (11) (331) (220)
Other businesses (12) 75 54 170
Special items (57) (21) (41) (97)
EBIT (443) (135) (1,091) (985)
BASF FY 2016 Analyst Conference Call, February 24, 2017 12
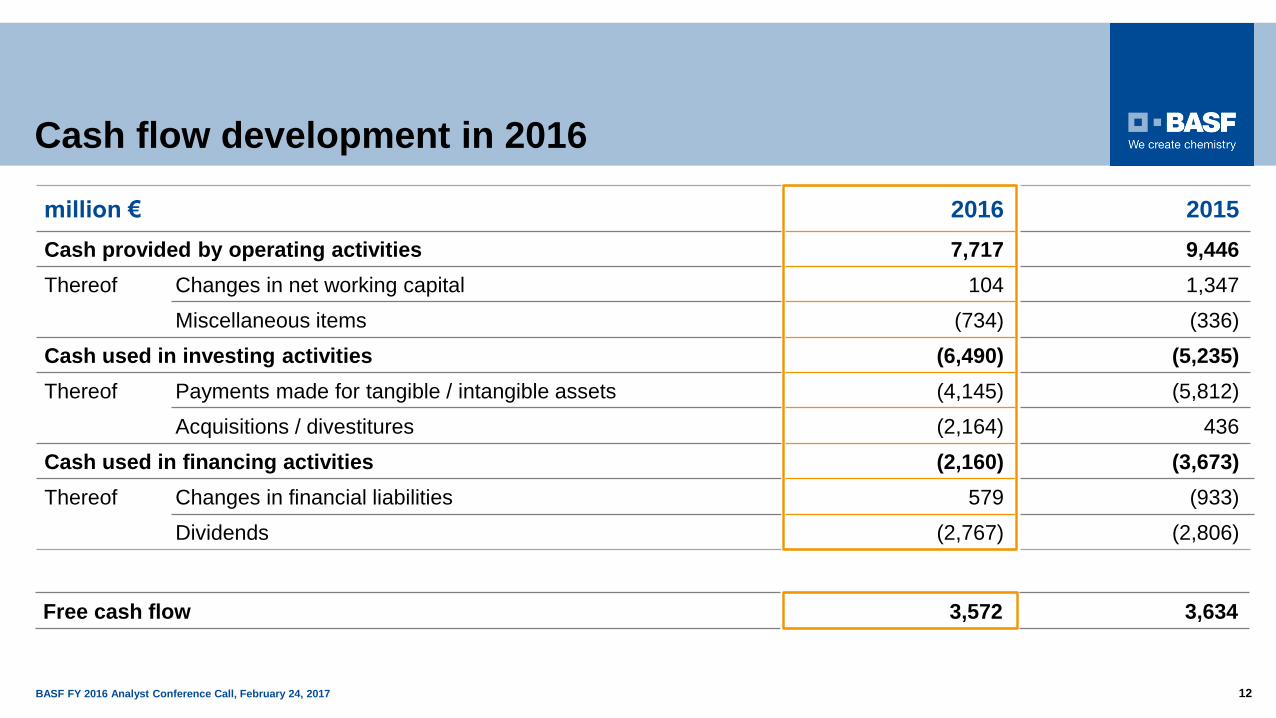
Cash flow development in 2016
million € 2016 2015
Cash provided by operating activities 7,717 9,446
Thereof Changes in net working capital 104 1,347
Miscellaneous items (734) (336)
Cash used in investing activities (6,490) (5,235)
Thereof Payments made for tangible / intangible assets (4,145) (5,812)
Acquisitions / divestitures (2,164) 436
Cash used in financing activities (2,160) (3,673)
Thereof Changes in financial liabilities 579 (933)
Dividends (2,767) (2,806)
Free cash flow 3,572 3,634
BASF FY 2016 Analyst Conference Call, February 24, 2017 13
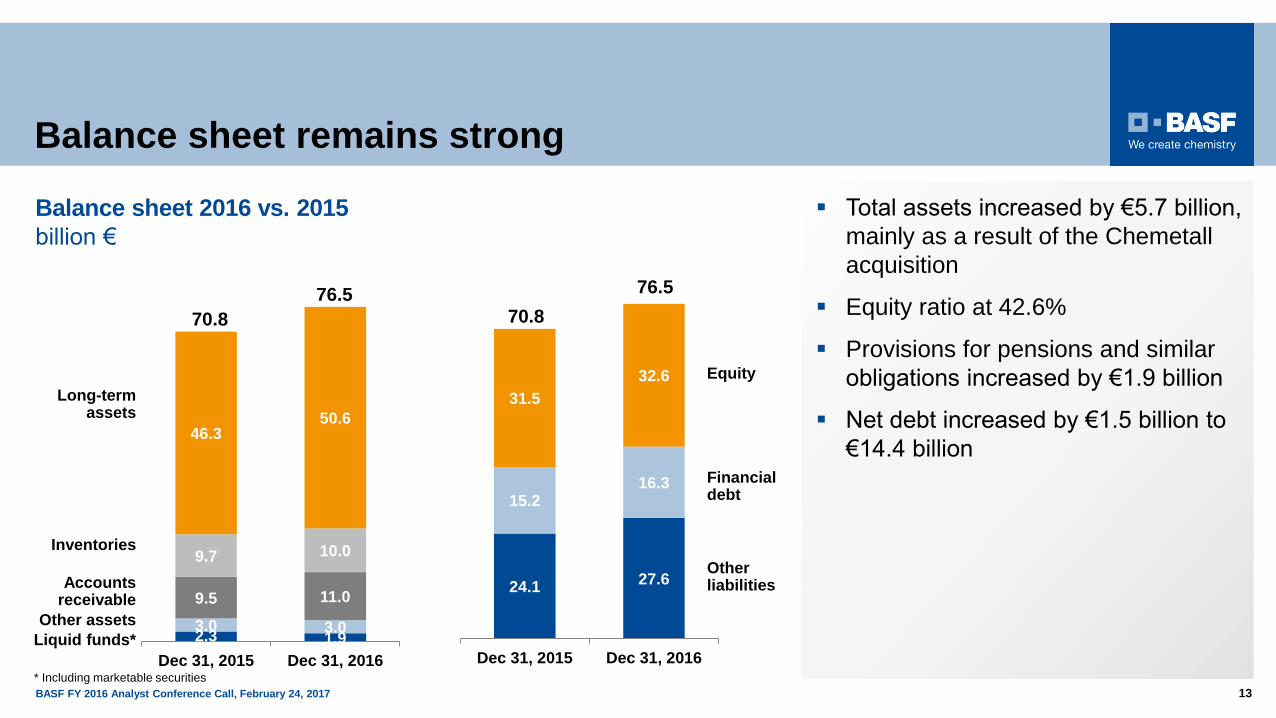
Balance sheet remains strong
Total assets increased by €5.7 billion,
mainly as a result of the Chemetall
acquisition
Equity ratio at 42.6%
Provisions for pensions and similar
obligations increased by €1.9 billion
Net debt increased by €1.5 billion to
€14.4 billion
Balance sheet 2016 vs. 2015
billion €
24.127.6
15.216.3
31.5
32.6
Dec 31, 2015 Dec 31, 2016
2.3 1.93.0 3.0
9.5 11.0
9.7 10.0
46.350.6
Dec 31, 2015 Dec 31, 2016
Liquid funds*
Accountsreceivable
Long-termassets
Inventories
Other assets
70.8
76.570.8
76.5
Otherliabilities
Financialdebt
Equity
* Including marketable securities
BASF FY 2016 Analyst Conference Call, February 24, 2017 14
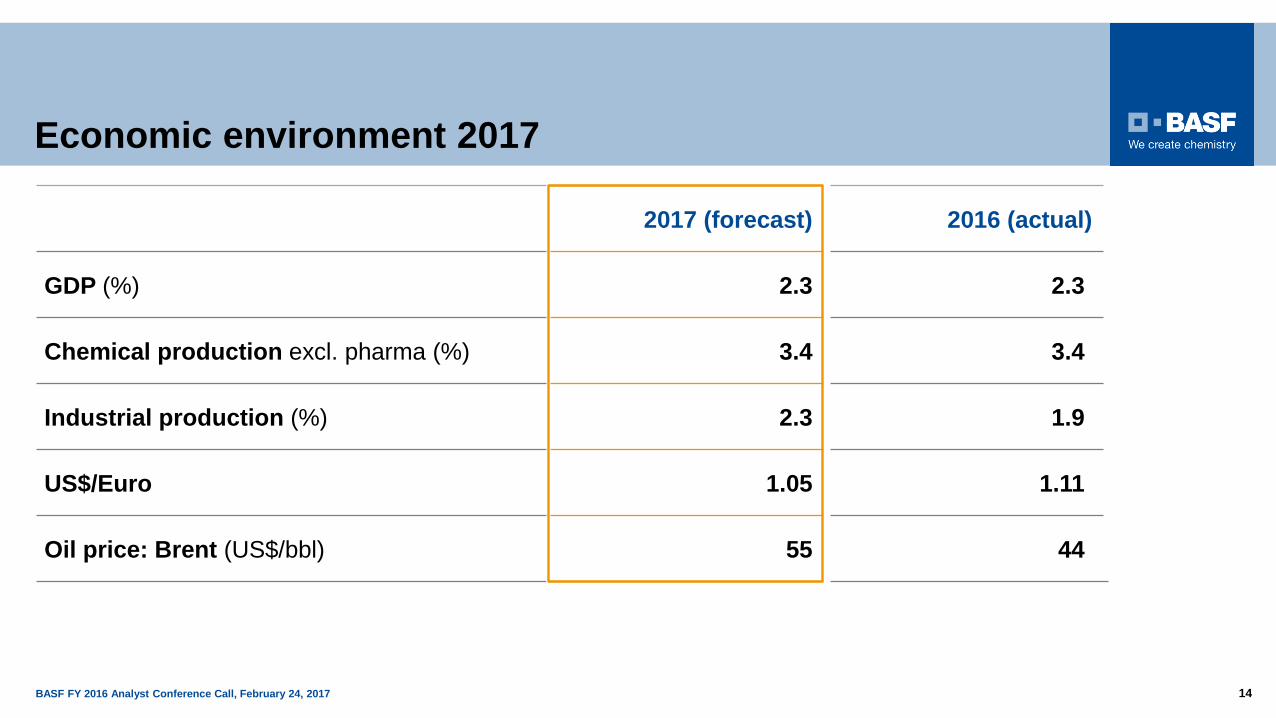
Economic environment 2017
2017 (forecast) 2016 (actual)
GDP (%) 2.3 2.3
Chemical production excl. pharma (%) 3.4 3.4
Industrial production (%) 2.3 1.9
US$/Euro 1.05 1.11
Oil price: Brent (US$/bbl) 55 44
BASF FY 2016 Analyst Conference Call, February 24, 2017 15
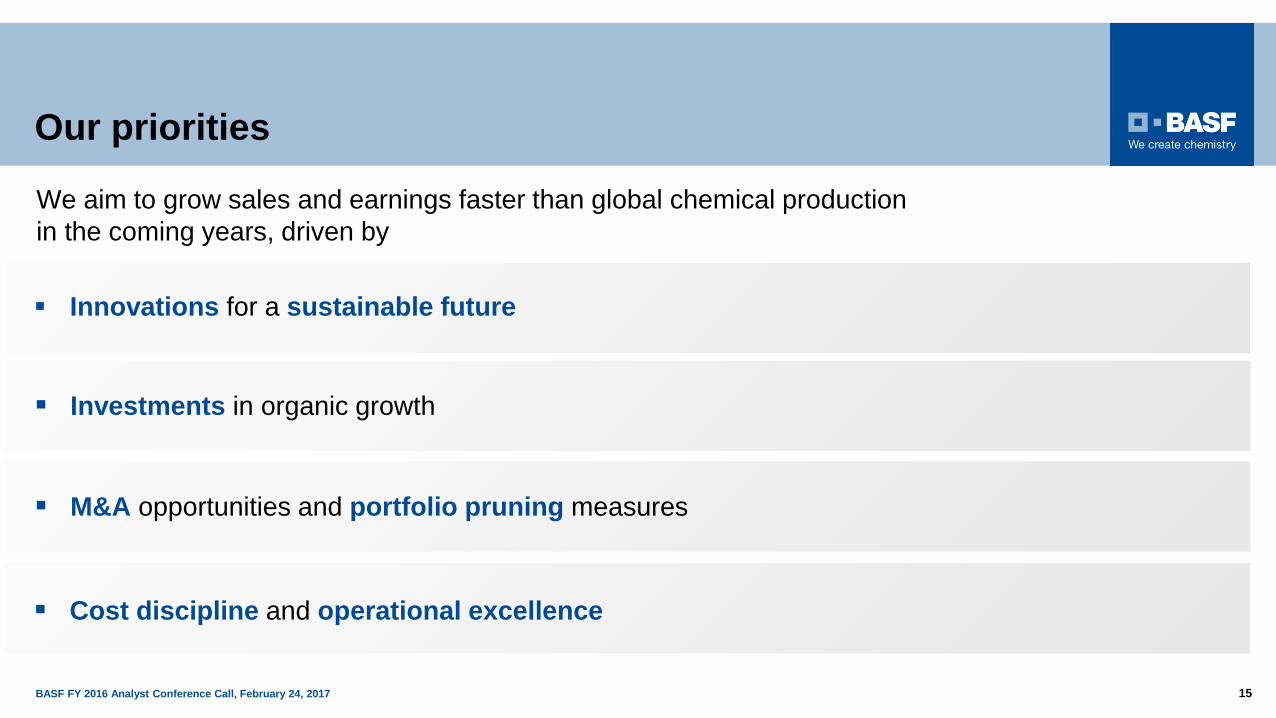
Innovations for a sustainable future
We aim to grow sales and earnings faster than global chemical production
in the coming years, driven by
Investments in organic growth
M&A opportunities and portfolio pruning measures
Our priorities
Cost discipline and operational excellence
BASF FY 2016 Analyst Conference Call, February 24, 2017 16
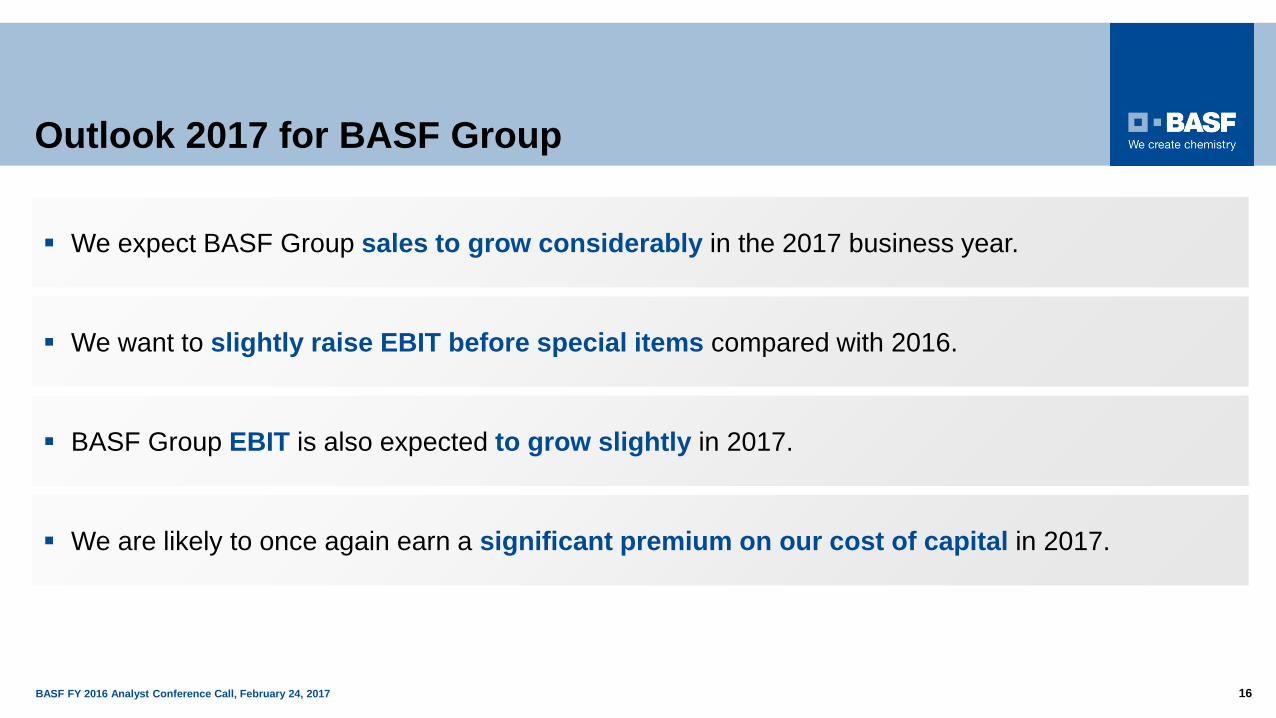
Outlook 2017 for BASF Group
We want to slightly raise EBIT before special items compared with 2016.
We expect BASF Group sales to grow considerably in the 2017 business year.
BASF Group EBIT is also expected to grow slightly in 2017.
We are likely to once again earn a significant premium on our cost of capital in 2017.
BASF FY 2016 Analyst Conference Call, February 24, 2017 17
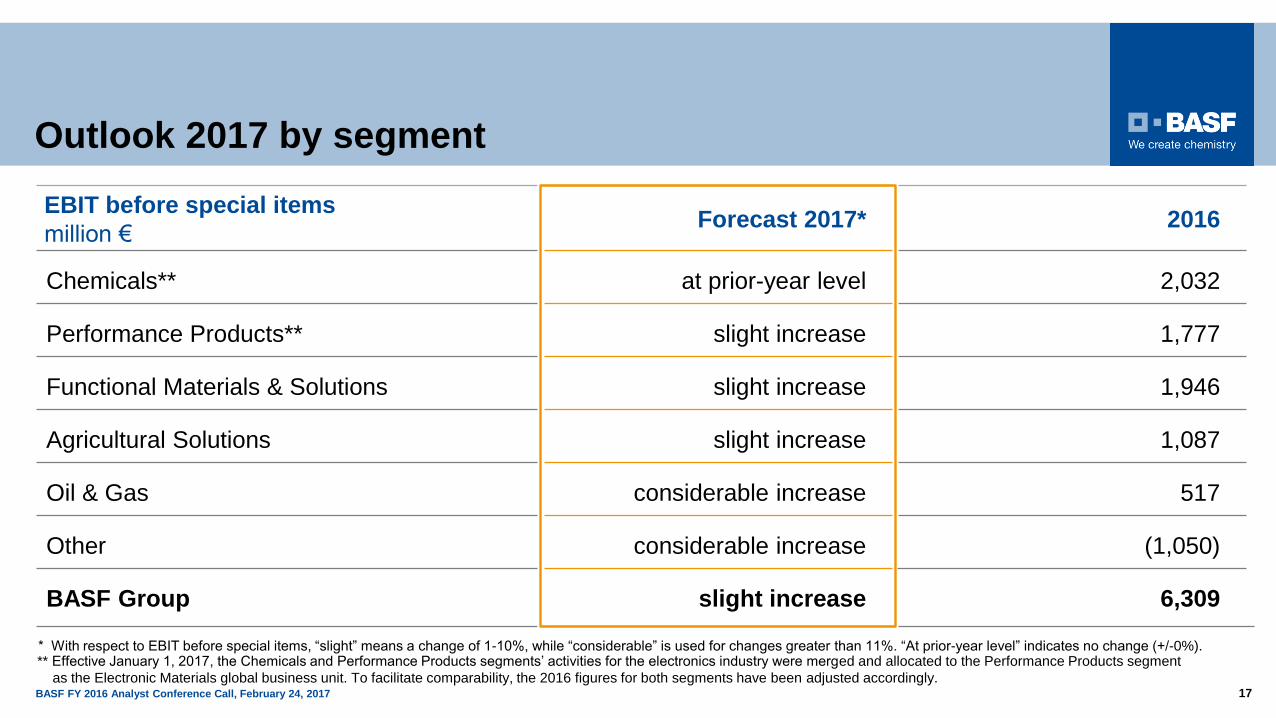
Outlook 2017 by segment
EBIT before special items
million €Forecast 2017* 2016
Chemicals** at prior-year level 2,032
Performance Products** slight increase 1,777
Functional Materials & Solutions slight increase 1,946
Agricultural Solutions slight increase 1,087
Oil & Gas considerable increase 517
Other considerable increase (1,050)
BASF Group slight increase 6,309
* With respect to EBIT before special items, “slight” means a change of 1-10%, while “considerable” is used for changes greater than 11%. “At prior-year level” indicates no change (+/-0%).** Effective January 1, 2017, the Chemicals and Performance Products segments’ activities for the electronics industry were merged and allocated to the Performance Products segment
as the Electronic Materials global business unit. To facilitate comparability, the 2016 figures for both segments have been adjusted accordingly.
BASF FY 2016 Analyst Conference Call, February 24, 2017 18BASF Investor Day 2015 – Keynote speech 18