basic concepts and future horizons in cancer...
TRANSCRIPT

Basic Concepts and Future Horizons in Cancer Immunotherapy
Drew Pardoll
Johns Hopkins

The amplitude of immune responses is determined
by a balance of positive signals (antigen+costimulation)
and negative forces (immune checkpoints)
IMMUNE CHECKPOINTS = BRAKES
Stat3, ~20 receptor/ligand, Treg, MDSC
Immune
ResponseIMMUNIZATION = ACCELERATOR
Signal 1 – Antigen
Signal 2 - Costimulation
Dendritic Cells VACCINE
Why do some
vaccines induce
tumor-specific
immunity but
rarely induce
tumor regression?

B7.1/B7.2
?
PD-L1/PD-L2
B7RP -1 ICOS
CD28
B7H3 ?
MHC/pep TCR
CTLA-4
PD-1
Signal 1
CD137L CD137
OX40L OX40
LIGHT LIGHT-R
Antigen
Presenting Cell
or Tumor Cell
T Cell
Cytokines (IL-1, IL-6, IL-10, IL-12, IL-18)
CD200R CD200
CD40 CD40L
HVEM BTLA
The Immunologic Synapse
PS/galectin9 Tim1/Tim3
LAG3

APC T cell
Activation(cytokines, lysis, prolif., migration)
B7.1 CD28
TCR Signal 1MHC-Ag
TumorTumor
PD-L1
PD-1
(-)(-)
(-)
Inhibition(anergy, exhaustion, death)
Anti-
PD-1
The PD-1 Pathway is a Master Checkpoint
within the Tumor Immune Microenvironment

Tumor
DC/M
maturation
LAG-3
CD4 T cell
Treg
Anti-
tumor CD8
killer cell
MDSC
PD-L1
PD-L1
PD-L2
A2aR
Multiple Cell Types within the Tumor Immune
Microenvironment Express PD-1 and PD-1L
PD-1
LAG-3
Tim3
BTLA
PD-1
B7-H3B7-H4
PD-L1/2PD-L1
IDO
IDOTTO
IDO

2 Mechanisms for PD-L1 upregulation in tumors
TUMOR
Oncogenic
Pathway
(Stat3, Akt)
T CellTCR
PD-1
MHC-pep
PD-L1
Constitutive tumor signaling
induces PD-L1 on tumor cells
Innate (tumor cell intrinsic) Resistance
TUMOR
Stats
TUMORT Cell
T Cell
IFN-g
T cell-induced
PD-L1 up-regulationAdaptive Resistance

2 Mechanisms for PD-L1 upregulation in tumors
TUMOR
Oncogenic
Pathway
(Stat3, Akt)
T CellTCR
PD-1
MHC-pep
PD-L1
Constitutive tumor signaling
induces PD-L1 on tumor cells
Innate (tumor cell intrinsic) Resistance
TUMOR
Stats
TUMORT Cell
T Cell
IFN-gTumor-induced
PD-1 up-regulation TGF-b
Adaptive Resistance
Treg, Mf
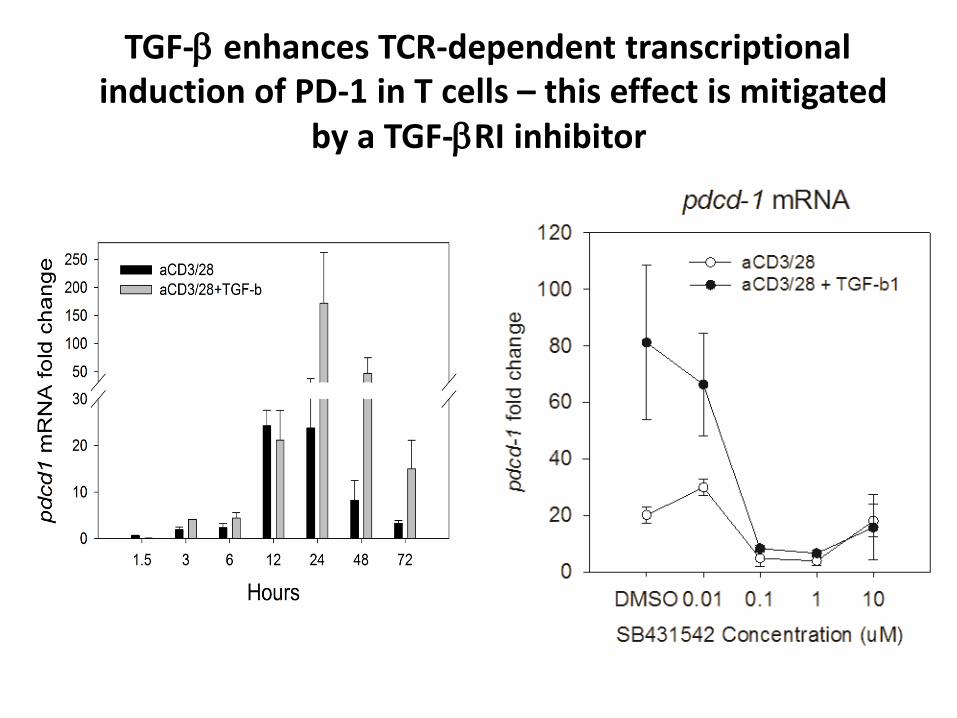
TGF-b enhances TCR-dependent transcriptionalinduction of PD-1 in T cells – this effect is mitigated
by a TGF-bRI inhibitor
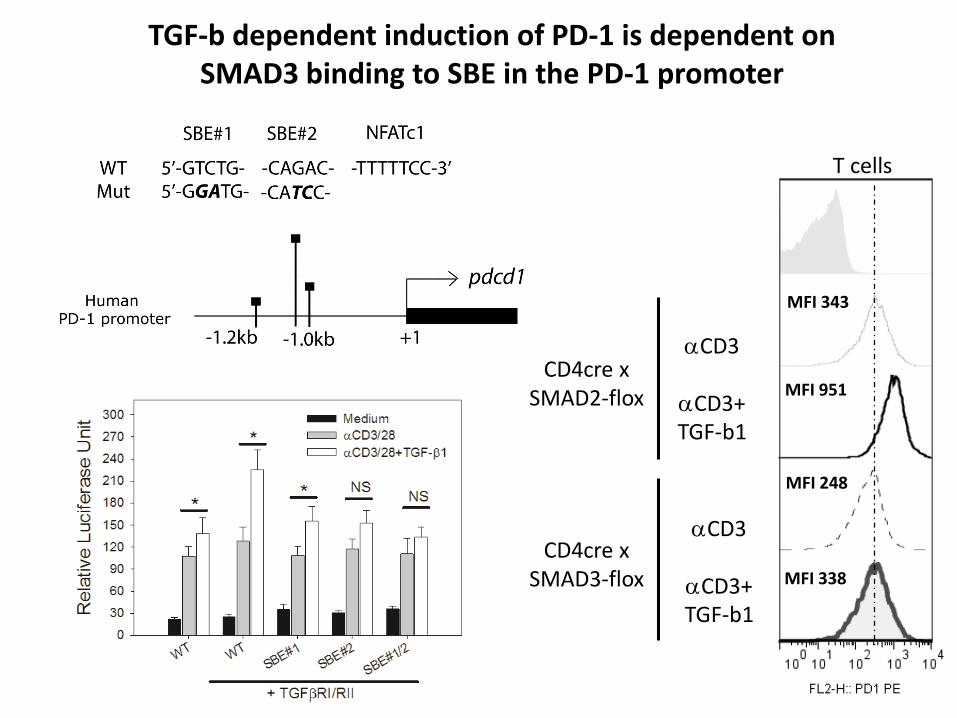
T cells
CD4cre xSMAD2-flox
aCD3
aCD3+TGF-b1
MFI 343
MFI 951
MFI 248
MFI 338
aCD3
aCD3+TGF-b1
CD4cre xSMAD3-flox
TGF-b dependent induction of PD-1 is dependent on SMAD3 binding to SBE in the PD-1 promoter
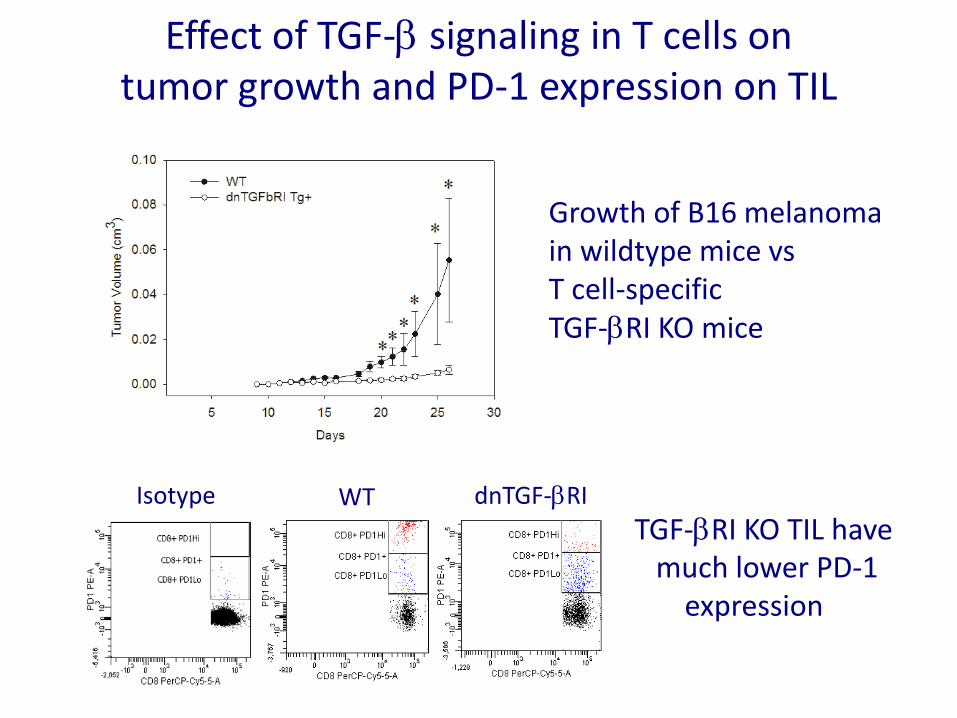
Effect of TGF-b signaling in T cells ontumor growth and PD-1 expression on TIL
dnTGF-bRIWTIsotype
Growth of B16 melanoma in wildtype mice vsT cell-specific TGF-bRI KO mice
TGF-bRI KO TIL havemuch lower PD-1
expression
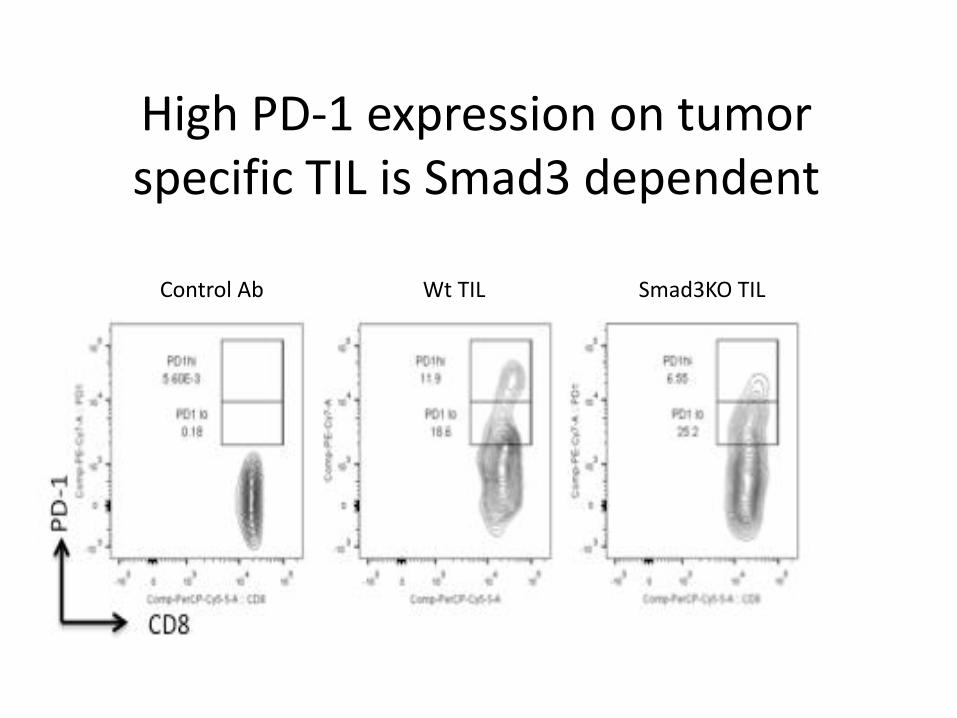
High PD-1 expression on tumor specific TIL is Smad3 dependent
Control Ab Wt TIL Smad3KO TIL

Can a tumor’s genetics
affect it’s microenvironment
and, as follows, its response
to immunotherapy?

Lawrence et al., Nature 2013
Mutational density among cancers sorted by histologyDoes higher mutational load = anti-PD-1 responsiveness?
MSIhi
POLE/POLD1
HPV+

Cancer Genotype linked to Immune Microenviroment – the
case of Colorectal Cancer
• Lymphocyte infiltration into CRC an independent predictor of clinical outcome (Gallon et al)
• Major genetic classification of CRC based on loss of key mismatch repair genes (Microsatellite instable vs stable)
• Even though CRC does not typically respond to anti-PD-1 as monotherapy, one CRC CR was observed – this patient was MSIhi (Lipson et al, CRC 2013)

Analysis of the immune microenvironment of CRC reveals
a subset (~20%) of tumors that are “inflammed”
“No
n-i
nfla
mm
ed”
“In
fla
mm
ed
”
0.1mm
CD8 20x
CD8 20x Foxp3 20x
0.1mm
CD4 20x
CD4 20x
Foxp3 20x

mRNA analysis from LCM reveals that MSI tumor microenvironment has enhanced Th1, CTL and checkpoint expression relative to MSS
MSS
MSITh1 CTL Th17 Treg
Pro-inflammation Checkpoints Metabolism
CD4

PD-L1 expression on myeloid cells inside MSI tumors
MSI
MSS
0.1mm
0.1mm
CD 163 20x PD-L1 20x
CD 163 20x PD-L1 20x
*
*
*
*

MSI
MSS
0.1mm
0.1mm
PD-1 20x LAG-3 20x
PD-1 20x LAG-3 20x
*
*
*
*
PD-1 & LAG-3 expression at TIL and stroma
according to mismatch repair status

MSIhi CRC TIL uniquely contain PD-1hi/IFNghi
populations of CD4 and CD8 T cells
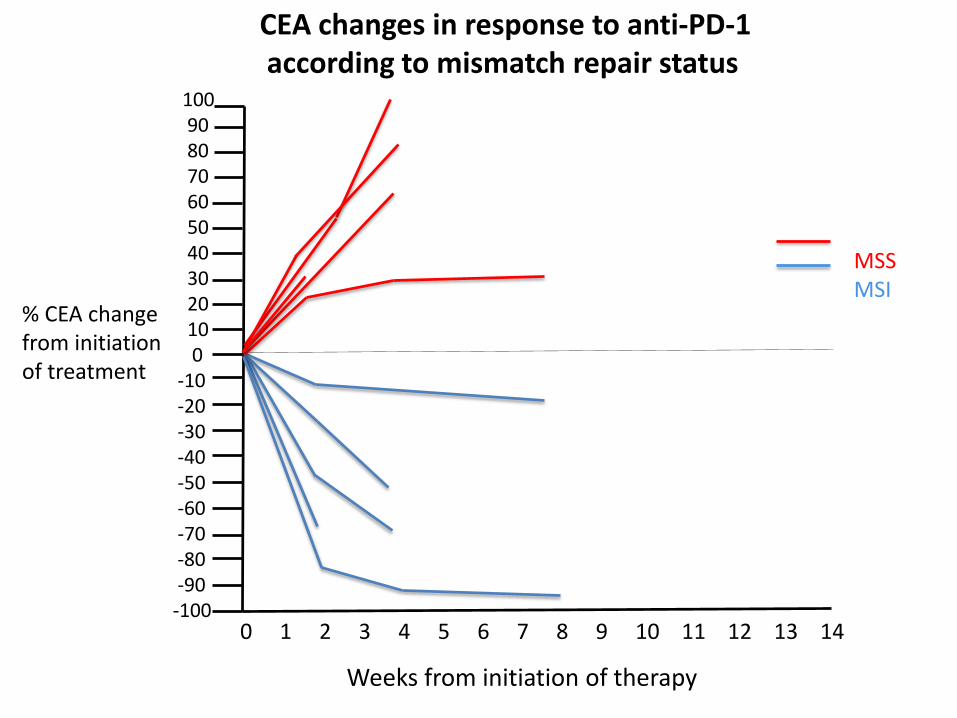
1009080706050403020100
-10-20-30-40-50-60-70-80-90-100
0 1 2 3 4 5 6 7 8 9 10 11 12 13 14
% CEA changefrom initiationof treatment
Weeks from initiation of therapy
CEA changes in response to anti-PD-1 according to mismatch repair status
MSSMSI

Does genetics of colon cancer affect microenvironment? MSIhi vs MSS
No POLE or POLD2 mutation – 49 total nonsynonymous exomic mutations (standard for MSS)
MSS MSS MSS
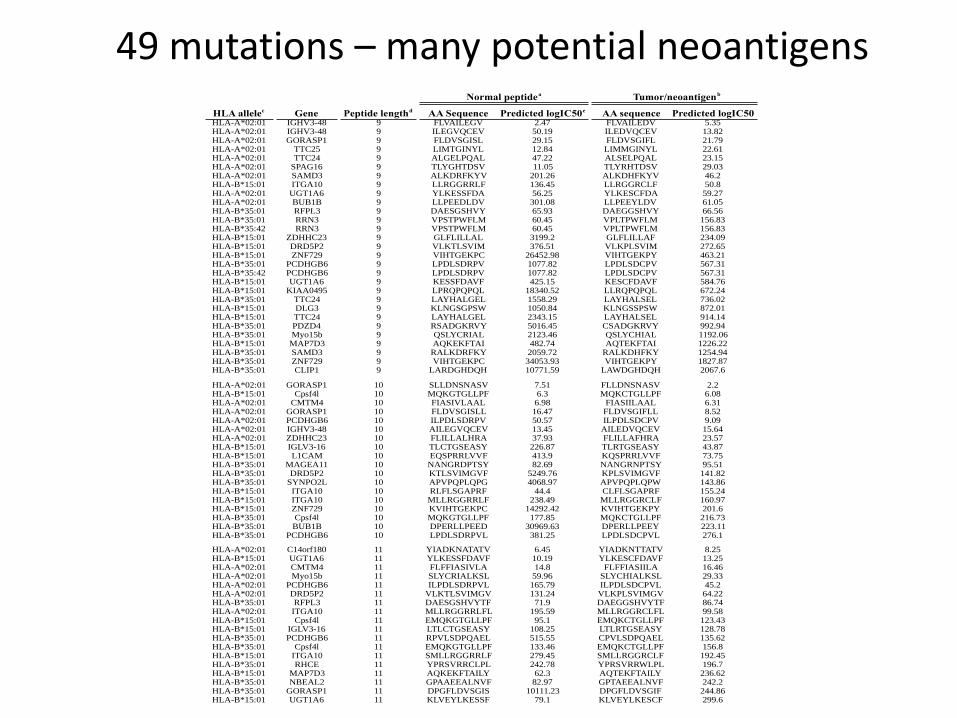
HLA allelec Gene Peptide lengthd AA Sequence Predicted logIC50e AA sequence Predicted logIC50HLA-A*02:01 IGHV3-48 9 FLVAILEGV 2.47 FLVAILEDV 5.35HLA-A*02:01 IGHV3-48 9 ILEGVQCEV 50.19 ILEDVQCEV 13.82HLA-A*02:01 GORASP1 9 FLDVSGISL 29.15 FLDVSGIFL 21.79HLA-A*02:01 TTC25 9 LIMTGINYL 12.84 LIMMGINYL 22.61HLA-A*02:01 TTC24 9 ALGELPQAL 47.22 ALSELPQAL 23.15HLA-A*02:01 SPAG16 9 TLYGHTDSV 11.05 TLYRHTDSV 29.03HLA-A*02:01 SAMD3 9 ALKDRFKYV 201.26 ALKDHFKYV 46.2HLA-B*15:01 ITGA10 9 LLRGGRRLF 136.45 LLRGGRCLF 50.8HLA-A*02:01 UGT1A6 9 YLKESSFDA 56.25 YLKESCFDA 59.27HLA-A*02:01 BUB1B 9 LLPEEDLDV 301.08 LLPEEYLDV 61.05HLA-B*35:01 RFPL3 9 DAESGSHVY 65.93 DAEGGSHVY 66.56HLA-B*35:01 RRN3 9 VPSTPWFLM 60.45 VPLTPWFLM 156.83HLA-B*35:42 RRN3 9 VPSTPWFLM 60.45 VPLTPWFLM 156.83HLA-B*15:01 ZDHHC23 9 GLFLILLAL 3199.2 GLFLILLAF 234.09HLA-B*15:01 DRD5P2 9 VLKTLSVIM 376.51 VLKPLSVIM 272.65HLA-B*15:01 ZNF729 9 VIHTGEKPC 26452.98 VIHTGEKPY 463.21HLA-B*35:01 PCDHGB6 9 LPDLSDRPV 1077.82 LPDLSDCPV 567.31HLA-B*35:42 PCDHGB6 9 LPDLSDRPV 1077.82 LPDLSDCPV 567.31HLA-B*15:01 UGT1A6 9 KESSFDAVF 425.15 KESCFDAVF 584.76HLA-B*15:01 KIAA0495 9 LPRQPQPQL 18340.52 LLRQPQPQL 672.24HLA-B*35:01 TTC24 9 LAYHALGEL 1558.29 LAYHALSEL 736.02HLA-B*15:01 DLG3 9 KLNGSGPSW 1050.84 KLNGSSPSW 872.01HLA-B*15:01 TTC24 9 LAYHALGEL 2343.15 LAYHALSEL 914.14HLA-B*35:01 PDZD4 9 RSADGKRVY 5016.45 CSADGKRVY 992.94HLA-B*35:01 Myo15b 9 QSLYCRIAL 2123.46 QSLYCHIAL 1192.06HLA-B*15:01 MAP7D3 9 AQKEKFTAI 482.74 AQTEKFTAI 1226.22HLA-B*35:01 SAMD3 9 RALKDRFKY 2059.72 RALKDHFKY 1254.94HLA-B*35:01 ZNF729 9 VIHTGEKPC 34053.93 VIHTGEKPY 1827.87HLA-B*35:01 CLIP1 9 LARDGHDQH 10771.59 LAWDGHDQH 2067.6
HLA-A*02:01 GORASP1 10 SLLDNSNASV 7.51 FLLDNSNASV 2.2HLA-B*15:01 Cpsf4l 10 MQKGTGLLPF 6.3 MQKCTGLLPF 6.08HLA-A*02:01 CMTM4 10 FIASIVLAAL 6.98 FIASIILAAL 6.31HLA-A*02:01 GORASP1 10 FLDVSGISLL 16.47 FLDVSGIFLL 8.52HLA-A*02:01 PCDHGB6 10 ILPDLSDRPV 50.57 ILPDLSDCPV 9.09HLA-A*02:01 IGHV3-48 10 AILEGVQCEV 13.45 AILEDVQCEV 15.64HLA-A*02:01 ZDHHC23 10 FLILLALHRA 37.93 FLILLAFHRA 23.57HLA-B*15:01 IGLV3-16 10 TLCTGSEASY 226.87 TLRTGSEASY 43.87HLA-B*15:01 L1CAM 10 EQSPRRLVVF 413.9 KQSPRRLVVF 73.75HLA-B*35:01 MAGEA11 10 NANGRDPTSY 82.69 NANGRNPTSY 95.51HLA-B*35:01 DRD5P2 10 KTLSVIMGVF 5249.76 KPLSVIMGVF 141.82HLA-B*35:01 SYNPO2L 10 APVPQPLQPG 4068.97 APVPQPLQPW 143.86HLA-B*15:01 ITGA10 10 RLFLSGAPRF 44.4 CLFLSGAPRF 155.24HLA-B*15:01 ITGA10 10 MLLRGGRRLF 238.49 MLLRGGRCLF 160.97HLA-B*15:01 ZNF729 10 KVIHTGEKPC 14292.42 KVIHTGEKPY 201.6HLA-B*35:01 Cpsf4l 10 MQKGTGLLPF 177.85 MQKCTGLLPF 216.73HLA-B*35:01 BUB1B 10 DPERLLPEED 30969.63 DPERLLPEEY 223.11HLA-B*35:01 PCDHGB6 10 LPDLSDRPVL 381.25 LPDLSDCPVL 276.1
HLA-A*02:01 C14orf180 11 YIADKNATATV 6.45 YIADKNTTATV 8.25HLA-B*15:01 UGT1A6 11 YLKESSFDAVF 10.19 YLKESCFDAVF 13.25HLA-A*02:01 CMTM4 11 FLFFIASIVLA 14.8 FLFFIASIILA 16.46HLA-A*02:01 Myo15b 11 SLYCRIALKSL 59.96 SLYCHIALKSL 29.33HLA-A*02:01 PCDHGB6 11 ILPDLSDRPVL 165.79 ILPDLSDCPVL 45.2HLA-A*02:01 DRD5P2 11 VLKTLSVIMGV 131.24 VLKPLSVIMGV 64.22HLA-B*35:01 RFPL3 11 DAESGSHVYTF 71.9 DAEGGSHVYTF 86.74HLA-A*02:01 ITGA10 11 MLLRGGRRLFL 195.59 MLLRGGRCLFL 99.58HLA-B*15:01 Cpsf4l 11 EMQKGTGLLPF 95.1 EMQKCTGLLPF 123.43HLA-B*15:01 IGLV3-16 11 LTLCTGSEASY 108.25 LTLRTGSEASY 128.78HLA-B*35:01 PCDHGB6 11 RPVLSDPQAEL 515.55 CPVLSDPQAEL 135.62HLA-B*35:01 Cpsf4l 11 EMQKGTGLLPF 133.46 EMQKCTGLLPF 156.8HLA-B*15:01 ITGA10 11 SMLLRGGRRLF 279.45 SMLLRGGRCLF 192.45HLA-B*35:01 RHCE 11 YPRSVRRCLPL 242.78 YPRSVRRWLPL 196.7HLA-B*15:01 MAP7D3 11 AQKEKFTAILY 62.3 AQTEKFTAILY 236.62HLA-B*35:01 NBEAL2 11 GPAAEEALNVF 82.97 GPTAEEALNVF 242.2HLA-B*35:01 GORASP1 11 DPGFLDVSGIS 10111.23 DPGFLDVSGIF 244.86HLA-B*15:01 UGT1A6 11 KLVEYLKESSF 79.1 KLVEYLKESCF 299.6
Normal peptidea Tumor/neoantigenb
49 mutations – many potential neoantigens

Normal Tumor0
100
200
300
400
Pre
dic
ted A
*0201 logIC
50
Normal Tumor0
10000
20000
30000
Pre
dic
ted B
*1501 logIC
50
Normal Tumor0
10000
20000
30000
40000
Pre
dic
ted B
*3501 logIC
50
A B CHLA-A201 HLA B1501 HLA-B3501
Potential Neoantigens in MSS patient with 49 coding mutations
De Novo HLA binding
New TCR contact in peptide with moderate – high HLA binding affinity

Therapeutic Implications for PD-1 Pathway
Blockade of Adaptive Resistance Model
Strong Endogenous
Anti-tumor Immune
Response
PD-L1 up-regulation
on tumor/TAMRESPONSE
Single agent
Anti-PD-1
Weak Endogenous
Anti-tumor Immune
Response
No PD-L1 up-regulation
on tumor/TAM
NO
RESPONSE
Single agent
Anti-PD-1
Weak Endogenous
Anti-tumor Immune
Response
Endogenous
Anti-tumor Immune
Response
RESPONSE
PD-L1 expression
on tumor/TAM
Inducer of Anti-tumor Immunity, ie vaccine1
Anti-PD-12

Cyclic Dinucleotides (CDNs) and Intracellular DNA Activate Innate Immunity via STING
• Cyclic dinucleotides (CDNs) regulate
gene expression in bacteria
• Intracellular bacteria secrete CDNs
through MDRs into the cytosol of
infected cells
• cGAS synthesizes c-GMP-AMP in
response to binding cytosolic DNA
• CDNs are sensed by STING (Stimulator
of Interferon Genes)
• STING activates innate immunity by
signaling through the TBK-1/IRF-3 axis
and NF-κB
• The potency of vaccines is significantly
enhanced by co-formulation with CDNs IFN-βPro-Inflammatory
cytokinesNF-KB IRF-3
IKK
Cyclic-di-GMP
c[G(3’,5’)pG(3’,5’)p]
IRF-3
TBK-1
ATP+ GTP
cGAMP
cGAS
Pathogen
CDG
Bacteria Protozoa Viruses
Cyclic-GMP-AMP
c[G(2’,5’)pA(3’,5’)p]
DDX41 IFI16 DAI DNA-PK
Th-2cytokinesSTAT6
STAT6NF-κB
STING

STING-CDN Crystal Structure Enables Rational Design of Molecules with 100x Potency Relative to Native
Molecules – most potent known DC activators
c-di-GMP STING co-crystal
: Phosphodiesterase resistance
CDN composition & modifications
: Phosphate bridge linkage
: Formulation enhancement
: Purine nucleotide base
CDN structure


0.00
0.20
0.40
0.60
0.80
1.00
7 12 17 22 27
Tum
or
Vo
lum
e
(cm
3)
GM-vaccineSTINGVAXSTINGVAX+Anti-PD1
Untreated
GM-Vaccine
STINGVAX (di-cAMP)
STINGVAX (R,R-di-A)
STINGVAX (ML-di-A)
CD8+INFg+ PD-L1
STINGVAX vaccination results in enhanced IFNgproduction in tumors associated with increased PD-L1
induction and synergy with anti-PD-1

Combination checkpoint blockade

LAG-3 KO
WT
PD-1 KO
PD-1/LAG-3
DKO
LAG-3 / PD-1 Double KO Mice Reject
Poorly Immunogenic B16 Tumors
Relative Intensity
Log
2Fold C
hange
Up
-re
gula
ted
in P
d-1
Hi v
sLo
Up
-re
gula
ted
in P
D-1
Lo
vs
Hi
Expression profiling
of PD-1hi vs PD-1lo
TIL reveals additional
checkpoint pathways
targetable with Ab:
LAG-3
Tu
mo
r V
olu
me
m
m3
Control Ab
(0/10 TF)Anti-
LAG-3
(0/10 TF)
Anti-PD-1
(4/10 TF)
0 10 20 30 40 50
0
500
1000
1500
2000
Anti-
LAG-3 +
Anti-PD-
1
(8/10 TF)
Days Post-Treatment Initiation
Tum
or
Volu
me
Epigenetic modulation of tumor antigenicity and the tumor
microenvironment

Multiple immune genes induced by 5-aza treatment
Checkpoint receptors
Interferon receptors/Stats
Antigen Processing/Presentation
Interferon pathway
IFN Regulatory Factors
Cancer Testes Ag
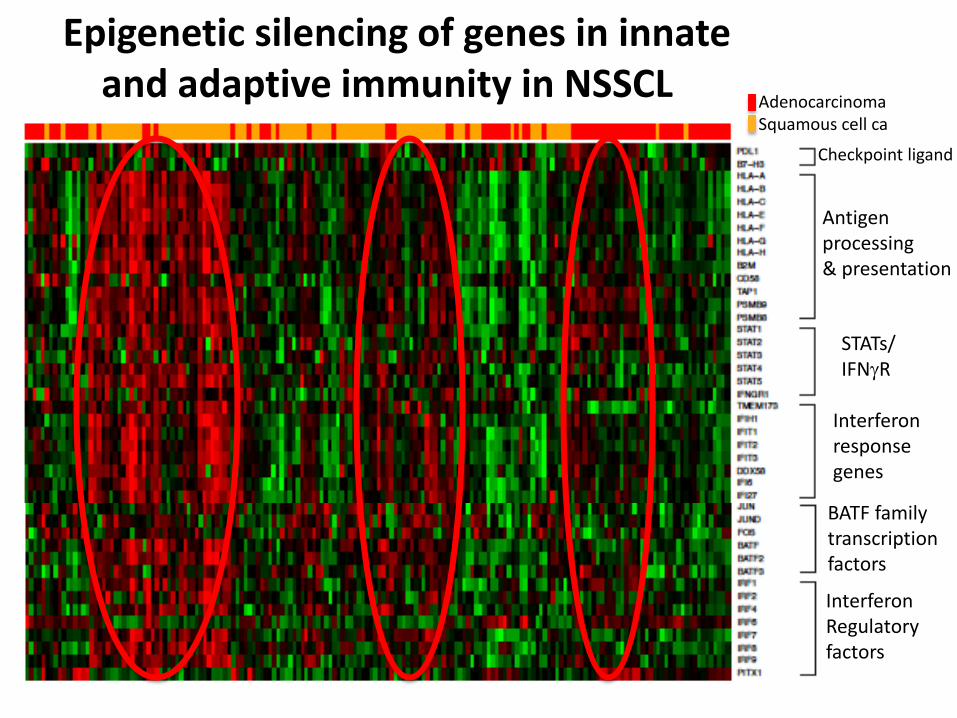
Checkpoint ligand
Antigenprocessing& presentation
STATs/IFNgR
Interferonresponsegenes
BATF familytranscriptionfactors
InterferonRegulatoryfactors
Epigenetic silencing of genes in innate and adaptive immunity in NSSCL
AdenocarcinomaSquamous cell ca

Response to anti-PD-1/PD-L1 after5’aza-CR + HDACi in 5 pt with NSCLC
Stable disease
Objective Response

% S
urv
iva
l
TimeControl
Standard or Other Therapy
Checkpoint Blockade
Combination
Improving Survival with Combination Therapy

Sponsored by Bloomberg Foundation, Barney Foundation,
Merieux Foundation, SU2C and Melanoma Research Alliance
Suzanne Topalian Janis TaubeJulie Brahmer Franck HousseauCharles Drake Nico LlosaBill Sharfman Ben ParkBob Anders Cindy SearsBert Vogelstein Young KimKen KinzlerNick PapadopolusSteve Baylin