basic concepts in data mining - caltech astronomygeorge/aybi199/oldlectures/borne_dmintro.pdf ·...
TRANSCRIPT
2008 NVO Summer School 1 1
Basic Concepts in Data Mining Kirk Borne George Mason University
THE US NATIONAL VIRTUAL OBSERVATORY
2008 NVO Summer School 2
Basic Concepts = Key Steps
• The key steps in a data mining project usually invoke and/or follow these basic concepts: – Data browse, preview, and selection – Data cleaning and preparation – Feature selection – Data normalization and transformation – Similarity/Distance metric selection – ... Select the data mining method – ... Apply the data mining method – ... Gather and analyze data mining results – Accuracy estimation – Avoiding overfitting
2008 NVO Summer School 3
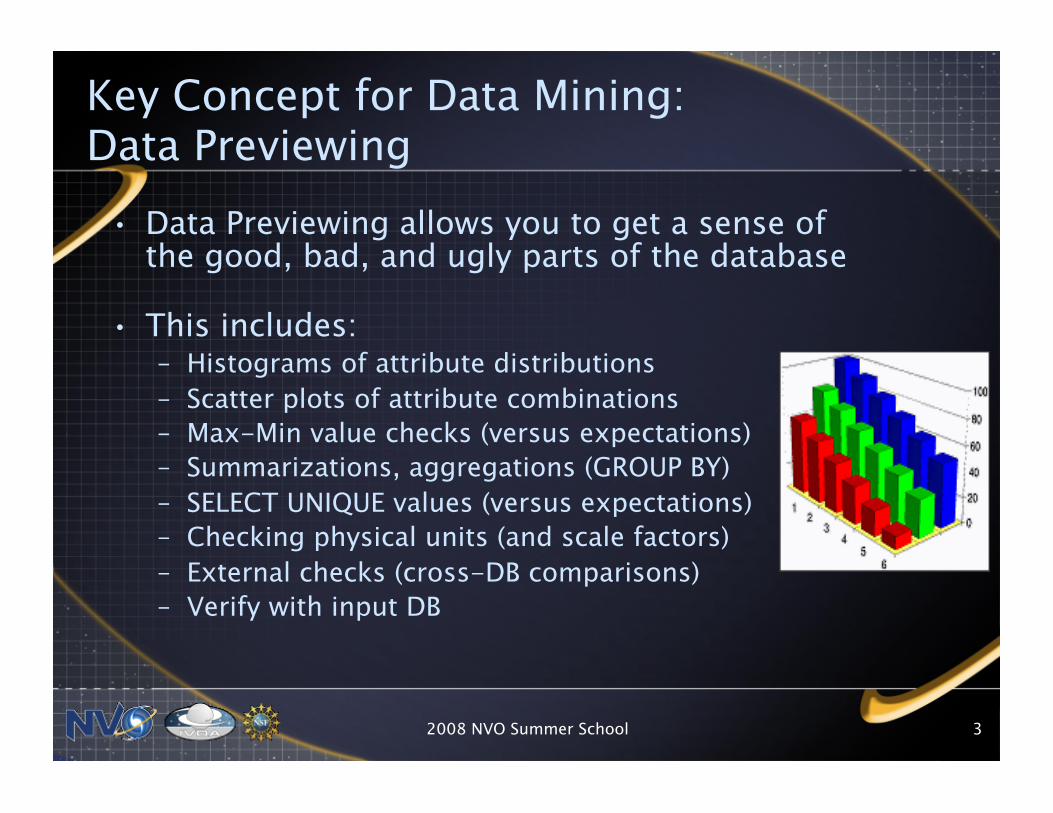
Key Concept for Data Mining: Data Previewing
• Data Previewing allows you to get a sense of the good, bad, and ugly parts of the database
• This includes: – Histograms of attribute distributions – Scatter plots of attribute combinations – Max-Min value checks (versus expectations) – Summarizations, aggregations (GROUP BY) – SELECT UNIQUE values (versus expectations) – Checking physical units (and scale factors) – External checks (cross-DB comparisons) – Verify with input DB
2008 NVO Summer School 4
Key Concept for Data Mining: Data Preparation = Cleaning the Data
• Data Preparation can take 40-80% (or more) of the effort in a data mining project
• This includes: – Dealing with NULL (missing) values – Dealing with errors – Dealing with noise – Dealing with outliers (unless that is your science!) – Transformations: units, scale, projections – Data normalization – Relevance analysis: Feature Selection – Remove redundant attributes – Dimensionality Reduction
2008 NVO Summer School 5
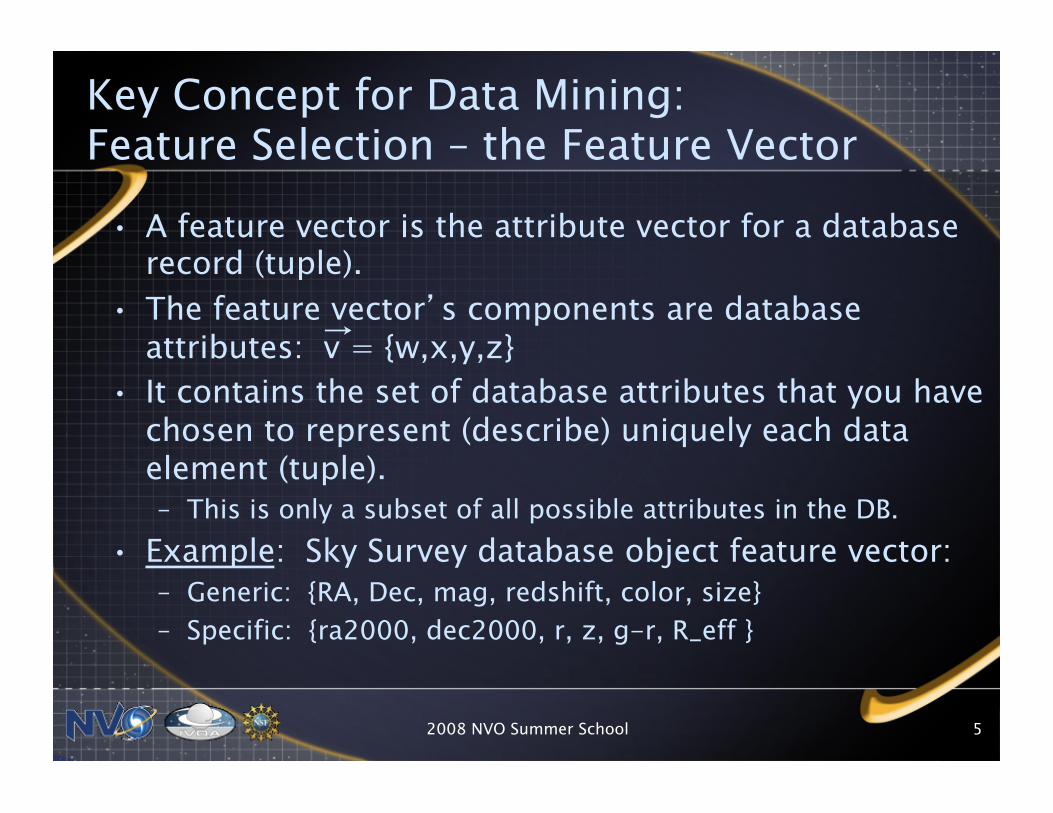
Key Concept for Data Mining: Feature Selection – the Feature Vector
• A feature vector is the attribute vector for a database record (tuple).
• The feature vector’s components are database attributes: v = {w,x,y,z}
• It contains the set of database attributes that you have chosen to represent (describe) uniquely each data element (tuple). – This is only a subset of all possible attributes in the DB.
• Example: Sky Survey database object feature vector: – Generic: {RA, Dec, mag, redshift, color, size} – Specific: {ra2000, dec2000, r, z, g-r, R_eff }
→
2008 NVO Summer School 6
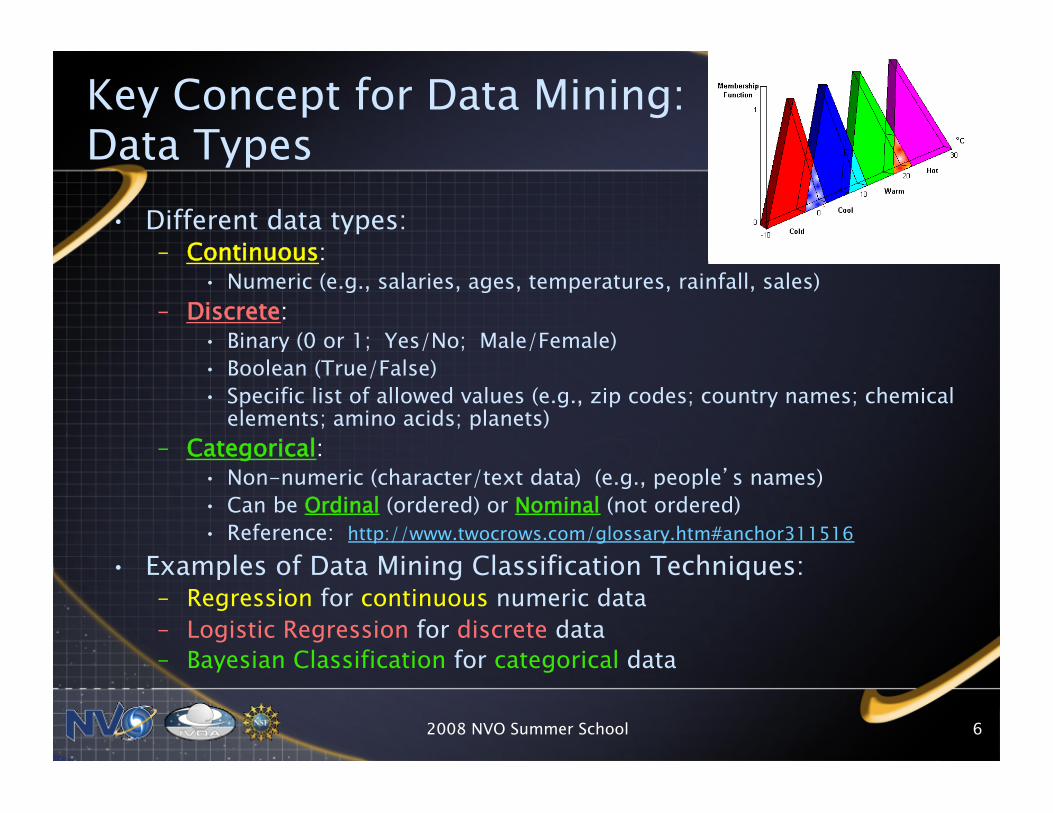
Key Concept for Data Mining: Data Types
• Different data types: – Continuous:
• Numeric (e.g., salaries, ages, temperatures, rainfall, sales) – Discrete:
• Binary (0 or 1; Yes/No; Male/Female) • Boolean (True/False) • Specific list of allowed values (e.g., zip codes; country names; chemical
elements; amino acids; planets) – Categorical:
• Non-numeric (character/text data) (e.g., people’s names) • Can be Ordinal (ordered) or Nominal (not ordered) • Reference: http://www.twocrows.com/glossary.htm#anchor311516
• Examples of Data Mining Classification Techniques: – Regression for continuous numeric data – Logistic Regression for discrete data – Bayesian Classification for categorical data
2008 NVO Summer School 7
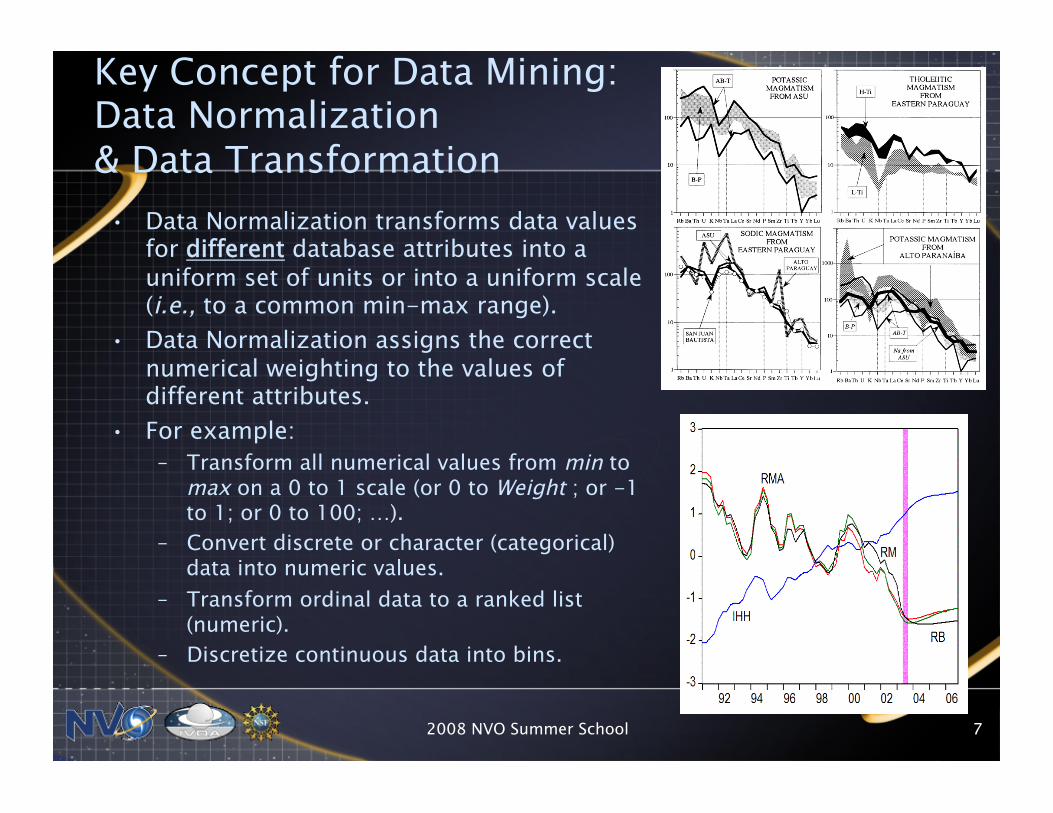
Key Concept for Data Mining: Data Normalization & Data Transformation
• Data Normalization transforms data values for different database attributes into a uniform set of units or into a uniform scale (i.e., to a common min-max range).
• Data Normalization assigns the correct numerical weighting to the values of different attributes.
• For example: – Transform all numerical values from min to
max on a 0 to 1 scale (or 0 to Weight ; or -1 to 1; or 0 to 100; …).
– Convert discrete or character (categorical) data into numeric values.
– Transform ordinal data to a ranked list (numeric).
– Discretize continuous data into bins.
2008 NVO Summer School 8
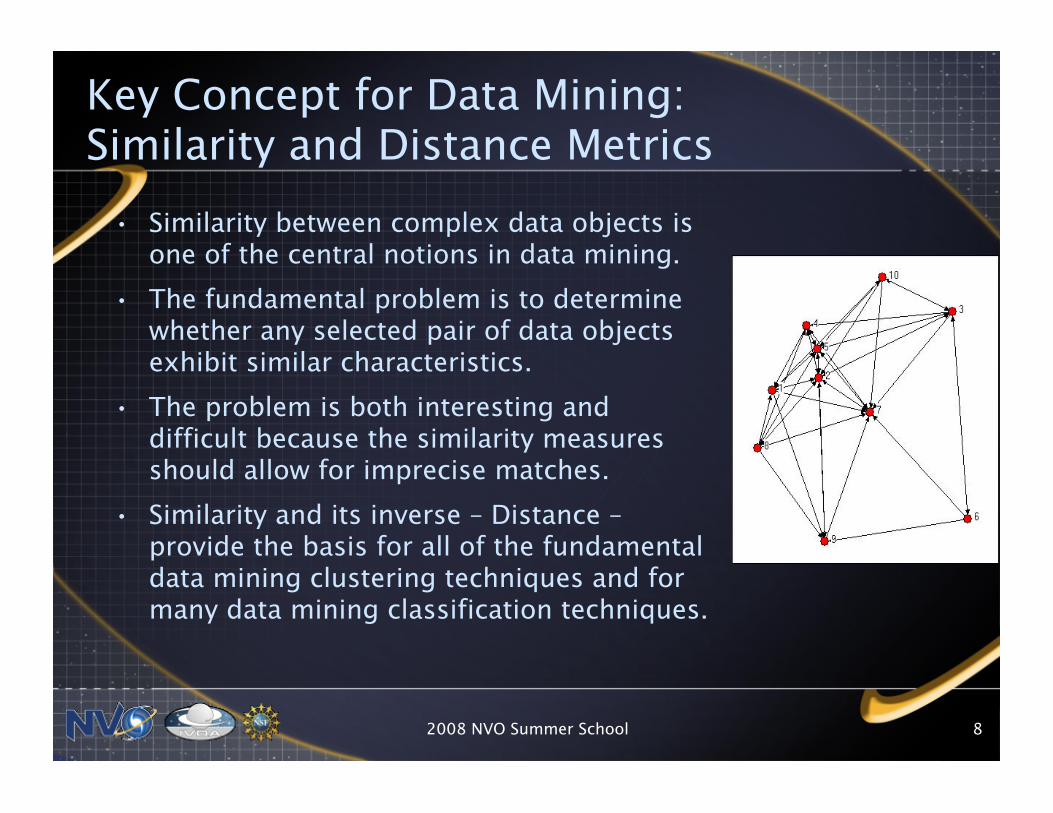
Key Concept for Data Mining: Similarity and Distance Metrics
• Similarity between complex data objects is one of the central notions in data mining.
• The fundamental problem is to determine whether any selected pair of data objects exhibit similar characteristics.
• The problem is both interesting and difficult because the similarity measures should allow for imprecise matches.
• Similarity and its inverse – Distance – provide the basis for all of the fundamental data mining clustering techniques and for many data mining classification techniques.
2008 NVO Summer School 9
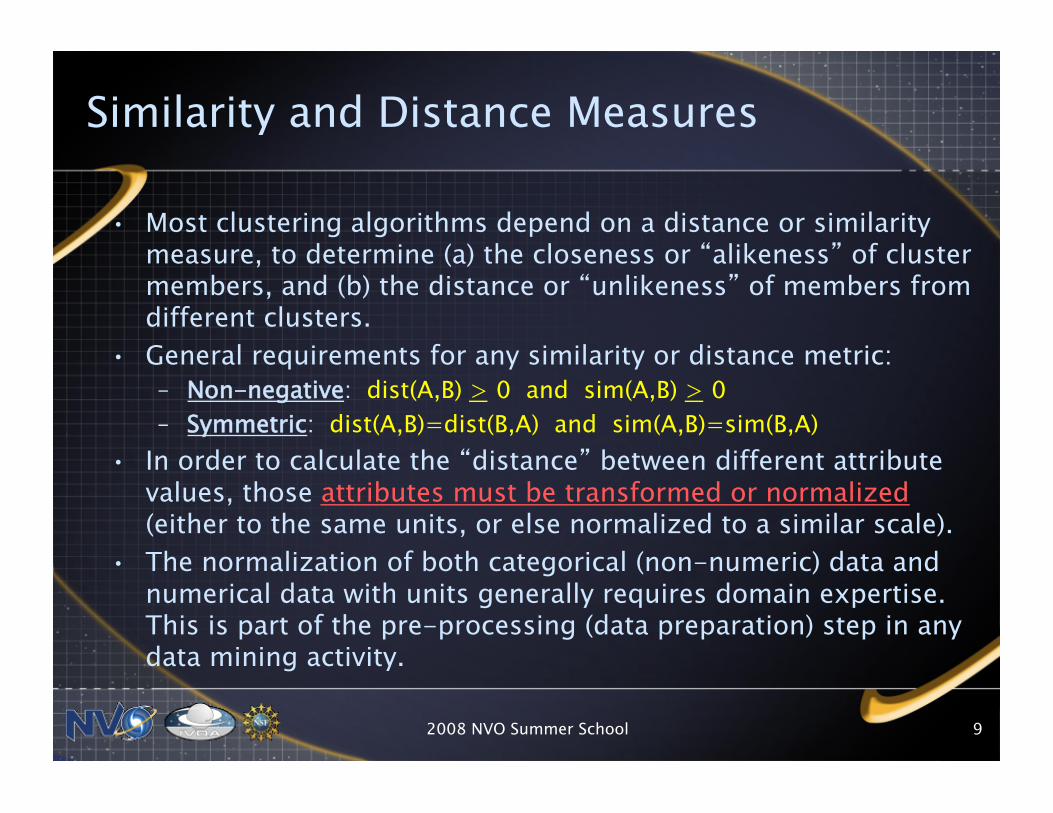
Similarity and Distance Measures
• Most clustering algorithms depend on a distance or similarity measure, to determine (a) the closeness or “alikeness” of cluster members, and (b) the distance or “unlikeness” of members from different clusters.
• General requirements for any similarity or distance metric: – Non-negative: dist(A,B) > 0 and sim(A,B) > 0 – Symmetric: dist(A,B)=dist(B,A) and sim(A,B)=sim(B,A)
• In order to calculate the “distance” between different attribute values, those attributes must be transformed or normalized (either to the same units, or else normalized to a similar scale).
• The normalization of both categorical (non-numeric) data and numerical data with units generally requires domain expertise. This is part of the pre-processing (data preparation) step in any data mining activity.
2008 NVO Summer School 10
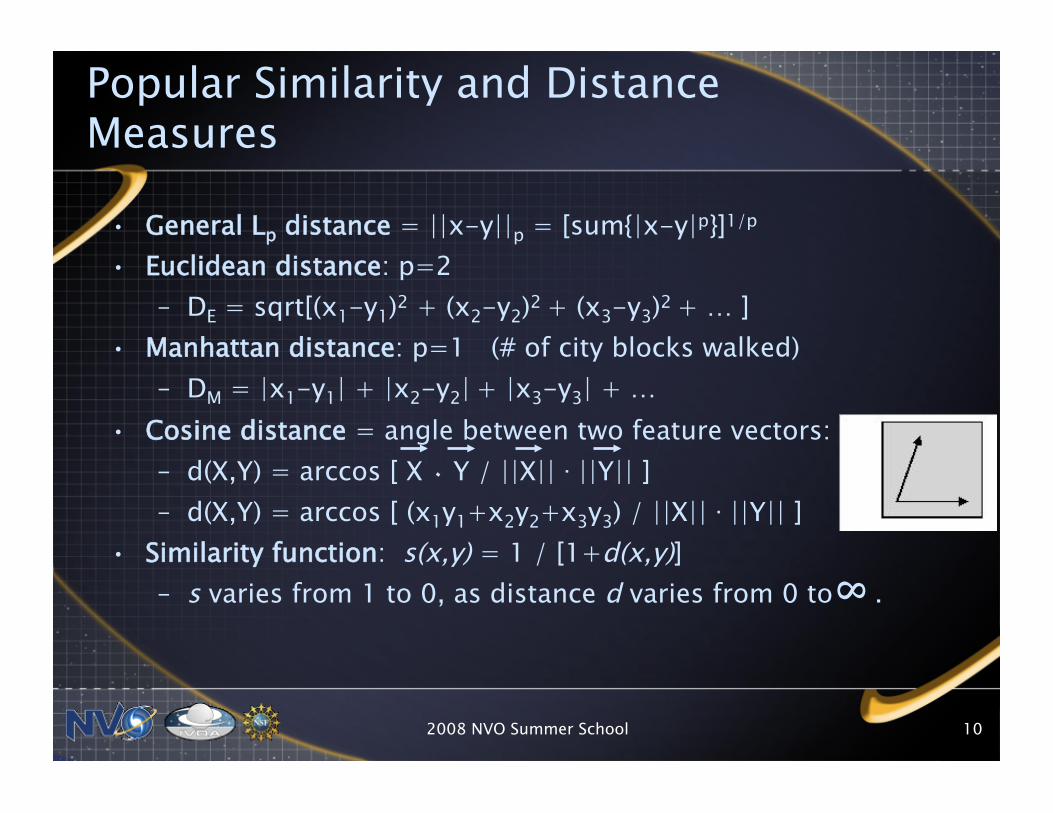
Popular Similarity and Distance Measures
• General Lp distance = ||x-y||p = [sum{|x-y|p}]1/p • Euclidean distance: p=2
– DE = sqrt[(x1-y1)2 + (x2-y2)2 + (x3-y3)2 + … ] • Manhattan distance: p=1 (# of city blocks walked)
– DM = |x1-y1| + |x2-y2| + |x3-y3| + … • Cosine distance = angle between two feature vectors:
– d(X,Y) = arccos [ X ٠ Y / ||X|| . ||Y|| ] – d(X,Y) = arccos [ (x1y1+x2y2+x3y3) / ||X|| . ||Y|| ]
• Similarity function: s(x,y) = 1 / [1+d(x,y)] – s varies from 1 to 0, as distance d varies from 0 to .
8
2008 NVO Summer School 11
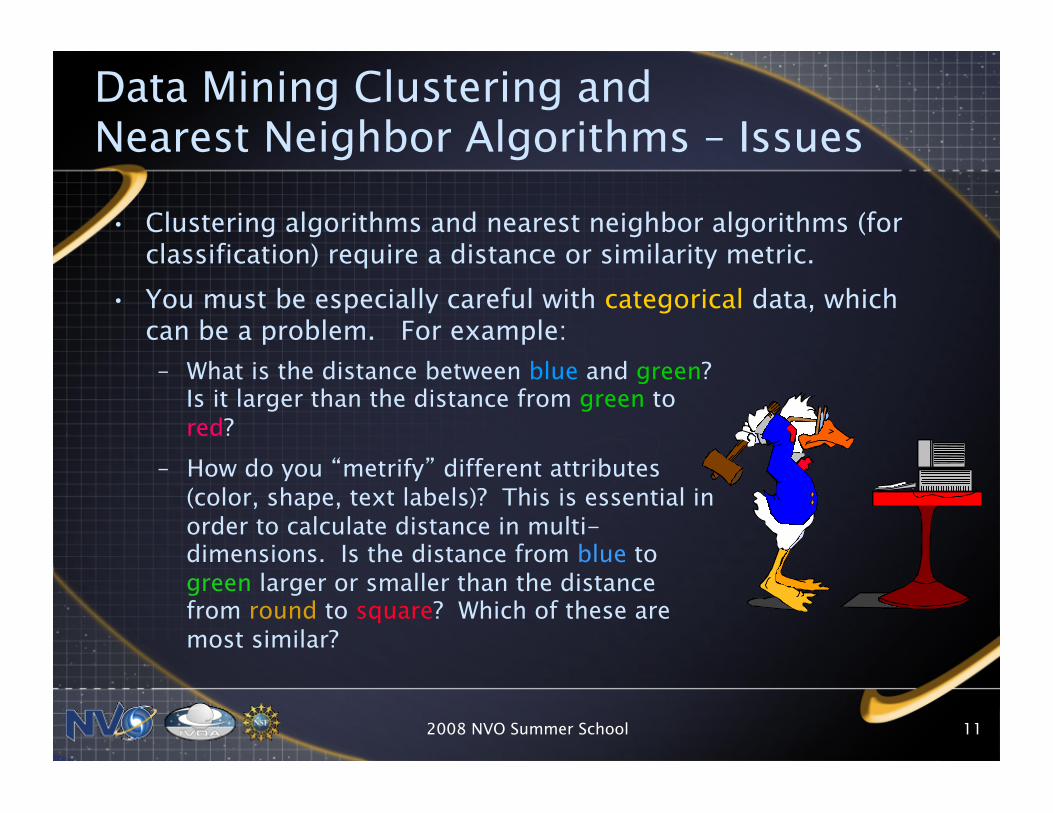
Data Mining Clustering and Nearest Neighbor Algorithms – Issues • Clustering algorithms and nearest neighbor algorithms (for
classification) require a distance or similarity metric. • You must be especially careful with categorical data, which
can be a problem. For example: – What is the distance between blue and green?
Is it larger than the distance from green to red?
– How do you “metrify” different attributes (color, shape, text labels)? This is essential in order to calculate distance in multi-dimensions. Is the distance from blue to green larger or smaller than the distance from round to square? Which of these are most similar?
2008 NVO Summer School 12
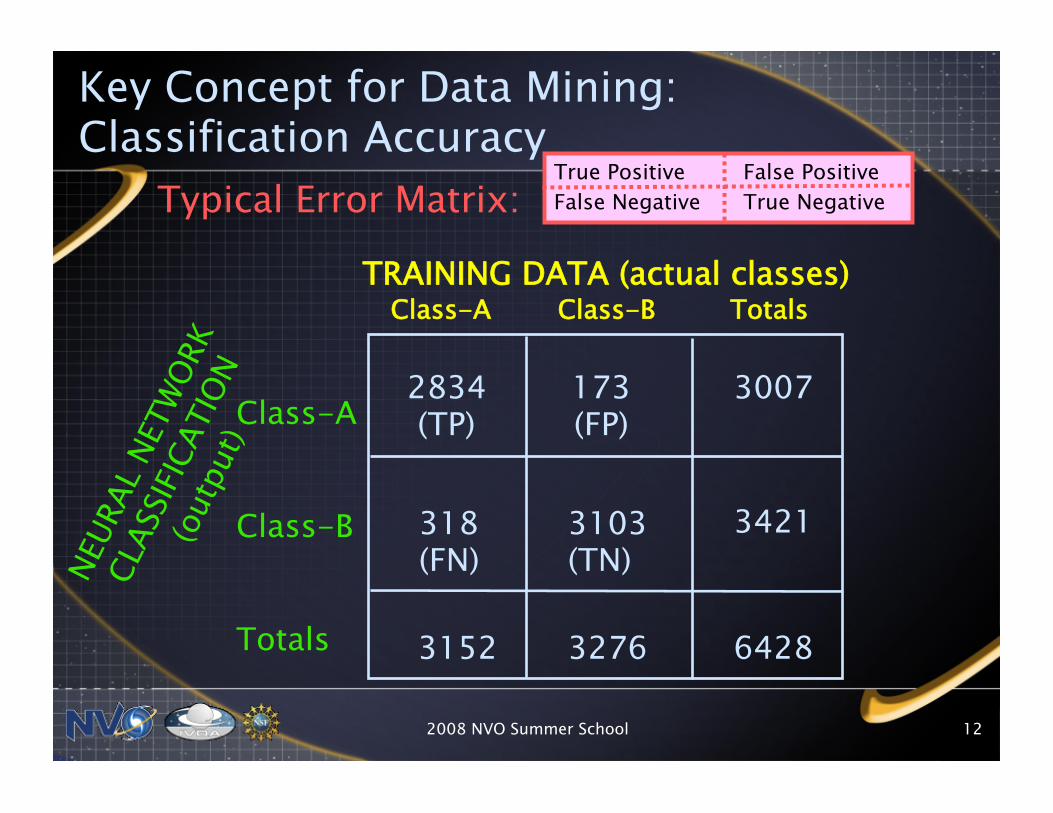
Typical Error Matrix:
Class-A Class-B Totals
Class-A Class-B Totals
TRAINING DATA (actual classes)
3007
318 (FN)
3421 3103 (TN)
3276 3152 6428
173 (FP)
2834 (TP)
True Positive False Positive False Negative True Negative
Key Concept for Data Mining: Classification Accuracy
2008 NVO Summer School 13
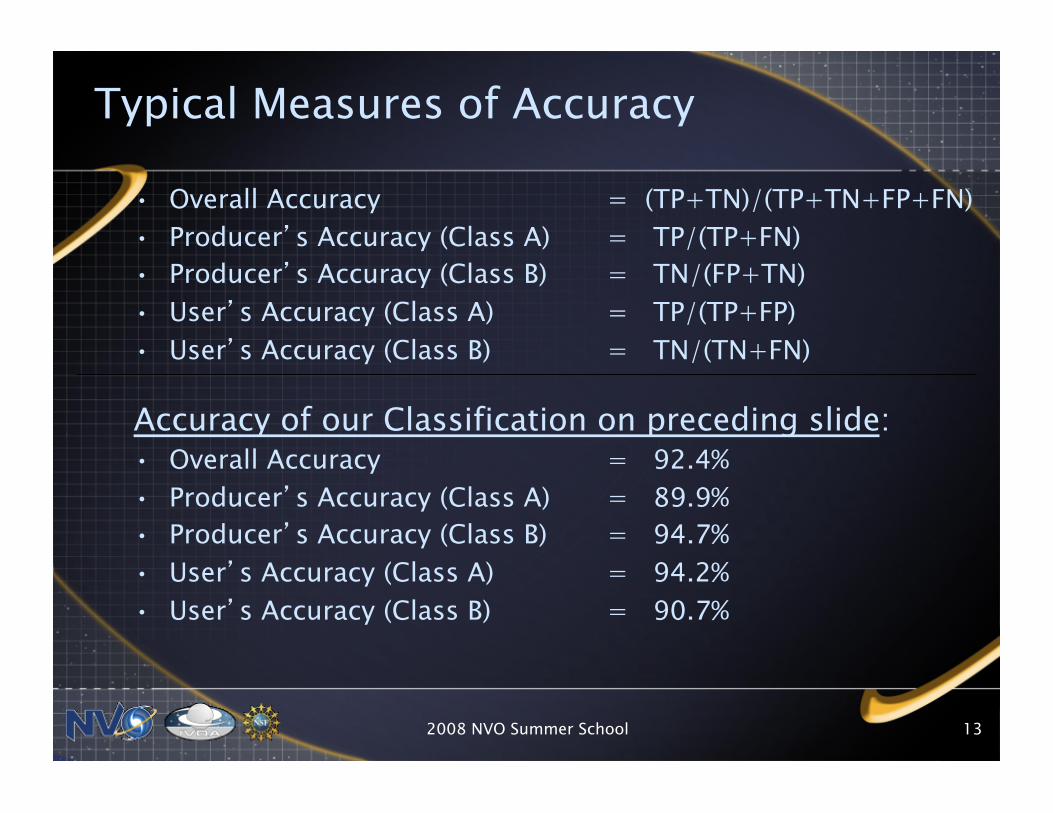
Typical Measures of Accuracy
• Overall Accuracy = (TP+TN)/(TP+TN+FP+FN) • Producer’s Accuracy (Class A) = TP/(TP+FN) • Producer’s Accuracy (Class B) = TN/(FP+TN) • User’s Accuracy (Class A) = TP/(TP+FP) • User’s Accuracy (Class B) = TN/(TN+FN)
Accuracy of our Classification on preceding slide: • Overall Accuracy = 92.4% • Producer’s Accuracy (Class A) = 89.9% • Producer’s Accuracy (Class B) = 94.7% • User’s Accuracy (Class A) = 94.2% • User’s Accuracy (Class B) = 90.7%
2008 NVO Summer School 14
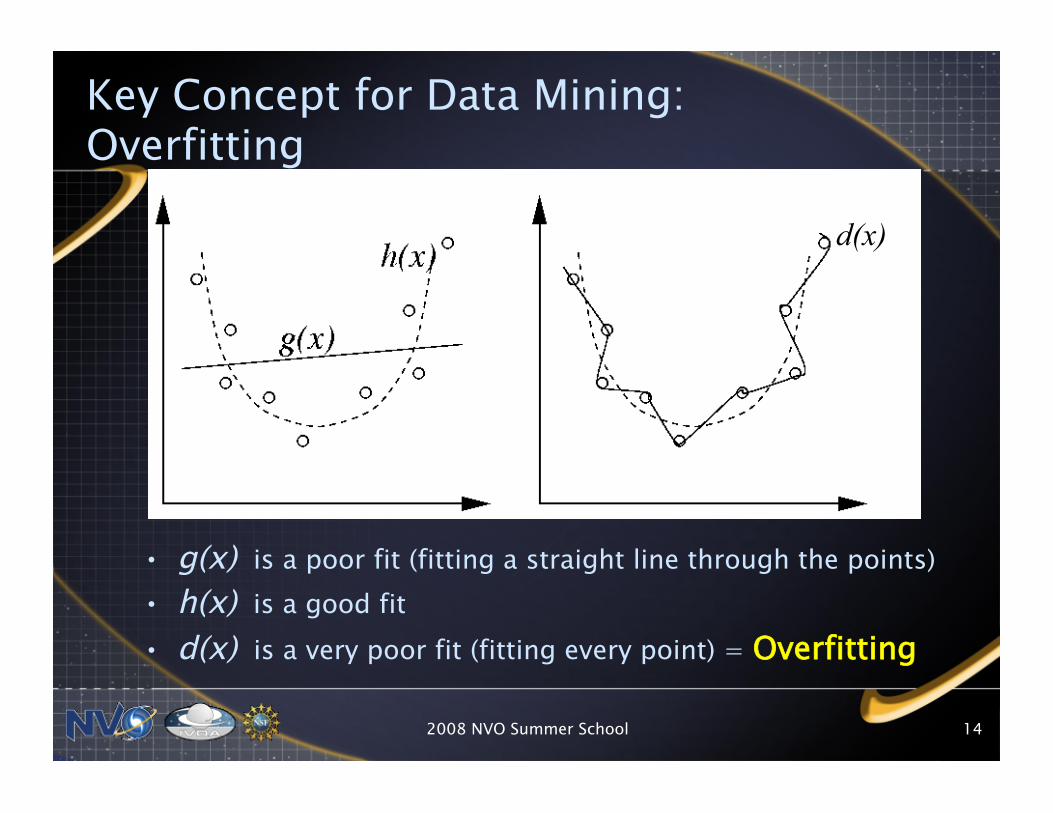
Key Concept for Data Mining: Overfitting
d(x)
• g(x) is a poor fit (fitting a straight line through the points) • h(x) is a good fit • d(x) is a very poor fit (fitting every point) = Overfitting
2008 NVO Summer School 15
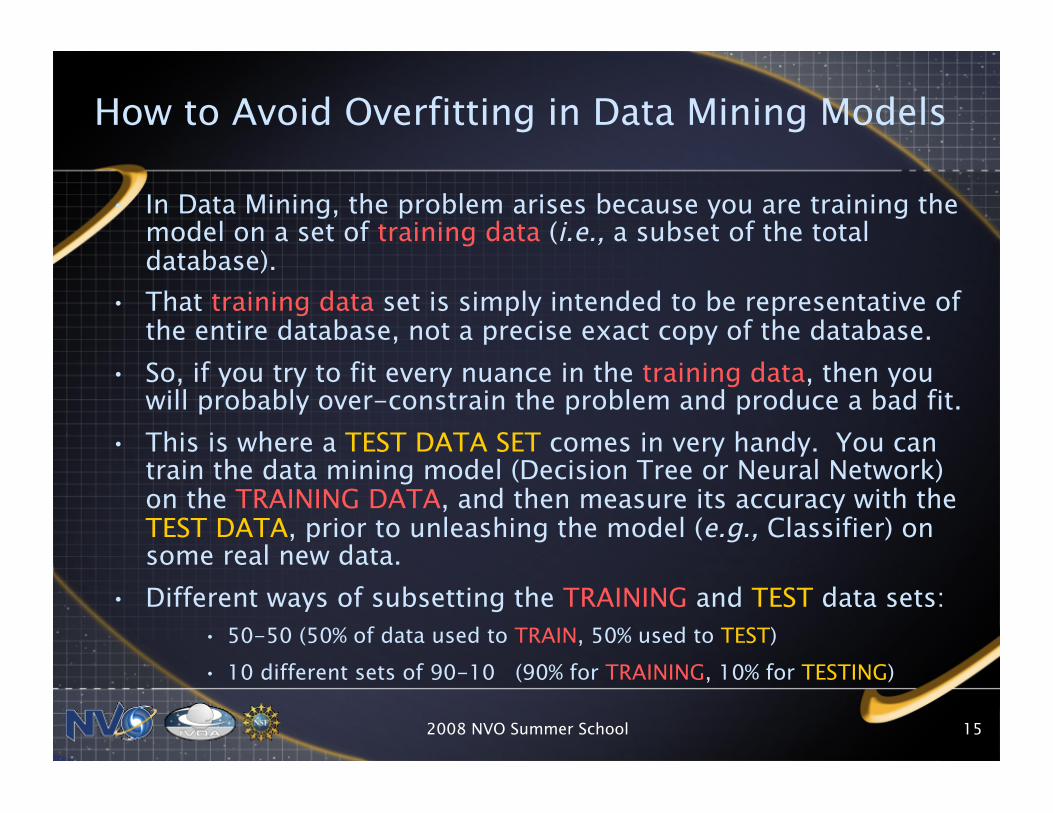
How to Avoid Overfitting in Data Mining Models
• In Data Mining, the problem arises because you are training the model on a set of training data (i.e., a subset of the total database).
• That training data set is simply intended to be representative of the entire database, not a precise exact copy of the database.
• So, if you try to fit every nuance in the training data, then you will probably over-constrain the problem and produce a bad fit.
• This is where a TEST DATA SET comes in very handy. You can train the data mining model (Decision Tree or Neural Network) on the TRAINING DATA, and then measure its accuracy with the TEST DATA, prior to unleashing the model (e.g., Classifier) on some real new data.
• Different ways of subsetting the TRAINING and TEST data sets: • 50-50 (50% of data used to TRAIN, 50% used to TEST) • 10 different sets of 90-10 (90% for TRAINING, 10% for TESTING)
2008 NVO Summer School 16
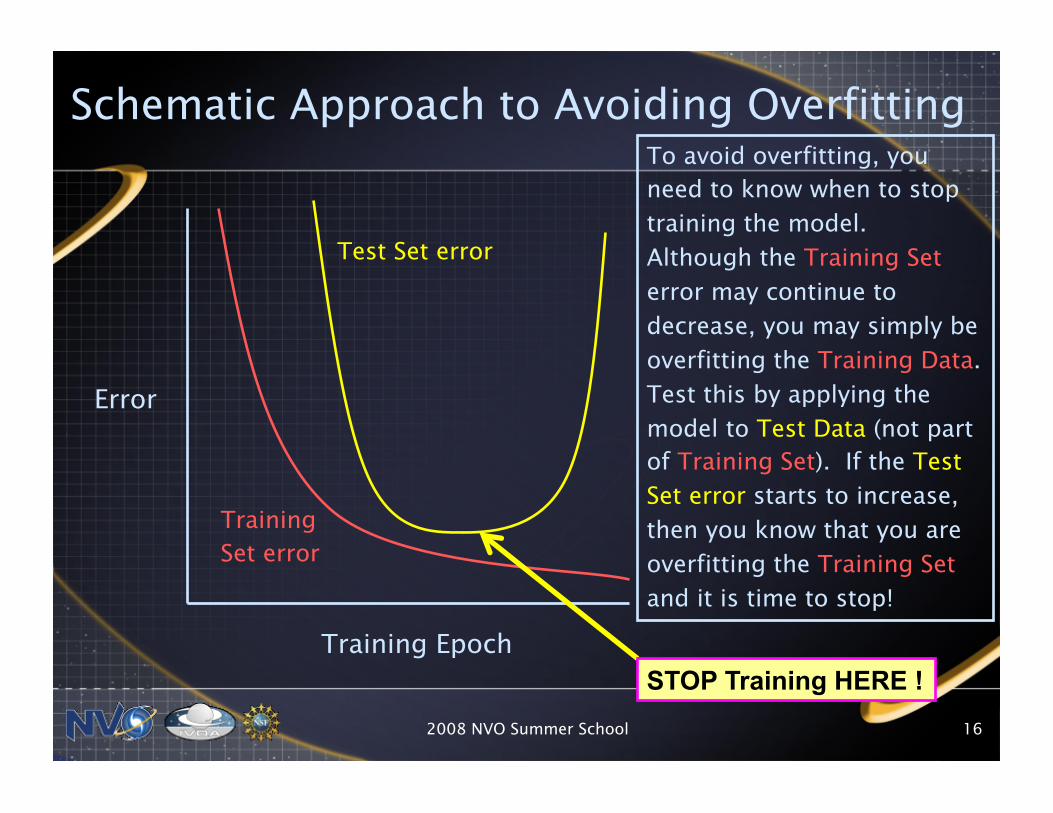
Schematic Approach to Avoiding Overfitting
Error
Training Epoch
Test Set error
Training Set error
To avoid overfitting, you need to know when to stop training the model. Although the Training Set error may continue to decrease, you may simply be overfitting the Training Data. Test this by applying the model to Test Data (not part of Training Set). If the Test Set error starts to increase, then you know that you are overfitting the Training Set and it is time to stop!
STOP Training HERE !