basic population information on - department … reports special... · basic population information...
TRANSCRIPT

BASIC POPULATION INFORMATION ON
BATTICALOA DISTRICT – 2007
Preliminary Report Based on Special Enumeration – 2007
Department of Census and Statistics October 2007

ISBN 978-955-577-614-1

Foreword
The Department of Census and Statistics (DCS), carried out a special enumeration in
Eastern province and in Jaffna district in Northern province. The objective of this
enumeration is to provide the necessary basic information needed to formulate
development programmes and relief activities for the people.
This preliminary publication for Batticaloa district has been compiled from the
reports obtained from the District based on summaries prepared by enumerators and
supervisors. A final detailed information will be disseminated after the computer processing
of questionnaires.
This preliminary release gives some basic information for Batticaloa district, such as
population by divisional secretary’s division, urban/rural population, sex, age (under 18
years and 18 years and over) and ethnicity. Data on displaced persons due to conflict or
tsunami are also included. Some important information which is useful for regional level
planning purposes are given by Grama Niladhari Divisions. This enumeration is based on the
usual residents of households in the district. These figures should be regarded as
provisional.
I wish to express my sincere thanks to the staff of the department and all other
government officials and others who worked with dedication and diligence for the
successful completion of the enumeration. I am also grateful to the general public for
extending their fullest co‐operation in this important undertaking. This publication has been
prepared by Population Census Division of this Department.
D.B.P. Suranjana Vidyaratne Director General of Census and Statistics
10th October 2007 Department of Census and Statistics, 15/12, Maitland Crescent, Colombo 7. Tel : (11) 2695291 Fax : (11) 2697594 Email : [email protected] Web : www.statistics.gov.lk
3

Acknowledgements
This publication has been prepared by the staff of the Population Census Division
under the guidance and direction of Mr. H.R. Gunasekara, Director (Census) assisted by Mr.
A.D.H. Gunathilaka and Mr. H.R. Dias, Deputy Directors.
The analysis was carried out by Mr. H.R. Dias, Deputy Director and publication was
organized by Mr. W.L.D.P.de.A. Goonatilleke, Senior Statistician. Compilation of statistical
tables and the preparation of charts were done by Mr. V.T. Anuruddha, Statistical Assistant.
Maps were prepared by Mr. R.D.M. Padmakumara, Data Entry Operator/Coding Clerk. Mr.
P.V.D.T.L. Saparamadu, Statistician was responsible for some operational activities of the
enumeration stage.
Mr. L.S.J.de.S. Wijeratna, Deputy Director of the field operations division assisted in
organizing field arrangements and Mr. D.G.S.G. Munasingha, Deputy Director of the
industry, construction, trade & services division was responsible for overall coordination of
the districts within Eastern Province.
District statistical staff headed by Mr. S.H. Mansoor, Senior Statistician of Batticaloa
district was responsible in conducting and supervising the enumeration activities in the
district.
The report was printed by the printing division under the supervision of Mr. W.C.
Weerawansa, Senior Statistician, Head of printing division.
4

Contents
Page
Foreword 3
Acknowledgements 4
Contents 5
List of Tables 6
List of Figures 7
District Map; Divisional Secretary’s (DS) Divisions and Urban Areas 2007 8
Basic Summary Results
1. Introduction 9
2. Population Size and Growth 10
3. Population Density 11
4. Population Distribution 12
5. Age –Sex Composition 14
6. Ethnic Distribution 16
7. Displaced Population 20
Appendix
Table 1 : Population by Sex, Age, DS division and Grama Niladhari (GN)
division, 2007 23
Table 2 : Number and percentage of displaced population by DS division
and Grama Niladhari (GN) division and reason for displacement,
2007 32
5
List of Tables
Table Page
A. Total population, percentage increase and average annual rate of growth, 1963‐2007 10
B. Population density, 1963‐2007 11
C. Number and percentage of population by DS division, 2007 12
D. Number and percentage of population by sector (with urban localities), 2007 14
E. Number and percentage of population by DS division and age under 18 years and 18 years and over, 2007 15
F. Population by DS division and sex, 2007 16
G. Number and percentage of population by ethnicity, 1963‐2007 16
H. Number and percentage of population by DS division and ethnicity, 2007 18
I. Number and percentage of displaced population by DS division and reason for displacement, 2007 20
6

List of Figures Figure Page A. Population size and average annual rate of growth, 1963‐2007 10
B. Population density, 1963‐2007 11
C. Population distribution by DS divisions, 2007 13
D. Percentage distribution of population by ethnicity, 2007 17
E. Major ethnic group of the population by DS divisions, 2007 19
F. Displaced population by DS divisions, 2007 21
7

8

Special Enumeration‐2007
POPULATION INFORMATION ON BATTICALOA DISTRICT
BASIC SUMMARY RESULTS
1. Introduction
The Census of Population and Housing –2001 was unable to carryout completely in
Northern and Eastern provinces. In order to overcome the lack of data required for ongoing
development programmes in Northern and Eastern provinces, Department of Census and
Statistics has carried out a special enumeration in Jaffna district in Northern province and in
Batticaloa, Trincomalee and Ampara districts in Eastern province. This is a complete
enumeration covering all the persons who are usual residents of households in the district.
Usual residence is defined as the housing unit or collective living quarter at which the
person usually lives, i.e. sleeps, keeps his clothes and other belongings etc. It is the
residence from which a person generally goes to work or if a student, attends school. This
‘de jure’ method of enumeration differs from the ‘de facto’ approach used during the last
Censuses in which people were enumerated during a specified period (usually 6 hours) at
the place where they are found irrespective of the usual residence. Basic demographic
information such as date of birth, sex, marital status, religion, ethnicity, relationship to head
of household, number of displaced persons, reason for displacement etc. were collected
through a carefully designed schedule. An enumerator for each Grama Niladhari (GN)
division and a supervisor for 10 GN divisions were appointed with the help of District
administration. The enumerator listed all the building units and collected the information
visiting each and every building unit within the area allocated to him/her. Close supervision
has been maintained throughout the enumeration by supervisors. The necessary
administrative arrangements in the district were carried out by the District Secretary and
Divisional Secretaries and all the technical guidance was provided by the staff of the
Department of Census and Statistics. Enumeration was carried out during the first three
weeks of August 2007.
9

2. Population Size and Growth
The total population enumerated in the Batticaloa district is 515,857. This represents
56.2 percent increase since the last Census in 1981. The average annual growth rate during
the period of 1981‐2007 shows a decline from 2.7 percent to 1.7 percent. The enumerated
population, intercensal increase, and average annual growth rates are shown in Table A and
Figure A for the district.
No. %
1963 196,1891971 256,721 60,532 30.9 3.31981 330,333 73,612 28.7 2.72007 515,857 185,524 56.2 1.7
Note : 1963, 1971 and 1981 figures are from the corresponding
Population Censuses
Population
Average annual rate of
growth (percent)
YearIncrease
Table A : Total population, percentage increase and average annual rate of growth, 1963 ‐ 2007
Figure A : Population size and average annual rate of growth, 1963 – 2007
0
100
200
300
400
500
600
1963 1971 1981 2007Year
Population ('000)
0
0.5
1
1.5
2
2.5
3
3.5
Growth rate (percent)
Population Grow th rate
Note : 1963, 1971 and 1981 figures are from the corresponding
Population Censuses
10

3. Population Density
Population density measured as the number of persons per unit area of land is
shown in Table B and Figure B. Population density stands at 198 persons per square
kilometer in the district. Population density is shown a significant increase from 1971 to
2007.
Year Population
Population density
(persons per sq. km.)
1963 196,189 811971 256,721 1051981 330,333 1342007 515,857 198
Note : 1963, 1971 and 1981 figures are from the corresponding Population Censuses
Table B : Population density, 1963 ‐ 2007
Figure B : Population density, 1963 – 2007
0
50
100
150
200
250
1963 1971 1981 2007Year
Popu
latio
n de
nsity
(per
sq.
km
.)
Note : 1963, 1971 and 1981 fi gures are from the corresponding Popula tion Censuses
11

4. Population Distribution
Number and percentage of population by Divisional Secretariat (DS) division is
shown in Table C. Manmunai North DS division reports the highest population while Koralai
Pattu South (Kiran) DS division reports the lowest population in the district. The pattern of
the population distribution is shown in Figure C.
Table C : Number and percentage of population by DS division, 2007
No. %
Batticaloa District 515,857 100.0
Koralai Pattu North (Vaharai) 21,263 4.1Koralai Pattu West (Oddamavadi) 20,985 4.1Koralai Pattu (Valachchenai) 24,589 4.8Eravur Pattu 75,886 14.7Eravur Town 25,024 4.9Manmunai North 88,459 17.1Kattankudy 39,523 7.7Manmunai Pattu (Araipattai) 30,747 6.0Manmunai South‐ West 23,988 4.7Poratheevu Pattu 38,282 7.4Manmunai South & Eruvil Pattu 57,917 11.2Koralai Pattu Central 24,510 4.8Koralai Pattu South (Kiran) 19,659 3.8Manmunai West 25,025 4.9
PopulationDS division
According to the current definition, urban sector comprised of all Municipal and
Urban Council areas. The definition of urban sector is not comparable between 1981 Census
which is the last completed census for Batticaloa district and this enumeration. This
happened as a consequence of abolishing town councils which were treated as urban in the
1981 Census and absorbing the administration of such areas into Pradesheeya Sabhas which
are considered as rural since 1987. Therefore the Urban population figures and percentages
should be interpreted cautiously.
12

13

Table D : Number and percentage of population by sector (with urban localities), 2007
No. %
Batticaloa District 515,857 100.0
Urban 127,982 24.8Batticaloa Municipal Council 88,459 17.1Kattankudy Urban Council 39,523 7.7
Rural 387,875 75.2
PopulationSector and urban locality
Table D shows the population distribution by sectors. Urban and Rural percentages
are 24.8 and 75.2 respectively.
5. Age‐Sex composition
At this preliminary stage, age distribution is available only as dichotomy, i.e.
population under 18 years and 18 years and over.
Number and percentage distribution of population by age, under 18 years and 18
years and over by divisional secretariat divisions are shown in Table E. It is seen that 39.9
percent of the population are under 18 years and 60.1 percent are 18 years and over.
14

No. % No. %
Batticaloa District 515,857 205,850 39.9 310,007 60.1
Koralai Pattu North (Vaharai) 21,263 9,724 45.7 11,539 54.3Koralai Pattu West (Oddamavadi) 20,985 8,187 39.0 12,798 61.0Koralai Pattu (Valachchenai) 24,589 10,011 40.7 14,578 59.3Eravur Pattu 75,886 32,731 43.1 43,155 56.9Eravur Town 25,024 9,457 37.8 15,567 62.2Manmunai North 88,459 30,620 34.6 57,839 65.4Kattankudy 39,523 15,785 39.9 23,738 60.1Manmunai Pattu (Araipattai) 30,747 11,578 37.7 19,169 62.3Manmunai South‐ West 23,988 9,873 41.2 14,115 58.8Poratheevu Pattu 38,282 16,014 41.8 22,268 58.2Manmunai South & Eruvil Pattu 57,917 21,618 37.3 36,299 62.7Koralai Pattu Central 24,510 10,230 41.7 14,280 58.3Koralai Pattu South (Kiran) 19,659 8,832 44.9 10,827 55.1Manmunai West 25,025 11,190 44.7 13,835 55.3
Table E : Number and percentage of population by DS division and age under 18 years and 18 years and over, 2007
DS division Under 18 years 18 years and overTotal
population
Age
Sex composition of a certain population refers to the distribution of people
according to sex. A useful measure of sex composition is the sex ratio, which is defined as
the number of males per 100 females in the population. Population by sex and sex ratio by
DS divisions are shown in Table F.
Male population of Batticaloa district is less than the female population. This is the
pattern for all the DS divisions, as the sex ratios are below 100. Among 14 DS divisions, of
the district, the highest sex ratio of 99.2 was recorded for Koralai Pattu Central divisional
secretariat. Eravur Town DS division also recorded a sex ratio of 99.
15
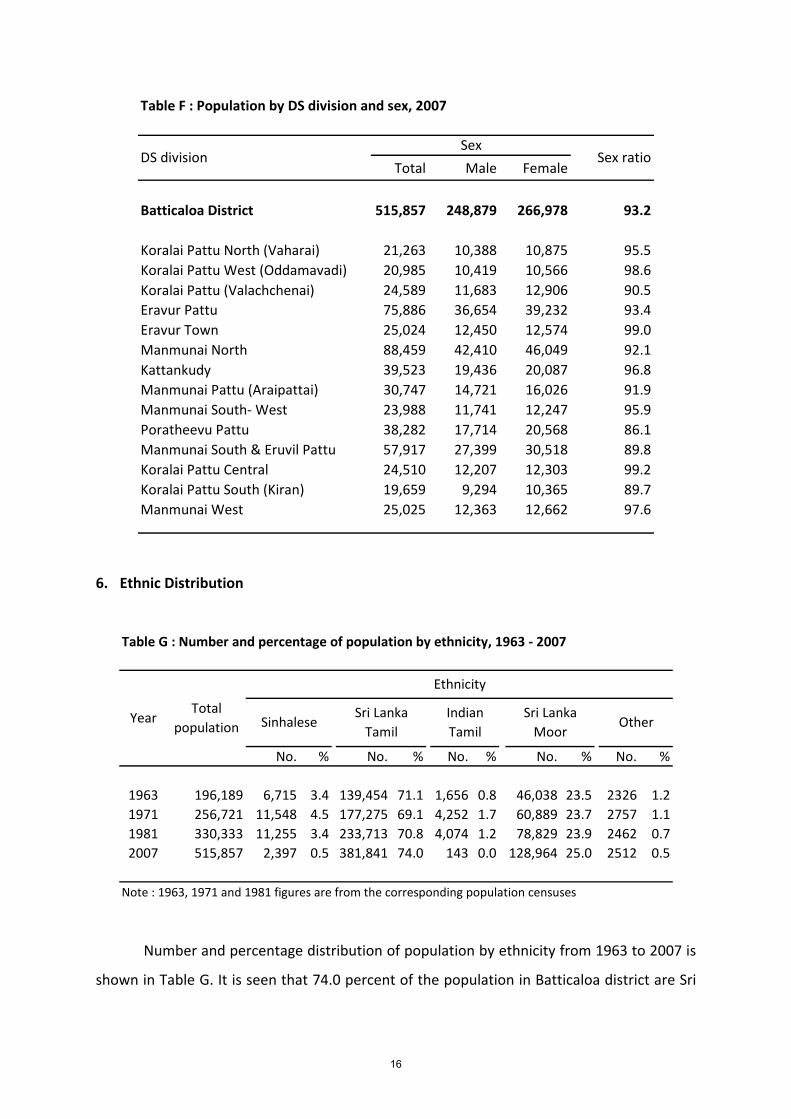
Table F : Population by DS division and sex, 2007
Total Male Female
Batticaloa District 515,857 248,879 266,978 93.2
Koralai Pattu North (Vaharai) 21,263 10,388 10,875 95.5Koralai Pattu West (Oddamavadi) 20,985 10,419 10,566 98.6Koralai Pattu (Valachchenai) 24,589 11,683 12,906 90.5Eravur Pattu 75,886 36,654 39,232 93.4Eravur Town 25,024 12,450 12,574 99.0Manmunai North 88,459 42,410 46,049 92.1Kattankudy 39,523 19,436 20,087 96.8Manmunai Pattu (Araipattai) 30,747 14,721 16,026 91.9Manmunai South‐ West 23,988 11,741 12,247 95.9Poratheevu Pattu 38,282 17,714 20,568 86.1Manmunai South & Eruvil Pattu 57,917 27,399 30,518 89.8Koralai Pattu Central 24,510 12,207 12,303 99.2Koralai Pattu South (Kiran) 19,659 9,294 10,365 89.7Manmunai West 25,025 12,363 12,662 97.6
DS divisionSex
Sex ratio
6. Ethnic Distribution
Table G : Number and percentage of population by ethnicity, 1963 ‐ 2007
No. % No. % No. % No. % No. %
1963 196,189 6,715 3.4 139,454 71.1 1,656 0.8 46,038 23.5 2326 1.21971 256,721 11,548 4.5 177,275 69.1 4,252 1.7 60,889 23.7 2757 1.11981 330,333 11,255 3.4 233,713 70.8 4,074 1.2 78,829 23.9 2462 0.72007 515,857 2,397 0.5 381,841 74.0 143 0.0 128,964 25.0 2512 0.5
Note : 1963, 1971 and 1981 figures are from the corresponding population censuses
YearTotal
population
Ethnicity
SinhaleseSri Lanka Tamil
Indian Tamil
Sri Lanka Moor
Other
Number and percentage distribution of population by ethnicity from 1963 to 2007 is
shown in Table G. It is seen that 74.0 percent of the population in Batticaloa district are Sri
16

Lanka Tamils in 2007. Sinhalese and Sri Lanka Moor comprises of 0.5 percent, 25.0 percent
respectively. (See Figure D).
Figure D : Percentage distribution of population by ethnicity, 2007
Sri Lanka Tamil,
(74.0%)
Sri Lanka Moor,
(25.0%)
Sinhalese, (0.5%)
Other*, (0.5%)
* Including Indian Tamil
Number and percentage distribution of ethnicity by DS divisions is shown in Table H.
Out of 14 DS divisions in the district, Sri Lanka Tamil is the major ethnic group in 10 DS
divisions. In the rest of 4 DS divisions viz Kattankudy, Koralai Pattu West, Koaralai Pattu
Central and Eravur Town, Sri Lanka Moor is the major ethnic group. Percentage of major
ethnic groups of the population by DS divisions are shown in Figure E.
17

Table H : Number and percentage of population by DS division and ethnicity, 2007
No. % No. % No. % No. % No. % No. % No. %
Batticaloa District 515,857 2,397 0.5 381,841 74.0 143 0.0 128,964 25.0 2,412 0.5 81 0.0 19 0.0
Koralai Pattu North (Vaharai) 21,263 1 0.0 21,262 100.0 ‐ ‐ ‐ ‐ ‐ ‐ ‐ ‐ ‐ ‐Koralai Pattu West (Oddamavadi) 20,985 3 0.0 147 0.7 ‐ ‐ 20,832 99.3 3 0.0 ‐ ‐ ‐ ‐Koralai Pattu (Valachchenai) 24,589 69 0.3 24,436 99.4 18 0.1 25 0.1 40 0.2 1 0.0 ‐ ‐Eravur Pattu 75,886 1,430 1.9 61,058 80.5 7 0.0 13,333 17.6 58 0.1 ‐ ‐ ‐ ‐Eravur Town 25,024 4 0.0 3,497 14.0 ‐ ‐ 21,447 85.7 76 0.3 ‐ ‐ ‐ ‐Manmunai North 88,459 226 0.3 82,031 92.7 63 0.1 3,845 4.3 2,197 2.5 80 0.1 17 0.0Kattankudy 39,523 ‐ ‐ 5 0.0 ‐ ‐ 39,517 100.0 ‐ ‐ ‐ ‐ 1 0.0Manmunai Pattu (Araipattai) 30,747 1 0.0 24,202 78.7 2 0.0 6,541 21.3 1 0.0 ‐ ‐ ‐ ‐Manmunai South‐ West 23,988 199 0.8 23,789 99.2 ‐ ‐ ‐ ‐ ‐ ‐ ‐ ‐ ‐ ‐Poratheevu Pattu 38,282 354 0.9 37,927 99.1 1 0.0 ‐ ‐ ‐ ‐ ‐ ‐ ‐ ‐Manmunai South & Eruvil Pattu 57,917 18 0.0 57,855 99.9 39 0.1 3 0.0 1 0.0 ‐ ‐ 1 0.0Koralai Pattu Central 24,510 84 0.3 969 4.0 ‐ ‐ 23,421 95.6 36 0.1 ‐ ‐ ‐ ‐Koralai Pattu South (Kiran) 19,659 7 0.0 19,639 99.9 13 0.1 ‐ ‐ ‐ ‐ ‐ ‐ ‐ ‐Manmunai West 25,025 1 0.0 25,024 100.0 ‐ ‐ ‐ ‐ ‐ ‐ ‐ ‐ ‐ ‐
Malay Other
Ethnicity
Total population
DS division BurgherSri Lanka Moor
Indian Tamil
Sri Lanka Tamil
Sinhalese
18

19

7. Displaced Population
No. % No. %
Batticaloa District 515,857 47,558 40,833 85.9 6,725 14.1 468,299
Koralai Pattu North (Vaharai) 21,263 5,435 1,093 20.1 4,342 79.9 15,828Koralai Pattu West (Oddamavadi) 20,985 42 27 64.3 15 35.7 20,943Koralai Pattu (Valachchenai) 24,589 2,702 2,702 100.0 ‐ ‐ 21,887Eravur Pattu 75,886 17,586 17,276 98.2 310 1.8 58,300Eravur Town 25,024 91 84 92.3 7 7.7 24,933Manmunai North 88,459 9,771 9,081 92.9 690 7.1 78,688Kattankudy 39,523 263 237 90.1 26 9.9 39,260Manmunai Pattu (Araipattai) 30,747 1,529 874 57.2 655 42.8 29,218Manmunai South‐ West 23,988 363 357 98.3 6 1.7 23,625Poratheevu Pattu 38,282 451 442 98.0 9 2.0 37,831Manmunai South & Eruvil Pattu 57,917 2,306 1,967 85.3 339 14.7 55,611Koralai Pattu Central 24,510 604 582 96.4 22 3.6 23,906Koralai Pattu South (Kiran) 19,659 6,411 6,107 95.3 304 4.7 13,248Manmunai West 25,025 4 4 100.0 ‐ ‐ 25,021
Table I : Number and percentage of displaced population by DS division and reason for displacement, 2007
Not displaced
Due to conflict
Due to tsunami
DS divisionTotal
populationTotal
displaced
Reason for displacement
One who change his/her place of residence due to conflict or tsunami is identified as
a displaced person. People are completely displaced in 23 Grama Niladhari divisions which
belong to 3 DS divisions in Batticaloa district mainly due to conflict. Out of total 47,558
displaced persons in the district, 40,833 are displaced due to conflict. Rest are displaced due
to tsunami disaster. These displaced persons are living in 48 welfare centres situated in 7 DS
divisions in the district at the time of enumeration . Highest number of displaced persons
(40.0 percent) are recorded from Eravur Pattu DS division. This is schematically shown in
Figure F.
20

21

APPENDIX

Male FemaleUnder 18 years
18 years and over
Batticaloa District 515,857 248,879 266,978 205,850 310,007
Koralai Pattu North (Vaharai) 21,263 10,388 10,875 9,724 11,539
211 Mankerny Central 547 256 291 250 297211 A Kayankerni 975 460 515 473 502211 B Punanai East (part) 2,275 1,109 1,166 1,068 1,207211 C Panichankerni 1,776 819 957 778 998211 D Vattavan 1,161 537 624 524 637211 E Mathurankernikulam 983 504 479 402 581211 F Kirimichai 990 476 514 441 549211 G Mankerny South 821 390 431 406 415212 Vaharai Central 319 158 161 120 199212 A Vaharai North 1,758 841 917 687 1,071212 B Ooriyankattu 1,902 965 937 856 1,046213 Kathiraveli 2,287 1,160 1,127 1,112 1,175213 A Palchenai 1,900 914 986 951 949213 B Kaddumurivu 626 293 333 303 323213 C Puchakerni 1,369 694 675 656 713213 D Ammanthanaveli 1,574 812 762 697 877
Koralai Pattu West (Oddamavadi) 20,985 10,419 10,566 8,187 12,798
207 Meeravodai Muslim West 2,614 1,299 1,315 1,090 1,524207 A Mancholai 2,238 1,060 1,178 846 1,392207 B Meeravodai Muslim East 2,992 1,468 1,524 1,134 1,858208 Oddamavady 3 2,452 1,207 1,245 950 1,502208 B Oddamavady 1 South 2,162 1,101 1,061 770 1,392208 B/2 Oddamavady 1 North 3,055 1,520 1,535 1,203 1,852208 C Oddamavady 2 2,165 1,106 1,059 819 1,346210 Paper Town 3,307 1,658 1,649 1,375 1,932
Koralai Pattu (Valachchenai) 24,589 11,683 12,906 10,011 14,578
202 Meeravodai Tamil 831 407 424 378 453202 A Karuwakerny 2,140 983 1,157 832 1,308202 B Kinnayadi 2,677 1,283 1,394 1,275 1,402202 C Sungankerni 2,088 1,056 1,032 981 1,107203 B Kumburumoolai 583 270 313 207 376204 Kalkuda 2,012 994 1,018 800 1,212204 A Kalmadu 4,673 2,236 2,437 2,001 2,672
205 Valaichenai Tamil 1,395 630 765 449 946205 A Puthukudiyiruppu 2,010 924 1,086 663 1,347205 B Pethalai 2,912 1,370 1,542 1,112 1,800205 C Nasivanthivu 1,060 494 566 510 550
Special Enumeration, 2007
AgeSexTotal
populationDS division and GN division
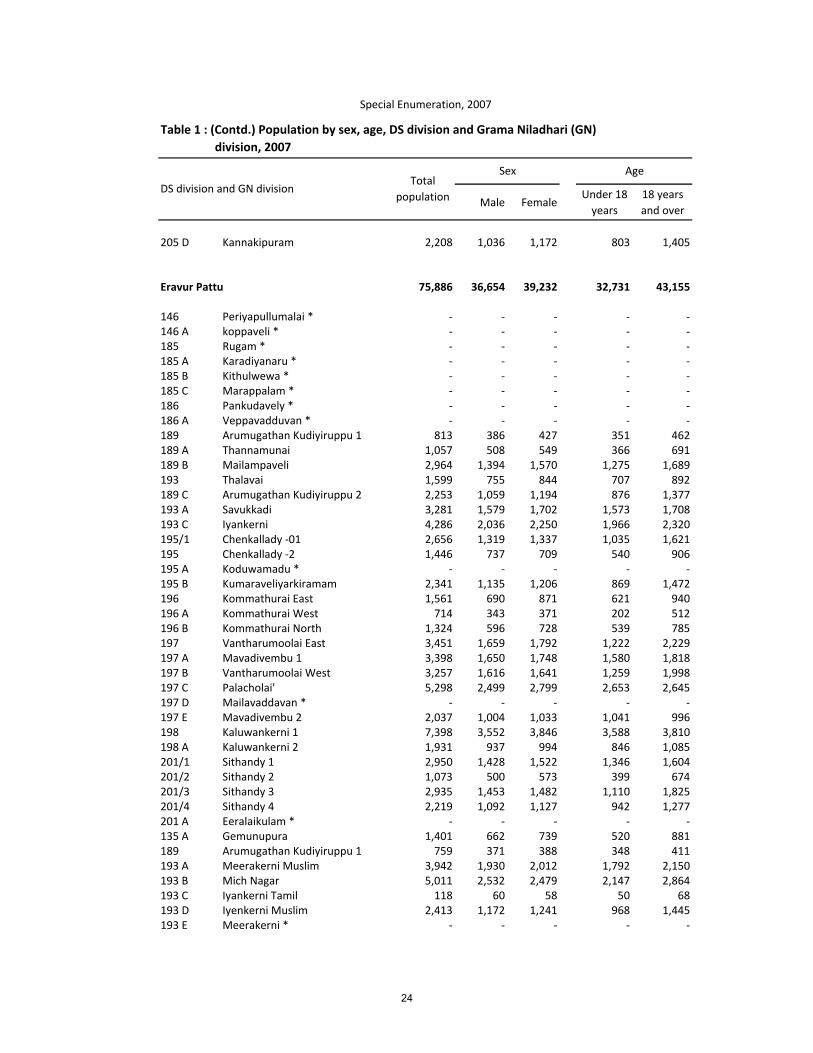
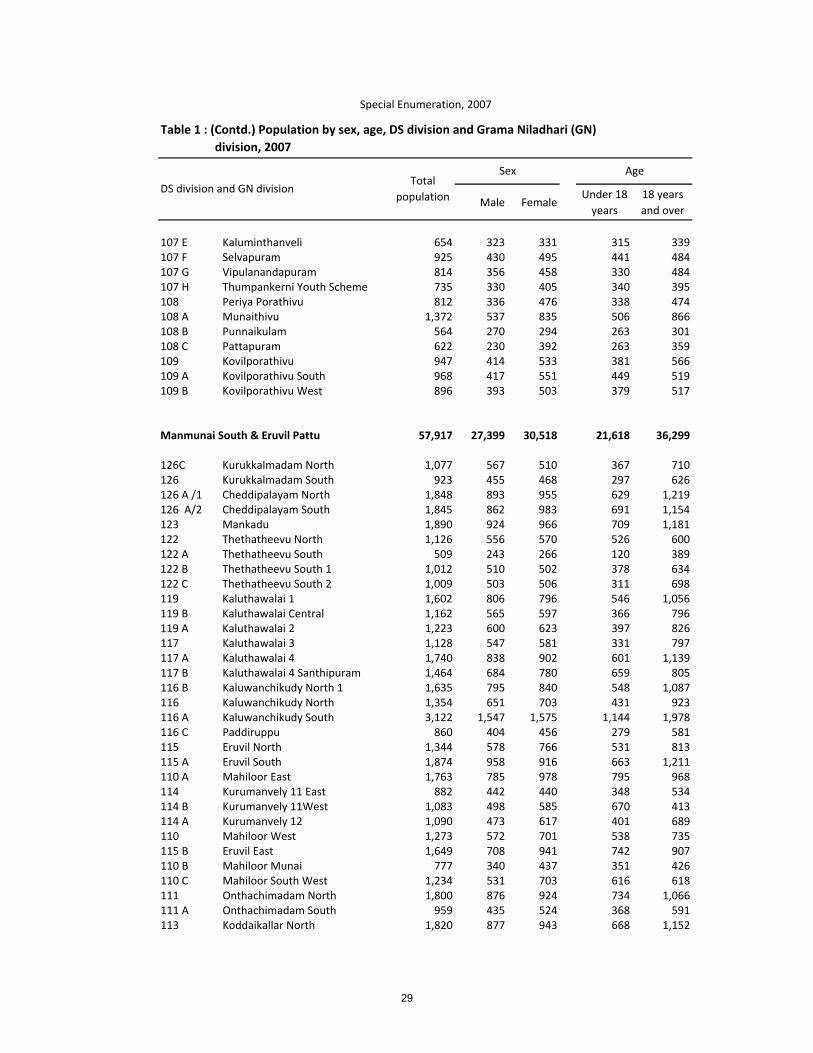
Table 1 : Population by sex, age, DS division and Grama Niladhari (GN) division, 2007
23
Male FemaleUnder 18 years
18 years and over
205 D Kannakipuram 2,208 1,036 1,172 803 1,405
Eravur Pattu 75,886 36,654 39,232 32,731 43,155
146 Periyapullumalai * ‐ ‐ ‐ ‐ ‐146 A koppaveli * ‐ ‐ ‐ ‐ ‐185 Rugam * ‐ ‐ ‐ ‐ ‐185 A Karadiyanaru * ‐ ‐ ‐ ‐ ‐185 B Kithulwewa * ‐ ‐ ‐ ‐ ‐185 C Marappalam * ‐ ‐ ‐ ‐ ‐186 Pankudavely * ‐ ‐ ‐ ‐ ‐186 A Veppavadduvan * ‐ ‐ ‐ ‐ ‐189 Arumugathan Kudiyiruppu 1 813 386 427 351 462189 A Thannamunai 1,057 508 549 366 691189 B Mailampaveli 2,964 1,394 1,570 1,275 1,689193 Thalavai 1,599 755 844 707 892189 C Arumugathan Kudiyiruppu 2 2,253 1,059 1,194 876 1,377193 A Savukkadi 3,281 1,579 1,702 1,573 1,708193 C Iyankerni 4,286 2,036 2,250 1,966 2,320195/1 Chenkallady ‐01 2,656 1,319 1,337 1,035 1,621195 Chenkallady ‐2 1,446 737 709 540 906195 A Koduwamadu * ‐ ‐ ‐ ‐ ‐195 B Kumaraveliyarkiramam 2,341 1,135 1,206 869 1,472196 Kommathurai East 1,561 690 871 621 940196 A Kommathurai West 714 343 371 202 512196 B Kommathurai North 1,324 596 728 539 785197 Vantharumoolai East 3,451 1,659 1,792 1,222 2,229197 A Mavadivembu 1 3,398 1,650 1,748 1,580 1,818197 B Vantharumoolai West 3,257 1,616 1,641 1,259 1,998197 C Palacholai' 5,298 2,499 2,799 2,653 2,645197 D Mailavaddavan * ‐ ‐ ‐ ‐ ‐197 E Mavadivembu 2 2,037 1,004 1,033 1,041 996198 Kaluwankerni 1 7,398 3,552 3,846 3,588 3,810198 A Kaluwankerni 2 1,931 937 994 846 1,085201/1 Sithandy 1 2,950 1,428 1,522 1,346 1,604201/2 Sithandy 2 1,073 500 573 399 674201/3 Sithandy 3 2,935 1,453 1,482 1,110 1,825201/4 Sithandy 4 2,219 1,092 1,127 942 1,277201 A Eeralaikulam * ‐ ‐ ‐ ‐ ‐135 A Gemunupura 1,401 662 739 520 881189 Arumugathan Kudiyiruppu 1 759 371 388 348 411193 A Meerakerni Muslim 3,942 1,930 2,012 1,792 2,150193 B Mich Nagar 5,011 2,532 2,479 2,147 2,864193 C Iyankerni Tamil 118 60 58 50 68193 D Iyenkerni Muslim 2,413 1,172 1,241 968 1,445193 E Meerakerni * ‐ ‐ ‐ ‐ ‐
Total population
Sex Age
Special Enumeration, 2007
Table 1 : (Contd.) Population by sex, age, DS division and Grama Niladhari (GN) division, 2007
DS division and GN division
24

Male FemaleUnder 18 years
18 years and over
Total population
Sex Age
Special Enumeration, 2007
Table 1 : (Contd.) Population by sex, age, DS division and Grama Niladhari (GN) division, 2007
DS division and GN division
Eravur Town 25,024 12,450 12,574 9,457 15,567
190 Eravur 1 1,207 581 626 476 731190 A Eravur 1 A 1,621 807 814 569 1,052190 B Eravur 1 B 1,579 735 844 629 950191 Eravur 2 1,661 861 800 671 990191 A Eravur 2 A 1,729 854 875 668 1,061191 B Eravur 2 B 1,014 524 490 410 604191 C Eravur 2 C 2,302 1,137 1,165 894 1,408192 Eravur 3 3,008 1,509 1,499 1,216 1,792192 A Eravur 6 1,192 592 600 421 771192 B Eravur 3 A 3,322 1,697 1,625 1,274 2,048192 C Eravur 6 A 1,560 748 812 573 987192 D Eravur 6 D 1,280 644 636 421 859194 Eravur 4 893 425 468 343 550194 A Eravur 5 1,679 848 831 553 1,126194 B Ellainagar 977 488 489 339 638
Manmunai North 88,459 42,410 46,049 30,620 57,839
168 Manchanthoduwai North 662 308 354 216 446168 A Manchanthoduwai South 2,760 1,310 1,450 1,152 1,608168 B Navatkudah 1,500 723 777 459 1,041168 C Navatkudah East 2,928 1,391 1,537 1,184 1,744168 D Navatkudah South 1,583 737 846 549 1,034171 A Nochimunai 3,519 1,737 1,782 1,239 2,280171 B Kalladi Uppodai 2,233 1,111 1,122 1,001 1,232171 C Kalladi Veloor 2,981 1,455 1,526 1,010 1,971171 Kallady 2,275 1,105 1,170 629 1,646172 Navalady 393 232 161 109 284172 A Kalladi Muhathuvaram 1,309 639 670 336 973172 B Thiruchendhur 2,296 1,137 1,159 797 1,499172 C Dutch Bar 307 169 138 88 219173 Amirthakali 2,448 1,146 1,302 701 1,747173 A Mamangam 1,998 974 1,024 724 1,274173 B Iruthayapuram East 2,145 1,032 1,113 720 1,425173 C Palameenmadu 2,091 1,010 1,081 856 1,235173 D Punnaicholai 1,896 905 991 675 1,221173 E Thiraimadu 2,339 1,153 1,186 927 1,412173 F Koolavadi 939 444 495 318 621173 G Gnansooriyam Square 1,796 884 912 486 1,310173 H Barathipuram 1,544 741 803 402 1,142173 I Koolavadi East 1,176 572 604 358 818173 J Thisaveerasingam Square 1,271 607 664 411 860
25

Male FemaleUnder 18 years
18 years and over
Total population
Sex Age
Special Enumeration, 2007
Table 1 : (Contd.) Population by sex, age, DS division and Grama Niladhari (GN) division, 2007
DS division and GN division
173 K Vettukkadu 1,201 542 659 398 803176 Kokkuvil 2,660 1,270 1,390 1,101 1,559176 A Sathurukondan 2,670 1,220 1,450 1,198 1,472176 B Karuveppenkerny 2,566 1,218 1,348 958 1,608176 C Periya Urany 1,274 513 761 481 793176 D Panichayadi 891 455 436 338 553176 E Iruthayapuram West 2,241 1,081 1,160 823 1,418176 F Sinna Urany 4,245 2,026 2,219 1,677 2,568176 G Jeyanthipuram 1,026 469 557 338 688176 H Iruthayapuram Central 936 434 502 298 638177 Thandavanveli 2,591 1,239 1,352 706 1,885177 A Arasadi 1,212 573 639 378 834177 B Thamaraikerny 1,749 751 998 519 1,230178 Koddamunai 1,508 728 780 425 1,083178 A Periya Uppodai 3,807 1,770 2,037 1,110 2,697179 Puliyanthivu East 1,768 844 924 504 1,264179 A Puliyanthivu West 1,409 618 791 441 968179 B Puliyanthivu Central 1,051 514 537 323 728179 C Puliyanthivu South 2,806 1,455 1,351 782 2,024181 Thimilathivu 1,102 495 607 407 695181 A Thirupperunthurai 1,658 919 739 722 936181 B Veechukalmunai 741 351 390 247 494181 C Puthunagar 1,883 912 971 708 1,175181 D Sethukudah 1,075 491 584 391 684
Kattankudy 39,523 19,436 20,087 15,785 23,738
164 A Kathankudy 5 2,219 1,059 1,160 951 1,268165 Kathankudy 3 1,312 637 675 500 812167 C New Kathankudy South 4,465 2,340 2,125 1,728 2,737162 Kathankudy 6 2,520 1,151 1,369 1,074 1,446166 A Kathankudy 2 North 2,275 1,134 1,141 916 1,359167 E Kathankudy 1 South 1,919 957 962 680 1,239164 B Kathankudy 5 South 841 394 447 443 398167 B New Kathankudy East 4,934 2,431 2,503 2,044 2,890164 Kathankudy 4 1,228 623 605 489 739166 Kathankudy 2 2,045 1,044 1,001 777 1,268167 D New Kathankudy West 1,980 889 1,091 791 1,189162 B Kathankudy 6 West 1,728 752 976 716 1,012165 A Kathankudy 3 West 1,020 518 502 364 656167 Kathankudy 1 1,105 543 562 421 684164 C Kathankudy 4 West 1,606 889 717 625 981165 B Kathankudy 3 East 1,292 648 644 510 782167 A New Kathankudy North 4,450 2,144 2,306 1,789 2,661162 A Kathankudy 6 South 2,584 1,283 1,301 967 1,617
26

Male FemaleUnder 18 years
18 years and over
Total population
Sex Age
Special Enumeration, 2007
Table 1 : (Contd.) Population by sex, age, DS division and Grama Niladhari (GN) division, 2007
DS division and GN division
Manmunai Pattu (Araipattai) 30,747 14,721 16,026 11,578 19,169
156 D Arayampathy Central 485 225 260 132 353155 B Kankeyanodai South 1,331 663 668 491 840153 Thalankuda 1,309 637 672 460 849154 Mavilankanthurai 951 460 491 410 541156 C Kovilkulam 911 438 473 357 554153 A Manmunai 878 405 473 360 518155 Kankeyanodai 976 444 532 388 588155 A Ollikulam 428 204 224 176 252156 B Arayampathy 3 South 978 447 531 646 332150 Kirankulam North 1,446 721 725 509 937150 A Kirankulam South 1,224 595 629 472 752150 B Kirankulam 1,377 681 696 482 895150 C Kirankulam Central 974 467 507 349 625151 Puthukudiyiruppu 1,178 564 614 417 761151 B Puthukudiyiruppu North 1,766 885 881 665 1,101151 A Puthukudiyiruppu South 933 443 490 382 551153 B Veder Kudiyiruppu 1,178 573 605 472 706152 Palamunai 2,536 1,277 1,259 1,138 1,398157 C Arayampathy East 2,049 963 1,086 796 1,253157 Arayampathy 2 419 197 222 125 294158 A Arayampathy West 736 312 424 177 559157 A Selvanagar 1,582 736 846 435 1,147157 D Arayampathy North 575 265 310 175 400156 Arayampathy 3 697 330 367 171 526157 B Selvanagar East 2,161 1,020 1,141 909 1,252156 A Rasathuraikiramam 907 443 464 313 594158 Arayampathy 1 762 326 436 171 591
Manmunai South‐ West 23,988 11,741 12,247 9,873 14,115
128 Ampilanthurai 1,208 621 587 413 795128 A Ampilanthurai West 793 378 415 324 469128 B Ampilanthurai North 630 313 317 236 394128 C Katchenai 663 337 326 286 377129 Arasadithivu 1,100 534 566 402 698129 A Kadukkamunai 1,538 761 777 634 904129 B Paddipalai 735 377 358 293 442129 C Arasadithivu North 1,019 495 524 411 608130 Pandariyaveli 1,215 559 656 488 727130 A Mahiladithivu 788 373 415 284 504130 B Mahiladithivu South 1,910 931 979 820 1,090132 Muthalaikdua 838 422 416 325 513132 A Muthalaikdua West 1,084 496 588 439 645
27

Male FemaleUnder 18 years
18 years and over
Total population
Sex Age
Special Enumeration, 2007
Table 1 : (Contd.) Population by sex, age, DS division and Grama Niladhari (GN) division, 2007
DS division and GN division
134 Munaikadu East 779 367 412 285 494134 A Munaikadu West 1,145 561 584 467 678134 B Munaikadu South 1,060 525 535 462 598134 C Munaikadu North 1,259 614 645 569 690135 Kokkaddicholai 1,682 830 852 702 980135 A Kokkaddicholai South 1,418 697 721 563 855136 Mavadimunmari 482 247 235 221 261136 A Thanthamalai 910 453 457 441 469136 B Kuluvinamadu 678 323 355 311 367136 C Kachakody 746 382 364 345 401136 D Panichachyadimunmari 308 145 163 152 156
Poratheevu Pattu 38,282 17,714 20,568 16,014 22,268
96 Mandur 3 871 383 488 319 55296 A Mandur Kottamunai 953 463 490 362 59197 Mandur 1 & 2 732 348 384 189 54397 A Palamunai 1,852 921 931 653 1,19997 B Mandur South 1,120 551 569 425 69598 Thambalawatrha 1,377 647 730 537 84098 A Ranamadu 276 120 156 122 15498 B Sankarpuram 1,396 603 793 622 77498 C Kanesapuram 1,082 506 576 462 62099 Vellavely 1,206 579 627 448 75899 A Kakkachchivaddai 1,132 564 568 532 60099 B Palayadivaddai 1,140 580 560 442 69899 C Sinnawathai 1,301 659 642 547 75499 D Vilanthottam 589 264 325 278 31199 E Anaikattiyaveli 593 278 315 302 29199 F Nellikadu 715 319 396 317 39899 G Kannapuram 712 354 358 303 40999 H Malayarkattu 805 375 430 339 46699 I Palacholai 812 378 434 420 39299 J Vivekananthapuram 645 278 367 296 34999 K Kannapuram East 761 335 426 341 420106 Palugamam 2 833 392 441 303 530106 A Thikkodai 1,522 755 767 678 844106 B Veeranchenai 612 267 345 247 365106 C Thumpankerni 500 239 261 192 308106 D Vanninagar 1,085 539 546 458 627106 E Suravaanaiyadi Oothu 504 203 301 239 265107 Palugamam 1 503 247 256 170 333107 A Navagirinagar 430 214 216 183 247107 B Ganthipuram 707 322 385 336 371107 C Vammiyadioothu 1,228 548 680 588 640107 D Mavetkudah 979 447 532 359 620
28
Male FemaleUnder 18 years
18 years and over
Total population
Sex Age
Special Enumeration, 2007
Table 1 : (Contd.) Population by sex, age, DS division and Grama Niladhari (GN) division, 2007
DS division and GN division
107 E Kaluminthanveli 654 323 331 315 339107 F Selvapuram 925 430 495 441 484107 G Vipulanandapuram 814 356 458 330 484107 H Thumpankerni Youth Scheme 735 330 405 340 395108 Periya Porathivu 812 336 476 338 474108 A Munaithivu 1,372 537 835 506 866108 B Punnaikulam 564 270 294 263 301108 C Pattapuram 622 230 392 263 359109 Kovilporathivu 947 414 533 381 566109 A Kovilporathivu South 968 417 551 449 519109 B Kovilporathivu West 896 393 503 379 517
Manmunai South & Eruvil Pattu 57,917 27,399 30,518 21,618 36,299
126C Kurukkalmadam North 1,077 567 510 367 710126 Kurukkalmadam South 923 455 468 297 626126 A /1 Cheddipalayam North 1,848 893 955 629 1,219126 A/2 Cheddipalayam South 1,845 862 983 691 1,154123 Mankadu 1,890 924 966 709 1,181122 Thethatheevu North 1,126 556 570 526 600122 A Thethatheevu South 509 243 266 120 389122 B Thethatheevu South 1 1,012 510 502 378 634122 C Thethatheevu South 2 1,009 503 506 311 698119 Kaluthawalai 1 1,602 806 796 546 1,056119 B Kaluthawalai Central 1,162 565 597 366 796119 A Kaluthawalai 2 1,223 600 623 397 826117 Kaluthawalai 3 1,128 547 581 331 797117 A Kaluthawalai 4 1,740 838 902 601 1,139117 B Kaluthawalai 4 Santhipuram 1,464 684 780 659 805116 B Kaluwanchikudy North 1 1,635 795 840 548 1,087116 Kaluwanchikudy North 1,354 651 703 431 923116 A Kaluwanchikudy South 3,122 1,547 1,575 1,144 1,978116 C Paddiruppu 860 404 456 279 581115 Eruvil North 1,344 578 766 531 813115 A Eruvil South 1,874 958 916 663 1,211110 A Mahiloor East 1,763 785 978 795 968114 Kurumanvely 11 East 882 442 440 348 534114 B Kurumanvely 11West 1,083 498 585 670 413114 A Kurumanvely 12 1,090 473 617 401 689110 Mahiloor West 1,273 572 701 538 735115 B Eruvil East 1,649 708 941 742 907110 B Mahiloor Munai 777 340 437 351 426110 C Mahiloor South West 1,234 531 703 616 618111 Onthachimadam North 1,800 876 924 734 1,066111 A Onthachimadam South 959 435 524 368 591113 Koddaikallar North 1,820 877 943 668 1,152
29

Male FemaleUnder 18 years
18 years and over
Total population
Sex Age
Special Enumeration, 2007
Table 1 : (Contd.) Population by sex, age, DS division and Grama Niladhari (GN) division, 2007
DS division and GN division
113 C Koddaikallar West 1,157 538 619 431 726113 B Koddaikallar East 1,041 434 607 376 665113 A Koddaikallar South 900 415 485 307 59376 Periyakallar 1 1,067 452 615 358 70976 A Periyakallar 1 South 1,257 609 648 382 87575 Periyakallar 2 1,077 523 554 294 78375 B Periyakallar 2 West 1,221 572 649 362 85975 A Periyakallar 3 806 389 417 260 54675 C Periyakallar 3 South 998 472 526 368 63074 Thuiraineelavanai North 1,241 541 700 537 70474 B Thuiraineelavanai North 1 773 374 399 268 50574 A Thuiraineelavanai South 983 476 507 366 61774 C Thuiraineelavanai South 1 1,319 581 738 554 765
Koralai Pattu Central 24,510 12,207 12,303 10,230 14,280
206 Valaichenai 4 Muslim 2,142 1,104 1,038 853 1,289206 A Brainthuraichenai North 2,974 1,489 1,485 1,270 1,704206 B Valaichenai 5 Muslim 1,983 1,049 934 798 1,185206 C Brainthuraichenai South 4,524 2,235 2,289 1,939 2,585206 D Valaichenai 5 South Muslim 2,652 1,311 1,341 1,048 1,604208 A Mavadichenai 2,741 1,373 1,368 1,102 1,639208 D Chemman Odai 3,771 1,771 2,000 1,568 2,203210 C Thiyavattavan 1,926 945 981 841 1,085211 B Regithenna , Jeyanthiyaya 1,797 930 867 811 986
Koralai Pattu South (Kiran) 19,659 9,294 10,365 8,832 10,827
199 Murakkottanchenai 2,010 968 1,042 860 1,150199 A Thevapuram 1,844 839 1,005 810 1,034200 Santhiveli 3,874 1,885 1,989 1,700 2,174200 A Thihilivaddai * ‐ ‐ ‐ ‐ ‐201 Palayadithona 2,879 1,383 1,496 1,471 1,408203 Kiran East 4,062 1,905 2,157 1,758 2,304203 A Kiran West 1,564 719 845 638 926203 C Korakallimadu 3,223 1,489 1,734 1,507 1,716209 Perillaveli * ‐ ‐ ‐ ‐ ‐209 A Muruthanai * ‐ ‐ ‐ ‐ ‐209 B Koraveli * ‐ ‐ ‐ ‐ ‐209 C Poolakadu * ‐ ‐ ‐ ‐ ‐209 D Kudumpimalai * ‐ ‐ ‐ ‐ ‐210 Vahaneri * ‐ ‐ ‐ ‐ ‐210 A/1 Vadamunai * ‐ ‐ ‐ ‐ ‐210 A/2 Othuchenai * ‐ ‐ ‐ ‐ ‐210 B Punanai West 203 106 97 88 115
30

Male FemaleUnder 18 years
18 years and over
Total population
Sex Age
Special Enumeration, 2007
Table 1 : (Contd.) Population by sex, age, DS division and Grama Niladhari (GN) division, 2007
DS division and GN division
210 A Kallichchai * ‐ ‐ ‐ ‐ ‐
Manmunai West 25,025 12,363 12,662 11,190 13,835‐ ‐ ‐ ‐ ‐
148 Iluppadichenai 1,229 598 631 573 656148 A Pavatkodichenai 1,653 842 811 806 847148 B Panchenai 843 428 415 413 430148 C Kanthinagar 564 276 288 300 264148 D Kanchirankudah 1,953 953 1,000 1,026 927148 E Kothiyapulai 1,005 489 516 449 556149 Kannankudah 1,004 508 496 378 626149 A Karayakkanthivu 998 497 501 412 586149 B Kurinchamunai 1,190 596 594 512 678149 C Mandapathady 803 392 411 337 466149 D Paruththichenai 991 491 500 458 533149 E Puthumandapathady 1,721 854 867 777 944182 Eachchanthivu 1,109 546 563 467 642182 A Vavunathivu 695 333 362 295 400182 B Navatkadu 1,422 685 737 576 846182 C Mankikaddu 479 221 258 201 278183 Karavetti 1,702 841 861 690 1,012183 A Vilavettuvan 1,563 780 783 661 902184 Mahilavattuvan 1,564 784 780 645 919184 A Unnichai 968 476 492 476 492184 D Naripulthottam 967 480 487 425 542184 E Nediyamadu 602 293 309 313 289184 B Aithiyamalai North* ‐ ‐ ‐ ‐ ‐184 C Aithiyamalai South* ‐ ‐ ‐ ‐ ‐
* Population has not been enumerated in these GN Division areas where all the people have been displaced and the resettlement has not taken place at the time of the enumeration
31

No. % No. %
Batticaloa District 515,857 47,558 40,833 85.9 6,725 14.1 468,299
Koralai Pattu North (Vaharai) 21,263 5,435 1,093 20.1 4,342 79.9 15,828
211 Mankerny Central 547 ‐ ‐ ‐ ‐ ‐ 547211 A Kayankerni 975 ‐ ‐ ‐ ‐ ‐ 975211 B Punanai East (part) 2,275 1,007 1,007 100.0 ‐ ‐ 1,268211 C Panichankerni 1,776 906 67 7.4 839 92.6 870211 D Vattavan 1,161 19 19 100.0 ‐ ‐ 1,142211 E Mathurankernikulam 983 ‐ ‐ ‐ ‐ ‐ 983211 F Kirimichai 990 ‐ ‐ ‐ ‐ ‐ 990211 G Mankerny South 821 ‐ ‐ ‐ ‐ ‐ 821212 Vaharai Central 319 ‐ ‐ ‐ ‐ ‐ 319212 A Vaharai North 1,758 ‐ ‐ ‐ ‐ ‐ 1,758212 B Ooriyankattu 1,902 17 ‐ ‐ 17 100.0 1,885213 Kathiraveli 2,287 364 ‐ ‐ 364 100.0 1,923213 A Palchenai 1,900 1,213 ‐ ‐ 1,213 100.0 687213 B Kaddumurivu 626 ‐ ‐ ‐ ‐ ‐ 626213 C Puchakerni 1,369 335 ‐ ‐ 335 100.0 1,034213 D Ammanthanaveli 1,574 1,574 ‐ ‐ 1,574 100.0 ‐
Koralai Pattu West (Oddamavadi) 20,985 42 27 64.3 15 35.7 20,943
207 Meeravodai Muslim West 2,614 ‐ ‐ ‐ ‐ ‐ 2,614207 A Mancholai 2,238 17 13 76.5 4 23.5 2,221207 B Meeravodai Muslim East 2,992 ‐ ‐ ‐ ‐ ‐ 2,992208 Oddamavady 3 2,452 ‐ ‐ ‐ ‐ ‐ 2,452208 B Oddamavady 1 South 2,162 0 ‐ ‐ ‐ ‐ 2,162208 B/2 Oddamavady 1 North 3,055 16 5 31.3 11 68.8 3,039208 C Oddamavady 2 2,165 9 9 100.0 ‐ ‐ 2,156210 Paper Town 3,307 ‐ ‐ ‐ ‐ ‐ 3,307
Koralai Pattu (Valachchenai) 24,589 2,702 2,702 100.0 ‐ ‐ 21,887
202 Meeravodai Tamil 831 39 39 100.0 ‐ ‐ 792202 A Karuwakerny 2,140 173 173 100.0 ‐ ‐ 1,967202 B Kinnayadi 2,677 486 486 100.0 ‐ ‐ 2,191202 C Sungankerni 2,088 525 525 100.0 ‐ ‐ 1,563203 B Kumburumoolai 583 3 3 100.0 ‐ ‐ 580204 Kalkuda 2,012 2 2 100.0 ‐ ‐ 2,010204 A Kalmadu 4,673 1,150 1,150 100.0 ‐ ‐ 3,523205 Valaichenai Tamil 1,395 36 36 100.0 ‐ ‐ 1,359205 A Puthukudiyiruppu 2,010 150 150 100.0 ‐ ‐ 1,860205 B Pethalai 2,912 76 76 100.0 ‐ ‐ 2,836
Special Enumeration, 2007
DS division and GN divisionNot
displacedDue to conflict
Due to tsunami
Total population
Total displaced
Reason for displacement
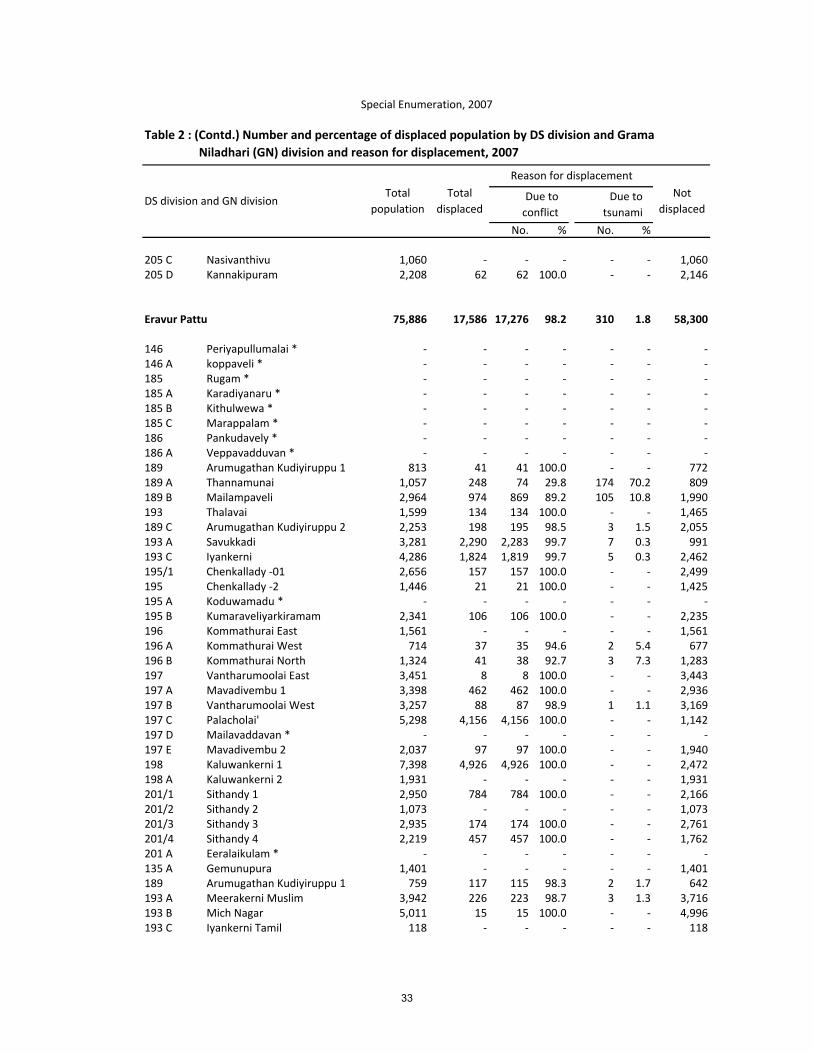
Table 2 : Number and percentage of displaced population by DS division and Grama Niladhari (GN) division and reason for displacement, 2007
32
No. % No. %
205 C Nasivanthivu 1,060 ‐ ‐ ‐ ‐ ‐ 1,060205 D Kannakipuram 2,208 62 62 100.0 ‐ ‐ 2,146
Eravur Pattu 75,886 17,586 17,276 98.2 310 1.8 58,300
146 Periyapullumalai * ‐ ‐ ‐ ‐ ‐ ‐ ‐146 A koppaveli * ‐ ‐ ‐ ‐ ‐ ‐ ‐185 Rugam * ‐ ‐ ‐ ‐ ‐ ‐ ‐185 A Karadiyanaru * ‐ ‐ ‐ ‐ ‐ ‐ ‐185 B Kithulwewa * ‐ ‐ ‐ ‐ ‐ ‐ ‐185 C Marappalam * ‐ ‐ ‐ ‐ ‐ ‐ ‐186 Pankudavely * ‐ ‐ ‐ ‐ ‐ ‐ ‐186 A Veppavadduvan * ‐ ‐ ‐ ‐ ‐ ‐ ‐189 Arumugathan Kudiyiruppu 1 813 41 41 100.0 ‐ ‐ 772189 A Thannamunai 1,057 248 74 29.8 174 70.2 809189 B Mailampaveli 2,964 974 869 89.2 105 10.8 1,990193 Thalavai 1,599 134 134 100.0 ‐ ‐ 1,465189 C Arumugathan Kudiyiruppu 2 2,253 198 195 98.5 3 1.5 2,055193 A Savukkadi 3,281 2,290 2,283 99.7 7 0.3 991193 C Iyankerni 4,286 1,824 1,819 99.7 5 0.3 2,462195/1 Chenkallady ‐01 2,656 157 157 100.0 ‐ ‐ 2,499195 Chenkallady ‐2 1,446 21 21 100.0 ‐ ‐ 1,425195 A Koduwamadu * ‐ ‐ ‐ ‐ ‐ ‐ ‐195 B Kumaraveliyarkiramam 2,341 106 106 100.0 ‐ ‐ 2,235196 Kommathurai East 1,561 ‐ ‐ ‐ ‐ ‐ 1,561196 A Kommathurai West 714 37 35 94.6 2 5.4 677196 B Kommathurai North 1,324 41 38 92.7 3 7.3 1,283197 Vantharumoolai East 3,451 8 8 100.0 ‐ ‐ 3,443197 A Mavadivembu 1 3,398 462 462 100.0 ‐ ‐ 2,936197 B Vantharumoolai West 3,257 88 87 98.9 1 1.1 3,169197 C Palacholai' 5,298 4,156 4,156 100.0 ‐ ‐ 1,142197 D Mailavaddavan * ‐ ‐ ‐ ‐ ‐ ‐ ‐197 E Mavadivembu 2 2,037 97 97 100.0 ‐ ‐ 1,940198 Kaluwankerni 1 7,398 4,926 4,926 100.0 ‐ ‐ 2,472198 A Kaluwankerni 2 1,931 ‐ ‐ ‐ ‐ ‐ 1,931201/1 Sithandy 1 2,950 784 784 100.0 ‐ ‐ 2,166201/2 Sithandy 2 1,073 ‐ ‐ ‐ ‐ ‐ 1,073201/3 Sithandy 3 2,935 174 174 100.0 ‐ ‐ 2,761201/4 Sithandy 4 2,219 457 457 100.0 ‐ ‐ 1,762201 A Eeralaikulam * ‐ ‐ ‐ ‐ ‐ ‐ ‐135 A Gemunupura 1,401 ‐ ‐ ‐ ‐ ‐ 1,401189 Arumugathan Kudiyiruppu 1 759 117 115 98.3 2 1.7 642193 A Meerakerni Muslim 3,942 226 223 98.7 3 1.3 3,716193 B Mich Nagar 5,011 15 15 100.0 ‐ ‐ 4,996193 C Iyankerni Tamil 118 ‐ ‐ ‐ ‐ ‐ 118
Special Enumeration, 2007
Table 2 : (Contd.) Number and percentage of displaced population by DS division and Grama Niladhari (GN) division and reason for displacement, 2007
DS division and GN divisionTotal
populationTotal
displaced
Reason for displacementNot
displacedDue to conflict
Due to tsunami
33

No. % No. %
Special Enumeration, 2007
Table 2 : (Contd.) Number and percentage of displaced population by DS division and Grama Niladhari (GN) division and reason for displacement, 2007
DS division and GN divisionTotal
populationTotal
displaced
Reason for displacementNot
displacedDue to conflict
Due to tsunami
193 D Iyenkerni Muslim 2,413 5 ‐ ‐ 5 100.0 2,408193 E Meerakerni * ‐ ‐ ‐ ‐ ‐ ‐ ‐
Eravur Town 25,024 91 84 92.3 7 7.7 24,933
190 Eravur 1 1,207 7 ‐ ‐ 7 100.0 1,200190 A Eravur 1 A 1,621 29 29 100.0 ‐ ‐ 1,592190 B Eravur 1 B 1,579 ‐ ‐ ‐ ‐ ‐ 1,579191 Eravur 2 1,661 1 1 100.0 ‐ ‐ 1,660191 A Eravur 2 A 1,729 ‐ ‐ ‐ ‐ ‐ 1,729191 B Eravur 2 B 1,014 ‐ ‐ ‐ ‐ ‐ 1,014191 C Eravur 2 C 2,302 4 4 100.0 ‐ ‐ 2,298192 Eravur 3 3,008 12 12 100.0 ‐ ‐ 2,996192 A Eravur 6 1,192 ‐ ‐ ‐ ‐ ‐ 1,192192 B Eravur 3 A 3,322 4 4 100.0 ‐ ‐ 3,318192 C Eravur 6 A 1,560 ‐ ‐ ‐ ‐ ‐ 1,560192 D Eravur 6 D 1,280 ‐ ‐ ‐ ‐ ‐ 1,280194 Eravur 4 893 12 12 100.0 ‐ ‐ 881194 A Eravur 5 1,679 ‐ ‐ ‐ ‐ ‐ 1,679194 B Ellainagar 977 22 22 100.0 ‐ ‐ 955
Manmunai North 88,459 9,771 9,081 92.9 690 7.1 78,688
168 Manchanthoduwai North 662 ‐ ‐ ‐ ‐ ‐ 662168 A Manchanthoduwai South 2,760 ‐ ‐ ‐ ‐ ‐ 2,760168 B Navatkudah 1,500 380 222 58.4 158 41.6 1,120168 C Navatkudah East 2,928 366 366 100.0 ‐ ‐ 2,562168 D Navatkudah South 1,583 701 701 100.0 ‐ ‐ 882171 A Nochimunai 3,519 13 ‐ ‐ 13 100.0 3,506171 B Kalladi Uppodai 2,233 2 2 100.0 ‐ ‐ 2,231171 C Kalladi Veloor 2,981 ‐ ‐ ‐ ‐ ‐ 2,981171 Kallady 2,275 6 6 100.0 ‐ ‐ 2,269172 Navalady 393 48 48 100.0 ‐ ‐ 345172 A Kalladi Muhathuvaram 1,309 33 33 100.0 ‐ ‐ 1,276172 B Thiruchendhur 2,296 107 89 83.2 18 16.8 2,189172 C Dutch Bar 307 58 58 100.0 ‐ ‐ 249173 Amirthakali 2,448 176 133 75.6 43 24.4 2,272173 A Mamangam 1,998 56 25 44.6 31 55.4 1,942173 B Iruthayapuram East 2,145 747 747 100.0 ‐ ‐ 1,398173 C Palameenmadu 2,091 1,262 1,247 98.8 15 1.2 829173 D Punnaicholai 1,896 226 203 89.8 23 10.2 1,670173 E Thiraimadu 2,339 500 500 100.0 ‐ ‐ 1,839173 F Koolavadi 939 29 13 44.8 16 55.2 910173 G Gnansooriyam Square 1,796 32 28 87.5 4 12.5 1,764
34

No. % No. %
Special Enumeration, 2007
Table 2 : (Contd.) Number and percentage of displaced population by DS division and Grama Niladhari (GN) division and reason for displacement, 2007
DS division and GN divisionTotal
populationTotal
displaced
Reason for displacementNot
displacedDue to conflict
Due to tsunami
173 H Barathipuram 1,544 63 23 36.5 40 63.5 1,481173 I Koolavadi East 1,176 5 5 100.0 ‐ ‐ 1,171173 J Thisaveerasingam Square 1,271 ‐ ‐ ‐ ‐ ‐ 1,271173 K Vettukkadu 1,201 627 627 100.0 ‐ ‐ 574176 Kokkuvil 2,660 1,154 1,154 100.0 ‐ ‐ 1,506176 A Sathurukondan 2,670 1,329 1,329 100.0 ‐ ‐ 1,341176 B Karuveppenkerny 2,566 77 44 57.1 33 42.9 2,489176 C Periya Urany 1,274 33 27 81.8 6 18.2 1,241176 D Panichayadi 891 145 145 100.0 ‐ ‐ 746176 E Iruthayapuram West 2,241 ‐ ‐ ‐ ‐ ‐ 2,241176 F Sinna Urany 4,245 503 497 98.8 6 1.2 3,742176 G Jeyanthipuram 1,026 28 9 32.1 19 67.9 998176 H Iruthayapuram Central 936 28 28 100.0 ‐ ‐ 908177 Thandavanveli 2,591 153 98 64.1 55 35.9 2,438177 A Arasadi 1,212 19 5 26.3 14 73.7 1,193177 B Thamaraikerny 1,749 17 4 23.5 13 76.5 1,732178 Koddamunai 1,508 125 113 90.4 12 9.6 1,383178 A Periya Uppodai 3,807 360 360 100.0 ‐ ‐ 3,447179 Puliyanthivu East 1,768 120 10 8.3 110 91.7 1,648179 A Puliyanthivu West 1,409 102 61 59.8 41 40.2 1,307179 B Puliyanthivu Central 1,051 ‐ ‐ ‐ ‐ ‐ 1,051179 C Puliyanthivu South 2,806 16 10 62.5 6 37.5 2,790181 Thimilathivu 1,102 20 20 100.0 ‐ ‐ 1,082181 A Thirupperunthurai 1,658 61 56 91.8 5 8.2 1,597181 B Veechukalmunai 741 11 10 90.9 1 9.1 730181 C Puthunagar 1,883 ‐ ‐ ‐ ‐ ‐ 1,883181 D Sethukudah 1,075 33 25 75.8 8 24.2 1,042
Kattankudy 39,523 263 237 90.1 26 9.9 39,260
164 A Kathankudy 5 2,219 45 35 77.8 10 22.2 2,174165 Kathankudy 3 1,312 ‐ ‐ ‐ ‐ ‐ 1,312167 C New Kathankudy South 4,465 ‐ ‐ ‐ ‐ ‐ 4,465162 Kathankudy 6 2,520 9 ‐ ‐ 9 100.0 2,511166 A Kathankudy 2 North 2,275 2 ‐ ‐ 2 100.0 2,273167 E Kathankudy 1 South 1,919 4 4 100.0 ‐ ‐ 1,915164 B Kathankudy 5 South 841 0 ‐ ‐ ‐ ‐ 841167 B New Kathankudy East 4,934 198 198 100.0 ‐ ‐ 4,736164 Kathankudy 4 1,228 5 ‐ ‐ 5 100.0 1,223166 Kathankudy 2 2,045 ‐ ‐ ‐ ‐ ‐ 2,045167 D New Kathankudy West 1,980 ‐ ‐ ‐ ‐ ‐ 1,980162 B Kathankudy 6 West 1,728 ‐ ‐ ‐ ‐ ‐ 1,728165 A Kathankudy 3 West 1,020 ‐ ‐ ‐ ‐ ‐ 1,020167 Kathankudy 1 1,105 ‐ ‐ ‐ ‐ ‐ 1,105164 C Kathankudy 4 West 1,606 ‐ ‐ ‐ ‐ ‐ 1,606
35

No. % No. %
Special Enumeration, 2007
Table 2 : (Contd.) Number and percentage of displaced population by DS division and Grama Niladhari (GN) division and reason for displacement, 2007
DS division and GN divisionTotal
populationTotal
displaced
Reason for displacementNot
displacedDue to conflict
Due to tsunami
165 B Kathankudy 3 East 1,292 ‐ ‐ ‐ ‐ ‐ 1,292167 A New Kathankudy North 4,450 ‐ ‐ ‐ ‐ ‐ 4,450162 A Kathankudy 6 South 2,584 ‐ ‐ ‐ ‐ ‐ 2,584
Manmunai Pattu (Araipattai) 30,747 1,529 874 57.2 655 42.8 29,218
156 D Arayampathy Central 485 ‐ ‐ ‐ ‐ ‐ 485155 B Kankeyanodai South 1,331 ‐ ‐ ‐ ‐ ‐ 1,331153 Thalankuda 1,309 15 13 86.7 2 13.3 1,294154 Mavilankanthurai 951 40 40 100.0 ‐ ‐ 911156 C Kovilkulam 911 ‐ ‐ ‐ ‐ ‐ 911153 A Manmunai 878 38 28 73.7 10 26.3 840155 Kankeyanodai 976 ‐ ‐ ‐ ‐ ‐ 976155 A Ollikulam 428 380 76 20.0 304 80.0 48156 B Arayampathy 3 South 978 267 240 89.9 27 10.1 711150 Kirankulam North 1,446 ‐ ‐ ‐ ‐ ‐ 1,446150 A Kirankulam South 1,224 57 52 91.2 5 8.8 1,167150 B Kirankulam 1,377 ‐ ‐ ‐ ‐ ‐ 1,377150 C Kirankulam Central 974 ‐ ‐ ‐ ‐ ‐ 974151 Puthukudiyiruppu 1,178 12 12 100.0 ‐ ‐ 1,166151 B Puthukudiyiruppu North 1,766 48 30 62.5 18 37.5 1,718151 A Puthukudiyiruppu South 933 3 ‐ ‐ 3 100.0 930153 B Veder Kudiyiruppu 1,178 213 204 95.8 9 4.2 965152 Palamunai 2,536 191 ‐ ‐ 191 100.0 2,345157 C Arayampathy East 2,049 219 136 62.1 83 37.9 1,830157 Arayampathy 2 419 ‐ ‐ ‐ ‐ ‐ 419158 A Arayampathy West 736 ‐ ‐ ‐ ‐ ‐ 704157 A Selvanagar 1,582 32 32 100.0 ‐ ‐ 1,582157 D Arayampathy North 575 3 ‐ ‐ 3 100.0 561156 Arayampathy 3 697 11 11 100.0 ‐ ‐ 697157 B Selvanagar East 2,161 ‐ ‐ ‐ ‐ ‐ 2,161156 A Rasathuraikiramam 907 ‐ ‐ ‐ ‐ ‐ 907158 Arayampathy 1 762 ‐ ‐ ‐ ‐ ‐ 762
Manmunai South‐ West 23,988 363 357 98.3 6 1.7 23,625
128 Ampilanthurai 1,208 ‐ ‐ ‐ ‐ ‐ 1,208128 A Ampilanthurai West 793 ‐ ‐ ‐ ‐ ‐ 793128 B Ampilanthurai North 630 ‐ ‐ ‐ ‐ ‐ 630128 C Katchenai 663 ‐ ‐ ‐ ‐ ‐ 663129 Arasadithivu 1,100 ‐ ‐ ‐ ‐ ‐ 1,100129 A Kadukkamunai 1,538 ‐ ‐ ‐ ‐ ‐ 1,538129 B Paddipalai 735 21 21 100.0 ‐ ‐ 714129 C Arasadithivu North 1,019 23 23 100.0 ‐ ‐ 996
36

No. % No. %
Special Enumeration, 2007
Table 2 : (Contd.) Number and percentage of displaced population by DS division and Grama Niladhari (GN) division and reason for displacement, 2007
DS division and GN divisionTotal
populationTotal
displaced
Reason for displacementNot
displacedDue to conflict
Due to tsunami
130 Pandariyaveli 1,215 ‐ ‐ ‐ ‐ ‐ 1,215130 A Mahiladithivu 788 ‐ ‐ ‐ ‐ ‐ 788130 B Mahiladithivu South 1,910 ‐ ‐ ‐ ‐ ‐ 1,910132 Muthalaikdua 838 22 22 100.0 ‐ ‐ 816132 A Muthalaikdua West 1,084 ‐ ‐ ‐ ‐ ‐ 1,084134 Munaikadu East 779 56 50 89.3 6 10.7 723134 A Munaikadu West 1,145 44 44 100.0 ‐ ‐ 1,101134 B Munaikadu South 1,060 28 28 100.0 ‐ ‐ 1,032134 C Munaikadu North 1,259 70 70 100.0 ‐ ‐ 1,189135 Kokkaddicholai 1,682 41 41 100.0 ‐ ‐ 1,641135 A Kokkaddicholai South 1,418 29 29 100.0 ‐ ‐ 1,389136 Mavadimunmari 482 ‐ ‐ ‐ ‐ ‐ 482136 A Thanthamalai 910 29 29 100.0 ‐ ‐ 881136 B Kuluvinamadu 678 ‐ ‐ ‐ ‐ ‐ 678136 C Kachakody 746 ‐ ‐ ‐ ‐ ‐ 746136 D Panichachyadimunmari 308 ‐ ‐ ‐ ‐ ‐ 308
Poratheevu Pattu 38,282 451 442 98.0 9 2.0 37,831
96 Mandur 3 871 ‐ ‐ ‐ ‐ ‐ 87196 A Mandur Kottamunai 953 ‐ ‐ ‐ ‐ ‐ 95397 Mandur 1 & 2 732 ‐ ‐ ‐ ‐ ‐ 73297 A Palamunai 1,852 ‐ ‐ ‐ ‐ ‐ 1,85297 B Mandur South 1,120 ‐ ‐ ‐ ‐ ‐ 1,12098 Thambalawatrha 1,377 ‐ ‐ ‐ ‐ ‐ 1,37798 A Ranamadu 276 ‐ ‐ ‐ ‐ ‐ 27698 B Sankarpuram 1,396 67 67 100.0 ‐ ‐ 1,32998 C Kanesapuram 1,082 14 14 100.0 ‐ ‐ 1,06899 Vellavely 1,206 ‐ ‐ ‐ ‐ ‐ 1,20699 A Kakkachchivaddai 1,132 ‐ ‐ ‐ ‐ ‐ 1,13299 B Palayadivaddai 1,140 20 20 100.0 ‐ ‐ 1,12099 C Sinnawathai 1,301 63 63 100.0 ‐ ‐ 1,23899 D Vilanthottam 589 1 1 100.0 ‐ ‐ 58899 E Anaikattiyaveli 593 ‐ ‐ ‐ ‐ ‐ 59399 F Nellikadu 715 7 7 100.0 ‐ ‐ 70899 G Kannapuram 712 ‐ ‐ ‐ ‐ ‐ 71299 H Malayarkattu 805 ‐ ‐ ‐ ‐ ‐ 80599 I Palacholai 812 ‐ ‐ ‐ ‐ ‐ 81299 J Vivekananthapuram 645 4 4 100.0 ‐ ‐ 64199 K Kannapuram East 761 ‐ ‐ ‐ ‐ ‐ 761106 Palugamam 2 833 5 5 100.0 ‐ ‐ 828106 A Thikkodai 1,522 ‐ ‐ ‐ ‐ ‐ 1,522106 B Veeranchenai 612 ‐ ‐ ‐ ‐ ‐ 612106 C Thumpankerni 500 9 4 44.4 5 55.6 491106 D Vanninagar 1,085 ‐ ‐ ‐ ‐ ‐ 1,085
37
No. % No. %
Special Enumeration, 2007
Table 2 : (Contd.) Number and percentage of displaced population by DS division and Grama Niladhari (GN) division and reason for displacement, 2007
DS division and GN divisionTotal
populationTotal
displaced
Reason for displacementNot
displacedDue to conflict
Due to tsunami
106 E Suravaanaiyadi Oothu 504 ‐ ‐ ‐ ‐ ‐ 504107 Palugamam 1 503 ‐ ‐ ‐ ‐ ‐ 503107 A Navagirinagar 430 ‐ ‐ ‐ ‐ ‐ 430107 B Ganthipuram 707 ‐ ‐ ‐ ‐ ‐ 707107 C Vammiyadioothu 1,228 ‐ ‐ ‐ ‐ ‐ 1,228107 D Mavetkudah 979 44 43 97.7 1 2.3 935107 E Kaluminthanveli 654 ‐ ‐ ‐ ‐ ‐ 654107 F Selvapuram 925 48 48 100.0 ‐ ‐ 877107 G Vipulanandapuram 814 7 7 100.0 ‐ ‐ 807107 H Thumpankerni Youth Scheme 735 ‐ ‐ ‐ ‐ ‐ 735108 Periya Porathivu 812 36 36 100.0 ‐ ‐ 776108 A Munaithivu 1,372 92 92 100.0 ‐ ‐ 1,280108 B Punnaikulam 564 2 2 100.0 ‐ ‐ 562108 C Pattapuram 622 7 7 100.0 ‐ ‐ 615109 Kovilporathivu 947 11 8 72.7 3 27.3 936109 A Kovilporathivu South 968 ‐ ‐ ‐ ‐ ‐ 968109 B Kovilporathivu West 896 14 14 100.0 ‐ ‐ 882
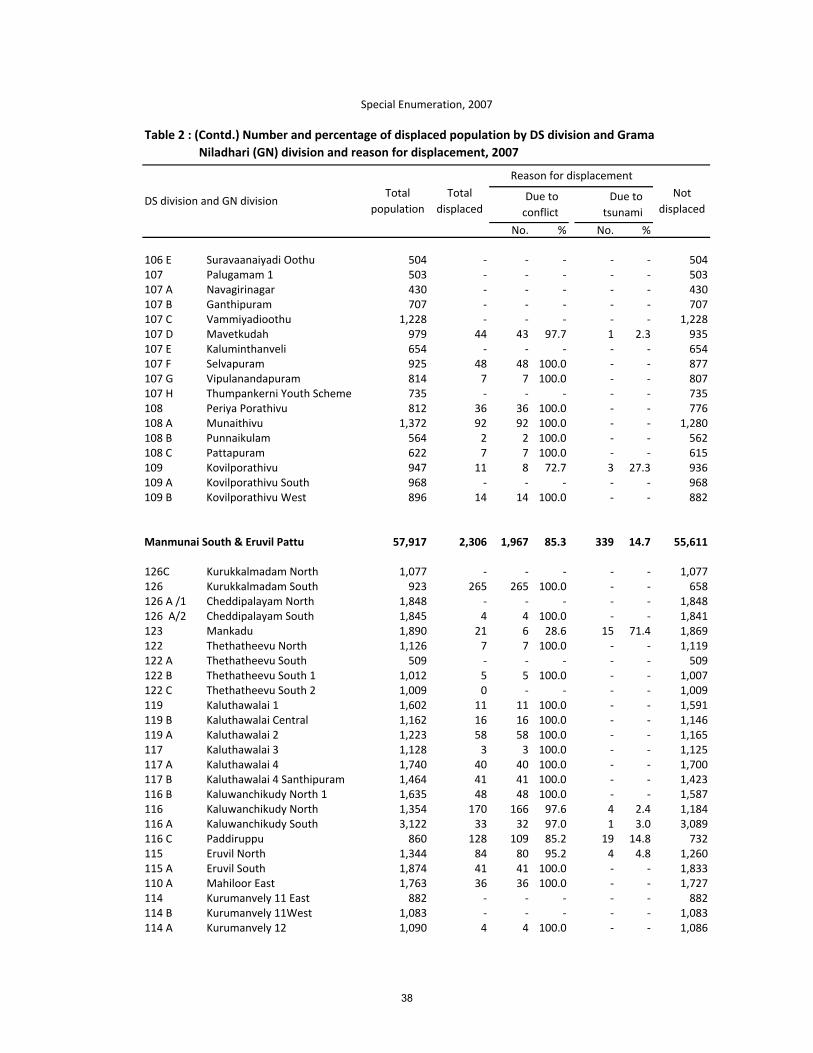
Manmunai South & Eruvil Pattu 57,917 2,306 1,967 85.3 339 14.7 55,611
126C Kurukkalmadam North 1,077 ‐ ‐ ‐ ‐ ‐ 1,077126 Kurukkalmadam South 923 265 265 100.0 ‐ ‐ 658126 A /1 Cheddipalayam North 1,848 ‐ ‐ ‐ ‐ ‐ 1,848126 A/2 Cheddipalayam South 1,845 4 4 100.0 ‐ ‐ 1,841123 Mankadu 1,890 21 6 28.6 15 71.4 1,869122 Thethatheevu North 1,126 7 7 100.0 ‐ ‐ 1,119122 A Thethatheevu South 509 ‐ ‐ ‐ ‐ ‐ 509122 B Thethatheevu South 1 1,012 5 5 100.0 ‐ ‐ 1,007122 C Thethatheevu South 2 1,009 0 ‐ ‐ ‐ ‐ 1,009119 Kaluthawalai 1 1,602 11 11 100.0 ‐ ‐ 1,591119 B Kaluthawalai Central 1,162 16 16 100.0 ‐ ‐ 1,146119 A Kaluthawalai 2 1,223 58 58 100.0 ‐ ‐ 1,165117 Kaluthawalai 3 1,128 3 3 100.0 ‐ ‐ 1,125117 A Kaluthawalai 4 1,740 40 40 100.0 ‐ ‐ 1,700117 B Kaluthawalai 4 Santhipuram 1,464 41 41 100.0 ‐ ‐ 1,423116 B Kaluwanchikudy North 1 1,635 48 48 100.0 ‐ ‐ 1,587116 Kaluwanchikudy North 1,354 170 166 97.6 4 2.4 1,184116 A Kaluwanchikudy South 3,122 33 32 97.0 1 3.0 3,089116 C Paddiruppu 860 128 109 85.2 19 14.8 732115 Eruvil North 1,344 84 80 95.2 4 4.8 1,260115 A Eruvil South 1,874 41 41 100.0 ‐ ‐ 1,833110 A Mahiloor East 1,763 36 36 100.0 ‐ ‐ 1,727114 Kurumanvely 11 East 882 ‐ ‐ ‐ ‐ ‐ 882114 B Kurumanvely 11West 1,083 ‐ ‐ ‐ ‐ ‐ 1,083114 A Kurumanvely 12 1,090 4 4 100.0 ‐ ‐ 1,086
38

No. % No. %
Special Enumeration, 2007
Table 2 : (Contd.) Number and percentage of displaced population by DS division and Grama Niladhari (GN) division and reason for displacement, 2007
DS division and GN divisionTotal
populationTotal
displaced
Reason for displacementNot
displacedDue to conflict
Due to tsunami
110 Mahiloor West 1,273 20 20 100.0 ‐ ‐ 1,253115 B Eruvil East 1,649 282 267 94.7 15 5.3 1,367110 B Mahiloor Munai 777 ‐ ‐ ‐ ‐ ‐ 777110 C Mahiloor South West 1,234 328 328 100.0 ‐ ‐ 906111 Onthachimadam North 1,800 96 10 10.4 86 89.6 1,704111 A Onthachimadam South 959 135 17 12.6 118 87.4 824113 Koddaikallar North 1,820 11 11 100.0 ‐ ‐ 1,809113 C Koddaikallar West 1,157 54 ‐ ‐ 54 100.0 1,103113 B Koddaikallar East 1,041 106 106 100.0 ‐ ‐ 935113 A Koddaikallar South 900 ‐ ‐ ‐ ‐ ‐ 90076 Periyakallar 1 1,067 47 47 100.0 ‐ ‐ 1,02076 A Periyakallar 1 South 1,257 97 97 100.0 ‐ ‐ 1,16075 Periyakallar 2 1,077 58 38 65.5 20 34.5 1,01975 B Periyakallar 2 West 1,221 4 4 100.0 ‐ ‐ 1,21775 A Periyakallar 3 806 34 34 100.0 ‐ ‐ 77275 C Periyakallar 3 South 998 16 16 100.0 ‐ ‐ 98274 Thuiraineelavanai North 1,241 ‐ ‐ ‐ ‐ ‐ 1,24174 B Thuiraineelavanai North 1 773 3 ‐ ‐ 3 100.0 77074 A Thuiraineelavanai South 983 ‐ ‐ ‐ ‐ ‐ 98374 C Thuiraineelavanai South 1 1,319 ‐ ‐ ‐ ‐ ‐ 1,319
Koralai Pattu Central 24,510 604 582 96.4 22 3.6 23,906
206 Valaichenai 4 Muslim 2,142 5 ‐ ‐ 5 100.0 2,137206 A Brainthuraichenai North 2,974 ‐ ‐ ‐ ‐ ‐ 2,974206 B Valaichenai 5 Muslim 1,983 ‐ ‐ ‐ ‐ ‐ 1,983206 C Brainthuraichenai South 4,524 7 5 71.4 2 28.6 4,517206 D Valaichenai 5 South Muslim 2,652 7 3 42.9 4 57.1 2,645208 A Mavadichenai 2,741 ‐ ‐ ‐ ‐ ‐ 2,741208 D Chemman Odai 3,771 6 6 100.0 ‐ ‐ 3,765210 C Thiyavattavan 1,926 351 351 100.0 ‐ ‐ 1,575211 B Regithenna , Jeyanthiyaya 1,797 228 217 95.2 11 4.8 1,569
Koralai Pattu South (Kiran) 19,659 6,411 6,107 95.3 304 4.7 13,248
199 Murakkottanchenai 2,010 63 63 100.0 ‐ ‐ 1,947199 A Thevapuram 1,844 ‐ ‐ ‐ ‐ ‐ 1,844200 Santhiveli 3,874 1,240 1,191 96.0 49 4.0 2,634200 A Thihilivaddai * ‐ ‐ ‐ ‐ ‐ ‐ ‐201 Palayadithona 2,879 2,221 1,967 88.6 254 11.4 658203 Kiran East 4,062 975 974 99.9 1 0.1 3,087203 A Kiran West 1,564 274 274 100.0 ‐ ‐ 1,290203 C Korakallimadu 3,223 1,638 1,638 100.0 ‐ ‐ 1,585209 Perillaveli * ‐ ‐ ‐ ‐ ‐ ‐ ‐
39

No. % No. %
Special Enumeration, 2007
Table 2 : (Contd.) Number and percentage of displaced population by DS division and Grama Niladhari (GN) division and reason for displacement, 2007
DS division and GN divisionTotal
populationTotal
displaced
Reason for displacementNot
displacedDue to conflict
Due to tsunami
209 A Muruthanai * ‐ ‐ ‐ ‐ ‐ ‐ ‐209 B Koraveli * ‐ ‐ ‐ ‐ ‐ ‐ ‐209 C Poolakadu * ‐ ‐ ‐ ‐ ‐ ‐ ‐209 D Kudumpimalai * ‐ ‐ ‐ ‐ ‐ ‐ ‐210 Vahaneri * ‐ ‐ ‐ ‐ ‐ ‐ ‐210 A/1 Vadamunai * ‐ ‐ ‐ ‐ ‐ ‐ ‐210 A/2 Othuchenai * ‐ ‐ ‐ ‐ ‐ ‐ ‐210 B Punanai West 203 ‐ ‐ ‐ ‐ ‐ 203210 A Kallichchai * ‐ ‐ ‐ ‐ ‐ ‐ ‐
Manmunai West 25,025 4 4 100.0 ‐ ‐ 25,021
148 Iluppadichenai 1,229 ‐ ‐ ‐ ‐ ‐ 1,229148 A Pavatkodichenai 1,653 ‐ ‐ ‐ ‐ ‐ 1,653148 B Panchenai 843 ‐ ‐ ‐ ‐ ‐ 843148 C Kanthinagar 564 ‐ ‐ ‐ ‐ ‐ 564148 D Kanchirankudah 1,953 ‐ ‐ ‐ ‐ ‐ 1,953148 E Kothiyapulai 1,005 ‐ ‐ ‐ ‐ ‐ 1,005149 Kannankudah 1,004 4 4 100.0 ‐ ‐ 1,000149 A Karayakkanthivu 998 ‐ ‐ ‐ ‐ ‐ 998149 B Kurinchamunai 1,190 ‐ ‐ ‐ ‐ ‐ 1,190149 C Mandapathady 803 ‐ ‐ ‐ ‐ ‐ 803
149 D Paruththichenai 991 ‐ ‐ ‐ ‐ ‐ 991149 E Puthumandapathady 1,721 ‐ ‐ ‐ ‐ ‐ 1,721182 Eachchanthivu 1,109 ‐ ‐ ‐ ‐ ‐ 1,109182 A Vavunathivu 695 ‐ ‐ ‐ ‐ ‐ 695182 B Navatkadu 1,422 ‐ ‐ ‐ ‐ ‐ 1,422182 C Mankikaddu 479 ‐ ‐ ‐ ‐ ‐ 479183 Karavetti 1,702 ‐ ‐ ‐ ‐ ‐ 1,702183 A Vilavettuvan 1,563 ‐ ‐ ‐ ‐ ‐ 1,563
184 Mahilavattuvan 1,564 ‐ ‐ ‐ ‐ ‐ 1,564184 A Unnichai 968 ‐ ‐ ‐ ‐ ‐ 968184 D Naripulthottam 967 ‐ ‐ ‐ ‐ ‐ 967184 E Nediyamadu 602 ‐ ‐ ‐ ‐ ‐ 602184 B Aithiyamalai North* ‐ ‐ ‐ ‐ ‐ ‐ ‐184 C Aithiyamalai South* ‐ ‐ ‐ ‐ ‐ ‐ ‐
* Population has not been enumerated in these GN Division areas where all the people have been displaced and the resettlement has not taken place at the time of the enumeration
40