basic socio-economic security in rural india and socio-economic security in rural india and china: a...
TRANSCRIPT


Basic Socio-economic Security in Rural India and China: A Comparative Study of Selected Villages
K.P. Kannan and N. Vijayamohanan Pillai*
The present paper is a condensed version of an empirical exercise conducted in the light of our conviction that social security in the context of the developing countries must be viewed not only from a contingency orientation (as in the developed countries) but also as a basic measure of freedom from multi-dimensional deficiency. The four realms of security that may be considered to constitute such a basic social security are: food security, housing security, health security, and education security, with an inherent dimension of employment security. The empirical domains of this case study were selected from the states of Kerala and Orissa in India and from the provinces of Jiangsu and Gansu in China. The selection of the regions was to anchor the study to a comparative plane: Kerala and Jiangsu as well-performing or ‘advanced’ regions, and Orissa and Gansu as poorly-performing or ‘under-developed’ regions in respect of the local social security experiences. Such a comparative study is expected to go a long way in facilitating an understanding of the impact of macro policies at the ground level through the responses of ‘actually living people’ articulating their conditions of basic socio-economic security. In the light of our field experience in India and China, it appears that the macro situation of poverty and human development are reflected, to some extent, in both the selected provinces at the village level in China, whereas it is not so much in the case of India. Despite this difference, it should be noted that Kerala state in India and Jiangsu province in China are similar in achieving a measure of basic socio-economic security.
INTRODUCTION
Given the dimension of the informal economy and the existence of massive and persistent poverty in the developing countries, the concept of social security has to be suited to the actual situation of those countries and to include the idea of elimination of poverty in its multiple manifestations as a necessary condition for attaining development.
Thus, in a developing country context, social security may be viewed in terms of a basic social security (BSS), primarily taking into account the dimension of deficiency, and a contingent social security (CSS), primarily taking into account the dimension of adversity (Kannan, 2007a)1. The former is a foundational requirement in the sense that the commonly accepted notion of social security for meeting contingencies (CSS) will not make any sense in its absence. The four realms of security that may be considered to constitute basic social security are: food security, housing security, health security, and education security. Inherent in all these is a dimension of income/employment security (Kannan, 2007a).
Indian Journal of Human Development, Vol. 3, No. 2, 2009
* Professor and Associate Professor, respectively, at the Centre for Development Studies, Thiruvananthapuram.

240 Indian Journal of Human Development
It is in this theoretical light that a study was jointly conducted (by the present authors at the Centre for Development Studies, Thiruvananthapuram) along with Prof. Zhang Xiaoshan and his group of researchers at the Rural Development Institute of the Chinese Academy of Social Sciences in Beijing, to examine the micro-dynamics of social security experiences through an intensive and in-depth case study. The regions selected were the states of Kerala and Orissa in India, and the provinces of Jiangsu and Gansu in China. The selection of the states/provinces was to anchor the study to a plane of comparison: Kerala and Jiangsu as well-performing or ‘advanced’ regions, and Orissa and Gansu as poorly-performing or ‘under-developed’ regions in respect of social development, in general, and the coverage of social security, in particular. The present paper is a condensed version of the analysis and findings of this study.
SOCIAL PROTECTION IN CHINA: A BACKGROUND
Following the model of the former Union of Soviet Socialist Republics (USSR), China had established a unique social security system, founded on the principle of full employment. Accordingly, urban workers (during the period of Mao Zedong’s rule), were provided jobs for life in the ‘iron rice bowl’, an expression relating to job and hence income security of the urban workers. The Labour Insurance Regulations of 1951 stipulated that state and collective enterprises provide for employees in the case of sickness, pregnancy, work injury, disability, death, and also in old age. Other state institutions also provided similar coverage. Thus, most welfare was provided to the urban workers via their work units (danwei). Under this danwei system, the range and quality of provision was uneven, depending on the size and resources of the danweis—large state industrial units typically allocated better provisions to their employees than did small collective enterprises; women, blue collar, and unskilled workers received lower-quality welfare provisions. The social insurance in China was unique in that it was the sole responsibility of the state and enterprises, with the workers not being responsible for any payment.
During the transitional period from a Central planning economy to the market-oriented economy (that started in 1978), the danwei system has proved too costly to be continued and entailed urban welfare reform, which, in turn, spurred labour market reform. This resulted in the Government encouragement in 1982 to the employment of workers under contract and in the 1986 Central Government regulations, requiring that all new workers be hired under the labour contract system. The ‘iron rice bowl’ was abandoned and public enterprise managers were invested with greater authority to dismiss workers.
In addition to the social security for the wage workers of the urban formal sector, there was social assistance for primarily disabled and elderly people, orphans, and most destitute households. Army veterans, retired soldiers, and the families of revolutionary martyrs and servicemen received regular compensation. The rural workers were, however, not fortunate enough to receive the generosity enjoyed by their urban counterparts, though rural communes provided some security, primarily in terms of health and collective welfare projects. Thus, the traditional familial system of welfare was largely in vogue in rural China.

Kannan and Pillai: Socio-economic Security in Rural India and China 241
From the middle of the 1980s, China began to reform the traditional social relief programmes. By the end of 1997, there were 49.31 million rural people living under the rural poverty line. This consisted of 4 per cent of the total population during that year. The Chinese official poverty line is very close to the Indian poverty line (of less than one PPP dollar per capita per day) despite a per capita income that is now close to twice that of India. If one goes by the international poverty line of two PPP dollars per capita per day, the proportion of the poor Chinese would shoot up to 47 per cent of the population as compared to nearly 80 per cent in India (see Table 1). Most of the past relief approaches were temporary measures. Therefore, since 1995, the Ministry of Civil Affairs (MCA) started launching some pilot projects in some areas to establish the rural minimum life security system. In 1996, the MCA issued the ‘Guiding Plan for the Establishment of Rural Social Security System’, which stipulated the establishment of a rural minimum life security system, specified the coverage, the guarantee standard and the source of the funds.
SOCIAL PROTECTION IN INDIA: A BACKGROUND
In India, there is a vast amount of literature on poverty and various forms of other deprivation in the society. While according to official estimates, absolute poverty in India is around 26 per cent, recent research has highlighted the fact that despite a high rate of growth of the economy of close to 6 per cent per annum since the mid-1980s, nearly 77 per cent of the population lives with a per capita per day consumption expenditure of two times the official poverty line (that is very close to two PPP dollars) in 2004-05. Of these people, 80 per cent belong to the category of informal workers, who have no job and/or social security (see Sengupta, Kannan and Raveendran, 2008). In its Report on Conditions of Work and Promotion of Livelihoods in the Unorganised Sector, the National Commission for Enterprises in the Unorganised Sector (NCEUS) identified the following categories of people with a high incidence of poor and the vulnerable (NCEUS, 2007):
1. Agricultural labour households in the rural areas;2. Casual labour households in the urban areas; and3. Disadvantaged workers such as child workers, migrants and bonded labour.The Report identified the workers and households of the Scheduled Castes (SCs)
and Scheduled Tribes (STs) as constituting the bottom layer of the Indian population and workers.
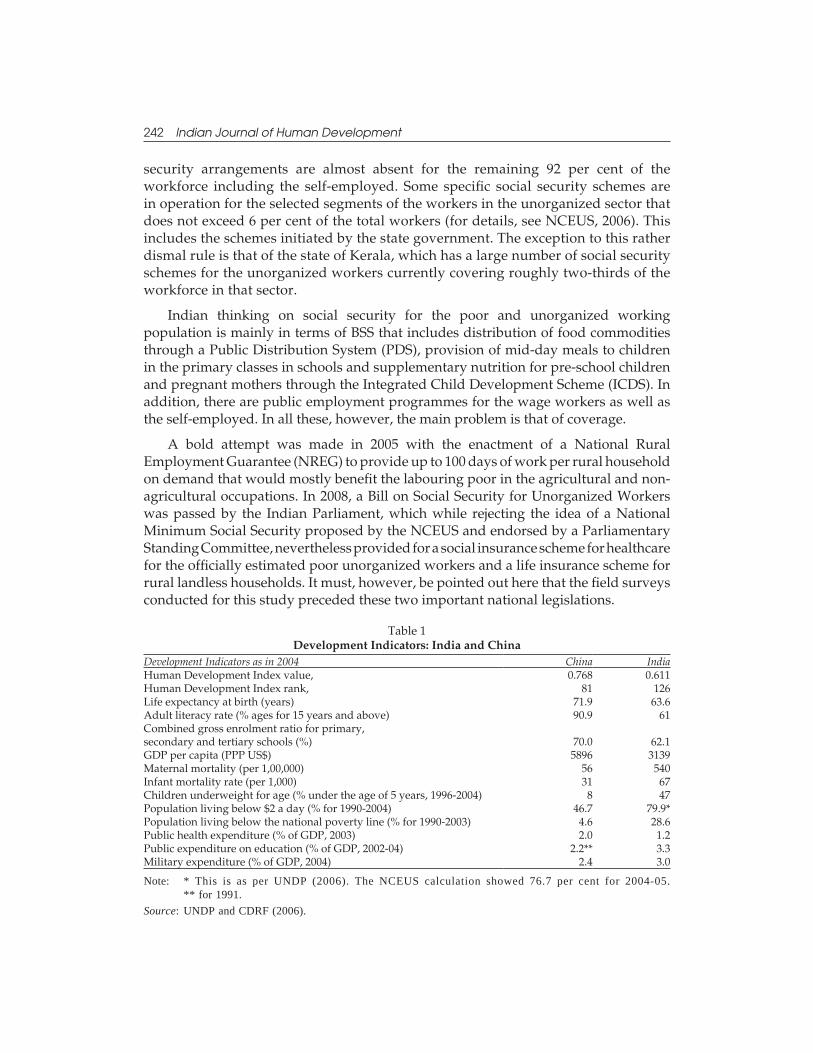
In order to provide a broad view of the comparative situation in India and China, Table 1 presents the achievements in selected human development/deprivation indicators. The gap between the two countries is quite unmistakable with China establishing a significant lead over India.
In terms of social security, the dominant thinking leans towards providing CSS to those who are employed in the formal sector of the Indian economy, accounting for around 8 per cent of the total workforce of 457 million in 2005. Similarly, social
242 Indian Journal of Human Development
security arrangements are almost absent for the remaining 92 per cent of the workforce including the self-employed. Some specific social security schemes are in operation for the selected segments of the workers in the unorganized sector that does not exceed 6 per cent of the total workers (for details, see NCEUS, 2006). This includes the schemes initiated by the state government. The exception to this rather dismal rule is that of the state of Kerala, which has a large number of social security schemes for the unorganized workers currently covering roughly two-thirds of the workforce in that sector.
Indian thinking on social security for the poor and unorganized working population is mainly in terms of BSS that includes distribution of food commodities through a Public Distribution System (PDS), provision of mid-day meals to children in the primary classes in schools and supplementary nutrition for pre-school children and pregnant mothers through the Integrated Child Development Scheme (ICDS). In addition, there are public employment programmes for the wage workers as well as the self-employed. In all these, however, the main problem is that of coverage.
A bold attempt was made in 2005 with the enactment of a National Rural Employment Guarantee (NREG) to provide up to 100 days of work per rural household on demand that would mostly benefit the labouring poor in the agricultural and non-agricultural occupations. In 2008, a Bill on Social Security for Unorganized Workers was passed by the Indian Parliament, which while rejecting the idea of a National Minimum Social Security proposed by the NCEUS and endorsed by a Parliamentary Standing Committee, nevertheless provided for a social insurance scheme for healthcare for the officially estimated poor unorganized workers and a life insurance scheme for rural landless households. It must, however, be pointed out here that the field surveys conducted for this study preceded these two important national legislations.
Table 1 Development Indicators: India and China
Development Indicators as in 2004 China India Human Development Index value, 0.768 0.611Human Development Index rank, 81 126Life expectancy at birth (years) 71.9 63.6Adult literacy rate (% ages for 15 years and above) 90.9 61Combined gross enrolment ratio for primary,secondary and tertiary schools (%) 70.0 62.1GDP per capita (PPP US$) 5896 3139Maternal mortality (per 1,00,000) 56 540Infant mortality rate (per 1,000) 31 67Children underweight for age (% under the age of 5 years, 1996-2004) 8 47Population living below $2 a day (% for 1990-2004) 46.7 79.9*Population living below the national poverty line (% for 1990-2003) 4.6 28.6Public health expenditure (% of GDP, 2003) 2.0 1.2Public expenditure on education (% of GDP, 2002-04) 2.2** 3.3Military expenditure (% of GDP, 2004) 2.4 3.0
Note: * This is as per UNDP (2006). The NCEUS calculation showed 76.7 per cent for 2004-05. ** for 1991.
Source: UNDP and CDRF (2006).

Kannan and Pillai: Socio-economic Security in Rural India and China 243
The objective of this paper is to subject this macro difference between India and China to a detailed study at the local level of villages in rural areas. Do the village level situations reflect the macro level situation? If so, do they expose the same differences as between the ‘advanced’ regions and ‘under-developed’ regions? What is the extent of these differences? Such a comparative study, in our view, would go a long way in understanding the impact of macro policies at the ground level through the responses of ‘actually living people’ articulating their conditions of basic socio-economic security.
THE STUDY AREAS IN INDIA: KERALA AND ORISSA
Kerala was primarily an agricultural economy until the end of the 1990s; it is, however, no longer so. In 1960-61, the primary sector contributed 56 per cent of the State’s Domestic Product employing more than 60 per cent of its workforce. By 2004-05, the contribution of the primary sector to the domestic product declined to around 16 per cent with an employment share of 35 per cent. This means that the non-agricultural sector now accounts for two-thirds of employment and around 85 per cent of the income. In fact, the service sector is now the biggest sector accounting for nearly two-thirds of the domestic product and employing around 45 per cent of the workforce.
Figure 1 Map of India Showing the States of Kerala and Orissa
Orissa
Kerala
Andaman and Nicobar Islands are not shown in the map

244 Indian Journal of Human Development
Kerala’s experience in enjoying a far higher level of quality of life, even when its per capita income was below the Indian average, had already elevated the state to the pedestal of a much acclaimed ‘model’ (see CDS, 1975 and 2006). It goes without saying that this development, in turn, represents a high degree of realization of the basic right to life, covering what have been called BSS and CSS. After a not-so-brief period of economic stagnation (1974-87), Kerala achieved a remarkable turnaround in growth that seems to be the result of the earlier and sustained investment in human development leading to a ‘virtuous cycle of growth’ (see Kannan, 2007b). Note that it is with this equivalence between development and realization of social security in terms of basic rights that our conceptual framework has been moulded. In the context of Kerala, this development was, in fact, made possible by a certain historical conjunction that presented an objective enabling environment for (what we call) the participatory development experience a la the organization and mobilization of people who constitute an effective political demand for the progressive realization of basic rights (see Kannan and Pillai, 2004).
Unlike in the context of Kerala, an unfavourable dynamics of the historical conjunction of ecological, economic, social, and institutional conditions in Orissa has worked itself out to contribute to the high level of insecurity there. The state remains poor despite its rich potential, with a high level of income poverty, inadequate employment opportunities in the lean seasons, a large tribal population (22.1 per cent as per the 2001 Census) living in remote areas with poor connectivity, along with another large section of the excluded SC population (16.5 per cent), and with a periodic recurrence of droughts and floods that give rise to a situation of chronic and endemic insecurity.
Despite being rich in natural and human resources, the state of Orissa continues to be one of the less developed in India with the highest incidence of poverty, with 46 per cent of its population being below the poverty line (BPL) as in 2004-05 as against the national average of 26.1 per cent. The National Human Development Report 2001 also places the Human Development Index (HDI) ranking for Orissa in an inter-state comparison among 15 states at the eleventh position. Nearly 85 per cent of the population of Orissa lives in rural areas and depends on agriculture for livelihood, which alone provides direct and indirect employment to about 65 per cent of the total workforce of the state as per the 2001 Census. Although the contribution of agriculture to the state income has significantly declined, with a contribution of about 28.13 per cent to the Net State Domestic Product during 2001-2002, the percentage of the workforce engaged in agriculture has remained somewhat unchanged, with the unwelcome implication of an overcrowding in agriculture with very low productivity. Nearly 62 per cent of the cultivable land is rain-fed and exposed to the vagaries of the monsoon. In both Orissa and Kerala, more than 90 per cent of the farmers are small and marginal with operational holdings of not more than two hectares. However, the value of the annual output per hectare (in 2003) of small and marginal holdings in Kerala, at Rs. 26,814, was close to four times that in Orissa at Rs. 6,870. This, no doubt, reflects the highly diversified as well as mixed cropping system with relatively

Kannan and Pillai: Socio-economic Security in Rural India and China 245
advanced technological and agronomic practices adopted by Kerala’s farmers, which seem to be conspicuous by their absence in Orissa.
THE STUDY AREAS IN CHINA: JIANGSU AND GANSU
Jiāngsū Shĕng
Jiāngsū is a province of the People’s Republic of China, located along the east coast of the country. It has a coastline of over 1,000 kilometres along the Yellow Sea, and the Yangtze River passes through its southern parts. Jiāngsū is very flat and low-lying, with plains covering 68 per cent of its total area and the water being not more than 50 meters above sea level. Jiāngsū is also laced with a well-developed irrigation system, which earned it (especially the southern half) the moniker of shuĭxiāng (‘land of water’); the southern city of Suzhou is so crisscrossed with canals that it has been dubbed as ‘Venice of the East’.
Jiāngsū is very wealthy among the provinces of China, with the second highest total GDP (after Guangdong province), but its geographical disparity is great, and southern cities like Suzhou and Wuxi have a GDP per capita that is around twice the provincial average, making South Jiāngsū one of the most prosperous regions in China. During the period 2001–04, its average per capita GDP was US$ 2992 (see Table 2).
A majority of Jiangsu’s residents are ethnic Han Chinese. Other minorities include the Hui and the Manchus.
Figure 2 Map of China Showing the Provinces of Jiangsu and Gansu
Blank areas are claimed but not administrated by the People's Republic of China.
South China Sea islands are not shown in the map.
Jiāngsū
Gansu
CHINA

246 Indian Journal of Human Development
Gansu
Gansu is a province located in the northwest of the People’s Republic of China and most of its land is more than 1 km above sea level. It lies between the Tibetan Plateau, Inner Mongolia, and the Loess Plateau, and borders Mongolia to the north-west. The Huang He (Yellow River) passes through the southern part of the province. It has a population of approximately 26 million, as per 2004 figures and has a large concentration of Han Chinese. The landscape in Gansu is very mountainous in the south and flat in the north. It is one of the poorest provinces in China, with an average per capita income of US$ 910 during 2001–04, which is less than one-third of that of Jiangsu (but much greater than that of Kerala), also making it one of the most backward provinces in respect of the development in China (see Table 2).
Agricultural produce in Gansu includes cotton, linseed oil, maize, and wheat. Gansu is known as a source for wild medicinal herbs, which are used in Chinese medicine. However, most of Gansu’s economy is based on mining and the extraction of minerals, especially rare earth elements. The oil fields at Yumen and Changqing are considered as significant in this regard.
Table 2 A Comparison of Study Regions for Selected Socio-economic Indices
Year (2001-04) India ChinaKerala Orissa Jiangsu Gansu
Population (million) 32 38 75 26Rural (%) 74 85 50 70Population density/sq. km. 819 236 728 57Per capita income (US$) 630 316 2992 910Human Development Index (Rank)1 0.638 (1) 0.404 (11) 0.805 (7) 0.675 (28)Literacy rate (%) 90.9 63.1 81.0 79.7Literacy: Male 94.2 75.3 90.6 89.1Literacy: Female 87.9 50.5 71.4 69.6Sex ratio (females per 1000 males) 1058 972 993 950Life expectancy (Years): 73 57 75.6 68.8Life expectancy: Rural 73 56 74 67.2Life expectancy: Urban 74 65 78.1 75.5Share of agriculture in:Income 15 28 8 16Employment 35 61 28 57
Note: 1 = HDI for India is for 2001 for 15 States; for China, HDI is for 2003 for 31 Provinces.
Source: Census of India (2001); Government of India (2002); UNDP and CDRF (2006).
THE LOCAL SCENARIO OF SOCIAL SECURITY
The Study Regions
The study was designed to be an in-depth analysis of the local dynamics in coping with the dimensions of deficiency (BSS) and adversity (CSS), and conducted in terms of a case study of sample households in two regions of different levels of development in

Kannan and Pillai: Socio-economic Security in Rural India and China 247
each of the two countries. The household surveys in Kerala and Orissa were conducted during the period between October 2004 and January 2005 whereas the surveys in Jiangsu and Gansu were conducted during the period January to October 2005. The regions selected for the case study are: Thalikulam village panchayat in the Thrissur district of Kerala, and Sason village panchayat in the Sambalpur district of Orissa in India, and Poling village and Xiazhin village in the Jiangsu City County of Jiangsu province and Hongxian village and Xigwan village in the Weiyuan County of Gansu province in China.
For the sample survey, 502 sample households were identified (approximately accounting for 10 per cent of the total number of households in the village panchayat) from the 12 wards of Thalikkulam panchayat (see Table 3)2.
Table 3 The Study Villages
State (India)/ Province (China) Kerala Orissa Jiangsu GansuDistrict (India)/County (China) Thrissur Sambalpur Jiangsu City WeiyuanPanchayat/Village Thalikkulam
Panchayat (12 Villages)
Sason Panchayat (8 Villages)
Poling Village and Xiazhin
Village
Hongxian Village and Xigwan
VillageNo. of Sample Households 502 562 501 505Work Participation (%) Male Female
78.521.5
60.839.2
5248
5446
Unlike Thalikkulam, Sason is dominated by a vulnerable social population: Sason sub-district has about a 22 per cent SC and 38 per cent ST population as per the 2001 Census. For the sample survey, 562 sample households were identified (accounting for about 25 per cent of the total number of households in the village panchayat) from all the eight villages of the Panchayat (as the households and villages lie scattered, unlike in Thalikkulam).
The sample survey in China identified 501 households in Poling village (243) and Xiazhin village (258) of Jiangsu province and 505 households in Hongxian village (233) and Xigwan village (272) of Gansu province.
THE RESULTS
The different dimensions of security considered in this study at the individual/household level are: i) employment security, ii) food security, iii) housing security, iv) health security, v) education security, and vii) old age security. Note that the last two would refer to what is here called ‘CSS’ insofar as it provides a fallback mechanism in times of need. The other dimensions belong, in our conception, to BSS. In what follows, each of these is taken up in turn.

248 Indian Journal of Human Development
Employment Security
We start with employment security, which is better identified with income security, the most basic security for a decent life. In a world, where living conditions are determined in private markets on prices, adequate income secures a safe position with a cushioning against inadequacies and adversities, that is, income security; and income is ultimately derived from labour—both mental and physical, that is, employment. Employment is secure when its remuneration is adequate and its tenure is certain. Based on the (un)certainty of tenure, employment is usually grouped into distinct categories of permanent, casual, and regular but not permanent. The first one refers to employment, in general, in the public sector and the last in the private sector, while the second category encompasses all employment opportunities, even in the public sector nowadays, with no guaranteed contract on tenure and remuneration, thereby entailing uncertainty and hence insecurity. Being uncertain in both tenure and remuneration, casual (or odd) employment is thus wholly insecure. Note also that in all these categories, there is an employee–employer relationship; hence, we can have a separate categorization based on this relationship, and where this is absent, we have another category of employment, that is, the self-employed one. Self-employment, which signifies another fertile field of uncertainty and hence insecurity, at present increasingly tends to harbour a large proportion of the residuals from employment opportunities. The context of uncertainty and insecurity is true in the case of China too for, what they refer to, as the odd job workers (that is, casual workers) and the self-employed ones. Hence in this paper, these two categories of workers are considered.
Casual Workers
These are workers who have no regular work. They depend on work that comes by as and when there is a demand for it. They are referred to as ‘casual workers’ in the Indian context whereas the Chinese scholars refer to them as ‘odd job workers’.
It is worth noting that about 43 per cent of the casual workers in Kerala surveyed reported to earn Rs. 100 to Rs. 150 a day; and the average reported daily earnings emerge as Rs. 137 (see Table 4). In the Orissa sample, on the other hand, most of the casual labourers (76.5 per cent) reported to be belonging to the Rs. 30–Rs. 50 earnings bracket, with mean daily earnings of Rs. 43 only. On the other hand, about 30 per cent of the odd job workers in the Jiangsu sample and 46 per cent in the Gansu sample reported to earn RMB 10–20 a day; however, the following higher income brackets are not much accessible for the Gansu workers. Note that the earnings distribution in Kerala as well as in Jiangsu is almost normal, but that in Orissa and Gansu, it is highly positively skewed. Thus in the Orissa sample, only 6.4 per cent of the casual labourers receive earnings greater than Rs. 50 a day, while in the Kerala sample, this earnings bracket includes as much as 98.6 per cent of the casual labourers; while 36.5 per cent in Jiangsu are bracketed in the higher income group of RMB 30 or more, only 6 per cent in Gansu find themselves in that group.

Kannan and Pillai: Socio-economic Security in Rural India and China 249
In respect of the number of days of work, nearly 60 per cent of the casual labourers in the Kerala sample work up to 15 days a month, whereas about 51 per cent of those in Orissa work for more than 15 days a month (see Table 5). On the other hand, 80 per cent of the workers in Jiangsu work for more than 200 days a year whereas about 84 per cent in Gansu work for less than 200 days, that is, more than 17 days and less than 17 days per month, respectively.
Table 4 Earnings per Day of the Casual (Odd Job) Workers in India and China
India (Rs.) Kerala Orissa China (Yuan) Jiangsu GansuNo. of workers 218 425 No. of workers 211 165Less than Rs. 30 0.46 17.18 Less than RMB 10 5.2 31.5Rs. 30–Rs. 50 9.17 76.47 RMB 10 - 20 29.9 45.5Rs. 50–Rs. 100 25.23 5.88 RMB 20-30 28.4 17Rs. 100–Rs. 150 42.66 0.47 RMB 30-40 24.6 3Rs. 150–Rs. 250 19.27 0 RMB 40-50 7.6 0.6Above Rs. 250 3.21 0 Above RMB 50 4.3 2.4
Table 5 Number of Days Worked in the Previous Month or Year of the Survey (%)
No. of Days Worked No. of Days Worked
Last Month Kerala Orissa Last Year Jiangsu Gansu
< or = 5 2.3 11.07 < 10 0.4 0.6
6 - 10 20.18 14.82 10-50 0.5 16.9
11 - 15 36.7 22.82 50-100 3.8 37.6
16 - 20 24.77 28.94 100-200 15.2 28.5
21 - 25 16.05 22.35 > 200 80.1 16.4
It should be noted that only about 15 per cent of the casual workers in the Kerala sample reported that their earnings were quite inadequate for a living, while the corresponding figure in Sason was as high as 44 per cent (see Table 6). Most of these ‘poor’ people had to resort to borrowing and some even had to seek support from their relatives; the remaining reported to have somehow managed to make both ends meet. It is worth noting that about half of the casual workers in the Kerala and Jiangsu samples and nearly 90 per cent of them in Orissa and 80 per cent in Gansu were also searching for more days of work and other work opportunities. None of these workers in India was fortunate enough to enjoy any benefits other than the wages provided by the employer, whereas some of their counterparts in China did enjoy the benefits of some material compensation in terms of food (and, as they reported, some cigarettes too!). Contrary to the general expectation, we could find only a few of the casual workers in Kerala with a background of trade union participation; Orissa’s blank in this regard is as expected. A sizeable proportion of these workers in both the countries are engaged in hazardous work.

250 Indian Journal of Human Development
Given this background of job (in)security, how are these casual workers prepared to cope with contingent events? As is well known, Kerala has a number of welfare schemes institutionalized through Welfare Funds/Boards for the benefit of the informal sector workers (for details, see Kannan, 2002). Kerala was the first, and the leading one among a few states to experiment with ‘Welfare Funds’ as a specific form of collective care arrangements for the informal sector workers; there are about 23 Welfare Funds3 in the state that benefit different segments of the informal workers in the state. However, one or another of these government welfare schemes stands to benefit only 16 per cent of the 218 casual workers surveyed in Kerala. This could perhaps be due to the location-specific nature of the concentration of certain occupations/industries with a significant proportion of informal workers (such as cashew workers in Kollam district, coir workers in Alappuzha district, and handloom and beedi workers in Kannur district). Or it may well be the case of slack trade unionism in the survey area that is characterized by a high density of international labour migration (mainly to the Gulf countries). However, the wide penumbra in the vast casual work opportunities left uncovered by any of the government welfare schemes even in Kerala, which leads the entire country in terms of such initiatives, must be noted. On the other extreme of this welfare administration lies Orissa, with apparently few initiatives on either the governmental or the personal front. None of the sample casual workers in the state is covered by any of the government welfare schemes.
Table 6 Background of Employment (In)security of Casual Workers
In percentage Kerala Orissa Jiangsu GansuEarnings adequate for livelihood 84.9 56.0 NA NASearching for more days of work 50.9 88.9 50.9 79.4Benefits other than pay 0 0 8.7 20.9Member of any trade union 10.1 0 NA NAMember of any government welfare scheme 16.1 0 NA NAEngaged in hazardous work 33.0 33.4 36.2 25.6Insurance against: Work-related hazards 27.1 0 80.0 33.3 Accidents 31.7 0.5 56.2 57.1 Sickness 24.8 0 4.4 1.8Pension plan 17.0 0 NA NAAny savings 6.4 2.4 NA NAAny property in your name 42.2 42.6 NA NALooking for a permanent/regular job 44.9 72.9 NA NA
Note: The Chinese scholars apparently did not seek information on items marked NA (Not Available) here.
The coverage under insurance in Kerala is mostly through the personal initiatives of the workers who also have a measure of basic education. This seems to have been critical in their ability to access information and avail of the insurance facilities. Of course, they also have a level of earnings, which is, as discussed earlier, more

Kannan and Pillai: Socio-economic Security in Rural India and China 251
than three times that of the workers in the Orissa villages for casual workers. The average earnings of the self-employed are also considerably higher than those of their counterparts in Orissa.
Self-employed Workers
The details of the self-employed workers are given in Table 7. Most of the self-employed (including about 75 per cent in the Kerala sample and 63 per cent in the Orissa sample) set up their units on their own or with the help of family funds. In the case of almost all the remaining units, capital was mobilized through borrowings; only some of these borrowers (about 36 per cent in the Kerala sample and 24 per cent in the Orissa sample) were able to pay off the entire debt. Most of the in-debt self-employed workers, especially in Orissa, feel that they are left with nothing much after paying back loans and have to borrow again. On the other hand, in the context of China, a majority of the self-employed units in Gansu (about 57 per cent) have relied on their own or their family funds whereas in Jiangsu, borrowings constitute the major source of capital (about 60 per cent). However, on the whole, only around 25 per cent of the self-employed workers are still on the lookout for some other, especially permanent, job.
Table 7 Background of the Self-employed and their Livelihood
Percentage (except in the first row) Kerala Orissa Jiangsu GansuNo. of self-employed 167 468 144 271Self-employed only 70.7 69.7 50.0 39.5With family members 19.8 16.7 22.9 48.0With hired workers 9.6 13.7 27.1 12.5Mobilized capital from own/family funds 74.8 62.6 40.1 56.6 from borrowings (including banks) 25.2 37.4 59.9 43.4Looking for other jobs 27.5 23.7 29.6 27.9Member of any professional/service association 90.4 22.9 NA NAEarnings adequate for livelihood 89.8 51.5Work involves any health hazard 15.0 10.0 15.3 1.8Insurance against: Work-related hazards 13.2 0.2 81.0 25.0 Accidents 42.5 0.6 14.0 1.4 Sickness 28.1 0.4 – –Pension plan 19.8 0.6 – –Crop insurance 44.4 0 – –Any savings 40.7 17.9 – –Any property in your name 50.3 38.7 – –
The earnings of the self-employed also reveal a pattern similar to those of the casual workers. Both in Kerala and Jiangsu, a majority of the self-employed have earnings that could be reckoned to be adequate to be the above the official poverty line for households. But in both Gansu and Orissa, a majority of the self-employed are in the

252 Indian Journal of Human Development
lower income bracket, which underlines their struggle for livelihood security. Among those with inadequate earnings, some get support from their relatives and friends and others resort to borrowing and dis-saving. However, some kind of supplementary works are taken up only by very few among them.
No public welfare scheme benefits are available for any of the self-employed workers in the samples. A number of them are exposed to work-related hazards (though very few in Gansu) and quite a few of them have prepared themselves through some cover of insurance protection in Kerala and China, but very few, as expected, in Orissa. As already seen, the insurance cover against sickness is not very popular among the workers in China. Nor is the pension plan. Nearly half of the self-employed workers engaged in agricultural works have some sort of crop insurance in Kerala but none elsewhere. It may also be noted that about 59 per cent of these workers in the Kerala sample and 87 per cent in the Orissa sample have reported no savings and about 51 per cent in the Kerala sample and 61 per cent in the Orissa sample have no property in their names.
Table 8 Monthly Earnings of the Self-employed
Earnings (Rs.) per Month Kerala Orissa Earnings (Yuan.) per month Jiangsu Gansu< or = Rs 500 7.19 67.74 < or =RMB 500 30.1 82.1Rs. 500 to Rs 1000 10.78 8.12 RMB 500-1000 33.8 13.4Rs. 1000 to Rs 2000 23.95 14.32 RMB 1000-2000 21.1 4.2Rs. 2000 to Rs 4000 29.94 6.21 RMB 2000-5000 3.8 0Rs. 4000 to Rs. 7000 19.16 2.99 More than RMB 5000 8.9 0Rs.7000 and above 14.38 2.35
A major problem faced by the self-employed units engaged in the manufacturing or processing of products is in marketing. Most of them do not have any arrangements with anybody for trading the products and have often experienced the problem of not being able to sell or being forced to make distress sales in the face of competition from brand products or lack of demand in general. This too adds to their insecurity.
Food Security
The favourable impact of the development initiatives, including the vast network of the Public Distribution System (PDS) within the reach of all the people, on the living standard in Kerala, in general, has been quite impressive, as it has resulted in a drastic fall in the poverty ratio. The survey results just corroborate the fact: 99 per cent of the 502 households surveyed reported that not a single member of their households goes hungry for lack of food. However, in the case of the Orissa villages, the households reported that around 39 per cent of them go hungry for lack of food (see Table 9).

Kannan and Pillai: Socio-economic Security in Rural India and China 253
It should be noted that having a ration card has become as much of a civilian (and a legal) requirement for identification of the household/member as a passport. About 96 per cent of the households surveyed in Kerala do have ration cards, including about 61 per cent Above the Poverty Line (APL), and 39 per cent Below Poverty Line (BPL) households, while 5 per cent have Antyodaya cards. In Orissa, on the other hand, only about 48 per cent of the households have ration cards.
Although regular use of the card is reported by most of the cardholders (about 76 per cent in Kerala and about 53 per cent in Orissa), it is mostly for kerosene and rice/wheat; all the Antyodaya and the BPL cardholders use their ration cards regularly for all the available ration items, but 12 households in Kerala reported that they had never used their cards. The poor quality of the PDS food items and the insignificant difference between the open market and PDS prices are highlighted by all the cardholders, including the regular card users.
Table 9 Some Background of Food (In)security in Indian Villages
Response of Households
Thalikkulam (Kerala) Sason (Orissa)Number Percentage Number Percentage
No member has to go hungry due to lack of food 498 99.2 342 60.9Possible to purchase on credit from PDS 4 0.8 0 0Possible to purchase on credit from traders/market 111 22.1 269 47.9Having a ration card 480 95.6 271 48.2Using ration card regularly 366 76.3 144 53.1Quantity allotted is enough for the family 308 64.2 88 32.5PDS shop is within 2 km from house 502 100 206 76.01Aware of mid-day meal scheme at school 502 100.0 382 68.0School nearby where the child studies provides mid-day meals
418 83.3 145 25.8
Aware of ICDS 502 100.0 362 64.4Settlement has an ICDS disbursement centre 481 95.8 357 63.5ICDS disbursement centre is within a range of 2 km 481 95.8 172 30.6
As for their ability to lift the entire ration quota of the available ration items, most of the regular card users including in the Antyodaya and BPL groups in Kerala normally face no constraints, but a significant number of the Orissa respondents reported sometimes being to lift the entire quota due to lack of money. While about 64 per cent of the regular card users in Kerala and about 32 per cent in Orissa also find that the ration quota allotted to them is enough for their family, the remaining in Orissa generally feel the PDS quantity is insufficient because of low and fixed entitlement per household rather than per person, as well as large family size. The latter is endorsed by those cardholders in Kerala who have complained of inadequate quota. Note that the regular use of the ration card also depends on the accessibility or closeness of the PDS shop to the residence including the time spent for ration collection and availability of ration items; for all the respondents in Kerala and 76 per cent of the card holders

254 Indian Journal of Human Development
in Orissa, the PDS shop is within a 2 km radius form their homes. While none of the card users in Kerala has complained of the non-availability of ration items, most of the Orissa cardholders have had only complaints.
Table 9 also provides an uneven picture of both the awareness of, and access to, mid-day meals in the schools. The fact that only 26 per cent of the Orissa households reported the provision of such mid-day meals in the schools attended by their children points to the enormous deficit in the implementation of this child-friendly scheme. However, in the case of the pre-school childcare centres (that is, ICDS), the situation is somewhat better in Orissa as compared to that obtaining with the mid-day meal scheme. At the time of the survey, 134 households in Kerala and 159 in Orissa were beneficiaries of the ICDS, while all in the Kerala sample and 54 per cent (86 households) in the Orissa sample reported that they receive the benefits regularly; the benefits consisted mainly of food for children below the age of 6 years and medical care. A few households in Kerala and most in Orissa, however, complained about the inadequacy of the available benefits.
Studies on China’s rural economy have noted that food security is mainly taken care of by access to land under the Household Responsibility System whereby small plots of land are distributed to the households. Our empirical findings (see Table 10) corroborate this picture. It is found that about 96 per cent (966) of the 1006 households surveyed in the two regions (483 households each) have land contracted from the collective. When probed further, it was revealed that in most cases, the land given hardly exceeded an acre per household. This is why only about 55 per cent of these land-owning households have grain production either with surplus over consumption or just enough for consumption; that is, about 45 per cent of them (434) go without adequate return from land even for consumption and face food insecurity, including as many as 380 (nearly 80 per cent) of the sample households in Gansu and 54 in Jiangsu.
Table 10 Some Background of Food (In)security in Chinese Villages
Status of Households
Jiangsu Gansu
Number Percentage Number PercentageSurveyed households 501 100 505 100Households that contracted land from Collective 483 96.4 483 95.6Grain Production for Consumption Sufficient/surplus 297 61.5 19 3.9 Just sufficient 132 27.3 84 17.4 Insufficient 54 11.2 380 78.7
During the transition period in rural China, when agriculture production was encouraged towards specialization, commoditization and marketization, and income sources and employment opportunities were inclined to be more and more diversified, what was the situation with regard to food security of the ordinary
Kannan and Pillai: Socio-economic Security in Rural India and China 255
villagers? It must be stated here that the questions canvassed in the Chinese context are not detailed enough to secure a more meaningful comparison with the villages in Kerala. Our counterpart Chinese scholars preferred to ask mostly subjective questions and stressed that food security is not a matter of serious concern. As such, there is no detailed quantitative assessment of the food security situation but only the perception of the households surveyed. We shall comment on this later in the section on Discussion of Findings.
From our survey, we could see that there are people, not insignificant in proportion, who are not only food insecure but also unable to obtain timely social relief from the government. Agricultural producers, who happen to face natural calamities, seldom expect to get external help and just rely on themselves to minimize the losses. As for those engaged in non-farming employment, low educational levels and lack of insurance against casualties stand to jeopardize their employment security and livelihood.
Since a majority of the households had their contracted land, why were nearly half of them unable to supply their own foodgrain consumption? Multiple causes are cited for the insufficient level of self-supply of grain: lack of arable land, occurrence of natural calamities, production of cash crops, impoverished soil; restoring of arable land to forestry; lack of labour force; land leasing; and so on.
Out of the 434 deficit households, about 91 per cent choose to purchase their foodgrains. We also came across two households that had to resort to even begging, while others depended upon borrowing and social relief from the state. However, the situation in the study villages was found to be far better than that in Orissa but not so vis-à-vis the study villages in Kerala.
Housing Security
Table 11 provides the details about the housing conditions in the study areas. About 96 per cent of the households in the Kerala study area and about 91.5 per cent in the Orissa study area are living in owned houses, whereas in the Gansu and Jiangsu provinces, the corresponding percentages are 96 and 98, respectively. Almost 60 per cent of the houses in the Kerala sample have concrete roofs, and almost 86 per cent have walls with either brick or stone, indicating good housing conditions, whereas in the Orissa sample, almost 97 per cent of the house roofs have been made of grass/thatch or sheet/tin and the walls of about 86 per cent of the houses are of material other than brick or stone. In the Chinese sample, most of the houses have roofs with sheets or tiles (including 93 per cent in Gansu and 67 per cent in Jiangsu); only about 32 per cent of the houses in Jiangsu and a mere 7 per cent in Gansu have concrete roofs. While most of the houses (97 per cent) in the advanced Jiangsu study areas are made of walls of brick or stone, as many as 95 per cent of the houses in the backward Gansu area are made of wood or mud with bricks.

256 Indian Journal of Human Development
Table 11 Housing Condition in the Indian and Chinese Study Villages
Percentage Kerala Orissa Jiangsu GansuStaying in own house 96.0 90.9 98.6 99.2Staying in relatives’ house 1.0 9.1 1.4 0.6Staying in a rented house 3.0 0 0 0.2Roof of the house—Grass/Thatch 14.7 38.1 1.8 0.8Roof of the house—Sheet/Tile 24.9 58.7 66.7 92.5Roof of the house—Concrete 60.4 3.2 31.5 6.6Wall of the house—Thatch/Bamboo 13.6 72.1 0 0.2Wall of the house—Sheet/Wood/Mud 0.8 14.1 3.0 94.7Wall of the house—Brick/Stone 85.7 13.9 97.0 5.1Having 3 or more rooms 79.4 16.2 78.9 83.7Electrified houses 96.4 19.8 100 97.2Toilet facility within the house 95.4 2.7 97.8 89.3Drinking water 100 96.4 100 79.0Water source is nearby/within the house 97.8 45.7 100 77.8
Other dimensions of housing are the number of rooms in the houses other than the kitchen, electrification, and availability of toilet facility and drinking water. In the Kerala sample, about 96 per cent of the houses are electrified and almost 80 per cent of the houses have either three rooms or more than three rooms other than the kitchen. In other words, 4 per cent of the houses do not have electricity and nearly 6 per cent have only one room other than the kitchen, while another 15 per cent have two rooms other than the kitchen. On the other hand, in the Orissa sample, only about 20 per cent of the houses are electrified and 16 per cent have three or more rooms. About 46 per cent of the sample houses here have only one room other than the kitchen. Coming to the other household amenities, about 95 per cent of the households in Kerala sample have toilet facilities and all the households have potable water facility. Open wells are the sources for drinking water for a majority (87 per cent) of the households, which is the case in the rest of Kerala too. Moreover, almost 98 per cent of the households have a water source either within the house or nearby. In the Orissa sample, while drinking water availability is not a problem for most of the sample households, with 46 per cent having a water source mostly nearby, private toilet facility is available only f a very few. The Chinese study areas are much better placed in all these respects without much regional variation: most of the houses in both the regions have three or more rooms (Jiangsu: 79 per cent and Gansu: 84 per cent); all the houses in Jiangsu are electrified and have drinking water facility, and 98 per cent have private toilet facility, while 97 per cent of the houses in Gansu are electrified, 89 per cent have private toilet facility, and nearly 80 per cent have drinking water facility.
Health Security
Table 12 presents the survey results on some selected health security aspects from the study areas of India and China with the expected differentials. While some healthcare facility (public or private hospital/clinic) is available nearby for most of the households of Kerala, only a few are fortunate enough in Orissa to benefit from this

Kannan and Pillai: Socio-economic Security in Rural India and China 257
facility; both the provinces in China fare much better than Kerala, with Gansu lagging behind Jiangsu.
As regards the personal or household level health security initiatives, a number of dimensions have been considered. Using iodized salt has perforce become a part of the daily life among most of the households in the Kerala sample, just as in other parts of the state, but it is so only for a very few in the Orissa sample; the Chinese experience, in general, is in line with that of Kerala’s without much regional variation. The conduction of regular medical check-ups as a preventive measure has some serious takers among the health-conscious households in Kerala as well as in Jiangsu, but only a few in Gansu and none in the Orissa villages. Promisingly, all the households in Kerala and most in Orissa are aware of and do resort to the available immunization programmes for children; but the households in the study villages of China in this respect are not so fortunate: even though most of them are aware of the immunization programme (about 80 per cent), only a few of them have got their children immunized, with Gansu faring better than Jiangsu here. Drinking boiled water is also an integral way of life among most of the households of Kerala (about 92 per cent in the sample), but only a few households in Orissa (about 12 per cent) were found to be doing so; the Chinese sample also shows a similar variation: in Jiangsu, 95 per cent of the households choose to drink purified water, while in Gansu, only 58 per cent do so. Modern, mostly LNG, modes of cooking are also widespread in Kerala, accounting for about 60 per cent in the sample, while only about 10 per cent of the households report this in the Orissa sample; on the other hand, China, in general, stands in a much better position than Kerala in this respect. All the sample households in Kerala have adequate kitchen ventilation and most of them have kitchen chimneys; nevertheless in nearly 10 per cent of the households, the member doing the kitchen work is found to have some constant respiratory illness. However, the situation is entirely different in Orissa; with some 55 per cent of the sample households having adequate kitchen ventilation, but only very few having kitchen chimneys, the specific respiratory problems are reported by only a few households there.
Table 12 Some Background of Health Security
Percentage Kerala Orissa Jiangsu GansuThe nearest hospital is within 2 km from house 73.5 6.4 97.2 84.0Using iodized salt in the diet 93.0 11.2 97.2 95.8Regular medical check-up as a preventive measure 16.1 0 24.6 3.4Aware of immunization programme for children 100 97.0 79.6 80.8Immunized children against polio and other diseases 100 88.0 18.0 28.3Boil/purify water before drinking 92.4 12.1 95.0 58.0Cooking based on LNG, biogas and other non-traditional energy sources
60.2 10.3 78.0 63.4
Education Security
As seen in Table 2, the literacy status of the households in China, in general, is very high without much geographical and gender differences, but remains below that of
258 Indian Journal of Human Development
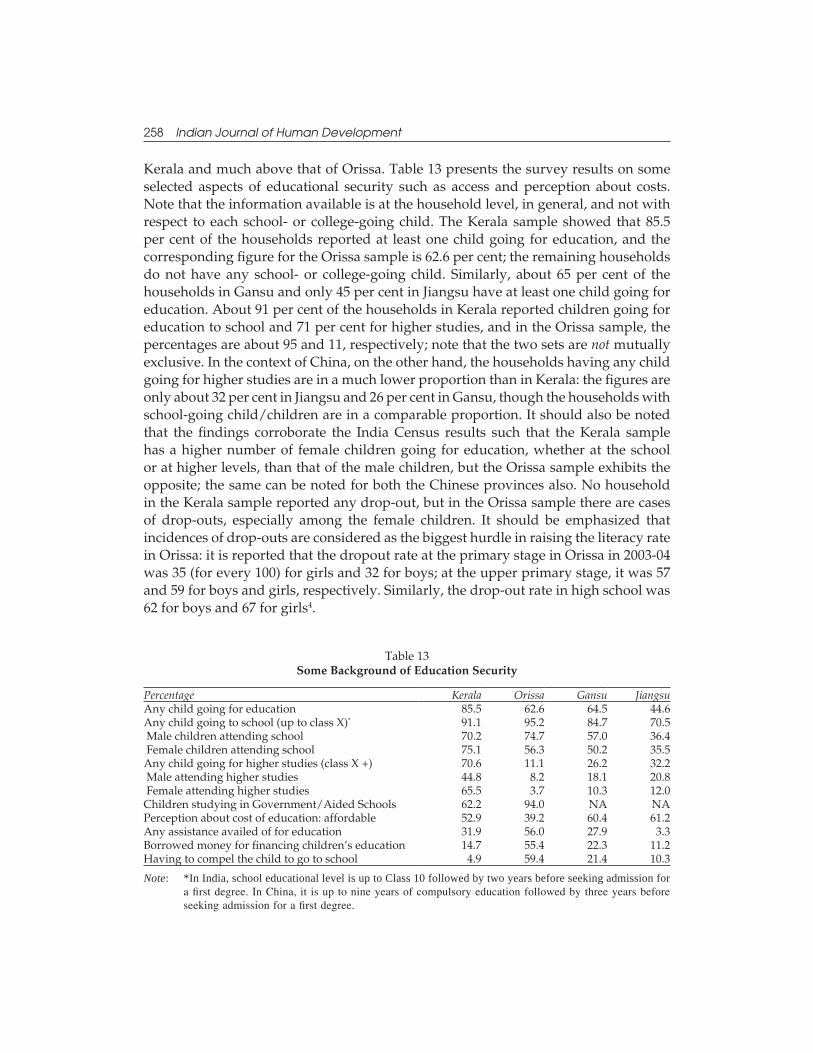
Kerala and much above that of Orissa. Table 13 presents the survey results on some selected aspects of educational security such as access and perception about costs. Note that the information available is at the household level, in general, and not with respect to each school- or college-going child. The Kerala sample showed that 85.5 per cent of the households reported at least one child going for education, and the corresponding figure for the Orissa sample is 62.6 per cent; the remaining households do not have any school- or college-going child. Similarly, about 65 per cent of the households in Gansu and only 45 per cent in Jiangsu have at least one child going for education. About 91 per cent of the households in Kerala reported children going for education to school and 71 per cent for higher studies, and in the Orissa sample, the percentages are about 95 and 11, respectively; note that the two sets are not mutually exclusive. In the context of China, on the other hand, the households having any child going for higher studies are in a much lower proportion than in Kerala: the figures are only about 32 per cent in Jiangsu and 26 per cent in Gansu, though the households with school-going child/children are in a comparable proportion. It should also be noted that the findings corroborate the India Census results such that the Kerala sample has a higher number of female children going for education, whether at the school or at higher levels, than that of the male children, but the Orissa sample exhibits the opposite; the same can be noted for both the Chinese provinces also. No household in the Kerala sample reported any drop-out, but in the Orissa sample there are cases of drop-outs, especially among the female children. It should be emphasized that incidences of drop-outs are considered as the biggest hurdle in raising the literacy rate in Orissa: it is reported that the dropout rate at the primary stage in Orissa in 2003-04 was 35 (for every 100) for girls and 32 for boys; at the upper primary stage, it was 57 and 59 for boys and girls, respectively. Similarly, the drop-out rate in high school was 62 for boys and 67 for girls4.
Table 13 Some Background of Education Security
Percentage Kerala Orissa Gansu JiangsuAny child going for education 85.5 62.6 64.5 44.6Any child going to school (up to class X)* 91.1 95.2 84.7 70.5 Male children attending school 70.2 74.7 57.0 36.4 Female children attending school 75.1 56.3 50.2 35.5Any child going for higher studies (class X +) 70.6 11.1 26.2 32.2 Male attending higher studies 44.8 8.2 18.1 20.8 Female attending higher studies 65.5 3.7 10.3 12.0Children studying in Government/Aided Schools 62.2 94.0 NA NAPerception about cost of education: affordable 52.9 39.2 60.4 61.2Any assistance availed of for education 31.9 56.0 27.9 3.3Borrowed money for financing children’s education 14.7 55.4 22.3 11.2Having to compel the child to go to school 4.9 59.4 21.4 10.3
Note: *In India, school educational level is up to Class 10 followed by two years before seeking admission for a first degree. In China, it is up to nine years of compulsory education followed by three years before seeking admission for a first degree.

Kannan and Pillai: Socio-economic Security in Rural India and China 259
Private unaided schools have a significant proportion of the children in the Kerala sample, but very few in Orissa do so; as already noted above, their presence is insignificant in China too. Only 53 per cent of the households in Kerala and a still lower 39 per cent in Orissa reported that the cost of education was ‘affordable’; in the two Chinese provinces, the proportion is much higher at 60 per cent in Gansu and 61 per cent in Jiangsu. Many households benefit from some assistance for their children’s education and/or go in for borrowings; the proportions in both the categories are much higher in Orissa. And a large number of households in the Orissa sample and a few in Kerala also find it difficult to send their wards to school without some coercion or coaxing; some households in the Chinese provinces also report similar findings.
Old Age Security
Our case study of the two panchayats of India and the four villages of China also surveyed all the old aged (those above 60 years) in each of the sample households regarding their security or insecurity aspects. We met a total of 268 old aged in the Kerala sample, 281 in the Orissa sample, 385 in the Jiangsu sample and 273 in the Gansu sample, with most of them being supported by children, the proportion being much less in the Kerala sample (see Table 14; note that in the Chinese samples, multiple means of subsistence are considered). Some still go for work for a living and a few in the Kerala sample lean entirely on their savings or income from property or pension from different sources. Some are taken care of by relatives in both the countries and most of them feel good about it; some live on a combination of different means.
Table 14 Some Background of Old Age (In)security
Percentage (except row 1) Kerala Orissa Jiangsu GansuNumber of the old aged surveyed 268 281 385 273Means of subsistence: Own work 6.3 8.9 61.7 59.5 Savings only 1.1 0 19.5 5.9 Pension only 8.2 0.7 12.0 6.6 Income from property only 3.4 0 37.1 37.4 Supported by children 48.5 69.8 89.1 86.3 Supported by some relatives 5.6 6.8 1.9 4.6 Combinations of above means 26.87 13.88 NA NASupported by Government or Collective – – 4.9 2.0Have any property in your name 78.4 51.6 88.9 75.4Have any savings 16.4 6.8 19.5 5.9Income enough for a living 23.9 18.5 NA NASupporting anybody with your income 24.6 26.0 4.7 8.8Participating in any community/political events 17.9 2.85 NA NAHave an active role in decisions taken in family 85. 5 41.3 NA NANot feeling unhealthy in general 35.5 36.3 NA NAHappy at home 92.9 63.4 NA NA
Most of the old aged in Kerala (about 78 per cent) as well as in Jiangsu (about 89 per cent) and Gansu (about 75 per cent), and 52 per cent in Orissa have some property in their names, which imbues them with a sense of security. Some have their own

260 Indian Journal of Human Development
savings too. However, the income they get from these different sources is not enough for a living for many of them in India and with the burden of additional dependency, the going gets tough for them. Their Chinese counterparts are somewhat better off in this respect though their response to whether the income is enough for a living is not available. There is a higher level of awareness among the old aged in India about the Annapurna scheme, especially in Kerala, but the scheme has very few beneficiaries, since it is meant only for the destitute above the age of 65 years who are not recipients of National Old Age Pension.
Most of the old aged in Orissa and some in the Kerala sample too face some financial difficulty in meeting personal needs. However, they are happy that they play an active role in most of the decisions taken in the family. Strangely, and unlike the younger generation, most of the old aged in the Kerala sample reported that they are not enthusiastic about participating in any community or political events, perhaps because of their perceived ill-health status; not many feel healthy, in general, in both the samples. However, most of them, especially in the Kerala sample, report that they are happy at home. Most, if not all, the old aged in Kerala also reported that they have a say in decisions taken in the family. Although a comparison with the Chinese villages is not possible here, this is in sharp contrast to those in the Orissa villages. This could be due to a greater degree of economic independence in Kerala.
DISCUSSION OF FINDINGS
In the light of our field experience in India and China, it appears that the macro situation of poverty and human development are reflected to some extent in both the selected provinces at the village level in China, whereas it is not so much in the case of India. Despite this difference, it should be noted that Kerala state in India and Jiangsu province in China are similar in achieving a measure of basic socio-economic security. However, as already seen, the two regions differ from each other in that Jiangsu is better-off in some respects while Kerala is superior in some other dimensions. For example, our fieldwork revealed that Kerala stands distinguished in terms of political activism and civic/associational institutional density in platforms spanning trade unions to cultural and residential associations. For example, we saw a number of village reading rooms/libraries dotting the Thalikkulam panchayat along side women’s and youth organizations. A similar presence of such organizations was not visible during our visits to the Chinese villages. However, every village has a party organization as well as an elected village council though the former remains supreme in decision-making.
Against this ‘advanced’ local level similarity, there is an interesting comparison of the ‘backward’ regions in the two countries, that is, Gansu in China and Orissa in India. It has been found that Gansu, though labelled as ‘backward’ in Chinese official economic circles, is much closer to Jiangsu and Kerala than to Orissa, that is, the inter-regional difference among Gansu, Jiangsu and Kerala appears smaller. More specifically, China enjoys more or less an even distribution of development in

Kannan and Pillai: Socio-economic Security in Rural India and China 261
terms of basic socio-economic security, unlike India. Orissa thus comes out more as an outlier with the visible presence of absolute poverty and deprivation. Scores of raw lives encountered during our field visits in the Orissa villages are living examples of a pitiable situation. Nearly 40 per cent of the sample households remained in hunger; only 20 per cent of the houses had permanent structures and less than 3 per cent had toilet facilities. Low wages, coupled with the unavailability of regular work, kept them in a vicious circle of poverty at the mercy of ruthless moneylenders who demanded high interest on small sums of loans. “We pay dearly for our small loans,” most of them complained, “If we take Rs. 100 worth of loan for a month, we’ll have to pay Rs 110.” While the same story was repeated across almost all the SC households, surprisingly, the situation was somewhat better for the ST households, perhaps due to some land ownership among them.
For one concrete example, let us consider the case of food security. There is little evidence of food insecurity across Chinese villages; true, hard data are not available; but nowhere there did we come across any child with symptoms of malnutrition, unlike in Orissa. The chubby children in Gansu were in sharp contrast to the emaciated ones in Orissa. The difference most probably lies in the ownership of land commanded by the Chinese rural households, though most of them have only less than an acre and about 11 per cent of the households in Jiangsu and 79 per cent in Gansu reported insufficient agricultural production. However, in the case of Gansu, there is need to further investigate why there are no visible manifestations of high food insecurity despite this production insufficiency. The plausible reasons could be the low dependency ratio of households (with only one or two children), a high female work participation rate and, the existence of opportunities for wage employment. At the time of our field visit in Gansu, many farmer households reported that adult women have migrated to other provinces for work (for cotton-picking in this case) that normally lasts for three to four months. They usually go as a group from the village and return as such. Kerala, on the other hand, represents a case of higher wages, rather than of access to land, coupled with a favourable security mechanism in terms of the effective functioning of the PDS, school meals, ICDS, etc. Notable here also is the ‘Gulf emigration effect’; one in four of the households surveyed reported having at least one emigrant that happens to be the same for the state as a whole.
Coming to the lessons offered by these two country experiences, it scarcely goes unnoticed that the growth-based basic macro-economic policy has not trickled down to the anticipated possible extent. The fact that the high (close to 10 per cent per annum) and uninterrupted growth in China could have given a spectacularly higher standard than what we witnessed to the rural well-being, in our view, is beyond dispute; recent research evidence also talks of disturbing trends in terms of widening inequality in income and welfare. Despite a better record in the case of absolute deprivation, China presented a picture of rural households still working their own way out of livelihood insecurity with scarcely any subsidy available in education or in healthcare services at the time of this study. Our visits to village schools revealed that school education involved not only paying tuition fees but also unofficial payments to supplement the

262 Indian Journal of Human Development
salaries of teachers. The same is the case with access to primary healthcare centres wherein the public provisioning hardly exceeded the availability of a building and one or two medical personnel. Patients had to pay for the services received as well as for obtaining drugs. Perhaps the high per capita income (as compared to the Indian states studied here) enables the households to spend higher amounts in both education and health.5
Similar is the Indian record, with a growth rate of well over 6 per cent per annum for three decades. The much expected trickle-down effect has hardly hugged a vast region of rural India, including Orissa, Bihar, Jharkhand, Uttar Pradesh, Assam, and so on, except for some minor touches here and there. The ground reality of absolute deprivation at the local level is a burning pointer to the fact that high growth per se never automatically ensures livelihood security for the rural masses; and that is one of the lessons derived from these experiences.
Kerala, as is well known, is surely an outlier in this context; in fact, its history of human development and security that underlines the significance of public action can question the very tenets of growth tactics. This is all the more evident when Jiangsu is compared with Kerala, which has a per capita income of less than a quarter of that of Jiangsu. And this is the second lesson learnt—the importance of active public action.
Acknowledgement: This is part of a larger study on Social Security in Rural India and China sponsored by the Ford Foundation, New Delhi and Beijing. We are grateful to Professor Zhang Xiaoshan, Director, Rural Development Institute, Chinese Academy of Social Sciences who collaborated with us in this study as well as provided an English version of the main findings of the survey of Chinese villages. Our thanks are also due to Kailas Sarap of the University of Sambalpur, Orissa and Chandra Dutt, Director, Centre of Science and Technology for Rural Development, Thrissur, Kerala who helped us in organizing the field study in the Orissa and Kerala villages, respectively. Thanks are also due to Rathi Kantha Kumbhar and P.B. Rakhee for research assistance. A special word of thanks to Ashwani Saith for his support in initiating us into this comparative study.
NOTES
1. For an extension of this argument within the perspective of human rights, see Kannan and Pillai, 2007.
2. In Kerala, a Village panchayat Ward is roughly equivalent to a village in other parts of India.
3. This was at the time of the survey. The number went up to 27 in 2008.
4. See (http://rc.orissa.gov.in/index3.asp?linkid=25&sublinkid=33),Accessed in July 2008.
5. Professor Ashwani Saith of the Institute of Social Studies, The Hague, confirmed this observation on the basis of his study of China’s rural economy (for more than three decades). He pointed out that a farmer household with two children at the secondary school could well end up spending half its income.
REFERENCES
Centre for Development Studies (CDS) (1975). Poverty, Unemployment and Development: A Case Study with Special Reference to Kerala, United Nations, New York.
Centre for Development Studies (CDS) (2006). Kerala Human Development Report 2005, State Planning Board, Government of Kerala, Thiruvananthapuram.

Kannan and Pillai: Socio-economic Security in Rural India and China 263
Government of India (2002). National Human Development Report 2001, Planning Commission, Oxford University Press, New Delhi.
Kannan, K.P. (2002). “The Welfare Fund Model of Social Security for Informal Sector Workers: The Kerala Experience”, Indian Journal of Labour Economics, Vol. 45, No. 2, pp. 243-272.
—— (2007a). “Social Security in a Globalizing World”, International Social Security Review, Vol. 60, Nos. 2-3, pp. 19-37.
—— (2007b). “From Human Development to Economic Growth: Kerala’s Turnaround in Growth Powered by Human Development, Remittances and Reform” in A. Vaidyanathan and K.L. Krishna (eds), Institutions and Markets in India’s Development: Essays for K.N. Raj, Oxford University Press, New Delhi, pp.319-344.
Kannan, K.P. and N. Vijayamohanan Pillai (2004). Development as a Right to Freedom: An Interpretation of the ‘Kerala Model’, Working Paper No. 361, Centre for Development Studies, Thiruvananthapuram, August.
—— (2007). Social Protection in Rural India, A Study Report submitted to the Ford Foundation, New Delhi, by the Centre for Development Studies, Thiruvananthapuram, June.
National Commission for Enterprises in the Unorganized Sector (NCEUS) (2006). Report on Social Security for Unorganized Workers, Government of India, New Delhi.
—— (2007). Report on Conditions of Work and Promotion of Livelihoods in the Unorganized Sector, Government of India, New Delhi.
—— (2008). A Special Programme for Marginal and Small Farmers, Government of India, New Delhi.
Sengupta, Arjun, K.P. Kannan and G. Raveendran (2008). “India’s Common People: Who Are They, How Many Are They and How Do They Live?” Economic and Political Weekly, Vol. 43, No. 11, pp. 49-63.
United Nations Development Programme (UNDP) (2006). Human Development Report 2006, The Human Development Report Office, New York.
United Nations Development Programme (UNDP) and China Development Research Foundation (CDRF) (2005). China National Human Development Report 2005, Beijing.

9 7 7 0 9 7 3 7 0 3 0 0 0
I SSN 0 9 7 3 - 7 0 3 0