basics of semzurbrigg/psy214b/09sem3a.pdf · 09sem3a 2 what is sem? •many names »structural...
TRANSCRIPT

09SEM3a 1
Basics of SEM
• What is SEM?• SEM vs. other approaches• Definitions• Implied and observed correlations• Identification• Latent vs. observed variables• Exogenous vs. endogenous variables• Multiple regression as a SEM model• Steps in SEM analysis• Interpreting output

09SEM3a 2
What is SEM?• Many names
» structural equation modeling» covariance structure analysis (or covariance
structure modeling or analysis of covariancestructure)
» causal modeling» path analysis (with latent variables)
• Several computer programs» LISREL [LInear Structural RELationships]
• the original» EQS [EQuationS]» AMOS [Analysis of Moment Structures]
• can be integrated with SPSS» CALIS, LISCOMP, RAMONA, SEPATH,
and others

09SEM3a 3
SEM: What It Is and What It Isn’t
WHAT IT IS:• Tests hypotheses about relationships
between variables• Very flexible• Comprehensive: Subsumes many other
techniques» multiple regression» confirmatory factor analysis» path analysis» ANOVA
WHAT IT ISN’T:• Only for correlational studies• A way to test causal hypotheses from
correlational data

09SEM3a 4
SEM vs. Other Approaches
• Similar to standard approaches» based on linear model» based on statistical theory; conclusions
valid only if assumptions are met» not a magic test of causality» statistical inference compromised if post
hoc tests performed• Different from standard approaches
» Requires formal specification of model» Allows latent variables» Statistical tests and assessment of fit more
ambiguous• can seem like less of a science; more of
an art
09SEM3a 5
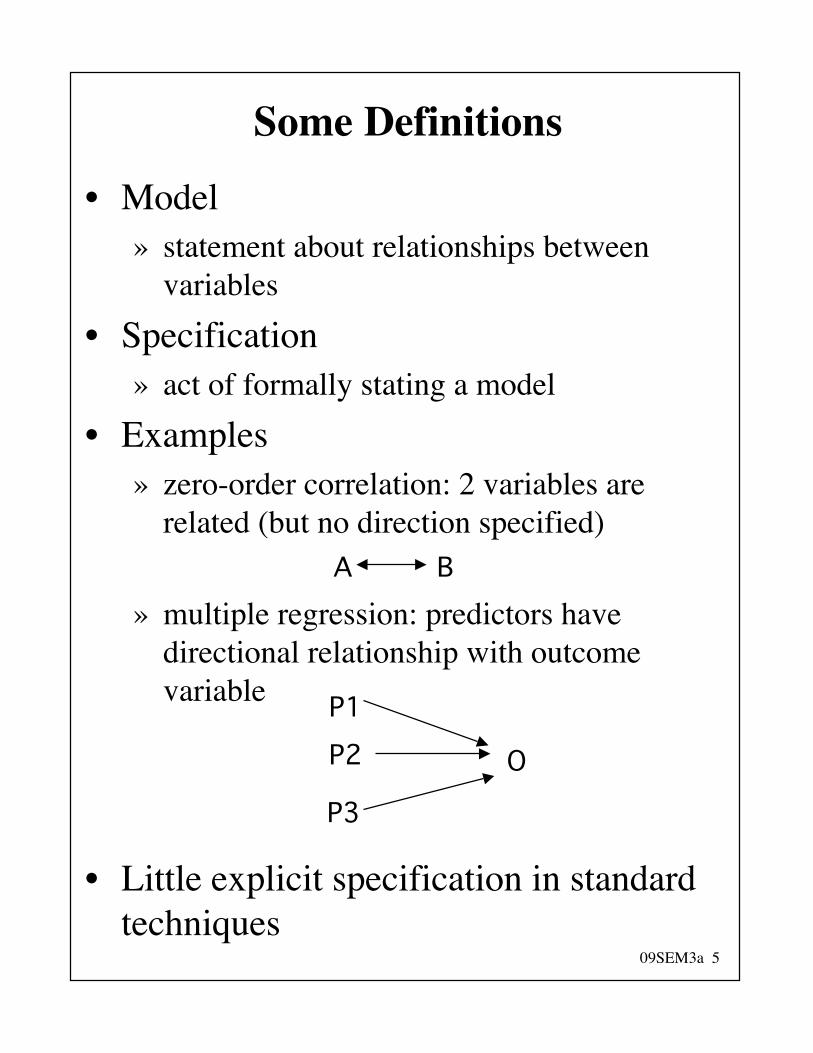
Some Definitions
• Model» statement about relationships between
variables• Specification
» act of formally stating a model• Examples
» zero-order correlation: 2 variables arerelated (but no direction specified)
» multiple regression: predictors havedirectional relationship with outcomevariable
• Little explicit specification in standardtechniques
A B
P1
P2
P3
O

09SEM3a 6
How SEM Works
• You supply two main things» Formal specification of model» Observed relationship between variables
• (i.e., a covariance or correlation matrix)» (You also need to supply the number of
participants or cases)• Model implies a set of covariances• Software tries to reproduce observed
covariance matrix• It does this by estimating parameters in
the model• Software produces two main things:
» parameter estimates» information about how well it did in
reproducing the covariance matrix

09SEM3a 7
More Definitions• Parameters
» parameters are constants» indicate the nature and size of the
relationship between two variables in thepopulation
» we can never know the true value of aparameter, but statistics help us make ourbest guess
• Parameters in SEM» can be specified as “fixed” (to be set equal
to some constant like zero)» or “free” (to be estimated from the data)
• Parameters in other techniques» Pearson correlation: one parameter is
estimated (r)» Regression: regression coefficients are
estimated

09SEM3a 8
An Example
• Model
• Implied correlations» rA,B = p1; rB,C = p2» rA,C = p1*p2
• Observed correlations» rAB = .4; rB,C = .4; rA,C = .16
• perfect fit» rA,B = .4; rB,C = .4; rA,C = .70
• unacceptable fit» rA,B = .4; rB,C = .4; rA,C = .20
• ok fit• Difference between “ok” and
“unacceptable” is a judgment call» no “p < .05” rule for the overall fit
BA Cp1 p2

09SEM3a 9
Identification
• Refers to the relationship between whatwill be estimated (the parameters) andthe information used to derive theseestimates
• If a model is identified it is possible tocalculate (estimate) a unique value forevery parameter
• If not, the model is unidentified orunderidentified
• Model will be unidentified if #Parameters > #Observations• Can also be empirically underidentified
depending on data» e.g., with high multicollinearity it’s as if
you have fewer observed variables

09SEM3a 10
Analogy: SolvingSimultaneous Equations
1) x + y = 6» no unique solution (x=5,y=1 or x=4,y=2)» not identified
2) x + y = 6 2x + y = 10
» unique solution: x=4, y=2» solution perfectly reproduces data (perfect
fit to data)» “just identified”
3) x + y = 6 3x + 3y = 18
» no unique solution» 2nd equation adds no constraints» empirically underidentified» like multicollinearity

09SEM3a 11
More simultaneous equations
4) x + y = 6 2x + y = 10 3x + y = 12• No solution perfectly reproduces data
» x=4, y=2 works for first two, but giveswrong answer for third equation
• But, can minimize differences betweendata and predicted outcomes» usually, try to minimize sum of squares
differences» e.g., x=4, y=2 gives SS of 4
• Best solution is x=3.0, y=3.3» sum of squared diffs = 0.67
• Unique best solution exists, but will notfit observed data perfectly
• Can measure how well it fits
09SEM3a 12
Fit: How Good is theUnique Solution?
• Note that more constraints (moreequations) means that it’s less likely thatour fit will be good» keep in mind when evaluating models» excellent fit less impressive if not very
many df• Fit refers to how much the predicted
covariances (or correlations) differ fromthe observed covariances» small squared differences (residuals)
indicate an acceptable fit» i.e., the model is plausible (can’t be
rejected)• Two main ways to measure: χ2 and fit
indices» we’ll come back to this in a few weeks

09SEM3a 13
Latent and Observed Variables
• One big advantage of SEM: allows forthe use of latent variables» aka factors, constructs» unmeasured (and unmeasurable) “pure”
variables» free of measurement error and “unique”
factors» represented by circles or ellipses
• In contrast to observed variables» aka manifest or measured variables;
indicators» something directly measured (e.g., by a
questionnaire)» include measurement error and other
variance not related to the “pure” constructof interest
» represented by squares or rectangles

09SEM3a 14
SEM Notation
Boxes are used to describe observedvariables
Circles are used to describe latentvariables
A single-headed arrow betweentwo boxesrepresents a causal relation
A double-headed arrow between twoboxesrepresents a noncausal (unexplained)relation
Arrows which do not originate froma box represent residuals
Double-headed arrows betweentwo residuals represent thecovariance of those residuals
e
e1
e2

09SEM3a 15
Latent/Observed (cont.)
Depression
BDI CESD Hamilton
e1 e2 e3

09SEM3a 16
Exogenous vs. Endogenous
• Exogenous variables» “of external origin”» causes are not included in the model (i.e.,
no arrows pointing to the variable; onlyarrows pointing out)
» like an IV (ANOVA) or a predictor(regression)
• Endogenous variables» “of internal origin”» represented as the effects of other variables
(i.e., at least one arrow pointing to it)» like a DV (ANOVA) or an outcome or
criterion variable (regression)• Endogenous variables can also predict
other variables in the model» different than ANOVA and regression» endogenous vars can have arrows pointing
in and pointing out
09SEM3a 17
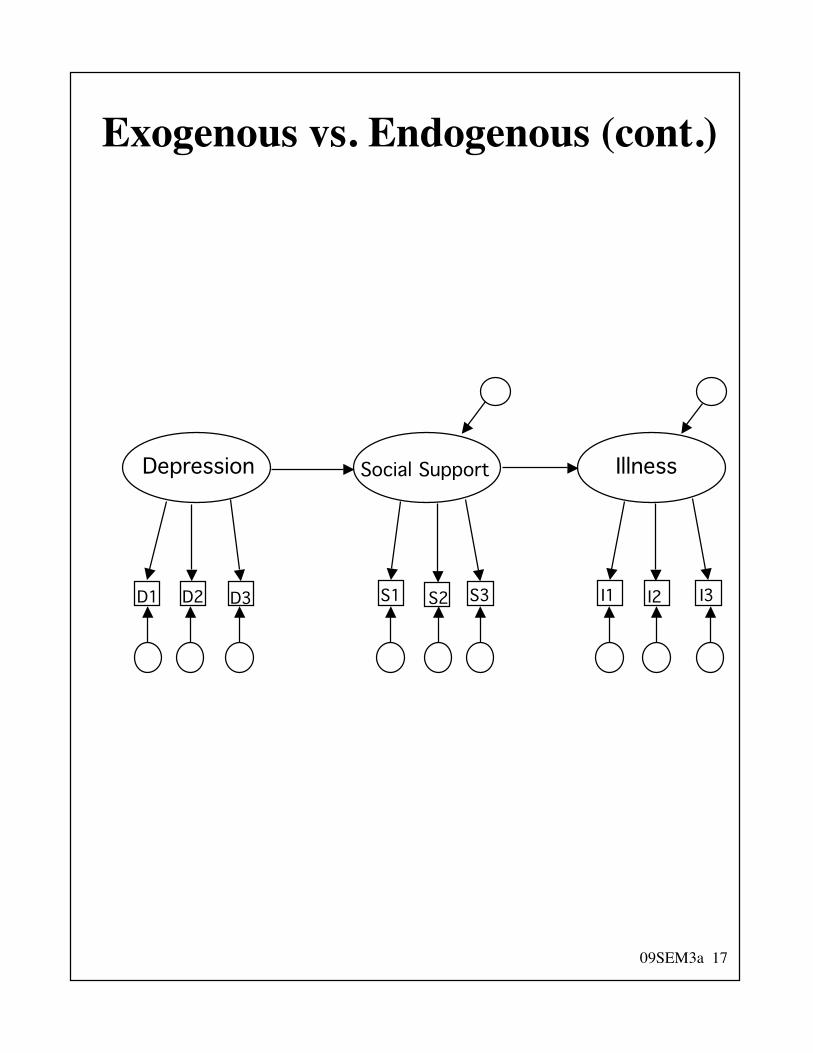
Exogenous vs. Endogenous (cont.)
Depression Social Support Illness
D1 D2 D3 S1 S2 S3 I1 I2 I3

09SEM3a 18
Disturbances
• Every endogenous variable has adisturbance
• These represent all omitted causes, plusany random or measurement error» i.e., all variance that predictors didn’t
predict• Also called residuals or error terms
» “error term” implies that there are noomitted causes (only error variance)
• Disturbances can be conceptualized asunmeasured (latent) exogenous variables
• They allow us to compute a percentvariance explained for each endogenousvariable

09SEM3a 19
Types of Associations
• Association» non-directional relationship» the type evaluated by Pearson correlation
• Direct» a directional relationship between variables» the type of association evaluated in multiple
regression or ANOVA» the building block of SEM models
• Indirect» Two (or more) directional relationships» V1 affects V2 which in turns affects V3» relationship between V1 and V3 is mediated
by V2• Total
» sum of all direct and indirect effects

09SEM3a 20
Associations
Depression Social Support Illness
D1 D2 D3 S1 S2 S3 I1 I2 I3
Alcoholism

09SEM3a 21
Multiple Regression
• Can run regression analyses using SEMsoftware
• Mathematics/computer algorithm usedby SEM is different, but
• Parameter estimates will be identical orvery close
• Note that fit will be perfect (number ofobservations and number of parametersare equal)
• Running in SEM buys you nothing» but, nice analysis to start with (you can
check against SPSS or SAS run)» SEM allows multiple DVs» SEM allows two-group (or multi-group)
comparisons

09SEM3a 22
X2
X3
X1
X4
Y1 e1
Multiple Regression Diagram

09SEM3a 23
Multiple Regression Diagram
Agency
Nurture
SelfEstm
.20
.47
.22
eSE
AMOSd:\awp sem\new models\regress.amw

09SEM3a 24
Steps in a SEM Analysis
• Step 1: Model specification» usually done by drawing pictures using
SEM software• Step 2: Parameter estimation
» SEM software performs this step» Iterative process» Final result is a set of parameters that
produce best fit to data possible• Step 3: Assessment of fit
» Software did the best it could, but how goodis that?
» Variety of ways to assess fit

09SEM3a 25
Computer Software: Preparation• The three steps in a SEM analysis are
easy to remember:» the software ensures that we have a
properly specified model before parametersare estimated;
» parameter estimates are computed, andprovided both on the diagram and in textoutput; and
» fit statistics appear after the parameterestimates. (defaults vary, but softwareallows the user to change the defaults).

09SEM3a 26
Interpreting Output I
• Listing of model specification» always good to check this» familiarity with syntax more imp than in
SPSS• Listing of observed covariance matrix• Scan for error messages
» e.g., that model did not converge• Parameter values
» unstandardized and standardized» like B’s and β’s in regression
• Listing of predicted covariance matrix• Matrix of residuals• Additional information on fit
09SEM3a 27
Computer Software: EQS
• EQS 6.1 available in 4th floor computerlab
• EQS 6.1 also available on machines incomputer lab in SS1
• Academic license: $595• Go to Multivariate Software home page
» http://www.mvsoft.com• Lisrel has a free, downloadable student
versions (limited in terms of # of casesand/or # of variables)» go to www.ssicentral.com
• Amos comes as part of SPSS GradPack(Windows version only)