basis and limitations of organic elemental analysis...
TRANSCRIPT
1
Basis and limitations of Organic Elemental Analysis with the AMS
(HR and UMR)
A. Aiken, P. DeCarlo, D. Sueper & J.L. JimenezJ. Kroll, D. Worsnop
et al.9th AMS Users Mtg
Manchester, UK
Overview1. Canada is a great country ☺2. How to calculate O/C etc. from AMS
spectra3. Fragmentation biases 4. Approximation from 44/OA5. Additional topics
• N/C, org. nitrates & sulfates

2
Canadian Air Force Base in Cold Lake, Alberta
Going from AMS spectra to O/C etc.• Counter-intuitive, NO ONE seems to
understands it by default• Wrong method occurs to everyone first
• Many people feel extremely strongly that the wrong method is the correct one!
• After much pain and explanation, semi-foggy understanding sets in
• Happy to discuss offline• Will post these slides on the web, please refer
to them if confused
3
Simple Sample Spectra:
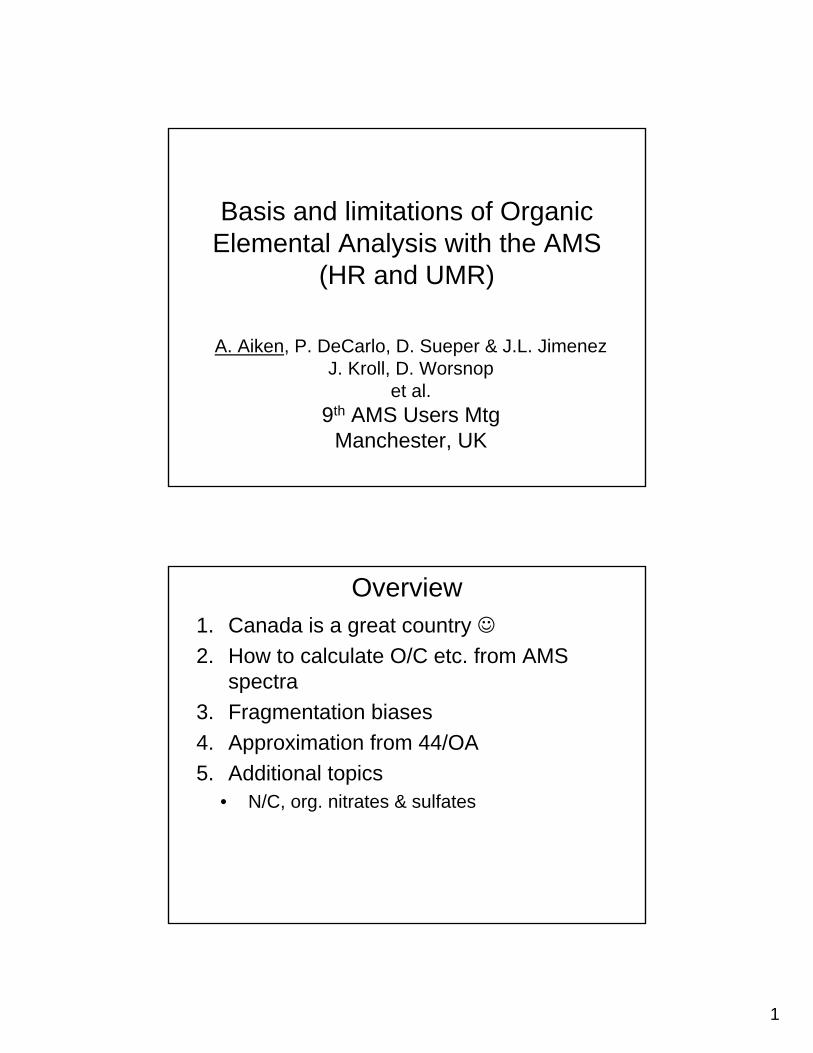
Converting Ion Signals to Element Mass• Pika (AMS HR code) generates ion signal (area) for each HR fragment• Consider the simple mass spectra that was generated in Pika for a SINGLE MOLECULE that contains only two mass fragments, CH3
+
and CO+ (physically unrealistic)• (Note that RIE doesn’t matter sincewe start from a single molecule)
20
15
10
5
0
Mas
s
3028262422201816141210m/z
CH3 CO
= mass= # of ionsQuestion: the fragments have the same intensity (= number of ions). But CO is bigger, i.e. it has more mass
A. CO signal should count more than CH3
B. CO signal and CH3 signals should be equally weighed
OOA-I uglydollKeychain
Ions
as
dete
cted
Ionization Efficiency α Electrons
Jimenez et al., JGR, 2003
4
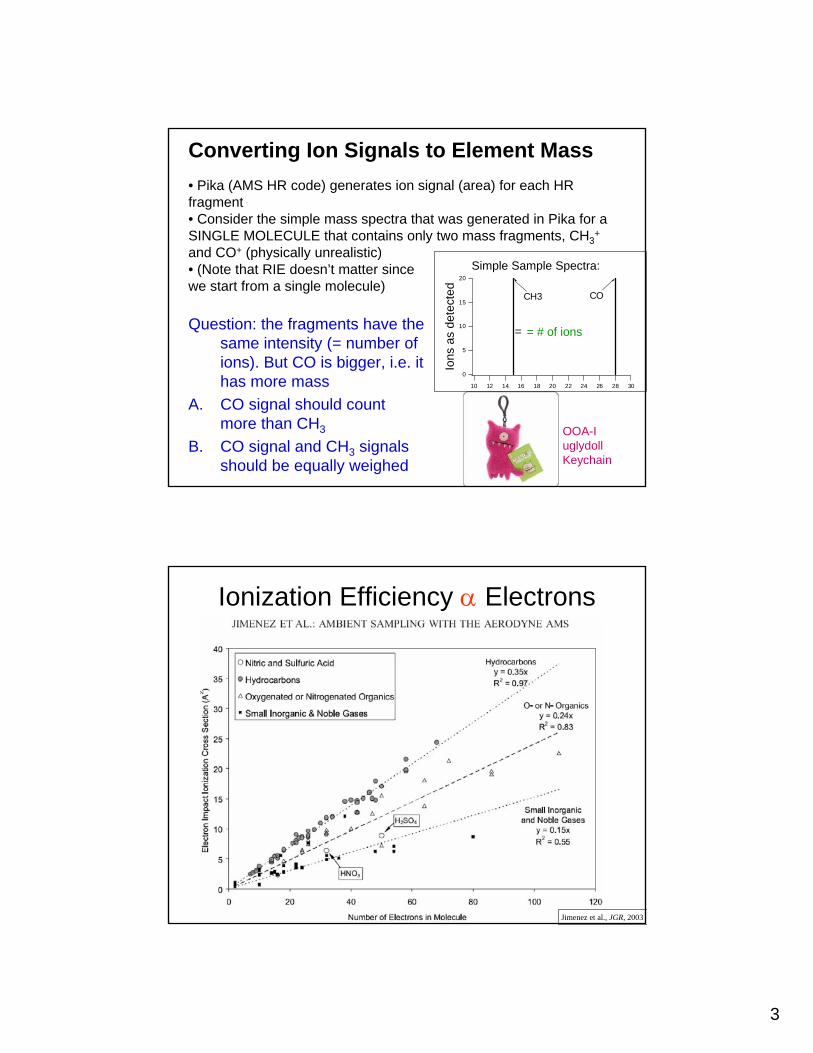
AMS Organic Quantification
Bird area represents the mass (cross section) of molecules in the ionizer
Machine gun represents electrons for ionization
Pieces on bottom represent ions detected
Adapted from Jimenez et al., JGR, 2003
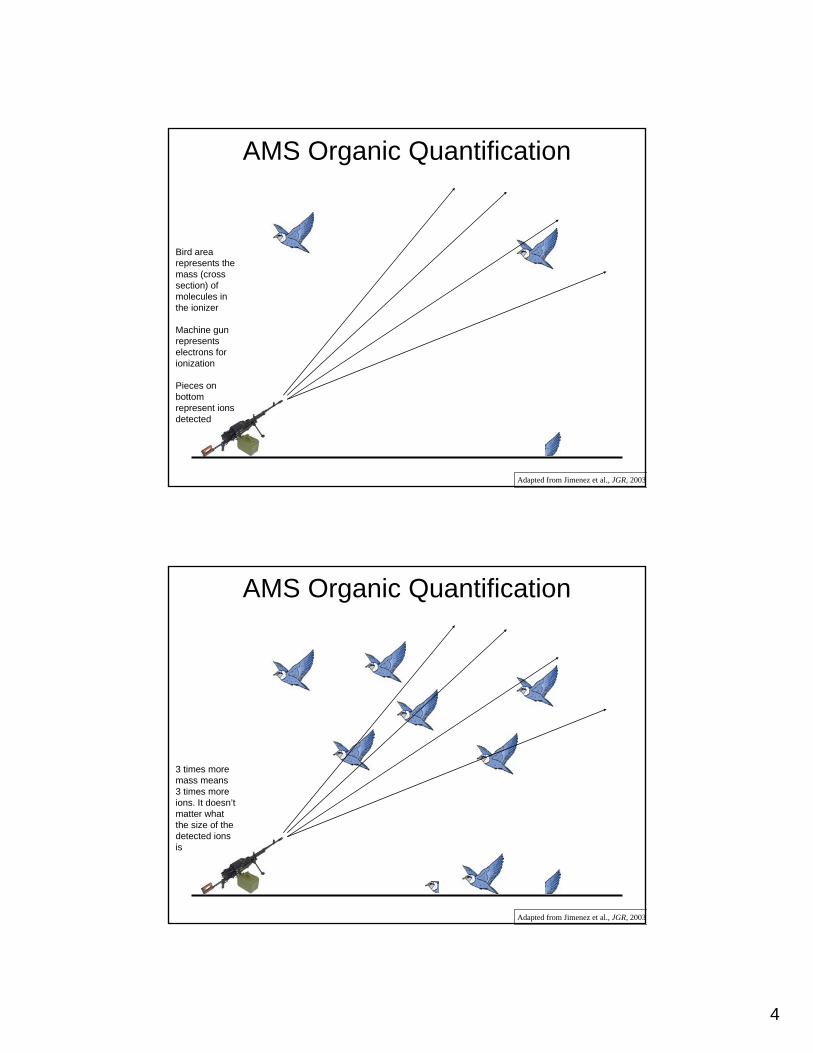
AMS Organic Quantification
3 times moremass means3 times more ions. It doesn’t matter what the size of the detected ions is
Adapted from Jimenez et al., JGR, 2003
5
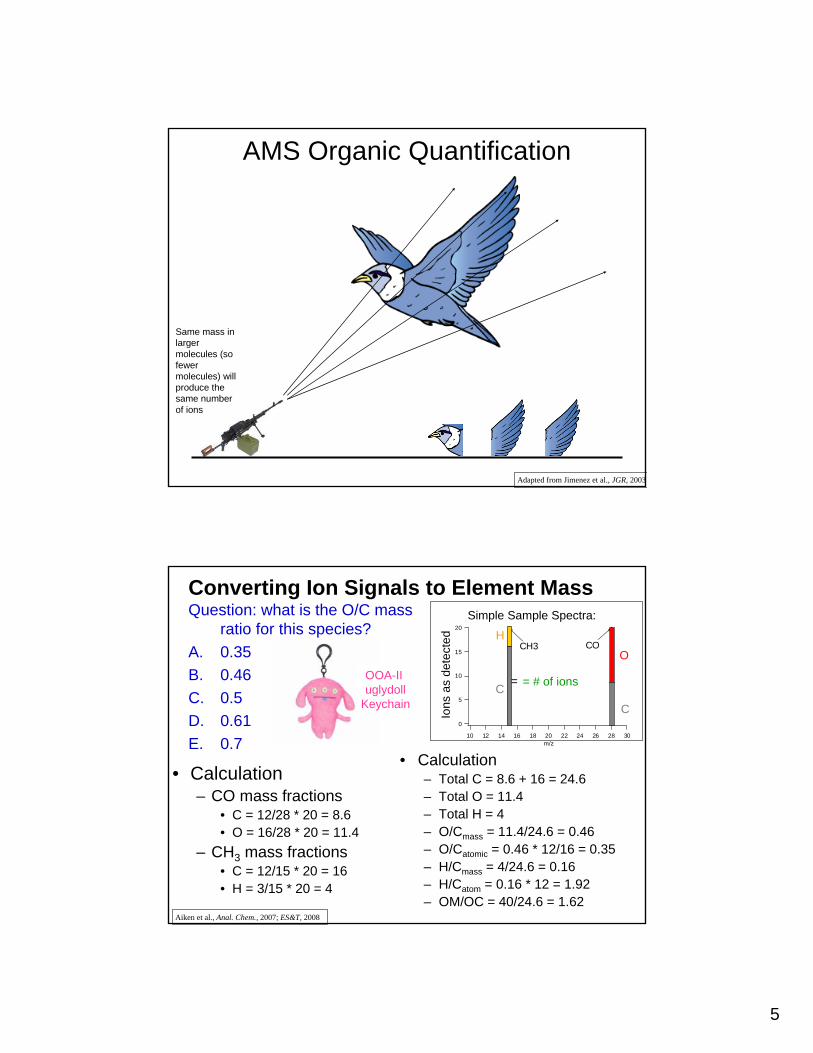
AMS Organic Quantification
Same mass in larger molecules (so fewer molecules) will produce the same number of ions
Adapted from Jimenez et al., JGR, 2003
OOA-II uglydoll
Keychain
Simple Sample Spectra:
Converting Ion Signals to Element Mass20
15
10
5
0
Mas
s
3028262422201816141210m/z
CH3 CO
= mass= # of ions
• Calculation– CO mass fractions
• C = 12/28 * 20 = 8.6• O = 16/28 * 20 = 11.4
– CH3 mass fractions• C = 12/15 * 20 = 16• H = 3/15 * 20 = 4
Question: what is the O/C mass ratio for this species?
A. 0.35B. 0.46C. 0.5D. 0.61E. 0.7
• Calculation– Total C = 8.6 + 16 = 24.6– Total O = 11.4– Total H = 4– O/Cmass = 11.4/24.6 = 0.46– O/Catomic = 0.46 * 12/16 = 0.35– H/Cmass = 4/24.6 = 0.16– H/Catom = 0.16 * 12 = 1.92– OM/OC = 40/24.6 = 1.62
C
O
C
H
Ions
as
dete
cted
Aiken et al., Anal. Chem., 2007; ES&T, 2008
6
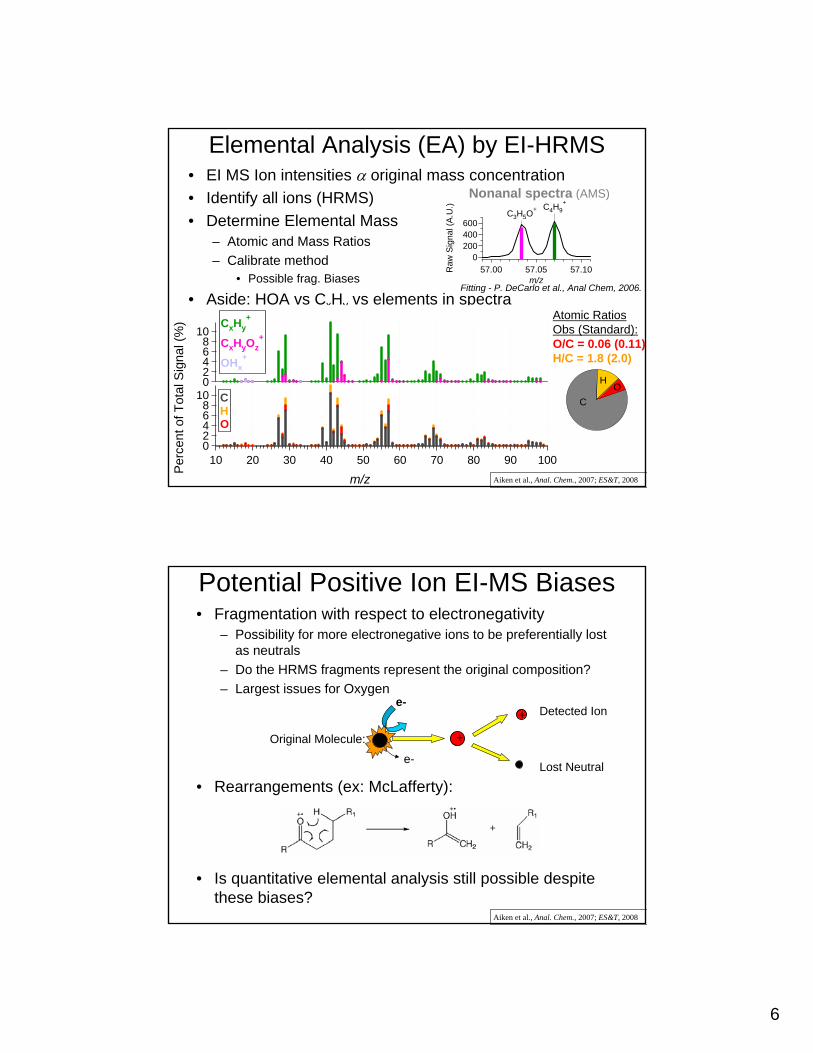
Elemental Analysis (EA) by EI-HRMS • EI MS Ion intensities α original mass concentration• Identify all ions (HRMS)• Determine Elemental Mass
– Atomic and Mass Ratios– Calibrate method
• Possible frag. Biases
• Aside: HOA vs CxHy vs elements in spectra
600400200
0
Raw
Sig
nal (
A.U
.)
57.1057.0557.00m/z
C3H5O+ C4H9
+Nonanal spectra (AMS)
1086420
Per
cent
of T
otal
Sig
nal (
%)
100908070605040302010
m/z
CxHy+
CxHyOz+
OHx+
1086420
Per
cent
of T
otal
Sig
nal (
%)
100908070605040302010
m/z
1086420
CxHy+
CxHyOz+
OHx+
CHO
Fitting - P. DeCarlo et al., Anal Chem, 2006.
OH
C
Atomic RatiosObs (Standard):O/C = 0.06 (0.11)H/C = 1.8 (2.0)
Aiken et al., Anal. Chem., 2007; ES&T, 2008
Potential Positive Ion EI-MS Biases• Fragmentation with respect to electronegativity
– Possibility for more electronegative ions to be preferentially lost as neutrals
– Do the HRMS fragments represent the original composition?– Largest issues for Oxygen
• Rearrangements (ex: McLafferty):
• Is quantitative elemental analysis still possible despite these biases?
Original Molecule:
e-
+
+ Detected Ion
e-Lost Neutral
Aiken et al., Anal. Chem., 2007; ES&T, 2008
7
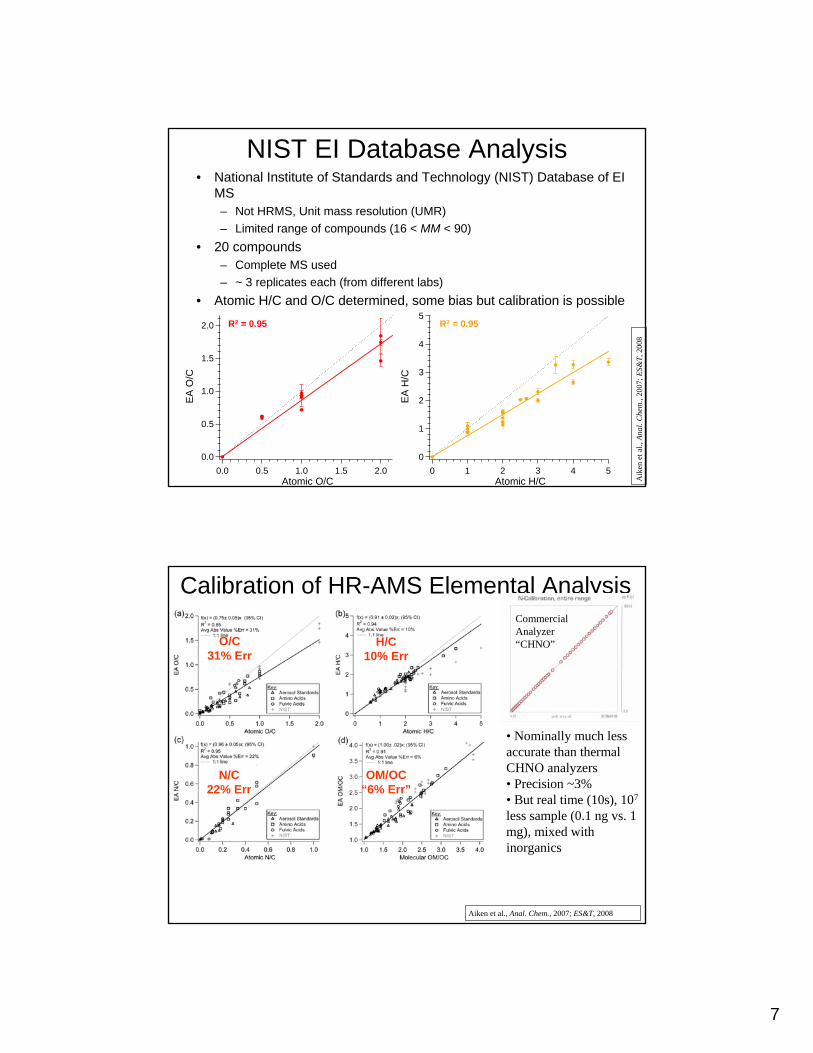
NIST EI Database Analysis• National Institute of Standards and Technology (NIST) Database of EI
MS– Not HRMS, Unit mass resolution (UMR)– Limited range of compounds (16 < MM < 90)
• 20 compounds– Complete MS used– ~ 3 replicates each (from different labs)
• Atomic H/C and O/C determined, some bias but calibration is possible
2.0
1.5
1.0
0.5
0.0
EA
O/C
2.01.51.00.50.0Atomic O/C
NIST fit f(x) = 0.86(x) ± 0.07 (95% CI)R2 = 0.95
5
4
3
2
1
0
EA
H/C
543210Atomic H/C
NIST fit f(x) = 0.75(x) ± 0.05 (95% CI)R2 = 0.92
R2 = 0.95R2 = 0.95
Aik
en e
t al.,
Ana
l. C
hem
., 20
07; E
S&T,
200
8
Calibration of HR-AMS Elemental Analysis
• Nominally much less accurate than thermal CHNO analyzers• Precision ~3%• But real time (10s), 107
less sample (0.1 ng vs. 1 mg), mixed with inorganics
CommercialAnalyzer“CHNO”O/C
31% ErrH/C
10% Err
N/C22% Err
OM/OC“6% Err”
Aiken et al., Anal. Chem., 2007; ES&T, 2008
8
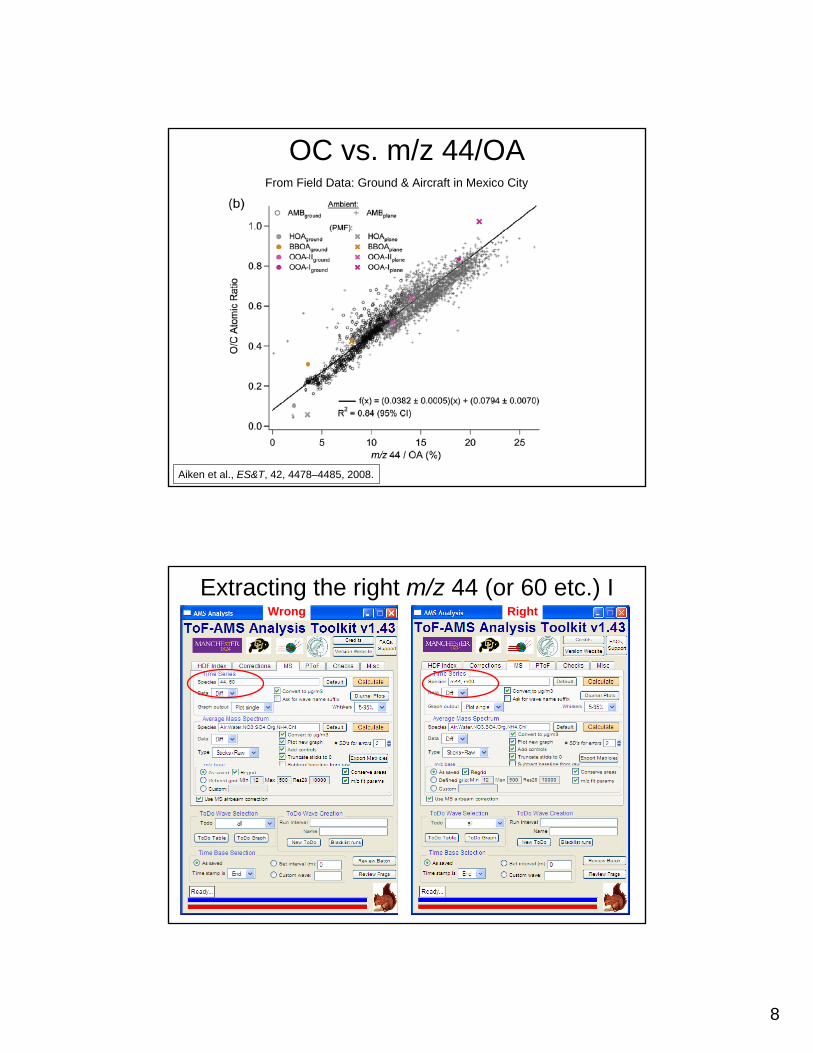
OC vs. m/z 44/OA
Aiken et al., ES&T, 42, 4478–4485, 2008.
From Field Data: Ground & Aircraft in Mexico City
Extracting the right m/z 44 (or 60 etc.) IWrong Right
9
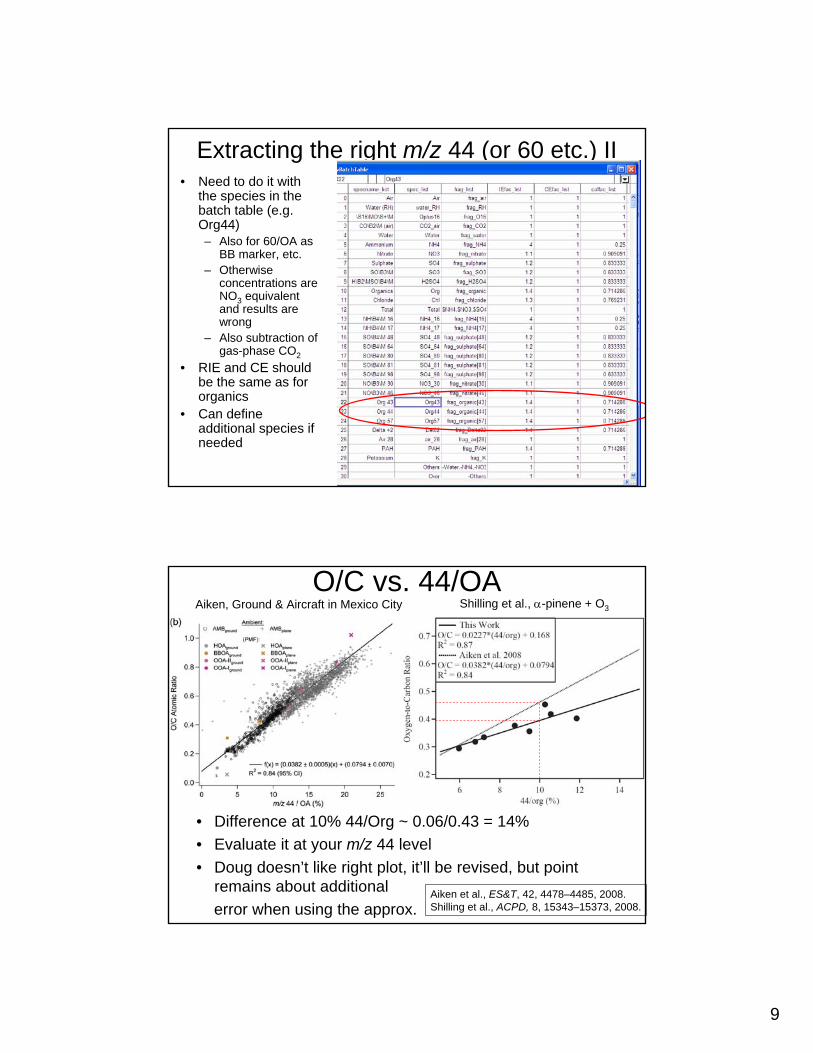
Extracting the right m/z 44 (or 60 etc.) II• Need to do it with
the species in the batch table (e.g. Org44)– Also for 60/OA as
BB marker, etc.– Otherwise
concentrations are NO3 equivalent and results are wrong
– Also subtraction of gas-phase CO2
• RIE and CE should be the same as for organics
• Can define additional species if needed
O/C vs. 44/OA
• Difference at 10% 44/Org ~ 0.06/0.43 = 14%• Evaluate it at your m/z 44 level• Doug doesn’t like right plot, it’ll be revised, but point
remains about additionalerror when using the approx.
Aiken et al., ES&T, 42, 4478–4485, 2008.Shilling et al., ACPD, 8, 15343–15373, 2008.
Aiken, Ground & Aircraft in Mexico City Shilling et al., α-pinene + O3

10
O/C vs 44/OA – AMAZE (Brazil Rainforest)1.0
0.9
0.8
0.7
0.6
0.5
0.4
0.3
Ato
mic
O/C
0.300.250.200.150.100.05m/z 44 / Org
Aiken et al., 2008 Shilling et al., 2008
4321Org (V) ug/m3
Courtesy of Qi Chen, HarvardFrom Chen, Martin, Farmer, Kimmel, et al., in preparation
O/C vs 44/OA – AMAZE (Brazil Rainforest) – 2.5 min average
1.0
0.9
0.8
0.7
0.6
0.5
0.4
0.3
Ato
mic
O/C
0.300.250.200.150.100.05m/z 44 / Org
Aiken et al., 2008 Shilling et al., 2008
4321Org (V) ug/m3
O/C can be a noisy measurement, especially at low Org concentrations.
In Mexico City we don’t calculate it below 2 μg sm-3
In the Amazon ~1 μg m-3
1.0
0.9
0.8
0.7
0.6
0.5
0.4
0.3
Atom
ic O
/C
0.300.250.200.150.100.05m/z 44 / Org
Aiken et al., 2008 Shilling et al., 2008
4321Org (V) ug/m3
2.5 min
1 hr
Courtesy of Qi Chen, HarvardFrom Chen, Martin, Farmer, Kimmel et al., in preparation

11
Summary of Uncertainties in O/C quantification and estimation
• Nominal calibration uncertainty from HR– From comparison to standards– Accuracy: 31% of O/C
• Probably too pessimistic because of mixture– Precision: 3% of O/C (repeating stds)
• Can be much worse if short time averages and/or low concentrations (precision degrades)
• Additional uncertainty from m/z 44 approximation– As a first guess evaluate with difference of Shilling vs Aiken– New approximations coming (people welcome to try)– E.g. 14% for 44/Org = 10%– Combined uncertainty = sqrt(0.312 + 0.142) = 0.34 = 34%
• Need for additional intercomparisons with other methods– Actually quite tricky, will be happy to discuss
AMSComm.
Other
Tech
nique
s
Impression we need to avoid!
Additional topics I• Higher m/z
– Aiken et al. paper included all important peaks beyond m/z 100– Although lack of PIKA defaults, we recommend that people do that– If not, you introduce an error that depends on how much signal is
beyond 100 and how different the O/C is for those fragments• H/C
– Similar uncertainties, it has gotten a lot less attention– Again further calibrations and comparisons with other methods would
be useful• N/C
– Extremely tricky at typical low concentrations• You’ll notice that we have reported a lot less• It requires extensive quality assurance of PIKA work
– Need to have m/z calibration to 0.001 amu– Accuracy at m/z 50 = 0.001/50= 20 ppm
• See your ppm graph in the calibrations• Much of the time, accuracy is WORSE unless a lot of care
– Be REALLY careful, potential to cause major confusion• “this AMS group says N/C is huge, that AMS group says that N/C is tiny,
on the same study. Thus the AMS is a piece of ____”work
12
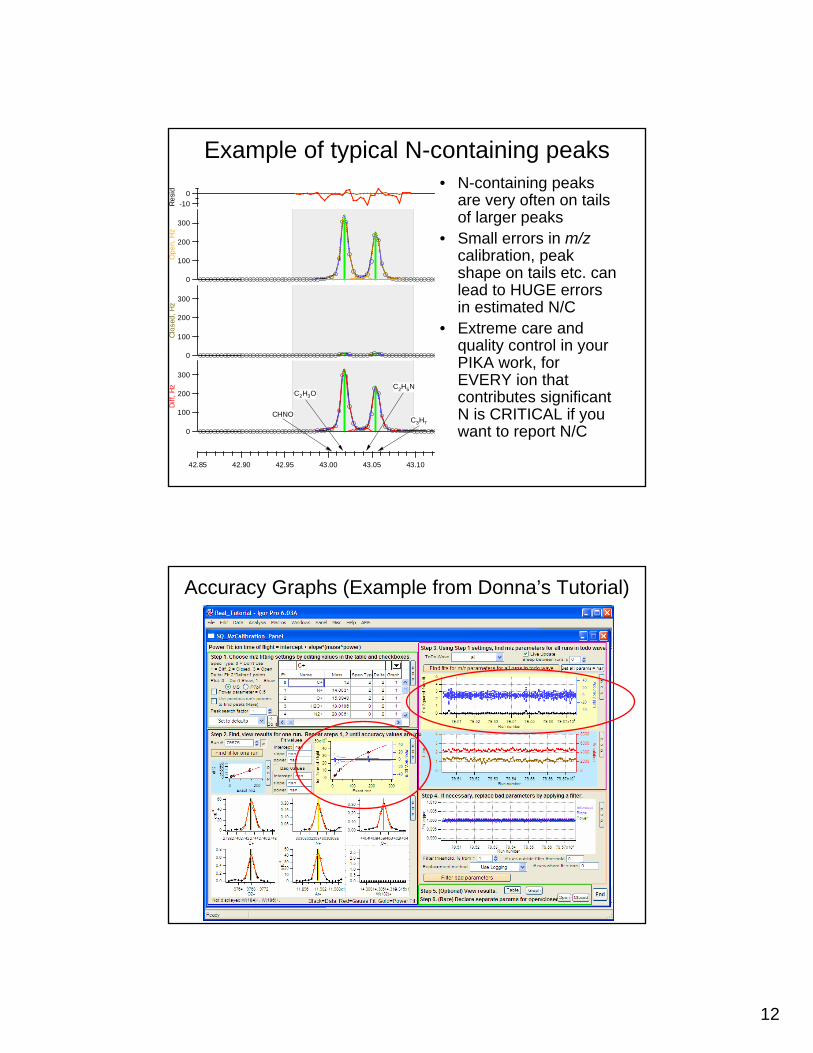
Example of typical N-containing peaks
300
200
100
0
Diff
, Hz
43.1543.1043.0543.0042.9542.9042.85
300
200
100
0
Ope
n, H
z
300
200
100
0
Clo
sed,
Hz
-100
Res
id
CHNO
C2H3OC2H5N
C3H7
• N-containing peaks are very often on tails of larger peaks
• Small errors in m/zcalibration, peak shape on tails etc. can lead to HUGE errors in estimated N/C
• Extreme care and quality control in your PIKA work, for EVERY ion that contributes significant N is CRITICAL if you want to report N/C
Accuracy Graphs (Example from Donna’s Tutorial)

13
Additional Topics II• Types of species we haven’t fully characterized for
fragmentation biases• Organonitrates
– high in models– Scattered experimental results for ambient importance– Perception: “AMS is blind to organonitrates”, N/C too low (?)– Strong evidence that most NO+ & NO2
+ in most datasets is inorganic– Evidence from 3 sets of experiments: most N as NO+ and NO2
+
• So indeed the N/C is too low if NO+ & NO2+ are not included AND
organonitrates are important• Need to evaluate NO+/NO2
+ , NH4+ balance etc.
• Expect a lot of progress by this time next year• Organosulfates
– Papers from Claeys, Surratt et al.: ~10% of S– C-S bond not as weak as C-O-N for organonitrates
• If C-S doesn’t break then they are quite small for many ambient datasets• If C-S does break then our typical analysis underestimates them
– Our group is looking at this in collaboration with Caltech– Don’t recommend reporting S/C of organics until calibration
experiments are completed
The AMS Family thanks you for your attention!
Sulfate Organic
Nitrate Ammonium
OOA-II HOA
OOA-I