basis of a humeomics science: chemical …...basis of a humeomics science: chemical fractionation...
TRANSCRIPT
Published: March 01, 2011
r 2011 American Chemical Society 1187 dx.doi.org/10.1021/bm101488e | Biomacromolecules 2011, 12, 1187–1199
ARTICLE
pubs.acs.org/Biomac
Basis of a Humeomics Science: Chemical Fractionation and MolecularCharacterization of Humic BiosuprastructuresAntonio Nebbioso and Alessandro Piccolo*
Dipartimento di Scienze del Suolo, della Pianta, dell’Ambiente e delle Produzioni Animali, Universit�a di Napoli Federico II, ViaUniversit�a 100, 80055 Portici, Italy, and Centro Interdipartimentale di Ricerca sulla Spettroscopia di Risonanza Magnetica Nucleare(CERMANU), Via Universit�a 100, 80055 Portici, Italy
bS Supporting Information
’ INTRODUCTION
Humic substances (HSs) are ubiquitous natural compoundsarising from the chemical and biological degradation of plant andanimal residues1. Humic substances (HSs) are crucial in ecosys-tems because they regulate the global carbon and nitrogen cycles,the growth of plants andmicroorganism, the fate and transport ofanthropogenic compounds and heavy metals, and the stabiliza-tion of soil structure.1-5 However, manufactured technologiesfor controlling HS activity are not yet developed because of theirlarge molecular complexity. Several analytical techniques havebeen applied to characterize HS, such as oxidative and reductivedegradation reactions,6 UV and fluorescence spectroscopy,7 13C
NMR spectroscopy,8-11 high-performance size exclusion chro-matography (HPSEC),12 pyrolysis-gas chromatography/massspectrometry (GC/MS),13-15 low- and high-resolution massspectrometry with electrospray ionization (ESI/MS),16-19 solidsorption on several materials (XAD, PVP, and similar) coupledto tangential ultrafiltration,20 and others. Nevertheless, none ofthese techniques alone was found to be sufficient to elucidate thestructural complexity of humic molecules.
Received: December 9, 2010Revised: January 28, 2011
ABSTRACT: We propose a mild stepwise fractionation of molecularcomponents of a humic acid (HA) suprastructure and their structuralidentification by advanced analytical methods. This procedure may be thebasis of a “Humeomics” approach to characterize natural humic moleculesand clarify their relations with ecosystems functions. Sequential fractionationincluded: (1) organic solvent extraction, (2) transesterification with borontrifluoride in methanol (BF3-CH3OH), (3) methanolic alkaline hydrolysis(KOH-CH3OH), and (4) cleavage of ether and glycosidic bonds with HI.Structural identification of initial and final material, separated organo-solubleand hydrosoluble fractions, and subfractions was conducted by GC-MS,HPSEC-ESI-MS (high-resolution, Orbitrap), and solid- and liquid-stateNMR. GC-MS revealed in organosoluble unbound fractions the presence ofboth saturated and unsaturated, linear and branched, alkanoic, hydroxyalk-anoic and alkandioic acids, n-alkanes, and n-alkanols. These components decreased progressively in fractions obtained after weakand strong ester cleavage. Unsubstituted alkanoic acids with variable chain length were ubiquitously detected in all fractions, therebysuggesting their fundamental function in the architecture of humic suprastructures. An important role in differentiatingsupramolecular associations should also be attributed to substituted alkanoic acids that were detected in variable amounts indifferent fractions. The content of aromatic acids and steroids was only noticed in the latter fractions. HPSEC-ESI-MS of initialand final solid fractions showed similar compounds, as indicated by GC-MS, whereas the hydrosoluble fraction aftertransesterification revealed fewer of these compounds but noticeable nitrogen-containing acids. A large amount of “cyclic” acidswere identified by MS empirical formula in initial HA, and, to a lesser extent, in the final fractionation residue as well as in thehydrosoluble fraction. The predominant alkyl NMR signals in organosoluble extracts and those of CH-N,CH-O, andO-CH-Ogroups in hydrosoluble fraction confirmed mass spectrometry results. Homo- and heterocorrelated liquid-state NMR spectraindicated spin systems interactions varying with separated fractions. Solid-state and dipolar-dephasing NMR spectra of final residueshowed predominance of sp2 carbons, 66% of which were quaternary carbons, and a significant increase in conformational rigiditywith respect to initial HA. Separated fractions accounted for 60% of initial HA weight, and losses were attributed to hydration water,liberated volatile compounds, and decarboxylation. Quantization of analytes showed that the sum of compound classes in separatedfractions was greater than that for the initial HA, thereby showing that stepwise fractionation increased significantly the analyticalidentification of humic molecules. Our results suggest this “Humeomics” approach as a valid path for mapping humic molecularcomposition and assess humus origin and formation.

1188 dx.doi.org/10.1021/bm101488e |Biomacromolecules 2011, 12, 1187–1199
Biomacromolecules ARTICLE
A general consensus considers HSs as supramolecular associa-tions of heterogeneous and relatively small (<1000 Da) mole-cules, which are held together in only apparently large molecular-sizes by weak linkages, such as hydrogen and hydrophobicbonds.21 This novel concept suggests that humic molecularcomplexity may be reduced by progressively breaking the inter-and intramolecular interactions that stabilize the complex su-prastructures and single humic molecules be isolated. Theirstructural identification may then be achieved by combiningadvanced analytical techniques.
Here we propose a chemical fractionation for a stepwiseremoval of molecules from complex humic matrices and applica-tion of up-to-date analytical techniques to determine theirchemical structure. This approachmay be defined as “Humeomics”,an analogy to modern terms describing genes, transcripts,proteins, and metabolite mapping technologies. However,whereas biomolecules are synthesized in living cells from specificprecursors to serve defined cellular functions, HSs are formedfrom the entropy-driven decay of dead organic matter toencompass broader ecological and environmental functions.Nevertheless, the operational procedure of molecular separation,followed by characterization, is common to other “-omic”sciences. Humeomics may then be described as “a stepwiseseparation of molecules from humic suprastructures by progres-sively breaking intermolecular bonds and characterizing theirstructure by advanced analytical instrumentation”.
The humeomic fractionation adopted here begins with anorganic solvent extraction of free or unbound humic moleculesassociated with the humic suprastructure only by weak dispersiveinteractions,22-24 without breaking any covalent bond. Twosubsequent steps include cleavage of covalent bonds in weaklybound esters by a mild boron trifluoride-methanol (BF3-MeOH)transesterification and more strongly bound esters by an alkaline(KOH-MeOH) solvolysis. Biological polyesters in HS have been
characterized,25 and both methods were previously described tocleave esters in soils,26,27 plants,28 and humic matter.29,30 Humicmolecules released as a result of ester cleavage can be furtherfractionated by means of liquid/liquid or solid phase extraction(SPE). Finally, both strong ether25 and glycosidic31 bonds arecleaved by treatment with hydroiodic acid (HI) following aclassic mechanism of protonation of the organic ether andsubsequent nucleophilic substitution (SN) by iodide with analcohol acting as a good leaving group. Qualitative and quanti-tative investigations on humic molecules released during thisstepwise fractionation were conducted by either GC/MS or LC/MS, depending on their water solubility, whereas additionalstructural information was acquired by solid-state and liquid-state NMR spectroscopy.
’EXPERIMENTAL SECTION
HumicMatter. A humic acid (HA) was isolated from a volcanic soil(Allic Fulvudand) at Vico (near Rome (Italy)) and purified as describedelsewhere.32 This humic extract (RES0) was oven-dried overnight at40 �C before being submitted to sequential chemical fractionation(Figure 1). Elemental composition of humic samples was by a FisonsInstruments EA 1108 elemental analyzer. All reagents used here were bySigma-Aldrich 99.9% pure and used without further purification. Allmeasurements were carried out in triplicate.Sequential Chemical Fractionation. Unbound Fraction
(ORG1). Unbound humic molecules (ORG1) were extracted by stirringfor 24 h at room temperature 1.0 g RES0 in 500 mL of a 2:1 v/vdichloromethane (DCM) and methanol (MeOH) solution. The super-natant was separated by centrifugation (15min, 15 000 rpm) and filteredthrough a Whatman GFC (1.0 μm) filter. This procedure was repeatedfour times. The humic residue was air-dried before the next step.
Weakly Bound Ester Fractions (ORG2 and AQU2). The residue wassuspended in a Teflon tube overnight with 12% BF3-MeOH under a N2
Figure 1. Scheme of sequential chemical fractionation.
1189 dx.doi.org/10.1021/bm101488e |Biomacromolecules 2011, 12, 1187–1199
Biomacromolecules ARTICLE
atmosphere at 90 �C. A ratio of 0.075 mL of solution per milligram ofresidue was used. This transesterification was repeated three times, andthe supernatants were centrifuged (15 min, 7000 rpm) and combined.The residual BF3 was quenched with water, and the solution wasextracted three times with a total of 80 mL (50:50, v/v) of chloro-form/water mixture. The organic phase was separated (ORG2), driedwith anhydrous Na2SO4, filtered on a Whatman 41 filter, and rotoeva-porated. The aqueous phase (AQU2) was ultrafiltered over Amicon Cmembranes (1000 Da cutoff) against distilled water until it was chloride-free and freeze-dried. The remaining solid residue was water-washed andair-dried before the next step.Strongly Bound Ester Fractions (ORG3 and AQU3). The residue was
suspended with a ratio of 0.25 mL per mg of substance in 1 M KOH-MeOH solution and refluxed for 2 h at 70 �C under a N2 atmosphere.After cooling, the reaction mixture was centrifuged (10 min, 3000 rpm)and the supernatant was recovered. The residue was washed withMeOH(2� 10 mL) and DCM (2� 10 mL) and centrifuged. The supernatantswere combined, their pH adjusted to 2.0 with 37%HCl, and then liquid-liquid extracted three times with total of 100 mL (50:50, v/v) of DCM/water mixture. The organosoluble (ORG3) and hydrosoluble (AQU3)extracts were purified as for ORG2 and AQU2. The solid residue waswater-washed and air-dried before the next step.Strongly Bound Ether Fraction and Final Residue (ORG4 & RES4). A
suspension of 0.25 mL of 47% HI aqueous solution per milligram ofresidue was stirred for 48 h at 75 �C under a N2 atmosphere. Aftercooling, the reaction mixture was neutralized by a saturated NaHCO3
solution. The resulting I2 was neutralized with a saturated Na2S2O3
solution. After centrifugation (10 min, 3000 rpm) and filtration, theresidue was extracted with diethyl ether (3� 50mL). This organic phase(ORG4) was dried with anhydrous Na2SO4. The solid humic residue(RES4) was dialyzed (3500 Da cutoff) against water and freeze-dried.Separation by Solid Phase Extraction.We dissolved 1.0 to 2.0
mg of dry organosoluble fractions (ORG1-4) in 2:1 v/v DCM/isopropanol solution and loaded them on SPE aminopropyl cartridges(Phenomenex Strata NH2 500mg/3.0 mL) previously conditioned withhexane (4.0 mL). The column was eluted with a 2:1 v/v DCM/isopropanol (8.0 mL) solution to yield a neutral subfraction and thenwith 2% v/v acetic acid in diethylether (8.0 mL) to elute an acidicsubfraction.Gas Chromatography-Mass Spectrometry. Organosoluble
fractions (ORG1-4) were derivatized by refluxing ∼0.30 mg ofsample for 1 h at 70 �C with an excess of MeOH and acetyl chloride,dried under a stream of N2, followed by silylation with 100 μLof N,N-bis[trimethylsilyl]trifluoracetamide/1% trimethylchlorosilane(Superchrom) in closed vials at 60 �C for 30 min. GC/MS analyseswere conducted with a Perkin-Elmer Autosystem XL gas chromato-graph, equipped with a Perkin-Elmer turbomass gold mass spectro-meter. The injector was set at 250 �C, and a fused-silica capillary column(Restek Rtx-5MS, 30 m length � 0.25 mm I.D. � 0.25 μm filmthickness) was used under a helium flow rate of 1.6 mL min-1.The oven temperature increased from 100 to 300 �C at 4 �C min-1
and kept constant for 20 min. The mass spectrometer operated infull scan mode in the m/z 50-600 range, with EI energy of 70 eVand cycle time of 1.0 s. Compound identification was supported byNIST-MS library mass spectra. Quantitative measurements were ob-tained by an external calibration curve of known standards such asderivatized tridecanoic, ω-hydroxyhexadecanoic, docosandioic acids,and sitosterol.Liquid Chromatography-Mass Spectrometry (LC/MS).
RES0, AQU2, and RES4 samples were dissolved into LC vials at 0.4g/L using a 0.01 M NH3 solution and injected with a 50 μL Rheodyneloop in a HPSEC system connected to the LC/MS system. HPSECcomprised a Phenomenex Bio-Sep SEC-S 2000 column (300� 7.8mm)and precolumn (30� 7.8 mm), both thermostatted at 30 �C. A DionexP 580 pump ensured a 0.3 mL 3min-1 elution of a 55/45 A/B solution(A: 5 mM AcONH4 in Milli-Q water and 5% MeCN, pH 7; B: 100%MeCN) for a total of 70 min. Mass spectra were obtained with a LTQOrbitrap (Thermo Electron, Waltham, MA) and negative ESI, 100-1000m/zmass range, and 1.0 s scan time. N2 was the sheath gas (45 AU)and He was the collision gas (7.99 AU). Spray voltage was at 4.00 kV,spray current was at 2.05 μA, capillary temperature was 260 �C, andcapillary voltage was 14.93 V. Hexadecanoic acid (16 d-3) and 4-hydro-xybenzoic acid (ring 13C-6) (Cambridge Isotope Laboratories, 99%)were dissolved in a 0.01MNH3 solution and added as internal standardsfor quantitative evaluation.NMR Spectroscopy. Solid-state CPMAS-13C NMR (cross-
polarization magic angle spinning-13C nuclear magnetic resonance)spectra were acquired with a Bruker AV 300 instrument equipped with a4 mm wide bore MAS probe. Samples were fitted in 4 mm Zirconiarotors with Kel-F caps and spun at 13 000( 2 Hz. A recycle time of 1.0 sand an acquisition time of 20 ms were used, and 1510 points wereacquired for each spectrum. The scan number ranged between 500 and700. Variable spin lock (VSL) experiments were acquired with a 3 srecycle delay, 30 ms acquiring time, 2200 scans, and a VSL RAMPsequence with 1 ms contact time. An average spin lock frequency of 60MHz was applied during the ramped cross-polarization time. Spin lockwas varied in intervals from 0.01 to 7.50 ms in 21 increments. Dipolardephasing (DD) experiments were set with a 15 μs delay and 15 000scans. Data were processed with Mestre-C software 4.9.9.9, and all FIDspectra were transformed with 100 Hz line broadening exponential typefilter function and 2k zero filling.
Liquid-state NMR spectra were acquired with a Bruker AV 400instrument equipped with a 5 mm inverse broadband, z-gradient coil,actively shielded probe. About 5.0 mg of sample was placed in 5.0 mmquartz tubes and dissolved with 1:1 CD3OD/CDCl3 forORG1;DMSO-d6 for ORG2, AQU2, and ORG3; and D2O/NaOD for RES4. Mono-dimensional spectra were acquired with presaturation of water signal and1000 scans. Bidimensional spectra were set up as follows: COSYexperiments were multi quantum filter (MQF) magnitude type withpulse gradient, 60-88 scans, 256/2k data points set over F1/F2, and a2.0 s delay; TOCSY experiments were TPPI phase-sensitive type with amixing time of 80 ms, 112-128 scans, 128/2k data points set over F1/F2,
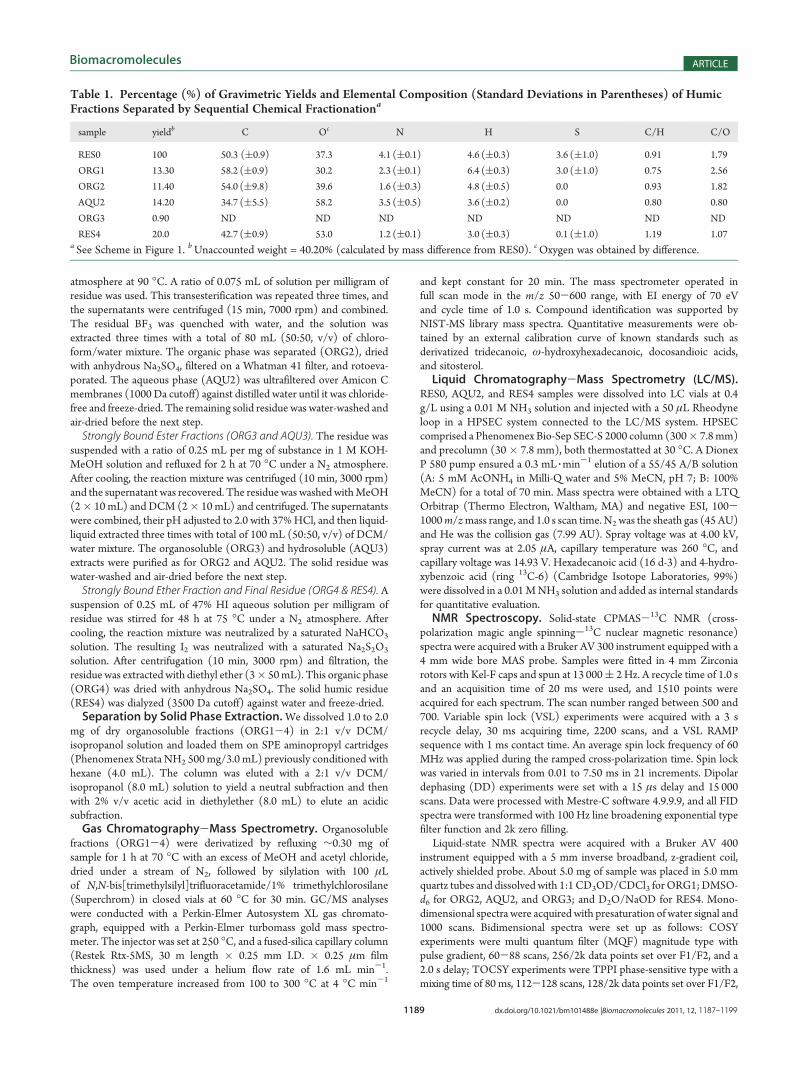
Table 1. Percentage (%) of Gravimetric Yields and Elemental Composition (Standard Deviations in Parentheses) of HumicFractions Separated by Sequential Chemical Fractionationa
sample yieldb C Oc N H S C/H C/O
RES0 100 50.3 ((0.9) 37.3 4.1 ((0.1) 4.6 ((0.3) 3.6 ((1.0) 0.91 1.79
ORG1 13.30 58.2 ((0.9) 30.2 2.3 ((0.1) 6.4 ((0.3) 3.0 ((1.0) 0.75 2.56
ORG2 11.40 54.0 ((9.8) 39.6 1.6 ((0.3) 4.8 ((0.5) 0.0 0.93 1.82
AQU2 14.20 34.7 ((5.5) 58.2 3.5 ((0.5) 3.6 ((0.2) 0.0 0.80 0.80
ORG3 0.90 ND ND ND ND ND ND ND
RES4 20.0 42.7 ((0.9) 53.0 1.2 ((0.1) 3.0 ((0.3) 0.1 ((1.0) 1.19 1.07a See Scheme in Figure 1. bUnaccounted weight = 40.20% (calculated by mass difference from RES0). cOxygen was obtained by difference.
1190 dx.doi.org/10.1021/bm101488e |Biomacromolecules 2011, 12, 1187–1199
Biomacromolecules ARTICLE
and a 2.0 s delay; HSQC experiments were TPPI phase-sensitive, echo-antiecho type with short-range coupling frequency set at 145 Hz, 128-256 scans, 256/2k data points set over F1/F2, and a 2.0 s delay; HMBC
experiments were low-pass magnitude J-filtered pulse gradient type witha long-range coupling frequency set at 5 Hz, 100-140 scans, 256/4kdata points set over F1/F2, and a 2.0 s delay.
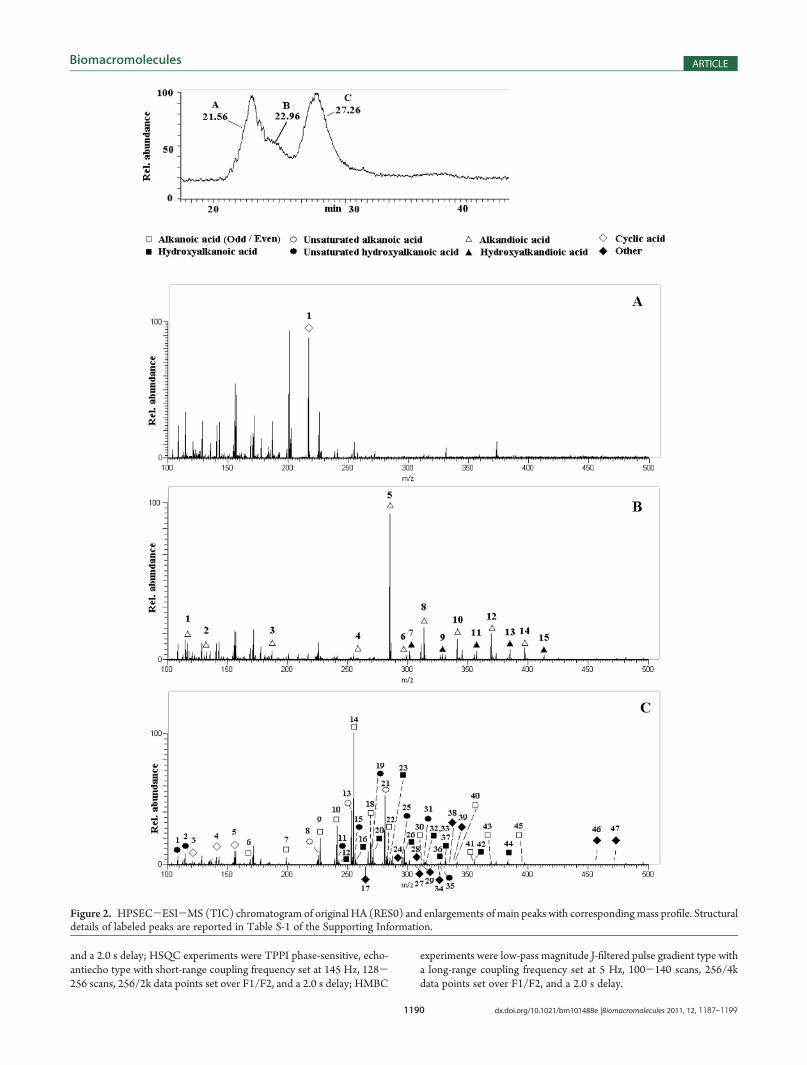
Figure 2. HPSEC-ESI-MS (TIC) chromatogram of original HA (RES0) and enlargements of main peaks with correspondingmass profile. Structuraldetails of labeled peaks are reported in Table S-1 of the Supporting Information.
1191 dx.doi.org/10.1021/bm101488e |Biomacromolecules 2011, 12, 1187–1199
Biomacromolecules ARTICLE
’RESULTS
The sequential fractionation of this HA yielded substantialamounts of ORG1, ORG2, ORG3, AQU2, and RES4 fractions,whereas AQU3 and ORG4 fractions yielded too small amountsfor meaningful instrumental analysis. Approximately 40% of theweight of fractionated material was unaccounted for (Table 1),perhaps because of losses of occluded hydration water33 or smallvolatile organic compounds and because of partial decarboxyla-tion induced by heating.Original Humic Acid (RES0). Elemental analysis of original
HA (RES0) was typical for a terrestrial HA (Table 1).34 The TICchromatogram by HPSEC-ESI-MS showed main signals at 22and 28 min and a first-peak shoulder at 23 min (Figure 2).Alkandioic, hydroxydioic, and a cyclic acid with empirical for-mula C7H6O8 mostly contributed to the shoulder (Figure 2B).Because of the high amount of unsaturation, the latter compoundshould include three carboxylic groups as substituents of a furanering to hypothesize a reasonably stable structure. Ring structureswere also implied for other compounds with similar formulas andunsaturation indexes. Alkanoic acids (saturated, unsaturated, andhydroxylated) were mainly responsible for the 28 min peak(Figure 2C), whereas other cyclic acids increased in peak tail(>30 min). Most masses in the first peak were not assignable toany meaningful formula (Figure 2A), possibly because of mo-lecular aggregation. Saturated linear alkanoic acids were the mostabundant linear compounds in RES0 (Table 2, Table S-1 of theSupporting Information) with ranges of C8-C30 for even-numbered acids and C15-C17 for odd-numbered acids, the latterbeing typical products of bacterial lipids degradation.35 Amongeven-numbered acids, C16 (>2 mg/gTOM) was present in thelargest amount, followed by C14 and C18 homologues, whereas
C8 was barely detectable. The C15 (0.78 mg/gTOM) and C17
(0.48 mg/gTOM) were the most abundant odd-numbered acids,whereas oleic acid (1.39 mg/gTOM) was the largest amongunsaturated alkanoic acids.Moreover, HPSEC-ESI-MS allowed detection of hydroxy-
lated C14-C24 acids, di- and trihydroxylated C18 acids, mono-unsaturated C14, C16, and C18 acids, hydroxy-unsaturated C6-C20 acids, C4-C24 dioic, C16-C24 hydroxy-dioic, cyclic acids,and several other unassigned acidic structures (Table S-1 of theSupporting Information). The most important hydroxy-satu-rated acids were: mono-OH-C16 (0.39 mg/gTOM), tri-OH-C18 (0.25 mg/gTOM), and mono-OH-C24 (0.24 mg/gTOM).Among hydroxy-unsaturated acids, the order of abundance wasC18 (0.42 mg/gTOM), C16, and C6 (Table S-1 of the SupportingInformation). As for saturated dioic acids (Table 2), C16 (1.2mg/gTOM) was the most abundant (Table S-1 of the SupportingInformation), whereas C24 (0.22 mg/gTOM) revealed the largestamount among hydroxy-diacids. Other negatively charged com-pounds were also detected, for which empirical formulas weredetermined, but no structure could be assigned. Among these,C18H26O4 (0.44 mg/gTOM) was the most important.The 13C-CPMAS-NMR spectrum (Figure 3B) of RES0
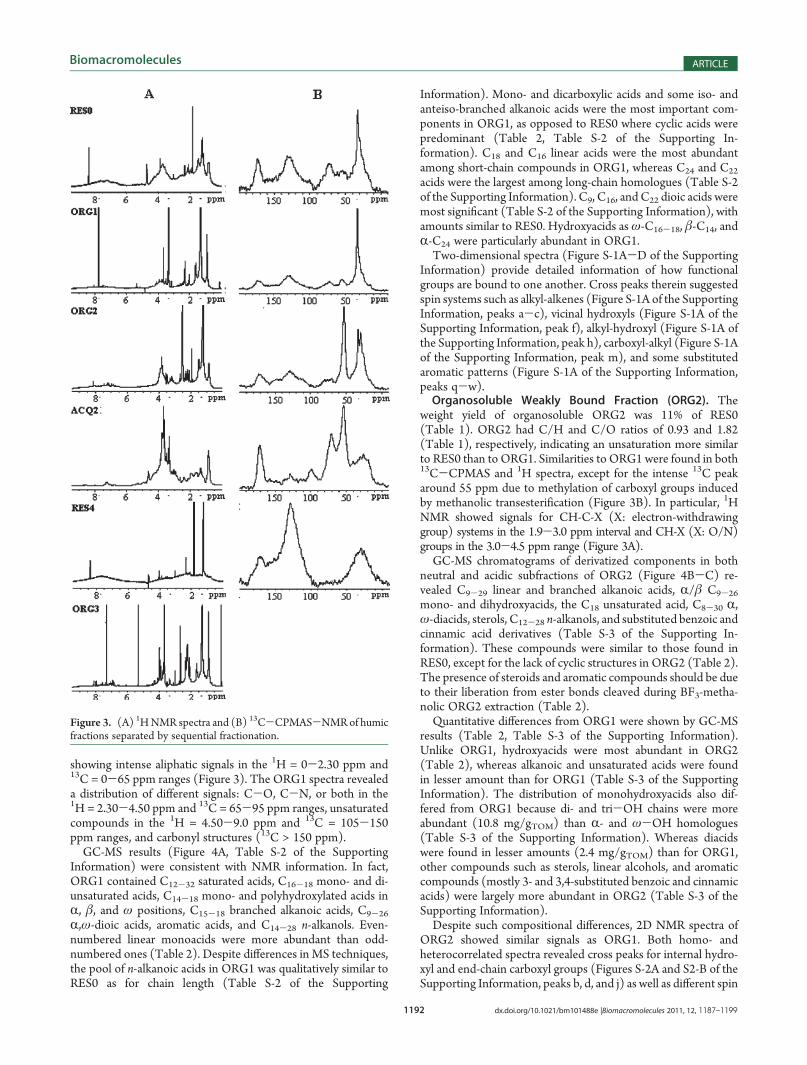
showed signals for carboxylic (175 ppm), sp2 aromatic/doublebond (110-150 ppm), C-O, C-N (65-105 ppm), and unsub-stituted alkyl (0-65 ppm) carbons. The large intensity of the latterNMR signal (Figure 3B) suggests that HPSEC-ESI-MS mayoverestimate cyclic over linear structures (Table 2).Unbound Fraction (ORG1). The weight yield of ORG1
accounted for 13% of RES0 with smaller C/H and larger C/Oratios than RES0, thus indicating a greater content of aliphaticand saturated components (Table 1). Both 13C-CPMAS-NMR and 1H NMR spectra confirmed a large alkyl content by
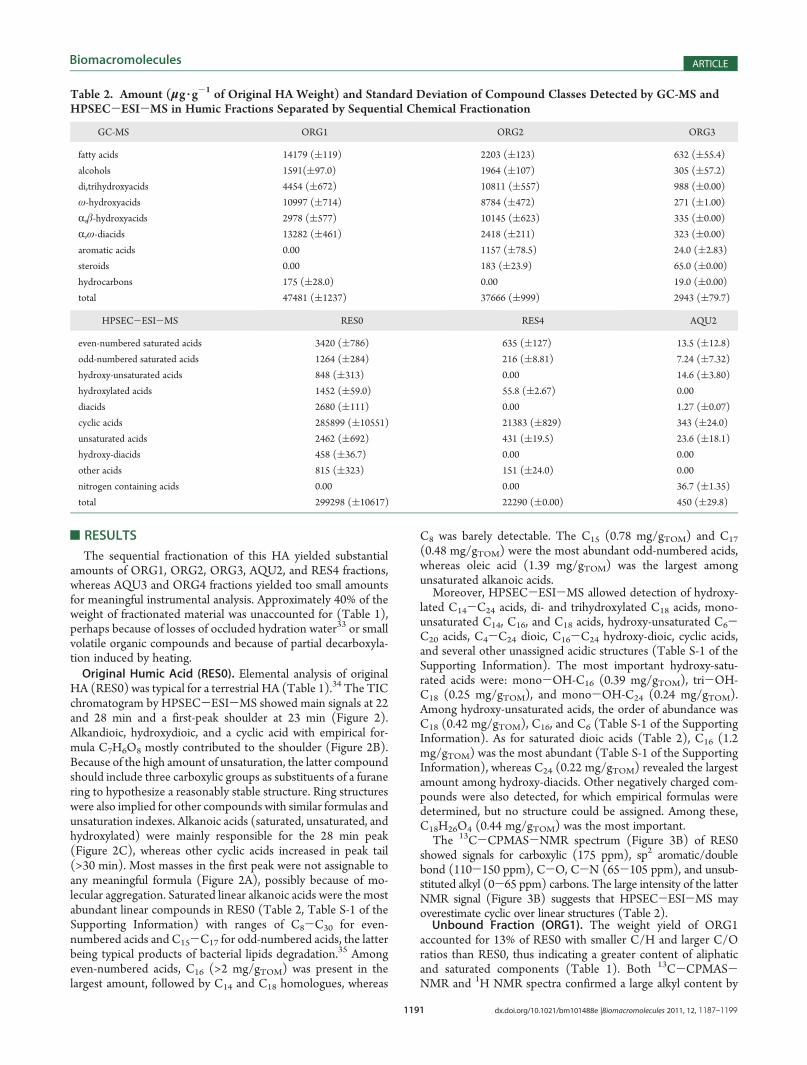
Table 2. Amount (μg 3 g-1 of Original HA Weight) and Standard Deviation of Compound Classes Detected by GC-MS and
HPSEC-ESI-MS in Humic Fractions Separated by Sequential Chemical Fractionation
GC-MS ORG1 ORG2 ORG3
fatty acids 14179 ((119) 2203 ((123) 632 ((55.4)
alcohols 1591((97.0) 1964 ((107) 305 ((57.2)
di,trihydroxyacids 4454 ((672) 10811 ((557) 988 ((0.00)
ω-hydroxyacids 10997 ((714) 8784 ((472) 271 ((1.00)
R,β-hydroxyacids 2978 ((577) 10145 ((623) 335 ((0.00)
R,ω-diacids 13282 ((461) 2418 ((211) 323 ((0.00)
aromatic acids 0.00 1157 ((78.5) 24.0 ((2.83)
steroids 0.00 183 ((23.9) 65.0 ((0.00)
hydrocarbons 175 ((28.0) 0.00 19.0 ((0.00)
total 47481 ((1237) 37666 ((999) 2943 ((79.7)
HPSEC-ESI-MS RES0 RES4 AQU2
even-numbered saturated acids 3420 ((786) 635 ((127) 13.5 ((12.8)
odd-numbered saturated acids 1264 ((284) 216 ((8.81) 7.24 ((7.32)
hydroxy-unsaturated acids 848 ((313) 0.00 14.6 ((3.80)
hydroxylated acids 1452 ((59.0) 55.8 ((2.67) 0.00
diacids 2680 ((111) 0.00 1.27 ((0.07)
cyclic acids 285899 ((10551) 21383 ((829) 343 ((24.0)
unsaturated acids 2462 ((692) 431 ((19.5) 23.6 ((18.1)
hydroxy-diacids 458 ((36.7) 0.00 0.00
other acids 815 ((323) 151 ((24.0) 0.00
nitrogen containing acids 0.00 0.00 36.7 ((1.35)
total 299298 ((10617) 22290 ((0.00) 450 ((29.8)
1192 dx.doi.org/10.1021/bm101488e |Biomacromolecules 2011, 12, 1187–1199
Biomacromolecules ARTICLE
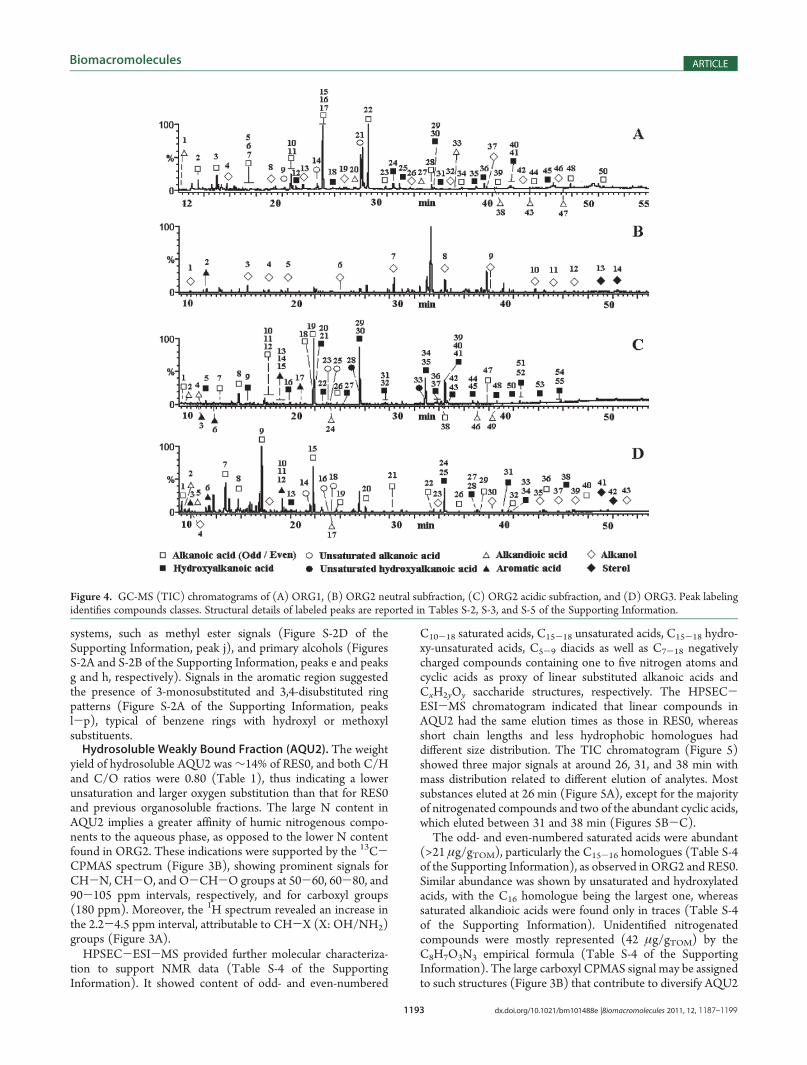
showing intense aliphatic signals in the 1H = 0-2.30 ppm and13C = 0-65 ppm ranges (Figure 3). The ORG1 spectra revealeda distribution of different signals: C-O, C-N, or both in the1H = 2.30-4.50 ppm and 13C = 65-95 ppm ranges, unsaturatedcompounds in the 1H = 4.50-9.0 ppm and 13C = 105-150ppm ranges, and carbonyl structures (13C > 150 ppm).GC-MS results (Figure 4A, Table S-2 of the Supporting
Information) were consistent with NMR information. In fact,ORG1 contained C12-32 saturated acids, C16-18 mono- and di-unsaturated acids, C14-18 mono- and polyhydroxylated acids inR, β, and ω positions, C15-18 branched alkanoic acids, C9-26
R,ω-dioic acids, aromatic acids, and C14-28 n-alkanols. Even-numbered linear monoacids were more abundant than odd-numbered ones (Table 2). Despite differences in MS techniques,the pool of n-alkanoic acids in ORG1 was qualitatively similar toRES0 as for chain length (Table S-2 of the Supporting
Information). Mono- and dicarboxylic acids and some iso- andanteiso-branched alkanoic acids were the most important com-ponents in ORG1, as opposed to RES0 where cyclic acids werepredominant (Table 2, Table S-2 of the Supporting In-formation). C18 and C16 linear acids were the most abundantamong short-chain compounds in ORG1, whereas C24 and C22
acids were the largest among long-chain homologues (Table S-2of the Supporting Information). C9, C16, and C22 dioic acids weremost significant (Table S-2 of the Supporting Information), withamounts similar to RES0. Hydroxyacids asω-C16-18, β-C14, andR-C24 were particularly abundant in ORG1.Two-dimensional spectra (Figure S-1A-D of the Supporting
Information) provide detailed information of how functionalgroups are bound to one another. Cross peaks therein suggestedspin systems such as alkyl-alkenes (Figure S-1A of the SupportingInformation, peaks a-c), vicinal hydroxyls (Figure S-1A of theSupporting Information, peak f), alkyl-hydroxyl (Figure S-1A ofthe Supporting Information, peak h), carboxyl-alkyl (Figure S-1Aof the Supporting Information, peak m), and some substitutedaromatic patterns (Figure S-1A of the Supporting Information,peaks q-w).Organosoluble Weakly Bound Fraction (ORG2). The
weight yield of organosoluble ORG2 was 11% of RES0(Table 1). ORG2 had C/H and C/O ratios of 0.93 and 1.82(Table 1), respectively, indicating an unsaturation more similarto RES0 than to ORG1. Similarities to ORG1 were found in both13C-CPMAS and 1H spectra, except for the intense 13C peakaround 55 ppm due to methylation of carboxyl groups inducedby methanolic transesterification (Figure 3B). In particular, 1HNMR showed signals for CH-C-X (X: electron-withdrawinggroup) systems in the 1.9-3.0 ppm interval and CH-X (X: O/N)groups in the 3.0-4.5 ppm range (Figure 3A).GC-MS chromatograms of derivatized components in both
neutral and acidic subfractions of ORG2 (Figure 4B-C) re-vealed C9-29 linear and branched alkanoic acids, R/β C9-26
mono- and dihydroxyacids, the C18 unsaturated acid, C8-30 R,ω-diacids, sterols, C12-28 n-alkanols, and substituted benzoic andcinnamic acid derivatives (Table S-3 of the Supporting In-formation). These compounds were similar to those found inRES0, except for the lack of cyclic structures in ORG2 (Table 2).The presence of steroids and aromatic compounds should be dueto their liberation from ester bonds cleaved during BF3-metha-nolic ORG2 extraction (Table 2).Quantitative differences from ORG1 were shown by GC-MS
results (Table 2, Table S-3 of the Supporting Information).Unlike ORG1, hydroxyacids were most abundant in ORG2(Table 2), whereas alkanoic and unsaturated acids were foundin lesser amount than for ORG1 (Table S-3 of the SupportingInformation). The distribution of monohydroxyacids also dif-fered from ORG1 because di- and tri-OH chains were moreabundant (10.8 mg/gTOM) than R- and ω-OH homologues(Table S-3 of the Supporting Information). Whereas diacidswere found in lesser amounts (2.4 mg/gTOM) than for ORG1,other compounds such as sterols, linear alcohols, and aromaticcompounds (mostly 3- and 3,4-substituted benzoic and cinnamicacids) were largely more abundant in ORG2 (Table S-3 of theSupporting Information).Despite such compositional differences, 2D NMR spectra of
ORG2 showed similar signals as ORG1. Both homo- andheterocorrelated spectra revealed cross peaks for internal hydro-xyl and end-chain carboxyl groups (Figures S-2A and S2-B of theSupporting Information, peaks b, d, and j) as well as different spin
Figure 3. (A) 1HNMR spectra and (B) 13C-CPMAS-NMRof humicfractions separated by sequential fractionation.
1193 dx.doi.org/10.1021/bm101488e |Biomacromolecules 2011, 12, 1187–1199
Biomacromolecules ARTICLE
systems, such as methyl ester signals (Figure S-2D of theSupporting Information, peak j), and primary alcohols (FiguresS-2A and S-2B of the Supporting Information, peaks e and peaksg and h, respectively). Signals in the aromatic region suggestedthe presence of 3-monosubstituted and 3,4-disubstituted ringpatterns (Figure S-2A of the Supporting Information, peaksl-p), typical of benzene rings with hydroxyl or methoxylsubstituents.Hydrosoluble Weakly Bound Fraction (AQU2). The weight
yield of hydrosoluble AQU2 was∼14% of RES0, and both C/Hand C/O ratios were 0.80 (Table 1), thus indicating a lowerunsaturation and larger oxygen substitution than that for RES0and previous organosoluble fractions. The large N content inAQU2 implies a greater affinity of humic nitrogenous compo-nents to the aqueous phase, as opposed to the lower N contentfound in ORG2. These indications were supported by the 13C-CPMAS spectrum (Figure 3B), showing prominent signals forCH-N, CH-O, and O-CH-O groups at 50-60, 60-80, and90-105 ppm intervals, respectively, and for carboxyl groups(180 ppm). Moreover, the 1H spectrum revealed an increase inthe 2.2-4.5 ppm interval, attributable to CH-X (X: OH/NH2)groups (Figure 3A).HPSEC-ESI-MS provided further molecular characteriza-
tion to support NMR data (Table S-4 of the SupportingInformation). It showed content of odd- and even-numbered
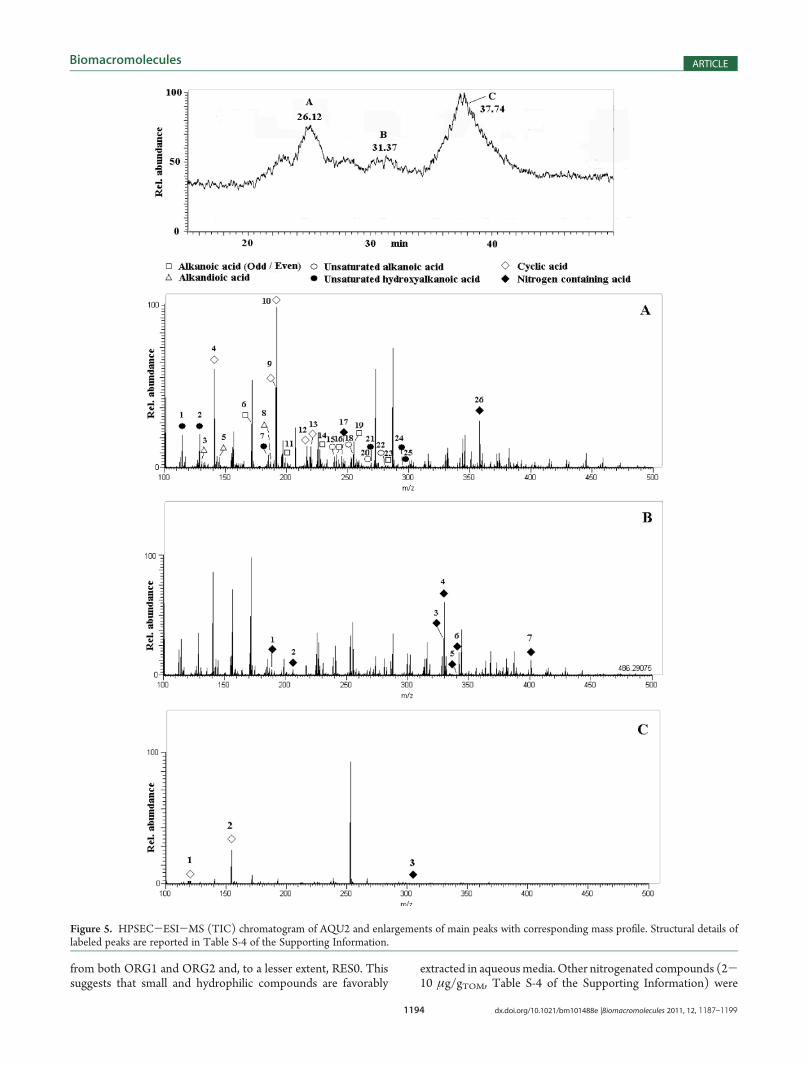
C10-18 saturated acids, C15-18 unsaturated acids, C15-18 hydro-xy-unsaturated acids, C5-9 diacids as well as C7-18 negativelycharged compounds containing one to five nitrogen atoms andcyclic acids as proxy of linear substituted alkanoic acids andCxH2yOy saccharide structures, respectively. The HPSEC-ESI-MS chromatogram indicated that linear compounds inAQU2 had the same elution times as those in RES0, whereasshort chain lengths and less hydrophobic homologues haddifferent size distribution. The TIC chromatogram (Figure 5)showed three major signals at around 26, 31, and 38 min withmass distribution related to different elution of analytes. Mostsubstances eluted at 26 min (Figure 5A), except for the majorityof nitrogenated compounds and two of the abundant cyclic acids,which eluted between 31 and 38 min (Figures 5B-C).The odd- and even-numbered saturated acids were abundant
(>21 μg/gTOM), particularly the C15-16 homologues (Table S-4of the Supporting Information), as observed in ORG2 and RES0.Similar abundance was shown by unsaturated and hydroxylatedacids, with the C16 homologue being the largest one, whereassaturated alkandioic acids were found only in traces (Table S-4of the Supporting Information). Unidentified nitrogenatedcompounds were mostly represented (42 μg/gTOM) by theC8H7O3N3 empirical formula (Table S-4 of the SupportingInformation). The large carboxyl CPMAS signal may be assignedto such structures (Figure 3B) that contribute to diversify AQU2
Figure 4. GC-MS (TIC) chromatograms of (A) ORG1, (B) ORG2 neutral subfraction, (C) ORG2 acidic subfraction, and (D) ORG3. Peak labelingidentifies compounds classes. Structural details of labeled peaks are reported in Tables S-2, S-3, and S-5 of the Supporting Information.
1194 dx.doi.org/10.1021/bm101488e |Biomacromolecules 2011, 12, 1187–1199
Biomacromolecules ARTICLE
from both ORG1 and ORG2 and, to a lesser extent, RES0. Thissuggests that small and hydrophilic compounds are favorably
extracted in aqueousmedia. Other nitrogenated compounds (2-10 μg/gTOM, Table S-4 of the Supporting Information) were
Figure 5. HPSEC-ESI-MS (TIC) chromatogram of AQU2 and enlargements of main peaks with corresponding mass profile. Structural details oflabeled peaks are reported in Table S-4 of the Supporting Information.

1195 dx.doi.org/10.1021/bm101488e |Biomacromolecules 2011, 12, 1187–1199
Biomacromolecules ARTICLE
identified by the MS-Orbitrap software with most probableempirical formulas: C16H29O6N3, C10H29O7N5, C7H13O6N,and C12H33O6N5. These compounds are likely to be responsiblefor the multiplicity of CH-OH proton signals in the 1H NMRspectrum of AQU2 (Figure 3A). Although unambiguous assign-ment of these structures was not possible, they largely character-ized AQU2 because all other fractions showed poor evidence of
aminoglycosides. However, the sensitivity of LC-MS was limited,probably because of less ionizable weakly acidic hydroxyl groupsprevailing over more acidic carboxyl groups.The 2D COSY spectrum indicated correlations for CH-CH
spin system (Figure S-3A of the Supporting Information, peak g),whereas TOCSY also showed long-range CHX-CHX (FigureS-3B of the Supporting Information, peaks d-f) and CH-CHX
Figure 6. HPSEC-ESI-MS (TIC) chromatogram of RES4 and enlargements of main peaks with corresponding mass profile. Structural details oflabeled peaks are reported in Table S-7 of the Supporting Information.

1196 dx.doi.org/10.1021/bm101488e |Biomacromolecules 2011, 12, 1187–1199
Biomacromolecules ARTICLE
(Figure S-3B of the Supporting Information, peaks a-c) inter-actions, probably belonging to alkyl structures bearing hydroxylor amino groups (Figure S-3B of the Supporting Information).The same TOCSY regions in ORG1 (Figure S-1B of theSupporting Information) were scarcely populated, thereby sug-gesting isolated hydroxylic moieties, as opposed to possibleglycosidic or polyolic structures in AQU2. Aromatic COSY(Figure S-3A of the Supporting Information, peak i) and TOCSY(Figure S-3B of the Supporting Information, peaks o-q) corre-lations in AQU2 appeared in more deshielded intervals thanthose for ORG2 (Figures S-2A and S-2B of the SupportingInformation, peaks l-q and peaks s-v, respectively), and theirlarger chemical shift values (8.5 to 8.7 ppm) suggest that theypossibly derive from double-condensed rings. No evidence ofthese structures was found by LC-MS, possibly because of lack ofionizable groups.Organosoluble Strongly Bound Fraction (ORG3). ORG3
gave a weight yield of only 0.9% of RES0 (Table 2) and had athick glue-like consistency that prevented meaningful elementalanalysis. The 1H NMR spectrum (Figure 3A) showed largealiphatic (0-2.30 ppm) and CH-X (X: O/N, 2.30-4.50 ppm)signals due to hydroxylated acids. Contrary to ORG1 or ORG2spectra, a number of low intensity signals for unsubstituted sp2
systems (4.50-9.0 ppm) were visible for ORG3, possiblyresponsible for the observed deliquescence.These indications were supported by GC-MS (Figure 4D),
which revealed the presence in ORG3 of C9-32 saturated andunsaturated n-alkanoic acids, C6-8 R,ω-diacids, C16,22,24 ω-monohydroxyacids, C22-C26 β-monohydroxyacids, C18 di-and trihydroxyacids, C12-28 n-alkanols, phenolic acids, andsteroids (Table S-5 of the Supporting Information). The mostabundant saturated acid was C16, whereas C18:1 was the largestamong unsaturated acids, thus showing consistency with 1HNMR observations. The great degree of hydroxylation in ORG3was conferred by the abundant poli-hydroxylated C18 andmonohydroxylated C16 acids. Also, diacids and n-alkanolsshowed quantitative importance, although less than that forORG1 or ORG2, the largest amount being measured for C16
(302 μg/gTOM) and C22 (11.8 μg/gTOM) homologues, respec-tively (Table S-5 of the Supporting Information).Two-dimensional NMR spectra of ORG3 suggested spin
systems (Figure S-4-D of the Supporting Information) similarto those of ORG1 and ORG2. Homocorrelated COSY andTOCSY spectra showed many cross peaks in the aromatic(Figure S-4A and S-4B of the Supporting Information, peaksm-r and peaks h and i, respectively) and CH-X (Figure S-4A ofthe Supporting Information, peaks b, f, i, h) regions, which wereconfirmed by heterocorrelated HSQC spectra (Figure S-4C ofthe Supporting Information, peaks t-z; peaks o-s). A smalleramount of compounds for all classes was found in ORG3 than inORG1 and ORG2 (Table 2), thus indicating that previoustransesterification had already broken most of the existingester bonds.Solid Residue after Ethers Cleavage (RES4). The residue
after cleavage of ether bonds accounted for 20% of RES0 weightand provided a C/H and C/O ratio of 1.19 and 1.07, respectively,as an indication of larger unsaturation and oxidation than that forRES0 (Table 1). As compared with RES0 and intermediatefractions, RES4 was depleted of linear structures and completelydeprived of alkandioic acids (Table 2).This was confirmed by VSL NMR experiments (Table S-6 of
the Supporting Information), which provided proton relaxation
times in the solid state (T1FH) as indicators of molecularrigidity.36 The T1FH values were larger for RES4 than forRES0 in all spectral regions and especially for sp2 carbons(95-150 ppm), thereby indicating a poorer molecular flexibilityand tighter packing for the final RES4 residue. 13C-CPMAS-NMR and DD (Figure S-5 of the Supporting Information)spectra were used, respectively, to characterize total and qua-ternary carbons, In fact, a large content of sp2 carbons in 13C-CPMAS-NMR resonated at 95-150 ppm (Figure 3B), but only66% of which were also found in DD spectra and hence identifiedas quaternary carbons (Figure S-5 of the Supporting In-formation). This suggests either totally substituted or condensedaromatic carbons in RES4. Also, the 1H solution spectrum ofRES4 (Figure 3A) indicated a broad band for sp2 signals (5.5-9.00 ppm), thereby supporting the unsaturated/oxidized natureof RES4.
13C-CPMAS and 1H NMR spectra of RES4 (Figure 3)showed other compounds with carbonyl (150-185 ppm) andaliphatic (15-40 ppm) C and aliphatic H (0.5-2.2 ppm)signals, respectively. These findings were supported by theTIC chromatogram of HPSEC-ESI-MS for RES4(Figure 6). Its two main peaks contained masses correspond-ing to odd- and even-numbered C10-18 saturated acids, C14-
18 unsaturated acids, C6,8 hydroxy-unsaturated acids, cyclicacids, and other C15-17 unidentified acidic structures com-prising four to six oxygen atoms, which were by far the mostabundant components (Table S-7 of the Supporting Infor-mation). Except for four compounds, most masses in the firstTIC peak were not attributable to known chemical structures(Figure 6A), whereas most recognizable structures werecomprised in the second TIC signal (Figure 6B). Moreover,three cyclic acids were eluted later in the chromatogram (>40min).RES4 large insaturation suggests that some of these unidenti-
fied acidic compounds must be cyclic to remain chemically stable(Table S-7 of the Supporting Information). Other unidentifiedstructures, probably linear because their empirical formularesembled that of n-alkanoic acids, were also detected in con-siderable amount (Table S-7 of the Supporting Information).These polar substances were also found in RES0 but not inAQU2 and must hence be bound tightly enough to humicmatrices to resist previous extractions.The 2D-COSY spectra showed correlations between CH-X
hydroxyalkyl and C-H alkyl protons (Figure S-6A of theSupporting Information, peaks j and l), the latter presumablyattributable to methyl groups. This correlation may be assignedto CH3-CHOH-R structures, which were not observed inother extracts. Cross peaks for vicinal hydroxyl protons (FigureS-6A of the Supporting Information, peak k) and in the aromaticregion (Figure S-6A of the Supporting Information, peaks m andn) may be attributed to 4-hydroxyl substituted rings. The doublepeaks may be explained with the concomitant presence ofphenate and phenol forms at the alkaline pH used for NMRanalysis (Figure S-6 of the Supporting Information). The hetero-correlated HSQC spectrum showed few signals, mainly due toalkyl groups in fatty acids (Figure S-6C of the SupportingInformation, peaks g-k). The high-field chemical shift for both1H and 13C nuclei of these signals indicates the proximity ofelectron-withdrawing nuclei such as oxygen, thereby suggestingprobable assignment to methylenes adjacent to multihydroxy-lated structures.
1197 dx.doi.org/10.1021/bm101488e |Biomacromolecules 2011, 12, 1187–1199
Biomacromolecules ARTICLE
’DISCUSSION
The “Humeomics” approach adopted here involved a mildchemical fractionation to separate humic molecules from theircomplex suprastructure and identification of their molecularstructure by advanced analytical techniques. Humic moleculessolvated in organic solvents in each fractionation step (ORG1-3) were further simplified by an SPE separation and thenstructurally analyzed by GC-MS after derivatization (Tables S-2,S-3, and S-5 of the Supporting Information). Conversely, humicmolecules separated in aqueous phases (AQU2) and humicconstituents in the original (RES0) and final (RES4) solid humicmaterials were characterized by ESI-MS following a HPSECseparation (Tables S-1, S-4, and S-7 of the Supporting In-formation). The high-resolution Orbitrap-MS detection pro-vided reliable empirical formulas for HPSEC-separatedanalytes. For most of linear acids, this was sufficient to identifytheir structures, with the exception of structural isomerism.
Because of appropriate standards calibration, a quantitativecomparison was possible between ORG fractions (measured byGC-MS) and AQU and RES (measured by LC-MS) materials(Table 2). Although the gravimetric yields of separated fractionsindicated a partial weight loss as compared with RES0 (Table 1),the sum of compounds identified by GC-MS in all fractions waslarger than that for bulk HA (RES0) (Table 2). This may behardly attributed to molecular change introduced by derivatiza-tion because it similarly affected GC-MS detectability of calibra-tion standards used to quantify unknown fractionationcompounds. Therefore, our mild fractionation was successfulnot only in preserving the structural features of progressivelyremoved humic molecules but also in enhancing their structuralidentification as specific compounds classes.
Both NMR and MS investigation showed that saturated andunsaturated n-alkanoic acids were largely present in all fractions(Table 2; Tables S-1-S-5 and S-7 of the Supporting In-formation). Being abundant in living cells and capable of forminghydrophobic associations during cell decay, they become aconsiderable part of humified suprastructures.37-40 Moreover,their presence in all separated fractions underlines their role informing and stabilizing humic supramolecular associations.Whereas part of saturated acid is loosely bound in the humicmatrix, as shown by their qualitative similarity in both RES0 andORG1, most n-alkanoic acids are involved in ester bonds andseparated only after hydrolysis steps (ORG2-3 and AQU2).Unsaturated alkanoic acids were also recovered in hydrosolubleAQU2 to an extent greater than their limited water solubilitywould allow, suggesting that aggregation with hydrophilic sub-stances increased their repartition in aqueous media. However, alarge portion of unsaturated acids was found in final RES4 residue(Table 2). Whereas RES4 molecular rigidity was generally largerthan that of RES0, the T1FHvalues of aliphatic sp3 were similar tothose of sp2 carbons (Table S-6 of the Supporting Information).This indicates that flexible unsaturated acids were still keptincorporated in the tight RES4 residue, possibly with a bridgingrole between compact sp2 carbons. Alternatively, new insatura-tion may be formed from dehydration of hydroxyl groups as aresult of HI treatment.
Hydroxylated acids and n-alkanols originate from decay ofplant biopolyesters such as cutin28 and suberin or from bacterialmetabolism.29 Various amounts of these classes were found in allseparated humic fractions (Tables S-1-S-5 and S-7 of theSupporting Information). Besides characterization by MS
techniques, 2D NMR showed how hydroxyl groups were boundto carbon chains (Figures S-1-S-4 and S-6 of the SupportingInformation), thereby indicating their molecular architectures.The largest abundance of hydroxy compounds was found inORG1 and ORG2, whereas di- and trihydroxy substituted acidswere prominent in both ORG2 and ORG3 fractions (Table 2).The latter compounds were thus more involved in multiple esterbonds and had a greater role in stabilizing humic suprastructures.In fact, the sterical hindrance conferred by di- and trihydroxy-lated components to humic associations through cross-linkingwith multihydroxylated linear acids required the smaller alkalinenucleophile (KOH) to release them in ORG3. The abundance ofmultifunctional hydroxyacids might also explain the reportednonsolid consistency of ORG3. These observations rank thiscompounds abundance in the order: unbound > linear esters >cross-linked esters.
Alkandioic acids are produced from either ω-oxidationof hydroxy acids or direct decay of plant material.28,41-43 BothGC-MS and LC-MS detected these compounds, thereby show-ing that the “Humeomics” approach enhanced understanding ofthe structural role of diacids. In fact, the HPSEC-ESI-MSchromatogram of RES0 (Figure 2) and its mass analysis (TableS-1 of the Supporting Information) showed that dioic acidseluted earlier (Figure 2B) than monocarboxyl homologues(Figure 2C). This suggests a correlation between diacid contentand hydrodynamic radius of humic associations because thediacids dipolar nature allowed different interactions with extract-ing solutions from that of monoacids. Moreover, quantitativeresults (Table 2) indicated that diacids were extensively isolatedas unbound material in ORG1, whereas a lesser amount wascleaved from esters and was absent in the final RES4 residue(Table 2). In fact, HPSEC-ESI-MS showed that the shouldercorresponding to dioic acids in RES0 (Figure 2) disappeared inRES4 (Figure 6). These findings suggest that alkandioic acidshave a less relevant role in stabilizing humic superstructures thantheir monoalkanoic acid equivalents. An explanation may resideon the diacids polar terminals that prevent their stable associationwith other apolar alkyl chains in humic matrices. Their greaterhydrophilicity may also justify the traces of hydroxylated diacidsfound in AQU2 (Table 2). It is noticeable that a partialapplication of this fractionation procedure on a compost HAshowed a more abundant content of dioic acids and alkanols inORG 340 than for this soil HA, The difference in molecularcontent observed between the two HA suggests that the humeo-mic fractionation proposed here enables distinction amonghumic matters of different origin and formation.
Polyhydroxylated compounds such as carbohydrates, aminosugars, or their derivatives are commonly associated with humicmatter.44 The decay of plant cellulose or fungal chitin may yieldthese hydrophilic substances, which become protected fromfurther biodegradation in humic hydrophobic domains.45 Thehigh hygroscopicity of hydrosoluble AQU2 was probably due tolarge content of these substances. In fact, solution-state NMRspectra for AQU2 revealed densely populated signals in spectralregions attributed to hydroxyalkyl and aminoalkyl residues(Figure S-3C of the Supporting Information, peaks a-h).Although polyhydroxylated species in AQU2 could not bestructurally identified by LC-MS because of poor sensitivity ofESI sources for non acidic structures, empirical formulas inferredtheir presence as nitrogen-containing compounds (Table S-4 ofthe Supporting Information). However, they were detected indifferent TIC regions (Figure 5A-C), thereby indicating
1198 dx.doi.org/10.1021/bm101488e |Biomacromolecules 2011, 12, 1187–1199
Biomacromolecules ARTICLE
association of nitrogenated polyhydroxylated structures withother compounds and different aggregation dynamics. Becauseempirical formulas are consistent with aminoglycosidic ratherthan heteroaromatic nitrogen (Table S-4 of the SupportingInformation), “Humeomics” show potential to contribute tocharacterize unknown humic nitrogen and solve a highly con-troversial aspect in humic chemistry.46
Aromatic structures are found in HS.27 They were mainlydetected in ORG2 and ORG3 fractions by GC-MS (Table 2),whereas other non aromatic cyclic structures were shown inRES0, RES4, and AQU2 by LC-MS (Tables S-1, S-4, and S-7 ofthe Supporting Information). Empirical formulas of latter com-pounds showed large C/H and small C/O ratios, therebyimplying multiple unsaturations and few unexchangeable pro-tons. The HPSEC distribution of non aromatic cyclic structures(Figures 2, 5, 6) differed from that of linear compounds, therebyimplying a mechanism for specific supramolecular associationsrather than their random inclusion in macromolecular network.Because these compounds, to our knowledge, had not beenpreviously reported in literature, our “humeomic” approachappears to be versatile enough to reveal both aromatic and nonaromatic structures. Nevertheless, an unambiguous characteriza-tion of non aromatic substances would require extensive use ofMS-MS analysis, which is beyond the scope of this work.
It is interesting to note that whereas the 13C-CPMASspectrum of RES4 (Figure 3B) showed a considerable signalaround 130 ppm and the DD spectrum (Figure S-5 of theSupporting Information) revealed that∼66% of such sp2 carbonpool is quaternary, the corresponding sp2-rich structures werenot detected by either mass spectrometry or solution 1H NMR.This suggests the presence of either π-π stacked fullysubstituted7 or highly condensed aromatic structures in residualRES4.47
Few linear hydrocarbons and steroids as a result of breakdownof plant roots cells28,48 were easily detected by GC-MS inorganosoluble fractions (Table 2). Hydrocarbons were foundmainly in ORG1 as unbound species, whereas steroids appearedin ORG2 and ORG3, indicating that they were tightly bound tothe humic matrix and liberated only after ester hydrolyses(Table 2). The hydrophobicity of these classes well integratewith n-alkanoic acids in strongly associated humic suprastruc-tures, which are further stabilized when these compounds are inester forms.
’CONCLUSIONS
This “humeomic” approach promises to reach an exhaustivemolecular characterization of HA and natural organic matter(NOM) in general. “Humeomic” is nondestructive of carbon-carbon bonds but isolates humic molecules with intact carbonstructure, which bind to humic matrix only by weak dispersiveforces or ester and ether linkages. The progressive separation ofundisturbed single humic components allows their structuralidentification by modern chromatographic and physical-chemi-cal techniques, thereby advancing knowledge on humus molec-ular characteristics as related to its origin and formation. Thisstepwise “Humeomics” may be generally applied to all kinds ofNOM and, because of its systematic reproducibility, may lead todevelop real models of humic conformational architecture. Anadvanced structural and stereochemical comprehension of humicsuprastructures is required to relate their molecular structure tobiological activities and functions in environmental ecosystems.
’ASSOCIATED CONTENT
bS Supporting Information. Chromatographic data andspectral images. This material is available free of charge via theInternet at http://pubs.acs.org.
’AUTHOR INFORMATION
Corresponding Author*Phone: þ39 081 253 91 60. Fax: þ39 081 253 91 86. E-mail:[email protected].
’ACKNOWLEDGMENT
A.N. gratefully acknowledges the use of the ESI-MS-Orbitrapat the Institut f€ur Umweltforschung, Universit€at Dortmund,Germany.
’REFERENCES
(1) Piccolo, A. Humus and Soil Conservation. InHumic Substances inTerrestrial Ecosystems; Piccolo, A., Ed.; Elsevier: Amsterdam, TheNetherlands, 1996; pp 225-264.
(2) Moliszweska, E.; Pisarek, I. Environ. Int. 1996, 22, 579–584.(3) Zhou, J. L.; Rowland, S. J. Water Res. 1997, 31, 1708–1718.(4) Spaccini, R.; Piccolo, A.; Conte, P.; Haberhauer, G.; Gerzabek,
M. H. Soil Biol. Biochem. 2002, 34, 1839–1851.(5) Nardi, S.; Pizzeghello, D.; Muscolo, A.; Vianello, A. Soil Biol.
Biochem. 2002, 34, 1527–1536.(6) Hautala, K.; Peuravuori, J.; Pihlaja, K. Chemosphere. 1997,
35, 809–817.(7) Jiahai, M. A.; Del Vecchio, R.; Golanoski, K.; Boyle, E.; Blough,
A. Environ. Sci. Technol. 2010, 44, 5395–5402.(8) Simpson, A. Soil Sci. 2001, 166, 795–809.(9) Peuravuori, J. Environ. Sci. Technol. 2005, 39, 5541–5549.(10) Smejkalova, D.; Piccolo, A. Environ. Sci. Technol. 2008,
42, 699–706.(11) �Smejkalov�a, D.; Spaccini, R; Piccolo, A. Eur. J. Soil Sci. 2008,
59, 496–504.(12) Piccolo, A.; Conte, P.; Trivellone, E.; Van Lagen, B.; Buurman,
P. Environ. Sci. Technol. 2002, 36, 76–84.(13) Martín, F.; del Rio, J. C.; Gonzalez-Vila, F. J.; Verdejo, T. J. Anal.
Appl. Pyrolysis 1995, 31, 75–83.(14) Lehtonen, T.; Peuravuori, J.; Pihlaja, K. Anal. Chim. Acta 2004,
511, 349–356.(15) Lehtonen, T.; Peuravuori, J.; Pihlaja, K. J. Anal. Appl. Pyrolysis
2003, 68-69, 315–329.(16) Marshall, A. G.; Hendrickson, C. L.; Jackson, G. S. Mass
Spectrom. Rev. 1998, 17, 1–35.(17) Piccolo, A.; Spiteller, M. Anal. Bioanal. Chem. 2003,
377, 1047–1059.(18) Hu, Q.; Noll, R. J.; Li, H.; Makarov, A.; Hardman, M.; Cooks,
R. G. J. Mass Spectrom. 2005, 40, 430–443.(19) Kujawinski, E. B.; Hatcher, P. G.; Freitas, M. A. Anal. Chem.
2002, 74, 413–419.(20) Peuravuori, J.; Monteiro, A.; Eglite, L.; Pihlaja, K.Talanta 2005,
65, 408–422.(21) Piccolo, A. Adv. Agron. 2002, 75, 57–134.(22) Bull, I. D.; Nott, C. J.; van Bergen, P. F.; Poulson, P. R.;
Evershed, R. P. Soil Biol. Biochem. 2000, 32, 1367–1376.(23) Naafs, D. F.W.; van Bergen, P. F.; Boogert, S. J.; de Leeuw, J.W.
Soil Biol. Biochem. 2004, 36, 297–308.(24) Guignard, L.; Lem�ee, L.; Ambl�es, A. Org. Geochem. 2005,
36, 287–297.(25) Grasset, L.; Ambl�es, A. J. Anal. Appl. Pyrolysis 1998, 47, 1–12.(26) Naafs, D. F. W.; van Bergen, P. F. Org. Geochem. 2002,
33, 189–199.
1199 dx.doi.org/10.1021/bm101488e |Biomacromolecules 2011, 12, 1187–1199
Biomacromolecules ARTICLE
(27) Nierop, K. G. J.; Naafs, D. F.W.; Verstraten, J. M.Org. Geochem.2003, 34, 719–729.(28) Kolattukudy, P. E. Science 1980, 208, 990–1000.(29) Almendros, G.; Sanz, J. Sci. Total Environ. 1989, 81/82, 51–60.(30) Fiorentino, G.; Spaccini, R.; Piccolo, A. Talanta 2006,
68, 1135–1142.(31) Almendros, G.; Guadalix, M. E.; Gonz�alez-Vila, F. J.; Martn, F.
Soil Biol. Biochem. 1998, 30, 755–765.(32) Nebbioso, A.; Piccolo, A. Environ. Sci. Technol. 2009, 43,
2417–2424.(33) Schaumann, G. E.; Bertmer, M. Eur. J. Soil Sci. 2008, 59,
423–429.(34) Rice, J. A.; MacCarthy, P. Org. Geochem. 1991, 17, 635–648.(35) Kaneda, T. Microbiol. Mol. Biol. Rev. 1991, 55, 288–302.(36) Piccolo, A.; Conte, P.; Tagliatesta, P. Biomacromolecules 2005,
6, 351–358.(37) Ambl�es, A.; Jambu, P.; Parlanti, E.; Joffre, J.; Riffe, C. Eur. J. Soil
Sci. 1994, 45, 175–182.(38) Lichtfouse, E.; Berthier, G.; Houot, S.; Barriuso, E.; Bergheaud,
V.; Vallaeys, T. Org. Geochem. 1995, 23, 849–85.(39) Bull, I. D.; van Bergen, P. F.; Poulton, P. R.; Evershed, R. P.Org.
Geochem. 1998, 28, 11–26.(40) Spaccini, R.; Piccolo, A. J. Agric. Food Chem. 2007, 55,
2293–2302.(41) Matzke, K.; Riederer, M. Planta 1991, 185, 233–245.(42) Riederer, M.; Matzke, K.; Ziegler, F.; K€ogel-Knabner, I. Org.
Geochem. 1993, 20, 1063–1076.(43) Bernards, M. A.; Lewis, N. G. Phytochemistry 1998,
47, 915–933.(44) Guggenberger, G.; Frey, S. D.; Six, J.; Paustian, K.; Elliott, E. T.
Soil Sci. Soc. Am. J 1999, 63, 1188–1198.(45) Piccolo, A.; Spaccini, R.; Nieder, R.; Richter, J. Clim. Change
2004, 67, 329–343.(46) Knicker, H.; Fr€und, R.; L€udemann, H.-D. Naturwissenschaften
1993, 80, 219–221.(47) Knicker, H. Biogeochemistry 2007, 85, 91–118.(48) Ecology and Metabolism of Plant Lipids; Fuller, G., Nes, W. D.,
Eds.; ACS Symposium Series 325; American Chemical Society:Washington, DC, 1987.