basis of presentation - cybg.com · and practices of the boe, ... - underlying capital generation...
TRANSCRIPT

BASIS OF PRESENTATION
CYBG PLC (the ‘Company’), together with its subsidiary undertakings (which together comprise the ‘Group’), operate under the Clydesdale Bank, Yorkshire Bank and B brands. It offers a range of banking services for both retail and business customers through retail branches, business banking centres, direct and online channels, and brokers. This release covers the results of the Group for the six months ended 31 March 2018. Statutory basis: Statutory information is set out on pages 31 to 57. However, a number of factors have had a significant effect on the comparability of the Group’s financial position and results. Accordingly, the results are also presented on an underlying basis. Underlying basis: The statutory results are adjusted for certain items which are listed below, to allow a comparison of the Group’s underlying performance. A reconciliation from the underlying to statutory basis is shown on page 13 and management's rationale for the adjustments is shown on page 58.
Conduct charges - These are customer redress and associated costs arising from legacy products and past sales practices. Restructuring and related expense - Restructuring of the business is currently ongoing with costs including redundancy
payments, property vacation costs, associated enablement costs and non-recurring costs arising from operational transformation. RBS alternative remedies package spend - Costs incurred, in relation to the RBS alternative remedies package, to enable
strategic and inorganic growth. Separation costs - Costs incurred directly relating to the demerger from National Australia Bank (NAB). Gain on disposal of VocaLink – A one-off gain recognised in the prior year on the disposal of the Group’s VocaLink share. Gain on defined benefit (DB) pension scheme reforms - A one-off gain recognised in the prior year on the closure of the defined
benefit pension scheme to future accrual for the majority of members. Alternative performance measures: the financial key performance indicators (KPIs) used by management in monitoring the Group’s performance and reflected throughout this report are determined on a combination of bases (including statutory, regulatory and alternative performance measures), as detailed at ‘Measuring financial performance – glossary’ on pages 250 to 251 of the Group annual report and accounts for the year ended 30 September 2017. Certain figures contained in this document, including financial information, may have been subject to rounding adjustments and foreign exchange conversions. Accordingly, in certain instances, the sum or percentage change of the numbers contained in this document may not conform exactly to the total figure given. The information contained within this announcement is deemed by the Group to constitute inside information as stipulated under the Market Abuse Regulation No 596/2014. Upon the publication of this announcement via Regulatory Information Service, this inside information is now considered to be in the public domain.
FORWARD LOOKING STATEMENTS The information in this document may include forward looking statements, which are based on assumptions, expectations, valuations, targets, estimates, forecasts and projections about future events. These can be identified by the use of words such as ‘expects’, ‘aims’, ‘targets’, ‘seeks’, ‘anticipates’, ‘plans’, ‘intends’, ‘prospects’, ‘outlooks’, ‘projects’, ‘believes’, ‘estimates’, ‘potential’, ‘possible’, and similar words or phrases. These forward looking statements, as well as those included in any other material discussed at any presentation, are subject to risks, uncertainties and assumptions about the Group and its securities, investments and the environment in which it operates, including, among other things, the development of its business and strategy, trends in its operating industry, changes to customer behaviours and covenant, macroeconomic and/or geopolitical factors, changes to its board and/or employee composition, exposures to terrorist activity, IT system failures, cyber-crime, fraud and pension scheme liabilities, changes to law and/or the policies and practices of the BoE, the FCA and/or other regulatory and governmental bodies, inflation, deflation, interest rates, exchange rates, changes in the liquidity, capital, funding and/or asset position and/or credit ratings of the Group, future capital expenditures and acquisitions, the repercussions of the UK’s referendum vote to leave the European Union (EU), the UK’s exit from the EU (including any change to the UK’s currency), Eurozone instability, and any referendum on Scottish independence. In light of these risks, uncertainties and assumptions, the events in the forward looking statements may not occur. Forward looking statements involve inherent risks and uncertainties. Other events not taken into account may occur and may significantly affect the analysis of the forward looking statements. No member of the Group or their respective directors, officers, employees, agents, advisers or affiliates gives any assurance that any such projections or estimates will be realised or that actual returns or other results will not be materially lower than those set out in this document and/or discussed at any presentation. All forward looking statements should be viewed as hypothetical. No representation or warranty is made that any forward looking statement will come to pass. No member of the Group or their respective directors, officers, employees, agents, advisers or affiliates undertakes any obligation to update or revise any such forward looking statement following the publication of this document nor accepts any responsibility, liability or duty of care whatsoever for (whether in contract, tort or otherwise) or makes any representation or warranty, express or implied, as to the truth, fullness, fairness, merchantability, accuracy, sufficiency or completeness of, the information in this document. The information, statements and opinions contained in this document do not constitute a public offer under any applicable legislation or an offer to sell or solicitation of any offer to buy any securities or financial instruments or any advice or recommendation with respect to such securities or other financial instruments.

Interim financial report For the six months ended 31 March 2018 Contents H1 2018 highlights 1 Business and financial review 3 Risk management 15 Statement of Directors’ responsibilities 29 Independent review report to CYBG PLC 30 Interim condensed consolidated financial statements
Interim condensed consolidated income statement 31 Interim condensed consolidated statement of comprehensive income 32 Interim condensed consolidated balance sheet 33 Interim condensed consolidated statement of changes in equity 34 Interim condensed consolidated statement of cash flows 35
Notes to the interim condensed consolidated financial statements 36
Additional information 58

1
CYBG PLC Interim Financial Report 2018 Continued execution of the Group’s strategy delivered a significant increase in underlying
profitability; significant action taken on legacy conduct issues drove a statutory loss
Significant increase in underlying profitability - Underlying profit before tax up 28% year-on-year to £158m; statutory loss after tax of £76m due to PPI legacy
costs - Net interest income up 4% driven by strong volume growth and NIM of 218bps, partly offset by non-interest
income down 10% primarily due to one-off marketing incentive costs relating to a successful current account switching campaign
- Underlying costs down 7% with income up 1%, delivering a 6%pts improvement in the underlying cost-to-income ratio to 64%
- Underlying capital generation of 27 basis points (bps) in the first six months - FY2018 guidance for underlying costs improved to <£640m; FY2018 NIM of c.220bps and medium term guidance
reiterated
Continued delivery of sustainable customer growth strategy
- 5% annualised deposit growth to £28.4bn with growth across all product categories demonstrating the strength of the Group’s diverse funding platform
- 5% annualised customer lending growth to £32.7bn with above system annualised mortgage growth of 6% and Core SME annualised growth of 5%
- Loan to deposit ratio of 115%; low reliance on TFS with balances of £2.25bn outstanding - only c.7% of customer lending
- Continued robust asset quality reflects prudent underwriting standards; net cost of risk of 13bps (H117: 15bps)
Significant action taken on legacy conduct issues
- £350m increase in provisions for legacy PPI costs to cover the costs to close-out the remediation programme and a revised estimate of 110,000 future walk-in complaints from Apr-18 to the Aug-19 time bar; remaining NAB indemnity of £148m now fully utilised
- £18m increase in provisions for other legacy conduct charges - Total conduct provisions increase reduced the Group’s CET1 ratio by c.100bps (after tax) - 11.3% CET1 ratio which continues to maintain a significant buffer to the Group’s regulatory capital requirements
Strategic delivery enables the Group to focus on capturing future growth opportunities
- Multi-year strategic investment in the iB digital platform means CYBG is ready for Open Banking today and is developing exciting new digital capabilities for both Retail and SME customers
- The Group is confident of achieving IRB accreditation for the mortgage portfolio in the next six months offering capital optimisation opportunities and opening up new attractive lending segments to the Group
- The Group’s SME franchise is well placed to be a beneficiary of the RBS alternative remedies package
David Duffy, Chief Executive Officer commented:
“In the first half of 2018, we have continued to make good progress in delivering our strategic priorities and developing CYBG as the leading alternative to the UK’s big banks. In a competitive market, we have significantly increased underlying profit, up 28% to £158m, while achieving 5% annualised lending growth across both mortgages and SMEs. While the economic outlook remains uncertain, CYBG is well positioned to continue executing our existing strategy and to capture future growth opportunities across both our Retail and SME businesses in the year ahead. We continue to deliver innovative technology to our customers and will soon leverage our Open Banking platform with the launch of our new account aggregator and other services to further enhance the customer experience. In addition, we are also preparing to compete for the opportunities offered by the RBS alternative remedies package in order to scale our regional SME franchise nationally and to build-out an SME offering that provides a credible near-term competitor to the incumbent banks.”

2
Enquiries:
Investors and Analysts Andrew Downey Head of Investor Relations
+44 20 3216 2694+44 7823 443 150
[email protected] Owen Price Senior Manager, Investor Relations
+44 20 3216 2785+44 7484 908 949
[email protected] Media (UK) Christina Kelly +44 7484 905 358Senior Media Relations Manager [email protected] Press Office +44 800 066 5998 [email protected] Powerscourt Victoria Palmer-Moore 07725 565 545Justin Griffiths +44 207 250 1446 Media (Australia) Citadel Magnus Peter Brookes +61 407 911 389James Strong +61 448 881 174
CYBG PLC will be hosting a presentation for analysts and investors covering the interim results at its offices at 15th Floor, 122 Leadenhall Street, London EC3V 4AB, starting at 08:30 BST today (17:30 AEST). The meeting will be webcast live and available at www.cybg.com/investor-centre/financial-results. Webcast participants will be able to send questions into the meeting. A recording of the webcast and conference call will be made available on the website www.cybg.com/investor-centre/financial-results shortly after the meeting. Dial in details: UK Toll Free 0808 234 0757 Australia Toll Free 1800 123 296 Australia Mobile 1300 105 779 Australia Local +61 3 8338 0026 Hong Kong Local +852 3051 2792 New Zealand Toll Free 0800 452 782 New Zealand Local +64 9 8876 907 USA Toll Free 1855 293 1544 Conference ID: 7589605

3
Business and financial review
Key performance indicators(1) The underlying results presented within this report reflect the Group’s results prepared on an underlying basis and as presented to the CEO and the Executive Leadership Team and the Board. These exclude certain items that are included in the statutory results, as management believes that these items are not reflective of the underlying business and do not aid meaningful period-on-period comparison. 6 months to 6 months to 12 months to 31 Mar 2018 31 Mar 2017 30 Sep 2017
Profitability: Net interest margin (NIM) 2.18% 2.26% 2.27%Statutory return on tangible equity (RoTE) (7.0)% 1.2% 6.1%Statutory cost to income ratio (CIR) 115% 86% 69%Statutory return on assets (0.36)% 0.15% 0.45%Statutory basic (loss)/earnings per share (EPS) (10.2)p 1.7p 17.3p
Underlying RoTE 10.6% 6.3% 7.5%Underlying CIR 64% 70% 67%Underlying return on assets 0.72% 0.47% 0.54%Underlying basic EPS 15.5p 9.0p 21.5p
As at: 31 Mar 2018 31 Mar 2017 30 Sep 2017
Asset Quality: Impairment charge to average customer loans (cost of risk) 0.13% 0.15% 0.14%90+ days past due (DPD) plus impaired assets to customer loans 1.02% 1.17% 1.06%Specific provision to total impaired assets 33.6% 36.6% 32.6%Total provision to customer loans 0.67% 0.77% 0.69%Indexed loan to value (LTV) of mortgage portfolio(2) 59.1% 56.9% 57.5%
Regulatory Capital: CET1 ratio 11.3% 12.5% 12.4%Tier 1 ratio 13.5% 14.8% 14.7%Total capital ratio 16.7% 18.0% 17.9%CRD IV leverage ratio 6.0% 6.7% 6.3%UK leverage ratio 7.0% 7.7% 7.4%Tangible net asset value (TNAV) per share 276.7p 283.3p 295.6p
Funding and Liquidity: Loan to deposit ratio (LDR) 115% 117% 115%Liquidity coverage ratio (LCR) 131% 112% 164%Net stable funding ratio (NSFR) 119% 120% 118%
(1) For a definition of each of the key performance indicators, refer to ‘Measuring financial performance – glossary’ on pages 250 to 251 of the Group annual report and
accounts for the year ended 30 September 2017. The key performance indicators include statutory, regulatory and alternative performance measures. Where applicable certain KPIs are calculated on an annualised basis for the periods to 31 March.
(2) LTV of the mortgage portfolio is defined as mortgage portfolio weighted by balance and indexed using the MIAC Acadametrics indices at a given date.

4
Business and financial review
Chief Executive Officer's statement
Overview
I am pleased to report that CYBG has continued to deliver in H1 2018 by remaining focused on executing our three-year strategic plan to establish ourselves as the UK's leading full-service challenger bank.
Our continued delivery of this strategy is evidenced by the significant improvement in our underlying profitability, with underlying profit before tax increasing 28% year-on-year to £158m. This has been driven by a combination of income growth derived through our sustainable customer growth strategy and improved customer experience, a reduced cost base from our efficiency programme and a low impairment charge due to our disciplined underwriting process.
While the Group delivered a strong underlying performance, the significant action taken to manage the Group’s legacy conduct issues means we have reported a statutory loss after tax of £76m. Walk-in complaint volumes have been running much higher than both we and the industry expected and as a result we revised our forecasts for the level of complaints received out to the time bar in August 2019. In addition, due to the complexity of the remaining cases within our proactive remediation exercise, we were required to take a provision top-up to close out the programme. While the size of the additional PPI provision charge is disappointing, it is important to note that given the strong capital position of the Group we have been able to absorb this impact and continue to retain a significant buffer to our regulatory requirement such that our strategy and future growth aspirations remain unchanged.
Delivering our strategic objectives
Sustainable customer growth
Our sustainable customer growth strategy continues to progress thanks to the focus on improving our customer journeys and the significant investment we have made in our digitally-enabled, omni-channel offering.
The sustainability of our growth strategy is underpinned by our prudent pre-funding approach to customer lending, and as a result, the Group grew its customer deposits by 5% (annualised) in the first six months of the year. This growth was supported by increases in both Retail and SME, and across all our key products (current accounts, savings and term deposits), once again demonstrating the strength of our diverse funding platform.
The Group has deployed this funding into our targeted customer lending segments to deliver 5% (annualised) customer loan growth, in line with our target. In mortgages, the Group delivered growth of 6% (annualised) vs. the market at 3%, following a strong pipeline into Q1 and continued success in our strategy of identifying niche areas of value in a competitive marketplace. In Core SME we delivered 5% (annualised) lending growth, with £1 billion of gross lending in the period and we therefore remain on track to achieve our £6 billion three-year lending commitment to SMEs by FY19. We remain cautious in the unsecured personal lending market, but continue to adopt a tactical pricing strategy that sees us selectively price in and out of the market when appropriate.
Efficiency
Our efficiency programme has continued to deliver absolute underlying operating cost reductions and we remain on track to deliver our three-year commitment of >£100 million of net cost savings by FY19. The Group reduced its underlying operating costs by 7% year-on-year, which translated into a 6%pt reduction in the cost to income ratio, which now stands at 64%, moving us closer to our target of 55-58% by FY19. In addition, the successful delivery seen in the first six months of the year has given us the confidence to upgrade our underlying cost guidance to <£640 million for FY18, down from <£650 million previously.
Capital optimisation
The Group’s IRB accreditation application is now in the final stages of the regulatory process and we are confident of achieving accreditation for the mortgage book within the next six months. We have recently completed the in-depth management interview phase and the PRA has indicated that they will now commence the next stage of the decision-making process. Once accreditation is achieved, the Group will work with the PRA to determine its regulatory capital requirement going forward. As previously guided, the adoption of IRB models is expected to result in a material reduction in the Group’s credit RWA’s and a consequential increase in the Group’s CET1 ratio. The Group will work through the opportunities this may afford us during FY19 and consult with our stakeholders when appropriate. Digital transformation progress
The significant, multi-year strategic investment the Group has been making in its technology platforms is enabling us to leverage the iB platform to deliver an enhanced digital experience for customers. Key achievements during the period include: the migration of all Clydesdale Bank and Yorkshire Bank customers onto the iB platform-enabled mobile apps providing all our customers with market-leading mobile functionality; CYBG becoming the first UK bank to launch mobile digital cheque processing, with the Group now accounting for 25% of all digital cheques processed; and, the roll-out of B on Web to our B customers with an enhanced home page and new design.

5
Business and financial review
Chief Executive Officer's statement
Digital transformation progress (continued) Our digital brand, B, continues to perform well and we now have over 170,000 customers, with deposits of £1.6 billion. The app is highly rated on the Apple App store reflecting the work we have done to improve the customer experience and B’s digital adoption score of 71% puts it among the top 3 in the market. Although Open Banking is now here, we are not expecting a rapid adoption by consumers given the wider industry is not fully ready, industry security protocols are not complete and customer concerns about data protection. However, CYBG is ready today - our iB platform was built with Open Banking in mind and we are ready to leverage the platform to offer our vision of the future digital banking model. This is built on providing our customers, both Retail and SME, a core set of propositions, which is supplemented by a customer-focused marketplace of products and services, developed by ourselves and in partnership with others. We have lots in development and testing at the moment, including our money management aggregation service, B Aggregator, which we will be launching on B this month, with further functionality to come later in the year. We will provide further updates on our strategic thinking in this space as the technological environment evolves. Operating environment
The UK economic outlook remains uncertain and while the economy has remained more resilient than expected following the EU referendum in 2016, the most recent economic data points to a slightly weaker environment. In particular, it appears that consumer spending has slowed and businesses have been holding back investment, which has had some impact on demand but with credit conditions remaining benign. In the mortgage market, the economic uncertainty has reduced customer demand while competition has remained intense and this has resulted in a challenging pricing environment, with market swap rates not being fully passed through to customer pricing. While the Bank of England’s May 2018 decision to hold the base rate stable has delayed expectations for future rate increases, the market continues to expect a rate increase later this year. Although the Group has assumed no base rate increases in its 2018 and medium-term targets, the structure of our balance sheet, with a large current account funding base, does mean that we will be positively geared to rising interest rates should they occur. In addition, following the UK’s decision to leave the EU in June 2016, we chose to reset our balance sheet growth targets assuming a lower growth and low interest rate outlook, and these targets continue to remain appropriate in the continued uncertain economic environment. Outlook
While the UK operating environment continues to remain challenging, we believe that CYBG is well positioned to continue delivering on its strategy. We hold a unique position in the UK banking market with scale, expertise and capabilities across both Retail and SME banking, with a number of competitive advantages, including: a diverse funding platform that enables us to raise deposits from Retail, SME and wholesale funding markets across the full
range of products, coupled with a judicious use of TFS that has been used only as a supplement to our funding plans; established, full-service lending franchises in both mortgages and SME; a strong capital position with a significant buffer to our regulatory requirement and future capital optimisation opportunities
from the anticipated IRB accreditation; a scalable, market-leading technology platform that is built and Open Banking ready today. These strengths give us the confidence that we can continue to deliver our existing strategy in the current environment and leverage the growth opportunities that are opening up ahead. This includes our commitment to supporting the RBS alternative remedies package where, given our existing SME banking capabilities, we intend to fully participate in the Incentivised Switching Scheme and offer an attractive home to SME customers leaving RBS. We will also submit an application to 'Pool A' of the Capability & Innovation Fund which, if successful, would enable us to further enhance our competitive edge in SME banking and accelerate our growth plans. In addition, while the Group’s organic strategy remains our primary focus, as previously guided, the Group will continue to assess inorganic opportunities and is well-positioned should any strategically attractive options arise. My colleagues and I are therefore fully focused on continuing to execute on our strategy and positioning CYBG to leverage the opportunities ahead.
David Duffy, Chief Executive Officer - 14 May 2018
6
Business and financial review
Overview of Group results
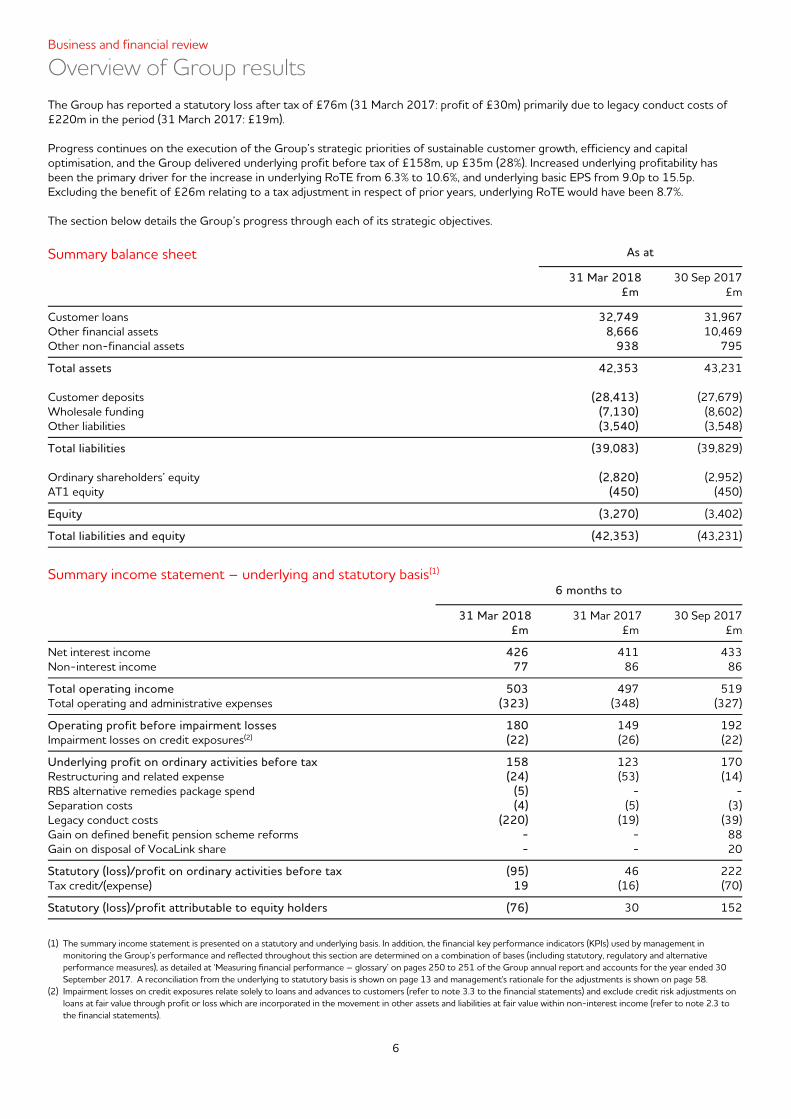
The Group has reported a statutory loss after tax of £76m (31 March 2017: profit of £30m) primarily due to legacy conduct costs of £220m in the period (31 March 2017: £19m). Progress continues on the execution of the Group’s strategic priorities of sustainable customer growth, efficiency and capital optimisation, and the Group delivered underlying profit before tax of £158m, up £35m (28%). Increased underlying profitability has been the primary driver for the increase in underlying RoTE from 6.3% to 10.6%, and underlying basic EPS from 9.0p to 15.5p. Excluding the benefit of £26m relating to a tax adjustment in respect of prior years, underlying RoTE would have been 8.7%. The section below details the Group’s progress through each of its strategic objectives. Summary balance sheet As at
31 Mar 2018 30 Sep 2017 £m £m
Customer loans 32,749 31,967Other financial assets 8,666 10,469Other non-financial assets 938 795
Total assets 42,353 43,231 Customer deposits (28,413) (27,679)Wholesale funding (7,130) (8,602)Other liabilities (3,540) (3,548)
Total liabilities (39,083) (39,829) Ordinary shareholders’ equity (2,820) (2,952)AT1 equity (450) (450)
Equity (3,270) (3,402)
Total liabilities and equity (42,353) (43,231)
Summary income statement – underlying and statutory basis(1)
6 months to
31 Mar 2018 31 Mar 2017 30 Sep 2017 £m £m £m
Net interest income 426 411 433Non-interest income 77 86 86
Total operating income 503 497 519Total operating and administrative expenses (323) (348) (327)
Operating profit before impairment losses 180 149 192Impairment losses on credit exposures(2) (22) (26) (22)
Underlying profit on ordinary activities before tax 158 123 170Restructuring and related expense (24) (53) (14)RBS alternative remedies package spend (5) - -Separation costs (4) (5) (3)Legacy conduct costs (220) (19) (39)Gain on defined benefit pension scheme reforms - - 88Gain on disposal of VocaLink share - - 20
Statutory (loss)/profit on ordinary activities before tax (95) 46 222Tax credit/(expense) 19 (16) (70)
Statutory (loss)/profit attributable to equity holders (76) 30 152
(1) The summary income statement is presented on a statutory and underlying basis. In addition, the financial key performance indicators (KPIs) used by management in
monitoring the Group’s performance and reflected throughout this section are determined on a combination of bases (including statutory, regulatory and alternative performance measures), as detailed at ‘Measuring financial performance – glossary’ on pages 250 to 251 of the Group annual report and accounts for the year ended 30 September 2017. A reconciliation from the underlying to statutory basis is shown on page 13 and management's rationale for the adjustments is shown on page 58.
(2) Impairment losses on credit exposures relate solely to loans and advances to customers (refer to note 3.3 to the financial statements) and exclude credit risk adjustments on loans at fair value through profit or loss which are incorporated in the movement in other assets and liabilities at fair value within non-interest income (refer to note 2.3 to the financial statements).

7
Business and financial review
Overview of Group results
Outlook for the second half of FY2018 The mortgage market in 2018 has been more subdued, with good re-mortgage activity, but lower levels of new lending and the competitive environment remains fierce. In late 2017, we brought mortgage processing back onshore, as part of our customer journey improvement initiatives. Some servicing and fulfilment delays arose resulting in our broker pipeline build being lower than we had hoped for a period. These issues are now resolved, however our Q3 mortgage growth is expected to slow as this is when we will see the impact of lower applications at the start of 2018. Despite this, we expect to be within our market guidance for mortgage growth for the year albeit at the lower end of the range, and more broadly, we are now in a better place to deliver our longer term growth ambitions. Our SME pipeline is strong and we expect to see similar growth in the portfolio over the second half of the year. We also expect to see continued, measured growth in unsecured personal lending which is building from a low base. Following on from the first half performance, our NIM guidance is unchanged at c220bps. We have continued to execute on our cost strategy, delivering further savings in the first half of FY2018 and we now expect our underlying costs to be below £640m for the full year.

8
Business and financial review
Financial performance review
1. Continued sustainable growth in asset and deposit balances
As at
31 Mar 2018 30 Sep 2017 £m £m
Mortgages 24,139 23,480SME lending (1) - core 6,982 6,821 - non-core 437 504Unsecured personal lending 1,191 1,162
Gross loans and advances to customers 32,749 31,967
Current accounts (2) 13,999 13,798Variable rate savings accounts (2) 8,153 7,880Fixed rate term deposits (3) 6,253 5,983Other wholesale deposits 8 18
Total customer deposits 28,413 27,679
(1) Includes financial assets at fair value of £421m (September 2017: £477m). (2) £150m of variable rate savings balances have been reclassified from current accounts in the comparative period to better reflect their nature. (3) Includes financial liabilities at fair value of £20m (September 2017: £26m).
Mortgages We started the period with a strong pipeline which enabled us to deliver annualised growth of 5.6% in the period, higher than system growth(1) of 2.6%. Our market share increased from 1.73% to 1.76%. We continued to see a growing number of customers favour fixed rate mortgage products, as they sought to further capitalise on the prevailing low interest rate environment against a backdrop of market sentiment that expects modest short to medium term interest rate rises. This, combined with higher customer retention, has resulted in growth in the fixed rate book to 77% of total mortgage balances (30 September 2017: 73%) and accounted for 96% of mortgages drawn in the period (30 September 2017: 95%). Longer term fixed rate mortgages are growing more popular with 5 year fixed mortgages now accounting for 25% of the portfolio (30 September 2017: 22%). In line with our expectations, the buy-to-let (BTL) property market has been more subdued following last year’s changes in tax relief for landlords, an increase in Stamp Duty and the Prudential Regulation Authority’s (PRA) enhanced affordability assessments. This has led to a shift in the mix of our mortgage book with BTL falling from 33% of mortgage stock at 30 September 2017 to 32%, with owner occupied accounting for a higher proportion of drawdowns in the period (76%, up from 64% in the comparative period to 31 March 2017). Reflecting this change in mix, the average LTV of new lending was 71% (30 September 2017: 71%) and the average LTV of the mortgage book increased from 57.5% to 59.1%. Our proportion of residential mortgages 90 days in arrears has remained stable at 0.53% (30 September 2017: 0.52%).
SME lending Our core SME lending portfolio increased by £161m in the period (4.7% annualised), ahead of system growth(2) of 2.2% and in line with market guidance of mid-single digit growth. We are outperforming the market despite the subdued demand resulting from Brexit uncertainty. The Group is delivering on its pledge to support small and medium sized businesses across the UK as part of the Group's 3 year commitment to fuel growth by lending £6bn in the three years to 2019. Lending origination targets have been achieved or exceeded in each of our core regions and this, coupled with lower attrition in the period, has contributed to the overall growth. We have continued to implement a number of new propositions and developed new capabilities to better support the funding needs of our SME customers. The SME portfolio remains well positioned. Underlying asset quality is resilient and stable, reflective of the diversity within the portfolio as a result of controlled risk appetite and an economic environment which continues to support business performance. The impaired asset portfolio has reduced to £114m (30 September 2017: £126m) which is at its lowest level for more than 10 years. The non-core portfolio reduced from £504m to £437m in the period as we continued to pro-actively run down the balances through the managed attrition of our largest non-core connections. (1) System growth is sourced from the BoE ‘Mortgages outstanding by type of lender, UK (BOE)’ report (MM4). (2) System growth is sourced from the BoE ‘Industrial analysis of monetary financial institutions’ lending to UK residents’ report (C1,2), and excludes individuals and individual
trusts, activities auxiliary to financial intermediation, insurance companies and pension funds, and financial intermediation (excluding insurance and pension funds) results.

9
Business and financial review
Financial performance review
Unsecured personal lending Unsecured personal lending has grown by £29m in the period (5.0% annualised) driven largely by competitive pricing on our fixed rate personal loans which grew by 8% over the period from £658m to £713m. The fixed rate personal loan market remains highly competitive, resulting in some margin erosion, as market rates have dipped to near historical lows and are yet to respond to the rising rate environment.
Growth in the fixed rate personal loan book was slightly offset by a fall in credit card balances of £14m to £382m (30 September 2017: £396m) as customers continue to be attracted to introductory interest free promotional products offered by other market participants.
Variable rate personal loans and overdrafts fell by £15m in the period from £111m to £96m. Variable rate loan balances continue to reduce as, although these products remain on sale, they are not actively promoted or targeted.
Current accounts Current account funding increased by £201m in the period. An unprecedented number of new personal current accounts were opened following our high profile national incentive campaign, which had a market leading £250 customer switching incentive. The B current account was the main beneficiary of the campaign (with balances up £139m) while the Current Account Plus product also contributed growth of £72m. The new account openings were in line with our strategy to sustainably grow this portfolio in a way that recruits the right profile of customer with whom we have an opportunity to build a long-term relationship.
Variable rate savings accounts Funding from variable rate savings accounts increased by £273m principally driven by £349m of growth in B savings accounts and £85m in business savings accounts. Partially offsetting this is attrition of £136m in cash ISA balances following continued product rationalisation and repricing of the portfolio. Business savings growth has been driven through targeted relationship management. There has been a noticeable change in book mix, with a higher proportion of balances being held in longer term notice products, providing an additional liquidity benefit.
Fixed rate term deposits Our fixed rate term deposit book increased by £270m to £6,253m as a result of deposit raising initiatives taken primarily in the first quarter of the year, including the successful launch of our second online digital bond along with two further cash ISA fixed rate bonds designed to actively retain maturing term deposits. As a result we increased our cash ISA fixed rate bond retention rate from 70% to 92%. Funding costs have fallen as a result of the maturity of a number of longer term higher priced products.
Funding and liquidity The Group continues to maintain its strong funding and liquidity position and seeks to achieve an appropriate balance between profitability, liquidity risk and capital optimisation. Reflecting our retail deposit-led funding strategy, our loan to deposit ratio was stable over the period at 115%. In addition to retail deposits, we ensure appropriate diversification in our funding base through a number of wholesale funding programmes. During the period we made further drawings from the BoE Term Funding Scheme (TFS), taking overall drawings at 31 March 2018 to £2.25 billion. We have deliberately accessed TFS judiciously - we have not relied on it to fund our growth and our drawings are at a level that can be refinanced comfortably over time. We have also maintained our access to public markets - in January, we successfully completed a further issuance of Lanark Residential Mortgage Backed Securities, raising £500m equivalent across USD and GBP tranches. The Group’s liquidity surplus continues to comfortably exceed our regulatory minimum and internal risk appetite, with a Liquidity Coverage Ratio (LCR) of 131% as at 31 March 2018 (30 September 2017: 164%).
.

10
Business and financial review
Financial performance review
Net interest income 6 months ended 31 March 2018 6 months ended 31 March 2017
Averagebalance (1)
Interest income/
(expense)
Averageyield/
(rate) (2)
Averagebalance (1)
Interest income/
(expense)
Averageyield/
(rate) (2)
Average balance sheet £m £m % £m £m %
Interest-earning assets: Mortgages 23,868 329 2.77 22,052 325 2.96SME lending (3) 7,276 141 3.88 7,023 130 3.72Unsecured personal lending 1,194 51 8.46 1,157 53 9.23Liquid assets 6,179 15 0.50 5,770 10 0.35Due from other banks 786 1 0.24 961 1 0.16Swap income/other - 15 n/a - 15 n/a
Total average interest-earning assets 39,303 552 2.81 36,963 534 2.90Total average non-interest-earning assets 2,834 2,440
Total average assets 42,137 39,403
Interest-bearing liabilities: Current accounts 11,103 (5) (0.08) 10,956 (3) (0.05)Savings accounts 7,996 (16) (0.38) 8,257 (22) (0.54)Term deposits 6,425 (51) (1.60) 5,301 (48) (1.83)Wholesale funding 7,137 (54) (1.50) 5,690 (50) (1.77)
Total average interest-bearing liabilities 32,661 (126) (0.77) 30,204 (123) (0.82)Total average non interest-bearing liabilities 6,074 5,970
Total average liabilities 38,735 36,174
Total average equity attributable to ordinary equity holders 3,402 3,229
Total average liabilities and average equity attributable to ordinary equity holders 42,137 39,403
Net interest income 426 411
(1) Average balances are calculated using the daily balances across the period. (2) Average yield is calculated by annualising the interest income/expense for the period. (3) Includes loans designated at fair value through profit or loss.
Group NIM of 2.18% remains in line with guidance of c220bps, down from 2.26% since March 2017. We guided to a reduction in NIM this year as we expected to see the impact of the shift in our mortgage mix towards a higher proportion of owner-occupier lending, together with generally competitive mortgage pricing over the last two years, feed through into lower average rates across the mortgage book. Furthermore we continue to see mortgage customers favouring fixed rate deals and this customer preference, alongside proactive early retention programmes in both CYBG and our competitors, continues to exert pressure on average mortgage margins through competitive fixed rate pricing and lower SVR balances. Nonetheless the Group continues to drive net interest income growth through its sustainable balance sheet growth strategy. Pricing in the unsecured personal lending market remains very competitive and the average gross yield on new business in the period was 6.2% (31 March 2017: 7.4%). Offsetting the margin pressure in our Retail asset portfolios we saw improved average customer rates in our SME book, benefitting from pricing discipline and a higher interest rate environment. In addition we actively managed our funding volumes and costs to support NIM.
Non-interest income Non-interest income reduced by £9m (11%) compared with March 2017, mainly due to the cost of the personal current account campaign incentives which amounted to £6m and resulted in increased current account volumes, supporting our customer growth strategy.

11
Business and financial review
Financial performance review
Impairment losses on credit exposures Impairment losses decreased from £26m to £22m, resulting in a 2bps reduction in net cost of risk reflecting strong portfolio quality and benign economic conditions. The reduction reflects a lower charge taken on our SME exposures offsetting an increase in the impairment charge for Retail exposures. A modest increase of £2m in impairment losses for our Retail unsecured portfolios resulted from the combined effect of portfolio growth, higher default rates on lending originated in earlier years and reduced recoveries.
6 months ended 31 March 2018 6 months ended 31 March 2017
Retail - secured
Retail -unsecured
SME Total Retail -secured
Retail -unsecured
SME Total
bps bps bps bps bps bps bps bps
Gross cost of risk 2 272 37 20 2 253 55 24 Specific provision releases and recoveries (6) (6)Fair value loans (1) (3)
Net cost of risk (1) 13 15
(1) Cost of risk calculated on an annualised basis.
2. Delivering cost savings ahead of plan
6 months to
31 Mar 2018 31 Mar 2017 30 Sep 2017Operating and administrative expenses £m £m £m
Personnel expenses 109 135 113Depreciation and amortisation expenses 43 42 45Other operating and administrative expenses 171 171 169
Total underlying operating and administrative expenses 323 348 327Restructuring and related expense 24 53 14RBS alternative remedies package spend 5 - -Separation costs 4 5 3Conduct charges 220 19 39Gain on defined benefit pension scheme reforms - - (88)
Total statutory operating and administrative expenses 576 425 295
Following the successful delivery of the first phase of the Group’s three-year efficiency programme in 2017, we have continued to execute on our cost strategy, delivering further savings in the first half of FY2018 which positions us well for delivering on our overall cost reduction commitment.
The benefits of last year’s cost reduction initiatives are being realised in the current period with a reduction in personnel expenses from £135m in March 2017 to £109m at March 2018. This is driven by headcount reductions following last year’s voluntary severance programme, as well as the closure of the defined benefit pension scheme to future accrual on 1 August 2017 for the majority of current employees. Building an improved reward package across CYBG has been a key area of focus in 2018 and improvements have included consolidated pay increases, enhanced defined contribution pension provision and the introduction of a flexible benefits account worth up to 5% (capped at £2,500) of salary from 1 January 2018 for all colleagues below Executive Director. In addition, in recognition of the delivery of an unprecedented level of change in FY2017, all eligible colleagues received £500 of free shares in December 2017 at a cost of £3m. Costs related to the restructuring and streamlining of our business have fallen by £29m to £24m, largely due to lower volume of restructuring initiatives in the period. The current period restructuring costs have been of a similar nature to the prior year but on a smaller scale with fewer branches being closed and a smaller number of redundancies. Also included in the current period were the costs required to deliver our customer journey initiatives and related operational transformation.

12
Business and financial review
Financial performance review
In line with the rest of the industry, the Group has experienced a sustained period of elevated PPI complaints in the six months to 31 March 2018. The Group has reassessed the level of provision that was considered appropriate to meet current and future expectations in relation to the mis-selling of PPI policies and concluded that a further charge of £350m was required. As a legacy conduct issue this provision is partially covered under the terms of the conduct indemnity deed entered into with National Australia Bank. The Group expects to draw down the full amount of the remaining indemnity cover (£148m), with the balance of £202m recognised as a charge to the income statement. The Group has also recognised additional costs of £18m for other less significant conduct related matters. The Group continues to assess the impact of resolving legacy conduct issues on an ongoing basis. 3. Capital optimisation
As at
31 Mar 2018 30 Sep 2017 £m £m
Common equity tier 1 capital 2,246 2,437Additional Tier 1 capital 450 450Tier 2 capital 631 628
Total capital 3,327 3,515
Risk weighted assets 19,949 19,678
Capital change
bps CET1
At 30 September 2017 12.4%Generated 90Asset growth (15)Investment spend (41)AT1 distributions (7)
Underlying capital generation 27
Non underlying items – conduct (102)Non underlying items – restructuring costs (10) Other (28)
Total net capital absorbed (113)
At 31 March 2018 11.3%
The Group delivered a fully loaded total capital ratio of 16.7% and CET1 ratio of 11.3% at March 2018. The impact of the additional conduct provision on the Group’s CET1 ratio was 102bps which means it will be operating below its guidance range of 12-13%. However, the Group continues to maintain a significant buffer to its regulatory capital requirements and remains confident in the business delivering net capital generation going forward. Underlying capital generation was 27bps, largely driven by strong underlying profits offset by growth in mortgages and SME lending with risk weighted assets (RWAs) increasing by £271m. Investment spend absorbed 41bps as the Group has invested heavily in our digital proposition to improve the customer experience and drive operational efficiencies. After non underlying charges, the Group’s CET1 ratio was 113bps lower at 11.3%.

13
Business and financial review
Reconciliation of statutory to underlying results
The underlying results presented within this section reflect the Group’s results prepared on an underlying basis and as presented to the CEO and the Executive Leadership Team and the Board. These exclude certain items that are included in the statutory results, as management believes that these items are not reflective of the underlying business and do not aid meaningful period-on-period comparison. The table below reconciles the statutory results to the underlying basis, and full details on the adjusted items are included on page 58:
Statutory
results Legacy
conduct costs
Business restruct-
uring
RBS alternative
remedies package
spend
Separation costs
Underlying basis
6 months to 31 March 2018 £m £m £m £m £m £m
Net interest income 426 - - - - 426Non-interest income 77 - - - - 77
Total operating income 503 - - - - 503Total operating and administrative expenses before impairment losses (576) 220 24 5 4 (323)
Operating (loss)/profit before impairment losses (73) 220 24 5 4 180Impairment losses on credit exposures (22) - - - - (22)
(Loss)/profit on ordinary activities before tax (95) 220 24 5 4 158Tax credit/(expense) 19 (20) (3) (1) (1) (6)
(Loss)/profit attributable to equity holders (76) 200 21 4 3 152
Financial performance measures
CIR 115% (44)% (5)% (1)% (1)% 64%RoTE (7.0)% 15.5% 1.6% 0.3% 0.2% 10.6%Basic EPS (10.2)p 22.6p 2.4p 0.4p 0.3p 15.5pReturn on assets (0.36)% 0.95% 0.10% 0.02% 0.01% 0.72%
Underlying profit after tax attributable to ordinary equity holders is equal to the underlying profit attributable to equity holders less dividends and distributions (net of tax relief) of £15m (31 March 2017: £15m) and amounted to £137m (31 March 2017: £79m).

14
Business and financial review
Reconciliation of statutory to underlying results
Statutory results
Legacy conduct
costs
Business restruct-
uring
Separation costs
Underlying basis
6 months to 31 March 2017 £m £m £m £m £m
Net interest income 411 - - - 411Non-interest income 86 - - - 86
Total operating income 497 - - - 497Total operating and administrative expenses before impairment losses (425) 19 53 5 (348)
Operating profit before impairment losses 72 19 53 5 149Impairment losses on credit exposures (26) - - - (26)
Profit on ordinary activities before tax 46 19 53 5 123Tax expense (16) (4) (8) (1) (29)
Profit attributable to equity holders 30 15 45 4 94
Financial performance measures
CIR 86% (4)% (11)% (1)% 70%RoTE 1.2% 1.2% 3.6% 0.3% 6.3%Basic EPS 1.7p 1.7p 5.1p 0.5p 9.0pReturn on assets 0.15% 0.07% 0.23% 0.02% 0.47%
Statutory results
Legacyconduct
costs
Business restruct-
uring
Separation costs
Pension scheme reforms
AFS invest- ment
disposal
Underlying basis
12 months to 30 September 2017 £m £m £m £m £m £m £m
Net interest income 844 - - - - - 844Non-interest income 192 - - - - (20) 172
Total operating income 1,036 - - - - (20) 1,016Total operating and administrative expenses before impairment losses (720) 58 67 8 (88) - (675)
Operating profit before impairment losses 316 58 67 8 (88) (20) 341Impairment losses on credit exposures (48) - - - - - (48)
Profit on ordinary activities before tax 268 58 67 8 (88) (20) 293Tax expense (86) (5) (9) (2) 31 (2) (73)
Profit attributable to equity holders 182 53 58 6 (57) (22) 220
Financial performance measures
CIR 69% (5)% (6)% (1)% 8% 2% 67%RoTE 6.1% 2.1% 2.1% 0.2% (2.1)% (0.9)% 7.5%Basic EPS 17.3p 5.9p 6.6p 0.7p (6.5)p (2.5)p 21.5pReturn on assets 0.45% 0.14% 0.16% 0.01% (0.16)% (0.06)% 0.54%

15
Risk management
Risk overview The approach to and management of risk is defined in the Group’s Risk Management Framework. Integral to the framework is the identification of principal risks, the process by which the Group sets its risk appetite and the nature and extent of risk it is willing to assume in order to achieve its strategic objectives. The framework identifies eight principal risks: credit risk; balance sheet and prudential regulation risk; regulatory and compliance risk; conduct risk; operational risk; financial crime risk; strategic, business and financial performance risk; and people risk. Further detail on these risks and how they are managed is available in the 2017 annual report and accounts (page 19). There have been no significant changes to the principal risks in the interim period. Mapped to the principal risk categories the Group maintains a top risks register, capturing the specific risks with potential to impact the Group's short and medium term outlook. The top risks are appropriately categorised with owners, required actions and mitigation plans in place. The top risks currently being monitored include, but are not limited to, geopolitical uncertainty including Brexit risk; cyber risk; the risks attached to potential customer detriment; third party supplier risk; and the risks attached to effective execution of the Group's strategies. Top risks are reviewed regularly by both Executive and Board Risk Committee. The following sections provide an overview of the Group’s performance relative to Credit Risk and Balance Sheet and Prudential Regulation Risk for the period:
Credit risk Credit risk is the risk that a borrower or counterparty fails to pay the interest or capital due on a loan or other financial instrument. Credit risk manifests itself in the financial instruments and/or products that the Group offers, and those in which the Group invests (including, among others, loans, guarantees, credit-related commitments, letters of credit, acceptances, inter-bank transactions, foreign exchange transactions, swaps and bonds). Credit risk can be found both on-balance sheet and off-balance sheet. Industry concentration of assets The following tables show the levels of industry concentration of assets.
31 Mar 2018 30 Sep 2017Gross loans and advances to customers including loans designated (unaudited) (audited)at fair value through profit or loss (1) £m £mProperty – mortgage 24,139 23,480 Agriculture, forestry, fishing and mining 1,652 1,743 Instalment loans to individuals and other personal lending (including credit cards) 1,205 1,165 Manufacturing 814 724 Wholesale and Retail 770 778 Property – construction 239 212 Financial, investment and insurance 111 90 Government and public authorities 34 32 Other commercial and industrial 3,785 3,743 32,749 31,967
(1) Includes balances due from customers on acceptances and excludes accrued interest
31 Mar 2018 30 Sep 2017
(unaudited) (audited)Contingent liabilities and credit related commitments £m £mProperty – mortgage 1,920 2,305 Agriculture, forestry, fishing and mining 372 375 Instalment loans to individuals and other personal lending (including credit cards) 1,953 1,945 Manufacturing 624 588 Wholesale and Retail 520 606 Property – construction 141 154 Financial, investment and insurance 306 290 Government and public authorities 428 426 Other commercial and industrial 1,807 1,830 8,071 8,519

16
Risk management
Credit risk Distribution of loans and advances by credit quality
The distribution of loans and advances by credit risk categorisation is analysed below. As at 31 March 2018 Other (unaudited) Retail Credit retail Lease SME overdrafts cards lending Mortgages finance lending (1) Total £m £m £m £m £m £m £mGross loans and advances: Neither past due nor impaired 49 369 684 23,736 594 6,206 31,638Past due but not impaired 5 13 17 355 20 115 525Impaired - - - 48 - 114 162 54 382 701 24,139 614 6,435 32,325
As at 30 September 2017 Other (audited) Retail Credit retail Lease SME overdrafts cards lending Mortgages finance lending (1) Total £m £m £m £m £m £m £mGross loans and advances: Neither past due nor impaired 51 384 635 23,104 572 6,054 30,800 Past due but not impaired 7 12 16 327 22 129 513 Impaired - - - 49 - 126 175 58 396 651 23,480 594 6,309 31,488
(1) SME lending includes business overdrafts Loans and advances which were past due but not impaired
The distribution of loans and advances that are past due but not impaired is analysed below: As at 31 March 2018 Other (unaudited) Retail Credit retail Lease SME overdrafts cards lending Mortgages finance lending (1) Total £m £m £m £m £m £m £m1 to 29 DPD 4 7 6 158 19 60 254 30 to 59 DPD - 2 4 48 - 17 7160 to 89 DPD - 1 2 22 - 4 29 Past due 90 days and over 1 3 5 127 1 34 171 5 13 17 355 20 115 525 As at 30 September 2017 Other (audited) Retail Credit retail Lease SME overdrafts cards lending Mortgages finance lending (1) Total £m £m £m £m £m £m £m1 to 29 DPD 5 6 6 142 22 88 269 30 to 59 DPD 1 2 3 32 - 10 48 60 to 89 DPD - 1 2 30 - 2 35 Past due 90 days and over 1 3 5 123 - 29 161 7 12 16 327 22 129 513
(1)
SME lending includes business overdrafts
Credit risk categorisation Description Neither past due nor impaired Loans that are not in arrears and where there is no objective evidence of impairment
Past due but not impaired Loans that are in arrears but have not been individually assessed as impaired
Impaired Loans which have been individually assessed for impairment as there is objective evidence of impairment including changes in customer circumstances

17
Risk management
Credit risk Impairment provision Movements in impairment provisions throughout the period are as follows: As at 31 March 2018 Other (unaudited) Retail Credit retail Lease SME overdrafts cards lending Mortgages finance lending (1) Total £m £m £m £m £m £m £mOpening balance 4 7 12 33 2 152 210Charge for the period 2 4 7 1 1 7 22Amounts written off (2) (4) (7) (1) (1) (11) (26)Recoveries of amounts written off in previous years
1 1 - - - 3 5
Other (2) - - - - - - -
Closing balance 5 8 12 33 2 151 211 Specific - - - 12 - 42 54Collective 5 8 12 21 2 109 157 5 8 12 33 2 151 211 As at 30 September 2017 Other (audited) Retail Credit retail Lease SME overdrafts cards lending Mortgages finance lending (1) Total £m £m £m £m £m £m £mOpening balance 3 6 10 39 2 155 215Charge for the period 2 6 9 (2) - 33 48Amounts written off (4) (9) (13) (4) - (45) (75)Recoveries of amounts written off in previous years
3 4 6 - - 5 18
Other (2) - - - - - 4 4
Closing balance 4 7 12 33 2 152 210 Specific - - - 13 - 43 56Collective 4 7 12 20 2 109 154 4 7 12 33 2 152 210
(1) SME lending includes business overdrafts.
(2) Other includes the recognition of certain impaired loans which were previously recorded at fair value through profit or loss, the unwind of net present value elements of specific provisions and other minor movements.

18
Risk management
Credit risk Retail mortgage lending
The LTV ratio of Retail mortgage lending, coupled with the relationship of the debt to customers’ income, is key to the credit quality of these loans. The table below sets out the indexed LTV analysis of the Group’s Retail mortgage stock:
31 Mar 2018 30 Sep 2017
(unaudited) (audited)LTV (1) % %Less than 50% 31 33 50% to 75% 49 49 76% to 80% 9 7 81% to 85% 5 4 86% to 90% 4 4 91% to 95% 2 1 96% to 100% - - Greater than 100% - - Unknown - 2 100 100
(1) LTV of the mortgage portfolio is defined as mortgage portfolio weighted by balance and indexed using the MIAC Acadametrics indices at a given date. Unknown
represents loans where data is not currently available due to front book data matching still to be completed and a de minimis amount due to weaknesses in historic data capture processes.
The table below summarises the level of forbearance in respect of the Group’s Retail mortgage portfolio at each balance sheet date.
Retail forbearance
As at 31 March 2018 (unaudited) Impairment allowance on Retail Total Retail loans and advances loans and advances subject to subject to forbearance measures forbearance measures
Number ofloans
Gross carrying amount
% of total portfolio
Impairment allowance Coverage
£m £m %Formal arrangements 1,533 167 0.70 3.5 2.13Temporary arrangements 1,396 169 0.70 2.8 1.65Interest only conversion 221 32 0.13 0.1 0.31Term extension 157 13 0.05 0.1 0.49Other 33 3 0.01 - 0.47Legal 162 16 0.07 0.9 5.61 3,502 400 1.66 7.4 1.86

19
Risk management
Credit risk Retail forbearance (continued)
As at 30 September 2017 (audited) Impairment allowance on Retail Total Retail loans and advances loans and advances subject to subject to forbearance measures forbearance measures
Number ofloans
Gross carrying amount
% of totalportfolio
Impairment allowance Coverage
£m £m %Formal arrangements 1,614 164 0.69 3.9 2.43Temporary arrangements 1,418 174 0.74 3.0 1.72Interest only conversion 202 30 0.13 0.2 0.56Term extension 149 12 0.05 0.1 0.51Other 29 2 0.01 - 0.61Legal 167 16 0.07 0.9 5.66 3,579 398 1.69 8.1 2.04 The Group also has a number of customers with interest only mortgages past maturity, not subject to forbearance. The Group has formal processes embedded to proactively track and facilitate pre-maturity customer engagement to bring the cases to a formal conclusion which is generally aimed to be achieved within six months after the loan has reached maturity. Complex cases can take longer than this to reach conclusion. At 31 March 2018, the Group had 107 (30 September 2017: 97) customers with interest only mortgages not subject to forbearance and which were post six month maturity with a total value of £16m (30 September 2017: £14m).
A further forbearance reserve of £4m (30 September 2017: £4m) is presently held within the overall collective provision. The effect of this on the above tables would be to increase the impairment allowance noted above to £11m (30 September 2017: £12m) and to increase overall coverage to 2.86% (30 September 2017: 3.05%).
When all other avenues of resolution including forbearance have been explored the Group will take steps to repossess and sell underlying collateral. In the period to 31 March 2018, there were 16 repossessions (12 months to 30 September 2017: 50) of which 6 (12 months to 30 September 2017: 13) were voluntary. Unsecured consumer credit The Group exercises limited forbearance strategies in relation to other types of consumer credit, including current accounts, unsecured loans and credit cards. The Group has assessed the total loan balances subject to forbearance on other types of retail lending to be £11m at 31 March 2018 (30 September 2017: £11m), representing 1.01% of the unsecured retail portfolio (30 September 2017: 1.02%). Impairment provisions on forborne balances totalled £3.6m at 31 March 2018 (30 September 2017: £3.1m) providing overall coverage of 31.37% (30 September 2017: 27.18%).

20
Risk management
Credit risk SME lending Credit quality of loans and advances
The Group has an internally developed credit rating system (‘eCRS’) for SME lending, as defined under the Group's credit risk management policy, which uses data drawn from a number of sources to assess the potential risk in lending to the Group's customers. This system assigns an indication of the probability of default (‘PD’) for each customer and can be broadly mapped to external agencies' rating scales. Description eCRS PDSenior investment grade 1 to 5 0 < 0.11Investment grade 6 to 11 0.11 < 0.55Sub-investment grade 12 to 23 0.55 < 99.99 The credit quality of the portfolio of loans and advances that were neither past due nor impaired can be assessed by reference to the Group's standard credit rating system. The credit rating system is supported by a variety of financial analytics, combined with processed market information to provide the main inputs for the measurement of counterparty risk. All internal risk ratings are tailored to the various categories and are derived in accordance with the Group's ratings policy. The table below presents the credit quality of SME loans and advances that are neither past due nor impaired:
31 Mar 2018 30 Sep 2017(unaudited) (audited)
£m £mSenior investment grade 901 946 Investment grade 1,760 1,807 Sub-investment grade 4,139 3,873 6,800 6,626
The table below summarises the level of forbearance in respect of the Group’s SME portfolio at each balance sheet date.
SME forbearance
As at 31 March 2018 (unaudited) Impairment allowance on Total SME loans and advances SME loans and advances subject to subject to forbearance measures forbearance measures
Number ofloans
Gross carrying amount
% of total portfolio
Impairment allowance Coverage
£m £m %Term extension 180 191 2.56 12.5 6.55Deferral of contracted capital repayments 110 123 1.65 23.9 19.37Reduction in contracted interest rate 3 1 0.01 - 3.34Alternative forms of payment 4 26 0.34 7.0 27.02Debt forgiveness 3 11 0.15 1.5 13.64Refinancing 16 20 0.27 2.9 14.28Covenant breach/reset/waiver 55 165 2.21 7.2 4.35 371 537 7.19 55.0 10.24

21
Risk management
Credit risk
SME forbearance (continued)
As at 30 September 2017 (audited) Impairment allowance on Total SME loans and advances SME loans and advances subject to subject to forbearance measures forbearance measures
Number ofloans
Gross carrying amount
% of total portfolio
Impairment allowance Coverage
£m £m %Term extension 206 190 2.58 12.8 6.71Deferral of contracted capital repayments 109 141 1.91 20.4 14.47Reduction in contracted interest rate 3 1 0.02 - 3.37Alternative forms of payment 5 28 0.37 8.1 29.40Debt forgiveness 3 11 0.15 1.4 12.70Refinancing 19 33 0.44 4.4 13.41Covenant breach/reset/waiver 50 155 2.11 8.1 5.24 395 559 7.58 55.2 9.88 Included in other financial assets at fair value is a portfolio of loans that is included in the above table. The value of fair value loans subject to forbearance at 31 March 2018 is £41m (30 September 2017: £45m), representing 0.55% of the total SME portfolio (30 September 2017: 0.61%). Impairment allowances on these amounts totalled £3m (30 September 2017: £4m), a coverage of 6.68% (30 September 2017: 8.89%).

22
Risk management
Balance sheet and prudential regulation risk The key balance sheet risks include capital, liquidity and funding risks, market risk which in the case of the Group is non traded market risk (incorporating interest rate and foreign exchange risks), pension risk and non traded equity risk. These risks are subject to extensive regulation with ongoing changes in the regulatory environment expected to influence the risks and the Group’s management of them. Capital
Capital is held by the Group to protect its depositors, to cover inherent risks in a normal and stressed operating environment and to support the Group's strategy of sustainable growth. Capital risk is the risk that the Group has insufficient quantity or quality of capital to support its operations. Included in this section are certain Pillar 3 disclosures which the Group has assessed as requiring semi-annual disclosure.
Regulatory capital (unaudited)
31 Mar 2018 30 Sep 2017CET1 capital £m £mCapital instruments 89 88 Retained earnings and other reserves 2,721 2,854 Common Equity Tier 1 capital before regulatory adjustments 2,810 2,942 Common Equity Tier 1 capital: regulatory adjustments:Defined benefit pension fund assets (1) (144) (135)Prudent valuation adjustment (2) (3) (4)Intangible assets (3) (371) (339)Deferred tax asset relying on future profitability (4) (89) (28)Cash flow hedge reserve 43 1 Total regulatory adjustments to Common Equity Tier 1 (564) (505)Common Equity Tier 1 Capital 2,246 2,437 Tier 1 capital AT1 capital instruments 450 450 Total Tier 1 capital 2,696 2,887 Tier 2 capital Subordinated debt 474 474 Credit risk adjustments 157 154 Total Tier 2 capital 631 628 Total capital 3,327 3,515
(1) The defined benefit pension fund asset (net of deferred tax liabilities) does not qualify as capital for regulatory purposes.(2) A prudent valuation adjustment is applied in respect of fair valued instruments as required under regulatory capital rules.(3) Intangible assets shall be deducted from capital for regulatory purposes.(4) Under CRD IV, deferred tax assets that rely on future profitability are deducted from CET1 capital.
Reconciliation of statutory total equity to regulatory capital (unaudited) 31 Mar 2018 30 Sep 2017
£m £mStatutory total equity 3,270 3,402 Deductions from capital (518) (478)Deferred tax asset relying on future profitability (89) (28)Cash flow hedge reserve 43 1 Foreseeable AT1 dividends and charges (10) (10)Regulatory Tier 1 capital 2,696 2,887

23
Risk management
Balance sheet and prudential regulation risk Capital (continued)
Regulatory capital flow of funds (unaudited) 31 Mar 2018 30 Sep 2017 £m £mCET1 capital CET1 capital at 1 October 2,437 2,397 Share capital: issued under employee share schemes 1 -Retained earnings and other reserves (including structured entities) (133) 181 Prudent valuation adjustment 1 3 Intangible assets (32) (83)Deferred tax asset relying on future profitability (61) 7 Defined benefit pension fund assets (9) (135)Cash flow hedge reserve 42 67 2,246 2,437 Tier 1 capital Tier 1 capital at 1 October 450 450 450 450 Total Tier 1 capital 2,696 2,887 Tier 2 capital Tier 2 capital at 1 October 628 625 Credit risk adjustments 3 3 Total Tier 2 capital 631 628Total capital 3,327 3,515 31 Mar 2018 30 Sep 2017
Minimum Pillar 1 capital requirements (unaudited) £m £mCredit risk 1,445 1,420 Operational risk 130 130 Counterparty risk 10 11 Credit valuation adjustment 11 13 Tier 1 regulatory capital requirements 1,596 1,574 RWA movements 6 months to
31 Mar 2018 6 months to
31 Mar 2017RWA flow statement (unaudited) £m £mRWAs at 1 October 19,678 19,029 Book size growth 262 342 Book quality deterioration/(improvement) 3 (146)Methodology and policy 6 156 RWAs at 31 March 19,949 19,381

24
Risk management
Balance sheet and prudential regulation risk
Capital (continued)
Pillar 1 RWAs and capital requirements by business line At 31 Mar 2018 At 30 Sep 2017Capital requirements for calculating RWAs (unaudited) Capital
requiredRWA Exposure Capital
requiredRWA Exposure
£m £m £m £m £m £mCentral governments or central banks - - 10,292 - - 12,947Regional governments or local authorities 2 20 162 2 19 156Public sector entities - 1 148 - 5 155Multilateral development banks - - 205 - - 205Financial institutions 8 99 572 13 163 1,453Corporates 322 4,021 4,422 273 3,418 3,791Retail 88 1,104 1,472 72 905 1,207Secured by mortgages on immovable property 927 11,586 28,010 961 12,001 28,203Exposures in default 48 606 499 47 590 483Collective investments undertakings - 1 1 - 1 1Equity exposures - 5 4 - 5 3Items associated with particularly high risk 4 51 34 3 40 26Covered bonds 5 58 580 4 48 477Other items 41 511 596 45 557 585Total credit risk 1,445 18,063 46,997 1,420 17,752 49,692Operational risk 130 1,621 130 1,621Counterparty risk 10 121 11 138Credit valuation adjustment 11 144 13 167 1,596 19,949 1,574 19,678 The ‘Exposure’ amounts disclosed above are post credit conversion factors and pre credit risk mitigation. 31 Mar 2018 30 Sep 2017
Capital position and CET1 (unaudited) £m £mRWA(1) Retail mortgages 8,881 8,646 Business lending 7,523 7,359 Other retail lending 958 932 Other lending 112 148 Other(2) 589 667
Credit risk 18,063 17,752 Operational risk 1,621 1,621 Counterparty risk 121 138 Credit valuation adjustment 144 167 Total RWAs 19,949 19,678 Capital ratios CET1 ratio(3) 11.3% 12.4%Tier 1 ratio 13.5% 14.7%Total capital ratio 16.7% 17.9%
(1) RWAs are calculated under the standardised approach. (2) The items included in the ‘other’ exposure class that attract a capital charge include items in the course of collection, cash in hand, fixed assets and deferred tax assets
that are not deducted. (3) CET1 capital is comprised of shares issued and related share premium, retained earnings and other reserves less specified regulatory adjustments.

25
Risk management
Balance sheet and prudential regulation risk Capital (continued)
The Group measures the amount of capital it requires and holds by applying the Capital Requirements Directive and Regulation (CRD IV) as implemented in the UK by the PRA and supplemented through additional regulation under the PRA Rulebook. The table below summarises the amount of capital in relation to RWAs the Group is currently required to hold, excluding any PRA Buffer. These ratios apply at the consolidated Group level.
As at 31 Mar 2018 Minimum requirements CET1 Total CapitalPillar 1 (1) 4.5% 8.0%Pillar 2A (2) 2.5% 4.5%Individual capital guidance 7.0% 12.5%
Capital conservation buffer (3) 1.9% 1.9%UK countercyclical capital buffer (4) 0.0% 0.0%
Total (excluding PRA buffer) (5) 8.9% 14.4% (1) The minimum amount of total capital under Pillar 1 of the regulatory framework is determined as 8% of RWAs, of which at least 4.5% of RWAs is required to be covered
by CET1 capital. (2) Growth in RWAs has meant the Group’s Pillar 2A total capital requirement, as set by the PRA’s Individual Capital Guidance (ICG), has reduced from 4.6% to 4.5%. At
least 56.25% of this needs to be met with CET1, equating to approximately 2.5% of RWAs. (3) The capital conservation buffer (CCB) is being phased in over the period from 1 January 2016 to 1 January 2019. The CCB has been set a 2.5% of RWAs, with 1.875%
applicable for 2018. (4) The UK countercyclical capital buffer (CCyB) may be set between 0% and 2.5%. On 16 March 2018 the Financial Policy Committee (FPC) reaffirmed that is expects to
increase the UK CCyB from 0% to 0.5% from 27 June 2018 and to 1% from 28 November 2018. The FPC will reconsider the adequacy of the 1% UK CCyB rate in June 2018, with a particular focus on the evolution of domestic risk appetite.
(5) The Group may be subject to a PRA buffer as set by the PRA but is not permitted to disclose the level of any buffer. A PRA buffer can consist of two components: − A risk management and governance buffer that is set as a scalar of the Pillar 1 and Pillar 2A requirements. − A buffer relating to the results of the BoE stress tests.
Underlying capital generation was 27bps (before the net impact of charges associated with restructuring, separation from our former parent and legacy conduct issues). While the Group’s CET1 ratio of 11.3% is below our guidance range of 12-13%, we continue to maintain a significant buffer to our transitional CRD IV minimum requirement of 8.9%, being a buffer of £470m. The Group continues to progress its IRB application with the PRA and is confident of achieving accreditation for its mortgage portfolio within the next six months.
The Group is working towards implementation of the minimum requirement for own funds and eligible liabilities (MREL) on 1 January 2022. The BoE provided the Group’s MREL guidance, including transitional arrangements, in late 2016. An interim MREL requirement of 18% of RWAs has been set at the Group level from 1 January 2020 until 31 December 2021. The BoE will advise the Group on its ultimate MREL requirement in 2020. The Group’s inaugural £300m bail-in senior debt issuance in June 2017 marked an important first step to meeting this requirement, with further gradual senior issuance expected over the next 4 years.
The Basel Committee published their final Basel III framework in December 2017. A key objective of the revisions is to reduce excessive variability of RWAs and improve the comparability of banks’ capital ratios. Implementation dates range from 2022 to 2027 and the Committee has introduced transitional arrangements to ensure an orderly and timely implementation. The Group’s initial analysis suggests that the new requirements will not have a material impact on the total amount of capital it is required to hold.
26
Risk management
Balance sheet and prudential regulation risk Capital (continued)
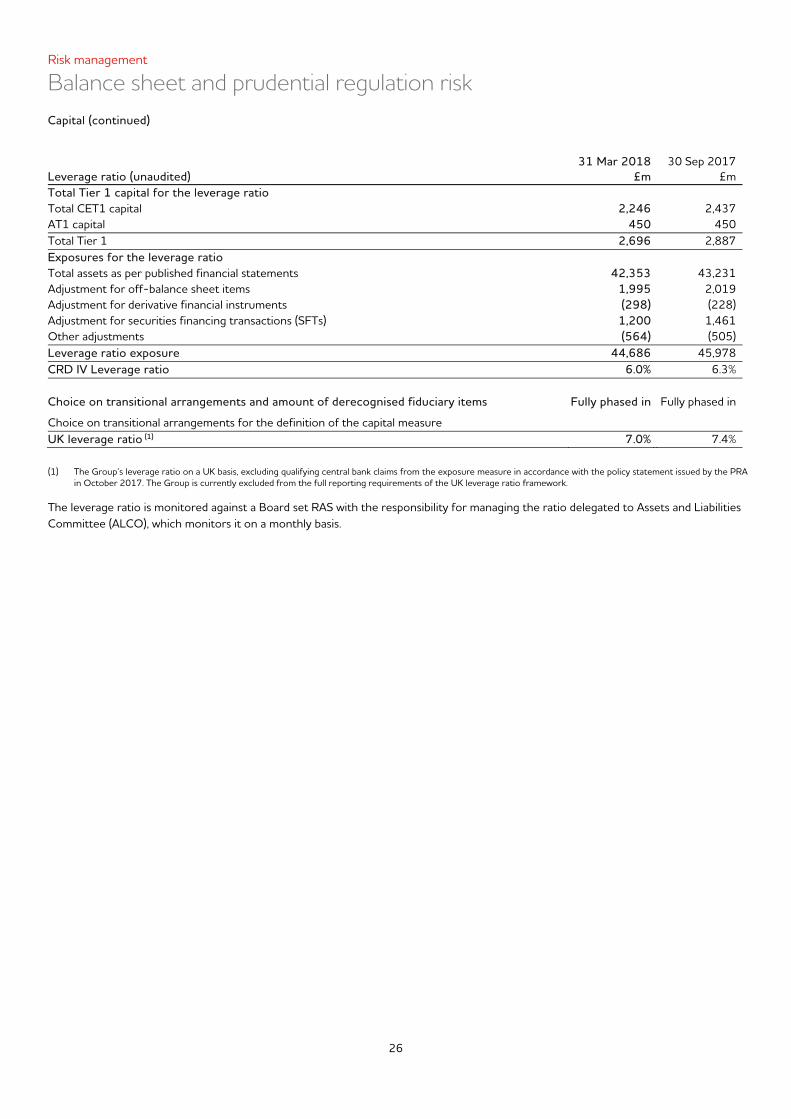
31 Mar 2018 30 Sep 2017Leverage ratio (unaudited) £m £mTotal Tier 1 capital for the leverage ratio Total CET1 capital 2,246 2,437 AT1 capital 450 450 Total Tier 1 2,696 2,887 Exposures for the leverage ratio Total assets as per published financial statements 42,353 43,231 Adjustment for off-balance sheet items 1,995 2,019 Adjustment for derivative financial instruments (298) (228)Adjustment for securities financing transactions (SFTs) 1,200 1,461 Other adjustments (564) (505)Leverage ratio exposure 44,686 45,978 CRD IV Leverage ratio 6.0% 6.3% Choice on transitional arrangements and amount of derecognised fiduciary items Fully phased in Fully phased in
Choice on transitional arrangements for the definition of the capital measure UK leverage ratio (1) 7.0% 7.4%
(1) The Group’s leverage ratio on a UK basis, excluding qualifying central bank claims from the exposure measure in accordance with the policy statement issued by the PRA
in October 2017. The Group is currently excluded from the full reporting requirements of the UK leverage ratio framework.
The leverage ratio is monitored against a Board set RAS with the responsibility for managing the ratio delegated to Assets and Liabilities Committee (ALCO), which monitors it on a monthly basis.

27
Risk management
Balance sheet and prudential regulation risk Funding and liquidity risk
Funding risk relates to the impact on the Group’s strategy of being unable to raise funds from customers and the wholesale markets of sufficient quantity and of appropriate mix and tenor. An inability to raise sufficient funds may lead to a reduction in lending growth or a requirement to raise the price paid for deposits, both outcomes having an adverse effect on shareholder value. Where funding risk manifests itself in an adverse effect on mix and tenor, for example a high proportion of short term wholesale deposits, there is an increased liquidity risk to the Group.
Liquidity risk is the risk that the Group is unable to meet its current and future financial obligations as they fall due at acceptable cost. These obligations include the repayment of deposits on demand or at their contractual maturity dates, the repayment of borrowings and loan capital as they mature, the payment of operating expenses and tax, the payment of dividends and the ability to fund new and existing loan commitments. External credit ratings The Group’s long-term credit ratings are summarised below: Outlook as at As at 31 Mar 2018 (1) 31 Mar 2018 30 Sep 2017CYBG PLC Fitch Stable BBB+ BBB+Standard & Poor’s Stable BBB- BBB-Clydesdale Bank PLC Fitch Stable BBB+ BBB+Standard & Poor's Stable BBB+ BBB+Moody's(2) Positive Baa1 Baa2
(1) For detailed background on the latest credit opinions, by S&P and Fitch, please refer to the respective rating agency websites. (2) Long-term deposit rating
On 7 December 2017, Moody’s upgraded the long-term deposit rating of Clydesdale Bank PLC by one notch to Baa1. This reflected Moody’s view on the improvement in the Bank’s management and risk and compliance frameworks, together with the delivery of the strategic plan and return to profitability. As part of the same rating action, Moody’s revised the outlook on Clydesdale Bank PLC’s long-term deposit rating to “positive” in anticipation of ongoing senior unsecured issuance from CYBG PLC to meet MREL. In November 2017, S&P revised their view of UK economic risk for the UK banking sector, which led to the outlooks for Clydesdale Bank PLC and CYBG PLC being revised from negative to stable. On 23 March 2018, S&P affirmed the ratings of Clydesdale Bank PLC and CYBG PLC, with a stable outlook. As at 14 May 2018, there have been no changes to the Group’s long-term credit ratings or outlooks since the report date. Liquid assets The quantity and quality of the Group’s liquid assets are calibrated to the Board’s view of liquidity risk appetite and remain at a prudent level above regulatory requirements. The Group was compliant with all internal and regulatory liquidity metrics at 31 March 2018.
The liquid asset portfolio provides a buffer against sudden and potentially sharp outflows of funds and liquid assets must therefore be of a high quality so they can be realised for cash and cannot be encumbered for any other purpose (e.g. to provide collateral for payments systems). Details on encumbered assets are provided in the following section.
The liquid asset portfolio is primarily comprised of cash at the BoE, UK Government Securities (Gilts) and listed securities (e.g. bonds issued by supra-nationals and AAA rated covered bonds).
31 Mar 2018 30 Sep 2017(unaudited) (audited)
Liquid asset portfolio £m £mCash and balances with central banks 3,459 4,367 UK government treasury bills and gilts 304 1,129 Other debt securities 959 829 4,722 6,325
Before investing in any security an assessment is completed for both the credit quality and the treatment for liquidity purposes. ALCO oversees the composition of the liquid asset portfolio.

28
Risk management
Balance sheet and prudential regulation risk Encumbered assets by asset category Examples of reasons for asset encumbrance include, among others, supporting the Group's secured funding programmes to provide stable term funding to the Group, use of assets as collateral for payments systems in order to support customer's transactional activity, and providing security for the Group's issuance of Scottish bank notes. The Group monitors the level of asset encumbrance to ensure an appropriate balance is maintained.
As at 31 March 2018
Assets encumbered with non-central bank counterparties Positioned at
the central bank (including
encumbered)£m
Other assets
Total£m
Assets not positioned at the central bank
Total£m
Readily available for
encumbrance£m
Other assets capable
of beingencumbered
£m
Cannot beencumbered
£m
Coveredbonds
£m
Securiti-sations
£mOther
£mTotal
£m
Cash and balances with central banks – – – – 2,904 3,246 - - 6,150 6,150Due from other banks 79 221 330 630 – - 200 - 200 830Investments – available for sale – – 23 23 47 1,272 - 10 1,329 1,352Other financial assets – – – – – - 421 - 421 421Derivatives – – – – – - - 334 334 334Loans and advances to customers 1,184 4,818 – 6,002 6,508 5,850 10,855 2,922 26,135 32,137Intangible assets – – – – – - - 371 371 371Deferred tax assets – – – – – - - 204 204 204Other assets – – – – – - 94 460 554 554Total assets 1,263 5,039 353 6,655 9,459 10,368 11,570 4,301 35,698 42,353
As at 30 September 2017
Assets encumbered with non-central bank counterparties Positioned at
the central bank (including
encumbered)£m
Other assets
Total£m
Assets not positioned at the central bank
Total£m
Readily available for
encumbrance£m
Other assets capable
of beingencumbered
£m
Cannot beencumbered
£m
Coveredbonds
£m
Securiti-sations
£mOther
£mTotal
£m
Cash and balances with central banks – – – – 2,850 4,087 – – 6,937 6,937Due from other banks 46 358 338 742 – – 432 – 432 1,174Investments – available for sale – – – – 95 1,971 – 10 2,076 2,076Other financial assets – – – – – – 477 – 477 477Derivatives – – – – – – – 282 282 282Loans and advances to customers 1,347 5,841 – 7,188 6,294 5,940 8,906 2,965 24,105 31,293Intangible assets – – – – – – – 339 339 339Deferred tax assets – – – – – – – 154 154 154Other assets – – – – – – 100 399 499 499Total assets 1,393 6,199 338 7,930 9,239 11,998 9,915 4,149 35,301 43,231

29
Statement of Directors’ responsibilities The Directors confirm that to the best of their knowledge these interim condensed consolidated financial statements have been prepared in accordance with International Accounting Standard 34, ‘Interim Financial Reporting’ (IAS 34) as adopted by the European Union and that the interim management report includes a fair review of the information required by DTR 4.2.7R and DTR 4.2.8R, namely: a) an indication of important events that have occurred during the six months ended 31 March 2018 and their impact on the
condensed consolidated interim financial statements and a description of the principal risks and uncertainties for the remaining six months of the financial year; and
b) material related party transactions in the six months ended 31 March 2018 and any material changes in the related party
transactions described in the last annual report of CYBG PLC.
Signed by order of the Board David Duffy Chief Executive Officer 14 May 2018

30
Independent review report to CYBG PLC Introduction We have been engaged by CYBG PLC to review the condensed set of financial statements in the interim financial report for the six months ended 31 March 2018 which comprises the interim condensed consolidated income statement, interim condensed consolidated statement of comprehensive income, interim condensed consolidated balance sheet, interim condensed consolidated statement of changes in equity, interim condensed consolidated statement of cash flows and the related explanatory notes 1.1 to 5.3. We have read the other information contained in the interim financial report and considered whether it contains any apparent misstatements or material inconsistencies with the information in the condensed set of financial statements. This report is made solely to the Company in accordance with guidance contained in International Standard on Review Engagements 2410 (UK and Ireland) "Review of Interim Financial Information Performed by the Independent Auditor of the Entity" issued by the Auditing Practices Board. To the fullest extent permitted by law, we do not accept or assume responsibility to anyone other than the Company, for our work, for this report, or for the conclusions we have formed. Directors' Responsibilities The interim financial report is the responsibility of, and has been approved by, the Directors. The Directors are responsible for preparing the interim financial report in accordance with International Accounting Standard 34, “Interim Financial Reporting,” as adopted by the European Union and the Disclosure and Transparency Rules of the United Kingdom's Financial Conduct Authority. As disclosed in Section 1, the annual financial statements of the Group are prepared in accordance with International Financial Reporting Standards as adopted by the European Union. The condensed set of financial statements included in this interim financial report has been prepared in accordance with International Accounting Standard 34, "Interim Financial Reporting", as adopted by the European Union. Our Responsibility Our responsibility is to express to CYBG PLC a conclusion on the condensed set of financial statements in the interim financial report based on our review. Scope of Review We conducted our review in accordance with International Standard on Review Engagements 2410 (UK and Ireland), "Review of Interim Financial Information Performed by the Independent Auditor of the Entity" issued by the Auditing Practices Board for use in the United Kingdom. A review of interim financial information consists of making enquiries, primarily of persons responsible for financial and accounting matters, and applying analytical and other review procedures. A review is substantially less in scope than an audit conducted in accordance with International Standards on Auditing (UK and Ireland) and consequently does not enable us to obtain assurance that we would become aware of all significant matters that might be identified in an audit. Accordingly, we do not express an audit opinion. Conclusion Based on our review, nothing has come to our attention that causes us to believe that the condensed set of financial statements in the interim financial report for the six months ended 31 March 2018 is not prepared, in all material respects, in accordance with International Accounting Standard 34 as adopted by the European Union and the Disclosure and Transparency Rules of the United Kingdom's Financial Conduct Authority. Ernst & Young LLP Leeds 14 May 2018

31
Financial statements Interim condensed consolidated income statement 6 months to 6 months to 12 months to 31 Mar 2018 31 Mar 2017 30 Sep 2017 (unaudited) (unaudited) (audited) Note £m £m £mInterest income and similar income 552 534 1,075Interest expense and similar charges (126) (123) (231)Net interest income 2.2 426 411 844Gains less losses on financial instruments at fair value 1 3 6Other operating income 76 83 186Non interest income 2.3 77 86 192Total operating income 503 497 1,036Total operating and administrative expenses before impairment losses 2.4 (576) (425) (720)Operating (loss)/profit before impairment losses (73) 72 316Impairment losses on credit exposures (22) (26) (48)(Loss)/profit on ordinary activities before tax (95) 46 268Tax credit/(expense) 2.5 19 (16) (86)(Loss)/profit for the period (76) 30 182(Loss)/profit attributable to ordinary shareholders (94) 12 146Profit attributable to other equity holders 18 18 36(Loss)/profit for the period attributable to equity holders (76) 30 182 Basic (loss)/earnings per share (pence) 2.6 (10.2) 1.7 17.3Diluted (loss)/earnings per share (pence) 2.6 (10.2) 1.7 17.2 All material items dealt with in arriving at the (loss)/profit before tax for the period relate to continuing activities. The notes on pages 36 to 57 form an integral part of these interim condensed consolidated financial statements.

32
Financial statements Interim condensed consolidated statement of comprehensive income
6 months to 6 months to 12 months to31 Mar 2018 31 Mar 2017 30 Sep 2017
(unaudited) (unaudited) (audited)£m £m £m
(Loss)/profit for the period (76) 30 182
Items that may be reclassified to the income statementChange in cash flow hedge reserve Losses during the period (56) (40) (84)Transfers from/(to) the income statement 1 (1) (4)Taxation thereon 13 9 21
(42) (32) (67)Change in available for sale reserve Gains/(losses) during the period 2 5 (7)Transfers to the income statement - - (20)Taxation thereon (1) (1) 7
1 4 (20)
Total items that may be reclassified to the income statement (41) (28) (87)
Items that will not be reclassified to the income statementRemeasurement of defined benefit pension plans 3 61 154 Taxation thereon (1) (13) (35)
2 48 119
Total items that will not be reclassified to the income statement 2 48 119 Other comprehensive (losses)/income net of tax (39) 20 32
Total comprehensive (losses)/income for the period net of tax (115) 50 214
Total comprehensive (losses)/income attributable to ordinary shareholders (133) 32 178 Total comprehensive income attributable to other equity holders 18 18 36 Total comprehensive (losses)/income attributable to equity holders (115) 50 214
The notes on pages 36 to 57 form an integral part of these interim condensed consolidated financial statements.
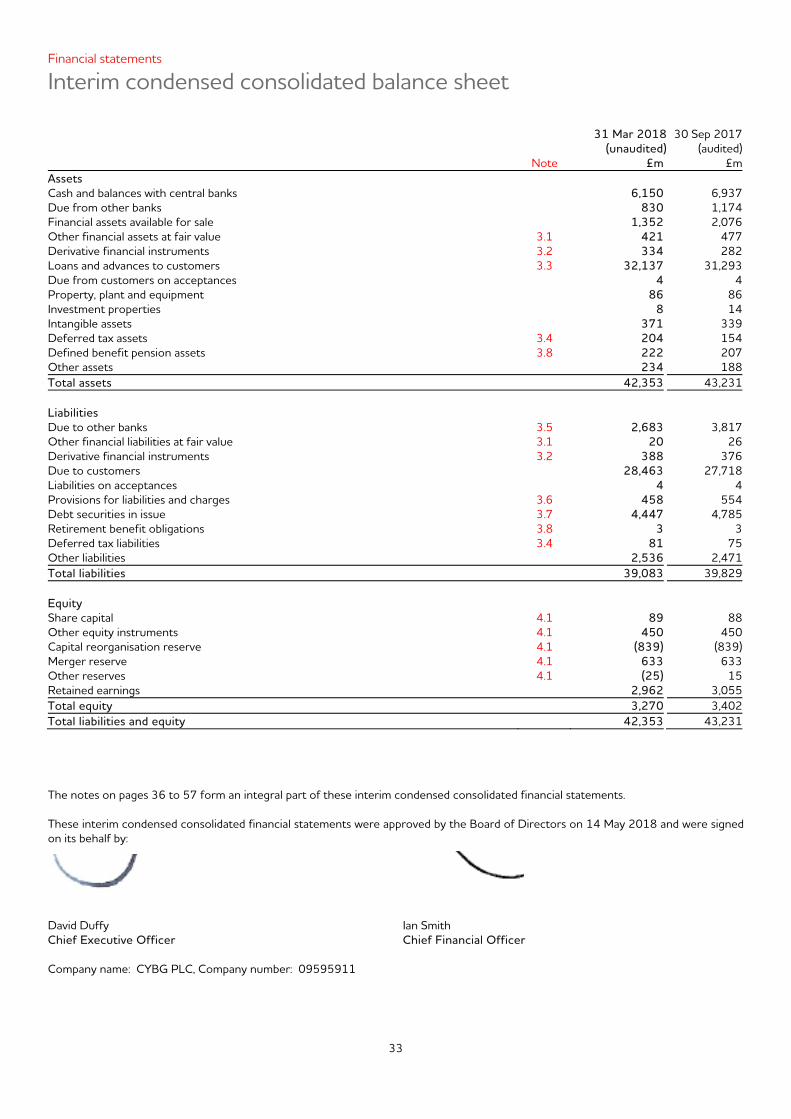
33
Financial statements Interim condensed consolidated balance sheet 31 Mar 2018 30 Sep 2017 (unaudited) (audited) Note £m £mAssets Cash and balances with central banks 6,150 6,937 Due from other banks 830 1,174 Financial assets available for sale 1,352 2,076 Other financial assets at fair value 3.1 421 477 Derivative financial instruments 3.2 334 282 Loans and advances to customers 3.3 32,137 31,293 Due from customers on acceptances 4 4 Property, plant and equipment 86 86 Investment properties 8 14 Intangible assets 371 339 Deferred tax assets 3.4 204 154 Defined benefit pension assets 3.8 222 207 Other assets 234 188 Total assets 42,353 43,231
Liabilities Due to other banks 3.5 2,683 3,817 Other financial liabilities at fair value 3.1 20 26 Derivative financial instruments 3.2 388 376 Due to customers 28,463 27,718 Liabilities on acceptances 4 4 Provisions for liabilities and charges 3.6 458 554 Debt securities in issue 3.7 4,447 4,785 Retirement benefit obligations 3.8 3 3 Deferred tax liabilities 3.4 81 75 Other liabilities 2,536 2,471 Total liabilities 39,083 39,829
Equity Share capital 4.1 89 88 Other equity instruments 4.1 450 450 Capital reorganisation reserve 4.1 (839) (839)Merger reserve 4.1 633 633 Other reserves 4.1 (25) 15 Retained earnings 2,962 3,055 Total equity 3,270 3,402 Total liabilities and equity 42,353 43,231 The notes on pages 36 to 57 form an integral part of these interim condensed consolidated financial statements. These interim condensed consolidated financial statements were approved by the Board of Directors on 14 May 2018 and were signed on its behalf by: David Duffy Ian SmithChief Executive Officer Chief Financial Officer Company name: CYBG PLC, Company number: 09595911

34
Financial statements Interim condensed consolidated statement of changes in equity
Other reserves Capital Other Equity based Asset Available Cash flow
Share reorganisation Merger equity compensation revaluation for sale hedge Retained Totalcapital reserve reserve instruments reserve reserve reserve reserve earnings equity
Note £m £m £m £m £m £m £m £m £m £m
At 1 October 2016 (audited) (1) 88 (839) 633 450 6 1 27 66 2,779 3,211Profit for the period - - - - - - - - 30 30Other comprehensive income/(losses) net of tax - - - - - - 4 (32) 48 20Total comprehensive income/(losses) for the period - - - - - - 4 (32) 78 50AT1 distributions paid (net of tax) - - - - - - - - (15) (15)Transfer from equity-based compensation reserve - - - - (1) - - - 1 -Equity-based compensation expensed - - - - 3 - - - - 3At 31 March 2017 (unaudited) 88 (839) 633 450 8 1 31 34 2,843 3,249Profit for the period - - - - - - - - 152 152Other comprehensive income/(losses) net of tax - - - - - - (24) (35) 71 12Total comprehensive income/(losses) for the period - - - - - - (24) (35) 223 164AT1 distributions paid (net of tax) - - - - - - - - (14) (14)Transfer from equity-based compensation reserve - - - - (3) - - - 3 -Equity based compensation expensed - - - - 3 - - - - 3At 30 September 2017 (audited)(1) 4.1 88 (839) 633 450 8 1 7 (1) 3,055 3,402Loss for the period - - - - - - - - (76) (76)Other comprehensive income/(losses) net of tax - - - - - - 1 (42) 2 (39)Total comprehensive income/(losses) for the period - - - - - - 1 (42) (74) 115Dividends paid to ordinary shareholders - - - - - - - - (9) (9)AT1 distributions paid (net of tax) - - - - - - - - (15) (15)Transfer from equity based compensation reserve - - - - (5) - - - 5 -Ordinary shares issued 1 - - - - - - - - 1Equity based compensation expensed - - - - 6 - - - - 6At 31 March 2018 (unaudited) 4.1 89 (839) 633 450 9 1 8 (43) 2,962 3,270
(1) The balances as at 1 October 2016 and 30 September 2017 have been audited; the movements in the individual six months periods to 31 March 2017 and 31 March 2018 are unaudited.
The notes on pages 36 to 57 form an integral part of these interim condensed consolidated financial statements.

35
Financial statements
Interim condensed consolidated statement of cash flows 6 months to 6 months to 12 months to 31 Mar 2018 31 Mar 2017 30 Sep 2017 (unaudited) (unaudited) (audited) £m £m £mOperating activities (Loss)/profit on ordinary activities before tax (95) 46 268 Adjustments for: Non-cash or non-operating items included in profit before tax (356) (340) (728)Changes in operating assets (605) (614) (1,857)Changes in operating liabilities (793) 744 919Interest received 568 520 1,123Interest paid (84) (134) (258)Tax received - group relief - - 1Net cash (used in)/provided by operating activities (1,365) 222 (532) Cash flows from investing activities Interest received 6 5 11Proceeds from maturity of available for sale investments 50 20 20Proceeds from sale of available for sale investments 821 - 60Purchase of available for sale investments (178) (350) (492)Proceeds from sale of tangible fixed assets(1) 6 6 19Purchase of tangible fixed assets(1) (10) (8) (21)Purchase and development of intangible assets (67) (72) (148)Net cash provided by/(used in) investing activities 628 (399) (551) Cash flows from financing activities Interest received 1 - 3Interest paid (45) (44) (90)Redemption and principal repayment on residential mortgage backed securities and covered bonds (838) (297) (740)Issuance of residential mortgage backed securities and covered bonds 496 - 750Issuance of medium-term notes/subordinated debt - - 298Amounts drawn down under the TFS 1,250 - 1,900Amounts repaid under the TFS (700) - -Amounts matured under the TFS (200) - -Ordinary dividends paid (9) - -AT1 distributions (18) (18) (36)Net cash (used in)/provided by financing activities (63) (359) 2,085 Net (decrease)/increase in cash and cash equivalents (800) (536) 1,002Cash and cash equivalents at the beginning of the period 6,952 5,950 5,950Cash and cash equivalents at the end of the period(2) 6,152 5,414 6,952
The notes on pages 36 to 57 form an integral part of these interim condensed consolidated financial statements.
(1) Tangible fixed assets include property, plant and equipment, investment properties and property inventory(2) Cash and cash equivalents is cash and balances with central banks less mandatory deposits plus cash equivalents within other assets, less due to other banks, and other
liabilities.

36
Financial statements
Notes to the interim condensed consolidated financial statements
Section 1: Basis of preparation and accounting policies Overview These interim condensed consolidated financial statements for the six months ended 31 March 2018 have been prepared in accordance with the Disclosure and Transparency Rules of the Financial Conduct Authority and IAS 34 ‘Interim Financial Reporting’ as adopted by the European Union (EU). They do not include all the information required by International Financial Reporting Standards (IFRS) in full annual financial statements and should therefore be read in conjunction with the annual report and accounts for the year ended 30 September 2017, which were prepared in accordance with IFRS as adopted by the EU. Copies of the 2017 annual report and accounts are available from the Group’s website - http://www.cybg.com/annual-results-2017/
The information in these interim condensed consolidated financial statements is unaudited and does not constitute annual accounts within the meaning of Section 434 of the Companies Act 2006 (‘the Act’). Statutory accounts for the year ended 30 September 2017 have been delivered to the Registrar of Companies and contained an unqualified audit report under Section 495 of the Act, which did not draw attention to any matters by way of emphasis and they did not contain any statements under Section 498 of the Act. 1.1 Going concern The Group's business activities, together with the factors likely to affect its future development, performance and position are set out in the business and financial review section of these interim condensed consolidated financial statements. This should be read in conjunction with the strategic report which can be found in the annual report and accounts for the year ended 30 September 2017. In addition, the risk report contained in the 2017 annual report includes the Group's risk management objectives. The Group’s objectives, policies and processes for managing capital can be found in the risk management section of this report.
The Directors have a reasonable expectation that the Group has adequate resources to continue in operational existence for the foreseeable future and therefore believe that the Group is well placed to manage its business risks successfully. Accordingly, they continue to adopt the going concern basis in preparing these interim condensed consolidated financial statements. 1.2 Accounting policies The accounting policies adopted in the preparation of these interim condensed consolidated financial statements are consistent with, and are a continuation of, those policies followed in the preparation of the CYBG PLC annual report and accounts for the year ended 30 September 2017. Comparatives are presented on a basis that conforms to the current presentation. 1.3 Critical accounting estimates and judgements The preparation of financial statements requires the use of certain critical accounting estimates and judgements that affect the reported amounts of assets, liabilities, revenues and expenses and the disclosed amounts of contingent liabilities. Assumptions made at each balance sheet date are based on best estimates at that date. Although the Group has internal control systems in place to ensure that best estimates can be reliably measured, actual amounts may differ from those estimated. There have been no significant changes in the basis upon which the critical accounting estimates and judgements as disclosed in note 1.8 of the 2017 annual report and accounts have been determined in relation to these interim condensed consolidated financial statements. 1.4 Accounting developments The Group has adopted the following IASB pronouncements in the current financial period. These do not have a material impact on the interim condensed consolidated financial statements:
Amendments to IAS 12: ‘Recognition of Deferred Tax Assets for Unrealised Losses’, issued in January 2016 and effective for financial years beginning on or after 1 January 2017. The amendments clarify the requirements on the recognition of deferred tax assets for unrealised losses.
Amendments to IAS 7: ‘Disclosure initiative, issued in January 2016 and effective for financial years beginning on or after 1 January 2017. The amendments to IAS 7: ‘Statement of Cash Flows’ require disclosures that enable users of the financial statements to evaluate changes in liabilities arising from an entity’s financing activities.
An overview of pronouncements that are relevant to the Group in future periods is provided on pages 193 to 195 of the 2017 annual report and accounts. Updates on the Group’s implementation progress on IFRS 9, IFRS 15 and IFRS 16 are provided separately. During the period, the IASB has issued the following further pronouncements which are relevant to the Group and are currently being impact assessed:
‘Annual Improvements to IFRS Standards 2015-2017 Cycle’, issued December 2017 and effective for financial years beginning on or after 1 January 2019. The IASB has made amendments to the following Standards: IFRS 3: ‘Business Combinations’; IFRS 11 ‘Joint Arrangements’, IAS 12 ‘Income Taxes’, and IAS 23: 'Borrowing Costs’.

37
Financial statements
Notes to the interim condensed consolidated financial statements
Section 1: Basis of preparation and accounting policies (continued)
‘Amendments to IAS 19 – plan amendment, curtailment or settlement’ issued February 2018 and effective prospectively for financial years beginning on or after 1 January 2019.
Updates on the implementation of IFRS 9: 'Financial Instruments', IFRS 15 ‘Revenue from Contracts with Customers’, and IFRS 16 ‘Leases’: IFRS 9 IFRS 9: ‘Financial Instruments’ will be implemented by the Group with effect from 1 October 2018, in line with the Standard’s requirements of applying for financial periods beginning on or after 1 January 2018. Classification and measurement IFRS 9 makes changes to the measurement categories for financial assets, with the current categories of available for sale and held to maturity no longer being available. The measurement categories available under IFRS 9 are amortised cost, fair value through other comprehensive income (FVOCI) and fair value through profit or loss (FVTPL). Assessments of the business model under which the financial asset is held and whether or not the contractual cash flows represent solely payments of principal and interest (SPPI) will determine which category a financial asset is classified under. A financial asset which is held in a ‘hold to collect’ business model and which passes the SPPI test, for example, will be held at amortised cost. The FVTPL category is similar to that under IAS 39, with the addition that financial assets not held in a ‘hold to collect’ or ‘hold to collect and sell’ business model will be held at FVTPL. Financial assets that fail the SPPI test will also be held at FVTPL. The Group anticipates the classification and measurement requirements of IFRS 9 will have a minimal impact, with the majority of the Group’s financial assets likely to remain at amortised cost. Impairment IFRS 9 utilises a single impairment model for financial assets held at amortised cost and FVOCI, which is based on an expected credit loss (ECL) methodology as opposed to the incurred loss methodology that currently exists under IAS 39. Where a financial asset has not experienced a significant increase in credit risk since origination, a 12 month (Stage 1) ECL will be calculated. Where a financial asset has experienced a significant increase in credit risk since origination, a lifetime (Stage 2) ECL calculation is required. Where a financial asset is credit-impaired, this will also require a lifetime (Stage 3) ECL calculation. In arriving at the relevant ECL (either 12 month or lifetime), IFRS 9 requires it to be calculated incorporating forward looking information, which takes into account future economic conditions in a multiple scenario and probability weighted approach. The move to an ECL methodology is the most significant change introduced by IFRS 9 which will impact on the Group’s results. Parallel run activities commenced in the first half of the year, with the model methodology and outputs subject to further review and refinement for the remainder of the parallel run period. A quantitative impact assessment of the ECL methodology will be available when the Group’s results for the year ending 30 September 2018 are announced in November 2018. By this time, the parallel run period will have completed and the Group will be in a position to provide an assessment of the impact of the ECL methodology on the Group’s results. Hedging As previously disclosed, the Group will exercise the accounting policy choice to continue to follow the hedge accounting requirements of IAS 39 until such time as the IASB has concluded on its approach to macro-hedging. Transition On implementation, the Group will not provide a full restatement of comparatives but will instead reflect changes through retained earnings, as permitted by IFRS 9. Impact on regulatory capital The Group acknowledges the transitional capital rules which were finalised by the EU in December 2017, and will exercise the option to adopt the transitional capital rules. The regulator has been notified of the Group’s decision. IFRS 15 IFRS 15 was issued in May 2014 and endorsed for use in the EU in September 2016. It is effective for financial years beginning on or after 1 January 2018, and will be adopted by the Group with effect from 1 October 2018. The core principle of IFRS 15 is that revenue reflects the transfer of goods or services to customers in an amount that reflects the consideration to which an entity expects to be entitled. The standard provides a principles based five step model for recognition.

38
Financial statements
Notes to the interim condensed consolidated financial statements
Section 1: Basis of preparation and accounting policies (continued) The majority of the Group's revenue is in the form of interest income from financial instruments which is not in scope for IFRS 15. Interest income from lease contracts is also not in scope. Fees and commissions together with certain elements of non interest income do fall within the scope of the standard. The Group continues to assess the related performance obligations to identify any fees or commissions that may require a change in recognition. Indications from work completed to date suggest that the standard is not expected to have a significant impact on the Group's results. Upon transition, any adjustments can be recognised either retrospectively to each prior reporting period presented (‘full retrospective’ approach), or retrospectively with the cumulative effect of initially applying the standard recognised at the date of initial application as an adjustment to the opening balance of retained earnings (‘modified retrospective’ approach). The Group anticipates adopting the modified retrospective approach to transition. IFRS 16 IFRS 16 was issued in January 2016 and endorsed for use in the EU. It is effective for financial years beginning on or after 1 January 2019, and will be adopted by the Group with effect from 1 October 2019. For lessees, operating leases will be brought onto the Group’s balance sheet with an asset recognised for the contractual ‘right of use’ and a financial liability recognised for the contractual payments. This change will mainly impact the properties that the Group currently accounts for as operating leases. An implementation plan is in place and the Group is currently undertaking a review of its lease agreements. There are no substantial changes to the accounting for leases by lessors, nor for finance leases. Further updates on the Group’s implementation progress on the above Standards will be provided in the annual report and accounts for the year ending 30 September 2018. 1.5 Presentation of risk disclosures Certain disclosures outlined in IFRS 7 ‘Financial Instruments: Disclosure’ concerning the nature and extent of risks relating to financial instruments have been included within the risk management section of this report.

39
Financial statements
Notes to the interim condensed consolidated financial statements
Section 2: Results for the period
2.1 Segment information The Group’s operating segments are operating units engaged in providing different products or services and whose operating results and overall performance are regularly reviewed by the Group’s Chief Operating Decision Maker, the Executive Leadership Team.
The Group’s business is organised into two principal operating segments: SME banking and Retail banking. In addition, Central Functions consist of the Group’s back office support functions.
SME banking The Group’s established regional SME franchise offers a full range of banking products and services to meet business customers’ banking needs across its small business, commercial, corporate & structured finance segments.
The Group’s SME franchise comprises small businesses (which the Group defines as businesses with lending of up to £0.5m but less than £2.0m in turnover) and medium businesses (which the Group defines as businesses with lending of more than £0.5m and greater than £2.0m in turnover).
Through its SME franchise, the Group offers a full range of lending products and services across a portfolio consisting of term lending, overdrafts and working capital solutions:
term lending: the Group offers a wide variety of term loans, both secured and unsecured, and offers customers a range of repayment and interest rate options. The majority of the Group’s business term lending is LIBOR based;
overdrafts: business overdrafts are the primary type of revolving variable rate credit facility offered by the Group to business customers;
invoice finance: the Group advances funds against the customer’s trade receivables; asset finance: these products provide a method of financing capital equipment purchases; international trade services: these products facilitate transactions between a buyer and seller located in different countries. The
Group offers import loans, export loans, documentary collections and currency guarantees, together with letters of credit for securing trade; and
business current accounts: the Group provides business customers day to day banking, current account facilities (including debit cards, cheque books, regular statements, direct debits and standing orders), and online banking.
Retail banking The Group has a comprehensive regional and national retail banking product proposition comprising:
personal current accounts (PCA): the Group offers a full range of PCAs, including, for example, B, a digital proposition, together with a packaged bank account and a basic bank account;
savings accounts: the Group offers a variety of savings accounts that pay a variable rate of interest. It also offers cash ISAs that provide depositors tax free returns;
term deposits: offer a fixed interest rate for a fixed term; mortgages: the Group provides mortgage loans on a capital repayment basis, where the loan is required to be repaid during its life,
and on an interest-only basis, where the customer pays interest during the term of the mortgage loan with the principal balance required to be repaid in full at maturity. The Group offers both owner occupied mortgage loans and BTL loans;
personal loans: the Group provides unsecured personal loans through its branch network and through its digital and telephone distribution channels;
credit cards: the Group currently offers four credit card products; Private MasterCard, Business MasterCard, Gold MasterCard and B MasterCard; and
overdrafts: the Group provides overdraft lending across a variety of PCA products, subject to the account holder’s status; and introductions to insurance and investment products through its branch network.

40
Financial statements
Notes to the interim condensed consolidated financial statements
Section 2: Results for the period (continued)
2.1 Segment information (continued) Operating segments SME Retail Central6 months ended 31 March 2018 banking banking functions Other(1) Total(unaudited) £m £m £m £m £mNet interest income 127 321 (22) - 426 Non interest income 37 50 (10) - 77 Total operating income 164 371 (32) - 503 Operating and administrative expenses (32) (47) (244) (253) (576)Impairment losses on credit exposures(2) (10) (12) ‐ - (22)Segment operating profit/(loss) before tax 122 312 (276) (253) (95)Average interest earning assets(3) 9,911 22,456 6,936 - 39,303 Operating segments(4) SME Retail Central6 months ended 31 March 2017 banking banking functions Other(1) Total(unaudited) £m £m £m £m £mNet interest income 123 312 (24) - 411 Non interest income 42 49 (5) - 86 Total operating income 165 361 (29) - 497 Operating and administrative expenses (29) (53) (266) (77) (425)Impairment losses on credit exposures(2) (15) (11) - - (26)Segment operating profit/(loss) before tax 121 297 (295) (77) 46 Average interest earning assets(3) 10,290 19,959 6,714 - 36,963 Operating segments SME Retail Central12 months ended 30 September 2017 banking banking functions Other(1) Total(audited) £m £m £m £m £mNet interest income 251 644 (51) - 844 Non interest income 83 100 (11) 20 192 Total operating income 334 744 (62) 20 1,036 Operating and administrative expenses (61) (97) (517) (45) (720)Impairment losses on credit exposures(2) (33) (15) - - (48)Segment operating profit/(loss) before tax 240 632 (579) (25) 268 Average interest earning assets(3) 10,154 20,577 6,966 - 37,697
(1) ‘Other’ reflects underlying adjustments to the statutory view of performance and is therefore not recharged to the Group’s two principal operating segments, such asconduct related provisions and restructuring costs. For a breakdown of the items included in this category, refer to ‘Measuring financial performance – glossary’.
(2) The impairment losses on credit exposures of £12m (31 March 2017: £11m and 30 September 2017: £15m) for Retail Banking include losses on certain retail productsattributable to SME (private banking) customers.
(3) Average interest earning assets for SME Banking include £2.5bn (31 March 2017: £3.2bn and 30 September 2017: £2.9bn) of mortgages originated by private banking(4) Comparative disclosures have been amended to conform with the current period’s presentation.
Liabilities are managed on a centralised basis and therefore are not disclosed by segment.
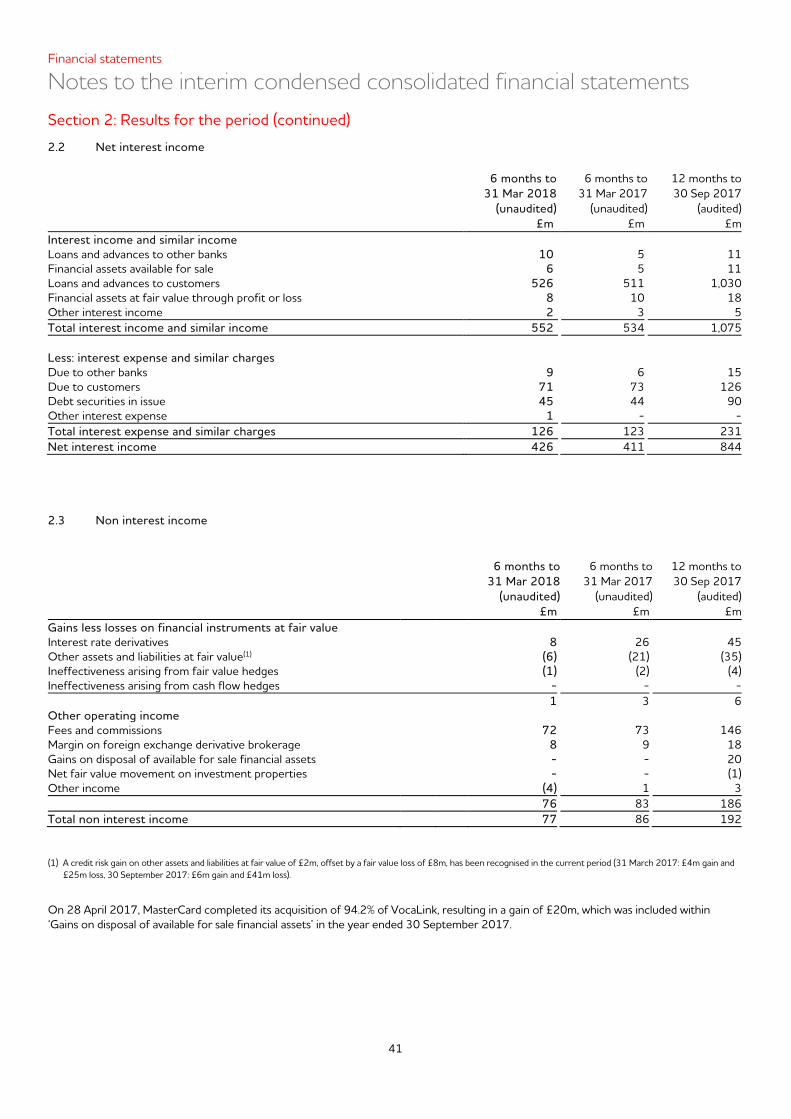
41
Financial statements
Notes to the interim condensed consolidated financial statements
Section 2: Results for the period (continued)
2.2 Net interest income 6 months to 6 months to 12 months to 31 Mar 2018 31 Mar 2017 30 Sep 2017 (unaudited) (unaudited) (audited) £m £m £mInterest income and similar income Loans and advances to other banks 10 5 11Financial assets available for sale 6 5 11Loans and advances to customers 526 511 1,030Financial assets at fair value through profit or loss 8 10 18Other interest income 2 3 5Total interest income and similar income 552 534 1,075 Less: interest expense and similar charges Due to other banks 9 6 15Due to customers 71 73 126Debt securities in issue 45 44 90Other interest expense 1 - -Total interest expense and similar charges 126 123 231Net interest income 426 411 844 2.3 Non interest income
6 months to 6 months to 12 months to31 Mar 2018 31 Mar 2017 30 Sep 2017
(unaudited) (unaudited) (audited) £m £m £mGains less losses on financial instruments at fair value Interest rate derivatives 8 26 45 Other assets and liabilities at fair value(1) (6) (21) (35)Ineffectiveness arising from fair value hedges (1) (2) (4)Ineffectiveness arising from cash flow hedges - - - 1 3 6 Other operating income Fees and commissions 72 73 146 Margin on foreign exchange derivative brokerage 8 9 18 Gains on disposal of available for sale financial assets - - 20 Net fair value movement on investment properties - - (1)Other income (4) 1 3 76 83 186 Total non interest income 77 86 192 (1) A credit risk gain on other assets and liabilities at fair value of £2m, offset by a fair value loss of £8m, has been recognised in the current period (31 March 2017: £4m gain and
£25m loss, 30 September 2017: £6m gain and £41m loss).
On 28 April 2017, MasterCard completed its acquisition of 94.2% of VocaLink, resulting in a gain of £20m, which was included within ‘Gains on disposal of available for sale financial assets’ in the year ended 30 September 2017.

42
Financial statements
Notes to the interim condensed consolidated financial statements
Section 2: Results for the period (continued)
2.4 Operating and administrative expenses
6 months to 6 months to 12 months to31 Mar 2018 31 Mar 2017 30 Sep 2017
(unaudited) (unaudited) (audited) £m £m £mPersonnel expenses 113 135 166 Restructuring and related expense (note 3.6) 24 53 67 RBS alternative remedies package spend 5 - -Depreciation and amortisation expense 43 42 87 Other operating and administrative expenses 391 195 400 Total operating and administrative expenses 576 425 720 Personnel expenses comprise the following items: 6 months to 6 months to 12 months to 31 Mar 2018 31 Mar 2017 30 Sep 2017 (unaudited) (unaudited) (audited) £m £m £mSalaries, wages and non-cash benefits and social security costs 67 93 171 Defined contribution pension expense 19 8 19 Defined benefit pension expense/(income) 1 20 (54)Equity based compensation 6 3 6 Other personnel expenses 20 11 24 Personnel expenses 113 135 166
In the six months to September 2017, the Group recognised gains in relation to its defined benefit pension scheme. A past service credit of £88m was included in personnel expenses as a result of the closure of the Scheme to future accrual for the majority of members. In addition, a curtailment gain of £13m was recognised in respect of redundancies which did not attract an enhancement entitlement and offsets against the related restructuring costs.
Other items of significance to the Group which are included within operating and administrative expenses are: 6 months to 6 months to 12 months to 31 Mar 2018 31 Mar 2017 30 Sep 2017 (unaudited) (unaudited) (audited) £m £m £mOperating lease charges 14 16 29 PPI redress expense (note 3.6) 202 15 48 Other conduct expenses (note 3.6) 18 4 10 Separation costs 4 5 8
2.5 Taxation
6 months to 6 months to 12 months to31 Mar 2018 31 Mar 2017 30 Sep 2017
(unaudited) (unaudited) (audited) £m £m £mCurrent tax Current year 4 4 17 Adjustment in respect of prior years 10 - - 14 4 17 Deferred tax (note 3.4) Current year 3 8 64 Adjustment in respect of prior years (36) 4 5 (33) 12 69 Tax (credit)/expense for the year (19) 16 86

43
Financial statements
Notes to the interim condensed consolidated financial statements
Section 2: Results for the period (continued)
2.5 Taxation (continued) The tax assessed for the period differs from that arising from applying the expected rate of corporation tax in the UK (19%). A reconciliation from the expense implied by the expected rate to the actual tax expense is as follows:
6 months to 6 months to 12 months to31 Mar 2018 31 Mar 2017 30 Sep 2017
(unaudited) (unaudited) (audited) £m £m £m(Loss)/profit on ordinary activities before tax (95) 46 268 Tax (credit)/expense based on the standard rate of corporation tax in the UK of 19% (March and September 2017: 19.5%) (18) 9 52 Effects of: Disallowable expenses 24 4 9 Conduct indemnity adjustment - (5) 7 Deferred tax assets recognised (4) (3) (21)Impact of rate change 5 7 34 Adjustments in respect of prior years (26) 4 5 Tax (credit)/expense for the year (19) 16 86
Disallowable expenses represent, in the main, the Group’s share of incremental conduct charges that are not deductible in computing taxable profits.
The prior year adjustment comprises movements in the deferred tax asset recognised for losses following the enactment of the Corporate Loss Restriction in Finance Act (No.2) 2017 in November 2017. These rules allowed, for the first time, certain losses to be relieved against the profits of group entities other than the one in which they arose, and also changed the order of precedence for relief of existing losses. The consequence of this change was that historic losses, previously derecognised are now brought onto the balance sheet in accordance with the Group’s established methodology. The remainder of the prior year adjustment relates to the revaluation of the conduct indemnity adjustment, and incorporates a fully offsetting movement between current and deferred tax.
The rate change charge arises on the revaluation of assets in consequence of the UK mainstream rate of tax trending towards the enacted rate of 17%, and where deferred tax assets have been utilised at rates lower than initially forecast. 2.6 Earnings per share (EPS) 6 months to 6 months to 12 months to 31 Mar 2018 31 Mar 2017 30 Sep 2017 (unaudited) (unaudited) (audited) £m £m £m(Loss)/profit attributable to ordinary shareholders (94) 12 146Tax relief on AT1 distribution attributable to ordinary equity holders 3 3 7
(Loss)/profit attributable to ordinary equity holders for the purposes of basic and diluted (loss)/earnings per share (91) 15 153
Weighted-average number of ordinary shares in issue (millions) - Basic 885 882 883- Diluted 885 883 884Basic (loss)/earnings per share (pence) (10.2) 1.7 17.3Diluted (loss)/earnings per share (pence) (10.2) 1.7 17.2

44
Financial statements
Notes to the interim condensed consolidated financial statements
Section 3: Assets and liabilities
3.1 Financial assets and liabilities at fair value through profit or loss
31 Mar 2018 30 Sep 2017 (unaudited) (audited) £m £mFinancial assets at fair value through profit or loss Loans and advances 421 477 Financial liabilities at fair value through profit or loss Due to customers – term deposits 20 26 Loans and advances Included in financial assets at fair value through profit or loss is a historical portfolio of loans (sales ceased in 2012). Interest rate risk associated with these loans is managed using interest rate derivative contracts and the loans are recorded at fair value to avoid an accounting mismatch. The maximum credit exposure of the loans is £421m (30 September 2017: £477m) including accrued interest receivable of £2m (30 September 2017: £2m). The cumulative loss in the fair value of the loans attributable to changes in credit risk amounts to £9m (30 September 2017: £11m) and the change for the current period is a decrease of £2m (30 September 2017: decrease of £13m) of which £2m (30 September 2017: £6m) has been recognised in the income statement.
The loans are classified as Level 3 in the fair value hierarchy (note 3.9). Due to customers - term deposits Included in financial liabilities at fair value through profit or loss are fixed rate deposits, the interest rate risk on which is hedged using interest rate derivative contracts. The deposits are recorded at fair value to avoid an accounting mismatch.
The change in fair value attributable to changes in the Group credit risk is £Nil (30 September 2017: £Nil). The Group is contractually obligated to pay £1m (30 September 2017: £1m) less than the carrying amount at maturity to the deposit holder.
The term deposits are classified as Level 3 in the fair value hierarchy (note 3.9).
3.2 Derivative financial instruments The tables below analyse derivatives between those designated as hedging instruments and those classified as held for trading. 31 Mar 2018 30 Sep 2017 (unaudited) (audited) £m £mFair value of derivative financial assets Designated as hedging instruments 260 202Designated as held for trading 74 80 334 282Fair value of derivative financial liabilities Designated as hedging instruments 253 229Designated as held for trading 135 147 388 376
Cash collateral on derivatives placed with banks totalled £330m as at 31 March 2018 (30 September 2017: £338m). Cash collateral received on derivatives totalled £46m as at 31 March 2018 (30 September 2017: £31m). These amounts are included within due from and due to other banks respectively.
The derivative financial instruments held by the Group are further analysed below. The notional contract amount is the amount from which the cash flows are derived, and does not represent the principal amounts at risk relating to these contracts.

45
Financial statements
Notes to the interim condensed consolidated financial statements
Section 3: Assets and liabilities (continued)
3.2 Derivative financial instruments (continued)
31 March 2018 (unaudited) 30 September 2017 (audited)Total derivative contracts Notional
contract amount
Fair value of assets
Fair value of liabilities
Notional contract amount
Fair value of assets
Fair value of liabilities
£m £m £m £m £m £mDerivatives designated as hedging instruments Cash flow hedges Interest rate swaps 22,562 113 133 17,952 56 104Cross currency swaps 695 81 - 527 89 -Forward foreign exchange 3 - - 6 - - 23,260 194 133 18,485 145 104Fair value hedges Interest rate swaps 1,380 66 120 1,452 57 125 Derivatives designated as held for trading Foreign exchange rate related contracts Spot and forward foreign exchange 2,599 45 50 2,689 45 47Cross currency swaps 150 5 5 150 9 9Options 16 - - 103 2 2 2,765 50 55 2,942 56 58Interest rate related contracts Swaps 850 16 70 983 18 82Swaptions 33 - - 33 - -Options 462 1 3 477 2 3 1,345 17 73 1,493 20 85Commodity related contracts 79 7 7 93 4 4Total derivative contracts 28,829 334 388 24,465 282 376
Derivatives traded to manage the Group's interest rate exposure on a net portfolio basis are accounted for as cash flow hedges. Derivatives traded to manage interest rate risk on certain fixed rate assets, such as UK Government Gilts, are accounted for as fair value hedges. The Group also cash flow hedges its foreign currency exposure on material, highly probable non-GBP denominated transactions.
The Group hedging positions also include those designated as foreign currency and interest rate hedges of debt issued from the Group's securitisation and covered bond programmes respectively. As such, certain derivative financial assets and liabilities have been booked in structured entities and consolidated within these financial statements.

46
Financial statements
Notes to the interim condensed consolidated financial statements
Section 3: Assets and liabilities (continued)
3.3 Loans and advances to customers
31 Mar 2018 30 Sep 2017(unaudited) (audited)
£m £mMortgages 24,139 23,480 Other term lending – SME 4,892 4,762 Other term lending – Retail 755 709 Overdrafts 1,507 1,524 Lease finance 614 594 Credit cards 382 396 Trade finance 36 23 Gross loans and advances to customers 32,325 31,488 Accrued interest receivable 79 75Unearned income (29) (28)Deferred and unamortised fee income (27) (32)Impairment provisions on credit exposures (211) (210) 32,137 31,293 The Group has a portfolio of fair valued business loans of £421m (30 September 2017: £477m) which are held separately as Other financial assets at fair value on the balance sheet (note 3.1). Combined with the above this is equivalent to total loans and advances of £32,558m (30 September 2017: £31,770m).
3.4 Deferred tax The Group recognises deferred tax attributable to the following items:
31 Mar 2018 30 Sep 2017 (unaudited) (audited) £m £mDeferred tax assets Tax losses carried forward 89 28Capital allowances 97 120Cash flow hedge reserve 14 1Transitional adjustment - available for sale reserve 2 3Employee equity based compensation 2 2 204 154Deferred tax liabilities Defined benefit pension scheme surplus (78) (72)Gains on unlisted available for sale investments (3) (3) (81) (75)Net deferred tax balance 123 79
Since 1 April 2017, the statutory rate of UK corporation tax has been 19% and will fall to 17% from 1 April 2020. In accordance with the appropriate accounting standard, these enacted rates are used to measure the value at which assets are expected to be realised and liabilities settled. A prior year adjustment to claim capital allowances provisionally disclaimed at 30 September 2017 has resulted in an increase to the residual loss deferred tax asset of £14m and a decrease in the corresponding capital allowance deferred tax asset of £19m. The difference between the two amounts, which arises because the two types of deferred tax assets are recognised at different rates, is taken to the income statement as part of the prior year credit set out in note 2.5.

47
Financial statements
Notes to the interim condensed consolidated financial statements
Section 3: Assets and liabilities (continued)
3.4 Deferred tax (continued) At 31 March 2018, the Group had an unrecognised deferred tax asset of £172m (30 September 2017: £180m) representing trading losses with a gross value of £1,010m (30 September 2017: £1,058m). Although there is no prescribed period after which losses expire, a deferred tax asset has not been recognised in respect of these losses as the Directors have insufficient certainty over their recoverability in the foreseeable future. 3.5 Due to other banks 31 Mar 2018 30 Sep 2017 (unaudited) (audited) £m £mSecurities sold under agreements to repurchase 351 1,864 Transaction balances with other banks 34 21 Deposits from other banks 46 31 Secured loans 2,252 1,901 2,683 3,817 Secured loans comprise amounts drawn under the TFS (including accrued interest).
3.6 Provisions for liabilities and charges 31 Mar 2018 30 Sep 2017 (unaudited) (audited) £m £mPPI redress provision Opening balance 422 725 Charge to the income statement (note 2.4) 202 48 Charge reimbursed/reimbursable under Conduct Indemnity 148 446 Utilised (405) (797)Closing balance 367 422 Customer redress and other provisions Opening balance 109 101 Charge to the income statement (note 2.4) 18 10 Charge reimbursed/reimbursable under Conduct Indemnity - 88 Utilised (58) (90)Closing balance 69 109 Restructuring provision(1) Opening balance 23 26 Charge to the income statement 10 58 Utilised (11) (61)Closing balance 22 23 Total provisions for liabilities and charges 458 554
(1) Restructuring provision includes surplus lease space provision.
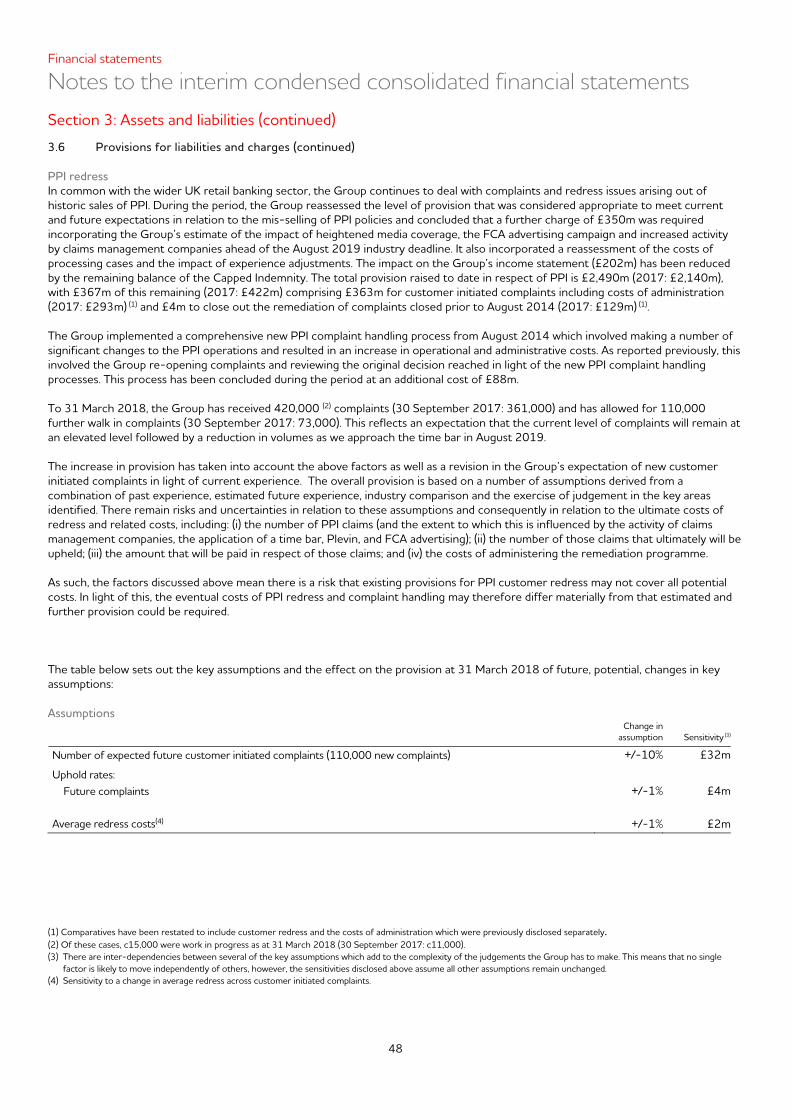
48
Financial statements
Notes to the interim condensed consolidated financial statements
Section 3: Assets and liabilities (continued)
3.6 Provisions for liabilities and charges (continued) PPI redress In common with the wider UK retail banking sector, the Group continues to deal with complaints and redress issues arising out of historic sales of PPI. During the period, the Group reassessed the level of provision that was considered appropriate to meet current and future expectations in relation to the mis-selling of PPI policies and concluded that a further charge of £350m was required incorporating the Group’s estimate of the impact of heightened media coverage, the FCA advertising campaign and increased activity by claims management companies ahead of the August 2019 industry deadline. It also incorporated a reassessment of the costs of processing cases and the impact of experience adjustments. The impact on the Group’s income statement (£202m) has been reduced by the remaining balance of the Capped Indemnity. The total provision raised to date in respect of PPI is £2,490m (2017: £2,140m), with £367m of this remaining (2017: £422m) comprising £363m for customer initiated complaints including costs of administration (2017: £293m) (1) and £4m to close out the remediation of complaints closed prior to August 2014 (2017: £129m) (1). The Group implemented a comprehensive new PPI complaint handling process from August 2014 which involved making a number of significant changes to the PPI operations and resulted in an increase in operational and administrative costs. As reported previously, this involved the Group re-opening complaints and reviewing the original decision reached in light of the new PPI complaint handling processes. This process has been concluded during the period at an additional cost of £88m. To 31 March 2018, the Group has received 420,000 (2) complaints (30 September 2017: 361,000) and has allowed for 110,000 further walk in complaints (30 September 2017: 73,000). This reflects an expectation that the current level of complaints will remain at an elevated level followed by a reduction in volumes as we approach the time bar in August 2019. The increase in provision has taken into account the above factors as well as a revision in the Group’s expectation of new customer initiated complaints in light of current experience. The overall provision is based on a number of assumptions derived from a combination of past experience, estimated future experience, industry comparison and the exercise of judgement in the key areas identified. There remain risks and uncertainties in relation to these assumptions and consequently in relation to the ultimate costs of redress and related costs, including: (i) the number of PPI claims (and the extent to which this is influenced by the activity of claims management companies, the application of a time bar, Plevin, and FCA advertising); (ii) the number of those claims that ultimately will be upheld; (iii) the amount that will be paid in respect of those claims; and (iv) the costs of administering the remediation programme. As such, the factors discussed above mean there is a risk that existing provisions for PPI customer redress may not cover all potential costs. In light of this, the eventual costs of PPI redress and complaint handling may therefore differ materially from that estimated and further provision could be required. The table below sets out the key assumptions and the effect on the provision at 31 March 2018 of future, potential, changes in key assumptions: Assumptions
Change in
assumption Sensitivity (3)
Number of expected future customer initiated complaints (110,000 new complaints) +/-10% £32m
Uphold rates: Future complaints +/-1% £4m
Average redress costs(4) +/-1% £2m
(1) Comparatives have been restated to include customer redress and the costs of administration which were previously disclosed separately. (2) Of these cases, c15,000 were work in progress as at 31 March 2018 (30 September 2017: c11,000). (3) There are inter-dependencies between several of the key assumptions which add to the complexity of the judgements the Group has to make. This means that no single
factor is likely to move independently of others, however, the sensitivities disclosed above assume all other assumptions remain unchanged. (4) Sensitivity to a change in average redress across customer initiated complaints.

49
Financial statements
Notes to the interim condensed consolidated financial statements
Section 3: Assets and liabilities (continued)
3.6 Provisions for liabilities and charges (continued) Customer redress and other provisions Other provisions include amounts in respect of a number of non-PPI conduct related matters, legal proceedings, and claims arising in the ordinary course of the Group’s business. Over the course of the period, the Group has raised further provisions of £18m for these matters, none of which is covered by the Capped Indemnity. The ultimate cost to the Group of other customer redress matters is driven by a number of factors relating to offers of redress, compensation, offers of alternative products, consequential loss claims and administrative costs. The matters are at varying stages of their life cycle and in certain circumstances, usually early in the life of a potential issue, elements of the potential exposure are contingent. These factors could result in the total cost of review and redress varying materially from the Group’s estimate. The final amount required to settle the Group’s potential liabilities in these matters is therefore uncertain and further provision could be required.
Conduct Indemnity Deed The Group’s economic exposure to the impact of historic conduct related liabilities is mitigated by a Capped Indemnity of £1.7bn from NAB. The Company and NAB have an agreement under which NAB has provided the Company with a Capped Indemnity to meet the costs of dealing with conduct matters related to products sold in the period prior to the date of the Group’s demerger from NAB (the Conduct Indemnity Deed). The legacy conduct matters covered by the Capped Indemnity are referred to as Relevant Conduct Matters. The Capped Indemnity provides the Group with economic protection against certain costs and liabilities (including financial penalties imposed by a regulator) resulting from conduct issues relating to:
a) PPI, standalone interest rate hedging products, voluntary scope tailored business loans and fixed rate tailored business loans; and
b) other conduct matters, subject to certain limitations and minimum financial thresholds.
Amounts payable under the Capped Indemnity include, subject to certain limitations, payments to customers to satisfy, settle or discharge a Relevant Conduct Matter and the direct costs and expenses of satisfying, settling, discharging or administering such Relevant Conduct Matter.
It has been agreed that NAB will meet 90.3% of Qualifying Conduct Costs claimed by the Company, up to the amount of the Capped Indemnity.
Claims under the Capped Indemnity are recognised in the consolidated income statement simultaneously with the charge for Relevant Conduct Matters. The conduct expense and associated reimbursement income are presented net within Other operating and administrative expenses. A reimbursement receivable is recognised on the consolidated balance sheet within Due from other banks; this receivable is periodically settled by NAB. The reimbursement receivable is not offset against the provision amount on the Group’s consolidated balance sheet. The provision expense and reimbursement income are disclosed above.
To the extent that it is no longer probable that provisions for a Relevant Conduct Matter previously raised will be required to settle conduct obligations and a provision for a Relevant Conduct Matter is released as unutilised, the related Capped Indemnity amounts received will become repayable to NAB.
Now that the Qualifying Conduct Costs are expected to exceed the Capped Indemnity, any costs in excess of the amounts currently provided will be borne by the Group.
To the extent that tax relief is expected in relation to provisions for which reimbursement income is applicable, amounts may become repayable to NAB. In the consolidated financial statements, deferred tax assets are only recognised in respect of the loss share proportion (9.7%) of unused tax losses on Relevant Conduct Matters, on the basis that the Group does not obtain the economic benefit of the future tax relief which is repayable to NAB.
The utilisation and undrawn balance of the Capped Indemnity is set out below:
Conduct
protection £m
Conduct protection provided by NAB 1,700Capital injected into CYBI prior to demerger (1) (120)Drawn in the period to 30 September 2017(2) (1,432)Undrawn Conduct Indemnity as at 30 September 2017 148Amount to be drawn relating to the period to 31 March 2018 (148)Balance as at 31 March 2018 -
(1) £120m of the £670m of capital injected in CYBI on 24 September 2015 was related to the Conduct Indemnity Deed.
(2) £465m of the £1,432m represents the pre-covered provision amount.

50
Financial statements
Notes to the interim condensed consolidated financial statements
Section 3: Assets and liabilities (continued)
3.6 Provisions for liabilities and charges (continued)
Duration and termination The indemnity protection provided by NAB to the Company in respect of Relevant Conduct Matters under the Capped Indemnity is perpetual in nature, except in the following circumstances:
(a) it is fully utilised by the Group; or
(b) in the event that, at any time:
(i) the PRA determines that NAB’s remaining exposure under the Capped Indemnity; or
(ii) the Unutilised Indemnity Amount,
is £100m or less, NAB will have the right (with the approval of the PRA (at its sole discretion)) to terminate the Capped Indemnity by subscribing for shares (at a price equivalent to the prevailing five-day average market price for the shares) in an amount equal to the Unutilised Indemnity Amount, provided that the maximum value of the shares to be subscribed for does not exceed a value equal to 9.9% of the issued share capital of the Group (on an undiluted basis) at such time (a ‘£100m Termination’).
(c) NAB and the Group may also agree arrangements to terminate or replace the Capped Indemnity with the consent of the PRA. In particular, NAB and the Group have agreed that they will, on the fifth anniversary of the demerger (and, if relevant, each subsequent anniversary of the demerger), seek to agree arrangements to terminate the Capped Indemnity. If any such arrangements are agreed between NAB and the Group, they will be required to obtain the approval of the PRA (at its sole discretion) before commencing the implementation of such arrangements. In relation to proposals made by NAB to the Group in connection with such termination of the Capped Indemnity, the Group cannot unreasonably withhold its agreement to the Capped Indemnity being replaced by a payment equal to the Unutilised Indemnity Amount to be applied (in whole or in part) in subscribing for shares (at a price equivalent to the prevailing five-day average market price for the shares), provided that the maximum value of the shares to be subscribed for pursuant to such proposal would not exceed £200m or if lower, a value equal to 9.9% of the issued share capital of the Group (on an undiluted basis) at such time (a ‘Post-5 Year Equity Subscription Termination’).
If £100m Termination or Post-5 Year Equity Subscription Termination occurs, the Group will not be entitled to make any further claims under the Capped Indemnity, but will be entitled to retain in a designated account for a period of three years following such termination, any Unutilised Covered Amount and any amount to be withdrawn from the designated account in respect of conduct costs that fall within the scope of the Capped Indemnity which have been incurred and paid by the Group prior to such termination. The Company will be required to return to NAB any other amounts in a designated account and to release to NAB all amounts remaining in the collateral account. Following the expiry of such three-year period, the Group will be required to repay all remaining amounts in a designated account net of any amount to be withdrawn from a designated account in respect of conduct costs that fall within the scope of the Capped Indemnity which have been incurred and paid by Group prior to such anniversary.
Restructuring provision Restructuring of the business is currently ongoing and a provision is held to cover redundancy payments, property vacation costs and associated enablement costs. During the period £24m (30 September 2017: £67m) was charged to the income statement, of which £14m (30 September 2017: £9m) was charged directly to the income statement and £10m (30 September 2017: £58m) was provided for in accordance with the requirements of IAS 37. £11m (30 September 2017: £61m) of the total provision was utilised in the period.
Included within the restructuring provision is an amount for committed rental expense on surplus lease space consistent with the expected exposure on individual leases where the property is unoccupied. This element of the provision will be utilised over the remaining life of the leases or until the leases are assigned, and is measured at present values by discounting anticipated future cash flows.

51
Financial statements
Notes to the interim condensed consolidated financial statements
Section 3: Assets and liabilities (continued)
3.7 Debt securities in issue 31 March 2018 Medium-term
notesSubordinated
debtSecuritisation Covered bonds Total
(unaudited)
£m £m £m £m £mCarrying value 297 476 2,898 698 4,369Fair value hedge adjustments - - - 42 42Total debt securities 297 476 2,898 740 4,411Accrued interest payable 3 3 4 26 36 300 479 2,902 766 4,447 30 September 2017 Medium-term
notesSubordinated
debtSecuritisation Covered bonds Total
(audited) £m £m £m £m £mCarrying value 297 476 3,242 698 4,713Fair value hedge adjustments - - - 50 50Total debt securities 297 476 3,242 748 4,763Accrued interest payable 3 3 6 10 22 300 479 3,248 758 4,785 There were no new issuances or redemptions of medium term notes, subordinated debt or covered bonds during the period to 31 March 2018. The Group issued the following debt under its securitisation programme in the period: - 1 February 2018 - USD 300M Lanark 2018-1 1A. - 1 February 2018 - GBP 285M Lanark 2018-1 2A. The following redemptions occurred during the period: - 20 November 2017 - GBP 335M Lannraig 2011-1 1A. - 22 November 2017 - GBP 525M Lanark 2012-2 2A. The remaining reduction in the carrying value is as a result of scheduled principal repayments on outstanding securitisation notes. 3.8 Retirement benefit obligations The Group operates both defined benefit and defined contribution arrangements. The Group’s principal trading subsidiary, Clydesdale Bank PLC, is the sponsoring employer in one funded defined benefit pension scheme, the Yorkshire and Clydesdale Bank Pension Scheme (‘the Scheme’). The Scheme was established under trust on 30 September 2009 as a result of the merger of the Clydesdale Bank Pension Scheme and the Yorkshire Bank Pension Fund. The assets of the Scheme are held in a trustee administered fund, with the Trustee responsible for the operation and governance of the Scheme, including making decisions regarding the Scheme’s funding and investment strategy. The Scheme is subject to the funding legislation outlined in the Pensions Act 2004 which came into force on 30 December 2005. This, together with documents issued by the Pensions Regulator, sets out the framework for funding defined benefit occupational pension plans in the UK.
The Group closed the Scheme to new members in 2004 and since April 2006 has determined benefits accruing on a career average revalued earnings basis. On 1 August 2017, the Scheme was closed to future benefit accrual for the majority of employees, with affected employees’ future pension benefits being provided through the existing defined contribution scheme, ‘Total Pension’. The Total Pension income statement charge for the year is shown in note 2.4.
The Group also provides post-retirement health care under a defined benefit scheme for pensioners and their dependant relatives for which provision has been made on a basis consistent with the methodology applied to the defined benefit pension scheme. This is a closed scheme and the provision will be utilised over the life of the remaining scheme members.

52
Financial statements
Notes to the interim condensed consolidated financial statements
Section 3: Assets and liabilities (continued) The following table provides a summary of the present value of the defined benefit obligation and fair value of plan assets for the Scheme: 31 Mar 2018 30 Sep 2017 (unaudited) (audited) £m £mActive members' defined benefit obligation (24) (807)Deferred members' defined benefit obligation(1) (2,223) (1,549)Pensioner and dependent members' defined benefit obligation (1,629) (1,618)Total defined benefit obligation (3,876) (3,974)Fair value of Scheme assets 4,098 4,181Net defined benefit pension asset 222 207Post-retirement medical benefits obligations (3) (3)
(1) Deferred members’ defined benefit obligation includes employees who became deferred members on 1 August 2017 as part of the Scheme closure exercise. 3.9 Fair value of financial instruments
Fair value is the price that would be received to sell an asset, or paid to transfer a liability in an orderly transaction between market participants at the valuation date.
Analysis of the fair value disclosures uses a hierarchy that reflects the significance of inputs used in measuring fair value. The level in the fair value hierarchy within which a fair value measurement is categorised is determined on the basis of the lowest level input that is significant to the fair value measurement in its entirety. The fair value hierarchy is as follows:
Level 1 fair value measurements – quoted prices (unadjusted) in active markets for an identical financial asset or liability; Level 2 fair value measurements – inputs, other than quoted prices within Level 1, that are observable for the financial asset or
liability, either directly (as prices) or indirectly (derived from prices); and Level 3 fair value measurements – inputs for the financial asset or liability that are not based on observable market data
(unobservable inputs).
For the purpose of reporting movements between levels of the fair value hierarchy, transfers are recognised at the beginning of the reporting period in which they occur.
(a) Fair value of financial instruments recognised on the balance sheet at amortised cost The table below show a comparison of the carrying amounts of financial assets and liabilities measured at amortised cost, as reported on the balance sheet, and their fair values where these are not approximately equal.
There are various limitations inherent in this fair value disclosure particularly where prices are derived from unobservable inputs due to some financial instruments not being traded in an active market. The methodologies and assumptions used in the fair value estimates are therefore described in the notes to the tables. The difference between carrying value and fair value is relevant in a trading environment, but is not relevant to assets such as loans and advances.
31 Mar 2018 30 Sep 2017 (unaudited) (audited) Carrying value Fair value Carrying value Fair value £m £m £m £mFinancial assets Loans and advances to customers (1) 32,137 31,845 31,293 31,088
Financial liabilities Due to customers (2) 28,463 28,561 27,718 27,833 Debt securities in issue (3) 4,447 4,555 4,785 4,910
(1) (2) (3)
Loans and advances to customers are categorised as Level 3 in the fair value hierarchy with the exception of £1,122m (30 September 2017: £1,009m) of overdraftswhich are categorised as Level 2. Categorised as Level 2 in the Fair Value Hierarchy. Categorised as Level 2 in the Fair Value Hierarchy with the exception of £800m (30 September 2017: £795m) which is categorised as level 1.

53
Financial statements
Notes to the interim condensed consolidated financial statements
Section 3: Assets and liabilities (continued)
3.9 Fair value of financial instruments (continued) (b) Fair value of financial instruments recognised on the balance sheet at fair value The following tables provide an analysis of financial instruments that are measured at fair value, using the fair value hierarchy described above.
Fair value measurement as at Fair value measurement as at 31 Mar 2018 (unaudited) 30 Sep 2017 (audited)
Level 1 Level 2 Level 3 Total Level 1 Level 2 Level 3 Total £m £m £m £m £m £m £m £mFinancial assets Derivative financial assets - 334 - 334 - 282 - 282 AFS investments – listed 1,342 - - 1,342 2,066 - - 2,066 AFS investments – unlisted - - 4 4 - - 4 4 AFS – other - - 6 6 - - 6 6 Other financial assets at fair value - - 421 421 - - 477 477 Total financial assets at fair value 1,342 334 431 2,107 2,066 282 487 2,835
Financial liabilities Derivative financial liabilities - 388 - 388 - 376 - 376 Other financial liabilities at fair value - - 20 20 - - 26 26 Total financial liabilities at fair value - 388 20 408 - 376 26 402
There were no transfers between Level 1 and 2 or 3 in the current or prior period.
Additional analysis on assets and liabilities measured at fair value based on valuation techniques for which any significant input is not based on observable market data (Level 3): Level 3 movements analysis: Period to 31 Mar 2018 Year to 30 Sep 2017 Financial
assetsavailable for
sale
Other financial
assets at fair value
Other financial
liabilities at fair value
Financial assets
available for sale
Other financial
assets at fair value
Otherfinancial
liabilities atfair value
£m £m £m £m £m £mBalance at the beginning of the period 10 477 (26) 36 750 (48)
Fair value (losses)/gains recognised(1)
In profit or loss - unrealised - (7) 1 - (39) 2In profit or loss - realised - - - 1 2 -In available for sale - unrealised - - - 1 - -Purchases - - -Sales(2) - - - (26) - -Settlements - (49) 5 (2) (236) 20Balance at the end of the period 10 421 (20) 10 477 (26)
(1) Net gains or losses were recorded in non interest income, interest income or expense and impairment losses or within the available for sale reserve as appropriate.
(2) The sale principally relates to the disposal of the VocaLink investment in the prior year.

54
Financial statements
Notes to the interim condensed consolidated financial statements
Section 3: Assets and liabilities (continued) 3.9 Fair value of financial instruments (continued) Quantitative information about significant unobservable inputs in Level 3 valuations The table below lists key unobservable inputs to Level 3 financial instruments, and provides the range of those inputs as at 31 March 2018.
Fair
value Valuation Unobservable Low High
£m technique inputs Range RangeFinancial assets
Other financial assets at fair value 421 Discounted cash flow Portfolio lifetime probability of default 2.2% 11.3%
AFS investments - unlisted 4 Discounted cash flow Contingent litigation risk 0% 100%
AFS - other 6 Discounted cash flow Funds under management attrition rate 10% 20%
The Group has £20m (30 September 2017: £26m) of financial liabilities at fair value classed as Level 3 which represent a portfolio of term deposits that are directly linked to the customer loans, which are also held at fair value and classed as Level 3. Their relationship to the fair value assets is such that should the liability be settled, the amount payable would be net of the fair value asset. Sensitivity of Level 3 fair value measurements to reasonably possible alternative assumptions Where valuation techniques use non-observable inputs that are significant to a fair value measurement in its entirety, changing these inputs will change the resultant fair value measurement.
The most significant exposure to Level 3 fair value measurements is in respect of the Group's fair value loan portfolio and the most significant inputs impacting the carrying value of the loans other than interest rates are future expectations of credit losses. If lifetime expected losses were 20% greater than predicted, the carrying value of the loans would decrease by £2m and vice versa.
The most significant input impacting the carrying value of the available for sale - other asset is the Funds Under Management Attrition rate. The Group currently assumes a 15% attrition rate. If this rate was 20% the fair value would reduce by £1m; if it was 10% the fair value would increase by £2m.
Other than these significant Level 3 measurements, the Group has a limited remaining exposure to Level 3 fair value measurements, and changing one or more of the inputs for fair value measurements in Level 3 to reasonable alternative assumptions would not change the fair value significantly with respect to profit or loss, total assets, total liabilities or equity on these remaining Level 3 measurements.

55
Financial statements
Notes to the interim condensed consolidated financial statements
Section 4: Capital
4.1 Equity 4.1.1 Share capital 31 Mar 2018 30 Sep 2017 (unaudited) (audited) 31 Mar 2018 30 Sep 2017 Number of Number of (unaudited) (audited) shares shares £m £mOrdinary shares - allotted, called up, and fully paid Opening ordinary share capital 883,606,066 881,531,852 88 88Issued under employee share schemes 1,545,527 2,074,214 1 -Closing ordinary share capital 885,151,593 883,606,066 89 88
The holders of ordinary shares are entitled to dividends as declared from time to time and are entitled to one vote per share at meetings of the shareholders of the Company. All shares in issue at 31 March 2018 rank equally with regard to the Company’s residual assets.
During the period 1,545,527 (30 September 2017: 2,074,214) ordinary shares were issued under employee share schemes with a nominal value of £0.2m (30 September 2017: £0.2m).
A final dividend in respect of the year ended 30 September 2017 of 1p per ordinary share in the Company, amounting to £9m, was paid in February 2018.
4.1.2 Other equity instruments Other equity instruments consist of Perpetual Contingent Convertible Notes (fixed 8%) which were issued on 8 February 2016 with a principal amount of £450m and an optional redemption on 8 December 2022 ('AT1 notes').
AT1 distributions of £18m were made in the current period, £15m net of tax (30 September 2017: £36m paid, £29m net of tax, 31 March 2017: £18m paid, £15m net of tax). 4.1.3 Capital reorganisation reserve The capital reorganisation reserve of £839m was recognised on the issuance of CYBG PLC ordinary shares in February 2016 in exchange for the acquisition of the entire share capital of the Group’s previous parent company, CYBI Limited. The reserve reflects the difference between the consideration for the issuance of CYBG PLC shares and CYBI Limited’s share capital and share premium. 4.1.4 Merger reserve A merger reserve of £633m was recognised on the issuance of CYBG PLC ordinary shares in February 2016 in exchange for the acquisition of the entire share capital of CYBI Limited. The merger reserve reflects the difference between the consideration for the issuance of CYBG PLC shares and the nominal value of the shares issued. 4.1.5 Other reserves Asset revaluation reserve The asset revaluation reserve includes the gross revaluation increments and decrements arising from the revaluation of land and buildings. Available for sale reserve The available for sale reserve records the gains and losses arising from changes in the fair value of available for sale financial assets. Cash flow hedge reserve The cash flow hedge reserve represents the cumulative post-tax gains and losses on derivatives designated as cash flow hedging instruments that will be recycled to the income statement when the hedged items affect profit or loss. As at 31 March 2018, the cash flow hedge reserve was a cumulative loss of £43m (30 September 2017: £1m cumulative loss). The fair value of derivatives in cash flow hedges decreased by £56m in the period (30 September 2017: £84m decrease), and a £1m loss (30 September 2017: £4m gain) was recycled to interest income in line with the hedged item affecting profit or loss. No amounts (30 September 2017: £0.3m loss) were transferred to non-interest income due to ineffectiveness arising from cash flow hedges. These movements were offset by a deferred tax credit of £13m (30 September 2017: credit of £21m). Equity based compensation reserve The Group’s equity based compensation reserve records the value of equity settled share based payment benefits provided to the Group’s employees as part of their remuneration that has been charged through the income statement and adjusted for deferred tax.

56
Financial statements
Notes to the interim condensed consolidated financial statements
Section 5: Other notes 5.1 Contingent liabilities and commitments
The table below sets out the amounts of financial guarantees and commitments which are not recorded on the balance sheet. Financial guarantees and commitments are credit-related instruments which include acceptances, letters of credit, guarantees and commitments to extend credit. The amounts do not represent the amounts at risk at the balance sheet date but the amounts that would be at risk should the contracts be fully drawn upon and the customer defaults. Since a significant portion of guarantees and commitments is expected to expire without being drawn upon, the total of the contract amounts is not representative of future liquidity requirements. 31 Mar 2018 30 Sep 2017 (unaudited) (audited) £m £mGuarantees and assets pledged as collateral security: Due in less than 3 months 21 19Due between 3 months and 1 year 53 40Due between 1 year and 3 years 8 7Due between 3 years and 5 years 4 3Due after 5 years 43 42 129 111 Other credit commitments Undrawn formal standby facilities, credit lines and other commitments to lend at call 7,942 8,408
Other contingent liabilities Financial Services Compensation Scheme (FSCS) The FSCS provides compensation to depositors in the event that a financial institution is unable to repay amounts due. Following the failure of a number of financial institutions, claims were triggered against the FSCS, initially to pay interest on borrowings which the FSCS has raised from the UK Government to support the protected deposits. During 2015, the FSCS levy was also invoiced to institutions for the third of three annual levies to cover capital repayments to the UK Government. The principal of these borrowings, which remains after the three annual levies have been paid, is anticipated to be repaid from the realisation of the assets of the defaulted institutions. The FSCS has however confirmed that the size of the future levies will be kept under review in light of developments from the insolvent estates.
The FSCS has estimated levies due to 31 March 2018 for the interest on borrowings and an accrual of £2m (30 September 2017: £2m) is held for the Group’s calculated liability to that date. The ultimate FSCS levy as a result of the failures is uncertain.
Conduct risk related matters There continues to be significant uncertainty and thus judgement is required in determining the quantum of conduct risk related liabilities, with note 3.6 reflecting the Group’s current position in relation to redress provisions including those for PPI. The final amount required to settle the Group’s potential liabilities for these, and other conduct related matters, is materially uncertain. Contingent liabilities include those matters where redress is likely to be paid and costs incurred but the amounts cannot currently be estimated. The Group will continue to reassess the adequacy of provisions for these matters and the assumptions underlying the calculations at each reporting date based upon experience and other relevant factors at that time. Legal claims The Group is named in and is defending a number of legal claims arising in the ordinary course of business. No material adverse impact on the financial position of the Group is expected to arise from the ultimate resolution of these legal actions.

57
Financial statements
Notes to the interim condensed consolidated financial statements
Section 5: Other notes (continued)
5.2 Related party transactions Transactions with pension schemes The Group incurred costs in relation to pension scheme administration. These costs, which amounted to £0.2m (31 March 2017: £0.2m, 30 September 2017: £0.3m), were charged to the Group sponsored scheme. The Group has deposits of £22.9m (30 September 2017: £20.3m) at the period end placed by the Scheme at market rates.
Pension contributions of £14m (period to 31 March 2017: £10m, year to 30 September 2017: £69m) were made during the period to the Yorkshire and Clydesdale Bank Pension Scheme sponsored by the Group. Information on the pension schemes operated by the Group is provided in note 3.8. 5.3 Events after the balance sheet date On 7 May 2018, the Group confirmed that it had made a preliminary approach regarding a potential all share combination with Virgin Money Holdings (UK) plc (‘Virgin Money’) (the ‘Proposal’). Under the terms of the Proposal, the Group would acquire all the issued and to be issued ordinary share capital of Virgin Money on the basis of an exchange ratio of 1.1297 new CYBG shares for each Virgin Money share. Under the terms of the Proposal, Virgin Money shareholders would own approximately 36.5%(1) of the combined group. In accordance with Rule 2.6(a) of The City Code on Takeovers and Mergers (the ‘Code’), by not later than 5.00 p.m. on 4 June 2018, the Group will be required to either announce a firm intention to make an offer for Virgin Money in accordance with Rule 2.7 of the Code or announce that it does not intend to make an offer, in which case such announcement will be treated as a statement to which Rule 2.8 of the Code applies. This deadline will only be extended with the consent of the UK Takeover Panel in accordance with Rule 2.6(c) of the Code. The Proposal does not impose any obligation on CYBG to make an offer, nor does it evidence a firm intention to make an offer within the meaning of the Code. CYBG also reserves the right:
to make an offer at any time on reduced terms than 1.1297 new CYBG shares for each Virgin Money share: o with the agreement or recommendation of the Board of Directors of Virgin Money; o if a third party announces a firm intention to make an offer for Virgin Money pursuant to Rule 2.7 of the Code, which, at
that date is valued at a lower price than the value of 1.1297 new CYBG shares for each Virgin Money share; o if Virgin Money announces, declares or pays any dividend or any other distribution to shareholders, in which case CYBG
reserves the right to make an equivalent reduction in its offer terms; or o following announcement by Virgin Money of a whitewash transaction pursuant to the Code; and
to introduce other forms of consideration and/or vary the mix or composition of consideration of any offer.
Any firm offer in accordance with Rule 2.7 of the Code will be subject to, among other things, satisfactory completion of due diligence, the recommendation of Virgin Money's Board of Directors and reaching agreement with Virgin Group Holdings Limited in relation to the brand. The Group reserves the right to waive any or all of these pre-conditions in whole or in part. Any firm offer will also be subject to customary terms and conditions for a transaction governed by the Code and the UK listing rules, including regulatory and CYBG and Virgin Money shareholder approval. (1) Based on the issuance of 509,812,684 new CYBG shares for Virgin Money's 451,262,132 ordinary shares on a fully diluted basis (including 445,442,008 ordinary
shares currently in issue and 5,820,124 ordinary shares to be issued on the exercise of options or vesting of awards under Virgin Money's share schemes), giving a pro forma share count for the combined group of 1,394,964,277.

58
Additional information
Measuring financial performance - glossary
Underlying adjustments to the statutory view of performance In arriving at an underlying basis, the effects of certain items that do not promote an understanding of historical or future trends of earnings or cash flows are removed, with management believing this presents a set of results that provide a more reflective period-on-period comparison. These items are:
Item
6 months to 31 Mar 2018 £m
6 months to 31 Mar 2017 £m
Year to 30 Sep 2017 £m Description
Reason for exclusion from the Group’s current underlying performance
Conduct charges
(220) (19) (58) These are customer redress and associated costs arising from legacy products and past sales practices.
These costs are historical in nature and are not indicative of the Group’s current underlying performance.
Restructuring and related expense
(24) (53) (67) Restructuring of the business is currently ongoing with costs including redundancy payments, property vacation costs, associated enablement costs and non-recurring costs arising from operational transformation.
These costs are significant and are part of the Group’s strategic objective in simplifying and streamlining operations and processes to enhance productivity. Consequently, this expense is not viewed as a normal ongoing operating cost to the Group.
RBS alternative remedies package spend
(5) - - Costs incurred, in relation to the RBS alternative remedies package, to enable strategic and inorganic growth.
These costs are part of delivering the Group’s growth strategy. Consequently, this expense is not viewed as a normal ongoing operating cost to the Group.
Separation costs
(4) (5) (8) Costs incurred directly relating to the demerger from NAB.
Specific costs relating to the demerger from NAB are historic and not indicative of the Group’s current underlying performance.
Gain on disposal of VocaLink
- - 20 A one-off gain recognised on the disposal of the Group’s VocaLink share.
Losses or gains from one-off or infrequent transactions are not indicative of the Group’s current underlying performance.
Gain on DB pension scheme reforms
- - 88 A one-off gain on the closure of the defined benefit pension scheme to future accrual for the majority of members.
Losses or gains from one-off or infrequent transactions are not indicative of the Group’s current underlying performance.

59
Additional information
Glossary For a glossary of terms and abbreviations used within this report refer to pages 250 to 259 of the Group annual report and accounts for the year ended 30 September 2017. For terms not previously included within the Glossary, or where terms have been redefined refer below: Net interest margin (NIM) Net interest income as a percentage of average interest earning assets for a given period. Net interest
income of £426m (31 March 2017: £411m) is divided by average interest earning assets for a given period of £39,303m (31 March 2017: £36,963m) (which is then adjusted to exclude short term repos used for liquidity management purposes, amounts received under the Conduct Indemnity and not yet utilised, and any associated income). As a result of the exclusions noted above, average interest earning assets used as the denominator have reduced by £168m (31 March 2017: £643m) and the net interest income numerator by £0.3m (31 March 2017: £0.7m).
Statutory return on assets
Statutory profit/(loss) after tax attributable to equity holders as a percentage of average total assets for a given period.
Total net capital absorbed
The amount of capital generated by the business in basis points over a given period, after non underlying items are included.
Underlying capital generation
The amount of capital generated by the business in basis points over a given period, before non underlying items are included.
Underlying profit after tax attributable to ordinary equity holders
Underlying profit before tax of £158m (31 March 2017: £123m) less tax charge of £6m (31 March 2017: £29m), less dividends and distributions (net of tax relief) of £15m (31 March 2017: £15m) and was equal to £137m (31 March 2017: £79m). The underlying tax charge is calculated by applying the statutory tax rate for the relevant period to the taxable items adjusted on the underlying basis.
Underlying return on assets
Underlying profit after tax attributable to equity holders as a percentage of average total assets for a given period.

60
Additional information
Officers and professional advisers Non-Executive Directors Chairman Jim Pettigrew (1) (4)
Deputy Chairman and Senior Independent Non-Executive Director David Bennett (1) (2) (3) (4)
Non-Executive Directors Clive Adamson (2) (3)
David Browne (1) (2) (3)
Paul Coby (3)
Adrian Grace (1)
Fiona MacLeod (3) (4)
Dr Teresa Robson-Capps (2)
Tim Wade (2) (3)
Executive Directors David Duffy Debbie Crosbie Ian Smith Company Secretary Lorna McMillanGroup General Counsel James Peirson Independent auditors Ernst & Young LLP 1 Bridgewater Place Water Lane Leeds LS11 5QR
(1) Member of the Remuneration Committee(2) Member of the Audit Committee (3) Member of the Risk Committee (4) Member of the Governance and Nomination Committee

61
CYBG PLCRegistered number 09595911 (England and Wales)
ARBN 609 948 281 (Australia)
Head Office: London Office: Registered Office:30 St. Vincent Place Floor 15, The Leadenhall Building 20 Merrion Way
Glasgow 122 Leadenhall Street Leeds G1 2HL London West Yorkshire
EC3V 4AB LS2 8NZ
www.cybg.com