batch benzaldehyde derivatives - biomedical engineering · batch production of benzaldehyde...
TRANSCRIPT
Batch Production of Benzaldehyde Derivatives
Abstract This is a design for batch production process of benzaldehyde, benzoin, and
cinnamaldehyde. 2,500 tonne/y of benzoin and 500 tonne of cinnamaldehyde are to be sold as product, while 3,500 tonne/y of benzaldehyde will be sold solely as a raw material for benzoin and cinnamaldehyde.
Batch schedules were developed for each product. Benzaldehyde is to be produced as a
semi-batch process throughout the year on its own line. A rate of 6 batches/day is achievable for the benzaldehyde process. Benzoin and cinnamaldehyde are to be operated on the same line at different times of the year. Benzoin was designed as a three-month campaign operating at a rate of 1 batch/day. Cinnamaldehyde was designed to run in between the benzoin campaigns as a one month campaign. A rate of 8 batches/day is achievable for the cinnamaldehyde process.
Based on a ten-year plant life, the total costs for the benzaldehyde, benzoin, and
cinnamaldehyde processes are $8,162,715/y, $4,612,322/y, and $5,567,461/y, respectively. The break-even prices for the products benzoin and cinnamaldehyde are $1.84/kg and $11.13/kg, respectively.

1
I. Introduction Benzaldehyde, benzoin, and cinnamaldehyde have many applications. One of the most
common applications of the products is as a flavor and fragrance additive. Because of this
application, it was desired to produce food-grade benzoin and cinnamaldehyde with purities of
at least 99 weight %.
The benzaldehyde derivatives processes were to be designed within an existing facility
provided by Specialty Batch Products, Inc. Two lines were available as well as several pieces of
equipment. The design of the processes included thorough material and energy balances,
detailed recipes of each process, design of appropriate equipment, a multi-product schedule, and
an economic analysis.

2
II. Results
A. Process Flow Diagram (PFD) and Stream Table Figures 1-3 show the PFDs for each process.
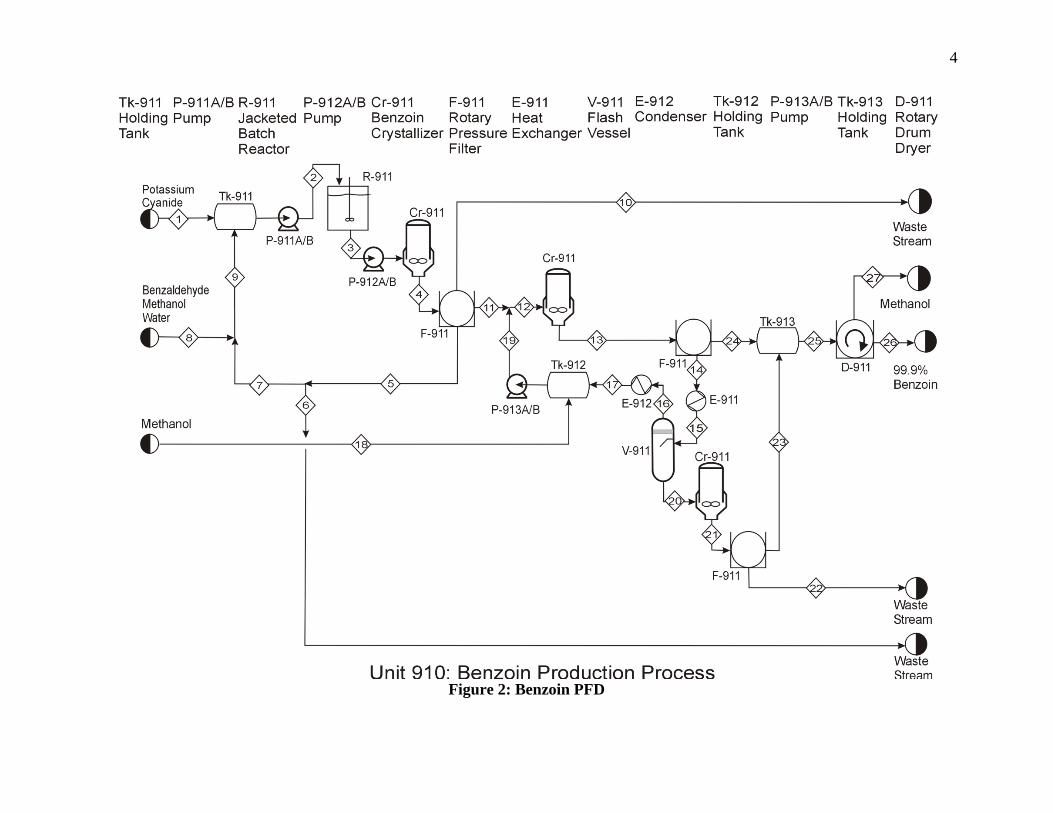
B. Multi-Product Schedule Gantt charts were developed for each process based on the detailed recipe designed for
each process. The Gantt charts are shown in Figures 4-6. Figure 4 shows the schedule for
benzaldehyde to produce 6 batches/day, assuming a 24 h operation. After the first reaction takes
place in R-901A, the products are moved to Tk-901 to allow a second batch to be produced in
R-901B, a separate reactor for the same reaction. The total times in Tk-901 and R-902 are
indicated by the boxes below the schedule, listed as 1.17 h. Therefore, this scheduling allows 6
batches/day to be possible. It should also be noted that the schedule stops before the tower
separation, as this is operated as a continuous column.
Figure 5 shows the Gantt chart for benzoin producing 1 batch/day. Because of multiple
crystallizations and filtering, the benzoin process takes a much longer time to produce one
batch. The total batch time is 23 hours.
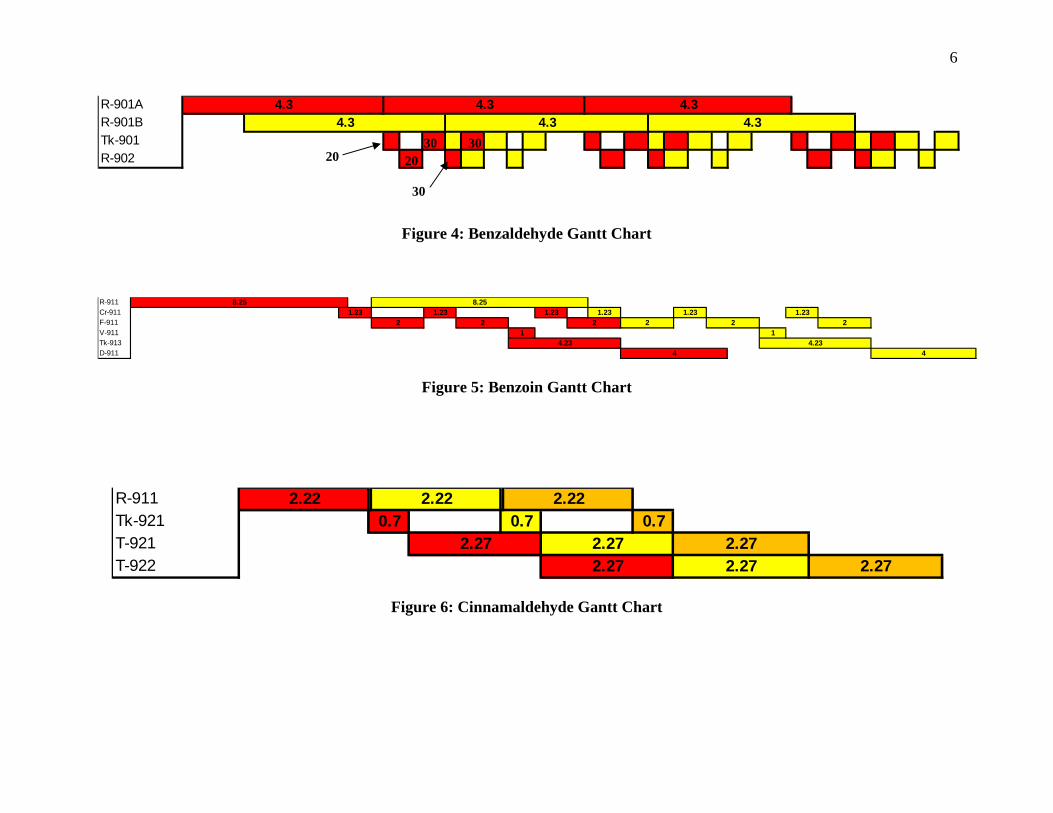
Figure 6 shows the Gantt chart for cinnamaldehyde producing 8 batches/day. Similar to
the benzaldehyde process, a hold tank is utilized in the cinnamaldehyde process after the first
reactor to allow a second batch to begin in the same reactor immediately after the first batch.
This allows for an overlapping schedule similar to benzaldehyde, but unlike benzaldehyde, a
second reactor is not necessary.

Figure 1: PFD for Benzaldehyde Production Proceess
3
4
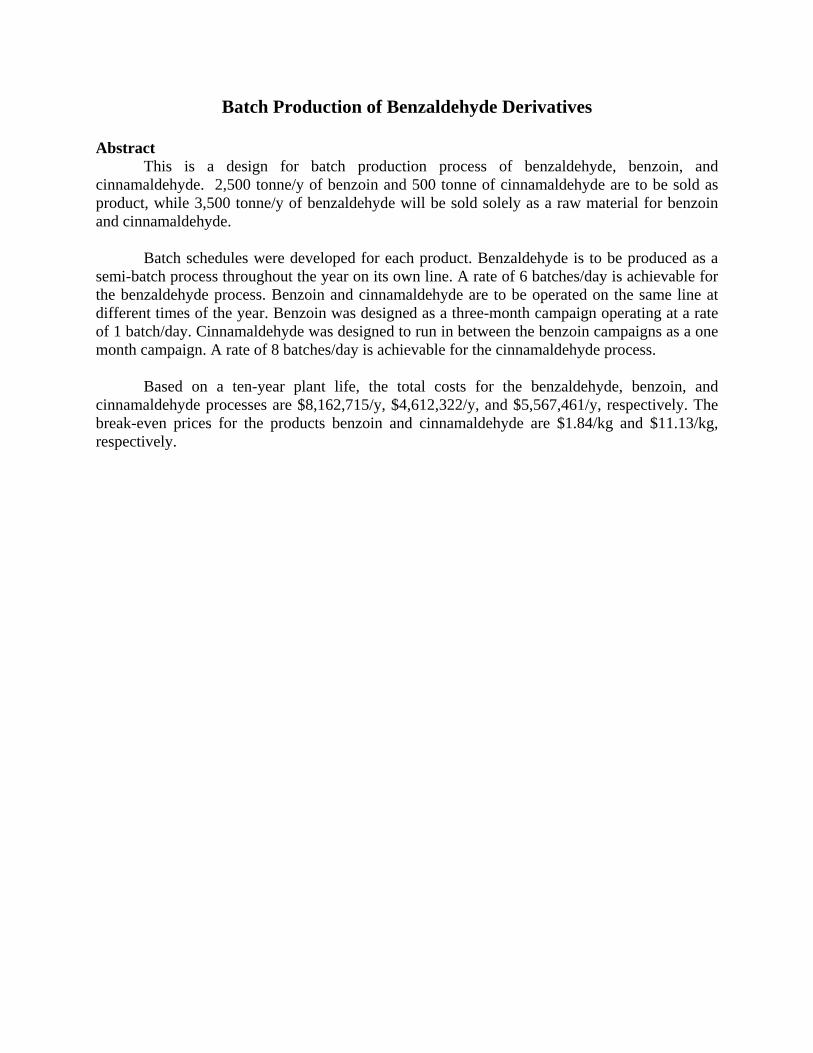
Figure 2: Benzoin PFD

5
Figure 3: PFD for Cinnamaldehyde Production Process
6
Figure 4: Benzaldehyde Gantt Chart
Figure 5: Benzoin Gantt Chart
Figure 6: Cinnamaldehyde Gantt Chart
R-901AR-901BTk-901R-902
4.34.34.3
4.34.3
4.3
R-911Cr-911 1.23 1.23 1.23F-911 2 2 2 2V-911 1 1Tk-913D-911 44
4.23
1.238.25
4.23
2
8.25
21.231.23
R-911 2.22Tk-921T-921T-922 2.27
0.72.272.27
2.272.27
2.22
2.27
2.220.7 0.7
2030
2030
30