bath and north east somerset sfra technical report · this bath and north east somerset (b&nes)...
TRANSCRIPT
Strategic Flood Risk Assessment of Bath and North East Somerset
VOLUME I Technical Report
April 2008
s u c c e s s f u l p e o p l e s u c c e s s f u l p r o j e c t s s u c c e s s f u l p e r f o r m a n c e
Contents
Foreword .................................................................................................................... i
1. Introduction................................................................................................... 1-1
2. Strategic assessment................................................................................... 2-1
3. Environment and planning context............................................................. 3-1
4. Flood defences and assets.......................................................................... 4-1
5. Flood warning and emergency planning .................................................... 5-1
6. Flooding from rivers..................................................................................... 6-1
7. Flooding from the sea .................................................................................. 7-1
8. Flooding from land (surface water)............................................................. 8-1
9. Flooding from groundwater......................................................................... 9-1
10. Flooding from sewers ................................................................................ 10-1
11. Flooding from artificial sources ................................................................ 11-1
12. Glossary and notation................................................................................ 12-1
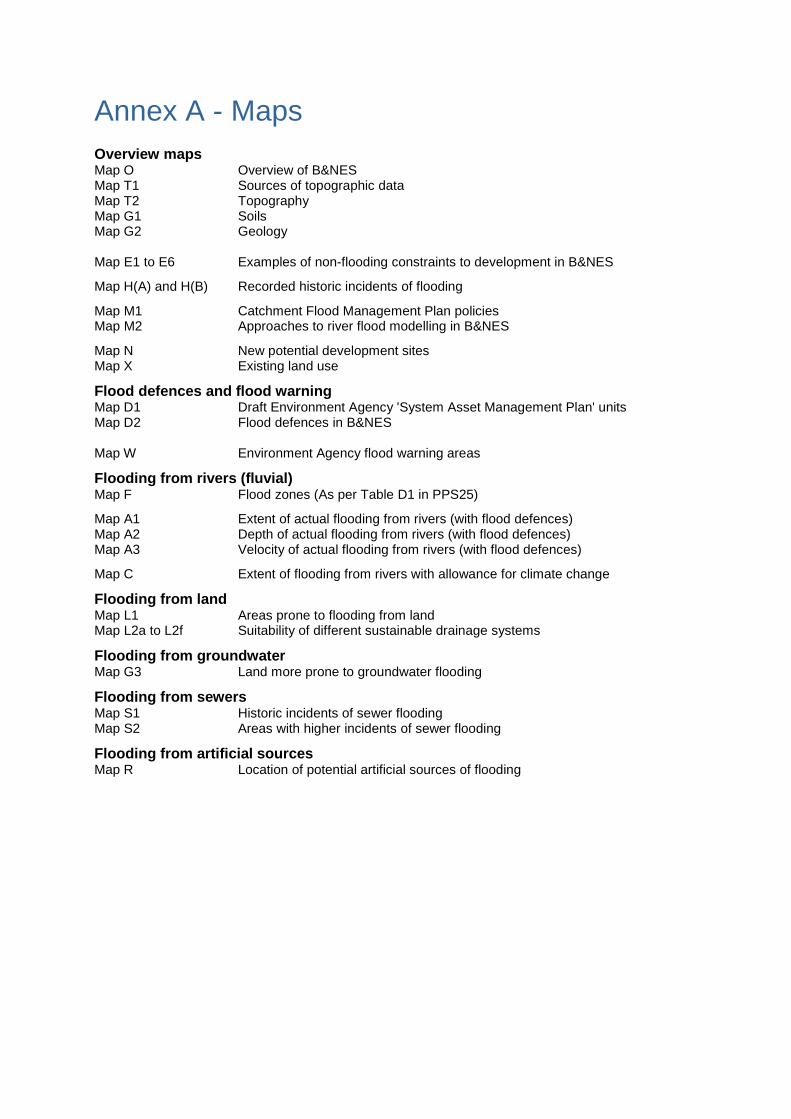
Annex A - Maps Overview maps Map O Overview of B&NES Map T1 Sources of topographic data Map T2 Topography Map G1 Soils Map G2 Geology
Map E1 to E6 Examples of non-flooding constraints to development in B&NES
Map H(A) and H(B) Recorded historic incidents of flooding
Map M1 Catchment Flood Management Plan policies Map M2 Approaches to river flood modelling in B&NES
Map N New potential development sites Map X Existing land use
Flood defences and flood warning Map D1 Draft Environment Agency 'System Asset Management Plan' units Map D2 Flood defences in B&NES
Map W Environment Agency flood warning areas
Flooding from rivers (fluvial) Map F Flood zones (As per Table D1 in PPS25)
Map A1 Extent of actual flooding from rivers (with flood defences) Map A2 Depth of actual flooding from rivers (with flood defences) Map A3 Velocity of actual flooding from rivers (with flood defences)
Map C Extent of flooding from rivers with allowance for climate change
Flooding from land Map L1 Areas prone to flooding from land Map L2a to L2f Suitability of different sustainable drainage systems
Flooding from groundwater Map G3 Land more prone to groundwater flooding
Flooding from sewers Map S1 Historic incidents of sewer flooding Map S2 Areas with higher incidents of sewer flooding
Flooding from artificial sources Map R Location of potential artificial sources of flooding
Foreword
Foreword Bath and North East Somerset (B&NES) Council are required to prepare a Strategic Flood Risk Assessment (SFRA) to support the production of their Local Development Framework (LDF).
The SFRA creates a strategic framework for the consideration of flood risk when making planning decisions. It has been developed in accordance with Planning Policy Statement 25: Development and Flood Risk (PPS25), as well as additional guidance provided by the Environment Agency.
The guidance provided in PPS25 requires local authorities and those responsible for development decisions to demonstrate that they have applied a risk-based, sequential approach in preparing development plans and considered flooding through the application of a Sequential Test. Failure to demonstrate that such a Test has been undertaken potentially leaves planning decisions and land allocations open to challenge during the planning process.
The underlying objective of the risk-based sequential allocation of land is to reduce the exposure of new development to flooding and reduce the reliance on long-term maintenance of built flood defences. Within areas at risk from flooding, it is expected that development proposals will contribute to a reduction of flood risk.
A SFRA is essential in enabling a strategic and proactive approach to be applied to flood risk management. The assessment allows us to understand current flood risk on a wide-spatial scale and how this is likely to change in the future.
The main objective of the B&NES SFRA is to provide flood information;
• so that an evidence-based and risk-based sequential approach can be adopted when making planning decisions, in line with PPS25
• that is strategic in that it covers a wide-spatial area and looks at flood risk today and in the future
• that supports sustainability appraisals of the local level documents (including the LDF)
• that identifies what further investigations may be required in detailed flood risk assessments (FRAs) for specific development proposals.
The SFRA is presented in a number of documents;
• Non technical summary
• Volume I – technical report and flood maps
• Volume II – user guide
• Volume III – management guide
Volume III – management guide The SFRA is a live document which is intended to be updated as new information and guidance becomes available. The outcomes and conclusions of the SFRA may not be valid in the event of future changes. It is the responsibility of the user to ensure they are using the best available information when making a land planning decision.
B&NES SFRA (April 2008) i Volume I - Technical Report
1. Introduction
Introduction
The B&NES SFRA is a 'live' document. The current version has been developed using the best information and concepts available at the time. As new information and concepts become available the document will be updated and so it is the responsibility of the reader to be satisfied that they are using the most up-to-date information and that the SFRA accounts for this information. All revisions to this summary document are listed in the table.
Version Issue Date Issued by Issued to
Final 23/04//2008 Capita Symonds
Ltd
B&NES, EA
B&NES SFRA (April 2008) Volume I - Technical Report
1-1
Introduction
Purpose of this report
This Bath and North East Somerset (B&NES) SFRA has been developed to inform the Local Development Framework (LDF). The SFRA must be robust and be evidence-based so that it does not leave planning decisions and land allocations open to challenge through the land use planning process. It is crucial that there is transparency in the data and methods used in the assessment.
This volume of the Bath & North East Somerset Strategic Flood Risk Assessment is the
Technical Report (or evidence base)
This report represents Volume I of the SFRA, and is the evidence base of Flood Risk in B&NES. This document contains all of the technical information and methods used in the assessment of flood risk across the study area. It includes information on the sources and reliability of data, methods used in the assessment, discussions regarding uncertainty, and key assumptions made.
To ensure that the technical information is easily updated when new assessments are undertaken in the future, the six ‘sources of flooding’ have been reported in stand alone chapters. Chapter 2 provides a summary of flood risk across the B&NES District. The maps generated during the assessment are provided in Annex A to this document.
The user is referred to Volumes II and III for guidance on how to interpret the information in this technical report and how to update the SFRA following improvements in data or changes in guidance. The SFRA is based on a range of data from different sources and of various degrees of certainty. It is the responsibility of the user to consider the source and certainty of the data when referring to the flood risk summaries and flood maps.
Overview of B&NES District
Location
B&NES district covers a 350km² area south east of Bristol in South West England. Map O in Annex A shows the district boundary and main rivers.
The largest urban area is the historic and world heritage city of Bath, which lies in the north east corner of the B&NES district. Bath is famous for its naturally occurring hot springs and the land surrounding the city is designated as an Area of Outstanding Natural Beauty (AONB). The towns of Keynsham and Midsomer Norton also fall within the district.
The remaining area is predominantly rural, featuring medieval enclosed fields and Avon forest. Chew Valley Reservoir lies in the south west corner and is an important water resources reservoir. It is designated as a Site of Special Scientific Interest (SSSI) and a Special Protection Area (SPA).
The population of B&NES has been slowly but steadily growing during recent decades and at the 2001 census stood at 169 040. About half the population lives in the city of Bath with the remaining living in Keynsham, Midsomer Norton and Radstock. There are also many villages and hamlets spread across 47 rural parishes which accommodate a substantial rural population. Map X in Annex A shows the existing land use in B&NES.
The rural landscape of the District is striking and diverse. Around a quarter of the rural areas lie within designated Areas of Outstanding Natural Beauty (AONB). Thirty villages in B&NES are designated as Conservation Areas, to preserve and enhance their existing character. Strung along the foothills of the Mendips are the villages of Ubley, Compton Martin and East and West Harptree. To the north of the Mendips is the undulating valley of the River Chew within which lie Chew Valley and Blagdon Lakes and a network of small villages. The largest of these is the historic village of Chew Magna which acts as a community focus for villages and hamlets. Maps E1, E2, E3 and E5 provide an indication of environmental constraints in B&NES.
B&NES SFRA (April 2008) Volume I - Technical Report
1-2
Introduction
Topography
The topography of B&NES is shown in Map T2 in Annex A. The Lower Avon valley in the north east corner of B&NES is the lowest lying area of land and slopes gently westward towards the Severn Estuary. The remaining area is fairly steep and generally slopes in a north easterly direction to meet the Lower Avon.
Topographic data available for B&NES includes Light Detecting and Ranging (LiDAR) data and ground survey data. Figure T1 in Annex A shows the availability of topographic datasets available for Bath and North East Somerset. Topographic datasets include:
• Synthetic Aperture Radar (SAR) dataset over the whole study area with a vertical root mean square error (RSME) in the order of ± 1m;
• Light Detecting and Ranging (LiDAR) dataset over much of the area with a vertical RSME in the order of ± 0.15m; and
• Ground survey of river cross-sections along most of the main watercourses with a vertical RMSE of less than ± 0.05m.
All topographic data has been used in the SFRA, with a preference to sources that are more accurate.
Geology and soils
Maps G1and G2 in Annex A show the soils and geology in B&NES, respectively.
The area surrounding Bath is underlain by limestone and clays mainly Great Oolite, Inferior Oolite, Upper Lias and Lower Lias characteristic of the Cotswolds to the east. This area is dominated by a lime rich loamy over clayey soils with a slight impeded drainage and in the higher regions a layer of freely draining, shallow lime rich soils. The semi-permeable geology and steep gradients allow for the emergence of springs, including the famous hot springs, which may cause flooding. The river valley and floodplains are underlain by Lower Lias Clays and Alluvium. The combination of low lying ground, soils with slightly impeded drainage and a semi-permeable underlying geology can lead to surface water flooding.
The lower lying areas in the north of B&NES where the River Avon and the River Chew flow into Keynsham, are underlain by Triassic mudstones and Upper Westphalian Limestone (and coal beds). In a low lying area with a mixture of both impermeable and semi-permeable geology only a reduced amount of water can penetrate into the underlying geology and therefore there is a higher risk of surface water flooding. Along the Chew Valley, before the confluence with the River Avon, the river is underlain by acid loamy and clayey soils which are slowly permeable but have impeded drainage. The town of Keynsham is underlain by loamy and clayey soils which are either naturally or seasonally wet with high groundwater levels. This puts the town and its surrounding area at risk of both groundwater and surface water flooding.
The Cam and Wellow Brook catchments are areas of high ground, underlain by Triassic Mudstones with a band of Inferior Oolite separating the two streams. The town of Midsomer Norton is situated near the source of the Wellow Brook at the top of the Cam Valley. The soils consist of acid loamy and clayey soils which are slowly permeable with impeded drainage in the higher to middle reaches of the two streams, changing to seasonally wet acid loamy and clayey soils which are slowly permeable and freely draining in the lower reaches. In the higher reaches of the two streams the emergence of springs indicates a possible risk of groundwater flooding within this area. The mid reaches of the two streams are at risk from surface water flooding due to the underlying impermeable geology and soils with impeded drainage.
The Chew Valley Lake, a low lying lake that is situated at the northern edge of the Mendips, is underlain by Triassic mudstone but is surrounded by the limestone hills of the Mendips to the south
B&NES SFRA (April 2008) Volume I - Technical Report
1-3
Introduction
and a ridge of Inferior Oolite to the West and North. The soils of the low lying land around the lake are slightly acid loamy and clayey soils with slightly impeded drainage. Due to the mixed geology and topography, the area is particularly at risk from surface water flooding as the water is unable to freely drain into the soil and the underlying geology.
The soils covering the limestone ridge of the Mendips in the south consist of slightly acid but base rich soils which are freely draining. In the north and west the limestone ridges are covered with freely draining shallow lime rich soils. This area has a low risk of flooding due to the topography of the land and the freely draining soils.
Sources of flooding
B&NES contains localised areas that are prone to flooding from a range of sources including rivers, sewers, land, and groundwater. The type of flooding is dependent on the interaction of rainfall, catchment characteristics and the sea. PPS25 identifies six sources of flooding to be investigated in an SFRA as flooding from rivers, the sea, groundwater, land, sewers and artificial sources. Each source is described in the following section and in more detail in the remaining chapters of this report.
Rivers
The River Avon, River Chew, Cam Brook and Wellow Brook are the main watercourses in B&NES.
River Avon is a major river in South West England and is the largest river within B&NES. It rises in Wiltshire and flows through Bath and Bristol before joining the River Severn at Avonmouth. The river is known as Lower Avon when it flows through the centre of Bath. Downstream of Bath, the river forms the northern boundary of B&NES. Flow on the Lower Avon through Bath is controlled by a series of weirs. Flooding is controlled by a series of embankments and walls in Bath.
The River Chew rises from the limestone hills of the Mendips in the western side of B&NES. It flows north west through Chew Valley Reservoir, a large artificial reservoir that attenuates flow, before flowing through the Chew Valley towards its confluence with the River Avon at Keynsham.
The Cam and Wellow Brooks are two tributaries of the River Avon which join to form the Midford Brook at Midford. Both the brooks rise from springs in the south of B&NES near Midsomer Norton. The valleys are well defined with the brooks free to meander across their floodplain. Flooding on the River Somer, a tributary of the Wellow Brook, is controlled in Midsomer Norton by a bypass tunnel.
Flooding from these rivers has occurred at a number of locations throughout B&NES and is considered the major source of flood risk. Of the 229 recorded incidents of flooding in B&NES, 187 (82%) are from this source of flooding. Flooding from rivers is explored further in Chapter 6.
Land (surface water)
This is the second largest source of flooding in B&NES. Of the 229 recorded incidents of flooding in B&NES, 42 (18%) are from this source of flooding. Whilst the mechanisms for runoff are well understood, predicting flooding from land is more complicated than other forms of flooding.
Flooding can occur anywhere throughout B&NES, although flooding is more likely to occur where soils and geology are less permeable, and where there is flat ground for water to collect. This type of flooding is explored further in Chapter 8.
B&NES SFRA (April 2008) Volume I - Technical Report
1-4
Introduction
Sea
B&NES is located a significant distance from the coastline (14.5km) and, as such, it is not affected by coastal flooding.
The River Avon freely discharges into the Severn Estuary, so water levels on the River Avon are influenced by tide levels. The current normal tidal limit on the River Avon is a weir in Keynsham, meaning that in normal events, tide levels do not influence flooding in B&NES.
Tides may affect flooding in B&NES during extreme events and/or when sea levels rise due to climate change. This type of flooding is explored further in Chapter 7.
Groundwater
For the purpose of the SFRA, groundwater flooding has been defined as flooding from sub-surface water. There are a number of mechanisms that can cause this type of flooding including regional groundwater rise, underground barriers to flow and rebound when pumping from mining activities ceases.
Groundwater flooding is not considered a significant issue in B&NES, although there are a number of springs in the north eastern corner. This type of flooding is explored further in Chapter 9.
Sewers
Flooding from sewers occurs when the man-made sewer system cannot convey the amount of water. This can occur due to extreme rainfall events, due to infrastructure failure or due to increased runoff from new developments. Predicting areas prone to sewer flooding is complex as flooding is localised and sewer systems are constantly being upgraded.
Wessex Water have provided a dataset to be used in predicting areas more prone to flooding from sewers. The main towns affected are Bath, Keynsham, Radstock and Midsomer Norton. This type of flooding is explored further in Chapter 10.
Artificial sources
Artificial sources of flooding within B&NES include the Kennet and Avon Canal, Chew Valley Lake and Chew Magna Reservoir. Flooding may occur if these were to overtop, leak or breach. Whilst a breach of embankments has a low probability, the consequences could be catastrophic.
The spillway at Chew Magna Reservoir was damaged in July 1968. In addition to this intensive rain and a series of bridge failures occurred during the storm and caused damage further downstream. Flooding from artificial sources is explored further in Chapter 11.
B&NES SFRA (April 2008) Volume I - Technical Report
1-5
Strategic assessment
2. Strategic assessment
The B&NES SFRA is a 'live' document. The current version has been developed using the best information and concepts available at the time. As new information and concepts become available the document will be updated and so it is the responsibility of the reader to be satisfied that they are using the most up-to-date information and that the SFRA accounts for this information. All revisions to this summary document are listed in the table.
Version Issue Date Issued by Issued to
Final 23/04//2008 Capita Symonds
Ltd
B&NES, EA
B&NES SFRA (April 2008) Volume I - Technical Report
2-1
Strategic assessment
Context
Information concerning the six types of flooding (river, sea, land, groundwater, sewer and artificial sources) has been collated and analysed for the whole of the study area. Where relevant, the four types of flooding (flood zones, actual, residual-overtopping, and residual-breach/failure) have been addressed.
The assessment has aimed to characterise flood risk today and also into the future. A 100 year time horizon has been assessed and is considered appropriate for land use planning.
The Environment Agency and other key stakeholders have been contacted throughout the SFRA process in an attempt to gather as much information as possible. Several meetings with the Environment Agency have provided an insight into their expectations of the SFRA.
The methodology proposed for the SFRA was based on the best use of available information and involved minimal new analyses and hydraulic modelling. Each dataset was reviewed with regard to its accuracy and the most appropriate datasets were used to define flood risk across B&NES under varying conditions.
In general, the results of the more detailed Environment Agency hydraulic models (ISIS and TUFLOW) were used in preference to the results from their national generalised broad scale models (JFLOW), in defining Flood Zones. It is important that the source of flood data is considered whenever using it to inform a land use planning decision.
B&NES and the Environment Agency will need to manage the update of the SFRA datasets in the future, as more detailed flood risk information becomes available. The management and update protocols are outlined in Volume III of the SFRA.
Level 1 Assessment for B&NES
Summary of flood risk in B&NES
The dominant flood risk affecting the B&NES district is flooding from rivers. The principal watercourses are the Lower Avon, River Chew, Cam Brook and Wellow Brook. Incidents of surface water flooding and sewer flooding are also significant however there is less certainty in assessing this risk at a strategic level. Flooding from artificial sources is also important due to the severity of consequences.
The areas most at risk of flooding are;
• Bath - at risk of flooding from rivers, sewers, surface water, artificial sources and to a lesser degree from groundwater (springs).
• Keynsham - at risk of flooding from rivers (which may be tidally influenced), surface water, sewers and artificial sources.
• Midsomer Norton/Radstock - at risk of flooding from rivers, surface water and sewers. Note: Midsomer Norton benefits from a flood alleviation scheme during a 1% AEP river flood event.
• Chew Magna and downstream communities - at risk of flooding from rivers, surface water and artificial sources.
Climate change impacts may increase the severity and frequency of storms and therefore flooding, as well as causing a rise in sea levels. Flooding from rivers, sewers and surface water is therefore likely to increase throughout B&NES in the future. B&NES may also become increasingly affected by tidal flooding as the tidal limit moves further inland.
B&NES SFRA (April 2008) Volume I - Technical Report
2-2
Strategic assessment
The areas which are likely to have the biggest increases in flood risk in the future are:
• Bath - increased flooding from rivers, sewers and surface water.
• Keynsham - increased flooding flooding from rivers (which will be more tidally influenced), surface water and sewers.
• Midsomer Norton/Radstock - increased flooding from rivers, surface water and sewers. Note: modelling results indicate that Midsomer Norton benefits from a flood alleviation scheme during a future 1% AEP river flood event.
• Chew Magna - increased flooding from rivers and surface water.
Flood risk statistics in B&NES
A Level 1 SFRA is undertaken over the whole of B&NES administrative boundary so that the Council can make a comparative assessment of flood risk. Thus they may undertake a risk-based approach and ‘Sequential Test’ as described in PPS25.
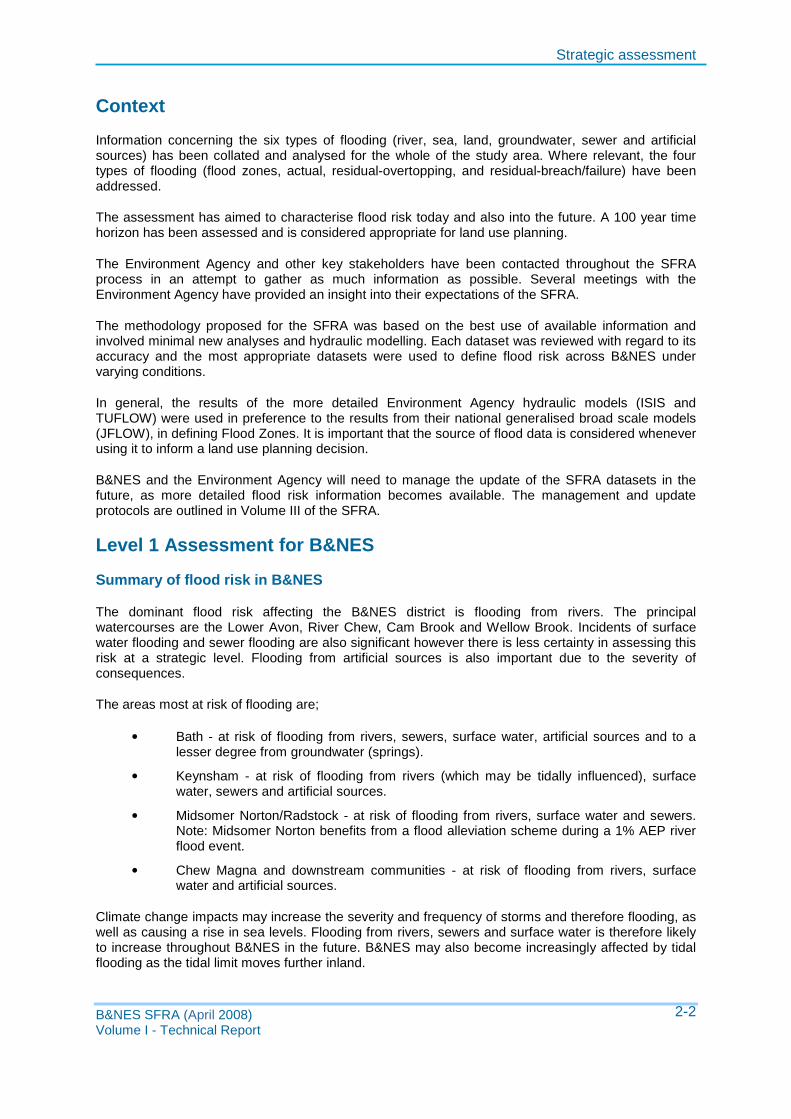
The draft RSS directs growth to existing urban areas, the RSS adds a further 6000 dwellings South West of Bristol and 1,500 South West of Bath. Within Bath and North East Somerset growth is to be focused on maximising the potential of brownfield land in Bath and urban extensions to Bath and Bristol. The latter will involve sites that are primarily greenfield. Sites which have been identified as having potential for development or redevelopment in B&NES are shown on Map N in Annex A. Table 2.1 provides a summary of the key flood risk statistics across B&NES.
Table 2.1 Key flood risk statistics for B&NES
Approximate area or number
Percentage of total area or number
B&NES statistics (Map O) B&NES district area 350 km2 100% Existing developed area 40 km2 11% Flood statistics Flooding from rivers and sea (Maps F, A1 and W) Area of B&NES within Flood Zone 3b (Functional Floodplain) 17 km2 5%
Area of B&NES within Flood Zone 3a (High flood risk) 19 km2 5% Area of B&NES within Flood Zone 2 (Medium flood risk) 25 km2 7% Area of B&NES within Flood Zone 3a which is defended <1 km2 <1% Area B&NES within covered by a flood warning service 11 km2 3% Area B&NES within covered by a flood emergency plan All All Other sources of flooding (Maps L, G3, S1, S2 and R) Area of B&NES prone to flooding from land (high) 77 km2 22% Area of B&NES prone to flooding from groundwater (high) 0 km2 0% Area of B&NES prone to flooding from sewers (high) 48 incidents N/A Area of B&NES prone to flooding from artificial sources (high) 4 km2 1%
B&NES SFRA (April 2008) Volume I - Technical Report
2-3
Strategic assessment
Level 2 Assessment for Bath
The South West RSS recognises Bath as a Strategically Significant Cities and Town (SSCT). This means that after a regional sustainability appraisal (informed by a regional flood risk appraisal), the city has been identified as a key development site. For this reason, a more detailed assessment has been undertaken for Bath in the SFRA.
As Bath is constrained by a range of sustainability factors, development may be required in areas with a medium (Flood Zone 2) or higher (Flood Zone 3a) risk of flooding. This section discusses the various options available to B&NES should the Sequential Test indicate that development in those areas is required.
Summary of flood risk in Bath
The dominant sources of flood risk in Bath are rivers and sewers, although there is some risk from surface water, artificial sources and groundwater. The main areas at risk are:
• Rivers - Map F_Bath shows the Flood Zones within Bath as per PPS25. Map A1_Bath shows the actual extent of flooding when existing flood defences are in place.
Map A2_Bath indicates the depth of flooding during a 1% AEP event. The existing flood defences do not prevent flooding during a 1% AEP flood event. The most number of properties are at risk in Grosvenor, central Bath (St John's Road and recreation/cricket grounds), Kingsmead (Riverside Road), Lower Weston (around the confluence) and Locksbrook.
Map A3_Bath indicates the velocity of flooding during a 1% AEP event. The velocity of floodwater through Bath is expected to be fairly low (<0.5m/s), although some faster velocities are expected around the Cleveland Bridge and around the A367/A36 interchange.
• Sewers - the drainage system throughout Bath is historic and aging, and may require a significant upgrade in the future. Incidents of sewer flooding have occurred throughout the City including Central Bath, Larkhall, Walcot, Locksbrook, Weston Park and Southdown.
• Surface water - where water may collect in low-lying without sewer systems and behind flood defences.
• Artificial sources - some risk of flooding from the Kennet and Avon Canal to the east of the City.
• Groundwater - small risk of flooding from springs in the north east extents of the City.
Climate change is expected to increase the 1% AEP floodplain along the Lower Avon and tributaries. In particular, the extent of flooding is expected to increase near Great Putney Street, Dolemeads, Kingsmead, Lower Weston, Locksbrook and Newbridge.
Flood risk statistics in Bath
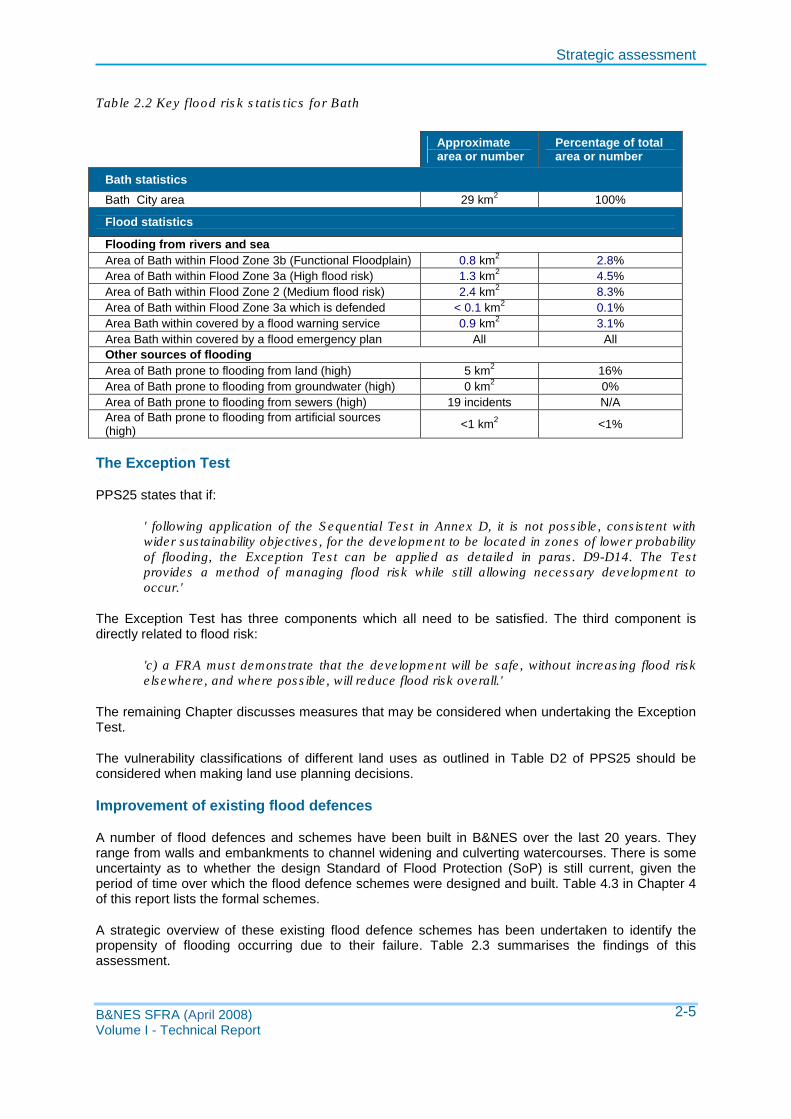
Table 2.2 provides a summary of the key flood risk statistics across Bath.
B&NES SFRA (April 2008) Volume I - Technical Report
2-4
Strategic assessment
Table 2.2 Key flood risk statistics for Bath
Approximate area or number
Percentage of total area or number
Bath statistics
Bath City area 29 km2 100%
Flood statistics
Flooding from rivers and sea Area of Bath within Flood Zone 3b (Functional Floodplain) 0.8 km2 2.8% Area of Bath within Flood Zone 3a (High flood risk) 1.3 km2 4.5% Area of Bath within Flood Zone 2 (Medium flood risk) 2.4 km2 8.3% Area of Bath within Flood Zone 3a which is defended < 0.1 km2 0.1% Area Bath within covered by a flood warning service 0.9 km2 3.1% Area Bath within covered by a flood emergency plan All All Other sources of flooding Area of Bath prone to flooding from land (high) 5 km2 16% Area of Bath prone to flooding from groundwater (high) 0 km2 0% Area of Bath prone to flooding from sewers (high) 19 incidents N/A Area of Bath prone to flooding from artificial sources (high) <1 km2 <1%
The Exception Test
PPS25 states that if:
' following application of the Sequential Test in Annex D, it is not possible, consistent with wider sustainability objectives, for the development to be located in zones of lower probability of flooding, the Exception Test can be applied as detailed in paras. D9-D14. The Test provides a method of managing flood risk while still allowing necessary development to occur.'
The Exception Test has three components which all need to be satisfied. The third component is directly related to flood risk:
'c) a FRA must demonstrate that the development will be safe, without increasing flood risk elsewhere, and where possible, will reduce flood risk overall.'
The remaining Chapter discusses measures that may be considered when undertaking the Exception Test.
The vulnerability classifications of different land uses as outlined in Table D2 of PPS25 should be considered when making land use planning decisions.
Improvement of existing flood defences
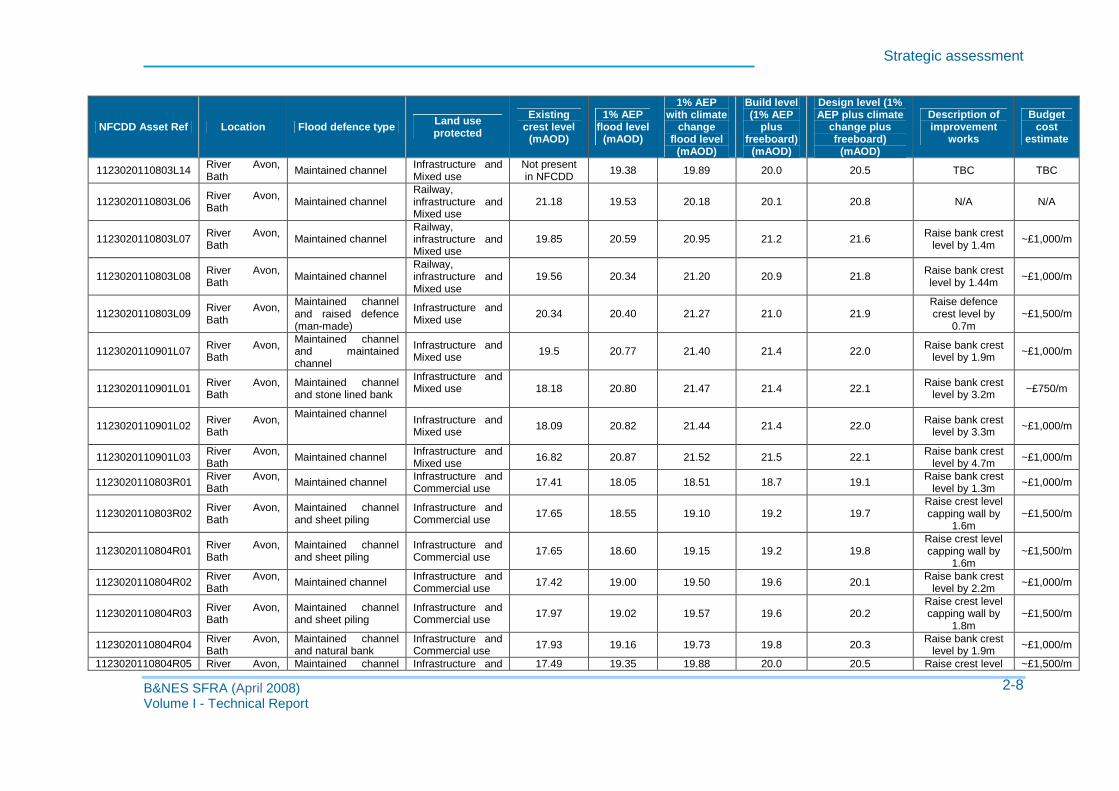
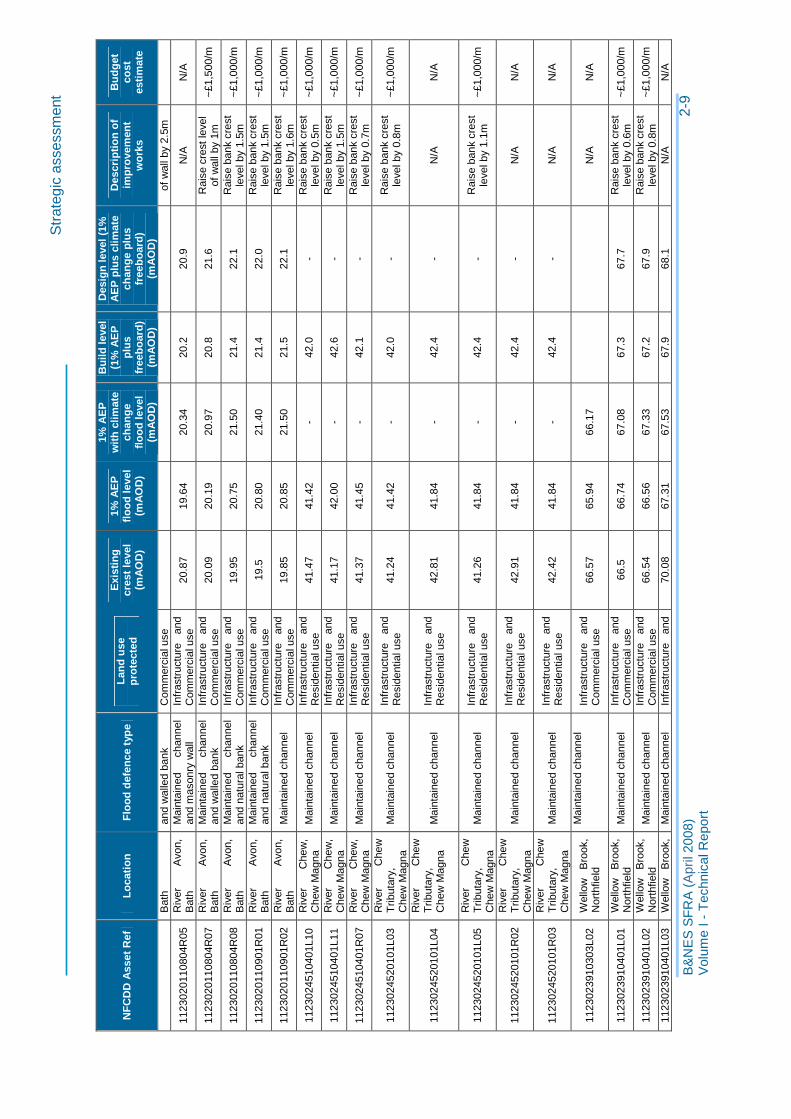
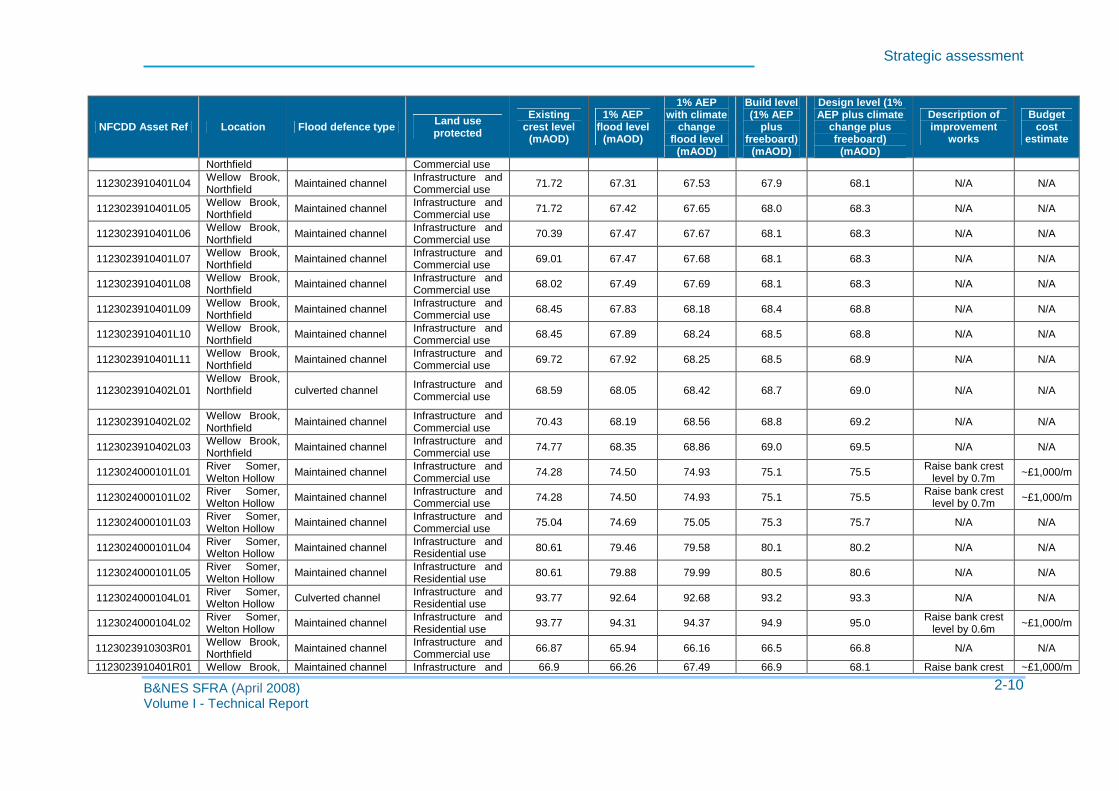
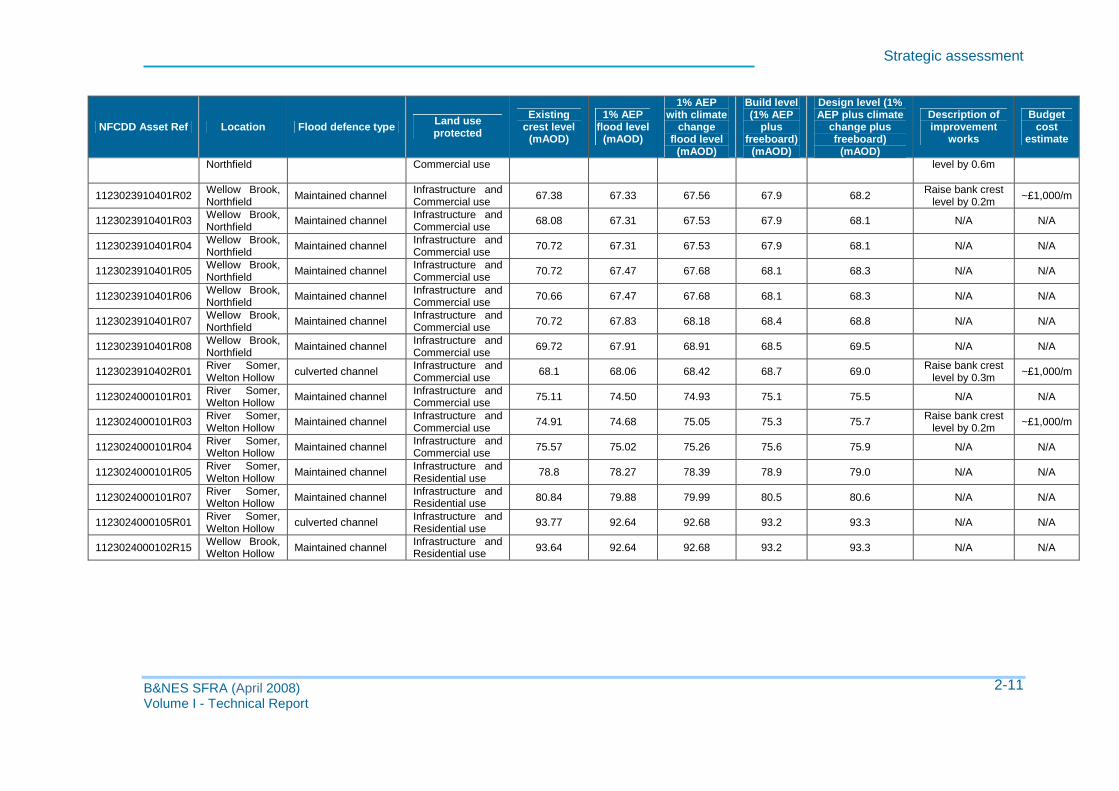
A number of flood defences and schemes have been built in B&NES over the last 20 years. They range from walls and embankments to channel widening and culverting watercourses. There is some uncertainty as to whether the design Standard of Flood Protection (SoP) is still current, given the period of time over which the flood defence schemes were designed and built. Table 4.3 in Chapter 4 of this report lists the formal schemes.
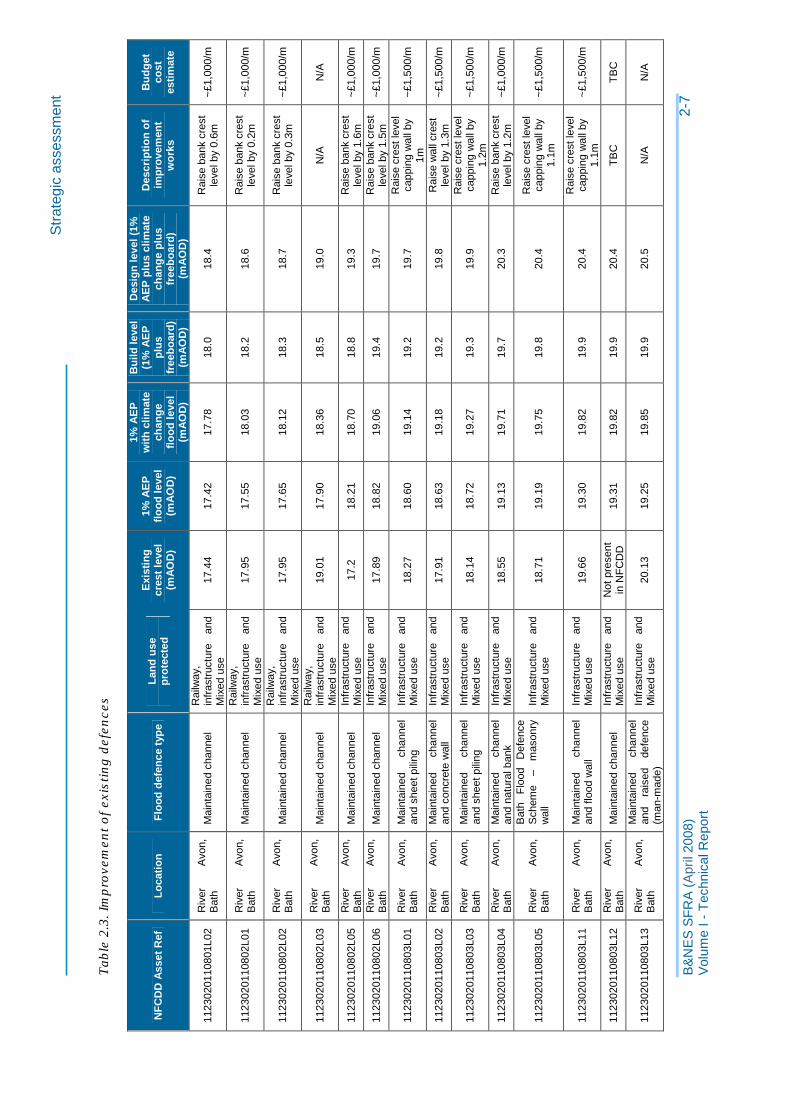
A strategic overview of these existing flood defence schemes has been undertaken to identify the propensity of flooding occurring due to their failure. Table 2.3 summarises the findings of this assessment.
B&NES SFRA (April 2008) Volume I - Technical Report
2-5
Strategic assessment
The location, type, crest level and asset reference of the flood defences was taken directly from the Environment Agency’s National Flood and Coastal Defence Database (NFCDD). In addition the current and future 1% AEP flood water levels at various locations along each of the associated watercourses has been identified. The modelled water levels were compared to the crest levels of the flood defences to establish their current SoP.
Freeboard has been added as part of the comparison to establish the level to which existing flood defences would need to be upgraded to ensure that their SoP is at least 1% AEP flood event as the ‘build level’, and the 1% AEP climate change flood event as the 'design level'. The design level accounts for future climate change and minor improvements, as necessary.
Freeboard is the height added to the design water level to take account of such factors as model accuracy, changes in physical channel and flow characteristics, waves and turbulence, debris blockage and climate change if not otherwise included.
Freeboard is the difference between the designed flood event (with climate change) and the height of the defence. A freeboard of 600mm is recommended for soft engineering defences (e.g. earth embankments), and a freeboard of 300mm is recommended for hard engineering defences (e.g. sheet pile walls).
An approximate budget cost estimate was used to provide an indication of the improvement works identified, in broad terms these equated to:
• Sheet Piles = £2,000/m
• Walls = £1500/m
• Natural Bank = £1000/m
• Stone Ban = £750/m
Most of the defences in B&NES were made up of ‘maintained channel’. The broad SFRA assessment has assumed that these channel banks will be raised in order to improve the SoP. However it may be possible to further deepen and re-grade the channels to improve channel capacity and conveyance.
Sheet pile wall and masonry concrete walls can be raised, depending on their design to improve SoP. In all cases it is assumed that there is an existing suitable foundation to increase the structure
B&NES SFRA (April 2008) Volume I - Technical Report
2-6
Str
ateg
ic a
sses
smen
t
Tabl
e 2.
3. Im
prov
emen
t of e
xist
ing
defe
nces
NFC
DD
Ass
et R
ef
Loca
tion
Floo
d de
fenc
e ty
pe
Land
use
pr
otec
ted
Exi
stin
g cr
est l
evel
(m
AO
D)
1% A
EP
flo
od le
vel
(mA
OD
)
1% A
EP
w
ith c
limat
e ch
ange
flo
od le
vel
(mA
OD
)
Bui
ld le
vel
(1%
AE
P
plus
fr
eebo
ard)
(m
AO
D)
Des
ign
leve
l (1%
A
EP
plu
s cl
imat
e ch
ange
plu
s fr
eebo
ard)
(m
AO
D)
Des
crip
tion
of
impr
ovem
ent
wor
ks
Bud
get
cost
es
timat
e
1123
0201
1080
1L02
R
iver
A
von,
B
ath
Mai
ntai
ned
chan
nel
Rai
lway
, in
frast
ruct
ure
and
Mix
ed u
se
17.4
4 17
.42
17.7
8 18
.0
18.4
R
aise
ban
k cr
est
leve
l by
0.6m
~£
1,00
0/m
1123
0201
1080
2L01
R
iver
A
von,
B
ath
Mai
ntai
ned
chan
nel
Rai
lway
, in
frast
ruct
ure
and
Mix
ed u
se
17.9
5 17
.55
18.0
3 18
.2
18.6
R
aise
ban
k cr
est
leve
l by
0.2m
~£
1,00
0/m
1123
0201
1080
2L02
R
iver
A
von,
B
ath
Mai
ntai
ned
chan
nel
Rai
lway
, in
frast
ruct
ure
and
Mix
ed u
se
17.9
5 17
.65
18.1
2 18
.3
18.7
R
aise
ban
k cr
est
leve
l by
0.3m
~£
1,00
0/m
1123
0201
1080
2L03
R
iver
A
von,
B
ath
Mai
ntai
ned
chan
nel
Rai
lway
, in
frast
ruct
ure
and
Mix
ed u
se
19.0
1 17
.90
18.3
6 18
.5
19.0
N
/A
N/A
1123
0201
1080
2L05
R
iver
A
von,
B
ath
Mai
ntai
ned
chan
nel
Infra
stru
ctur
e an
d M
ixed
use
17
.2
18.2
1 18
.70
18.8
19
.3
Rai
se b
ank
cres
t le
vel b
y 1.
6m
~£1,
000/
m
1123
0201
1080
2L06
R
iver
A
von,
B
ath
Mai
ntai
ned
chan
nel
Infra
stru
ctur
e an
d M
ixed
use
17
.89
18.8
2 19
.06
19.4
19
.7
Rai
se b
ank
cres
t le
vel b
y 1.
5m
~£1,
000/
m
1123
0201
1080
3L01
R
iver
A
von,
B
ath
Mai
ntai
ned
chan
nel
and
shee
t pili
ng
Infra
stru
ctur
e an
d M
ixed
use
18
.27
18.6
0 19
.14
19.2
19
.7
Rai
se c
rest
leve
l ca
ppin
g w
all b
y 1m
~£
1,50
0/m
1123
0201
1080
3L02
R
iver
A
von,
B
ath
Mai
ntai
ned
chan
nel
and
conc
rete
wal
l In
frast
ruct
ure
and
Mix
ed u
se
17.9
1 18
.63
19.1
8 19
.2
19.8
R
aise
wal
l cre
st
leve
l by
1.3m
~£
1,50
0/m
1123
0201
1080
3L03
R
iver
A
von,
B
ath
Mai
ntai
ned
chan
nel
and
shee
t pili
ng
Infra
stru
ctur
e an
d M
ixed
use
18
.14
18.7
2 19
.27
19.3
19
.9
Rai
se c
rest
leve
l ca
ppin
g w
all b
y 1.
2m
~£1,
500/
m
1123
0201
1080
3L04
R
iver
A
von,
B
ath
Mai
ntai
ned
chan
nel
and
natu
ral b
ank
Infra
stru
ctur
e an
d M
ixed
use
18
.55
19.1
3 19
.71
19.7
20
.3
Rai
se b
ank
cres
t le
vel b
y 1.
2m
~£1,
000/
m
1123
0201
1080
3L05
R
iver
A
von,
B
ath
Bat
h Fl
ood
Def
ence
S
chem
e –
mas
onry
w
all
Infra
stru
ctur
e an
d M
ixed
use
18
.71
19.1
9 19
.75
19.8
20
.4
Rai
se c
rest
leve
l ca
ppin
g w
all b
y 1.
1m
~£1,
500/
m
1123
0201
1080
3L11
R
iver
A
von,
B
ath
Mai
ntai
ned
chan
nel
and
flood
wal
l In
frast
ruct
ure
and
Mix
ed u
se
19.6
6 19
.30
19.8
2 19
.9
20.4
R
aise
cre
st le
vel
capp
ing
wal
l by
1.1m
~£
1,50
0/m
1123
0201
1080
3L12
R
iver
A
von,
B
ath
Mai
ntai
ned
chan
nel
Infra
stru
ctur
e an
d M
ixed
use
N
ot p
rese
nt
in N
FCD
D
19.3
1 19
.82
19.9
20
.4
TBC
TB
C
1123
0201
1080
3L13
R
iver
A
von,
B
ath
Mai
ntai
ned
chan
nel
and
rais
ed
defe
nce
(man
-mad
e)
Infra
stru
ctur
e an
d M
ixed
use
20
.13
19.2
5 19
.85
19.9
20
.5
N/A
N
/A
2-7
B&
NE
S S
FRA
(Apr
il 20
08)
Vol
ume
I -T
echn
ical
Rep
ort
Strategic assessment
NFCDD Asset Ref Location Flood defence type Land use protected
Existing crest level
(mAOD)
1% AEP flood level
(mAOD)
1% AEP with climate
change flood level
(mAOD)
Build level (1% AEP
plus freeboard)
(mAOD)
Design level (1% AEP plus climate
change plus freeboard)
(mAOD)
Description of improvement
works
Budget cost
estimate
1123020110803L14 River Avon, Bath Maintained channel Infrastructure and
Mixed use Not present in NFCDD 19.38 19.89 20.0 20.5 TBC TBC
1123020110803L06 River Avon, Bath Maintained channel
Railway, infrastructure and Mixed use
21.18 19.53 20.18 20.1 20.8 N/A N/A
1123020110803L07 River Avon, Bath Maintained channel
Railway, infrastructure and Mixed use
19.85 20.59 20.95 21.2 21.6 Raise bank crest level by 1.4m ~£1,000/m
1123020110803L08 River Avon, Bath Maintained channel
Railway, infrastructure and Mixed use
19.56 20.34 21.20 20.9 21.8 Raise bank crest level by 1.44m ~£1,000/m
1123020110803L09 River Avon, Bath
Maintained channel and raised defence (man-made)
Infrastructure and Mixed use 20.34 20.40 21.27 21.0 21.9
Raise defence crest level by
0.7m ~£1,500/m
1123020110901L07 River Avon, Bath
Maintained channel and maintained channel
Infrastructure and Mixed use 19.5 20.77 21.40 21.4 22.0 Raise bank crest
level by 1.9m ~£1,000/m
1123020110901L01 River Avon, Bath
Maintained channel and stone lined bank
Infrastructure and Mixed use 18.18 20.80 21.47 21.4 22.1 Raise bank crest
level by 3.2m ~£750/m
1123020110901L02 River Avon, Bath
Maintained channel Infrastructure and Mixed use 18.09 20.82 21.44 21.4 22.0 Raise bank crest
level by 3.3m ~£1,000/m
1123020110901L03 River Avon, Bath Maintained channel Infrastructure and
Mixed use 16.82 20.87 21.52 21.5 22.1 Raise bank crest level by 4.7m ~£1,000/m
1123020110803R01 River Avon, Bath Maintained channel Infrastructure and
Commercial use 17.41 18.05 18.51 18.7 19.1 Raise bank crest level by 1.3m ~£1,000/m
1123020110803R02 River Avon, Bath
Maintained channel and sheet piling
Infrastructure and Commercial use 17.65 18.55 19.10 19.2 19.7
Raise crest level capping wall by
1.6m ~£1,500/m
1123020110804R01 River Avon, Bath
Maintained channel and sheet piling
Infrastructure and Commercial use 17.65 18.60 19.15 19.2 19.8
Raise crest level capping wall by
1.6m ~£1,500/m
1123020110804R02 River Avon, Bath Maintained channel Infrastructure and
Commercial use 17.42 19.00 19.50 19.6 20.1 Raise bank crest level by 2.2m ~£1,000/m
1123020110804R03 River Avon, Bath
Maintained channel and sheet piling
Infrastructure and Commercial use 17.97 19.02 19.57 19.6 20.2
Raise crest level capping wall by
1.8m ~£1,500/m
1123020110804R04 River Avon, Bath
Maintained channel and natural bank
Infrastructure and Commercial use 17.93 19.16 19.73 19.8 20.3 Raise bank crest
level by 1.9m ~£1,000/m
1123020110804R05 River Avon, Maintained channel Infrastructure and 17.49 19.35 19.88 20.0 20.5 Raise crest level ~£1,500/m
B&NES SFRA (April 2008) 2-8 Volume I - Technical Report
Str
ateg
ic a
sses
smen
t
NFC
DD
Ass
et R
ef
Loca
tion
Floo
d de
fenc
e ty
pe
Land
use
pr
otec
ted
Exi
stin
g cr
est l
evel
(m
AO
D)
1% A
EP
flo
od le
vel
(mA
OD
)
1% A
EP
w
ith c
limat
e ch
ange
flo
od le
vel
(mA
OD
)
Bui
ld le
vel
(1%
AE
P
plus
fr
eebo
ard)
(m
AO
D)
Des
ign
leve
l (1%
A
EP
plu
s cl
imat
e ch
ange
plu
s fr
eebo
ard)
(m
AO
D)
Des
crip
tion
of
impr
ovem
ent
wor
ks
Bud
get
cost
es
timat
e
Bat
h an
d w
alle
d ba
nk
Com
mer
cial
use
of
wal
l by
2.5m
1123
0201
1080
4R05
R
iver
A
von,
B
ath
Mai
ntai
ned
chan
nel
and
mas
onry
wal
l In
frast
ruct
ure
and
Com
mer
cial
use
20
.87
19.6
4 20
.34
20.2
20
.9
N/A
N
/A
1123
0201
1080
4R07
R
iver
A
von,
B
ath
Mai
ntai
ned
chan
nel
and
wal
led
bank
In
frast
ruct
ure
and
Com
mer
cial
use
20
.09
20.1
9 20
.97
20.8
21
.6
Rai
se c
rest
leve
l of
wal
l by
1m
~£1,
500/
m
1123
0201
1080
4R08
R
iver
A
von,
B
ath
Mai
ntai
ned
chan
nel
and
natu
ral b
ank
Infra
stru
ctur
e an
d C
omm
erci
al u
se
19.9
5 20
.75
21.5
0 21
.4
22.1
R
aise
ban
k cr
est
leve
l by
1.5m
~£
1,00
0/m
1123
0201
1090
1R01
R
iver
A
von,
B
ath
Mai
ntai
ned
chan
nel
and
natu
ral b
ank
Infra
stru
ctur
e an
d C
omm
erci
al u
se
19.5
20
.80
21.4
0 21
.4
22.0
R
aise
ban
k cr
est
leve
l by
1.5m
~£
1,00
0/m
1123
0201
1090
1R02
R
iver
A
von,
B
ath
Mai
ntai
ned
chan
nel
Infra
stru
ctur
e an
d C
omm
erci
al u
se
19.8
5 20
.85
21.5
0 21
.5
22.1
R
aise
ban
k cr
est
leve
l by
1.6m
~£
1,00
0/m
1123
0245
1040
1L10
R
iver
C
hew
, C
hew
Mag
na
Mai
ntai
ned
chan
nel
Infra
stru
ctur
e an
d R
esid
entia
l use
41
.47
41.4
2 -
42.0
-
Rai
se b
ank
cres
t le
vel b
y 0.
5m
~£1,
000/
m
1123
0245
1040
1L11
R
iver
C
hew
, C
hew
Mag
na
Mai
ntai
ned
chan
nel
Infra
stru
ctur
e an
d R
esid
entia
l use
41
.17
42.0
0 -
42.6
-
Rai
se b
ank
cres
t le
vel b
y 1.
5m
~£1,
000/
m
1123
0245
1040
1R07
R
iver
C
hew
, C
hew
Mag
na
Mai
ntai
ned
chan
nel
Infra
stru
ctur
e an
d R
esid
entia
l use
41
.37
41.4
5 -
42.1
-
Rai
se b
ank
cres
t le
vel b
y 0.
7m
~£1,
000/
m
1123
0245
2010
1L03
R
iver
C
hew
Tr
ibut
ary,
C
hew
Mag
na
Mai
ntai
ned
chan
nel
Infra
stru
ctur
e an
d R
esid
entia
l use
41
.24
41.4
2 -
42.0
-
Rai
se b
ank
cres
t le
vel b
y 0.
8m
~£1,
000/
m
1123
0245
2010
1L04
Riv
er
Che
w
Trib
utar
y,
Che
w M
agna
M
aint
aine
d ch
anne
l In
frast
ruct
ure
and
Res
iden
tial u
se
42.8
1 41
.84
-42
.4
-N
/A
N/A
1123
0245
2010
1L05
R
iver
C
hew
Tr
ibut
ary,
C
hew
Mag
na
Mai
ntai
ned
chan
nel
Infra
stru
ctur
e an
d R
esid
entia
l use
41
.26
41.8
4 -
42.4
-
Rai
se b
ank
cres
t le
vel b
y 1.
1m
~£1,
000/
m
1123
0245
2010
1R02
R
iver
C
hew
Tr
ibut
ary,
C
hew
Mag
na
Mai
ntai
ned
chan
nel
Infra
stru
ctur
e an
d R
esid
entia
l use
42
.91
41.8
4 -
42.4
-
N/A
N
/A
1123
0245
2010
1R03
R
iver
C
hew
Tr
ibut
ary,
C
hew
Mag
na
Mai
ntai
ned
chan
nel
Infra
stru
ctur
e an
d R
esid
entia
l use
42
.42
41.8
4 -
42.4
-
N/A
N
/A
1123
0239
1030
3L02
W
ello
w
Bro
ok,
Nor
thfie
ld
Mai
ntai
ned
chan
nel
Infra
stru
ctur
e an
d C
omm
erci
al u
se
66.5
7 65
.94
66.1
7 N
/A
N/A
1123
0239
1040
1L01
W
ello
w
Bro
ok,
Nor
thfie
ld
Mai
ntai
ned
chan
nel
Infra
stru
ctur
e an
d C
omm
erci
al u
se
66.5
66
.74
67.0
8 67
.3
67.7
R
aise
ban
k cr
est
leve
l by
0.6m
~£
1,00
0/m
1123
0239
1040
1L02
W
ello
w
Bro
ok,
Nor
thfie
ld
Mai
ntai
ned
chan
nel
Infra
stru
ctur
e an
d C
omm
erci
al u
se
66.5
4 66
.56
67.3
3 67
.2
67.9
R
aise
ban
k cr
est
leve
l by
0.8m
~£
1,00
0/m
1123
0239
1040
1L03
W
ello
w
Bro
ok,
Mai
ntai
ned
chan
nel
Infra
stru
ctur
e an
d 70
.08
67.3
1 67
.53
67.9
68
.1
N/A
N
/A
2-9
B&
NE
S S
FRA
(Apr
il 20
08)
Vol
ume
I -T
echn
ical
Rep
ort
Strategic assessment
NFCDD Asset Ref Location Flood defence type Land use protected
Existing crest level
(mAOD)
1% AEP flood level
(mAOD)
1% AEP with climate
change flood level
(mAOD)
Build level (1% AEP
plus freeboard)
(mAOD)
Design level (1% AEP plus climate
change plus freeboard)
(mAOD)
Description of improvement
works
Budget cost
estimate
1123023910401L04
Northfield Wellow Brook, Northfield Maintained channel
Commercial use Infrastructure and Commercial use 71.72 67.31 67.53 67.9 68.1 N/A N/A
1123023910401L05 Wellow Brook, Northfield Maintained channel Infrastructure and
Commercial use 71.72 67.42 67.65 68.0 68.3 N/A N/A
1123023910401L06 Wellow Brook, Northfield Maintained channel Infrastructure and
Commercial use 70.39 67.47 67.67 68.1 68.3 N/A N/A
1123023910401L07 Wellow Brook, Northfield Maintained channel Infrastructure and
Commercial use 69.01 67.47 67.68 68.1 68.3 N/A N/A
1123023910401L08 Wellow Brook, Northfield Maintained channel Infrastructure and
Commercial use 68.02 67.49 67.69 68.1 68.3 N/A N/A
1123023910401L09 Wellow Brook, Northfield Maintained channel Infrastructure and
Commercial use 68.45 67.83 68.18 68.4 68.8 N/A N/A
1123023910401L10 Wellow Brook, Northfield Maintained channel Infrastructure and
Commercial use 68.45 67.89 68.24 68.5 68.8 N/A N/A
1123023910401L11 Wellow Brook, Northfield Maintained channel Infrastructure and
Commercial use 69.72 67.92 68.25 68.5 68.9 N/A N/A
1123023910402L01 Wellow Brook, Northfield culverted channel Infrastructure and
Commercial use 68.59 68.05 68.42 68.7 69.0 N/A N/A
1123023910402L02 Wellow Brook, Northfield Maintained channel Infrastructure and
Commercial use 70.43 68.19 68.56 68.8 69.2 N/A N/A
1123023910402L03 Wellow Brook, Northfield Maintained channel Infrastructure and
Commercial use 74.77 68.35 68.86 69.0 69.5 N/A N/A
1123024000101L01 River Somer, Welton Hollow Maintained channel Infrastructure and
Commercial use 74.28 74.50 74.93 75.1 75.5 Raise bank crest level by 0.7m ~£1,000/m
1123024000101L02 River Somer, Welton Hollow Maintained channel Infrastructure and
Commercial use 74.28 74.50 74.93 75.1 75.5 Raise bank crest level by 0.7m ~£1,000/m
1123024000101L03 River Somer, Welton Hollow Maintained channel Infrastructure and
Commercial use 75.04 74.69 75.05 75.3 75.7 N/A N/A
1123024000101L04 River Somer, Welton Hollow Maintained channel Infrastructure and
Residential use 80.61 79.46 79.58 80.1 80.2 N/A N/A
1123024000101L05 River Somer, Welton Hollow Maintained channel Infrastructure and
Residential use 80.61 79.88 79.99 80.5 80.6 N/A N/A
1123024000104L01 River Somer, Welton Hollow Culverted channel Infrastructure and
Residential use 93.77 92.64 92.68 93.2 93.3 N/A N/A
1123024000104L02 River Somer, Welton Hollow Maintained channel Infrastructure and
Residential use 93.77 94.31 94.37 94.9 95.0 Raise bank crest level by 0.6m ~£1,000/m
1123023910303R01 Wellow Brook, Northfield Maintained channel Infrastructure and
Commercial use 66.87 65.94 66.16 66.5 66.8 N/A N/A
1123023910401R01 Wellow Brook, Maintained channel Infrastructure and 66.9 66.26 67.49 66.9 68.1 Raise bank crest ~£1,000/m
B&NES SFRA (April 2008) 2-10 Volume I - Technical Report
Strategic assessment
NFCDD Asset Ref Location Flood defence type Land use protected
Existing crest level
(mAOD)
1% AEP flood level
(mAOD)
1% AEP with climate
change flood level
(mAOD)
Build level (1% AEP
plus freeboard)
(mAOD)
Design level (1% AEP plus climate
change plus freeboard)
(mAOD)
Description of improvement
works
Budget cost
estimate
Northfield Commercial use level by 0.6m
1123023910401R02 Wellow Brook, Northfield Maintained channel Infrastructure and
Commercial use 67.38 67.33 67.56 67.9 68.2 Raise bank crest level by 0.2m ~£1,000/m
1123023910401R03 Wellow Brook, Northfield Maintained channel Infrastructure and
Commercial use 68.08 67.31 67.53 67.9 68.1 N/A N/A
1123023910401R04 Wellow Brook, Northfield Maintained channel Infrastructure and
Commercial use 70.72 67.31 67.53 67.9 68.1 N/A N/A
1123023910401R05 Wellow Brook, Northfield Maintained channel Infrastructure and
Commercial use 70.72 67.47 67.68 68.1 68.3 N/A N/A
1123023910401R06 Wellow Brook, Northfield Maintained channel Infrastructure and
Commercial use 70.66 67.47 67.68 68.1 68.3 N/A N/A
1123023910401R07 Wellow Brook, Northfield Maintained channel Infrastructure and
Commercial use 70.72 67.83 68.18 68.4 68.8 N/A N/A
1123023910401R08 Wellow Brook, Northfield Maintained channel Infrastructure and
Commercial use 69.72 67.91 68.91 68.5 69.5 N/A N/A
1123023910402R01 River Somer, Welton Hollow culverted channel Infrastructure and
Commercial use 68.1 68.06 68.42 68.7 69.0 Raise bank crest level by 0.3m ~£1,000/m
1123024000101R01 River Somer, Welton Hollow Maintained channel Infrastructure and
Commercial use 75.11 74.50 74.93 75.1 75.5 N/A N/A
1123024000101R03 River Somer, Welton Hollow Maintained channel Infrastructure and
Commercial use 74.91 74.68 75.05 75.3 75.7 Raise bank crest level by 0.2m ~£1,000/m
1123024000101R04 River Somer, Welton Hollow Maintained channel Infrastructure and
Commercial use 75.57 75.02 75.26 75.6 75.9 N/A N/A
1123024000101R05 River Somer, Welton Hollow Maintained channel Infrastructure and
Residential use 78.8 78.27 78.39 78.9 79.0 N/A N/A
1123024000101R07 River Somer, Welton Hollow Maintained channel Infrastructure and
Residential use 80.84 79.88 79.99 80.5 80.6 N/A N/A
1123024000105R01 River Somer, Welton Hollow culverted channel Infrastructure and
Residential use 93.77 92.64 92.68 93.2 93.3 N/A N/A
1123024000102R15 Wellow Brook, Welton Hollow Maintained channel Infrastructure and
Residential use 93.64 92.64 92.68 93.2 93.3 N/A N/A
2-11 B&NES SFRA (April 2008) Volume I - Technical Report
Strategic assessment
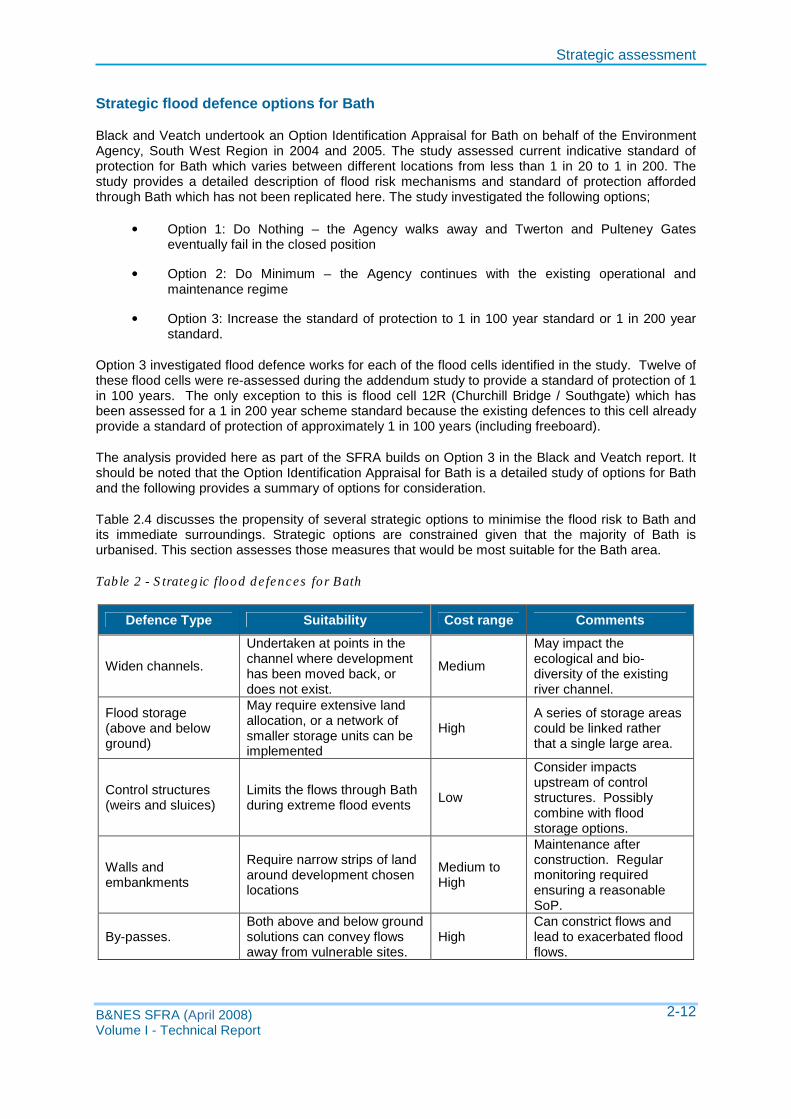
Strategic flood defence options for Bath
Black and Veatch undertook an Option Identification Appraisal for Bath on behalf of the Environment Agency, South West Region in 2004 and 2005. The study assessed current indicative standard of protection for Bath which varies between different locations from less than 1 in 20 to 1 in 200. The study provides a detailed description of flood risk mechanisms and standard of protection afforded through Bath which has not been replicated here. The study investigated the following options;
• Option 1: Do Nothing – the Agency walks away and Twerton and Pulteney Gates eventually fail in the closed position
• Option 2: Do Minimum – the Agency continues with the existing operational and maintenance regime
• Option 3: Increase the standard of protection to 1 in 100 year standard or 1 in 200 year standard.
Option 3 investigated flood defence works for each of the flood cells identified in the study. Twelve of these flood cells were re-assessed during the addendum study to provide a standard of protection of 1 in 100 years. The only exception to this is flood cell 12R (Churchill Bridge / Southgate) which has been assessed for a 1 in 200 year scheme standard because the existing defences to this cell already provide a standard of protection of approximately 1 in 100 years (including freeboard).
The analysis provided here as part of the SFRA builds on Option 3 in the Black and Veatch report. It should be noted that the Option Identification Appraisal for Bath is a detailed study of options for Bath and the following provides a summary of options for consideration.
Table 2.4 discusses the propensity of several strategic options to minimise the flood risk to Bath and its immediate surroundings. Strategic options are constrained given that the majority of Bath is urbanised. This section assesses those measures that would be most suitable for the Bath area.
Table 2 - Strategic flood defences for Bath
Defence Type Suitability Cost range Comments
Widen channels.
Undertaken at points in the channel where development has been moved back, or does not exist.
Medium
May impact the ecological and biodiversity of the existing river channel.
Flood storage (above and below ground)
May require extensive land allocation, or a network of smaller storage units can be implemented
High A series of storage areas could be linked rather that a single large area.
Control structures (weirs and sluices)
Limits the flows through Bath during extreme flood events Low
Consider impacts upstream of control structures. Possibly combine with flood storage options.
Walls and embankments
Require narrow strips of land around development chosen locations
Medium to High
Maintenance after construction. Regular monitoring required ensuring a reasonable SoP.
By-passes. Both above and below ground solutions can convey flows away from vulnerable sites.
High Can constrict flows and lead to exacerbated flood flows.
B&NES SFRA (April 2008) Volume I - Technical Report
2-12
Strategic assessment
Discussions with the Environment Agency have determined a preference to ‘move back’ existing and proposed riverside development, close to the channel edge. This will allow an increase in channel conveyance, minimising the risk of constricted flows through urban areas. This solution also allows for additional flood storage along the banks during extreme flood events.
Upstream flood storage and control structures can be used in conjunction, as a system or in isolation of each other. These options control the flow into Bath, reducing the likely flood risk. However care will need to be taken to ensure flood flows are not increased back up the river network and exacerbate flooding in outlying areas.
Walls, embankments, and by-passes can be used to control flows through the urban areas of Bath. Following construction they require a high degree of maintenance to ensure the Standard of Flood Protection maintained over the lifetime of the development. These measures can also lead to a constriction of flows which can exacerbate flooding during extreme events, or backing up of the system.
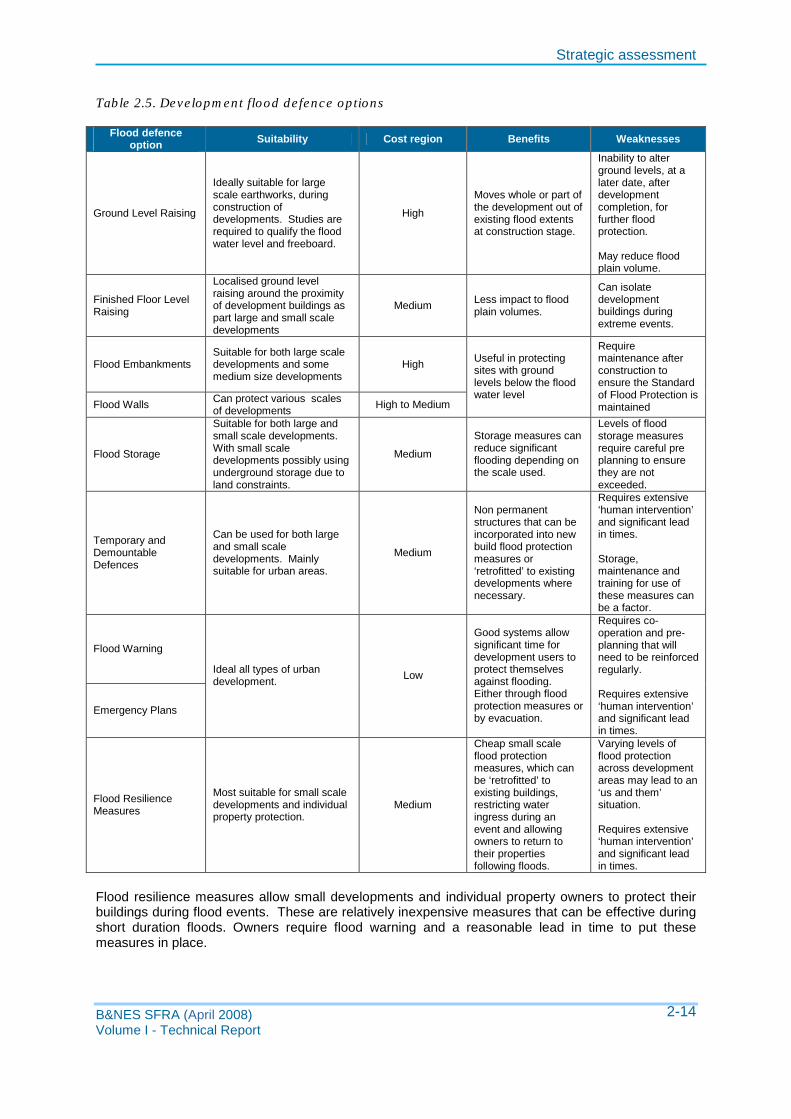
Site specific measures
Table 2.5 summaries a series of options which could be used to reduce the risk of flooding, if development is required in medium and/or high risk areas.
The majority of the options discussed in Table 2.5 are suitable for both large and small scale developments. Site ground level raising can be more viable for larger sites. Ground re-profiling is a high cost option. If the development is proposed in low lying areas, were flood water usually accumulates during extreme events, then ground level raising can affect the way flood volume storage operates. Compensation volumes are usually required to accommodate such loses.
It is possible to just raise the finished floor levels of the development buildings out of the flood water level. This reduces any impacts to the flood plain, and can be less costly than whole sale ground reprofiling. However during prolonged flood conditions the buildings can become isolated and subsequently difficult to evacuate.
Embankments and walls can be used as perimeter flood protection measures around large or small sites. This may enable developments to be proposed on much lower lying land than would normally be acceptable. These types of measures are designed using the parameters of the day, which can be superseded at a later date. These measures can be quite costly, depending on the site topography and geology, and require consistent inspections and maintenance during their operating life.
Flood storage methods depend on the size of proposed development. Large scale developments can set aside areas of surface flood storage. Whereas some relatively small developments may be able to incorporate below ground level storage measures, subject to site specific considerations. The cost of such measures vary depending on the scale of development. A significant amount of analysis is usually required prior to the implementation of such measures to determine the most appropriate size of storage.
Temporary and Demountable (T&D) flood defences are considered better for medium to small development areas that rely on human intervention and lead in times. Many T&D’s require trained multiple operatives, storage and maintenance. Initial procurement costs can be high, although subsequent operations costs are relatively mid-range.
Flood warning and emergency plans are essential for developments located in high flood risk areas. They provide advance warning to enable users of the site to protect themselves during a flood event, or evacuate to a safer location. These can be reasonably inexpensive measures that can be used in conjunction with Temporary and Demountable flood defences or flood resilience measures.
B&NES SFRA (April 2008) Volume I - Technical Report
2-13
Strategic assessment
Table 2.5. Development flood defence options
Flood defence option Suitability Cost region Benefits Weaknesses
Ground Level Raising
Ideally suitable for large scale earthworks, during construction of developments. Studies are required to qualify the flood water level and freeboard.
High
Moves whole or part of the development out of existing flood extents at construction stage.
Inability to alter ground levels, at a later date, after development completion, for further flood protection.
May reduce flood plain volume.
Finished Floor Level Raising
Localised ground level raising around the proximity of development buildings as part large and small scale developments
Medium Less impact to flood plain volumes.
Can isolate development buildings during extreme events.
Flood Embankments Suitable for both large scale developments and some medium size developments
High Useful in protecting sites with ground levels below the flood water level
Require maintenance after construction to ensure the Standard of Flood Protection is maintained Flood Walls Can protect various scales
of developments High to Medium
Flood Storage
Suitable for both large and small scale developments. With small scale developments possibly using underground storage due to land constraints.
Medium
Storage measures can reduce significant flooding depending on the scale used.
Levels of flood storage measures require careful pre planning to ensure they are not exceeded.
Temporary and Demountable Defences
Can be used for both large and small scale developments. Mainly suitable for urban areas.
Medium
Non permanent structures that can be incorporated into new build flood protection measures or ‘retrofitted’ to existing developments where necessary.
Requires extensive ‘human intervention’ and significant lead in times.
Storage, maintenance and training for use of these measures can be a factor.
Flood Warning
Ideal all types of urban development. Low
Good systems allow significant time for development users to protect themselves against flooding. Either through flood protection measures or by evacuation.
Requires cooperation and pre-planning that will need to be reinforced regularly.
Requires extensive ‘human intervention’ and significant lead in times.
Emergency Plans
Flood Resilience Measures
Most suitable for small scale developments and individual property protection.
Medium
Cheap small scale flood protection measures, which can be ‘retrofitted’ to existing buildings, restricting water ingress during an
Varying levels of flood protection across development areas may lead to an ‘us and them’ situation.
event and allowing owners to return to their properties following floods.
Requires extensive ‘human intervention’ and significant lead in times.
Flood resilience measures allow small developments and individual property owners to protect their buildings during flood events. These are relatively inexpensive measures that can be effective during short duration floods. Owners require flood warning and a reasonable lead in time to put these measures in place.
B&NES SFRA (April 2008) Volume I - Technical Report
2-14
Strategic assessment
Sustainable Drainage Systems (SuDS)
Flooding from rivers, sewers, and surface water is likely to increase throughout B&NES in the future as a result of climate change. However in addition to this the impact of new development on flood risk needs to be considered, both at the new development site and existing developments within the catchment. The impact of development on flood risk within the catchment should be considered, even where the development itself is not at risk of flooding. For example intense development in the catchments, could result in increased run off if not managed, and result in increased fluvial flooding within and downstream of the study area.
New developments can also increase pressure on sewer systems and urban drainage. It is therefore important to manage the impact of developments in a sustainable manner. PPS25 provides an opportunity for all those with responsibility for the drainage of new development to contribute to managing flood risk, improving amenity and biodiversity, and improving water quality. As a minimum the negative impacts of development on surface water runoff should be mitigated.
In addition to the concerns over flood risk, there is increasing pressure for efficient and sustainable use of water resources. This can be helped by incorporating Sustainable Urban Drainage Systems (SuDS) and grey water reuse systems into new developments (as per PPS25 and the Building Regulations, Part H).
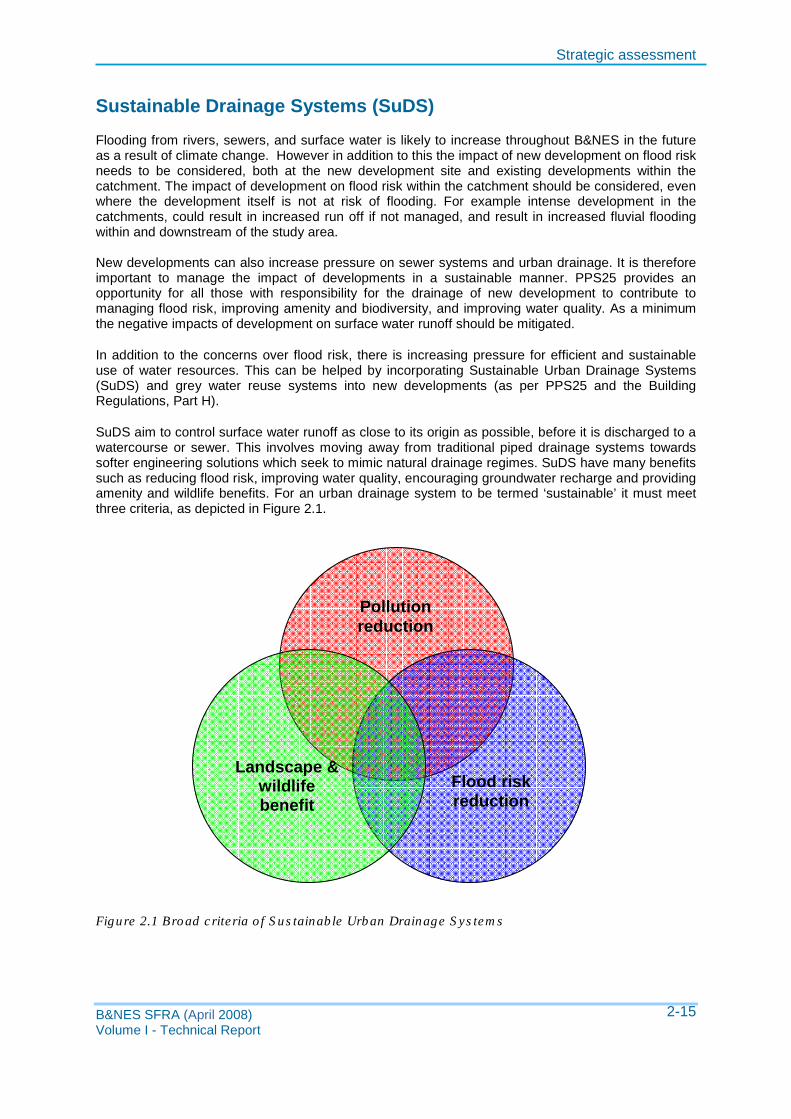
SuDS aim to control surface water runoff as close to its origin as possible, before it is discharged to a watercourse or sewer. This involves moving away from traditional piped drainage systems towards softer engineering solutions which seek to mimic natural drainage regimes. SuDS have many benefits such as reducing flood risk, improving water quality, encouraging groundwater recharge and providing amenity and wildlife benefits. For an urban drainage system to be termed ‘sustainable’ it must meet three criteria, as depicted in Figure 2.1.
Pollution reduction
Flood risk reduction
Landscape & wildlife benefit
Figure 2.1 Broad criteria of Sustainable Urban Drainage Systems
B&NES SFRA (April 2008) Volume I - Technical Report
2-15
Strategic assessment
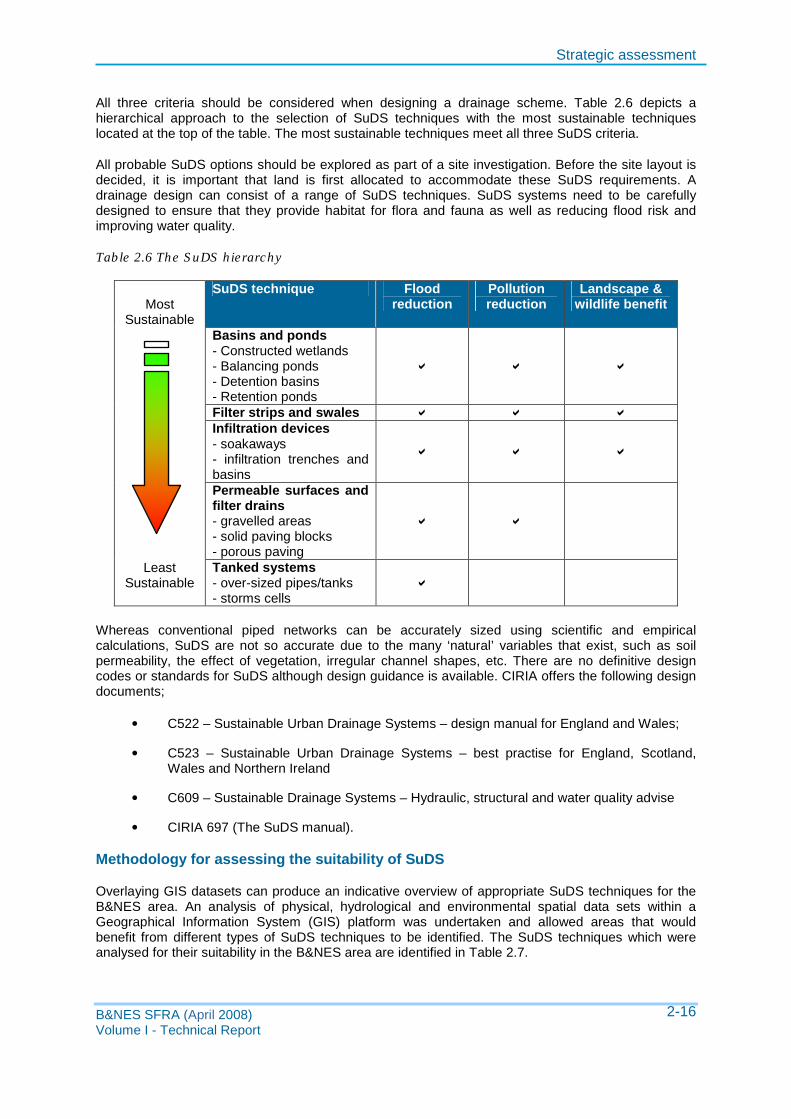
All three criteria should be considered when designing a drainage scheme. Table 2.6 depicts a hierarchical approach to the selection of SuDS techniques with the most sustainable techniques located at the top of the table. The most sustainable techniques meet all three SuDS criteria.
All probable SuDS options should be explored as part of a site investigation. Before the site layout is decided, it is important that land is first allocated to accommodate these SuDS requirements. A drainage design can consist of a range of SuDS techniques. SuDS systems need to be carefully designed to ensure that they provide habitat for flora and fauna as well as reducing flood risk and improving water quality.
Table 2.6 The SuDS hierarchy
Most Sustainable
SuDS technique Flood reduction
Pollution reduction
Landscape & wildlife benefit
Basins and ponds - Constructed wetlands - Balancing ponds - Detention basins - Retention ponds
) ) )
Filter strips and swales ) ) ) Infiltration devices - soakaways - infiltration trenches and basins
) ) )
Permeable surfaces and filter drains - gravelled areas - solid paving blocks - porous paving
) )
Least Sustainable
Tanked systems - over-sized pipes/tanks - storms cells
)
Whereas conventional piped networks can be accurately sized using scientific and empirical calculations, SuDS are not so accurate due to the many ‘natural’ variables that exist, such as soil permeability, the effect of vegetation, irregular channel shapes, etc. There are no definitive design codes or standards for SuDS although design guidance is available. CIRIA offers the following design documents;
• C522 – Sustainable Urban Drainage Systems – design manual for England and Wales;
• C523 – Sustainable Urban Drainage Systems – best practise for England, Scotland, Wales and Northern Ireland
• C609 – Sustainable Drainage Systems – Hydraulic, structural and water quality advise
• CIRIA 697 (The SuDS manual).
Methodology for assessing the suitability of SuDS
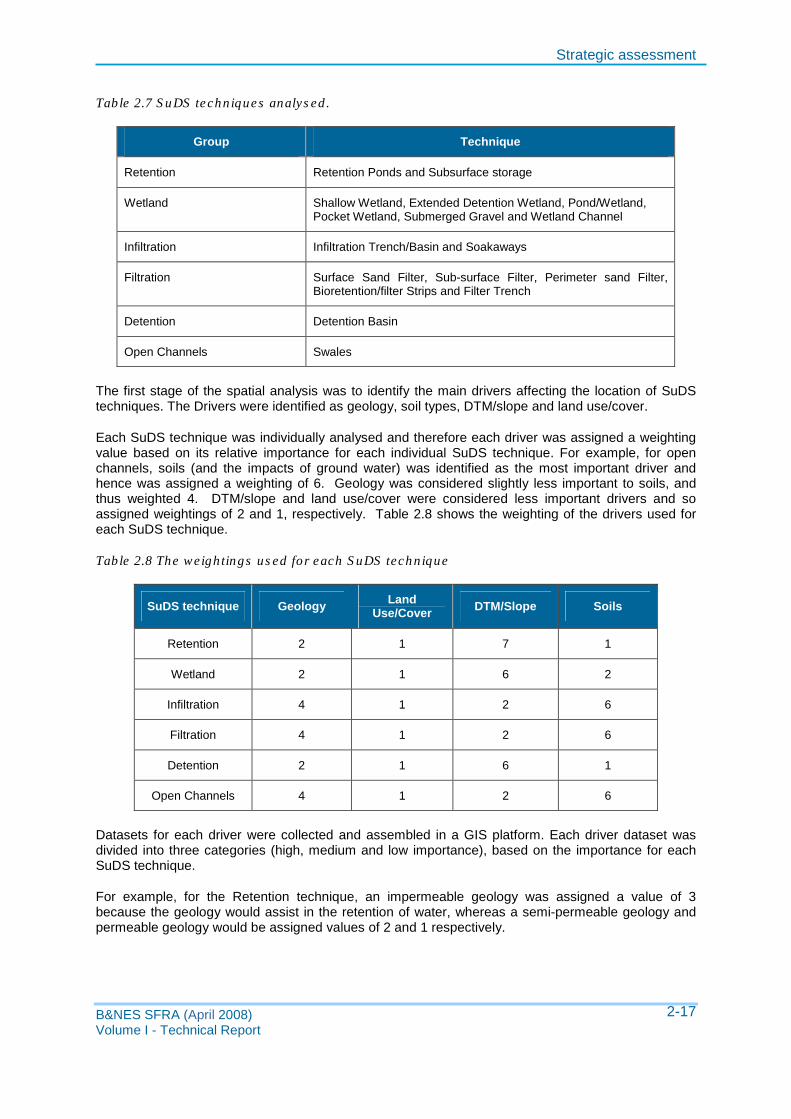
Overlaying GIS datasets can produce an indicative overview of appropriate SuDS techniques for the B&NES area. An analysis of physical, hydrological and environmental spatial data sets within a Geographical Information System (GIS) platform was undertaken and allowed areas that would benefit from different types of SuDS techniques to be identified. The SuDS techniques which were analysed for their suitability in the B&NES area are identified in Table 2.7.
B&NES SFRA (April 2008) Volume I - Technical Report
2-16
Strategic assessment
Table 2.7 SuDS techniques analysed.
Group Technique
Retention Retention Ponds and Subsurface storage
Wetland Shallow Wetland, Extended Detention Wetland, Pond/Wetland, Pocket Wetland, Submerged Gravel and Wetland Channel
Infiltration Infiltration Trench/Basin and Soakaways
Filtration Surface Sand Filter, Sub-surface Filter, Perimeter sand Filter, Bioretention/filter Strips and Filter Trench
Detention Detention Basin
Open Channels Swales
The first stage of the spatial analysis was to identify the main drivers affecting the location of SuDS techniques. The Drivers were identified as geology, soil types, DTM/slope and land use/cover.
Each SuDS technique was individually analysed and therefore each driver was assigned a weighting value based on its relative importance for each individual SuDS technique. For example, for open channels, soils (and the impacts of ground water) was identified as the most important driver and hence was assigned a weighting of 6. Geology was considered slightly less important to soils, and thus weighted 4. DTM/slope and land use/cover were considered less important drivers and so assigned weightings of 2 and 1, respectively. Table 2.8 shows the weighting of the drivers used for each SuDS technique.
Table 2.8 The weightings used for each SuDS technique
SuDS technique Geology Land Use/Cover DTM/Slope Soils
Retention 2 1 7 1
Wetland 2 1 6 2
Infiltration 4 1 2 6
Filtration 4 1 2 6
Detention 2 1 6 1
Open Channels 4 1 2 6
Datasets for each driver were collected and assembled in a GIS platform. Each driver dataset was divided into three categories (high, medium and low importance), based on the importance for each SuDS technique.
For example, for the Retention technique, an impermeable geology was assigned a value of 3 because the geology would assist in the retention of water, whereas a semi-permeable geology and permeable geology would be assigned values of 2 and 1 respectively.
B&NES SFRA (April 2008) Volume I - Technical Report
2-17
Strategic assessment
The datasets were then interrogated for a 25m grid cell and the rankings summed to come up with a total value indicating the suitability of a particular SuDS technique to each grid cell. The higher the value in each grid cell the higher the suitability of that particular SuDS technique.
Capacity for the use of SuDS in B&NES
Six maps, Annex A, were produced identifying the generally suitable areas for each SuDS technique over the B&NES district.
Figure L2a shows the locations where SuDS Retention solutions would be suitable for implementation. Retention areas require flat gradients and are not suitable for unstable ground. They generally require impermeable geology and soils, however in permeable ground conditions an impermeable layer (lining or puddle clay) can be used. The eastern areas of the B&NES study area are made up of steep undulating slopes, and therefore would not be suitable for retention areas. However the western extents of the B&NES study area have numerous flat areas were retention solutions could be used. This specific analysis has assumed no significant future ground re-profiling across the B&NES study area.
Figure L2b shows the locations where SuDS Wetland solutions would be suitable for implementation. Similar to retention areas, Wetland areas require almost horizontal slopes, although these can be achieved through embankments. Soils and geology should be sufficiently impermeable to maintain wet conditions. Given the higher importance attributed to geology and soils in the assessment, a larger number of areas are generally suitable for Wetland solutions than Retention. However wetlands usually require significant land take, and as such smaller areas may be discounted at a later stage.
Figures L2c and L2d show the locations where SuDS Infiltration and Filtration solutions would be suitable for implementation, respectively. The main criteria for both Infiltration and Filtration solutions are that they are designed for intermittent flow, with allowance for draining and re-aeration. This means that neither wholly impermeable nor permeable soils are ideal for Infiltration and Filtration solutions. The majority of the soils across the B&NES study area are impermeable, with a ‘central area’ of semi-impermeable soils, which would be suitable for implementation of Infiltration and Filtration solutions.
Figure L2e shows the locations where SuDS Detention solutions would be suitable for implementation. In order to incorporate Detention solutions the basin floor must be as level as possible to minimise velocities. Detention solutions generally require impermeable geology and soils, however in permeable ground conditions an impermeable layer (lining or puddle clay) can be used. Given the minor importance of the geology and soils for Detention solutions, a large number of areas are generally suitable for Detention solutions across the B&NES study area. It should be noted that Detention solutions can require significant land take, and as such smaller areas may be discounted at a later stage.
Figure L2f shows the locations where SuDS Open Channel solutions would be suitable for implementation. In this instance a combination of semi-impermeable soils and shallow slope requirements have limited open channel solutions to dispersed locations across the B&NES study area. Whilst ground level contours can be used to obviate the necessity for large flat areas, undulating slopes cause issues in maintaining constantly lower flows. In addition large sections of the B&NES study area are wholly impermeable and as such are not suitable for Open Channel solutions, where more appropriate SuDS could be implemented.
B&NES SFRA (April 2008) Volume I - Technical Report
2-18
Environment and planning context
3. Environment and planning context
The B&NES SFRA is a 'live' document. The current version has been developed using the best information and concepts available at the time. As new information and concepts become available the document will be updated and so it is the responsibility of the reader to be satisfied that they are using the most up-to-date information and that the SFRA accounts for this information. All revisions to this summary document are listed in the table.
Version Issue Date Issued by Issued to
Final 23/04//2008 Capita Symonds
Ltd
B&NES, EA
B&NES SFRA (April 2008) Volume I - Technical Report
3-1
Environment and planning context
Introduction
B&NES became a Unitary Authority on 1 April 1996, combining the former Bath and Wansdyke District areas. Being a Unitary Authority, it is responsible for both district and county level duties.
The Planning and Compulsory Purchase Act 2004 introduced a number of significant changes into the planning system. The production of County Structure Plans has been abolished and these will be replaced with a regional level statutory policy in the form of the Regional Spatial Strategy (RSS). The RSS is designed to identify the broad locations for future development in the area. The RSS for the South West 2006-2026 is currently in draft form.
At the local level a more flexible Local Development Framework (LDF) has been introduced to replace Local Plans. B&NES is currently in the process of completing their LDF which involves preparation of a number of core development plan documents (DPD), supported by supplementary planning documents (SPD) as required. These documents are designed to provide more detailed information regarding how and where development takes place. Prior to the changes in legislation B&NES had been preparing a Local Plan, based on the former planning system. It is likely that this will be adopted by September 2007, and the adopted policies will be saved for a period of up to three years. This will be superseded by the LDF once complete.
A SFRA is required to inform the development planning process at the local (district) scale. Whilst the SFRA is not a spatial plan or a planning policy, it informs the planning process by providing information of present, future and residual flood risk. The SFRA will enable B&NES to designate areas for development following the 'Sequential Test' as required by national policy, PPS25. The SFRA should provide the necessary information for planners to be able to make strategic decisions to identify the amount of development that may be permitted, how the drainage of that development should function and how vulnerable areas should be protected or adapted.
The SFRA's relationship with the land use (spatial) planning process is particularly important and operates at two levels, with a strong link to local level documents, LDF and a slightly weaker, but still important, link to county and regional level documents. It provides information so that an evidence-based and risk-based sequential test may be undertaken.
As well as PPS25 and the local plans identified above, there are a number of other plans and policies which will influence, and will be influenced by the SFRA. Figure 3.1 shows the conceptual land use planning framework in which the SFRA has been developed and how it may fit into the wider planning framework in England.
Catchment flood management plans (CFMPs) and shoreline management plans (SMPs) represent the first ‘tier’ in the strategic flood risk management process, providing the overall framework within which more detailed assessments, such as the B&NES SFRA are undertaken (although in this instance the SMP is not relevant due to B&NES geographical location). The SFRA covers specific land uses and is better able to influence flood risk management policies to address local issues, although CFMPs may be better placed to guide flood risk management policies on a catchment scale.
The SFRA does not eliminate the need for more detailed flood risk assessments (FRAs) of individual proposed development sites. More detailed FRAs will still be required which are in accordance with PPS25. Rather the SFRA will provide additional information for these FRAs to draw upon and identify more detailed issues associated with flood hazards and flood consequences. This chapter discusses the plans and policies relevant to developments and flood risk within B&NES.
B&NES SFRA (April 2008) Volume I - Technical Report
3-2
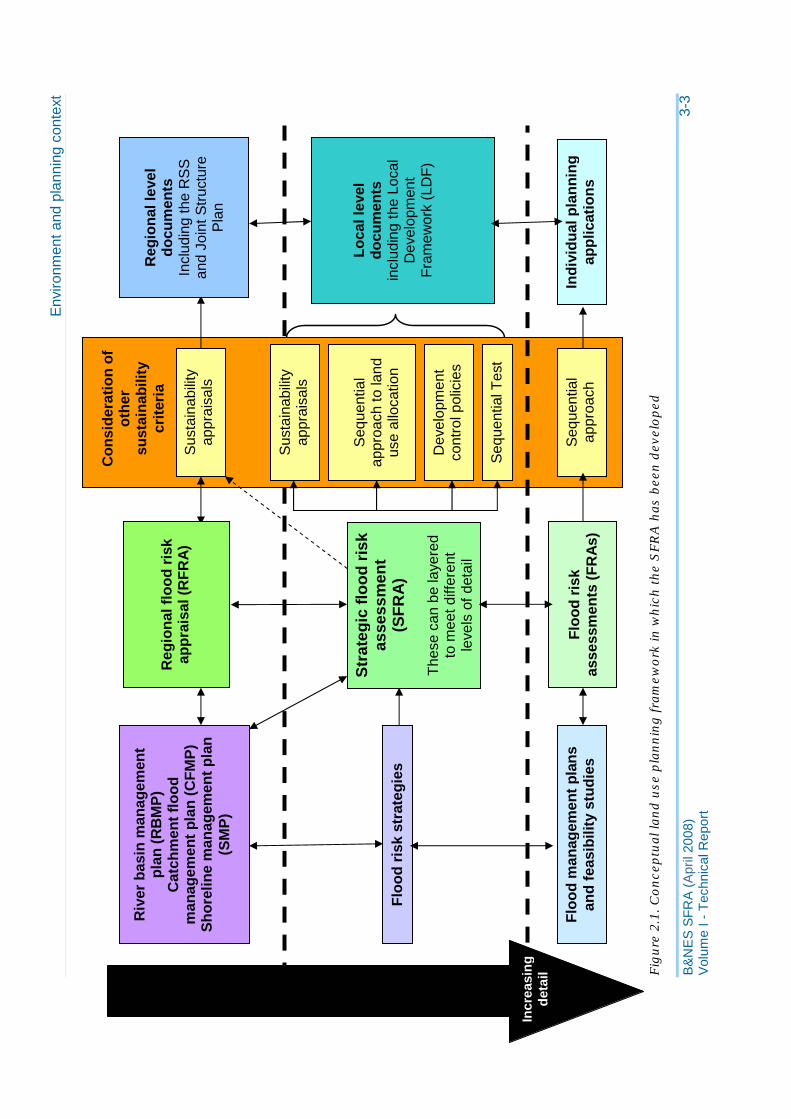
Env
ironm
ent a
nd p
lann
ing
cont
ext
Str
ateg
ic fl
ood
risk
as
sess
men
t (S
FRA
)
The
se c
an b
e la
yere
d to
mee
t diff
eren
t le
vels
of d
etai
l
Floo
d ri
sk s
trat
egie
s
Loca
l lev
el
docu
men
ts
incl
udin
g th
e Lo
cal
Dev
elop
men
t Fr
amew
ork
(LD
F)
Indi
vidu
al p
lann
ing
appl
icat
ions
Reg
iona
l lev
el
docu
men
ts
Incl
udin
g th
e R
SS
an
d Jo
int S
truc
ture
P
lan
Riv
er b
asin
man
agem
ent
plan
(RB
MP
) C
atch
men
t flo
od
man
agem
ent p
lan
(CFM
P)
Sho
relin
e m
anag
emen
t pla
n (S
MP
)
Floo
d ri
sk
asse
ssm
ents
(FR
As)
Reg
iona
l flo
od r
isk
appr
aisa
l (R
FRA
) S
usta
inab
ility
ap
prai
sals
Floo
d m
anag
emen
t pla
ns
and
feas
ibili
ty s
tudi
es
Seq
uent
ial
appr
oach
Con
side
ratio
n of
ot
her
sust
aina
bilit
y cr
iteri
a
Incr
easi
ng
deta
il
Dev
elop
men
t co
ntro
l pol
icie
s
Seq
uent
ial
appr
oach
to la
nd
use
allo
catio
n
Sus
tain
abili
ty
appr
aisa
ls
Seq
uent
ial T
est
Figu
re 2
.1. C
once
ptua
l lan
d us
e pl
anni
ng fr
amew
ork
in w
hich
the
SFR
A h
as b
een
deve
lope
d
B&
NE
S S
FRA
(Apr
il 20
08)
Vol
ume
I -T
echn
ical
Rep
ort
3-3
Environment and planning context
National level
National Planning Policy Guidance Notes (PPGs) and their replacements Planning Policy Statements (PPSs) have been prepared, or are in the process of being prepared, by the government to explain statutory provisions and provide guidance to local authorities and others on planning policy and the operation of the planning system. They also explain the relationship between planning policies and other policies which have an important bearing on issues of development and land use.
Regional bodies and Local Authorities must take the contents of these documents into account in preparing their planning policy.
PPS of importance to the preparation of landuse planning documents include:
• Planning Policy Statement 1: Delivering Sustainable Development (2005) - this sets out the Government's overarching planning policies on the delivery of sustainable development through the planning system;
• Planning Policy Statement 3: Housing (2006) - identifies how the planning system supports the growth in housing completions needed in England;
• Planning Policy Statement 11: Regional Spatial Strategies (2004) - sets out the procedural policy on Regional Spatial Strategies; and,
• Planning Policy Statement 12: Local Development Frameworks (2004) - sets out the Government's policy on the preparation of local development documents which will comprise the local development framework.
In addition, PPS25 is of particular importance to the development of the SFRA as it provides guidance on developing flood risk areas. This is described in more detail below.
PPS25: Development and Flood Risk
The current government guidance on development and flood risk is outlined in PPS25, issued by the department for Communities and Local Government (CLG). The guidance provided in PPS25 is current and supersedes older policies including Planning Policy Guidance 25 (2001) and the Environment Agency's 'Policy and Practice for the Protection of Floodplains' (1997).
PPS25 outlines how flood risk should be considered at all stages of the planning and guidance development process. It gives guidance on how flood risk can be managed and reduced through the land use planning process. PPS25 acts on a precautionary basis and takes into account climate change.
PPS25 uses the planning process to promote a risk-based approach to ensure new development is not exposed unnecessarily to flooding by considering flood risk at every stage. New developments should reduce flood risk where possible and maintain floodplains as natural areas that continue to function effectively. Therefore, floodplains should be protected from inappropriate development.
PPS25 states that regional and local planning bodies should prepare and implement strategies that help deliver sustainable development by appraising risk, managing risk and reducing risk. SFRAs fall into the first category of ‘Appraising risk’ so that the risk can be appropriately managed or reduced.
B&NES SFRA (April 2008) Volume I - Technical Report
3-4
Environment and planning context
Regional level
South West Regional Spatial Strategy 2006 – 2026 (DRAFT 2006)
The draft South West RSS is a review of the current Regional Planning Guidance for the South West (RPG10). It is the key document for planning, monitoring and managing future development in the South West and will, in 2008, replace RPG10 and the county structure plans for Cornwall and the Isles of Scilly, Devon, Dorset, Gloucestershire, Somerset, Wiltshire and the former Avon area.
The aim of the draft South West RSS is to contribute to the achievement of sustainable development. The RSS, incorporating a Regional Transport Strategy (RTS), provides a broad development strategy for the region for a twenty year period (until 2026). It also informs the preparation of B&NES Local Development Documents (LDDs), Local Transport Plans (LTPs) and regional and sub-regional strategies and programmes that have a bearing on land use activities.
Key strategic sustainability policy objectives of the draft RSS relevant to the B&NES SFRA include;
• Avoiding the need for development in flood risk areas and incorporating measures in design and construction to reduce the effects of flooding
• Requiring ‘future proofing’ of development activity for its susceptibility to climate change
• Positively planning to enhance natural environments through development, taking a holistic approach based on landscape or ecosystem scale planning.
The South West RSS has identified housing targets for unitary authorities and districts within its area. Within the period 2006 – 2026 the overall annual average net dwelling requirement is set at 22 895 – 23 060. Of these, the net dwelling requirement for B&NES is 775 per year until 2026.
Development Policy F: Master Planning, states that:
'Developers, local authorities and public agencies will ensure that major development areas, such as mixed-use developments and urban extensions to the Strategically Significant Cities and Towns (SSCTs) should be planned on a comprehensive and integrated basis within an overall master plan and phasing regime…and… avoid areas susceptible to flooding.'
The draft RSS identifies SSCTs, the primary focus for new development, as those places which offer the greatest opportunity for employment, and the greatest levels of accessibility, by means other than the car, to cultural, transport, health, education and other services.
Bath is the only SSCT in B&NES and is required to provide 375 net dwellings per year in the period 2006 – 2026, leaving 400 net dwellings to be built elsewhere in B&NES per year. Regeneration of urban areas surrounding Bath to meet the housing demand includes areas such as Norton Radstock.
Policy SR5 states that:
'The urban extension should also provide an appropriate level of physical and social infrastructure, well integrated into the City through sustainable means of movement, avoiding areas susceptible to flooding from the River Avon, to ensure that it will maximise the ability to be a sustainable community…'
Policy SR2 states:
'Bath and North East Somerset … should plan for the balanced growth of the…urban areas of Bath…maximising the use of previously developed land and buildings, and within a revised green belt, make provision for significant urban extensions, for mixed-use development, to meet the longer-term needs…'
B&NES SFRA (April 2008) Volume I - Technical Report
3-5
Environment and planning context
A Green Belt Review was completed as part of the development of the draft RSS. It suggested that the new development could be located in areas of green belt if the integrity of green belt was retained as a whole. This was found to be particularly important in Bath, as it may enable a more sustainable pattern of development to be pursued, rather than a more dispersed option which could result in an increase in car- borne commuting.
The strong economic performance of Bath is expected to continue (overall employment in the Bath Travel to Work Area (TTWA) is expected to rise by about 16,000- 20,200 jobs over the plan period) as long as land and labour availability can be maintained.
Regionally significant transport routes are the transport corridors which connect the major urban areas within the region, and are the primary arteries for long-distance intra-regional freight and passenger traffic. Their upkeep and management is essential to the efficient functioning and movement of goods across the region. They also offer regional access to the South West’s ports and airports. Such routes located in B&NES the A36/A46 – Bath to M27 and M4. Map E6 shows the major transport routes in Bath.
The draft RSS recognises that flood risk management can contribute to quality of life, through for example the use of green infrastructure such as river corridors and floodplains. It also recognises that the South West faces a major challenge over the next 50 to 100 years as flood and storm damage increases:
‘Towns and cities around the region will need to adapt to this situation with a priority to defend existing properties from flooding, and to direct growth to areas where it can be accommodated with little or no risk of flooding. In critical locations where the line ‘must be held’ to protect vital social or economic assets and key infrastructure which supports the connectivity of the region, there will be high costs to maintain and upgrade the network of flood warnings and sustainable defences in order to reduce property damage and distress due to flooding’.
Policy F1 of the draft RSS states that:
‘Taking account of climate change and the increasing risk of coastal and river flooding, priority is to; • defend existing properties and, where possible, locate new development in places with
little or no risk of flooding;
• protect flood plains and land liable to tidal or coastal flooding from development;
• follow a sequential approach to development in flood risk areas;
• use development to reduce the risk of flooding through location, layout and design;
• relocate existing development from areas of the coast at risk, which cannot be realistically defended;
• identify areas of opportunity for managed realignment to reduce the risk of flooding and create new wildlife areas.’
In addition, Policy G of the draft RSS requires:
‘the use of sustainable drainage systems to minimise flood risk associated with new developments’.
B&NES SFRA (April 2008) Volume I - Technical Report
3-6
Environment and planning context
Somerset and Joint Structure Plan Alteration 1996-2016 (DEPOSIT DRAFT 2004)
The new plan making system introduces RSS’s and removes the need for county led Structure Plans. As such, the Somerset and Joint Structure Plan Alteration 1996 - 2016 has been put on hold and will not be carried through to adoption. However the policies within the Somerset and Exmoor National Park Joint Structure Plan Review 1991 - 2011, and the Somerset & Exmoor National Park Joint Structure Plan Alteration 1996 - 2016 will continue to be material planning considerations in determining planning applications until the RSS is adopted in early 2008.
Policy 60 from the Somerset & Exmoor National Park Joint Structure Plan Alteration 1996 –2016 is the most relevant flood policy and has been produced in line with the Somerset and Exmoor National Park Joint Structure Plan Review 1991 – 2011. Policy 60: Flood Plain Protection;
'Areas vulnerable to flooding should continue to be protected from development which would cause a net loss of flood storage area or interrupt the free flow of water or adversely affect their environmental or ecological value.
In allocating land for development in local plans, consideration must be given to measures to mitigate the impact on the existing land drainage regime to avoid exacerbating flooding problems.'
Policies relating to housing allocation have been superseded by the draft RSS.
Local level
B&NES Local Plan (Adopted October 2007)
The Local Plan is the primary basis for deciding planning applications. It sets out policies which guide how and where development should take place up to the year 2011.
B&NES Local Plan recognises that not all development can be concentrated in Bath. The next priority should be those settlements which have significant existing advantages over other locations in respect of public transport access to major employment areas and other important facilities. The existing urban areas of Keynsham and Norton Radstock have good bus links to Bath and Bristol and potential to improve upon existing reasonable rail services. They also have a good range of facilities and services. The B&NES Local Plan identifies these towns as suitable for significant levels of development.
Housing requirements in the area will increase over the B&NES Local Plan period. Policy HG.1 states:
'Provision will be made for the construction of 6 855 dwellings in the period 1996-2011. The provision will incorporate a mix of dwelling size, type, tenure and affordability to meet the needs of specific groups such as the elderly or first time buyers. New housing developments should avoid the creation of large areas of housing of similar characteristics.'
This housing requirement will be superseded by the requirements set out in the draft South West RSS. Nevertheless, Table 3A of the B&NES Local Plan sets out those areas where significant numbers of housing could be provided. Although the actual numbers of new housing proposed for B&NES will change based on the draft RSS, the following areas are likely to be indicative of the location of new dwellings;
• Bath Western Riverside;
• St Martin ’s Hospital;
• South West Keynsham;
• St Peter ’s Factory / Jewsons;
B&NES SFRA (April 2008) Volume I - Technical Report
3-7
Environment and planning context
• Welton Packaging Factory;
• Land at Cautletts Close, Midsomer Norton; and
• Paulton Printing Factory.
In terms of location for employment, the B&NES Local Plan promotes the location of employment-related development on land already used for such purposes, including development undertaken as part of mixed use schemes, with green field employment land released for new employment development only where necessary.
Policy ET.1 identifies a need to increase office floorspace over the plan period, and reduce industrial floorspace by 45,000m2. The increase in office space is outlined below:
Policy ET1: During the period 2001-2011 the Council will seek … (A) a net increase in office floorspace (Class B1a&b) of approx 24,000sq.m distributed as follows:
Total Annual average Bath 18,000 sq.m 1,800 sq.m Keynsham No net change No net change Norton-Radstock 2,000 sq.m 200 sq.m Rural areas 4,000 sq.m 400 sq.m B&NES Total 24,000 sq.m 2,400 sq.m
The B&NES Local Plan recognises that new development, redevelopment and land raising can have significant implications for flood risk. Supporting text within the Plan states that:
'Within river floodplains, new development or redevelopment of existing sites may be liable to flooding or may increase the risk of flooding elsewhere by reducing the storage capacity of the floodplain and impeding flood flows. Likewise, consideration must be given to the whole river catchment as development outside the floodplain can also increase flood risk or be subject to localised flooding.'
Policy NE.14 states: Development will not be permitted where:
(i) it is subject to flooding, causes flooding elsewhere or where it would impede the flow of floodwater unless the flood hazard can be mitigated; (ii) it causes net loss in the flood storage capacity; (iii) the run-off from the development would result in, or increase the risk of, flooding of watercourses, ditches, land or property; (iv) it would prevent the maintenance of the channels of watercourses; it would result in watercourse channel instability; or (v) the existing drainage systems on the site are adversely affected ,or if the land drainage of the site, when developed, is inadequate.
All planning applications located within an indicative floodplain shown on the Proposals Map or where there is other evidence that it is at risk from flooding should be accompanied by a Flood Risk Assessment.
B&NES Local Development Framework (LDF)
B&NES is currently developing a LDF, as required by the Planning and Compulsory Purchase Act 2004. The LDF will comprise a portfolio of Local Development Documents (LDDs), and will replace the existing planning system. There are two types of Local Development Document:
• Development Plan Documents (DPD): these will be subject to independent examination and have the weight of development plan status. Together with the South West RSS they form the statutory development plans for the area; and
B&NES SFRA (April 2008) Volume I - Technical Report
3-8
Environment and planning context
• Supplementary Planning Documents (SPD): these will not be subject to independent examination and do not have development plan status. However, they can constitute a material consideration in the determination of planning applications and must supplement a policy in a DPD. They cannot be used to formulate planning policy.
Work commenced on a Core Strategy DPD in January 2007. The Core Strategy will set out the long term planning framework for B&NES, and will replace the existing Local Plan (which is currently being treated as a plan in preparation). It will include a spatial vision and spatial objectives for a ten year period from adoption of the plan but also looking ahead to 2026, and will be supported by the completion of this SFRA.
Other plans and policies
Catchment Flood Management Plan (CFMP)
Catchment Flood Management Plans (CFMP) outline the future management of flood risk on a catchment scale. The plans are being developed by the Environment Agency in consultation with local stakeholders. The CFMPs look at the current level of flood risk and compare this to the predicted future flood risk. This allows a targeted approach in dealing with flood risk in areas that will need it the most. The CFMP process assesses how flooding might affect people, property and the environment. The CFMP policies should be considered when making land planning decisions.
Most of B&NES falls within the boundaries of the Bristol Avon CFMP. A small area on the western side of the district falls within the North and Mid Somerset CFMP.
Each CFMP is divided into a number of 'management units' which are defined as areas with similar sources, pathways and receptors of flooding. Each management unit is assigned a preferred flood risk management policy based on an appraisal of the social, economic and environmental damages of flooding.
Map M1 in Annex A shows the boundaries of the management units and preferred policies. Most of B&NES is classed as Mendip Slopes, with a preferred policy of 'sustain the current level of flood risk', and Lower Avon Rural, with a preferred policy of 'continue with existing or alternative actions'. Bath, Bristol and Chew Magna all have a further action to 'take further action to reduce risk'.
B&NES SFRA (April 2008) Volume I - Technical Report
3-9
Environment and planning context
System asset management plans (SAMPs)
The Environment Agency is currently reviewing their assets to develop System Asset Management Plans (SAMPs) so that they can make informed decisions on their investments in capital works. These plans may have a bearing on decisions made by the council of B&NES in relation to the long-term condition of existing flood defences in the area.
Once completed, the area covered by each SAMP will be divided into a number of 'management units' and assigned a specific management policy for each unit. SAMPs are compatible with Catchment Flood Management Plan (CFMP) policy units.
Maps D1a to D1i in Annex A show the draft SAMP management units in B&NES. These are explored further in Chapter 4.
Key stakeholders
PPS25 requires that all sources of flood risk be considered when making land use planning decisions. To ensure that all sources of flood risk are included, it is important to consult a range of organisations. The key organisations identified within B&NES are:
The Environment Agency - a statutory consultee for RSS, LDD, sustainability appraisals, and planning applications. Their main role is to provide flood risk information and advice. B&NES lies within the South West Region of the Environment Agency.
Wastewater companies - generally responsible for surface water drainage from developments connected to adopted sewers. B&NES is serviced by Wessex Water. B&NES are advised to consult water companies in developing LDDs, so that specific capacity problems and Urban Drainage Plans are considered.
Highways authorities – should be consulted to ensure highway drainage issues are addressed in the SFRA.
Emergency services and multi-agency emergency planning - consult Emergency Resilience Forums during the preparation of development documents and liaise with their emergency planning officers regarding any planning applications which have implications for emergency planning. In some cases, it may be appropriate for B&NES to consult the emergency services themselves on specific emergency planning issues related to new developments.
B&NES SFRA (April 2008) Volume I - Technical Report
3-10
Flood defences and assets
4. Flood defences and assets
The B&NES SFRA is a 'live' document. The current version has been developed using the best information and concepts available at the time. As new information and concepts become available the document will be updated and so it is the responsibility of the reader to be satisfied that they are using the most up-to-date information and that the SFRA accounts for this information. All revisions to this summary document are listed in the table.
Version Issue Date Issued by Issued to
Final 23/04//2008 Capita Symonds
Ltd
B&NES, EA
B&NES SFRA (April 2008) Volume I - Technical Report
4-1
Flood defences and assets
Introduction
Structures and defences are built to help reduce the occurrence, and therefore consequences of flooding. These assets can be owned, operated and maintained by the Environment Agency, Local Authorities, private business and/or local residents. This Chapter summarises the defences identified and reviewed in B&NES.
In some instances, river processes have been modified over time by these defences (such as river walls, flood storage areas, flood alleviation channels and embankments) and by undertaking maintenance activities (such as river dredging).
To fully understand flood risk, it is necessary to assess the area at risk of flooding;
• with the flood defences in place
• with the flood defences removed
• with a breach or failure of the flood defence.
To do so the existing flood defences must be identified and defined in terms of their type and physical characteristics. In addition, information on ownership, condition and maintenance arrangements are required to assess the likelihood of failure.
Data collection and manipulation
Sources of data
The Environment Agency's National Flood and Coastal Defence Database (NFCDD) has been the primary source of information for identifying flood defences. Other GIS layers and reports from the Environment Agency and B&NES have been used to supplement NFCDD as outlined in Table 4.1. Further information on the data collected is stored in the document database in Volume III of the SFRA.
Table 4.1 Flood and asset data sources collected to date
Source Title Data type Date
Environment Agency NFCDD data in the form of defence polyline and point data and structure point data GIS 2007
Environment Agency Bath Flood Defence Scheme, DRAFT Addendum to Option Identification Appraisal Report 2005
Environment Agency River Chew Section 105 Flood Risk Mapping Report 2004
Environment Agency Bath, North East Somerset and Bristol, Section 105, Flood Risk Mapping Report 2000
Environment Agency Bath, North East Somerset and Bristol, Section 105, Flood Risk Mapping
GIS (TUFLOW
model layer)
2007
Environment Agency nat_defences_v2_2.shp GIS 2007
B&NES River Avon Regeneration Pre-feasibility study Report 2006
B&NES Maintained watercourses GIS 2007
Environment Agency System Asset Management Plan Units - draft PDF 20 June 2007
B&NES SFRA (April 2008) Volume I - Technical Report
4-2
Flood defences and assets
Screening of NFCDD data
The Environment Agency's National Flood and Coastal Defence Database (NFCDD) has been the primary source of information for identifying flood defences. This database contains flood defence and asset data for the whole of England and Wales.
The NFCDD dataset provided by the Environment Agency contained attributed polyline data for flood defences in the B&NES. Due to the vast amount of information in NFCDD, the dataset was cleaned to remove non-flood defence structures. A number of analyses were undertaken to;
• Determine the type of flood defence
• Determine the source of flooding that it was defending
• Estimate the standard of protection.
The attribute fields were edited to remove information fields which consistently lacked data.
NFCDD contains details of a number of structures across the study area and many of these do not have a major impact on flooding during large events. Environment Agency National guidance provides information by which to define flood defences. Only significant flood defences such as flood alleviation channels and raised defences have been identified as flood defences for the purposes of the SFRA. NFCDD structures not considered flood defences include surface water outfalls, natural banks, raising of ground levels and maintained channels (dredged and weed cut). However these structures can provide benefit, for example the maintained channel downstream of the River Somer Flood Alleviation Tunnel is considered important for reducing flood risk.
The ‘Asset type’ field was used to remove non-flood defence structures. The following were removed:
• Natural channel.
• Maintained channel*
• Culverted channel*
• Non flood defence structure.
*where maintained or culverted channel had been separately identified as a significant flood defence (Standard of Protection greater than 100) the information was not removed.
The defence types identified within NFCDD for the B&NES study area were raised defences (man made), and a flood alleviation tunnel consisting of culverted and maintained channel.
Through identifying defences type it is possible to consider:
• The consequence of failure (such as embankment failure compared to failure of a riverwall).
• Maintenance requirements. For example assets with additional erosion protection may require more inspection but less maintenance. However assets without erosion protection (in a less erosive environment) may eventually require more significant improvement.
B&NES SFRA (April 2008) Volume I - Technical Report
4-3
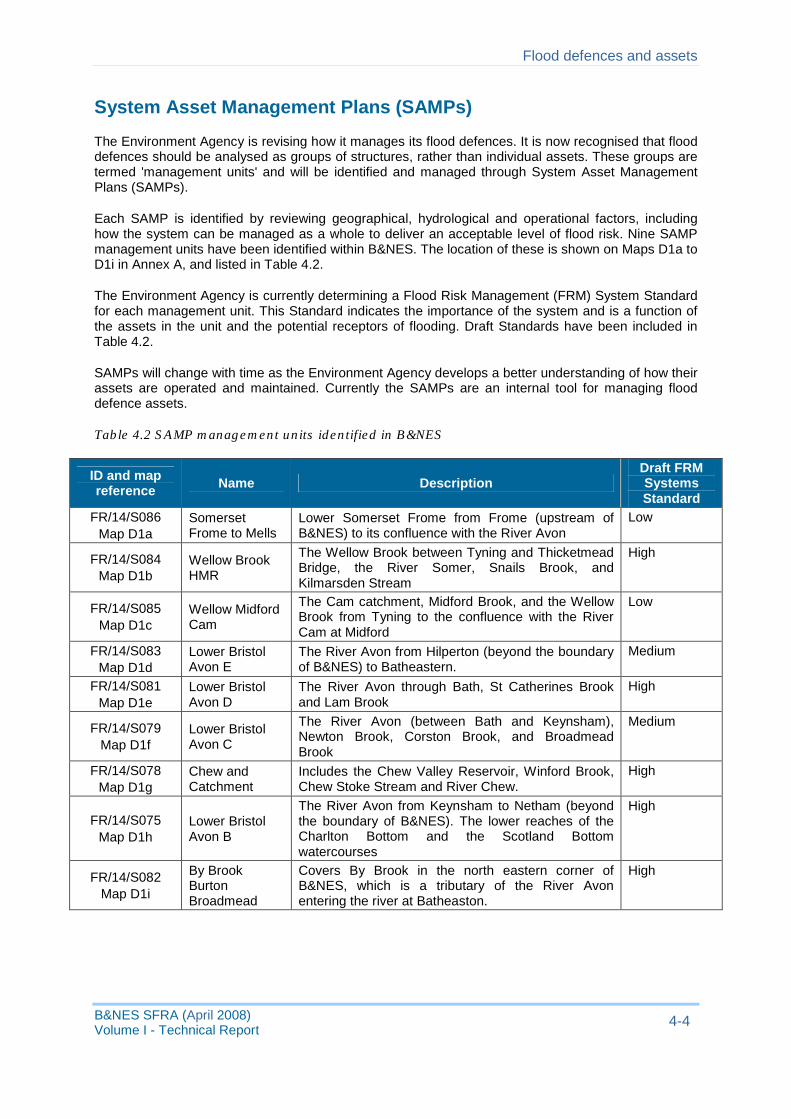
Flood defences and assets
System Asset Management Plans (SAMPs)
The Environment Agency is revising how it manages its flood defences. It is now recognised that flood defences should be analysed as groups of structures, rather than individual assets. These groups are termed 'management units' and will be identified and managed through System Asset Management Plans (SAMPs).
Each SAMP is identified by reviewing geographical, hydrological and operational factors, including how the system can be managed as a whole to deliver an acceptable level of flood risk. Nine SAMP management units have been identified within B&NES. The location of these is shown on Maps D1a to D1i in Annex A, and listed in Table 4.2.
The Environment Agency is currently determining a Flood Risk Management (FRM) System Standard for each management unit. This Standard indicates the importance of the system and is a function of the assets in the unit and the potential receptors of flooding. Draft Standards have been included in Table 4.2.
SAMPs will change with time as the Environment Agency develops a better understanding of how their assets are operated and maintained. Currently the SAMPs are an internal tool for managing flood defence assets.
Table 4.2 SAMP management units identified in B&NES
ID and map reference Name Description
Draft FRM Systems Standard
FR/14/S086 Map D1a
Somerset Frome to Mells
Lower Somerset Frome from Frome (upstream of B&NES) to its confluence with the River Avon
Low
FR/14/S084 Map D1b
Wellow Brook HMR
The Wellow Brook between Tyning and Thicketmead Bridge, the River Somer, Snails Brook, and Kilmarsden Stream
High
FR/14/S085 Map D1c
Wellow Midford Cam
The Cam catchment, Midford Brook, and the Wellow Brook from Tyning to the confluence with the River Cam at Midford
Low
FR/14/S083 Map D1d
Lower Bristol Avon E
The River Avon from Hilperton (beyond the boundary of B&NES) to Batheastern.
Medium
FR/14/S081 Map D1e
Lower Bristol Avon D
The River Avon through Bath, St Catherines Brook and Lam Brook
High
FR/14/S079 Map D1f
Lower Bristol Avon C
The River Avon (between Bath and Keynsham), Newton Brook, Corston Brook, and Broadmead Brook
Medium
FR/14/S078 Map D1g
Chew and Catchment
Includes the Chew Valley Reservoir, Winford Brook, Chew Stoke Stream and River Chew.
High
FR/14/S075 Map D1h
Lower Bristol Avon B
The River Avon from Keynsham to Netham (beyond the boundary of B&NES). The lower reaches of the Charlton Bottom and the Scotland Bottom watercourses
High
FR/14/S082 Map D1i
By Brook Burton Broadmead
Covers By Brook in the north eastern corner of B&NES, which is a tributary of the River Avon entering the river at Batheaston.
High
B&NES SFRA (April 2008) 4-4 Volume I - Technical Report
Flood defences and assets
Summary of key flood defences
Flood defences identified within B&NES are shown in Map D2 and Map D2_Bath in Annex A, and summarised in Table 4.3.
At present, the key flood defences in B&NES protect against flooding from rivers. These are located in Bath and Midsomer Norton, which both have a formal flood alleviation scheme. The scheme in Bath consist primarily of channel widening and re-grading undertaken in 1974, there are also two relatively short lengths of raised defence and the Midsomer Norton scheme consists of a flood alleviation tunnel.
The Chew Valley Reservoir also provides some flood defence benefit as it attenuates flow from the upper catchment, although it is not considered a formal flood defence.
Bath Flood Alleviation Scheme
The two raised defence structures in B&NES are the small wall on the left bank at Lower Bristol Road immediately downstream from Churchill Bridge, and the length of left bank along Spring Gardens Road, protecting the Dolemeads. For the rest of Bath, protection is afforded by the widening and regrading of the channel completed in 1974.
The flood defence scheme in Bath was initiated soon after the 1960 flood and was finally completed in 1974 at a cost of £3M. The scheme focused on improving conveyance through the town and several options were discussed including a Flood Alleviation Tunnel.
The final design involved widening and deepening the channel from Pulteney to Saltford to increase conveyance. Large steel sheet-piles were added to strengthen the vertical walls of the modified reach. Modifications were made to Pulteney Weir, which was previously a simple straight weir which spanned the entire width of the channel. The new horseshoe shaped weir maximised the amount of flow that could pass over the weir, reducing flood risk upstream1.
Adjacent to Pulteney Weir is a radial gate (sluice gate). As the water level rises upstream of Pulteney Weir, a corresponding rise of water level in the sluice structure causes large floats on either side of the sluice to rise. This lifts the curved face of the gate from the bed of the channel, thereby allowing additional flow to pass. The resulting reduction in river levels upstream of the weir contributes towards reducing the flood risk. The effectiveness of the sluice in large flood events has been questioned2 and through hydraulic model simulations it has been argued that it could be removed or substantially modified1.
At the downstream end of the scheme at Twerton, there is a large structure which spans the Avon. This structure houses two sluice gates which replaced the original weir in 1967. During low flows, these sluice gates maintain water levels in Bath. The structure would have been important for the old mills in the city but is now essential for continued navigational use of the river (as a link to the Kennet & Avon Canal).
The left hand gate is a large radial gate, whilst the right hand gate is a vertical lifting sluice. On top of the vertical gate is a smaller, tilting plate which is used for fine control of water levels at the upper end of normal flow. In response to increases in flow and therefore water level, the gates will open at a rate which maintains a constant upstream level. Should the river level continue to rise after the gates are fully open, flooding of vulnerable areas of Bath could result.
A recent Pre-feasibility Study carried out by the Environment Agency has shown that there are particular areas of Bath which are vulnerable due to low spots in the existing defences. The
1 Bath and North East Somerset Council, (2006), River Avon Regeneration Pre-Feasibility, Final Report (9R80038), Haskoning
UK Ltd 2
Environment Agency, (2005) Bath Flood Defence Scheme, DRAFT Addendum to Option Identification Appraisal, Halcrow
B&NES SFRA (April 2008) Volume I - Technical Report
4-5
Flood defences and assets
subsequent Feasibility Report commissioned by the Environment Agency looks at possible solutions for addressing these problem areas.3
The defences through Bath are a combination of different structures and channel features. The raised defences have been removed for the undefended case and modelled using the Environment Agency Flood Zone Improvement model. Therefore the raised defences have been included for the defended case modelled for the SFRA. This is discussed further in Chapter 6.
Midsomer Norton Flood Alleviation Scheme
The River Somer Flood Alleviation Scheme comprises a low flow channel through the centre of Midsomer Norton and a flood alleviation tunnel around it. The inlets start at Midsomer Norton cricket ground, with a second tunnel inlet immediately upstream of the town centre. In addition to this significant channel improvements (as implemented in 1981) have been undertaken some 500m downstream of the lower extent of the modelled reach.4
The Environment Agency confirmed that there have been two incidents of property flooding since the scheme was completed, which were due to surface water flooding. The channel through the centre of Midsomer Norton is designed to take local surface flood water.
The SFRA considers the Flood Alleviation Tunnel at Midsomer Norton and the scheme through Bath to be defences. The Flood Alleviation Tunnel on the River Somer has been removed to determine Flood Zone 3a for the area, and included when defining Flood Zone 3b and the actual and residual flood risk in the town. This is discussed further in Chapter 6.
Chew Valley Lake
Situated at the top of the Chew catchment the Chew Valley Lake is a large and important public water supply reservoir. It is the fifth largest artificial lake in the United Kingdom with an area of 4.9km2 and an estimated volume of 20 000 000m3. The lake was opened in the 1950s as a public water supply for the City of Bristol and surrounding area5.
Compensation flows enter the River Chew via a culvert at the base of the spillway and larger flood flows can enter the river via overtopping of the spillway. As the reservoir is not kept full, it has some capacity for flood storage. The resultant attenuation means that the reservoir is considered a 'defacto' flood defence.
As the primary purpose of the reservoir is not flood defence, is has not been considered as a defence within the modelling undertaken in the SFRA (i.e. it was not removed in the 'without flood defences' scenario). However it is considered as an artificial source of flooding explored further in Chapter 11.
Chew Magna Reservoir
Chew Magna Reservoir is a small (0.02km2) reservoir located immediately upstream of Chew Magna. It was created in the 1930s by damming the Winford Brook to supply water to the villages in Chew Valley6 .The reservoir provides some flood attenuation, although as the water levels are maintained relatively high, it has a limited impact during large flood events.
The Chew Magna Reservoir is not considered a formal defence and as such has not been considered in the modelling undertaken for the SFRA (i.e. it is not removed in the 'without defences' scenario). However it has been considered as an artificial source of flooding explored further in Chapter 11.
3 Bath and North East Somerset Council, (2006), River Avon Regeneration Pre-Feasibility, Final Report (9R80038), Haskoning
UK Ltd. 4
Environment Agency, (2000) Nat. Sect. 105. Framework, Bath, North East Somerset and Bristol, BBV and Symonds. 5
http://www.answers.com/Chew%20Valley%20Lake 6
http://www.answers.com/topic/chew-magna-reservoir
B&NES SFRA (April 2008) Volume I - Technical Report
4-6
Flood defences and assets
Maintained channels and sheet piling
In addition to the flood defences identified some sections of maintained channel and steel piling are identified in NFCDD as having a standard of protection between 20% AEP and 1% AEP. These maintained reaches include sections of the River Avon through Bath, a section of the River Wellow through Radstock (2.5 to 1% AEP), and sections of channel at Chew Magna on the Winford Brook and River Chew (10% AEP and 2% AEP, respectively).
Sections of maintained channel and sheet piling are not considered defences by the Environment Agency when assessing areas benefiting from defences. This approach has been adopted when assessing the impact of flood defences in the SFRA. Thus these assets have not been removed in the 'without defences' modelling scenario.
Maintenance
The Environment Agency and Local Authority carry out annual inspections of flood defence assets and update NFCDD. The data from these inspections is used to inform the owner of their duty to maintain assets to an appropriate level. As a result, information about flood defences is constantly changing.
GIS layers provided within the SFRA must be reviewed to obtain all of the defence information when considering the condition and standard of protection offered by flood defences at specific locations. It is important that users of the SFRA recognise issues with data quality and consistency of the source NFCDD datasets. The most current and correct information should be used. NFCDD is a live database, which is continually updated by the Environment Agency. Future updates of NFCDD should rectify any omissions and errors in the current dataset.
The management of the river defences and assets within B&NES is divided between a number of different parties. The Environment Agency is responsible for the majority of the river defences and has a supervisory duty over all flood defences under the Environment Act 1995.
B&NES Council maintain a number of watercourses and assets such as trash screens and culverts throughout the study area.
The Environment Agency has permissive powers to maintain and improve watercourses designated as 'Main River' and associated structures for the efficient passage of river flow and the management of water levels. The Environment Agency also has a general supervisory duty for all flood risk management activities.
As the operating authority, Councils have the regulatory and supervisory role for flood defences on all ordinary watercourses which are not within the area of an internal drainage board (IDB). Culverts under roads are generally the responsibility of the relevant Highways Authority.
B&NES SFRA (April 2008) Volume I - Technical Report
4-7
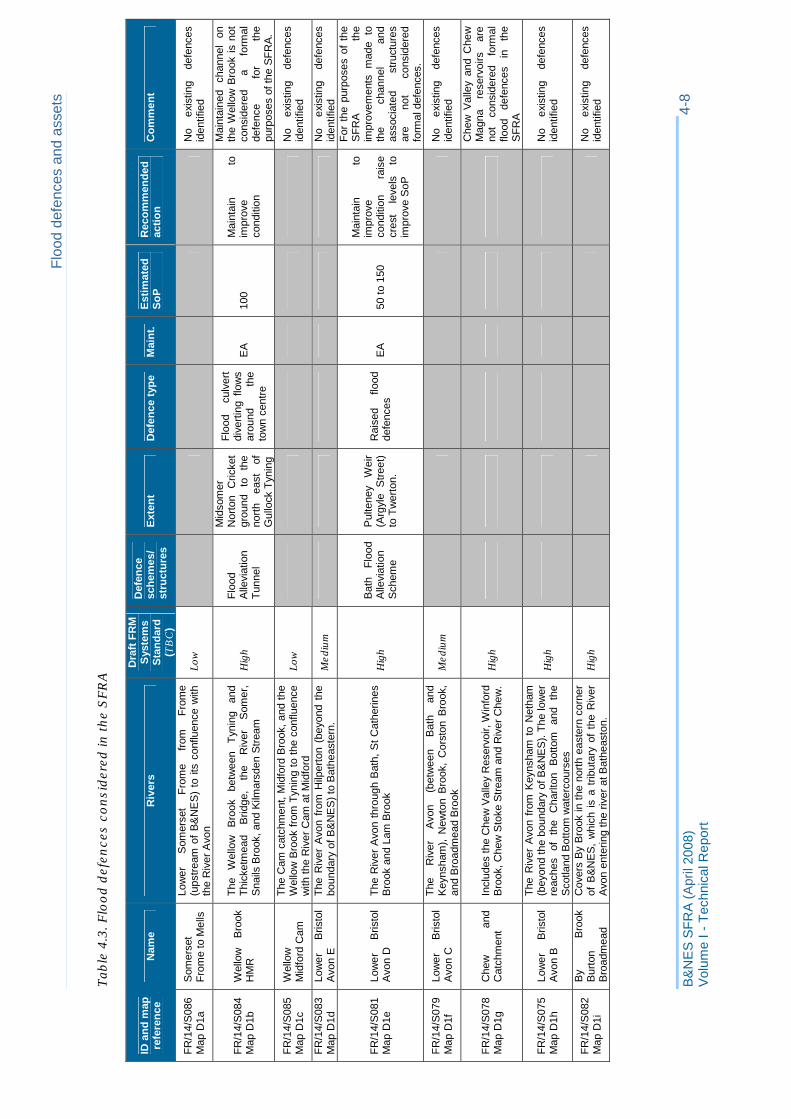
Floo
d de
fenc
es a
nd a
sset
s
Tabl
e 4.
3. F
lood
def
ence
s co
nsid
ered
in th
e S
FRA
ID a
nd m
ap
refe
renc
e N
ame
Riv
ers
Sys
tem
s S
tand
ard
(TB
C)
Dra
ft F
RM
D
efen
ce
sche
mes
/ st
ruct
ures
E
xten
t D
efen
ce ty
pe
Mai
nt.
Est
imat
ed
SoP
R
ecom
men
ded
actio
n C
omm
ent
FR/1
4/S
086
Map
D1a
S
omer
set
From
e to
Mel
ls
Low
er
Som
erse
t Fr
ome
from
Fr
ome
(ups
tream
of
B&
NE
S)
to it
s co
nflu
ence
with
th
e R
iver
Avo
n Lo
w
No
exis
ting
defe
nces
id
entif
ied
FR/1
4/S
084
Map
D1b
W
ello
w
Bro
ok
HM
R
The
Wel
low
B
rook
be
twee
n T
ynin
g an
d Th
icke
tmea
d B
ridge
, th
e R
iver
S
omer
, S
nails
Bro
ok, a
nd K
ilmar
sden
Stre
am
Hig
h Fl
ood
Alle
viat
ion
Tunn
el
Mid
som
er
Nor
ton
Cric
ket
grou
nd
to
the
north
ea
st
of
Gul
lock
Tyn
ing
Floo
d cu
lver
t di
verti
ng f
low
s ar
ound
th
e to
wn
cent
re
EA
10
0 M
aint
ain
to
impr
ove
cond
ition
Mai
ntai
ned
chan
nel
on
the
Wel
low
Bro
ok is
not
co
nsid
ered
a
form
al
defe
nce
for
the
purp
oses
of t
he S
FRA
.
FR/1
4/S
085
Map
D1c
W
ello
w
Mid
ford
Cam
The
Cam
cat
chm
ent,
Mid
ford
Bro
ok, a
nd th
e W
ello
w B
rook
from
Tyn
ing
to th
e co
nflu
ence
w
ith th
e R
iver
Cam
at M
idfo
rd
Low
N
o ex
istin
g de
fenc
es
iden
tifie
d
FR/1
4/S
083
Map
D1d
Lo
wer
B
risto
l A
von
E
The
Riv
er A
von
from
Hilp
erto
n (b
eyon
d th
e bo
unda
ry o
f B&
NE
S) t
o B
athe
aste
rn.
Med
ium
N
o ex
istin
g de
fenc
es
iden
tifie
d
FR/1
4/S
081
Map
D1e
Lo
wer
B
risto
l A
von
D
The
Riv
er A
von
thro
ugh
Bat
h, S
t Cat
herin
es
Bro
ok a
nd L
am B
rook
H
igh
Bat
h Fl
ood
Alle
viat
ion
Sch
eme
Pul
tene
y W
eir
(Arg
yle
Stre
et)
to T
wer
ton.
Rai
sed
flood
de
fenc
es
EA
50
to 1
50
Mai
ntai
n to
im
prov
e co
nditi
on
rais
e cr
est
leve
ls
to
impr
ove
SoP
For
the
purp
oses
of
the
SFR
A
the
impr
ovem
ents
mad
e to
th
e ch
anne
l an
d as
soci
ated
st
ruct
ures
ar
e no
t co
nsid
ered
fo
rmal
def
ence
s.
FR/1
4/S
079
Map
D1f
Lo
wer
B
risto
l A
von
C
The
Riv
er
Avo
n (b
etw
een
Bat
h an
d K
eyns
ham
), N
ewto
n B
rook
, C
orst
on B
rook
, an
d B
road
mea
d B
rook
M
ediu
m
No
exis
ting
defe
nces
id
entif
ied
FR/1
4/S
078
Map
D1g
C
hew
an
d C
atch
men
t In
clud
es th
e C
hew
Val
ley
Res
ervo
ir, W
info
rd
Bro
ok, C
hew
Sto
ke S
tream
and
Riv
er C
hew
. H
igh
Che
w V
alle
y an
d C
hew
M
agna
re
serv
oirs
ar
e no
t co
nsid
ered
fo
rmal
flo
od
defe
nces
in
th
e S
FRA
FR/1
4/S
075
Map
D1h
Lo
wer
B
risto
l A
von
B
The
Riv
er A
von
from
Key
nsha
m t
o N
etha
m
(bey
ond
the
boun
dary
of B
&N
ES
). Th
e lo
wer
re
ache
s of
th
e C
harlt
on
Bot
tom
an
d th
e S
cotla
nd B
otto
m w
ater
cour
ses
Hig
h N
o ex
istin
g de
fenc
es
iden
tifie
d
FR/1
4/S
082
Map
D1i
By
Bro
ok
Bur
ton
Bro
adm
ead
Cov
ers
By
Bro
ok in
the
north
eas
tern
cor
ner
of B
&N
ES
, w
hich
is
a tri
buta
ry o
f th
e R
iver
A
von
ente
ring
the
river
at B
athe
asto
n.
Hig
h N
o ex
istin
g de
fenc
es
iden
tifie
d
4-8
B&
NE
S S
FRA
(Apr
il 20
08)
Vol
ume
I -T
echn
ical
Rep
ort
Flood warning and emergency planning
5. Flood warning and emergency planning
The B&NES SFRA is a 'live' document. The current version has been developed using the best information and concepts available at the time. As new information and concepts become available the document will be updated and so it is the responsibility of the reader to be satisfied that they are using the most up-to-date information and that the SFRA accounts for this information. All revisions to this summary document are listed in the table.
Version Issue Date Issued by Issued to
Final 23/04//2008 Capita Symonds
Ltd
B&NES, EA
B&NES SFRA (April 2008) Volume I - Technical Report
5-1
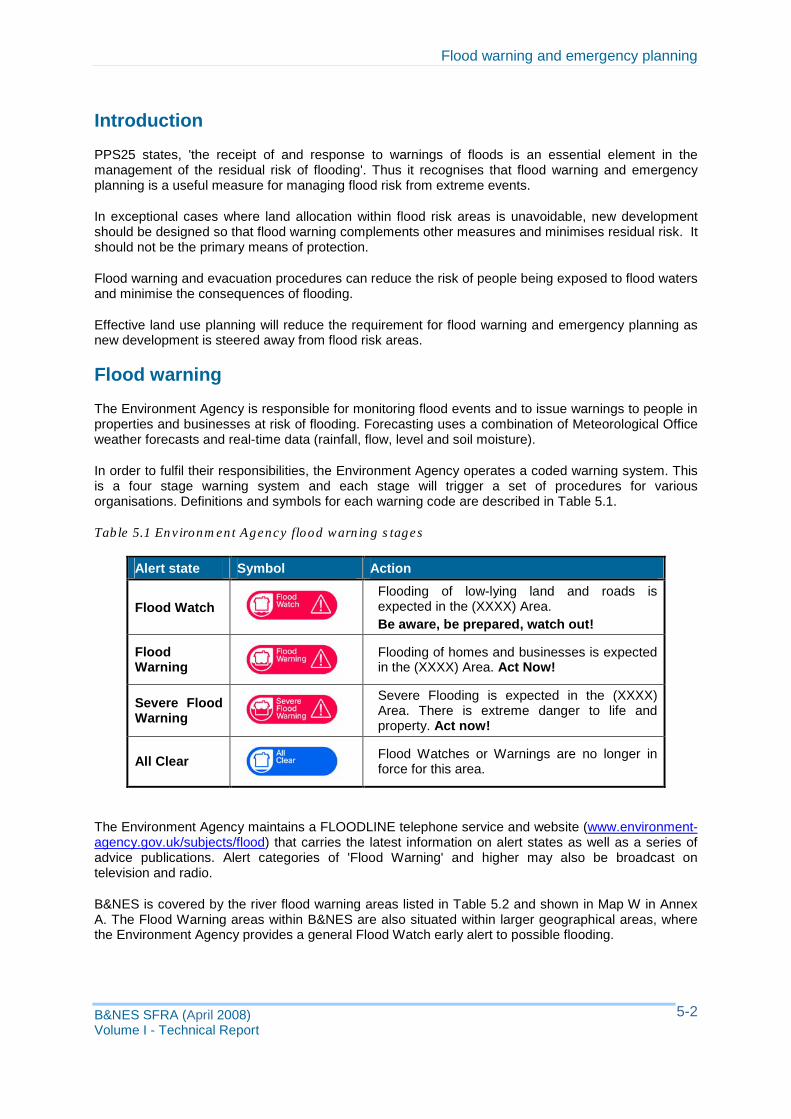
Flood warning and emergency planning
Introduction
PPS25 states, 'the receipt of and response to warnings of floods is an essential element in the management of the residual risk of flooding'. Thus it recognises that flood warning and emergency planning is a useful measure for managing flood risk from extreme events.
In exceptional cases where land allocation within flood risk areas is unavoidable, new development should be designed so that flood warning complements other measures and minimises residual risk. It should not be the primary means of protection.
Flood warning and evacuation procedures can reduce the risk of people being exposed to flood waters and minimise the consequences of flooding.
Effective land use planning will reduce the requirement for flood warning and emergency planning as new development is steered away from flood risk areas.
Flood warning
The Environment Agency is responsible for monitoring flood events and to issue warnings to people in properties and businesses at risk of flooding. Forecasting uses a combination of Meteorological Office weather forecasts and real-time data (rainfall, flow, level and soil moisture).
In order to fulfil their responsibilities, the Environment Agency operates a coded warning system. This is a four stage warning system and each stage will trigger a set of procedures for various organisations. Definitions and symbols for each warning code are described in Table 5.1.
Table 5.1 Environment Agency flood warning stages
Alert state Symbol Action
Flood Watch Flooding of low-lying land and roads is expected in the (XXXX) Area. Be aware, be prepared, watch out!
Flood Warning
Flooding of homes and businesses is expected in the (XXXX) Area. Act Now!
Severe Flood Warning
Severe Flooding is expected in the (XXXX) Area. There is extreme danger to life and property. Act now!
All Clear Flood Watches or Warnings are no longer in force for this area.
The Environment Agency maintains a FLOODLINE telephone service and website (www.environmentagency.gov.uk/subjects/flood) that carries the latest information on alert states as well as a series of advice publications. Alert categories of 'Flood Warning' and higher may also be broadcast on television and radio.
B&NES is covered by the river flood warning areas listed in Table 5.2 and shown in Map W in Annex A. The Flood Warning areas within B&NES are also situated within larger geographical areas, where the Environment Agency provides a general Flood Watch early alert to possible flooding.
B&NES SFRA (April 2008) Volume I - Technical Report
5-2
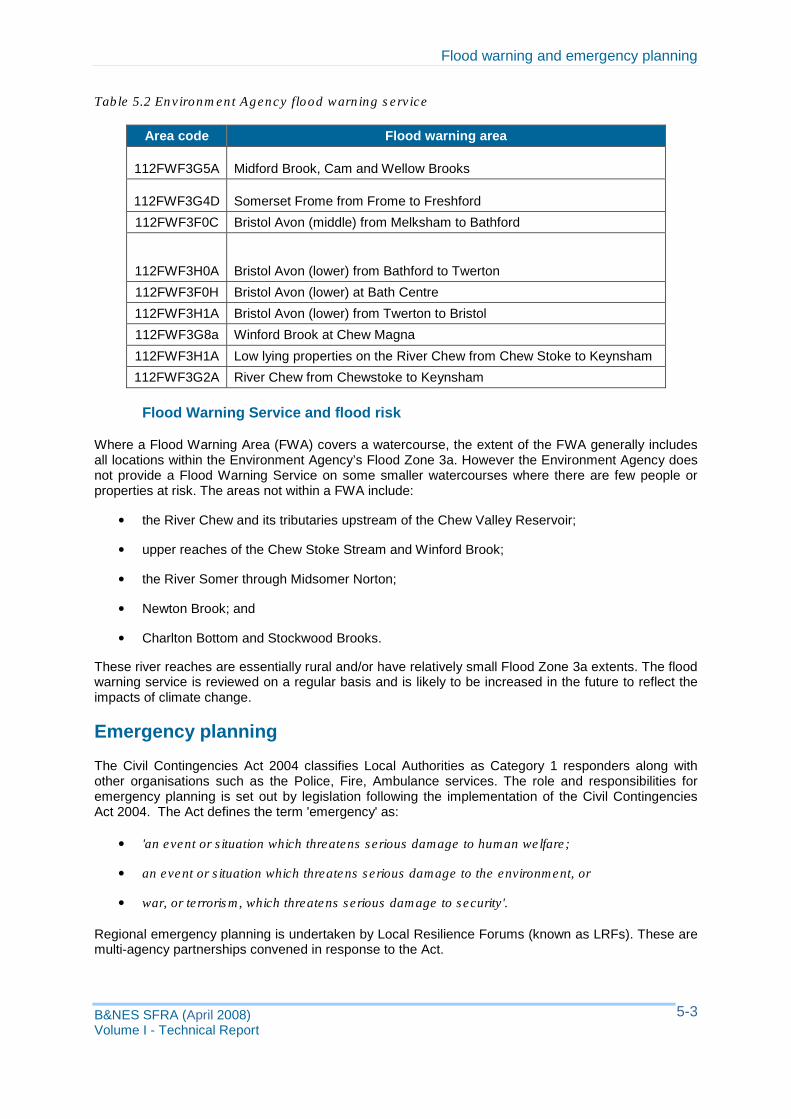
Flood warning and emergency planning
Table 5.2 Environment Agency flood warning service
Area code Flood warning area
112FWF3G5A Midford Brook, Cam and Wellow Brooks
112FWF3G4D Somerset Frome from Frome to Freshford
112FWF3F0C Bristol Avon (middle) from Melksham to Bathford
112FWF3H0A Bristol Avon (lower) from Bathford to Twerton
112FWF3F0H Bristol Avon (lower) at Bath Centre
112FWF3H1A Bristol Avon (lower) from Twerton to Bristol
112FWF3G8a Winford Brook at Chew Magna
112FWF3H1A Low lying properties on the River Chew from Chew Stoke to Keynsham
112FWF3G2A River Chew from Chewstoke to Keynsham
Flood Warning Service and flood risk
Where a Flood Warning Area (FWA) covers a watercourse, the extent of the FWA generally includes all locations within the Environment Agency’s Flood Zone 3a. However the Environment Agency does not provide a Flood Warning Service on some smaller watercourses where there are few people or properties at risk. The areas not within a FWA include:
• the River Chew and its tributaries upstream of the Chew Valley Reservoir;
• upper reaches of the Chew Stoke Stream and Winford Brook;
• the River Somer through Midsomer Norton;
• Newton Brook; and
• Charlton Bottom and Stockwood Brooks.
These river reaches are essentially rural and/or have relatively small Flood Zone 3a extents. The flood warning service is reviewed on a regular basis and is likely to be increased in the future to reflect the impacts of climate change.
Emergency planning
The Civil Contingencies Act 2004 classifies Local Authorities as Category 1 responders along with other organisations such as the Police, Fire, Ambulance services. The role and responsibilities for emergency planning is set out by legislation following the implementation of the Civil Contingencies Act 2004. The Act defines the term 'emergency' as:
• 'an event or situation which threatens serious damage to human welfare;
• an event or situation which threatens serious damage to the environment, or
• war, or terrorism, which threatens serious damage to security'.
Regional emergency planning is undertaken by Local Resilience Forums (known as LRFs). These are multi-agency partnerships convened in response to the Act.
B&NES SFRA (April 2008) Volume I - Technical Report
5-3
Flood warning and emergency planning
The partnership is formed of the emergency services, health agencies, LPAs, the Environment Agency and other organisations such as the Maritime and Coastguard Agency. Together these groups prepare for incidents, including flooding, in the form of contingency plans. They respond to incidents and then assist in the recovery following the incident.
During flood incidents the Environment Agency issues warnings to those likely to be affected, operates flood defences on certain rivers and advises the emergency services on the expected level of flooding. The Environment Agency and Local Authority also liaise closely during a flood incident.
B&NES have a range of contingency plans which detail how local services will work together to respond to any type of incident or disaster. These plans include but are not limited to a Civil Emergency Manual, Flood Plan, and Emergency Communications plan.
B&NES have a Flooding Emergency Response Guidance document which incorporates the Environment Agency Major Incident Plan. The guidance document covers flooding incidents which necessitate single and multi agency response; the need to re-house or relocate residents and emergency response measures for the community as a result of transport problems, loss of food and loss of utilities.7 The document describes the roles and responsibilities of the emergency services, various departments with B&NES Council, utility companies, Association of British Insurers, and the Environment Agency. The bronze, silver and gold control centre locations and leaders are defined. B&NES have Crisis Management Team which has various responsibilities including liaison with other agencies, provision of support to the community and staff, and media communications.
The guidance refers to the Environment Agency Flood Zone maps for an indication of areas which are more likely to flood. There is an opportunity to feed in more detailed information including timing of flooding and flood depth and velocity data.
7 Bath and North East Somerset, 2005, Flooding Emergency Response Guidance, Operational Issue.
B&NES SFRA (April 2008) Volume I - Technical Report
5-4
Flooding from rivers
6. Flooding from rivers
The B&NES SFRA is a 'live' document. The current version has been developed using the best information and concepts available at the time. As new information and concepts become available the document will be updated and so it is the responsibility of the reader to be satisfied that they are using the most up-to-date information and that the SFRA accounts for this information. All revisions to this summary document are listed in the table.
Version Issue Date Issued by Issued to
Final 23/04//2008 Capita Symonds
Ltd
B&NES, EA
B&NES SFRA (April 2008) Volume I - Technical Report
6-1
Flooding from rivers
Introduction
Flooding from rivers occurs when water levels rise higher than bank levels, causing floodwater to spill across adjacent land (floodplain). The main reasons that water levels can rise in rivers are;
• intense or prolonged rainfall causing runoff rates and flow to increase in rivers, exceeding the capacity of the channel. This can be exacerbated by wet antecedent conditions and where there are significant contributions of groundwater
• constrictions in the river channel causing flood water to backup
• blockage of structures or the river channel causing flood water to backup
• high water levels and/or locked flood (tide) gates preventing discharge at the outlet of the river.
The consequence of river flooding depends on how hazardous the flood waters are and what the receptor of flooding is. The hazard of river flood water is related to the depth and velocity, which depends on the;
• magnitude of flood flows
• size, shape and slope of the river channel
• width and roughness of the floodplain
• types of structures that cross the channel.
Flood hazard can vary greatly throughout catchments and even across floodplain areas. The most hazardous flows generally occur in steep catchments and towards the bottom of large catchments. Hazardous river flows can pose a significant risk to exposed people, property and infrastructure.
Whilst low hazard flows are of less risk to life, they can disrupt communities, require significant post-flood cleanup and can cause superficial and possibly structural damage to property.
Data collection
Historic flooding
Historic incidents of river flooding have been collected from various sources. A preliminary review of the datasets has identified in broad terms the locations and types of previous flooding problems.
Map H in Annex A shows the locations of previous flood events. Of the 229 recorded incidents of flooding in B&NES, 187 (82%) are from this source of flooding. Flood events of varying scale have been recorded in 1809, 1823, 1882, 18948, 1925, 1947, 1960, 1963, 1968, 1972, 1974, 1975, 1979, 1981, 1985, 1989, 1995, 2000, and 2003. Bath, Keynsham and Chew Magna have been affected the most.
The floods in October and November 2000 closed roads and flooded homes, business premises and low lying farmland and disrupted rail services. In 1960 Bath City centre was also severely flooded as the river Avon rose to over 20 feet above its normal level. Flood defences including sluice gates and a weir were completed by Bath City Council in 19749 and probably saved Bath from flooding in 1979, 1982 and 1985.10
The Chew Valley has suffered from severe flooding in the past. Water levels were recorded to reach 2 foot within the parish church at Pensford during flooding on November 12th 1894. In July 1968 the
8 Environment Agency, BANES Sect105 9 River Avon Regeneration Pre-Feasibility Study, B&NES Council, May 2006, Final Report.10 http://www.bathnes.gov.uk/BathNES/advicebenefits/Emergencies/planning.htm
B&NES SFRA (April 2008) Volume I - Technical Report
6-2
Flooding from rivers
streets of Pensford and Keynsham were underwater and the flooding caused a total of seven deaths. The flooding in Pensford is thought to have weakened the structure of the railway viaduct, built in 1873, making it unsafe and unsuitable for use.11 Other events in the Chew catchment occurred in 1960, 1968, 1979, 1981, 1995, 2000 and 2002. Note: During the 1968 event the spillway at Chew Magna Reservoir was damaged, this is discussed in Chapter 11.
The village of Stockwood Vale lies on the Charlton Bottom Watercourse and is located approximately 1km west of Keynsham. The town has flooded on many occasions in the past, the most recent of which occurred on 30 October 2000. Approximately 5 properties through Stockwood Vale experienced flooding during this event.12
Existing studies
The Environment Agency holds a number of hydraulic models and hydrological assessments that were developed for previous river flood studies. The models are summarised in Table 6.1. All the models used in the study were provided by the Environment Agency, and were developed for a range of different studies. The studies vary in scale and scope from catchment-wide CFMPs to more detailed asset improvement studies.
The majority of models used in the SFRA have been used by the Environment Agency for flood mapping. In addition to these models the Environment Agency also commissioned a national scale model in 2004 to produce flood extents for the whole country.
The 2004 study involved national generalised broad scale modelling, using a 2D raster flood spreading model (JFLOW), of all rivers in England and Wales. At the time, these models were based on a SAR DTM which had flood defences and major infrastructure removed.
Flow estimates were derived using an automated system of the Flood Estimation Handbook (FEH) Statistical Method. A flow estimate was defined every 200m along all flow paths with catchment greater than 3km2. Flood outlines for the 1% AEP and 0.1 % AEP floods were generated. These flood outlines form the basis of the Environment Agency Flood Zone maps published on their website.
The Environment Agency Flood Zones are periodically updated as new information becomes available. Version (v3.5) was received in September 2007 from the Environment Agency. It is based on an advanced LiDAR DTM and has been used to determine area at risk of flooding where model results were not available.
The hydrology of the main catchment areas of interest was previously assessed as part of Environment Agency studies listed in Table 6.1. The hydrological assessment undertaken for the studies was based on FEH methods. The normal practice is to validate the flows through comparison with previous more detailed flood studies, historic flooding information and hydrometric data. Given that the majority of studies are detailed mapping projects, no changes were made to the hydrology other than adjustments for climate change scenarios.
11 Environment Agency, River Chew and Tributaries (Somerset), SW053, August 2004, FINAL REPORT, Symonds Group12 Environment Agency Charlton Bottom Watercourse, Pre-Feasibility Studies 2001/2002 Batch, January 2002, Posford Haskoning Ltd
B&NES SFRA (April 2008) Volume I - Technical Report
6-3
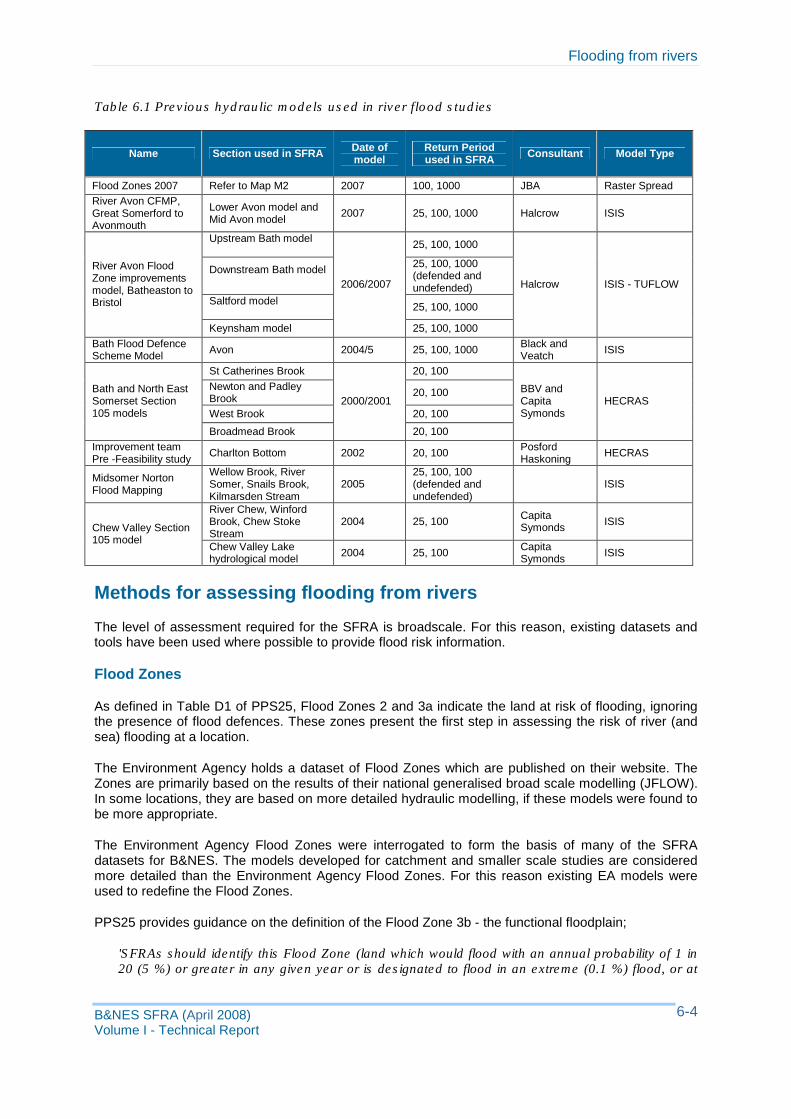
Flooding from rivers
Table 6.1 Previous hydraulic models used in river flood studies
Name Section used in SFRA Date of model
Return Period used in SFRA Consultant Model Type
Flood Zones 2007 Refer to Map M2 2007 100, 1000 JBA Raster Spread River Avon CFMP, Great Somerford to Avonmouth
Lower Avon model and Mid Avon model 2007 25, 100, 1000 Halcrow ISIS
Upstream Bath model 25, 100, 1000
Halcrow ISIS - TUFLOW
River Avon Flood Zone improvements model, Batheaston to Bristol
Downstream Bath model 2006/2007
25, 100, 1000 (defended and undefended)
Saltford model 25, 100, 1000
Keynsham model 25, 100, 1000 Bath Flood Defence Scheme Model Avon 2004/5 25, 100, 1000 Black and
Veatch ISIS
St Catherines Brook 20, 100
BBV and Capita Symonds
HECRAS Bath and North East Somerset Section
Newton and Padley Brook 2000/2001
20, 100
105 models West Brook 20, 100
Broadmead Brook 20, 100 Improvement team Pre -Feasibility study Charlton Bottom 2002 20, 100 Posford
Haskoning HECRAS
Midsomer Norton Flood Mapping
Wellow Brook, River Somer, Snails Brook, Kilmarsden Stream
2005 25, 100, 100 (defended and undefended)
ISIS
Chew Valley Section 105 model
River Chew, Winford Brook, Chew Stoke Stream
2004 25, 100 Capita Symonds ISIS
Chew Valley Lake hydrological model 2004 25, 100 Capita
Symonds ISIS
Methods for assessing flooding from rivers
The level of assessment required for the SFRA is broadscale. For this reason, existing datasets and tools have been used where possible to provide flood risk information.
Flood Zones
As defined in Table D1 of PPS25, Flood Zones 2 and 3a indicate the land at risk of flooding, ignoring the presence of flood defences. These zones present the first step in assessing the risk of river (and sea) flooding at a location.
The Environment Agency holds a dataset of Flood Zones which are published on their website. The Zones are primarily based on the results of their national generalised broad scale modelling (JFLOW). In some locations, they are based on more detailed hydraulic modelling, if these models were found to be more appropriate.
The Environment Agency Flood Zones were interrogated to form the basis of many of the SFRA datasets for B&NES. The models developed for catchment and smaller scale studies are considered more detailed than the Environment Agency Flood Zones. For this reason existing EA models were used to redefine the Flood Zones.
PPS25 provides guidance on the definition of the Flood Zone 3b - the functional floodplain;
'SFRAs should identify this Flood Zone (land which would flood with an annual probability of 1 in 20 (5 %) or greater in any given year or is designated to flood in an extreme (0.1 %) flood, or at
B&NES SFRA (April 2008) Volume I - Technical Report
6-4
Flooding from rivers
another probability to be agreed between the LPA and Environment Agency, including water conveyance routes.'
Flood Zone 3b was defined using the available models, with defences for the 5% AEP flood event. Where detailed models were not available, Environment Agency Flood Zone 3a was used instead, as advised in the PPS25 Practice Companion Guide.
Actual risk
Actual risk shows the land at risk of flooding, when existing flood defences are in place. For the purposes of the SFRA, the flood defences were assumed to operate in perfect condition. The analysis considered flooding from a river event with a 1% AEP. Actual risk was defined using the Environment Agency models where available and substituted with GIS analysis of Environment Agency Flood Zones in other areas.
Residual risk
Residual risks are those which result from a:
• flood of greater magnitude than flood defences were designed; and/or
• breach or failure of flood defence and other assets.
These risks are particularly important because although they are less likely to occur, the consequences of them occurring are greater. Residual risk was defined using models and Environment Agency Flood Zones.
Impact of the revised climate change guidance
The latest government guidance for climate change and flood risk is contained within FCDPAG3 Economic Appraisal: Supplementary Note to Operating Authorities – Climate Change Impacts October 2006. The note was issued in November 2006 and informs appraisers and decision makers of new climate change allowances and broadly how these should be considered when assessing flood risk. Defra expects this note to be applied to all future appraisals, strategies and management plans that have started after October 2006.
The guidance is referred to in PPS25 Annex B where it states that '…the most up to date guidance on climate change…should be considered in the preparation of Regional Flood Risk Assessments, Strategic Flood Risk Assessments…'.
The most important points to consider are;
• Updated figures of regional net sea level risk allowances are contained within Table 1 (of the note)
• New indicative sensitivity ranges covering peak rainfall intensity, peak river flow volume, offshore wind speed and extreme wave heights in Table 2 of the note
• The precautionary approach in assessing sea level rise
• Use of sensitivity analysis to gauge uncertainty of flows, rainfall, wind and wave action on sea levels
• Response to climate change through either managed/adaptive or precautionary approaches. Note: in a SFRA, a precautionary approach is recommended.
A 100 year climate change time horizon has been investigated to provide more detailed information upon which to make land use planning decisions. It will be up to the decision-maker to select the most appropriate time horizon for the specific land use they are investigating.
B&NES SFRA (April 2008) Volume I - Technical Report
6-5
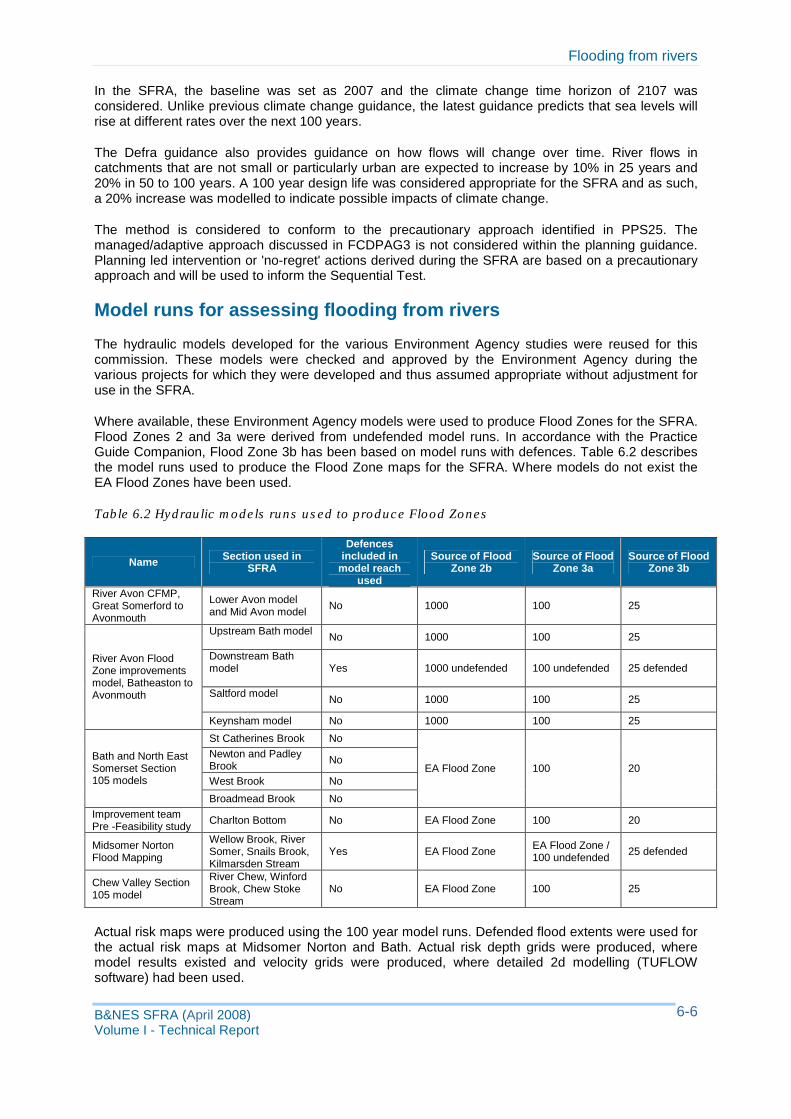
Flooding from rivers
In the SFRA, the baseline was set as 2007 and the climate change time horizon of 2107 was considered. Unlike previous climate change guidance, the latest guidance predicts that sea levels will rise at different rates over the next 100 years.
The Defra guidance also provides guidance on how flows will change over time. River flows in catchments that are not small or particularly urban are expected to increase by 10% in 25 years and 20% in 50 to 100 years. A 100 year design life was considered appropriate for the SFRA and as such, a 20% increase was modelled to indicate possible impacts of climate change.
The method is considered to conform to the precautionary approach identified in PPS25. The managed/adaptive approach discussed in FCDPAG3 is not considered within the planning guidance. Planning led intervention or 'no-regret' actions derived during the SFRA are based on a precautionary approach and will be used to inform the Sequential Test.
Model runs for assessing flooding from rivers
The hydraulic models developed for the various Environment Agency studies were reused for this commission. These models were checked and approved by the Environment Agency during the various projects for which they were developed and thus assumed appropriate without adjustment for use in the SFRA.
Where available, these Environment Agency models were used to produce Flood Zones for the SFRA. Flood Zones 2 and 3a were derived from undefended model runs. In accordance with the Practice Guide Companion, Flood Zone 3b has been based on model runs with defences. Table 6.2 describes the model runs used to produce the Flood Zone maps for the SFRA. Where models do not exist the EA Flood Zones have been used.
Table 6.2 Hydraulic models runs used to produce Flood Zones
Defences
Name Section used in SFRA
included in model reach
Source of Flood Zone 2b
Source of Flood Zone 3a
Source of Flood Zone 3b
used River Avon CFMP, Great Somerford to Avonmouth
Lower Avon model and Mid Avon model No 1000 100 25
Upstream Bath model No 1000 100 25
River Avon Flood Zone improvements model, Batheaston to Avonmouth
Downstream Bath model Yes 1000 undefended 100 undefended 25 defended
Saltford model No 1000 100 25
Keynsham model No 1000 100 25
St Catherines Brook No
EA Flood Zone 100 20 Bath and North East Somerset Section
Newton and Padley Brook No
105 models West Brook No
Broadmead Brook No Improvement team Pre -Feasibility study Charlton Bottom No EA Flood Zone 100 20
Midsomer Norton Flood Mapping
Wellow Brook, River Somer, Snails Brook, Kilmarsden Stream
Yes EA Flood Zone EA Flood Zone / 100 undefended 25 defended
Chew Valley Section 105 model
River Chew, Winford Brook, Chew Stoke Stream
No EA Flood Zone 100 25
Actual risk maps were produced using the 100 year model runs. Defended flood extents were used for the actual risk maps at Midsomer Norton and Bath. Actual risk depth grids were produced, where model results existed and velocity grids software) had been used.
were produced, where detailed 2d modelling (TUFLOW
B&NES SFRA (April 2008) Volume I - Technical Report
6-6
Flooding from rivers
The River Somer Flood Alleviation Tunnel was included in the Midsomer Norton model, and through Bath the 2d_zln_defences and 2d_zln_wall layers supplied by the Environment Agency (Halcrow model) were used to raise bank levels and walls within the Flood Zone Improvement Model.
Residual risk from overtopping of defences is normally run for an extreme event such as the 0.1% AEP event. The only model where existing information was available to do this was in Bath. However the 1% (100 year) undefended and defended model extents were very similar, suggesting that the SOP through Bath is lower than reported in NFCDD. As such, it was anticipated that the 0.1% defended and undefended extents would be very similar and therefore the residual risk would be the same as the actual risk for an event with a 0.1% AEP. As the existing flood defences should not alter the 0.1% AEP flood outlines, the residual risk (0.1% AEP flood with defences) has not been separately mapped. The user should refer to Flood Zone 2 for this outline.
Climate change scenarios were run by increasing the 1% AEP inflows by 20%. Where applicable the climate change scenario was run with the existing defences in their current condition. The tidal limit of the River Avon is considered under normal conditions to be at Netham Weir in Bristol. However during high spring tides the limit extends to Keynsham Weir, which is within the B&NES study area. As well as increasing flows, the climate change predictions13 for sea level rise were used to increase the downstream boundary.
The flood extents for the 4% and 1% AEP flood events were available for St Catherines Brook and the Newton and Padley Brook, however the models used to generate the outlines were not. As a result, additional model runs, depth data, and climate change scenarios could not be achieved within the SFRA.
Processing of results
Water level results from the Environment Agency models were processed to form flood outlines, velocity and depth grids. The range of outputs available varies depending on the type of modelling software used. Flood extents and depth grids have been produced where 1d models have been used and flood extents, depth and velocity grids where 2D modelling software was used.
The following steps were undertaken to process the 1D results;
• Maximum water levels were extracted from the model at cross section locations
• A water level surface was created from the extracted water levels using GIS software. An inverse distance weighting algorithm (IDW) was used to interpolate between the water levels at each geo-referenced cross section
• The water level surface was intersected with the digital terrain model of the area (e.g. LiDAR). This process involves the subtraction of the water level surface from the topographic data to give a water depth grid
• Where the water depths were positive, a flood extent was created. The flood extent was edited to remove any areas disconnected from the water course and other processing anomalies.
13 DEFRA FCDPAG3 Economic Appraisal Supplementary Note to Operating Authorities – Climate change Impacts, October 2006.
B&NES SFRA (April 2008) Volume I - Technical Report
6-7
Flooding from rivers
The following steps were undertaken to process the 2D results;
• Maximum water levels were extracted as .MIF points from the relevant _h.DAT TUFLOW results files.
• .MIF points were converted to a water surface using an inverse distance weighting procedure in the GIS software package MapInfo.
• The topographic data of the area (e.g. LiDAR) was subtracted from the water level surface and a flood extent produced.
• The flood outlines were cleaned by removing all dry islands less than 200m2 in size.
• The .ASC depth and velocity results were imported into MapInfo/Vertical Mapper to analyse and produce the respective grids.
Where flood extents were provided by the Environment Agency with the various models these were used in preference to reprocessing the model results.
Results
Flood Zones (Map F)
The Flood Zones derived for B&NES are shown in Map F1 in Annex A. The Flood Zones have been developed from a number of different datasets. Where available, modelled flood extents were used to produce Flood Zones 2, 3a and 3b. Where these were not available, the existing Environment Agency Flood Zones were used.
Most of B&NES lies within Flood Zone 1, however all of the rivers have an area of floodplain along their length, showing Flood Zones 2, 3a and 3b from river flooding. The floodplains of the rivers in B&NES are generally well defined by the local topography and therefore the flood outlines for different events do not change significantly.
The area of floodplain is larger where river flows are large and where the ground adjacent to the river is flat, allowing flood flows to spread out. This is seen along the River Avon between Bath and Keynsham. The largest areas of Flood Zones 2 and 3a are therefore in this area.
Flood Zone 3b (the functional floodplain) comprises land where water has to flow or be stored in times of flood. The SFRA identifies this as a Flood Zone with an annual probability of 5% or greater. The impact of flood defences is included in the assessment. The 'functional floodplain' mainly encompasses rural land, although the recreation ground and sport centre area in Bath is included in this category. It should be noted that in some areas the 4% AEP (25 year) flood event was used instead of the 5% AEP event due to the availability of model results.
Due to the availability of model results the 4% AEP event was used through Bath and is particularly relevant because the outline provided by the Environment Agency appears to have been manually edited to account for defences and engineering judgement. There are some areas where the flood level is very close to ground level (based on LiDAR) and without more detailed survey it is difficult to determine the extent of flooding. In these areas the flood extent produced during SFRA model runs is larger than that supplied by the Environment Agency. The areas where the Environment Agency flood extent was smaller included a section on both banks approximately 250 m downstream of Windsor Bridge Road (A3604), an area near Victoria Bridge, an area between Midland Bridge Road and Green Park Road, the area around North Parade Road and upstream toward Argyle Street, and also between the river and St John’s Road. As the functional floodplain is defined by the 5% AEP, rather than the 4% AEP event it was decided to use the EA flood extent to represent the functional floodplain through Bath.
B&NES SFRA (April 2008) Volume I - Technical Report
6-8
Flooding from rivers
Actual flooding (Maps A1 to A3)
Actual flooding shows the land at risk of flooding, with flood defences in place. The flood defences are assumed to operate in perfect condition and to their specified design standard. The analysis considers flooding from a river event with a 1% AEP.
Figure A1 shows the flood extent of a 1% AEP flood with flood defences in place. The actual risk outlines are the same as Flood Zones where there are no defences, however differences are observed in Midsomer Norton and Bath where defences are in place.
As the SFRA only considers the two relatively short sections of raised defence to actually be defences through Bath, the difference between defended and undefended flood extents is unsurprisingly very small. And in one area the defended flood extent appears to be larger than the undefended. The flood extent shown in both the defended and undefended runs suggests that the standard of protection provided by the scheme completed in 1974 is less than a 1% AEP event and certainly less than the 0.7% AEP (150 year return period) suggested by the Environment Agency's defence dataset (NFCDD).
The flood alleviation tunnel through Midsomer Norton provides benefit to the town, with a significant reduction in flooding due to the scheme.
Map A2 in Annex A shows the flood depth where model results are available. The deepest flood water is shown in the floodplain of the Lower Avon upstream and downstream of Bath, and along the eastern floodplain of the Lower Avon through Bath itself.
Map A3 in Annex A shows the flood velocity along the Lower Avon, which was the only location where suitable model results (2D modelling) were available. Velocities in the floodplain were generally low, with the exception of a couple of roads which act as a flow routes in central Bath.
Climate change (Map C)
Map C in Annex A shows the predicted flood outlines for the 1% AEP, 100 year time horizon climate change scenario. Flood extents are expected to increase throughout B&NES, although due to the defined nature of the valleys, flood depths are expected to increase more than flood extents.
Little increase in flooding is expected in Midsomer Norton due to the existing flood alleviation scheme.
As the flood defences in Bath were shown to overtop in the existing 1% AEP flood outline, they are not expected to provide protection during a future 1% AEP. Flooding in Bath was shown to increase through the centre of the city.
Uncertainty in flood risk assessment
Due to the extensive coverage of models across B&NES, estimation of risk of flooding from rivers is considered robust for the level of assessment required in the SFRA. The greatest uncertainties in the hydraulic modelling occur as a result of;
• Models not having been fully calibrated or verified (they were only sensibility checked by the Environment Agency)
• Joint probability of storm surges with high river flows has not been assessed
• The models assume that flood defences do not fail and the conditions of the defences do not change (i.e. the crest levels remain constant).
• Small structures, small flood defences and detailed topographic details in urban areas have not been included in the broader scale models. Thus flood outlines are less certain near these features.
B&NES SFRA (April 2008) Volume I - Technical Report
6-9
Flooding from rivers
There are inherent uncertainties with any GIS interpolation of data points. There are several options for interpolation, however the IDW method was favoured for the flood extent production because;
• It is suitable for broad scale assessments
• The IDW method is a fairly standardised algorithm, but can be customised by the user, and the resulting files are straightforward to work with.
Managing flooding from rivers
Flooding from rivers can be managed in a number of ways, including;
• Avoidance - developing outside of the floodplain
• Prevention - walls and embankments used to exclude water from a site, improved channel conveyance, pumping or flood storage areas used to attenuate/retain peak flows upstream
• Management - flood resilient design, flood warning, evacuation and emergency planning, and flood awareness.
CFMPs provide a large-scale assessment of the risks associated with river flooding. They present a policy framework to address the risks to people and the developed, historic and natural environment in a sustainable manner. In doing so, a CFMP is a high-level document that forms an important part of the Department for Environment, Food and Rural Affairs strategy for flood and coastal defence.
CFMPs provide the management plan for the next 100 years and the policies required for it to be implemented. This is intended for general readership and is the main tool for communicating intentions. Whilst the justification for decisions is presented, it does not provide all of the information behind the recommendations, this being contained in the supporting documents. The policies adopted in B&NES are discussed in Chapter 3.
The Environment Agency is currently reviewing its assets and developing System Asset Management Plans (SAMPs). These will identify and provide information on existing assets, and help to decide where investment is most needed.
Strategic options for managing flood risk in B&NES is discussed in Chapter 2 of this report.
The most suitable type of flood management at a site depends on site specific conditions, the receptor of flooding and the type of flooding.
Planning considerations
PPS25 requires that decision makers use the SFRA to inform their knowledge of flooding, refine the information on the Flood Map and determine the variations in flood risk from all sources of flooding across and from their area. These should form the basis for preparing appropriate policies for flood risk management in these areas.
Flooding from rivers is one of the most destructive forms of flooding in England and Wales and as a consequence areas liable to flood are usually better defined than other sources. A large amount of information on river flooding can be obtained from local authority or Environment Agency staff, and/or National datasets, such as the Environment Agency Flood Zones. Any potential land use planning decisions should be made after consulting these sources.
PPS25 requires a precautionary approach to be undertaken when making land use planning decisions regarding flood risk. This is partly due to the considerable uncertainty surrounding flooding mechanisms and how flooding may respond to climate change. It is also due to the potentially devastating consequences of flooding to the people and property affected.
The information presented in this SFRA should be used to inform more detailed flood risk assessments for all new developments within Flood Zone 2 and 3.
B&NES SFRA (April 2008) Volume I - Technical Report
6-10
Flooding from the sea
7. Flooding from the sea
The B&NES SFRA is a 'live' document. The current version has been developed using the best information and concepts available at the time. As new information and concepts become available the document will be updated and so it is the responsibility of the reader to be satisfied that they are using the most up-to-date information and that the SFRA accounts for this information. All revisions to this summary document are listed in the table.
Version Issue Date Issued by Issued to
Final 23/04//2008 Capita Symonds
Ltd
B&NES, EA
B&NES SFRA (April 2008) Volume I - Technical Report
7-1
Flooding from the sea
Introduction
Flooding from the sea occurs when water levels in the sea rise above ground levels of coastal land. This can occur during normal high tides, when there are extreme atmospheric effects, and when wind action causes water levels of the sea to rise.
Although B&NES is not a coastal area, the tidal limit of the River Avon is reported to extend as far as Keynsham Weir, which is within B&NES, during high spring tides. As such, tidal flooding needs to be considered both now and in the future given the predicted increase in sea level.
Tidal flooding can be severe however due to the large distance between Keynsham and Avonmouth, the effects of an extreme tidal event are reduced. It is conceivable that the impact of an extreme tide event would be the same as a significantly smaller river flood.
The greatest concern is the combination of a tidal event and an extreme fluvial event. Tide locking reduces the ability of the river to discharge water and as such increase flood levels. The probability of both an extreme tidal event and an extreme fluvial event occurring together is significantly less than them occurring independently. Joint probability analysis is a complex procedure and is outside the scope of this study.
Data collection
Historic flood events
The Environment Agency is the main body which collects records of flooding from the sea. A review of their flood incident dataset (FRIS) was undertaken during the SFRA. No incidents of flooding were wholly attributed to flooding from the sea (tidal). However it may be possible that tidal effects have contributed to the recorded river flood events along the lower reaches of the River Avon.
Existing studies
In 2004, the Environment Agency commissioned national generalised broad scale modelling, using Hydrof to determine areas at risk of flooding from the sea (coastal). The resultant flood outline shows the area at risk of flooding from the sea, and as expected, B&NES is not within this area.
A number of existing studies have looked at extreme sea levels at the outlet of the River Avon. The south west region of the Environment Agency provided extreme tide levels for Avonmouth, based on a 2003 study14. The levels were 9.09mAOD for a 0.5% AEP storm surge and 9.37mAOD for a 0.1% AEP storm surge.
Both the Avonmouth Strategic Flood Risk Assessment (SFRA) and Bristol Avon Catchment Flood Management Plan (CFMP) included some analysis of flooding along the tidal reaches of the Lower Avon. Analysis in the CFMP was undertaken using a broadscale hydraulic model extending from Great Somerford to Avonmouth. This was provided by the Environment Agency for use in the SFRA.
Assessing flood risk from the sea
The level of assessment required for the SFRA is broadscale. For this reason, existing datasets and tools have been used where possible to provide flood risk information.
14 Posford Haskoning (2003) South West Regional Report on Extreme Tide Levels, Prepared for the Environment Agency, February 2003
B&NES SFRA (April 2008) Volume I - Technical Report
7-2
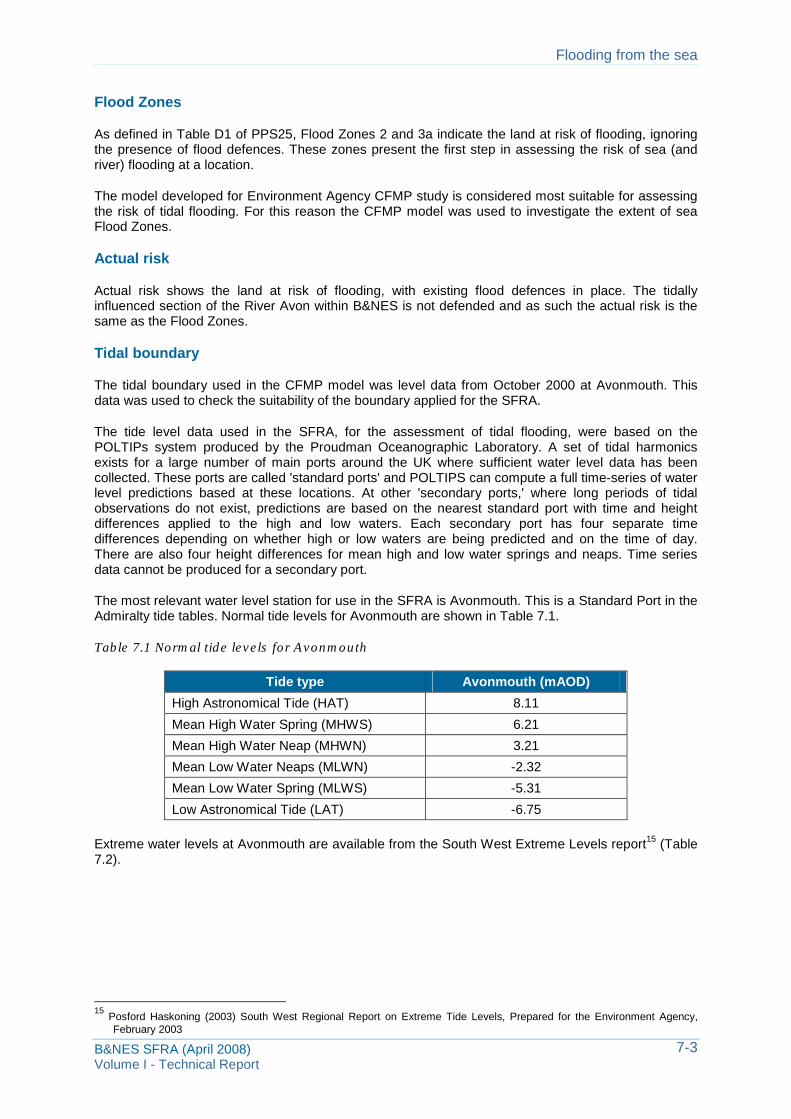
Flooding from the sea
Flood Zones
As defined in Table D1 of PPS25, Flood Zones 2 and 3a indicate the land at risk of flooding, ignoring the presence of flood defences. These zones present the first step in assessing the risk of sea (and river) flooding at a location.
The model developed for Environment Agency CFMP study is considered most suitable for assessing the risk of tidal flooding. For this reason the CFMP model was used to investigate the extent of sea Flood Zones.
Actual risk
Actual risk shows the land at risk of flooding, with existing flood defences in place. The tidally influenced section of the River Avon within B&NES is not defended and as such the actual risk is the same as the Flood Zones.
Tidal boundary
The tidal boundary used in the CFMP model was level data from October 2000 at Avonmouth. This data was used to check the suitability of the boundary applied for the SFRA.
The tide level data used in the SFRA, for the assessment of tidal flooding, were based on the POLTIPs system produced by the Proudman Oceanographic Laboratory. A set of tidal harmonics exists for a large number of main ports around the UK where sufficient water level data has been collected. These ports are called 'standard ports' and POLTIPS can compute a full time-series of water level predictions based at these locations. At other 'secondary ports,' where long periods of tidal observations do not exist, predictions are based on the nearest standard port with time and height differences applied to the high and low waters. Each secondary port has four separate time differences depending on whether high or low waters are being predicted and on the time of day. There are also four height differences for mean high and low water springs and neaps. Time series data cannot be produced for a secondary port.
The most relevant water level station for use in the SFRA is Avonmouth. This is a Standard Port in the Admiralty tide tables. Normal tide levels for Avonmouth are shown in Table 7.1.
Table 7.1 Normal tide levels for Avonmouth
Tide type Avonmouth (mAOD)
High Astronomical Tide (HAT) 8.11
Mean High Water Spring (MHWS) 6.21
Mean High Water Neap (MHWN) 3.21
Mean Low Water Neaps (MLWN) -2.32
Mean Low Water Spring (MLWS) -5.31
Low Astronomical Tide (LAT) -6.75
Extreme water levels at Avonmouth are available from the South West Extreme Levels report15 (Table 7.2).
15 Posford Haskoning (2003) South West Regional Report on Extreme Tide Levels, Prepared for the Environment Agency, February 2003
B&NES SFRA (April 2008) Volume I - Technical Report
7-3
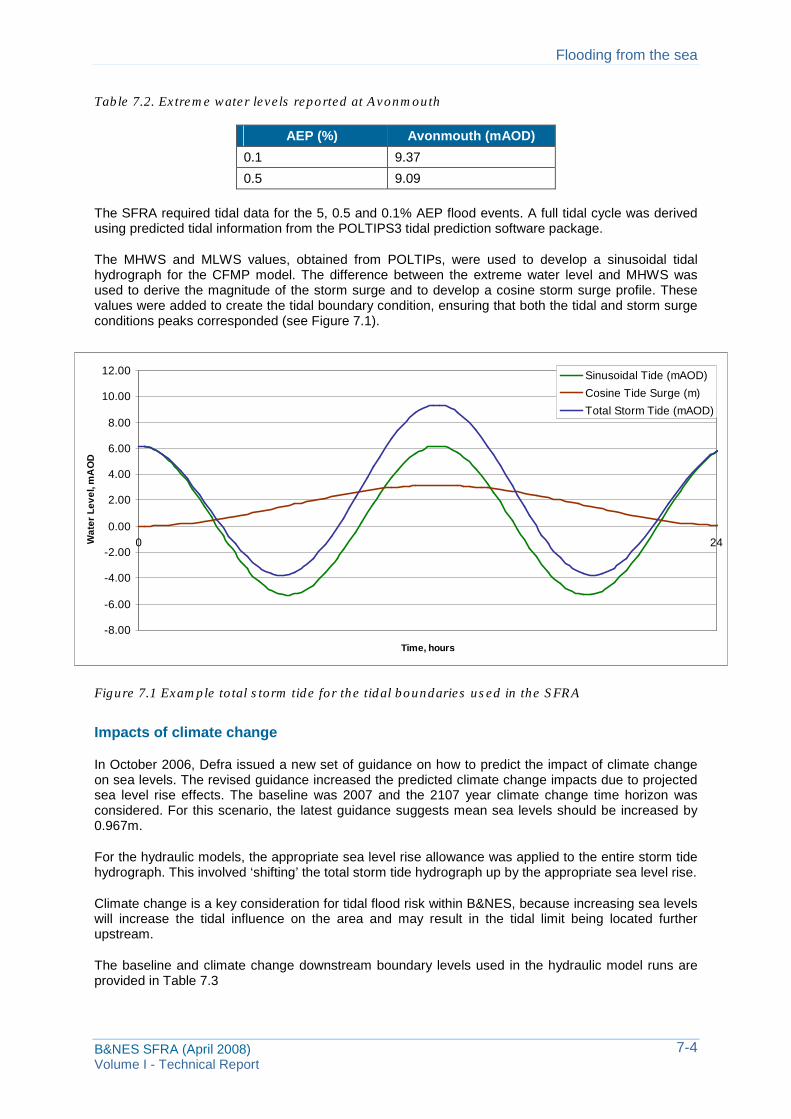
Flooding from the sea
Table 7.2. Extreme water levels reported at Avonmouth
AEP (%) Avonmouth (mAOD)
0.1 9.37
0.5 9.09
The SFRA required tidal data for the 5, 0.5 and 0.1% AEP flood events. A full tidal cycle was derived using predicted tidal information from the POLTIPS3 tidal prediction software package.
The MHWS and MLWS values, obtained from POLTIPs, were used to develop a sinusoidal tidal hydrograph for the CFMP model. The difference between the extreme water level and MHWS was used to derive the magnitude of the storm surge and to develop a cosine storm surge profile. These values were added to create the tidal boundary condition, ensuring that both the tidal and storm surge conditions peaks corresponded (see Figure 7.1).
Wat
er L
evel
, mA
OD
12.00
10.00
8.00
6.00
4.00
2.00
0.00
-2.00
-4.00
-6.00
-8.00
Sinusoidal Tide (mAOD)
Cosine Tide Surge (m)
Total Storm Tide (mAOD)
0 24
Time, hours
Figure 7.1 Example total storm tide for the tidal boundaries used in the SFRA
Impacts of climate change
In October 2006, Defra issued a new set of guidance on how to predict the impact of climate change on sea levels. The revised guidance increased the predicted climate change impacts due to projected sea level rise effects. The baseline was 2007 and the 2107 year climate change time horizon was considered. For this scenario, the latest guidance suggests mean sea levels should be increased by 0.967m.
For the hydraulic models, the appropriate sea level rise allowance was applied to the entire storm tide hydrograph. This involved ‘shifting’ the total storm tide hydrograph up by the appropriate sea level rise.
Climate change is a key consideration for tidal flood risk within B&NES, because increasing sea levels will increase the tidal influence on the area and may result in the tidal limit being located further upstream.
The baseline and climate change downstream boundary levels used in the hydraulic model runs are provided in Table 7.3
7-4 B&NES SFRA (April 2008) Volume I - Technical Report
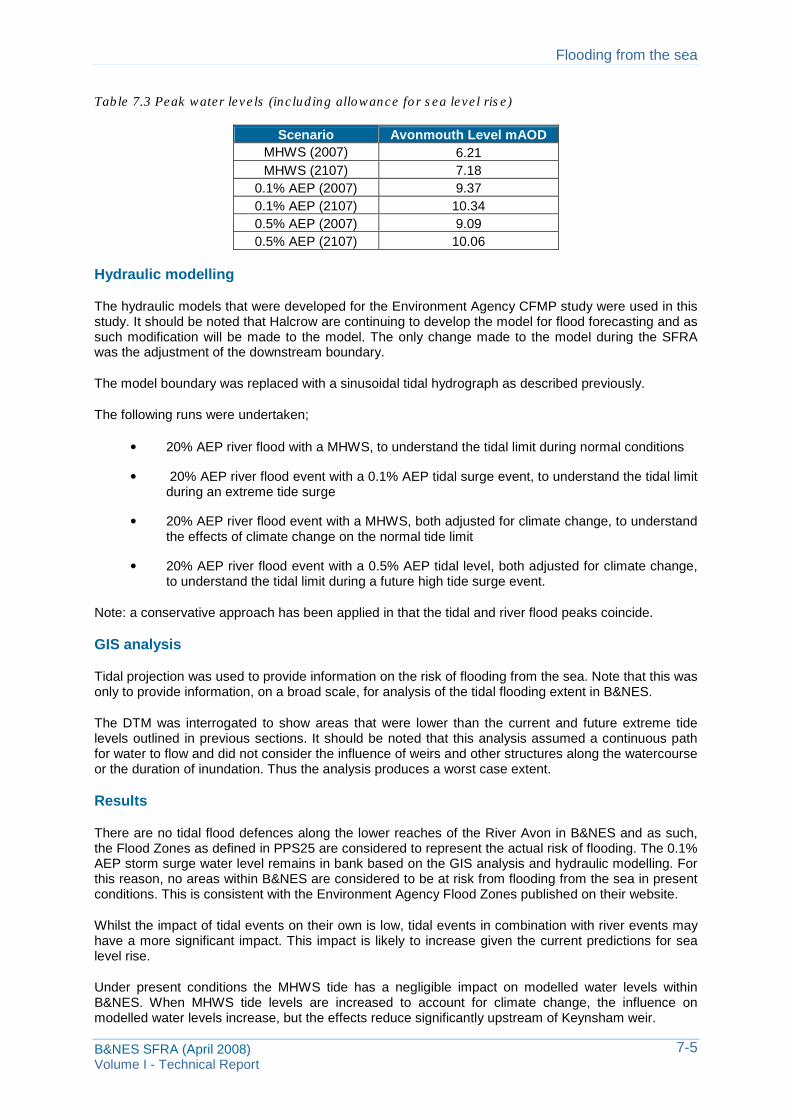
Flooding from the sea
Table 7.3 Peak water levels (including allowance for sea level rise)
Scenario Avonmouth Level mAOD MHWS (2007) 6.21 MHWS (2107) 7.18
0.1% AEP (2007) 9.37 0.1% AEP (2107) 10.34 0.5% AEP (2007) 9.09 0.5% AEP (2107) 10.06
Hydraulic modelling
The hydraulic models that were developed for the Environment Agency CFMP study were used in this study. It should be noted that Halcrow are continuing to develop the model for flood forecasting and as such modification will be made to the model. The only change made to the model during the SFRA was the adjustment of the downstream boundary.
The model boundary was replaced with a sinusoidal tidal hydrograph as described previously.
The following runs were undertaken;
• 20% AEP river flood with a MHWS, to understand the tidal limit during normal conditions
• 20% AEP river flood event with a 0.1% AEP tidal surge event, to understand the tidal limit during an extreme tide surge
• 20% AEP river flood event with a MHWS, both adjusted for climate change, to understand the effects of climate change on the normal tide limit
• 20% AEP river flood event with a 0.5% AEP tidal level, both adjusted for climate change, to understand the tidal limit during a future high tide surge event.
Note: a conservative approach has been applied in that the tidal and river flood peaks coincide.
GIS analysis
Tidal projection was used to provide information on the risk of flooding from the sea. Note that this was only to provide information, on a broad scale, for analysis of the tidal flooding extent in B&NES.
The DTM was interrogated to show areas that were lower than the current and future extreme tide levels outlined in previous sections. It should be noted that this analysis assumed a continuous path for water to flow and did not consider the influence of weirs and other structures along the watercourse or the duration of inundation. Thus the analysis produces a worst case extent.
Results
There are no tidal flood defences along the lower reaches of the River Avon in B&NES and as such, the Flood Zones as defined in PPS25 are considered to represent the actual risk of flooding. The 0.1% AEP storm surge water level remains in bank based on the GIS analysis and hydraulic modelling. For this reason, no areas within B&NES are considered to be at risk from flooding from the sea in present conditions. This is consistent with the Environment Agency Flood Zones published on their website.
Whilst the impact of tidal events on their own is low, tidal events in combination with river events may have a more significant impact. This impact is likely to increase given the current predictions for sea level rise.
Under present conditions the MHWS tide has a negligible impact on modelled water levels within B&NES. When MHWS tide levels are increased to account for climate change, the influence on modelled water levels increase, but the effects reduce significantly upstream of Keynsham weir.
B&NES SFRA (April 2008) Volume I - Technical Report
7-5
Flooding from the sea
The baseline 0.5 and 0.1% AEP extreme tide events increased peak levels by approximately 0.3m and 0.45m during a 20% AEP river flood event downstream of Keynsham weir. However, water levels are only increased by 0.1m upstream of the weir.
With climate change adjustments, the modelled water levels increased by 0.9m downstream of Keynsham weir compared to the baseline MHWS scenario. However, water levels only increased by 0.4m upstream of the weir. Furthermore, only 0.12m was attributed to the tide with the remainder attributed to the climate change increase in flows.
As such, sea level rise is expected to have a relatively small effect on water levels in B&NES during MHWS tides and a moderate impact on water levels during extreme events. The water levels are not expected to be greater than those experienced during a relatively small flood event (20% AEP).
The rising ground levels and weirs along the Lower Avon are likely to mitigate the impact of climate change and prevent flooding from sea in B&NES in the future.
Uncertainty
A number of methods have been used to determine the risk of flooding from sea in B&NES. The certainty in each method varies significantly and is related to the base datasets, assumptions and simplifications used. The following should be considered when using the tidal model results:
• The tidal boundary was based on a design sinusoidal tide. It was assumed that the peak of the mean spring tide and the storm surge occurred at the same time. Further analysis of tidal cycles and storm surges is required in more detailed assessments.
• The extreme water levels were taken from a previous study and there are uncertainties in the calculations that were used to derive these results.
The GIS analysis was simplistic in that it did not include any actual hydraulic processes and there was no duration of the flood event. Thus the outlines, in line with the precautionary principal, depict the maximum that the flood extent could be.
The results of the analyses undertaken in the SFRA were consistent with other studies, historic evidence and expert knowledge. They are considered robust for use in land use planning decisions.
Managing flooding from the sea
Flooding from the sea is not expected to present a risk to B&NES now or in the future. Flooding from rivers is the dominant source in the Lower Avon. As such, any flood defence measures will be designed for this source of flooding.
Climate change may increase the tidal limit of the Lower Avon to within the B&NES study area. As such, the design and management of river flooding in the lower reaches of B&NES should include a joint probability assessment of tidal and river flooding.
Planning considerations
PPS25 requires decision makers to consider flooding from sea when making land use planning decisions. Although the risk from tidal flooding is low within B&NES, it should still be considered, particularly with respect to the design life of developments.
The impact of climate change on flooding from the sea is particularly important. The latest government guidance indicates exponential growth rates in sea level rise. This will have enormous implications on this type of flood risk in the future. It is important that the land use planning process is used to guide development away from these areas so that there may be less reliance on defences in the future.
For B&NES, the main consideration is that increased sea level will increase the influence of tidal events, which if occurring at the same time as river flood events, can worsen the situation.
B&NES SFRA (April 2008) Volume I - Technical Report
7-6
Flooding from land (surface water)
8. Flooding from land (surface water)
The B&NES SFRA is a 'live' document. The current version has been developed using the best information and concepts available at the time. As new information and concepts become available the document will be updated and so it is the responsibility of the reader to be satisfied that they are using the most up-to-date information and that the SFRA accounts for this information. All revisions to this summary document are listed in the table.
Version Issue Date Issued by Issued to
Final 23/04//2008 Capita Symonds
Ltd
B&NES, EA
B&NES SFRA (April 2008) Volume I - Technical Report
8-1
Flooding from land (surface water)
Introduction
Description
Flooding from land, also known as surface water flooding, occurs when intense, often short duration rainfall is unable to soak into the ground or enter drainage systems. It is made worse when soils are saturated so that they cannot accept any more water. The excess water then ponds in low points, overflows or concentrates in minor drainage lines that are usually dry. This type of flooding is usually short lived and associated with heavy downpours of rain. Often there is limited warning before this type of localised flooding occurs.
Drainage basins or catchments vary in size and shape, which has a direct effect on the amount of surface runoff. The amount of runoff is also a function of geology, slope, climate, rainfall, saturation, soil type and vegetation. Geological considerations include rock and soil types and characteristics, as well as degree of weathering. Porous material (sand, gravel, and soluble rock) absorbs water more readily than fine-grained, dense clay or unfractured rock and has a lower runoff potential. Poorly drained material has a higher runoff potential and is more likely to cause flooding.
Distinguishing between flooding from land and flooding from groundwater can be complicated. For the purpose of the SFRA, groundwater is defined as any water that soaks into the ground and re-emerges at a different location. Thus sub-surface flow and springs are considered in Chapter 9 (flooding from groundwater).
Urban areas usually have extensive drainage or sewer systems. For the purpose of the SFRA, surface water flooding in urban areas is covered in greater detail in Chapter 10 (flooding from sewers).
Causes and classifications
Water flowing over the ground surface that has not entered a natural channel or artificial drainage system is classified as surface water runoff or overland flow.
Flooding from land can occur in rural and urban areas, but usually causes more damage in the latter. Urban areas can be inundated by flow from adjacent farmlands. Flood pathways include the land and water features over which floodwater flows. These pathways include minor drainage lines, roads and even flood management infrastructure.
Developments that include significant impermeable surfaces, such as roads and car parks may increase the occurrence of surface water runoff.
Flooding can also occur when structures used to manage flooding fail. For example, flooding would be worse if a culvert were to collapse or block. Note: these are culverts to manage surface water runoff, not in urban drainage systems or rivers.
Impacts of surface water flooding
Surface water flooding can affect all forms of the built environment, including property, infrastructure, agriculture and the natural environment. It is usually short-lived and will tend to last as long as the rainfall event. However flooding may persist in low-lying areas where ponding occurs. Due to this shorter duration, flooding from land tends not to have as serious consequences as other forms of flooding, such as flooding from rivers or the sea.
Flooding may occur as sheet flow or as rills and gullies causing increased erosion of agricultural land. This can result in ‘muddy floods’ where soil and other material are washed onto roads and properties, requiring extensive clean-up. Both rural and urban land use changes are likely to alter the amount of surface water in the future. Future development is also likely to change the position and numbers of people and/or developments exposed to flooding.
B&NES SFRA (April 2008) Volume I - Technical Report
8-2
Flooding from land (surface water)
Data collection
Historic flood incidents
Information held by the Environment Agency and local authorities about this type of flooding is limited and due to its nature it is difficult to accurately define all the areas at risk from this source of flooding.
All historic incidents of flooding recorded by the Environment Agency are included in their FRIS dataset. This dataset was used as the primary source of verification information in the assessment of flooding from land. No additional information was available, although it is likely that other stakeholders such as the highways authorities, fire brigade and the parish would hold records (in various formats and levels of detail).
The source of flooding was examined in the FRIS dataset to extract only those incidents related to surface water. In doing so, some of the FRIS incidents with a source labelled as 'unknown' have been reassigned a source of 'surface water'. These have been plotted on Map L in Annex A.
Flooding from land is the second largest source of flooding in B&NES, with 42 (18%) of the 229 historic incidents attributed to this source. Most incidents of flooding from land have occurred in the impermeable upland areas of B&NES, and in particular along roads. The main communities affected are Chew Magna, West Harptree, Compton Martin and Priston.
The Environment Agency have also highlighted that two incidents of surface water flooding have occurred in Midsomer Norton High Street which caused property flooding.
It is possible that other incidents of this type of flooding have occurred but were not recorded if the receptor of flooding was agricultural land.
Existing studies
No assessments of flooding from overland flow or surface water runoff appropriate to the scale of the SFRA were identified during consultation with the EA, Wessex Water and British Waterways.
Currently no single government body is responsible for monitoring or responding to surface water flooding. Defra’s Making Space for Water Strategy (MSW) aims to provide greater clarity for the public and professional bodies impacted by and involved in the management of flooding. MSW recognises the need for an integrated understanding of flooding from all sources including surface water.
As a consequence, Defra have instigated a series of investigations into flooding from other sources (Defra 2006). The research project aims to:
…'assess the feasibility of mapping flood risk from different types of flooding (including overland flow), together with the practicalities of implementing flood modelling methods considered for the significant types of flooding’.
The research project identified that the greatest barrier to producing accurate flood risk maps for other sources of flooding was;
• The availability of data for ground-truthing in consistent and useable formats.
• The modelling methods required to capture all the observed processes were complex and may not be realistic in the immediate future. Furthermore whilst there was a general understanding of the causes of flooding from land, the location, timing and extent was difficult to predict because of the poorly understood processes, localised nature of drivers of flooding and lack of available datasets.
This research has been considered when assessing flood risk.
B&NES SFRA (April 2008) Volume I - Technical Report
8-3
Flooding from land (surface water)
Assessment of flood risk
Method
The existing Environment Agency Flood Zones only indicate areas liable to flood from rivers and the sea. Other data must therefore be used to determine the areas susceptible to flooding from other sources, such as flooding from land.
The methodology used in the SFRA to assess flooding from land is built on the premise that this type of flooding is directly related to the physical, hydrological and environmental characteristics of a particular location.
An analysis of relevant catchment datasets within a Geographical Information System (GIS) platform was undertaken. The analysis identified areas that had not necessarily flooded in the past, but had a greater likelihood of experiencing flooding from surface water runoff or overland flow.
The first stage of the spatial analysis was to identify drivers of flooding from land. Each driver was then assigned a weighting value based on the relative importance of its contribution to surface water flooding. Drivers and weighting values for surface water flooding were:
• Geology (weighting value of 6)
• Land cover classification (weighting value of 4)
• Soil (weighting value of 5)
• DTM (weighting value of 3)
• Annual average rainfall (weighting value of 3)
Each driver dataset was divided into three categories (high, medium and low), based on likelihood for flooding. For example, an area of impermeable geology was assigned a value of 3 to reflect its higher contribution to runoff, whereas a layer of permeable geology was assigned a value of 1.
The datasets were then interrogated using a 25m grid cell and the rankings equated to determine an overall value for each cell. The cells were contoured to produce a layer showing areas with a high, medium or low likelihood of flooding from land. The results of the analyses were sensibility checked with known incidents of surface water flooding within the area.
Results
Map L in Annex A shows the results of the analysis of surface water flooding across B&NES. This shows that most of B&NES has a medium risk of flooding from land. Areas with a higher likelihood are the flat uplands in the west, and the urban areas of Midsomer Norton, Keynesham and parts of Bath.
Areas with the lowest likelihood of flooding are the steep areas in the middle of B&NES. However the drainage lines within these slopes have a higher likelihood.
These results are broadly consistent with the recorded incidents of flooding in B&NES. However it is important to recognise that surface water flooding is very site specific and can occur at any location.
Climate change
There is no research covering the study area which specifically considers the impact of climate change on surface water flooding. Future climate change projections indicate that more frequent short-duration, high intensity rainfall and more frequent periods of long duration rainfall are to be expected. These kinds of changes will have significant implications for flooding from land.
B&NES SFRA (April 2008) Volume I - Technical Report
8-4
Flooding from land (surface water)
Indirect impacts of climate change on land use and land management may also change future flood risk.
In the absence of certainty, Planning Policy Statement 25: Development and Flood Risk, (PPS25) advocates a precautionary approach. Sensitivity ranges are suggested for peak rainfall intensities over various time horizons. As our understanding of the impacts of climate change improves, these guidelines are likely to be revised. It is imperative that the site specific flood risk assessments consider the impact of climate change on flooding from land.
Uncertainty
The causes of surface water flooding are generally well understood. However it is difficult to predict the actual location, timing and extent of flooding, which are dependent upon the characteristics of the site specific land use, local variations in topography, geology, soils and the hydrological conditions. Furthermore, limited and variable measured datasets make it more difficult to determine an exact annual exceedance probability.
The analyses in the SFRA have attempted to determine areas more likely to be affected by this source of flooding. However these analyses have been undertaken on a broad scale and should be used as a guide only. A detailed assessment of flooding from surface water should be undertaken for all proposed development sites, which assesses the potential impacts of climate change.
Managing flooding from land
At present there is no government body with a clear responsibility for managing this type of flooding. As of spring 2006 the Environment Agency assumed a strategic overview role for monitoring flooding from land but the extent and the legislative details remain to be clarified.
The Environment Agency and Meteorological Office provide a limited warning service for flooding from land in some areas, and includes records of known surface water flooding in its FRIS dataset. Flood warning is complicated for this source due to the highly varied and localised nature, and generally short lead in times.
Surface water flooding is often highly localised and complex. Management is therefore strongly dependent upon the characteristics of the site. The implications of surface water flooding should be considered and managed through development control and building design.
Possible management and responses to flooding include:
• Sensitive land use management based on policies at a strategic level.
• Major ground works (such as new or improved drainage systems, including drains, dams and embankments).
• Appropriate site selection for developments.
• Development zoning including the use of green space and planting to manage runoff.
• Flood proofing of developments (including land raising and raising floor levels) and flood warning.
• Management of development runoff (such as the inclusion of SuDS).
Long-term operation and maintenance requirements and responsibilities are a key consideration. The appropriateness of sustainable drainage techniques (SuDS) should be assessed. The suitability of different SuDS techniques is discussed in Chapter 2.
B&NES SFRA (April 2008) Volume I - Technical Report
8-5
Flooding from land (surface water)
Planning considerations
The Environment Agency Flood Zones Map does not include flooding from land, however PPS25 requires that consideration be given to other forms of flooding during the decision making process.
PPS25 requires that decision makers use the SFRA to inform their knowledge of flooding. The SFRA refines the information on the Flood Map and determines the variations in flood risk from all sources of flooding across the area. The information then forms the basis for preparing appropriate policies for flood risk management for these areas. PPS25 states that local planning authority should further the use of SUDS by, amongst other things, adopting 'policies for incorporating SUDS requirements in local development documents.'
Assessments of flooding from land are therefore needed. The SFRA has provided a map showing areas which have previously flooded from land, and areas that are more likely to flood from this source. However as these processes are highly variable at the local scale, the maps only provide a guide at a strategic level.
Flooding should be managed through the flood risk assessment process. Further collation of relevant data is required, such as land use, runoff rates, existing drainage systems, past events and consultation with relevant bodies. All new proposed developments should undertake a detailed assessment of the site and upstream catchment characteristics. Specific factors that should be considered when undertaking a flood risk assessment include:
• Areas liable to flooding (based on site and catchment characteristics).
• The extent, standard and effectiveness of existing drainage systems.
• The likely runoff rates.
• The likely impacts to other areas (such as increases in surface water runoff rates).
• The likely extent, depth and velocity of flooding.
• The effects of climate change.
• The suitability of different sustainable drainage system options.
B&NES SFRA (April 2008) Volume I - Technical Report
8-6
Flooding from groundwater
9. Flooding from groundwater
The B&NES SFRA is a 'live' document. The current version has been developed using the best information and concepts available at the time. As new information and concepts become available the document will be updated and so it is the responsibility of the reader to be satisfied that they are using the most up-to-date information and that the SFRA accounts for this information. All revisions to this summary document are listed in the table.
Version Issue Date Issued by Issued to
Final 23/04//2008 Capita Symonds
Ltd
B&NES, EA
B&NES SFRA (April 2008) Volume I - Technical Report
9-1
Flooding from groundwater
Introduction
Description
Groundwater flooding is caused by the emergence of water originating from sub-surface permeable strata. Groundwater flooding can happen at point or diffuse locations and it tends to be long in duration, developing over weeks or months and prevailing for days or weeks.
It is important to assess the type of groundwater flooding to fully understand the source and pathway and, if required, potential management solutions. There are many mechanisms associated with groundwater flooding, which can be broadly classified as the phenomena outlined in Table 9.1.
Causes of high groundwater levels
High groundwater levels can result from the combination of geological, hydrogeological, topographic and recharge phenomena and can mostly be associated with the seven mechanisms described in Table 9.1. Each has been described using the source-pathway-receptor model.
For the purposes of the SFRA it is appropriate to consider the geographical scale, social and economic cost and certainty of prediction when considering groundwater flood risk. Of the groundwater flooding mechanisms experienced in the SFRA study area, rising groundwater levels in major aquifers as a result of long duration rainfall present by far the greatest and most extensive level of risk.
Impacts of groundwater flooding
Flooding is generally not hazardous to life, but can cause considerable damage to property and infrastructure due to long durations of flooding. The main impacts of groundwater flooding are:
• Flooding of basements of buildings below ground level – in the mildest case this may involve seepage of small volumes through walls, temporary loss of services etc. In more extreme cases larger volumes may lead to the catastrophic loss of stored items and failure of structural integrity.
• Overflowing of sewers and drains – surcharging of drainage networks can lead to overland flows causing significant but localised damage to property. Sewer surcharging can lead to inundation of property by polluted water. Note: it is complex to separate this flooding from other sources, notably surface water or sewer flooding.
• Flooding of buried services or other assets below ground level – prolonged inundation of buried services can lead to interruption and disruption of supply.
• Inundation of farmland, roads, commercial, residential and amenity areas – inundation of grassed areas can be inconvenient however the inundation of hard-standing areas can lead to structural damage and the disruption of commercial activity. Inundation of agricultural land for long durations can have financial consequences.
• Flooding of ground floors of buildings above ground level – can be disruptive, and may result in structural damage. The long duration of flooding can outweigh the lead time which would otherwise reduce the overall level of damages.
B&NES SFRA (April 2008) Volume I - Technical Report
9-2
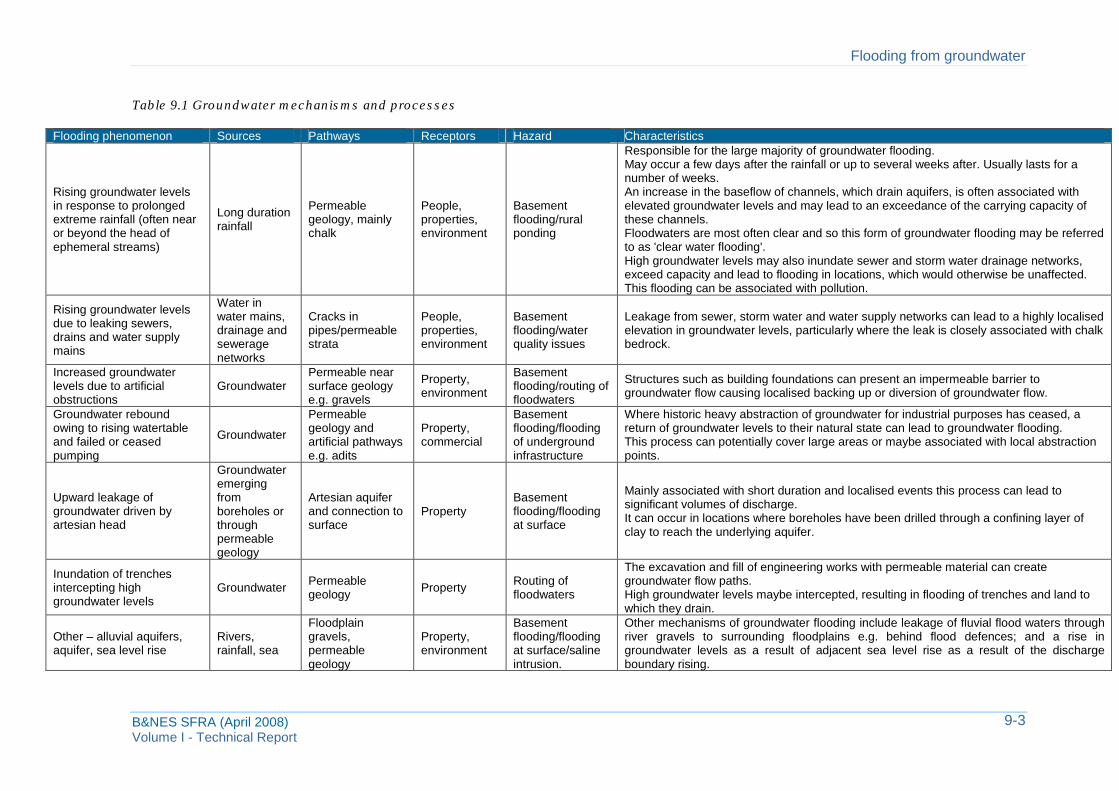
Flooding from groundwater
Table 9.1 Groundwater mechanisms and processes
Flooding phenomenon Sources Pathways Receptors Hazard Characteristics
Rising groundwater levels in response to prolonged extreme rainfall (often near or beyond the head of
Long duration rainfall
Permeable geology, mainly chalk
People, properties, environment
Basement flooding/rural ponding
Responsible for the large majority of groundwater flooding. May occur a few days after the rainfall or up to several weeks after. Usually lasts for a number of weeks. An increase in the baseflow of channels, which drain aquifers, is often associated with elevated groundwater levels and may lead to an exceedance of the carrying capacity of these channels. Floodwaters are most often clear and so this form of groundwater flooding may be referred
ephemeral streams) to as 'clear water flooding'. High groundwater levels may also inundate sewer and storm water drainage networks, exceed capacity and lead to flooding in locations, which would otherwise be unaffected. This flooding can be associated with pollution.
Rising groundwater levels due to leaking sewers, drains and water supply mains
Water in water mains, drainage and sewerage networks
Cracks in pipes/permeable strata
People, properties, environment
Basement flooding/water quality issues
Leakage from sewer, storm water and water supply networks can lead to a highly localised elevation in groundwater levels, particularly where the leak is closely associated with chalk bedrock.
Increased groundwater levels due to artificial obstructions
Groundwater Permeable near surface geology e.g. gravels
Property, environment
Basement flooding/routing of floodwaters
Structures such as building foundations can present an impermeable barrier to groundwater flow causing localised backing up or diversion of groundwater flow.
Groundwater rebound Permeable Basement Where historic heavy abstraction of groundwater for industrial purposes has ceased, a owing to rising watertable and failed or ceased Groundwater geology and
artificial pathways Property, commercial
flooding/flooding of underground
return of groundwater levels to their natural state can lead to groundwater flooding. This process can potentially cover large areas or maybe associated with local abstraction
pumping e.g. adits infrastructure points. Groundwater
Upward leakage of groundwater driven by artesian head
emerging from boreholes or through permeable
Artesian aquifer and connection to surface
Property Basement flooding/flooding at surface
Mainly associated with short duration and localised events this process can lead to significant volumes of discharge. It can occur in locations where boreholes have been drilled through a confining layer of clay to reach the underlying aquifer.
geology
Inundation of trenches intercepting high groundwater levels
Groundwater Permeable geology Property Routing of
floodwaters
The excavation and fill of engineering works with permeable material can create groundwater flow paths. High groundwater levels maybe intercepted, resulting in flooding of trenches and land to which they drain.
Floodplain Basement Other mechanisms of groundwater flooding include leakage of fluvial flood waters through Other – alluvial aquifers, Rivers, gravels, Property, flooding/flooding river gravels to surrounding floodplains e.g. behind flood defences; and a rise in aquifer, sea level rise rainfall, sea permeable environment at surface/saline groundwater levels as a result of adjacent sea level rise as a result of the discharge
geology intrusion. boundary rising.
9-3 B&NES SFRA (April 2008) Volume I - Technical Report
Flooding from groundwater
Data collection
Historic incidents
Information held by the Environment Agency and local authorities about this type of flooding is very limited and due to its nature it is difficult to accurately define all the areas at risk from this source of flooding.
All historic incidents of flooding recorded by the Environment Agency are included in their FRIS dataset. This dataset was used as the primary source of verification information in the assessment of flooding from groundwater. No additional information was available, although it is possible that other stakeholders such as the highways authorities, fire brigade and the parish would hold records (in various format and levels of detail).
The FRIS dataset did not contain any incidents which were directly attributed to this source of flooding. However one incident in Lambridge in north east Bath was attributed to a combination of river and groundwater flooding. The Lam Brook is a spring fed watercourses and as such it is probable that flood events in this north eastern area of Bath may be caused by a combination of river and groundwater flooding.
Existing studies
No single government body is responsible for monitoring or responding to groundwater flooding. Defra’s Making Space for Water Strategy (MSW) aims to provide greater clarity for the public and professional bodies impacted by and involved in the management of flooding. MSW recognises the need for an integrated understanding of flooding from all sources including groundwater.
As a consequence Defra have instigated a series of investigations into groundwater flooding such as;
• HA5 Groundwater Flooding Records Collation, Monitoring and Risk Assessment, March 2006 - aims to make recommendations for effective collation and monitoring of groundwater flooding information and identify organisational and funding arrangements required to implement this. It has identified that a national database for groundwater flooding is desirable and that scientific research into improving the understanding of groundwater flood processes is required.
• HA4a Flooding from Other Sources, October 2006 - aims to assess the feasibility of mapping flood risk from different types of flooding (including groundwater), together with the practicalities of implementing flood modelling methods considered for the significant types of flooding (including groundwater flooding). It has identified that the greatest barrier to producing accurate flood risk maps of other sources of flooding is the availability of data for ground-truthing in consistent and useable formats. It has further identified that the modelling methods that would be required to capture all the observed processes are complex and may not be realistic in the immediate future
In 2004, Defra published a series of groundwater emergence maps (GEM) which were developed from analysis of historical datasets and other predictive techniques. The main data used in the analysis were the observations of groundwater flooding in 2000/1. Where insufficient observations existed, representative rises in groundwater levels were mapped and used to determine locations where the watertable would have neared the ground surface during this period. The resultant GEM did not include any land within B&NES.
B&NES SFRA (April 2008) Volume I - Technical Report
9-4
Flooding from groundwater
Assessment of flood risk
Methods
The existing Environment Agency Flood Zones only indicate areas liable to flood from rivers and the sea. Other data must therefore be used to determine the areas susceptible to flooding from other sources, such as flooding from groundwater.
The methodology used in the SFRA to assess flooding from land is built on the premise that this type of flooding is directly related to the physical, hydrological and environmental characteristics of a particular location.
An analysis of relevant catchment datasets within a Geographical Information System (GIS) platform was undertaken. The analysis identified areas that had not necessarily flooded in the past, but had a greater likelihood of experiencing flooding from groundwater.
The first stage of the spatial analysis was to identify drivers of flooding from groundwater. Each driver was then assigned a weighting value based on the relative importance of its contribution to surface water flooding. Drivers and weighting values for groundwater flooding were;
• Geology (weighting value of 6)
• Soil (weighting value of 5)
• DTM (weighting value of 3)
• Aquifers (weighting value of 2)
Each driver dataset was divided into three categories (high, medium and low), based on likelihood for flooding. For example, an area of permeable geology was assigned a value of 3 to reflect its higher recharge rate, whereas a layer of impermeable geology was assigned a value of 1.
The datasets were then interrogated using a 25m grid cell and the rankings equated to determine an overall value for each cell. The cells were contoured to produce a layer showing areas with a high, medium or low likelihood of flooding from groundwater.
In the absence of any historic incidents, the results were sensibility checked against known drivers and against the springs marked on 10k OS Mapping.
Results
The results of the spatial analysis are shown in Map G3 in Annex A, along with the known location of springs. No areas within B&NES indicated a high risk of groundwater flooding. The western side of the catchment was shown to be at lower risk due to its higher elevation, and the eastern side was shown to be at higher risk due to its slightly more permeable geology and lower topography.
Due to the relatively impermeable underlying geology of B&NES it is reasonable to expect that there are no areas with a high risk. Furthermore, lack of groundwater monitoring in the area and no historic incidents of flooding contribute to the verification of these results.
There are a number of springs located on the 10k OS Map. Most of these are located in the north eastern side of B&NES with a medium likelihood of flooding, and at the heads and along the sides of perennial streams.
B&NES SFRA (April 2008) Volume I - Technical Report
9-5
Flooding from groundwater
Climate change
There is currently no research specifically considering the impact of climate change on groundwater flooding. The mechanisms of flooding from aquifers are unlikely to be affected by climate change, however if winter rainfall becomes more frequent and heavier, groundwater levels may increase. Higher winter recharge may however be balanced by lower recharge during the predicted hotter and drier summers.
Uncertainty
The spatial analysis undertaken in the SFRA is highly qualitative. The maps do not indicate specific areas that will flood, but instead indicate areas where further analysis is recommended. Local factors that cannot be assessed without more reliable quantitative data can affect groundwater and the potential for emergence.
Despite this, none of the datasets examined in the SFRA indicated that groundwater flooding is a significant issue in B&NES. Thus some confidence can be achieved in assigning a low to medium probability of this source of flooding within B&NES.
The impact of climate change on groundwater levels is highly uncertain. More winter rainfall may increase the frequency of groundwater flooding incidents, but drier summers and lower recharge of aquifers may counteract this.
Managing groundwater flooding
At present there is no government body with a clear responsibility for groundwater flooding, having a statutory obligation for measuring and reporting events or providing advice and affording protection to those at risk.
As of spring 2006 the Environment Agency assumed a strategic overview for monitoring groundwater flooding but the extent and the legislative details remain to be clarified. The Environment Agency currently provides some data of known groundwater flooding incidents in their FRIS dataset.
Groundwater flooding is often highly localised and complex. Management is strongly dependent upon the characteristics of the specific situation. The costs associated with the management of groundwater flooding are highly variable. The implications of groundwater flooding should be considered and managed through development control and building design. Possible responses include;
• Improve conveyance of floodwater through and away from flood prone areas
• Raising property ground or floor levels
• Provide local protection for specific problem areas such as flood proofing properties (such as tanking or sealing of building basements)
• Replacement and renewal of leaking sewers, drains and water supply reservoirs. Water companies have a programme to address leakage from infrastructure, so there is clear ownership of the potential source.
Planning considerations
The Environment Agency Flood Map does not include groundwater flooding. The SFRA is required to build on the Flood Map by investigating other sources of flooding. PPS25 requires that decision makers use the SFRA to inform their knowledge of flooding across the area. These should form the basis for preparing appropriate policies for flood risk management. The propensity for groundwater flooding should be a material consideration when making land use allocation decisions.
B&NES SFRA (April 2008) Volume I - Technical Report
9-6
Flooding from groundwater
Groundwater flooding has always occurred. It generally occurs more slowly than river flooding and in specific locations. The rarity of groundwater flooding combined with the mobility of the population means that people often do not know there is a groundwater flood risk.
New developments are particularly at risk because little consideration is given to groundwater as a source of flooding in the planning process. The sparse frequency of groundwater flood events can contribute to poor decision-making.
Groundwater flood risk should be investigated, identified, quantified and managed where possible by the flood risk assessment process. Assessments of groundwater flooding must therefore always be included at all levels of future flood risk assessment. However a probabilistic approach to mapping groundwater flooding is not currently possible given the current datasets. Thus further collation of all relevant data, such as spring flows, borehole water levels, and recorded flood levels, past history and photographs of events and consultation with local residents should be undertaken in when preparing site specific flood risk assessments (FRA).
In particular, the factors that should be taken into account during these FRA are;
• Areas liable to flood based on the best available information
• Extent, standard and effectiveness of existing flood defences (if present)
• Likely rates of water level rise within the aquifer, and if possible, trigger levels for the onset of overland flow
• Quantities and velocities of overland flow
• Likely depth of flooding
• Likelihood of impacts to other areas
• Possible impacts of climate change.
Indicators that the development may be at risk from groundwater flooding include;
• If the development site is near to the junction between geological strata of differing permeability
• If the development site is located at a similar level to nearby springs, or stream headwaters
• If the development proposals include basements or excavation into the ground
• If the vegetation on the site suggests periodic waterlogging due to high groundwater levels.
B&NES SFRA (April 2008) Volume I - Technical Report
9-7

Flooding from sewers
10. Flooding from sewers
The B&NES SFRA is a 'live' document. The current version has been developed using the best information and concepts available at the time. As new information and concepts become available the document will be updated and so it is the responsibility of the reader to be satisfied that they are using the most up-to-date information and that the SFRA accounts for this information. All revisions to this summary document are listed in the table.
Version Issue Date Issued by Issued to
Final 23/04//2008 Capita Symonds
Ltd
B&NES, EA
B&NES SFRA (April 2008) Volume I - Technical Report
10-1
Flooding from sewers
Introduction
Description
Flooding from sewers occurs when rainfall exceeds the capacity of networks or when there is an infrastructure failure.
For the purposes of this SFRA sewer flooding is defined as any flooding which occurs in an urban area with a comprehensive sewer network. This includes combined, and surface water sewers, culverted minor watercourses (lost watercourses), sewer pumping stations and water treatment facilities. It does not include flooding from over land drainage systems in rural areas.
Causes of sewer flooding
The main causes of sewer flooding are;
• Lack of capacity in sewer drainage networks due to original under-design or due to an increase in demand (such as climate change and/or new developments)
• Lack of capacity in sewer drainage networks due to events larger than the system designed event
• Lack of capacity in sewer drainage networks when a watercourse is fully culverted (lost watercourses), thus removing floodplain capacity
• Lack of maintenance of sewer networks which leads to a reduction in capacity and can sometime lead to total sewer blockage
• Water mains bursting/leaking due to lack of maintenance or as a result of damage
• Groundwater infiltration into poorly maintained or damaged pipe networks
• Restricted outflow from the sewer systems due to high water levels in receiving watercourses or the sea.
Impacts of sewer flooding
The impact of sewer flooding is usually confined to relatively small localised areas. When flooding is associated with blockage or failure of the sewer network, flooding can be rapid and unpredictable.
Drainage systems often rely on gravity assisted dendritic systems, which convey water in trunk sewers located at the lower end of the catchment. Failure of these trunk sewers can have serious consequences, which are often exacerbated by topography, as water from surcharged manholes will flow into low-lying land that may already be suffering from other types of flooding.
The modification of watercourses into culverted or piped structures can result in reduced capacity. Excess water may flow along unexpected routes as the original channel is no longer present and the new system cannot accept it.
Whilst the area affected by sewer flooding is localised, the quality of water can be poor. Flooding of combined sewers can lead to contaminated water entering properties nearby watercourses.
Sewer flooding is likely to have a high concentration of solid, soluble and insoluble contaminants. This can lead to a reduction in the environmental quality of receiving watercourses. Flooding of contaminated land (such as landfills, motorways, and petrol station forecourts) will transport
B&NES SFRA (April 2008) Volume I - Technical Report
10-2
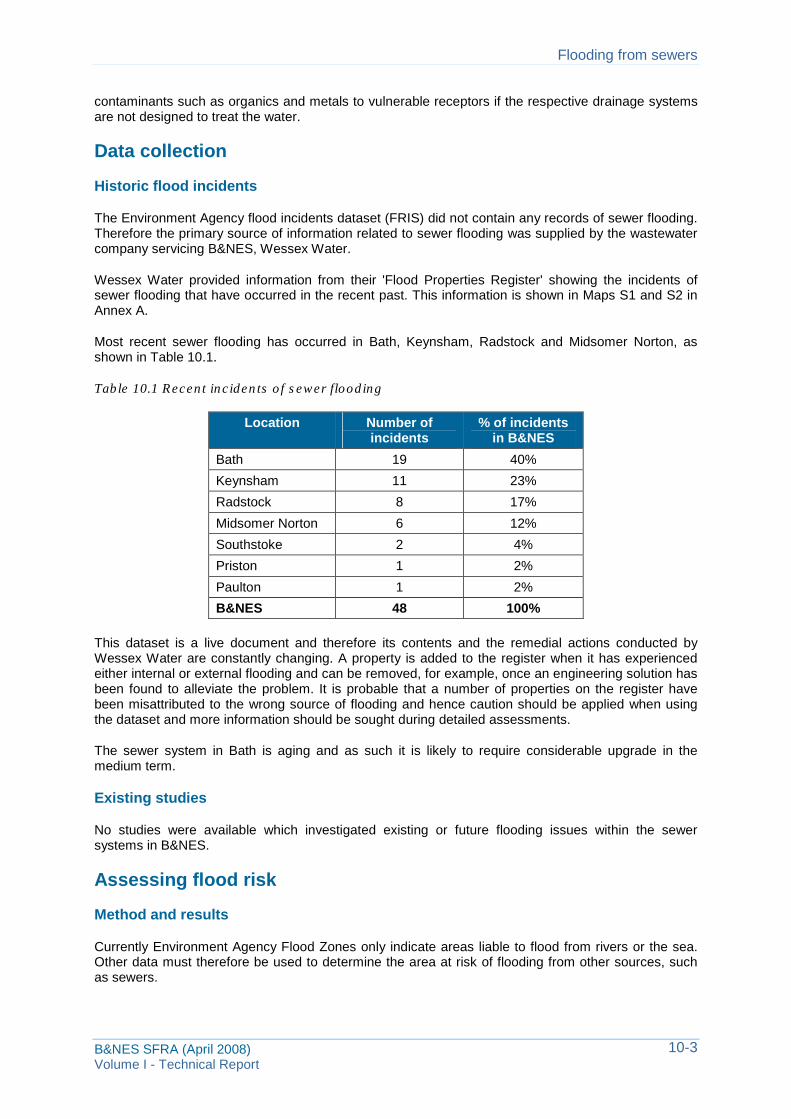
Flooding from sewers
contaminants such as organics and metals to vulnerable receptors if the respective drainage systems are not designed to treat the water.
Data collection
Historic flood incidents
The Environment Agency flood incidents dataset (FRIS) did not contain any records of sewer flooding. Therefore the primary source of information related to sewer flooding was supplied by the wastewater company servicing B&NES, Wessex Water.
Wessex Water provided information from their 'Flood Properties Register' showing the incidents of sewer flooding that have occurred in the recent past. This information is shown in Maps S1 and S2 in Annex A.
Most recent sewer flooding has occurred in Bath, Keynsham, Radstock and Midsomer Norton, as shown in Table 10.1.
Table 10.1 Recent incidents of sewer flooding
Location Number of incidents
% of incidents in B&NES
Bath 19 40%
Keynsham 11 23%
Radstock 8 17%
Midsomer Norton 6 12%
Southstoke 2 4%
Priston 1 2%
Paulton 1 2%
B&NES 48 100%
This dataset is a live document and therefore its contents and the remedial actions conducted by Wessex Water are constantly changing. A property is added to the register when it has experienced either internal or external flooding and can be removed, for example, once an engineering solution has been found to alleviate the problem. It is probable that a number of properties on the register have been misattributed to the wrong source of flooding and hence caution should be applied when using the dataset and more information should be sought during detailed assessments.
The sewer system in Bath is aging and as such it is likely to require considerable upgrade in the medium term.
Existing studies
No studies were available which investigated existing or future flooding issues within the sewer systems in B&NES.
Assessing flood risk
Method and results
Currently Environment Agency Flood Zones only indicate areas liable to flood from rivers or the sea. Other data must therefore be used to determine the area at risk of flooding from other sources, such as sewers.
B&NES SFRA (April 2008) Volume I - Technical Report
10-3
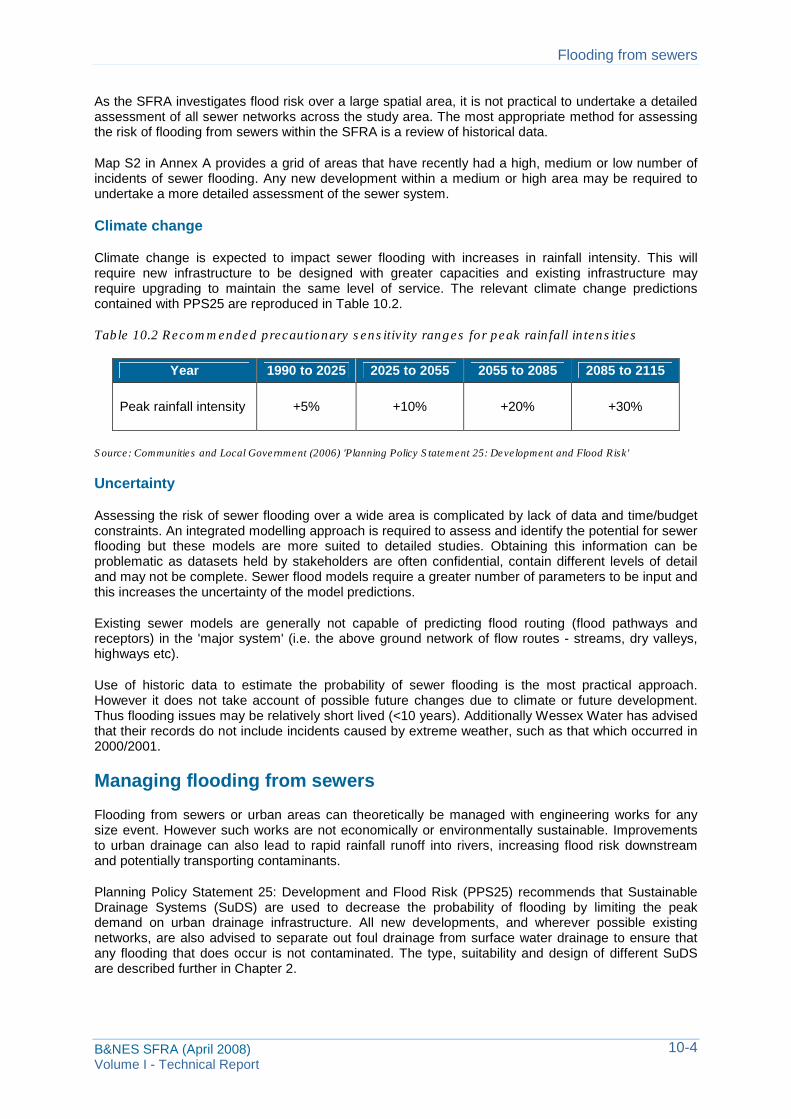
Flooding from sewers
As the SFRA investigates flood risk over a large spatial area, it is not practical to undertake a detailed assessment of all sewer networks across the study area. The most appropriate method for assessing the risk of flooding from sewers within the SFRA is a review of historical data.
Map S2 in Annex A provides a grid of areas that have recently had a high, medium or low number of incidents of sewer flooding. Any new development within a medium or high area may be required to undertake a more detailed assessment of the sewer system.
Climate change
Climate change is expected to impact sewer flooding with increases in rainfall intensity. This will require new infrastructure to be designed with greater capacities and existing infrastructure may require upgrading to maintain the same level of service. The relevant climate change predictions contained with PPS25 are reproduced in Table 10.2.
Table 10.2 Recommended precautionary sensitivity ranges for peak rainfall intensities
Year 1990 to 2025 2025 to 2055 2055 to 2085 2085 to 2115
Peak rainfall intensity +5% +10% +20% +30%
Source: Communities and Local Government (2006) 'Planning Policy Statement 25: Development and Flood Risk'
Uncertainty
Assessing the risk of sewer flooding over a wide area is complicated by lack of data and time/budget constraints. An integrated modelling approach is required to assess and identify the potential for sewer flooding but these models are more suited to detailed studies. Obtaining this information can be problematic as datasets held by stakeholders are often confidential, contain different levels of detail and may not be complete. Sewer flood models require a greater number of parameters to be input and this increases the uncertainty of the model predictions.
Existing sewer models are generally not capable of predicting flood routing (flood pathways and receptors) in the 'major system' (i.e. the above ground network of flow routes - streams, dry valleys, highways etc).
Use of historic data to estimate the probability of sewer flooding is the most practical approach. However it does not take account of possible future changes due to climate or future development. Thus flooding issues may be relatively short lived (<10 years). Additionally Wessex Water has advised that their records do not include incidents caused by extreme weather, such as that which occurred in 2000/2001.
Managing flooding from sewers
Flooding from sewers or urban areas can theoretically be managed with engineering works for any size event. However such works are not economically or environmentally sustainable. Improvements to urban drainage can also lead to rapid rainfall runoff into rivers, increasing flood risk downstream and potentially transporting contaminants.
Planning Policy Statement 25: Development and Flood Risk (PPS25) recommends that Sustainable Drainage Systems (SuDS) are used to decrease the probability of flooding by limiting the peak demand on urban drainage infrastructure. All new developments, and wherever possible existing networks, are also advised to separate out foul drainage from surface water drainage to ensure that any flooding that does occur is not contaminated. The type, suitability and design of different SuDS are described further in Chapter 2.
B&NES SFRA (April 2008) Volume I - Technical Report
10-4
Flooding from sewers
The sewer systems in B&NES, particularly Bath, are aging and will require significant upgrade in the medium future. An integrated urban drainage strategy would be a preferred means of managing surface water.
Planning considerations
The Environment Agency Flood Map does not include flooding from sewers, however PPS25 requires that consideration be given to other forms of flooding during the decision making process.
Assessments of flooding from sewers are therefore needed. A probabilistic approach requires an understanding of hydrological, hydraulic and structural engineering processes. These processes are highly variable at the local scale and can not meaningfully be performed at a strategic level. Thus a more detailed assessment is required for individual proposed developments. At a minimum, a sewer assessment should be undertaken when proposing additional development in those locations having a medium or high number of historic incidents, as shown on Map S2 in Annex A.
As well as informing land use planning, flooding from sewers should be managed by the development control process. Further collation of all relevant data, such as sewer capacity, past events and consultation with water companies and operating authorities should be undertaken when preparing site specific flood risk assessments. Factors that should be taken into account during these flood risk assessments are;
• Capacity of the existing drainage system
• Increase in surface water runoff rates
• Effects of climate change
• Suitable SuDS.
B&NES SFRA (April 2008) Volume I - Technical Report
10-5
Flooding from artificial sources
11. Flooding from artificial sources
The B&NES SFRA is a 'live' document. The current version has been developed using the best information and concepts available at the time. As new information and concepts become available the document will be updated and so it is the responsibility of the reader to be satisfied that they are using the most up-to-date information and that the SFRA accounts for this information. All revisions to this summary document are listed in the table.
Version Issue Date Issued by Issued to
Final 23/04//2008 Capita Symonds
Ltd
B&NES, EA
B&NES SFRA (April 2008) Volume I - Technical Report
11-1
Flooding from artificial sources
Introduction
For the purpose of the SFRA, flooding from artificial sources has been defined as flooding from nonnatural or artificial sources of flooding as reservoirs, canals and lakes where water is retained above natural ground level.
Artificial sources of flooding also includes operational and redundant industrial processes including mining, quarrying, and sand and gravel extraction, although these have not been identified in B&NES.
The spatial and temporal extent of flooding from artificial sources can be highly variable. For example, the likelihood of a new reservoir failing is very small compared to that of a canal embankment that is over one hundred years old. However whilst the probability is low, the consequences of a new reservoir failing could be catastrophic.
The two artificial sources of flood risk identified within B&NES are the canals (Kennet and Avon Canal) and reservoirs (Chew Valley Lake and Chew Magna Reservoir). As the causes, impacts and assessment of these sources varies, they have been described separately below.
Canals
Description and impacts
The Kennet and Avon canal is the only canal in B&NES and contributes to the transportation link between Reading and Bristol. It runs parallel to the Lower Avon in the eastern side of B&NES until it joins the Avon in Bath. There are three principal mechanisms which could cause flooding:
• Leakage may occur through bed and bank linings or through structures designed to drain and manage water levels in the canal. This form of flooding is often of limited extent and low hazard, but may be prolonged in duration.
• Breach is a catastrophic failure of a water retaining structure, normally leading to rapid loss of all impounded water unless emergency measures are taken. Breach is considered to be of low probability but of high consequence and for this reason is identified as a most significant flood mechanism.
• Overtopping of canal banks either into or from the canal may lead to property flooding. Overtopping also puts more pressure on canal embankments which can lead to a breach. A canal may act as a conduit for flooding to low lying areas some distance away from the nearest watercourse. Overtopping in general is a low consequence event and so is often not reported.
A comprehensive list of the factors affecting canal flood risk is contained within Flooding from Other Sources HA4a (Appendix D: Flooding from Canals)16 .
The volume of water within the canal section determines the impact of a flood event. For a canal structure this is calculated from pound length (distance from lock to lock) and average cross section. Complete failure of a canal side (depending on water level being stored within pound) is likely to have a greater impact than partial failure whereby a void is created and water issues at a constant rate.
16 Defra 2006 (2006a) 'Flooding from other sources' Technical report HA4a, prepared by Jacobs, October 2006
B&NES SFRA (April 2008) Volume I - Technical Report
11-2
Flooding from artificial sources
Historic incidents of canal flooding
Datasets are held at varying levels of detail by British Waterways, local interest groups, the Environment Agency, British Geological Survey Mapping, canal operators/owners, and local planning authorities.
British Waterways was contacted during the SFRA but was unavailable to provide details of known breaches, flood incidents or asset condition.
The Environment Agency flood incident dataset (FRIS) did not contain any recorded incidents of flooding from the Kennet and Avon Canal. It is possible that unreported incidents of overtopping have occurred.
Assessment of risk from canals
Defra17 proposes a four-stage assessment of the risk associated with flooding from canals. An initial assessment of ground topography and historic datasets was used to indicate the level of assessment required in the SFRA. The assessment found that flood risk from the canal would be relatively minor and as such would not warrant a highly detailed study at this strategic level.
Defra was therefore modified to reflect the level of assessment required in the SFRA. A more detailed approach would be required if undertaking a site-specific flood risk assessment. The assessment steps included;
• A review of available datasets. No historic incidents or anecdotal evidence of flooding from the canal were provided during the SFRA from British Waterways, the Environment Agency or B&NES
• Assessment of hazard. 10k OS Mapping and LiDAR data was used to define an area which may be at risk of flooding from the canal.
The area at risk of flooding has been mapped in Figure R in Annex A. Any new developments within the area at risk of flooding from the canal should include a more detailed site specific analysis in the flood risk assessment.
Flood risk from the canal in B&NES is relatively low as the canal is perched on the slope of the Avon Valley, rather than on a raised embankment. As such the risk of overtopping is higher than the risk of breach. A railway line runs parallel and downstream of the canal for much of its length in B&NES. It is likely that the extent of any flooding from the canal would be limited due to the presence of the railway embankment.
Upstream of Bath there are few properties adjacent to the canal. Combined with the relatively small floodplain, their risk is considered low.
Within Bath there are properties adjacent to the canal which would be inundated if the canal banks failed or overtopped. Given that the canal is not raised on an embankment, the risk of bank failure is reduced. Likewise, water levels are well managed in the canal and thus the risk of overtopping is reduced. The flood risk from the canal in Bath is also considered low.
Uncertainty from canals
Flood probability, extents, depths and velocities were not quantified in the SFRA due to lack of data and an initial review which indicated that flooding from canals was not a significant risk in B&NES. The area of risk is based on a qualitative assessment, which should be considered when using results for land use planning.
17 Defra 2006 (2006a) 'Flooding from other sources' Technical report HA4a, prepared by Jacobs, October 2006
B&NES SFRA (April 2008) Volume I - Technical Report
11-3
Flooding from artificial sources
All new developments within the flood risk area should undertake a more detailed assessment. Predicting flooding from canals is more complex than some other forms of flooding. The following should be considered in more detailed assessments;
• Often damage to the canal structure is below the water depth and is not visible unless a full structural survey is undertaken. Such surveys may not detect erosion of the canal base due to groundwater or leaking water mains
• It is difficult to allow for and predict the actions of third parties e.g. construction works alongside a canal that may cause damage to the integrity of the canal structure and damage by canal users
• Datasets relating to canal construction may be incomplete especially for the older systems or at an inappropriate level of detail
• Historic flood event data may not be relevant. For example, if the historic event was due to structure failure and the damage has been competently repaired this data is not relevant. Also, historic flood data does not take account of climate change.
Managing flooding from canals
Responsibilities for the inland waterways network are held by a large number of public and private authorities. The Kennet and Avon Canal is managed by British Waterways. The Transport Act 1962 established the British Waterways Board (BW) and divided canals into three categories: commercial, cruising and remainder. BW completed a programme of safety related work on commercial and cruising waterways in March 2004.
In addition to British Waterways, the Kennet and Avon Trust have an important role in the history of the canals. The Kennet and Avon Canal Trust was formed over 40 years ago to restore the, then closed, Kennet & Avon Canal from Reading to Bristol as a "through" navigation and as a public amenity. The canal was re-opened in 1990. Since then the Trust has worked in partnership with British Waterways and the riparian local authorities to maintain the use of the canal for navigation. The main objectives of the Kennet and Avon Canal Trust are to protect, enhance and promote the canal for the enjoyment of all.
Neither authority is understood to issue flood or water level warnings however they do consult with the Environment Agency. British Waterways manage the closure of lengths of the canal when flash floods have either caused damage or have altered water levels. Adequate management of water levels in the canal should be sufficient to prevent flooding from overtopping.
The maintenance of the canal structure is of interest to British Waterways and the canal Trust for non-flood issues. For this reason, maintenance is undertaken on a regular basis and should reduce the risk of flooding from a breach.
The processes and procedures undertaken by the operating authorities should be determined at the appropriate level of flood risk assessment.
Flooding from reservoirs
Description and impacts
The Chew Valley Lake and Chew Magna Reservoir are two reservoirs in B&NES that have been identified as potential sources of artificial flooding. These have structures which impound water for supply purposes and have been described earlier in Chapter 4.
B&NES SFRA (April 2008) Volume I - Technical Report
11-4
Flooding from artificial sources
Managed or un-managed reservoir release may increase floodwater depths and velocities in adjacent areas. Reservoir flooding may occur as a result of failure of a reservoir’s civil structure due to the system being overwhelmed or malfunction of the water level control system.
Design standards at impounding reservoirs are necessarily high. While there have been no major flood-related incidents at UK reservoirs since July 1968, the consequences of such an event could be catastrophic. A breach within a dam or flooding impounding reservoir would result in very deep, fast flowing floodwater flowing downstream.
Historic incidents of flooding
Data relating to the structure, management and historic reservoirs in B&NES is held by the Environment Agency, B&NES, Bristol Water and the Health and Safety Executive (HSE). A review of the Environment Agency's flood incident dataset (FRIS) found that there were no historic incidents of flooding from either reservoir in B&NES. No incidents of flooding were supplied by the other stakeholders.
An internet search revealed one historic incident related to failure of the Chew Magna Reservoir in 1968:
'At Chew Magna the reservoir overflowed into Winford Brook, further swelling the river. Some time during the late evening, one of the debris-stricken bridges finally succumbed to the pressure and was demolished, sending a swirling torrent down to the next bridge, where the process was repeated and multiplied.
This created what eye witnesses called a 'wall of water' that crashed down the Chew Valley, swamping buildings, destroying bridges and washing away parked cars as it progressed. The 10 feet tall wave reached Keynsham shortly before midnight, carrying with it a cargo of debris. Long standing road bridges at Pensford, Woollard and Keynsham were destroyed beyond repair, causing major traffic problems in what was the height of the holiday season.'18
This incident provides an example of a cascade effect, whereby the failure of one asset can lead to a failure of a downstream asset, causing floodwater to build up at consecutive stages. The effect was catastrophic and symbolic of the devastation associated with reservoir flooding. It is likely that this flood has been attributed to 'river flooding' in the Environment Agency's FRIS dataset.
Existing studies
The Water Act (2003) requires that undertakers produce flood maps by Autumn 2007. Bristol Water and B&NES Council have advised that inundation maps have been produced for the reservoirs in B&NES. For National Security reasons, these maps were not available for use in the SFRA.
Assessment of risk
In the absence of data, a coarse modelling exercise was undertaken to determine an area which may be affected if the reservoirs were to breach.
The existing hydraulic model for the River Chew was modified to remove the spillway and 1m depth of the spillway at the downstream extent of the Chew Valley Lake. The hydraulic model was then run with a 1% AEP event in the upstream catchment and no inflows from the tributaries.
The results were compared with the 0.1% AEP flood outline produced by the Environment Agency to represent their Flood Zone 2. The method to produce the flood outline involved removing barriers to flow such as reservoirs. Thus it is representative of an extreme flood with no embankments in place. Flood Zone 2 was found to be larger in most locations down the Valley.
18 http://www.riverchew.co.uk/flood_1968.htm
B&NES SFRA (April 2008) Volume I - Technical Report
11-5
Flooding from artificial sources
Following a conservative approach, the new model outlines and Environment Agency Flood Zone 2 outline were combined to produce an area which may be affected if the reservoirs were to breach. This area is shown on Figure R in Annex A.
Uncertainty
The assessment of the risk of flooding from reservoirs undertaken for the SFRA has not included any analysis of the integrity of the reservoir structures. Instead, a precautionary approach in line with PPS25 has been adopted to highlight areas which may be at risk. More detailed assessments are required for all developments proposed within this area of risk. As with canals, predicting flooding from reservoirs is more complex than some other forms of flooding. The following should be considered in more detailed assessments:
• Failure of a reservoir can have a cascade effect, as was witnessed in the 1968 flood in the Chew Valley
• Geotechnical assessment of embankments, below water level, is required to assess the likelihood of flooding and associated risk. This then needs to be combined with hydrological data and the risk assessment and modelling process becomes complicated
• It is difficult to allow for and predict the actions of third parties, such as construction works alongside a reservoir which may cause damage to the integrity of the impounding structure
• Datasets relating to reservoir construction may be incomplete especially for the older systems or at an inappropriate level of detail
• Historic flood event data may not be relevant. For example, if the historic event was due to structure failure and the damage has been competently repaired this data is not relevant. Also, historic flood data does not take account of climate change
• Asset management is more likely to be undertaken on reservoirs that have a capacity in excess of 25,000m3 or where they form part of a commercial activity.
Managing flood from reservoirs
Design standards at impounding reservoirs are necessarily high. As such, they are usually designed not to overtop or breach in a high (1% AEP) or even extreme (0.1% AEP) flood event. Managing flooding from reservoirs therefore involves maintenance to ensure that the integrity of the impounding structures is retained. Due to the severity of the consequences of failure, there is a range of legislation which aims to ensure reservoirs do not fail.
The Reservoirs Act (1975) provides the legal framework to ensure the safety of United Kingdom reservoirs that hold at least 25,000m3 of water above natural ground level. Reservoir owners (undertakers) have ultimate responsibility for the safety of their reservoirs, ensuring frequent inspections are undertaken by appropriately qualified engineers.
The Water Act 2003 requires that flood plans be produced for specified reservoirs. In the event that a reservoir could cause a flood after an uncontrolled release of water, it is important that arrangements are in place so that emergency services and local authorities can provide effective assistance.
The Environment Agency is now responsible for the Enforcement Authority of the Reservoirs Act 1975 in England and Wales. As well as the Environment Agency, the Health and Safety Executive and B&NES have a responsibility for regulating reservoirs.
Where people are at risk B&NES has a duty under the Building Regulations (1984) to serve notice on owners if the structure is deemed unsafe.
B&NES SFRA (April 2008) Volume I - Technical Report
11-6
Flooding from artificial sources
Planning considerations
The Environment Agency Flood Map does not include flooding from artificial sources, however PPS25 requires that consideration be given to other forms of flooding during the decision making process. Assessments of artificial sources of flooding are therefore needed.
A probabilistic approach to artificial sources of flooding is not entirely suitable due to the low probability of such flooding occurring, but extreme consequences. Instead, an overall risk assessment should be undertaken which considers both probability and consequences.
Further collation of all relevant data, such as asset information, measured water levels, operating regimes, past history and photographs of events and consultation with operating authorities should be undertaken when preparing more detailed assessments.
More specifically, factors that should be taken into account during these detailed assessments are;
• the probable area liable to flooding
• the extent, standard and effectiveness of existing impoundment structures
• the likely depth of flooding
• the likely velocity of flooding
• any likely cascade effects
• the possible effects of climate change.
A risk-based approach is strongly recommended. Consideration of hydrological and geotechnical factors should be undertaken to determine the probability and consequences of failure when making land use allocation decisions.
This source of flooding should also be considered during development control, with appropriate measures included in building design.
B&NES SFRA (April 2008) Volume I - Technical Report
11-7
Glossary and notation
12. Glossary and notation
The B&NES SFRA is a 'live' document. The current version has been developed using the best information and concepts available at the time. As new information and concepts become available the document will be updated and so it is the responsibility of the reader to be satisfied that they are using the most up-to-date information and that the SFRA accounts for this information. All revisions to this summary document are listed in the table.
Version Issue Date Issued by Issued to
Final 23/04//2008 Capita Symonds
Ltd
B&NES, EA
B&NES SFRA (January 2008) Volume I - Technical Report
12-1
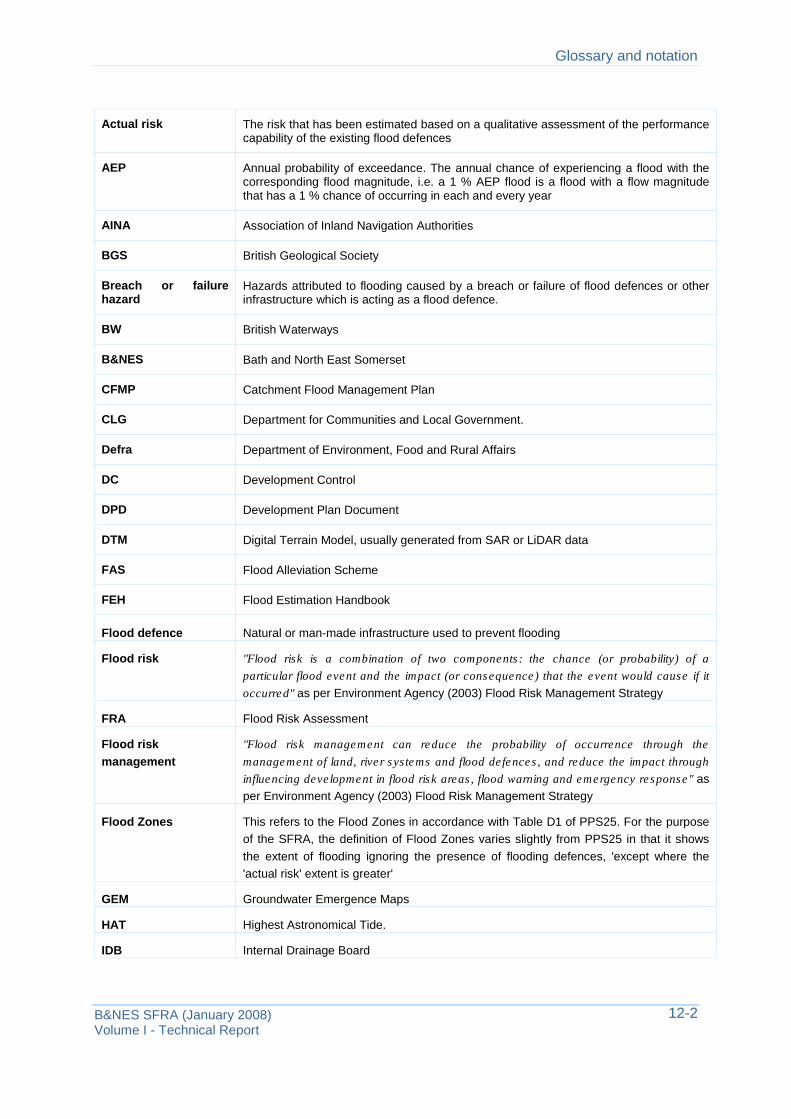
Glossary and notation
Actual risk The risk that has been estimated based on a qualitative assessment of the performance capability of the existing flood defences
AEP Annual probability of exceedance. The annual chance of experiencing a flood with the corresponding flood magnitude, i.e. a 1 % AEP flood is a flood with a flow magnitude that has a 1 % chance of occurring in each and every year
AINA Association of Inland Navigation Authorities
BGS British Geological Society
Breach or failure hazard
Hazards attributed to flooding caused by a breach or failure of flood defences or other infrastructure which is acting as a flood defence.
BW British Waterways
B&NES Bath and North East Somerset
CFMP Catchment Flood Management Plan
CLG Department for Communities and Local Government.
Defra Department of Environment, Food and Rural Affairs
DC Development Control
DPD Development Plan Document
DTM Digital Terrain Model, usually generated from SAR or LiDAR data
FAS Flood Alleviation Scheme
FEH Flood Estimation Handbook
Flood defence Natural or man-made infrastructure used to prevent flooding
Flood risk "Flood risk is a combination of two components: the chance (or probability) of a particular flood event and the impact (or consequence) that the event would cause if it occurred" as per Environment Agency (2003) Flood Risk Management Strategy
FRA Flood Risk Assessment
Flood risk management
"Flood risk management can reduce the probability of occurrence through the management of land, river systems and flood defences, and reduce the impact through influencing development in flood risk areas, flood warning and emergency response" as per Environment Agency (2003) Flood Risk Management Strategy
Flood Zones This refers to the Flood Zones in accordance with Table D1 of PPS25. For the purpose of the SFRA, the definition of Flood Zones varies slightly from PPS25 in that it shows the extent of flooding ignoring the presence of flooding defences, 'except where the 'actual risk' extent is greater'
GEM Groundwater Emergence Maps
HAT Highest Astronomical Tide.
IDB Internal Drainage Board
12-2 B&NES SFRA (January 2008) Volume I - Technical Report
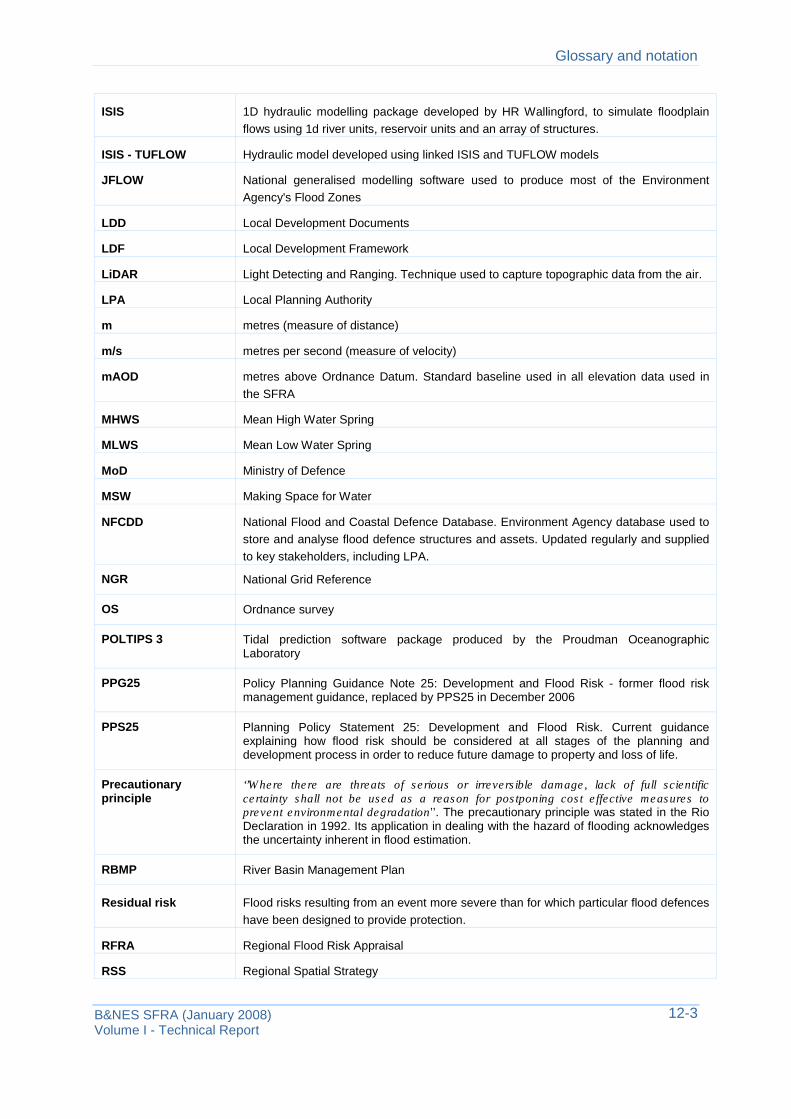
Glossary and notation
ISIS 1D hydraulic modelling package developed by HR Wallingford, to simulate floodplain flows using 1d river units, reservoir units and an array of structures.
ISIS - TUFLOW Hydraulic model developed using linked ISIS and TUFLOW models
JFLOW National generalised modelling software used to produce most of the Environment Agency's Flood Zones
LDD Local Development Documents
LDF Local Development Framework
LiDAR Light Detecting and Ranging. Technique used to capture topographic data from the air.
LPA Local Planning Authority
m metres (measure of distance)
m/s metres per second (measure of velocity)
mAOD metres above Ordnance Datum. Standard baseline used in all elevation data used in the SFRA
MHWS Mean High Water Spring
MLWS Mean Low Water Spring
MoD Ministry of Defence
MSW Making Space for Water
NFCDD National Flood and Coastal Defence Database. Environment Agency database used to store and analyse flood defence structures and assets. Updated regularly and supplied to key stakeholders, including LPA.
NGR National Grid Reference
OS Ordnance survey
POLTIPS 3 Tidal prediction software package produced by the Proudman Oceanographic Laboratory
PPG25 Policy Planning Guidance Note 25: Development and Flood Risk - former flood risk management guidance, replaced by PPS25 in December 2006
PPS25 Planning Policy Statement 25: Development and Flood Risk. Current guidance explaining how flood risk should be considered at all stages of the planning and development process in order to reduce future damage to property and loss of life.
Precautionary principle
‘’Where there are threats of serious or irreversible damage, lack of full scientific certainty shall not be used as a reason for postponing cost effective measures to prevent environmental degradation’’. The precautionary principle was stated in the Rio Declaration in 1992. Its application in dealing with the hazard of flooding acknowledges the uncertainty inherent in flood estimation.
RBMP River Basin Management Plan
Residual risk Flood risks resulting from an event more severe than for which particular flood defences have been designed to provide protection.
RFRA Regional Flood Risk Appraisal
RSS Regional Spatial Strategy
12-3 B&NES SFRA (January 2008) Volume I - Technical Report
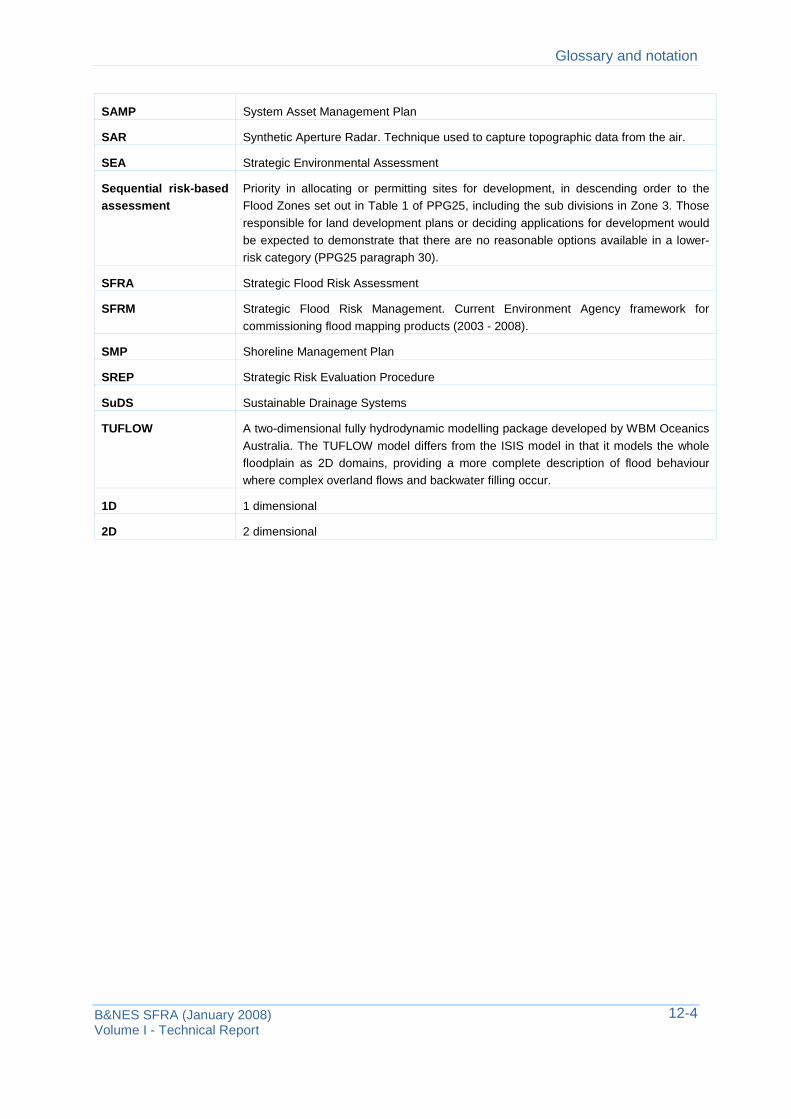
Glossary and notation
SAMP System Asset Management Plan
SAR Synthetic Aperture Radar. Technique used to capture topographic data from the air.
SEA Strategic Environmental Assessment
Sequential risk-based assessment
Priority in allocating or permitting sites for development, in descending order to the Flood Zones set out in Table 1 of PPG25, including the sub divisions in Zone 3. Those responsible for land development plans or deciding applications for development would be expected to demonstrate that there are no reasonable options available in a lower-risk category (PPG25 paragraph 30).
SFRA Strategic Flood Risk Assessment
SFRM Strategic Flood Risk Management. Current Environment Agency framework for commissioning flood mapping products (2003 - 2008).
SMP Shoreline Management Plan
SREP Strategic Risk Evaluation Procedure
SuDS Sustainable Drainage Systems
TUFLOW A two-dimensional fully hydrodynamic modelling package developed by WBM Oceanics Australia. The TUFLOW model differs from the ISIS model in that it models the whole floodplain as 2D domains, providing a more complete description of flood behaviour where complex overland flows and backwater filling occur.
1D 1 dimensional
2D 2 dimensional
12-4 B&NES SFRA (January 2008) Volume I - Technical Report