batlivala & karani - b&k securities€¦ · · 2016-06-13continued pressure on...
TRANSCRIPT

Continued pressure on realisations taking toll on performance...
Ferrous: The companies under our coverage set reported average revenue de-growth of ~3% and
~20% on QoQ and YoY basis, respectively, primarily on account of lower realisations (Rs 1,500-
2,000/tonnes lower QoQ). Volumes for most of the companies were flat to marginally higher on QoQ
basis. Though some companies did witness some benefits from lower iron ore and coking coal prices,
fall in realisation more than outweighed the positive impact, thus hurting the operating performance.
The implied benefits of the safeguard duty on HRC of 20% to Indian manufacturers have been wiped
off by further fall in Chinese steel prices. 3QFY16 would witness a further fall in steel prices of Rs
500-1000/tonne QoQ. Demand scenario continues to remain weak, thus we do not see growth in
steel volumes to happen before FY17.
Non-ferrous: Prices continue to remain under pressure. LME prices in 2Q for aluminium, zinc, lead
and copper fell sequentially by 9%, 15%, 12% and 13%, respectively. The fall in realisations were
further aggravated due to decline in premia (aluminium 2Q average was US$ 100/tonne lower QoQ).
All the companies under coverage reported better volumes sequentially. Higher volumes, improved
product mix, better availability of e-auction coal and Rupee depreciation of ~2% arrested the fall in
EBITDA to some extent for this sector. 3Q realisation would be further lower QoQ (3Q average for
aluminium, zinc, lead and copper till date is down by 6%,9%,2% and 4%, respectively over 2Q). 2H
volumes are expected to better than 1H (major maintenance shutdowns are over in 1H). Premia and
Rupee has witnessed some stability off late. Expect volumes to protect profitability in 2H.
Pipes: The SAW pipe players under coverage have outperformed our expectation as they executed
better margins orders during the quarter. Seamless players continue to suffer from Chinese dumping
while stainless steel pipe players have also witnessed some slowdown in order booking. Falling crude
prices is making us cautious on the pace of new order book additions as many projects are getting
delayed or re-evaluated impacting the visibility beyond FY17. In India, government thrust on
infrastructure and water management would drive the demand for HSAW as well as DI pipes (steadily
growing). However, we expect increasing competitive intensity (JSAW operating PSL’s mill)
in HSAW business. This coupled with delays in global orders execution are expected to put pressure
on EBITDA/tonne going forward. Stay cautious on the outlook for this sector.
Top pick – Nalco: Higher alumina sales (insulated from fluctuations in metal premiums) through
ramping up of existing facility and commissioning of ~1.0 mn tpa alumina plant over the next three-
four years is expected to drive earnings growth for the company. This backed by strong balance sheet,
with stable net cash of ~Rs 24/share in FY17 (despite planned capex), dividend yield of ~5% and
attractive valuation of 3.7x FY17E EV/EBITDA and 2.8x FY18E EV/EBITDA (5-year mean for
one-year forward EV/EBITDA stands at 8.2x), keeps us upbeat on this company. Maintain Buy with
a target price of Rs 50 (6.5x FY17E EV/EBITDA and 5.0x FY18E EV/EBITDA).
Upgrades/Downgrades: We have downgraded Tata Steel, JSW Steel, SAIL and Godawari to
Outperformer, Underperformer, Sell and Underperformer respectively due to earnings cuts lead by
higher than expected fall in realisations.
SECTOR UPDATE
Batlivala & Karani26 November 2015
Metals – 2QFY16 Results Review
Parin Tanna Vikash [email protected] [email protected]+91-22-4031 7129 +91-22-4031 7173

2METALS – 2QFY16 RESULTS REVIEW
B&K RESEARCH NOVEMBER 2015
Index ...................................................................... Page No.
Ferrous sector ................................................................ 3-20
Tata Steel .................................................................................................. 5
JSW Steel .................................................................................................. 7
Jindal Steel & Power ................................................................................. 9
Steel Authority of India ......................................................................... 11
NMDC ................................................................................................... 13
Godawari Power & Ispat ........................................................................ 15
Monnet Ispat & Energy .......................................................................... 17
Usha Martin ........................................................................................... 19
Non-ferrous sector ....................................................... 21-30
Vedanta ................................................................................................... 22
Hindalco ................................................................................................. 25
Hindustan Zinc ....................................................................................... 27
Nalco ...................................................................................................... 29
Pipes ........................................................................... 31-40
Jindal SAW ............................................................................................. 32
Welspun Corp ........................................................................................ 34
Ratnamani Metals & Tubes .................................................................... 36
Maharashtra Seamless ............................................................................ 38
Change in estimates ..................................................... 40-43
Ferrous ................................................................................................... 40
Non-ferrous ........................................................................................... 42
Pipes ....................................................................................................... 43
Valuation matrix .............................................................. 44

3METALS – 2QFY16 RESULTS REVIEW
B&K RESEARCH NOVEMBER 2015
Realis ation growth (QoQ)
(10)(8)
(6)(4)
(2)
02
46
8
2QFY
14
3QFY
14
4QFY
14
1QFY
15
2QFY
15
3QFY
15
4QFY
15
1QFY
16
2QFY
16
%
Volume growth (QoQ)
(20)
(15)
(10)
(5)
0
5
10
15
20
2QFY
14
3QFY
14
4QFY
14
1QFY
15
2QFY
15
3QFY
15
4QFY
15
1QFY
16
2QFY
16
%
(40)
(30)
(20)
(10)
0
10
20
2QFY
14
3QFY
14
4QFY
14
1QFY
15
2QFY
15
3QFY
15
4QFY
15
1QFY
16
2QFY
16
%
(100)
(50)
0
50
100
%
Revenue EBITDA PAT (RHS)
Ferrous
Performance at a glance
2Q is traditionally a weak quarter for steel sector. However, persistent imports and falling
realisations have aggravated the fall in operating performance. The companies under our
coverage universe reported aggregated revenue fall of ~3% on QoQ basis primarily on
account of fall in realisations. The average realisation across companies witnessed a fall of
~6% while volumes for most of the companies were flat to marginally better. Ex-NMDC,
the volumes under our coverage set reported ~1% increase on QoQ basis.
Underperformance at the EBITDA coupled with higher interest charges owing to
commissioning of facilities leads to significant erosion in profits. The 8 ferrous companies
under coverage reported aggregated net loss (adjusted) of Rs 12.3 bn against net profit of
Rs 6.5 bn in 1QFY16 and Rs 37.5 bn in 2QFY15. A large part of the loss was contributed
by SAIL which reported net loss of Rs 10.6 bn.
Realisation, EBITDA and PAT growth trend
Source: Company, B&K Research
Steep fall in realisations andhigher than expected rawmaterial incidence, impactedthe EBITDA
Volumes and realisation trend for the sector
Source: Company, B&K Research
Movement in costs
The raw material incidence has been higher sequentially as well as against our expectation.
The benefits of falling raw material prices was lower than expectation as many companies
had old inventories this coupled with disruption in captive mining has inflated the cost for
the players. Commissioning of new plants has led to increase in other manufacturing costs.

4METALS – 2QFY16 RESULTS REVIEW
B&K RESEARCH NOVEMBER 2015
EBITDA/tonne growth (QoQ)
(40)
(30)
(20)
(10)
0
10
20
2QFY
14
3QFY
14
4QFY
14
1QFY
15
2QFY
15
3QFY
15
4QFY
15
1QFY
16
2QFY
16
%
Cost incidence
% of sales 2QFY14 3QFY14 4QFY14 1QFY15 2QFY15 3QFY15 4QFY15 1QFY16 2QFY16
Raw material 43.5 41.7 44.6 39.9 39.7 40.1 41.1 40.4 41.8
Employee cost 11.9 11.1 10.6 12.4 12.0 11.9 13.3 13.7 14.2
Manufacturing and others 28.5 29.6 26.9 28.6 30.3 31.2 33.4 33.7 35.2
Fall in realisation weigh down on EBITDA/tonne
The companies under our coverage universe reported a 35% sequential fall in EBITDA/
tonne primarily on falling realisations. The fall in EBITDA/tonne was aggravated on account
of one of the worst performance of SAIL (reported EBITDA/tonne loss of Rs 3,800
against EBITDA/tonne loss of Rs 304 in 1Q). Ex-SAIL, the fall in EBITDA/tonne stood
at ~21%.
EBITDA/tonne growth
Source: Company, B&K Research
EBITDA/tonne continues toremain under pressure
EBITDA/tonne
(Rs/tonne) 2QFY14 3QFY14 4QFY14 1QFY15 2QFY15 3QFY15 4QFY15 1QFY16 2QFY16 3QFY16E 4QFY16E
Tata Steel India 14,402 14,210 17,049 15,504 14,664 9,295 6,972 7,880 7,979 6,621 6,682
Tata Steel Europe (US$) 25 32 32 52 46 64 44 26 (11) (3) 15
JSW Steel 7,137 7,478 8,052 8,545 8,534 6,988 5,469 4,838 4,908 4,511 4,741
Jindal Steel & Power 7,130 9,783 8,944 13,927 10,066 11,636 7,922 7,523 5,372 6,939 7,450
SAIL 2,870 3,799 3,539 4,101 4,553 4,224 2,943 (304) (3,828) (2,658) (1,144)
NMDC 2,280 2,607 2,572 2,798 2,761 2,791 1,846 1,658 1,397 1,132 1,231
Source: B&K Research

5METALS – 2QFY16 RESULTS REVIEW
B&K RESEARCH NOVEMBER 2015
Tata Steel Downgrade to Outperformer
Looses at European operations to continue...
2QFY16 performance: Tata Steel consolidated operating results (EBITDA came in at
Rs 18.3 bn versus our expectation of Rs 25.3 bn) were much lower than our expectation
on account of underperformance of the Tata Steel Europe (EBITDA loss at Rs 2.4 bn
versus our expectation of profit of Rs 5.8 bn owing to lower volumes) and other subsidiaries
(EBITDA of Rs 1.3 bn versus our expectation of Rs 4 bn).
Other highlights and key takeaways from concalls
3Q expectations: Tata Steel India realisations are expected to be Rs 1,000-1,500/tonne
lower. Higher raw material cost (disruption in captive iron ore mine) would impact the
EBITDA/tonne. However, we expect EBITDA losses to be lower for Corus owing to lower
raw material incidence. Overall, we expect 3Q EBITDA to be marginally better QoQ.
Ferro Chrome unit has re-started. The company expects this unit to report EBITDA of Rs
8 bn annually.
UK Steel assets value written down: The company has written down the UK assets
value to its bare minimum considering the current weak environment (Rs 77.7 bn impairment
charges). It is now evaluating viability of Canada iron ore project.
Outlook and valuation
Outlook for the steel industry continues to remain weak. The pressure on steel prices due
to falling international prices, higher imports coupled with weak domestic demand outlook
hurt the profitability of the sector. In the current scenario, Tata Steel India is poised well to
deliver volume led growth over a medium term. Kalinganagar operations are now expected
to commission by 4QFY16 (earlier expected to commission in end 2QFY16). Problems for
its iron ore procurement from its captive mines have been resolved. Tata Steel Europe
continues to face problems due to weak demand outlook in UK (partially magnified due to
higher imports). Delay in commissioning of Kalinganagar project (we had assumed 0.3 mn
tonnes of volumes which would now only come in FY17) and given the dismal performance
of Tata Steel Europe, we have reduced our FY16 and FY17 EBITDA/tonne from US$
41.7 and US$ 45 to US$ 7.7 and US$ 18.0, respectively. At the same time, we have changed
our INR call from 62 to 65. Consequently our FY16 and FY17 EBITDA stands downward
revised by 20% and 5%, respectively.
We are also introducing our FY18 numbers where we are expecting FY18 EBITDA to
grow by 19% primarily on account of better volumes and marginally better realisations. We
are valuing the company on FY17 earnings. On our revised numbers we arrive at a target
price of Rs 255 (6.3x FY17E EV/EBITDA). Downgrade the stock to Outperformer, given
there is limited upside for the stock.
LARGE CAP
Share Data
Price (Rs) 224
BSE Sensex 25,776
Reuters code TISC.BO
Bloomberg code TATA IN
Market cap. (US$ mn) 3,282
6M avg. daily turnover (US$ mn) 26.5
Issued shares (mn) 971
Target price (Rs) 255
Performance (%) 1M 3M 12M
Absolute (9) 9 (53)
Relative (3) 9 (48)
Valuation Ratios
Yr to 31 Mar FY17E FY18E
EPS (Rs) 9.1 27.0
+/- (%) – 195.8
PER (x) 24.6 8.3
PBV (x) 0.6 0.6
Dividend/Yield (%) 4.0 4.0
EV/Sales (x) 0.7 0.6
EV/EBITDA (x) 6.0 4.8
Major shareholders (%)
Promoters 31
FIIs 14
MFs 5
BFSI's 21
Public & Others 29
Relative performance
0
200
400
600
800
1,000
Apr
-07
Apr
-08
Jun-
09
Jun-
10
Jul-1
1
Aug
-12
Sep-
13
Oct
-14
Nov
-15
Tata Steel (Actual)Sensex

6METALS – 2QFY16 RESULTS REVIEW
B&K RESEARCH NOVEMBER 2015
Tata Steel
Valuations
Period end (x) Mar 15 Mar 16E Mar 17E Mar 18E
PER 9,768.1 (131.6) 24.6 8.3
PCE 5.2 3.7 2.8 2.2
Price/Book 0.9 0.6 0.6 0.6
Yield (%) 2.5 4.0 4.0 4.0
EV/EBITDA 8.1 8.1 6.0 4.8
Key Ratios
Period end (%) Mar 15 Mar 16E Mar 17E Mar 18E
Adjusted EPS (Rs) 0.0 (1.7) 9.1 27.0
Growth (99.9) (5,358.8) (635.0) 195.8
CEPS (Rs) 61.2 61.0 81.3 103.1
Book NAV/share (Rs) 346.1 357.1 353.9 368.5
Dividend/share (Rs) 8.0 9.0 9.0 9.0
Dividend payout ratio (24.0) 46.2 110.5 37.4
EBITDA margin 9.1 9.0 11.4 12.7
EBIT margin 5.4 4.6 6.6 7.9
Tax Rate 101.1 105.2 59.6 40.7
RoCE 5.6 4.4 6.7 8.6
Total debt/Equity (x) 2.3 2.1 2.1 2.0
Net debt/Equity (x) 2.0 1.8 1.8 1.6
Du Pont Analysis - ROE
Net margin 0.0 (0.1) 0.7 1.9
Asset turnover (x) 0.8 0.8 0.8 0.8
Leverage factor (x) 4.3 4.6 4.6 4.7
Return on equity 0.0 (0.5) 2.6 7.5
Cash Flow Statement
Period end (Rs mn) Mar 15 Mar 16E Mar 17E Mar 18E
Profit before Tax (13,881) 36,639 24,462 45,950
Depreciation 59,436 61,042 70,246 (74,099)
Change in working capital 39,306 100,247 25,391 18,229
Total tax paid (23,665) (22,571) (13,585) (17,689)
Others 48,478 43,647 60,305 137,177
Cash flow from oper. (a) 109,673 219,005 166,820 183,127
Capital expenditure (27,508) (111,531) (96,524) (55,424)
Change in investments 16,384 (2,080) (2,288) (2,517)
Others (7,256) (140) (142) (143)
Cash flow from inv. (b) (18,380) (113,752) (98,954) (58,084)
Free cash flow (a+b) 91,293 105,253 67,866 125,042
Equity raised/(repaid) 104 956 0 0
Debt raised/(repaid) (8,918) (28,790) (13,609) (6,496)
Dividend (incl. tax) (11,355) (18,095) (9,809) (9,809)
Others (69,669) (44,363) (61,535) (63,765)
Cash flow from fin. (c) (89,839) (90,292) (84,953) (80,071)
Net chg in cash (a+b+c) 1,454 14,961 (17,087) 44,972
Income Statement
Period end (Rs mn) Mar 15 Mar 16E Mar 17E Mar 18E
Net Sales 1,370,133 1,209,925 1,283,042 1,370,054
Growth (%) (5.9) (11.7) 6.0 6.8
Operating expenses (1,269,680) (1,121,623) (1,157,029) (1,216,468)
Operating profit 100,454 88,302 126,013 153,586
Other operating income 24,904 20,000 20,000 20,000
EBITDA 125,358 108,302 146,013 173,586
Growth (%) (23.6) (13.6) 34.8 18.9
Depreciation (59,436) (61,042) (70,246) (74,099)
Other income 7,962 9,000 9,000 9,001
EBIT 73,883 56,260 84,768 108,488
Finance Cost (48,478) (43,647) (60,305) (62,538)
Exceptional & Extraordinary (39,287) 24,027 0 0
Profit before tax (13,881) 36,639 24,462 45,950
Tax (current + deferred) (25,674) (13,272) (14,584) (18,688)
P/(L) for the period (39,555) 23,367 9,878 27,262
P/L of Associates, 300 (1,000) (1,000) (1,000)Min Int, Pref Div
Reported Profit/(Loss) (39,255) 22,367 8,878 26,262
Adjusted Net profit 32 (1,659) 8,878 26,262
Growth (%) (99.9) (5,368.2) (635.0) 195.8
Balance Sheet
Period end (Rs mn) Mar 15 Mar 16E Mar 17E Mar 18E
Share Capital 9,714 9,732 9,732 9,732
Reserves & surplus 326,530 337,795 334,633 348,858
Shareholders' funds 336,244 347,526 344,365 358,589
Minority Int, Share Appl, 17,239 17,239 17,239 17,239Pref Capital
Non-Current Liabilities 777,711 778,211 783,712 789,213
Long-term borrowings 656,752 651,752 651,752 651,752
Other Long term liab, Prov, DTL 120,959 126,459 131,960 137,461
Current liabilities 458,261 436,216 470,413 506,090
Short-term borrowings, 149,185 125,395 111,786 105,290Curr Maturity
Other Current Liab + Provi 309,077 310,821 358,627 400,800
Total (Equity and Liab.) 1,589,455 1,579,192 1,615,729 1,671,131
Non-current assets 1,053,508 1,102,655 1,134,257 1,121,314
Fixed assets (Net block) 833,709 884,198 910,476 891,801
Non-current Investments 20,804 22,885 25,173 27,691
Long-term loans and advances 50,655 46,798 49,691 52,761
Other non-current assets, 148,340 148,774 148,916 149,061DTA, Goodwill
Current assets 535,947 476,537 481,472 549,818
Cash & Current Investment 101,246 116,207 99,119 144,091
Other current assets 434,702 360,331 382,353 405,727
Total (Assets) 1,589,455 1,579,192 1,615,729 1,671,131
Total Debt 805,937 777,147 763,538 757,042
Capital Employed 1,280,379 1,268,371 1,257,102 1,270,331

7METALS – 2QFY16 RESULTS REVIEW
B&K RESEARCH NOVEMBER 2015
JSW Steel Downgrade to Underperformer
Pure converters play...
2QFY16 performance
JSW Steel (standalone) reported operating performance better than our expectation. Higher
volumes (3.19 mn tonnes, ~3% better than expectation) and lower raw material incidence
(iron ore prices lower than our expectation) are the primarily reason for the outperformance.
EBITDA came in at Rs 15.6 bn versus our estimate of Rs 13.4 bn. EBITDA per tonne
stood at Rs 4,908 (B&K estimate was at Rs 4,318) marginally higher from Rs 4,838/tonne
in 1QFY16.
Other highlights and key takeaways from concalls
3Q performance: We expect volume (~2% lower) and realisations (~Rs 500/tonne) to
be lower sequentially. However, the fall in EBITDA/tonne would be lower owing to benefits
of lower raw material incidence.
Volume guidance maintained: JSW is taking planned shutdown in all of its plants
during 3Q in phases to increase the capacity to 18 mn tonnes by 4QFY16. However, full
year production and sales guidance was maintained at 13.4 mn tonnes and 12.9 mn tonnes,
respectively (we have taken 12.6 mn tonnes of sales in FY16).
Debt and Capex: The current consolidated net debt stood at ~Rs 390 bn. JSW maintained
capex guidance at ~Rs 90 bn in the next couple of years (Rs 52 bn in FY16) to increase
Vijayanagar and Dolvi capacity by around ~2 mn tpa each.
Outlook and valuation
Expansion at Dolvi and Vijayanagar are expected to aid volume driven growth over the
next couple of years. Improving integration at Dolvi unit coupled with softening in raw
material prices (increasing supplies with opening of more iron ore mines and falling coking
coal prices) would augur well for the company. Continuous fall in global steel prices would
hurt the profitability of the Indian domestic steel producers in the medium term. The net
exports from China has moved up by ~32% YoY (for first 10 months), is a threat to the
global steel industry.
Due to continuous pressure on realisation on account of imports and subdued demand, we
have reduced our FY16 and FY17 realisation estimates by 3% and 7%, respectively, versus
our previous estimates. Consequently, our FY16 and FY17 EBITDA estimates are down by
~22% and ~20%, respectively. We are also introducing our FY18 numbers where we are
expecting FY18 EBITDA to grow by 16% primarily on account of better volumes and
marginally better realisations. On our revised numbers we arrive at a target price of Rs 825
(6.5x FY17E EV/EBITDA and 5.6x FY18E EV/EBITDA).
LARGE CAP
Share Data
Price (Rs) 887
BSE Sensex 25,776
Reuters code JSTL.BO
Bloomberg code JSTL IN
Market cap. (US$ mn) 3,229
6M avg. daily turnover (US$ mn) 11.5
Issued shares (mn) 242
Target price (Rs) 825
Performance (%) 1M 3M 12M
Absolute (3) 2 (27)
Relative 3 2 (20)
Valuation Ratios
Yr to 31 Mar FY17E FY18E
EPS (Rs) 63.9 94.3
+/- (%) 1,049.1 47.6
PER (x) 13.9 9.4
PBV (x) 0.9 0.8
Dividend/Yield (%) 0.1 0.1
EV/Sales (x) 1.2 1.0
EV/EBITDA (x) 6.7 5.6
Major shareholders (%)
Promoters 41
GOI 1
FIIs 17
MFs 3
BFSI's 2
Public & Others 36
Relative performance
0200400600800
1,0001,2001,4001,600
Apr
-07
Apr
-08
Jun-
09
Jun-
10
Jul-1
1
Aug
-12
Sep-
13
Oct
-14
Nov
-15
JSW Steel (Actual)Sensex

8METALS – 2QFY16 RESULTS REVIEW
B&K RESEARCH NOVEMBER 2015
JSW Steel
Valuations
Period end (x) Mar 15 Mar 16E Mar 17E Mar 18E
PER 11.9 159.4 13.9 9.4
PCE 4.2 6.6 4.4 3.7
Price/Book 1.0 1.0 0.9 0.8
Yield (%) 1.2 0.1 0.1 0.1
EV/EBITDA 6.2 9.3 6.7 5.6
Key Ratios
Period end (%) Mar 15 Mar 16E Mar 17E Mar 18E
Adjusted EPS (Rs) 76.3 5.6 63.9 94.3
Growth (14.8) (92.7) 1,049.1 47.6
CEPS (Rs) 218.4 135.3 202.2 240.0
Book NAV/share (Rs) 919.6 921.5 981.7 1,071.7
Dividend/share (Rs) 11.0 0.5 0.5 1.0
Dividend payout ratio 18.1 10.4 0.9 1.2
EBITDA margin 18.1 14.3 17.6 17.5
EBIT margin 11.7 8.2 11.8 12.2
Tax rate 31.7 33.0 33.0 33.0
RoCE 9.7 5.6 8.9 10.2
Total debt/Equity (x) 1.7 1.8 1.7 1.6
Net debt/Equity (x) 1.6 1.7 1.6 1.4
Du Pont Analysis - ROE
Net margin 3.5 0.3 3.0 3.8
Asset turnover (x) 0.6 0.5 0.6 0.7
Leverage factor (x) 3.8 3.8 3.7 3.7
Return on equity 8.5 0.6 6.7 9.2
Cash Flow Statement
Period end (Rs mn) Mar 15 Mar 16E Mar 17E Mar 18E
Profit before tax 25,391 4,171 25,218 36,194
Depreciation 34,345 31,362 33,426 35,205
Change in working capital 3,193 (16,766) (13,518) (3,028)
Total tax paid (695) 3,639 (668) (6,943)
Others 33,816 29,515 31,991 34,105
Cash flow from oper. (a) 96,050 51,921 76,449 95,532
Capital expenditure (70,076) (51,078) (40,250) (46,500)
Change in investments 635 0 0 0
Others (1,392) 6,036 3,499 3,501
Cash flow from inv. (b) (70,833) (45,042) (36,751) (42,999)
Free cash flow (a+b) 25,216 6,878 39,698 52,533
Equity raised/(repaid) (0) 0 0 0
Debt raised/(repaid) 32,277 15,018 10,000 15,001
Dividend (incl. tax) (3,158) (3,257) (140) (140)
Others (41,833) (34,874) (37,332) (39,428)
Cash flow from fin. (c) (12,714) (23,113) (27,472) (24,567)
Net chg in cash (a+b+c) 12,503 (16,235) 12,226 27,966
Income Statement
Period end (Rs mn) Mar 15 Mar 16E Mar 17E Mar 18E
Net sales 520,506 454,612 514,119 604,476
Growth (%) 3.3 (12.7) 13.1 17.6
Operating expenses (435,692) (393,989) (428,410) (503,900)
Operating profit 84,813 60,622 85,709 100,576
Other operating income 9,209 4,425 4,926 4,927
EBITDA 94,023 65,047 90,635 105,503
Growth (%) 2.6 (30.8) 39.3 16.4
Depreciation (34,345) (31,362) (33,426) (35,205)
Other income 1,114 3,500 3,500 3,501
EBIT 60,792 37,186 60,709 73,800
Finance cost (34,930) (33,015) (35,491) (37,606)
Exceptional & extraordinary (471) 0 0 0
Profit before tax 25,391 4,171 25,218 36,194
Tax (current + deferred) (8,194) (1,376) (8,322) (11,944)
P/(L) for the period 17,197 2,794 16,896 24,250
P/L of Associates, 769 (1,450) (1,450) (1,450)Min Int, Pref Div
Reported Profit/(Loss) 17,966 1,344 15,446 22,800
Adjusted net profit 18,437 1,344 15,446 22,800
Growth (%) (14.8) (92.7) 1,049.1 47.6
Balance Sheet
Period end (Rs mn) Mar 15 Mar 16E Mar 17E Mar 18E
Share capital 2,417 2,417 2,417 2,417
Reserves & surplus 219,869 220,320 234,873 256,640
Shareholders' funds 222,286 222,737 237,290 259,057
Minority Interest and others 9,231 9,280 9,331 9,385
Non-current liabilities 375,126 395,484 410,843 431,219
Long-term borrowings 336,766 351,784 361,784 376,784
Other non-current liabilities 38,360 43,700 49,059 54,435
Current liabilities 252,549 192,121 211,399 246,539
ST borrowings, Curr maturity 43,132 43,132 43,132 43,133
Other current liabilities 209,417 148,989 168,267 203,406
Total (Equity and Liab.) 859,192 819,622 868,863 946,200
Non-current assets 671,019 681,201 700,477 722,912
Fixed assets (Net block) 588,562 608,279 615,103 626,398
Non-current Investments 5,990 5,990 5,990 5,990
Long-term loans and advances 55,279 48,281 63,385 74,524
Other non-current assets 21,188 18,652 16,000 16,000
Current assets 188,173 138,421 168,386 223,288
Cash & current investment 19,136 2,900 15,127 43,093
Other current assets 169,038 135,520 153,259 180,195
Total (Assets) 859,192 819,622 868,863 946,200
Total debt 379,898 394,916 404,916 419,917
Capital employed 649,775 670,633 700,596 742,794

9METALS – 2QFY16 RESULTS REVIEW
B&K RESEARCH NOVEMBER 2015
Jindal Steel & Power Under Review
Lack of integration continues to hurt the performance...
2QFY16 performance
Jindal Steel & Power (JSPL) reported consolidated EBITDA (Rs 10.1 bn) broadly in line
with expectation despite lower revenues. Underperformance of JPL (reported EBITDA
of Rs 1.68 bn versus our expectation of Rs 2.56 on account of higher coal cost) was largely
compensated by better performance of other subsidiaries.
Other highlights and key takeaways from concalls
3Q performance: We expect 3Q performance to be largely flat to marginally lower. As
better volumes/product mix and lower raw material incidence is expected to largely
compensate for the fall in realisations. The company is increasing its focus on retail segment
to drive the growth.
Transferring all power assets under one roof: JSPL board has approved the transfer
of 920 MW captive power capacity situated at Angul, Odisha (6x135 MW) and at Raigarh,
Chhattisgarh (2x55 MW) to JPL at a fair market value determined by an independent
valuer appointed by the Board.
Opting for 5/25 scheme: JSPL is looking to re-structure its debt through 5/25 scheme.
JPL has already received the necessary approvals.
Outlook and valuation
Outlook for the steel industry continues to remain weak. The pressure on steel prices due
lower international prices and higher imports coupled with weak domestic demand outlook
hurt the profitability of the sector. Ramping up of Angul, Oman and Tamnar II would
provide volume led growth to the company going forward. Better utilisations of facilities
coupled with the benefits of lower raw material prices are expected to aid the operating
performance of the company. Despite, the fundamental volume growth story being intact,
it is still difficult to attribute discount to the fair value multiple because of the regulatory
concerns and uncertainties. Therefore, we would like to maintain our Under Review stance
on the company. As and when some clarity emerges on regulatory front, we would bring the
stock back under rating. Given the challenging market scenario, we are reducing our
consolidated FY16 and FY17 EBITDA estimates by ~10% and ~12%, respectively. The
fall was primarily on account of steel business (lower realisation a in both, standalone and
Shadeed) which was marginally offset by better performance of other subsidiaries (South
Africa, Mozambique, Australia, etc). We are also introducing our FY18 numbers where we
are expecting FY18 EBITDA to grow by 30% primarily on account of better volumes
(power and steel) and marginally better realisations in steel business.
MID CAP
Share Data
Price (Rs) 86
BSE Sensex 25,776
Reuters code JNSP.BO
Bloomberg code JSP IN
Market cap. (US$ mn) 1,190
6M avg. daily turnover (US$ mn) 12.0
Issued shares (mn) 915
Performance (%) 1M 3M 12M
Absolute 13 27 (42)
Relative 20 27 (36)
Valuation Ratios
Yr to 31 Mar FY17E FY18E
EPS (Rs) (5.1) 10.0
PER (x) – 8.6
PBV (x) 0.4 0.4
Dividend/Yield (%) 1.2 2.3
EV/Sales (x) 1.9 1.6
EV/EBITDA (x) 9.2 7.1
Major shareholders (%)
Promoters 62
FIIs 17
MFs 1
BFSI's 2
Public & Others 18
Relative performance
0
200
400
600
800
Apr
-07
Apr
-08
Jun-
09
Jun-
10
Jul-1
1
Aug
-12
Sep-
13
Oct
-14
Nov
-15
Jindal Steel & Power(Actual)Sensex

10METALS – 2QFY16 RESULTS REVIEW
B&K RESEARCH NOVEMBER 2015
Jindal Steel & Power
Valuations
Period end (x) Mar 15P Mar 16E Mar 17E Mar 18E
PER 22.6 (7.0) (16.9) 8.6
PCE 4.3 4.6 3.3 2.1
Price/Book 0.7 0.4 0.4 0.4
Yield (%) 0.0 0.6 1.2 2.3
EV/EBITDA 10.5 11.7 9.2 7.1
Key Ratios
Period end (%) Mar 15P Mar 16E Mar 17E Mar 18E
Adjusted EPS (Rs) 6.9 (12.4) (5.1) 10.0
Growth (66.8) (278.8) (58.6) (295.4)
CEPS (Rs) 36.8 18.6 26.2 41.1
Book NAV/share (Rs) 230.0 217.1 211.0 219.0
Dividend/share (Rs) 0.0 0.5 1.0 2.0
Dividend payout ratio 0.0 (4.1) (19.7) 20.2
EBITDA margin 28.1 19.8 20.2 21.8
EBIT margin 15.2 7.7 10.6 13.9
Tax rate 129.6 21.0 (14.1) 43.2
RoCE 4.5 2.3 4.1 6.6
Total debt/Equity (x) 2.1 2.2 2.2 2.0
Net debt/Equity (x) 2.0 1.9 2.0 2.0
Du Pont Analysis - ROE
Net margin 3.3 (5.6) (1.8) 2.9
Asset turnover (x) 0.3 0.3 0.3 0.4
Leverage factor (x) 3.4 3.8 4.1 4.2
Return on equity 2.9 (5.5) (2.4) 4.7
Cash Flow Statement
Period end (Rs mn) Mar 15P Mar 16E Mar 17E Mar 18E
Profit before tax (15,428) (16,987) (6,304) 10,831
Depreciation 27,328 28,359 28,630 28,480
Change in working capital 19,556 (10,450) (39,677) (32,104)
Total tax paid (46,449) 49,235 13,524 6,907
Others 25,837 32,589 34,390 33,680
Cash flow from oper. (a) 10,845 82,745 30,563 47,794
Capital expenditure (53,298) (16,271) (23,856) (20,077)
Change in investments (14,433) 0 0 0
Others (463) (47) (52) (57)
Cash flow from inv. (b) (68,194) (16,317) (23,908) (20,134)
Free cash flow (a+b) (57,349) 66,427 6,655 27,660
Equity raised/(repaid) 5 0 0 0
Debt raised/(repaid) 91,326 (4,367) (10,918) (10,918)
Dividend (incl. tax) (1,385) 0 (462) (923)
Others (31,359) (29,217) (30,472) (29,120)
Cash flow from fin. (c) 58,587 (33,584) (41,852) (40,961)
Net chg in cash (a+b+c) 1,238 32,843 (35,197) (13,301)
Income Statement
Period end (Rs mn) Mar 15P Mar 16E Mar 17E Mar 18E
Net sales 194,007 203,322 265,307 319,807
Growth (%) (3.0) 4.8 30.5 20.5
Operating expenses (139,409) (163,012) (211,741) (249,967)
Operating profit 54,598 40,310 53,566 69,841
EBITDA 54,598 40,310 53,566 69,841
Growth (%) 0.1 (26.2) 32.9 30.4
Depreciation (27,328) (28,359) (28,630) (28,480)
Other income 2,256 3,650 3,150 3,150
EBIT 29,526 15,601 28,086 44,510
Finance cost (25,837) (32,589) (34,390) (33,680)
Exceptional & extraordinary (19,116) 0 0 0
Profit before tax (15,428) (16,987) (6,304) 10,831
Tax (current + deferred) 882 3,571 (886) (4,678)
P/(L) for the period (14,546) (13,416) (7,190) 6,152
P/L of Associates, 1,765 2,086 2,503 3,004Min Int, Pref Div
Reported Profit/(Loss) (12,781) (11,330) (4,686) 9,156
Adjusted net profit 6,335 (11,330) (4,686) 9,156
Growth (%) (66.8) (278.8) (58.6) (295.4)
Balance Sheet
Period end (Rs mn) Mar 15P Mar 16E Mar 17E Mar 18E
Share capital 915 915 915 915
Reserves & surplus 209,506 197,714 192,105 199,415
Shareholders' funds 210,421 198,629 193,020 200,330
Minority Interest and others 8,573 9,430 10,373 11,410
Non-current liabilities 380,056 377,551 369,146 360,846
Long-term borrowings 353,996 349,996 339,996 329,996
Other non-current liabilities 26,061 27,556 29,150 30,850
Current liabilities 156,317 207,709 235,564 260,008
ST borrowings, Curr maturity 101,012 100,645 99,727 98,809
Other current liabilities 55,305 107,064 135,838 161,199
Total (Equity and Liab.) 755,366 793,319 808,103 832,595
Non-current assets 592,043 595,499 600,117 599,983
Fixed assets (Net block) 551,677 555,333 550,558 542,155
Non-current Investments 3,528 3,528 3,528 3,528
Long-term loans and advances 30,885 30,638 39,978 48,190
Other non-current assets 5,954 6,001 6,053 6,110
Current assets 163,323 197,820 207,986 232,612
Cash & current investment 25,715 58,558 23,361 10,061
Other current assets 137,608 139,262 184,624 222,551
Total (Assets) 755,366 793,319 808,103 832,595
Total debt 455,007 450,640 439,723 428,805
Capital employed 700,061 686,255 672,265 671,395

11METALS – 2QFY16 RESULTS REVIEW
B&K RESEARCH NOVEMBER 2015
Steel Authority of India Downgrade to SELL
No respite in sight...
2QFY16 performance
Steel Authority of India (SAIL) reported one of the worst operating performance in the
last 10 years. The company reported EBITDA losses higher than our expectation at Rs
10.5 bn (B&K expectation was Rs 2.3 bn) primarily due to higher raw material incidence
and other expenditure. Raw material incidence came in at 44% versus our expectation of
37.5%. The other expenditure was ~13% higher than our expectation and QoQ. Primarily
on account of Rs 2.8 bn DMF provision.
Other highlights and key takeaways from concalls
3Q performance: We expect realisations to be lower by ~Rs 1,000/tonne. Overall,
SAIL would continue to make EBITDA losses albeit lower owing to higher volumes and
savings on coking coal cost.
Lowered FY16 guidance: SAIL has given the production guidance of 14.0 mn tonnes
of saleable steel in FY16 a tad lower than previous guidance of 14.5-15.0 mn tonnes as
weak demand and rising inventories (3.1 mn tonnes of finished and semi) are hurting the
company.
Debt and Capex: The net debt as on 2Q end stood Rs 319 bn, ~Rs 22 bn higher
sequentially largely on account of capex of ~Rs 17 bn during the quarter. The company
plans to spend ~Rs 65 bn, as capex during FY16 (Rs 30 bn spent during 1H) lower than
earlier guidance of Rs 75 bn. Most of the facilities have been commissioned (except Bhilai
plant which would commission by March 2016).
Outlook and valuation
Outlook for the steel industry continues to remain weak. The pressure on steel prices is
expected to continue; safeguard duty does not seem to be helping given the Chinese HRC
prices have fallen by ~10% from the time safeguard duty was implemented to now. Thus,
the benefits that the steel companies could have achieved through execution of better
volumes (import substitution) and some price increases has all been washed out. A phased
commissioning of the new expansions is expected to drive volume going forward for SAIL.
The spread between raw material prices and domestic steel prices has narrowed substantially,
which is hurting the company’s overall performance at present. Given the dismal
performance, we have reduced our FY16 and FY17 volume guidance from 13.3 and 15.3
mn tonnes to 11.8 and 14.8 mn tonnes, respectively. We have also reduced our FY16 and
FY17 realisations by ~2% and ~4%, respectively. Thus, FY17 EBITDA stands downgraded
by 31%. We are also introducing our FY18 numbers where we are expecting FY18 EBITDA
to grow by 70% (lower base effect) primarily on account of better volumes and marginally
better realisations. We continue to remain negative on the SAIL. We thus we are downgrading
the stock to Sell with a revised target price of Rs 35 (15.3x FY17E EV/EBITDA and 8.9x
FY18E EV/EBITDA) from Rs 45 earlier.
LARGE CAP
Share Data
Price (Rs) 44
BSE Sensex 25,776
Reuters code SAIL.BO
Bloomberg code SAIL IN
Market cap. (US$ mn) 2,734
6M avg. daily turnover (US$ mn) 3.0
Issued shares (mn) 4,130
Target price (Rs) 35
Performance (%) 1M 3M 12M
Absolute (21) (13) (50)
Relative (16) (13) (44)
Valuation Ratios
Yr to 31 Mar FY17E FY18E
EPS (Rs) 0.9 5.5
+/- (%) – 506.6
PER (x) 48.3 8.0
PBV (x) 0.5 0.5
Dividend/Yield (%) 4.6 4.8
EV/Sales (x) 1.2 1.2
EV/EBITDA (x) 15.6 9.9
Major shareholders (%)
Promoters 75
FIIs 6
MFs 1
BFSI's 15
Public & Others 3
Relative performance
050
100150200250300350
Apr
-07
Apr
-08
Jun-
09
Jun-
10
Jul-1
1
Aug
-12
Sep-
13
Oct
-14
Nov
-15
SAIL (Actual)Sens ex

12METALS – 2QFY16 RESULTS REVIEW
B&K RESEARCH NOVEMBER 2015
Steel Authority of India
Valuations
Period end (x) Mar 15 Mar 16E Mar 17E Mar 18E
PER 13.3 (6.0) 48.3 8.0
PCE 7.2 (14.5) 7.4 3.9
Price/Book 0.6 0.5 0.5 0.5
Yield (%) 3.0 4.6 4.6 4.8
EV/EBITDA 12.1 (23.4) 15.6 9.9
Key Ratios
Period end (%) Mar 15 Mar 16E Mar 17E Mar 18E
Adjusted EPS (Rs) 5.1 (7.3) 0.9 5.5
Growth 7.6 – – 506.6
CEPS (Rs) 9.4 (3.0) 5.9 11.1
Book NAV/share (Rs) 105.3 95.8 94.3 97.3
Dividend/share (Rs) 2.0 2.0 2.0 2.1
Dividend payout ratio 47.4 (32.3) 256.9 44.5
EBITDA margin 10.1 (5.7) 8.0 11.8
EBIT margin 8.4 (8.6) 5.3 9.0
Tax Rate 11.3 41.5 15.0 15.0
RoCE 4.9 (4.1) 3.0 5.5
Total debt/Equity (x) 0.7 0.9 1.1 1.2
Net debt/Equity (x) 0.6 0.9 1.1 1.2
Du Pont Analysis - ROE
Net margin 4.6 (7.7) 0.8 4.0
Asset turnover (x) 0.5 0.4 0.5 0.5
Leverage factor (x) 2.2 2.4 2.7 2.9
Return on equity 4.9 (7.3) 1.0 5.8
Cash Flow Statement
Period end (Rs mn) Mar 15 Mar 16E Mar 17E Mar 18E
Profit before Tax 23,589 (51,708) 4,426 26,846
Depreciation 17,733 17,733 20,733 23,233
Change in working capital (11,778) 29,163 (4,467) (1,638)
Total tax paid 484 22,559 594 (2,707)
Others 6,763 82,093 32,187 37,990
Cash flow from oper. (a) 36,791 30,386 36,613 64,836
Capital expenditure (64,991) (81,343) (92,839) (95,352)
Change in investments (1,989) (92) (93) (94)
Others 5,781 3,406 3,916 3,643
Cash flow from inv. (b) (61,199) (78,029) (89,015) (91,803)
Free cash flow (a+b) (24,408) (47,644) (52,402) (26,967)
Debt raised/(repaid) 46,163 62,000 71,000 64,000
Dividend (incl. tax) (8,666) (6,123) (9,712) (9,905)
Others (18,597) (17,169) (21,335) (25,202)
Cash flow from fin. (c) 18,900 38,708 39,953 28,893
Net chg in cash (a+b+c) (5,507) (8,935) (12,449) 1,925
Income Statement
Period end (Rs mn) Mar 15 Mar 16E Mar 17E Mar 18E
Net Sales 452,081 392,829 490,752 574,013
Growth (%) (2.1) (13.1) 24.9 17.0
Operating expenses (411,451) (417,879) (453,979) (508,548)
Operating profit 40,629 (25,050) 36,773 65,466
Other operating income 5,027 2,500 2,500 2,500
EBITDA 45,656 (22,550) 39,273 67,966
Growth (%) 12.7 – – 73.1
Depreciation (17,733) (17,733) (20,733) (23,233)
Other income 10,208 6,618 7,428 7,155
EBIT 38,131 (33,665) 25,968 51,888
Finance Cost (14,542) (18,042) (21,542) (25,042)
Profit before tax 23,589 (51,708) 4,426 26,846
Tax (current + deferred) (2,662) 21,480 (664) (4,027)
P/(L) for the period 20,927 (30,227) 3,762 22,819
Reported Profit/(Loss) 20,927 (30,227) 3,762 22,819
Adjusted Net profit 20,927 (30,227) 3,762 22,819
Growth (%) 7.6 – – 506.6
Balance Sheet
Period end (Rs mn) Mar 15 Mar 16E Mar 17E Mar 18E
Share Capital 41,305 41,305 41,305 41,305
Reserves & surplus 393,743 354,359 348,382 360,598
Shareholders' funds 435,048 395,665 389,688 401,903
Non-Current Liabilities 213,653 271,144 333,746 393,465
Long-term borrowings 140,256 195,256 255,256 312,256
Other Long term liab, Prov, DTL 73,398 75,888 78,490 81,209
Current liabilities 344,568 350,454 372,473 400,014
Short-term borrowings, 158,722 165,722 176,722 183,722Curr Maturity
Other Current Liab + Provi 185,846 184,732 195,751 216,292
Total (Equity and Liab.) 993,269 1,017,262 1,095,907 1,195,382
Non-current assets 707,908 779,049 856,258 934,028
Fixed assets (Net block) 653,644 719,128 793,395 867,663
Non-current Investments 9,191 9,283 9,375 9,469
Long-term loans and advances 45,073 50,639 53,487 56,896
Current assets 285,361 238,213 239,649 261,354
Cash & Current Investment 23,052 14,117 1,668 3,593
Other current assets 262,309 224,096 237,981 257,761
Total (Assets) 993,269 1,017,262 1,095,907 1,195,382
Total Debt 298,977 360,977 431,977 495,977
Capital Employed 807,423 832,530 900,155 979,090

13METALS – 2QFY16 RESULTS REVIEW
B&K RESEARCH NOVEMBER 2015
NMDC Maintain Underperformer
Iron ore prices continue to stay under pressure...
2QFY16 performance
Operating performance was lower than our expectations owing to lower realisations (~4%)
and higher DMF provisions (Rs 1.36 bn versus our expectation Rs 1 bn). EBITDA stood at
Rs 9.02 bn versus our expectation of Rs 9.5 bn (1QFY16 stood at Rs 11.0 bn). This implies
an EBITDA/tonne of Rs 1,397 down from Rs 1,658/tonne in 1QFY16 (B&K estimate
stood at Rs 1,471/tonne).
Other highlights and key takeaways from concalls
3Q expectation: We expect company to execute higher volumes sequentially. However,
operating performance is expected to deteriorate further on account of further fall in
realisations.
Further cuts in lump prices: The company has reduced the lump prices further by
Rs 100/tonne to Rs 2,400/tonne. Fines prices on the other hand has been increased by Rs
100/tonne to Rs 1,560 The cumulative cuts in lump and fines prices since April 1 2015
stood at Rs 650/tonne and Rs 400/tonne, respectively.
Outlook and valuation
Ramping up of Bailadila 11B, commissioning of Kumaraswamy mines coupled with
improving evacuation facilities (slurry pipeline, railways, etc.) would translate into higher
volumes going forward. However, outlook for iron ore prices has deteriorated on increasing
iron ore capacities globally as well as domestic. This coupled with slowdown of steel
production in China would continue to keep the iron ore prices weak
domestically. NMDC took fresh cuts in iron ore prices in 3Q. The cumulative cuts in lump
and fines prices since April 1 2015 stood at Rs 650/tonne and Rs 400/tonne, respectively,
is steeper than our expectation. Given higher than expected fall in realisations, we have cut
our blended realisation for FY16 and FY17 by ~8% and ~16%, respectively, against our
previous estimates. At the same time owing to slower execution of volumes, we have
reduced FY16 and FY17 volumes by 7-8% each. Consequently, our FY16 and FY17
EBITDA stands downward revised by 20% and 28%, respectively. We are also introducing
our FY18 numbers where we are expecting FY18 EBITDA to grow by 20% primarily on
account of better volumes and marginally better realisations. On our revised earnings we
arrive at a target price of Rs 94 (6.5x FY17E EV/EBITDA). Maintain Underperformer.
LARGE CAP
Share Data
Price (Rs) 92
BSE Sensex 25,776
Reuters code NMDC.BO
Bloomberg code NMDC IN
Market cap. (US$ mn) 5,486
6M avg. daily turnover (US$ mn) 3.4
Issued shares (mn) 3,965
Target price (Rs) 94
Performance (%) 1M 3M 12M
Absolute (9) (2) (37)
Relative (3) (2) (30)
Valuation Ratios
Yr to 31 Mar FY17E FY18E
EPS (Rs) 10.4 11.6
+/- (%) 5.9 11.6
PER (x) 8.8 7.9
PBV (x) 1.1 1.1
Dividend/Yield (%) 9.5 9.5
EV/Sales (x) 3.3 3.5
EV/EBITDA (x) 6.3 6.3
Major shareholders (%)
Promoters 80
FIIs 4
BFSI's 13
Public & Others 3
Relative performance
0
100
200
300
400
500
600
Apr
-07
Apr
-08
Jun-
09
Jun-
10
Jul-1
1
Aug
-12
Sep-
13
Oct
-14
Nov
-15
NMDC (Actual)Sensex

14METALS – 2QFY16 RESULTS REVIEW
B&K RESEARCH NOVEMBER 2015
NMDC
Valuations
Period end (x) Mar 15P Mar 16E Mar 17E Mar 18E
PER 7.8 9.4 8.8 7.9
PCE 7.6 8.9 8.5 7.6
Price/Book 1.6 1.1 1.1 1.1
Yield (%) 6.6 9.3 9.5 9.5
EV/EBITDA 4.2 5.3 6.3 6.3
Key Ratios
Period end (%) Mar 15P Mar 16E Mar 17E Mar 18E
Adjusted EPS (Rs) 16.5 9.8 10.4 11.6
Growth 2.5 (40.5) 5.9 11.6
CEPS (Rs) 16.9 10.3 10.9 12.1
Book NAV/share (Rs) 81.5 81.1 81.1 82.2
Dividend/share (Rs) 8.6 8.6 8.7 8.7
Dividend payout ratio 63.4 104.6 100.4 90.0
EBITDA margin 62.9 52.0 53.2 55.0
EBIT margin 80.0 77.1 78.5 76.9
Tax Rate 33.9 34.0 34.0 35.0
RoCE 31.6 18.2 19.3 21.8
Net debt/Equity (x) (0.6) (0.5) (0.3) (0.1)
Du Pont Analysis - ROE
Net margin 52.9 50.8 51.8 49.9
Asset turnover (x) 0.4 0.2 0.2 0.3
Leverage factor (x) 1.1 1.1 1.0 1.0
Return on equity 21.0 12.1 12.8 14.2
Cash Flow Statement
Period end (Rs mn) Mar 15P Mar 16E Mar 17E Mar 18E
Profit before Tax 97,685 58,985 62,487 70,781
Depreciation 1,622 1,822 1,842 1,862
Change in working capital 1,947 9,016 (1,132) (2,991)
Total tax paid (33,555) (20,072) (21,264) (24,792)
Cash flow from oper. (a) 67,699 49,751 41,934 44,860
Capital expenditure (26,050) (42,195) (52,674) (58,687)
Change in investments (3,116) 0 0 0
Cash flow from inv. (b) (29,166) (42,195) (52,674) (58,687)
Free cash flow (a+b) 38,533 7,556 (10,739) (13,827)
Dividend (incl. tax) (40,709) (40,695) (41,409) (41,409)
Others 35 0 0 0
Cash flow from fin. (c) (40,674) (40,695) (41,409) (41,409)
Net chg in cash (a+b+c) (2,141) (33,139) (52,148) (55,236)
Income Statement
Period end (Rs mn) Mar 15P Mar 16E Mar 17E Mar 18E
Net Sales 123,564 76,552 79,632 92,072
Growth (%) 2.5 (38.0) 4.0 15.6
Operating expenses (45,781) (36,745) (37,302) (41,429)
Operating profit 77,784 39,807 42,330 50,643
EBITDA 77,784 39,807 42,330 50,643
Growth (%) 0.1 (48.8) 6.3 19.6
Depreciation (1,622) (1,822) (1,842) (1,862)
Other income 22,654 21,000 22,000 22,000
EBIT 98,815 58,985 62,487 70,781
Exceptional & Extraordinary (1,130) 0 0 0
Profit before tax 97,685 58,985 62,487 70,781
Tax (current + deferred) (33,467) (20,072) (21,264) (24,792)
P/(L) for the period 64,219 38,913 41,224 45,989
Reported Profit/(Loss) 64,219 38,913 41,224 45,989
Adjusted Net profit 65,349 38,913 41,224 45,989
Growth (%) 2.5 (40.5) 5.9 11.6
Balance Sheet
Period end (Rs mn) Mar 15P Mar 16E Mar 17E Mar 18E
Share Capital 3,965 3,965 3,965 3,965
Reserves & surplus 319,353 317,571 317,386 321,966
Shareholders' funds 323,317 321,536 321,351 325,931
Non-Current Liabilities 1,491 1,491 1,491 1,491
Other Long term liab, Prov, DTL 1,491 1,491 1,491 1,491
Current liabilities 19,890 12,627 13,135 15,187
Other Current Liab + Provi 19,890 12,627 13,135 15,187
Total (Equity and Liab.) 344,698 335,654 335,977 342,609
Non-current assets 105,747 146,120 196,951 253,776
Fixed assets (Net block) 90,437 130,549 181,105 237,642
Non-current Investments 5,619 5,619 5,619 5,619
Long-term loans and advances 9,691 9,952 10,226 10,514
Current assets 238,951 189,534 139,026 88,833
Cash & Current Investment 184,431 151,293 99,145 43,910
Other current assets 54,520 38,241 39,881 44,924
Total (Assets) 344,698 335,654 335,977 342,609
Capital Employed 324,808 323,027 322,842 327,422

15METALS – 2QFY16 RESULTS REVIEW
B&K RESEARCH NOVEMBER 2015
Godawari Power & Ispat Downgrade to Underperformer
Pellet outlook worsening...
2QFY16 performance
Godawari Power & Ispat’s (GPIL) consolidated operating performance was lower than our
expectation. Both standalone as well as subsidiaries underperformed. EBITDA stood at Rs
571 mn (B&K estimate was Rs 680 mn) despite in line revenues. A large part of
underperformance can be attributed to poor performance of subsidiaries (Rs 153 mn
against our expectation of Rs 228 mn) as Ardent Steel made EBITDA losses (we were
expecting EBITDA positive) due to significant fall in pellet prices.
Other highlights and key takeaways from concalls
3Q expectation: We expect largely flat volumes and realization to be lower by ~Rs 550/
tonne and Rs 1,000/tonne for pellet and steel, respectively. However, significant increase
in captive mining coupled with softening in raw material prices (iron ore as well as coal)
would lead to marginally better operating performance.
Guidance: The company intends to play volume game and maximise absolute EBITDA
(to produce pellet and sponge iron at full capacity). Significant increase in iron ore mining
(from 0.45 mn tonnes in FY15 to ~0.8 mn tonnes in FY16) would drive the profitability.
The current debt stood at ~Rs 20 bn (to remain at this level in FY16) with an average cost
of ~12%.
Outlook and valuation
We expect the growth to be primarily driven by better volumes going forward (targeting to
ramp up the production and sales of pellets, sponge, billets, etc. to optimum level to
maximise EBITDA). Ramping up of Ari Dongri (mining capacity increased from 0.7 mn tpa
to 1.4 mn tpa) and Boria Tibu iron ore mine would improve the integration level. However,
benefits of captive mine would now be much lower than previously envisages due to fall in
merchant iron ore prices and increased costs (DMF, etc.). GPIL derives majority of the
profits from its pellet division and savings on captive mining. However, considering the
sharp correction in pellet prices and weak outlook we expect margins to remain under
pressure on medium term. Given the higher than expected fall in realisation, we have
reduced our pellet realisations/tonne from Rs 5,800 to Rs 5,000 for FY16 and from Rs
5,650 to Rs 4,650 for FY17. At the same time, we have also reduced our FY16 and FY17
steel realisations by 6-7% for both the year. Consequently, our FY16 and FY17 EBITDA
stands downward revised by 35% and 27%, respectively. We are also introducing our FY18
numbers where we are expecting FY18 EBITDA to grow by 14% primarily on account of
better contribution from captive iron ore mining and marginally better realisations.
We are downgrading the stock to Underperformer with a revised target price of Rs 71
(6.9x FY17E EV/EBITDA) from Rs 80 earlier.
SMALL CAP
Share Data
Price (Rs) 69
BSE Sensex 25,776
Reuters code GDPI.BO
Bloomberg code GODPI IN
Market cap. (US$ mn) 34
6M avg. daily turnover (US$ mn) 0.03
Issued shares (mn) 33
Target price (Rs) 71
Performance (%) 1M 3M 12M
Absolute (10) 6 (52)
Relative (4) 6 (47)
Valuation Ratios
Yr to 31 Mar FY17E FY18E
EPS (Rs) (5.0) 6.7
PER (x) (13.7) 10.3
PBV (x) 0.3 0.3
Dividend/Yield (%) – 0.7
EV/Sales (x) 0.9 0.8
EV/EBITDA (x) 6.9 5.8
Major shareholders (%)
Promoters 65
MFs 6
BFSI's 1
Public & Others 28
Relative performance
0
100
200
300
400
Apr
-07
Apr
-08
Jun-
09
Jun-
10
Jul-1
1
Aug
-12
Sep-
13
Oct
-14
Nov
-15
Godawari Power & Ispat (Actual)Sens ex

16METALS – 2QFY16 RESULTS REVIEW
B&K RESEARCH NOVEMBER 2015
Godawari Power & Ispat
Valuations
Period end (x) Mar 15 Mar 16E Mar 17E Mar 18E
PER 4.9 (4.6) (13.7) 10.3
PCE 1.7 3.0 2.1 1.7
Price/Book 0.3 0.3 0.3 0.3
Yield (%) 1.0 (1.3) 0.0 0.7
EV/EBITDA 6.3 8.5 6.9 5.8
Key Ratios
Period end (%) Mar 15 Mar 16E Mar 17E Mar 18E
Adjusted EPS (Rs) 19.7 (14.9) (5.0) 6.7
Growth 11.6 – – –
CEPS (Rs) 55.8 22.7 32.6 41.5
Book NAV/share (Rs) 282.2 268.3 263.7 269.8
Dividend/share (Rs) 1.0 (0.9) 0.0 0.5
Dividend payout ratio 5.9 7.2 7.0 8.2
EBITDA margin 15.0 11.3 13.3 14.7
EBIT margin 12.5 6.9 9.0 10.9
Tax rate 7.7 18.9 13.9 28.7
RoCE 9.4 4.9 6.7 8.5
Total debt/Equity (x) 1.9 1.9 1.9 1.7
Net debt/Equity (x) 1.8 1.9 1.8 1.7
Du Pont Analysis - ROE
Net margin 2.7 (2.1) (0.7) 0.9
Asset turnover (x) 0.7 0.6 0.6 0.7
Leverage factor (x) 4.1 4.1 4.1 4.1
Return on equity 7.2 (5.4) (1.9) 2.5
Cash Flow Statement
Period end (Rs mn) Mar 15 Mar 16E Mar 17E Mar 18E
Profit before tax 766 (756) (263) 320
Depreciation 1,182 1,233 1,232 1,141
Change in working capital 1,903 (359) 356 248
Total tax paid (49) 125 37 (92)
Others 2,237 2,333 2,349 2,296
Cash flow from oper. (a) 6,038 2,576 3,711 3,912
Capital expenditure (2,428) (908) (828) (688)
Change in investments (162) (1) (1) (1)
Others 53 (18) (19) (21)
Cash flow from inv. (b) (2,538) (927) (848) (710)
Free cash flow (a+b) 3,501 1,649 2,862 3,202
Debt raised/(repaid) (456) (188) (707) (707)
Dividend (incl. tax) (79) 57 15 (14)
Others (2,261) (2,123) (2,196) (2,208)
Cash flow from fin. (c) (2,797) (2,254) (2,888) (2,929)
Net chg in cash (a+b+c) 704 (605) (26) 273
Income Statement
Period end (Rs mn) Mar 15 Mar 16E Mar 17E Mar 18E
Net sales 23,950 22,935 23,245 24,031
Growth (%) 13.1 (4.2) 1.3 3.4
Operating expenses (20,368) (20,336) (20,147) (20,506)
Operating profit 3,582 2,600 3,097 3,525
EBITDA 3,582 2,600 3,097 3,525
Growth (%) 3.2 (27.4) 19.1 13.8
Depreciation (1,182) (1,233) (1,232) (1,141)
Other income 602 210 221 232
EBIT 3,003 1,577 2,086 2,615
Finance cost (2,237) (2,333) (2,349) (2,296)
Profit before tax 766 (756) (263) 320
Tax (current + deferred) (59) 143 37 (92)
P/(L) for the period 707 (613) (227) 228
P/L of Associates, (62) 124 62 (8)Min Int, Pref Div
Reported Profit/(Loss) 645 (490) (165) 220
Adjusted net profit 645 (490) (165) 220
Growth (%) 11.6 – – –
Balance Sheet
Period end (Rs mn) Mar 15 Mar 16E Mar 17E Mar 18E
Share capital 328 328 328 328
Reserves & surplus 8,917 8,462 8,309 8,511
Shareholders' funds 9,244 8,790 8,637 8,838
Minority Interest and others 1,671 1,755 1,842 1,935
Non-current liabilities 15,005 14,713 14,121 13,530
Long-term borrowings 14,094 13,794 13,194 12,594
Other non-current liabilities 911 918 927 936
Current liabilities 11,561 11,209 11,085 11,080
ST borrowings, Curr maturity 6,286 6,398 6,291 6,184
Other current liabilities 5,275 4,812 4,795 4,896
Total (Equity and Liab.) 37,481 36,467 35,686 35,383
Non-current assets 26,944 26,646 26,273 25,854
Fixed assets (Net block) 25,897 25,573 25,169 24,716
Non-current Investments 664 664 664 664
Long-term loans and advances 207 216 227 240
Other non-current assets 176 194 213 234
Current assets 10,537 9,821 9,412 9,528
Cash & current investment 1,059 454 429 703
Other current assets 9,478 9,367 8,983 8,826
Total (Assets) 37,481 36,467 35,686 35,383
Total debt 20,380 20,192 19,485 18,778
Capital employed 32,206 31,655 30,891 30,487
17METALS – 2QFY16 RESULTS REVIEW
B&K RESEARCH NOVEMBER 2015
Monnet Ispat & Energy Under Review
Working capital issue hampering ramp-up...
2QFY16 performance
Monnet Ispat & Energy (Standalone) reported operating performance lower than our
expectations. Underperformance at the revenue level coupled with high raw material
incidence adversely impacted the operating performance. The company reported EBITDA
loss of Rs 953 mn versus our expectation of EBITDA loss of Rs 515 mn.
Other highlights
Working capital constraints: The company is finding difficult to ramp-up the 1.5 mn
tpa steel plant to its optimum capacity owing to dearth of working capital. The current
utilisation of the plant is ~40%. Management plans to sell some assets to improve liquidity.
Strategic Debt Restructuring (SDR): The Board of Directors have considered
accepting SDR scheme where the loans of the bank would be converted into equity shares.
This means that the control of the company would eventually go to the lenders.
Monnet Power stake sale: Monnet Ispat has signed an MoU with JSW Energy to sell
part/full stake in Monnet Power (87.5% stake) which is developing a 1,050 MW (2x525)
coal fired thermal power plant at Angul, Orissa. Monnet Ispat had invested ~Rs 6 bn in
Monnet Power. Monnet Power has debt of ~Rs 40 bn.
Outlook and valuation
Subdued demand, rising import pressure coupled with falling prices have taken a toll on the
performance of the company. Lack of working capital has forced the company to run at
suboptimal utilisation levels which further deteriorated the condition. Monnet is trying to
sell 1,050 MW power plant (in advance stage of negotiation with JSW Energy) which if
goes through would aid it to reduce the debt at the consolidated level and provide it much
needed working capital for steel plant ramp-up. We expect Monnet to report losses at the
net level in the near to medium term. Possibility of SDR for steel business (Strategic Debt
restructuring) implies management control going into the hands of lenders. Lenders then
would have 12 months to sell the assets therefore the clarity on future prospectus of the
company is diminishing. Therefore we are withdrawing our Sell rating and keeping the
company Under Review until further clarity emerges.
SMALL CAP
Share Data
Price (Rs) 32
BSE Sensex 25,776
Reuters code MNET.BO
Bloomberg code MISP IN
Market cap. (US$ mn) 32
6M avg. daily turnover (US$ mn) 0.2
Issued shares (mn) 66
Performance (%) 1M 3M 12M
Absolute (13) 12 (58)
Relative (7) 12 (54)
Valuation Ratios
Yr to 31 Mar FY17E FY18E
EPS (Rs) (134.2) (132.8)
PER (x) (0.2) (0.2)
PBV (x) 4.5 (0.3)
EV/Sales (x) 3.5 2.5
EV/EBITDA (x) 49.2 28.0
Major shareholders (%)
Promoters 49
FIIs 22
Public & Others 29
Relative performance
0100200300400500600700800
Apr
-07
Apr
-08
Jun-
09
Jun-
10
Jul-1
1
Aug
-12
Sep-
13
Oct
-14
Nov
-15
Monnet Ispat (Actual)Sensex

18METALS – 2QFY16 RESULTS REVIEW
B&K RESEARCH NOVEMBER 2015
Monnet Ispat & Energy
Valuations
Period end (x) Mar 15 Mar 16E Mar 17E Mar 18E
PER (0.5) (0.2) (0.2) (0.2)
PCE (1.1) (0.3) (0.5) (0.7)
Price/Book 0.2 0.2 4.5 (0.3)
EV/EBITDA 144.5 (66.3) 49.2 28.0
Key Ratios
Period end (%) Mar 15 Mar 16E Mar 17E Mar 18E
Adjusted EPS (Rs) (91.3) (146.0) (134.2) (132.8)
Growth (1,717.3) 59.9 (8.1) (1.0)
CEPS (Rs) (47.5) (91.5) (64.0) (46.0)
Book NAV/share (Rs) 287.3 141.3 7.2 (125.6)
EBITDA margin 2.7 (7.8) 7.1 8.9
EBIT margin (4.2) (20.3) (3.4) (0.2)
Tax rate 24.0 32.0 30.5 31.4
RoCE (0.9) (3.5) (0.9) (0.1)
Total debt/Equity (x) 6.2 11.9 69.3 (21.0)
Net debt/Equity (x) 6.1 11.8 68.8 (20.9)
Du Pont Analysis - ROE
Net margin (18.5) (38.3) (22.3) (15.3)
Asset turnover (x) 0.2 0.2 0.3 0.4
Leverage factor (x) 6.8 11.3 32.0 (41.0)
Return on equity (25.7) (68.1) (180.7) 224.2
Cash Flow Statement
Period end (Rs mn) Mar 15 Mar 16E Mar 17E Mar 18E
Profit before tax (10,632) (14,217) (12,834) (12,943)
Depreciation 2,884 3,587 4,620 5,719
Change in working capital 5,993 6,755 (1,357) (15)
Total tax paid (23) 3,999 3,912 4,060
Others 6,705 9,122 11,505 12,850
Cash flow from oper. (a) 4,927 9,247 5,846 9,670
Capital expenditure (14,100) (4,889) (2,996) (1,501)
Change in investments 71 (47) (49) (52)
Others 76 (52) (54) (57)
Cash flow from inv. (b) (13,952) (4,988) (3,099) (1,610)
Free cash flow (a+b) (9,025) 4,259 2,747 8,060
Equity raised/(repaid) (2) 0 0 0
Debt raised/(repaid) 17,629 3,000 8,500 4,500
Dividend (incl. tax) (211) 0 0 0
Others (6,997) (8,938) (11,346) (12,635)
Cash flow from fin. (c) 10,419 (5,938) (2,846) (8,135)
Net chg in cash (a+b+c) 1,394 (1,679) (100) (75)
Income Statement
Period end (Rs mn) Mar 15 Mar 16E Mar 17E Mar 18E
Net sales 32,421 25,097 39,597 57,095
Growth (%) 40.8 (22.6) 57.8 44.2
Operating expenses (31,552) (27,044) (36,797) (52,016)
Operating profit 869 (1,947) 2,800 5,079
EBITDA 869 (1,947) 2,800 5,079
Growth (%) (77.5) (324.0) (243.8) 81.4
Depreciation (2,884) (3,587) (4,620) (5,719)
Other income 647 439 490 547
EBIT (1,368) (5,095) (1,329) (93)
Finance cost (6,705) (9,122) (11,505) (12,850)
Exceptional & extraordinary (2,559) 0 0 0
Profit before tax (10,632) (14,217) (12,834) (12,943)
Tax (current + deferred) 1,940 4,553 3,912 4,060
P/(L) for the period (8,692) (9,665) (8,922) (8,884)
P/L of Associates, 124 54 87 139Min Int, Pref Div
Reported Profit/(Loss) (8,568) (9,610) (8,835) (8,745)
Adjusted net profit (6,009) (9,610) (8,835) (8,745)
Growth (%) (1,717.3) 59.9 (8.1) (1.0)
Balance Sheet
Period end (Rs mn) Mar 15 Mar 16E Mar 17E Mar 18E
Share capital 659 659 659 659
Reserves & surplus 18,257 8,647 (188) (8,931)
Shareholders' funds 18,916 9,305 471 (8,273)
Minority Interest and others 3,048 3,178 3,249 3,324
Non-current liabilities 94,757 95,801 103,847 108,396
Long-term borrowings 93,934 94,934 102,934 107,434
Other non-current liabilities 823 867 913 962
Current liabilities 48,143 45,820 50,915 58,088
ST borrowings, Curr maturity 31,063 33,063 33,563 33,563
Other current liabilities 17,081 12,757 17,353 24,525
Total (Equity and Liab.) 164,864 154,104 158,483 161,535
Non-current assets 141,354 142,774 141,275 137,188
Fixed assets (Net block) 129,403 130,358 128,369 123,768
Non-current Investments 943 990 1,039 1,091
Long-term loans and advances 7,341 7,708 8,093 8,498
Other non-current assets 3,667 3,719 3,773 3,830
Current assets 23,510 11,330 17,208 24,347
Cash & current investment 2,662 983 883 808
Other current assets 20,849 10,347 16,325 23,539
Total (Assets) 164,864 154,104 158,483 161,535
Total debt 124,997 127,997 136,497 140,997
Capital employed 147,783 141,347 141,130 137,010

19METALS – 2QFY16 RESULTS REVIEW
B&K RESEARCH NOVEMBER 2015
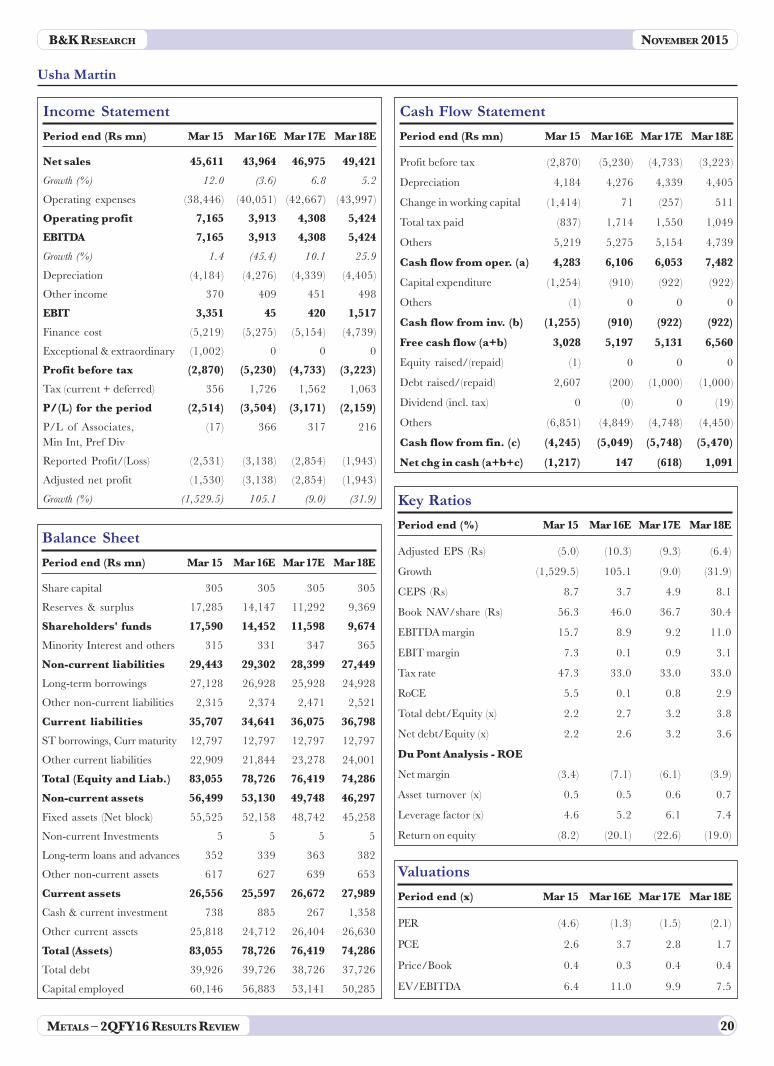
Usha Martin Maintain Underperformer
No silver lining in sight; high debt levels a concern...
2QFY16 performance
Usha Martin’s (USM) consolidated operating performance was below expectation primarily
on account of underperformance of standalone business. EBITDA stood at Rs 534 mn
much lower than our estimate of ~Rs 1.06 bn. Almost entire underperformance came
from subdued standalone EBITDA (Rs 401 mn versus our estimate of Rs 925 mn). Inventory
looses to the tune of Rs 178 mn; DMF provision of RS 186 mn and 23 days shutdown of
Blast furnace impacted the operating performance. Net losses stood at Rs (993) mn.
Other highlights and key takeaways from concalls
Looking to monetise assets: The company has identified some additional land and
other non-core assets which it intends to sell to garner Rs 2.5 bn over the next 24-30
months time. It has recently sold its 50% stake in JV (flight charter business) for Rs 81 mn.
Promoters stand firm on capital infusion: Out of total proposed Rs 1.2 bn equity
infusion by promoters, the company has received Rs 300 mn (25% of warrant money).
Promoters committed to infuse Rs 600 mn by March 2016 and Rs 300 mn by September
2016.
Compensation from Kathutia mine yet to come: Usha Martin is still under active
negotiation with Hindalco for Kathautia coal mine compensation (expects to receive Rs
1.85 bn by FY16 end).
Debt and capex: The current net debt stood at ~Rs 40 bn almost flat QoQ. The company is
negotiating with banks for a moratorium of three years on principal repayment (some
banks have already approved). Usha Martin would be spending ~Rs 1 bn in FY16 largely
on maintenance and Brinda & Sasai mine (would take 24-30 moths to commission).
Outlook and valuation
We expect the company to deliver higher volume growth going forward as facilities ramps
up (entire expansion project along with pellet plant is up and running). However, subdued
domestic demand, falling steel prices and threat of imports coupled with capacity additions
by domestic players would keep the margins under pressure in near term. We have reduced
our blended realisation by 3-4% for both FY16 and FY17 to reflect the fall in commodity
prices. Also, given the temporary shutdown of pellet plant we have reduced the outside
pellet sales by 0.4 mn tonnes and 0.15 mn tonnes for FY16 and FY17, respectively, and sold
more semi during these years. Consequently our FY16 and FY17 EBITDA stands downward
revised by 40% for each of the year. We maintain Underperformer rating with a revised
target price of Rs 13 (10x FY17 EV/EBITDA) down from Rs 18 earlier. Maintain
Underperformer.
SMALL CAP
Share Data
Price (Rs) 14
BSE Sensex 25,776
Reuters code USBL.BO
Bloomberg code USM IN
Market cap. (US$ mn) 63
6M avg. daily turnover (US$ mn) 0.1
Issued shares (mn) 305
Target price (Rs) 13
Performance (%) 1M 3M 12M
Absolute (19) (12) (51)
Relative (14) (12) (46)
Valuation Ratios
Yr to 31 Mar FY17E FY18E
EPS (Rs) (9.3) (6.4)
PER (x) (1.5) (2.1)
PBV (x) 0.4 0.4
EV/Sales (x) 0.9 0.8
EV/EBITDA (x) 9.9 7.5
Major shareholders (%)
Promoters 42
FIIs 22
MFs 12
BFSI's 3
Public & Others 21
Relative performance
020406080
100120140160
Apr
-07
Apr
-08
Jun-
09
Jun-
10
Jul-1
1
Aug
-12
Sep-
13
Oct
-14
Nov
-15
Usha Martin (Actual)Sens ex
20METALS – 2QFY16 RESULTS REVIEW
B&K RESEARCH NOVEMBER 2015
Usha Martin
Valuations
Period end (x) Mar 15 Mar 16E Mar 17E Mar 18E
PER (4.6) (1.3) (1.5) (2.1)
PCE 2.6 3.7 2.8 1.7
Price/Book 0.4 0.3 0.4 0.4
EV/EBITDA 6.4 11.0 9.9 7.5
Key Ratios
Period end (%) Mar 15 Mar 16E Mar 17E Mar 18E
Adjusted EPS (Rs) (5.0) (10.3) (9.3) (6.4)
Growth (1,529.5) 105.1 (9.0) (31.9)
CEPS (Rs) 8.7 3.7 4.9 8.1
Book NAV/share (Rs) 56.3 46.0 36.7 30.4
EBITDA margin 15.7 8.9 9.2 11.0
EBIT margin 7.3 0.1 0.9 3.1
Tax rate 47.3 33.0 33.0 33.0
RoCE 5.5 0.1 0.8 2.9
Total debt/Equity (x) 2.2 2.7 3.2 3.8
Net debt/Equity (x) 2.2 2.6 3.2 3.6
Du Pont Analysis - ROE
Net margin (3.4) (7.1) (6.1) (3.9)
Asset turnover (x) 0.5 0.5 0.6 0.7
Leverage factor (x) 4.6 5.2 6.1 7.4
Return on equity (8.2) (20.1) (22.6) (19.0)
Cash Flow Statement
Period end (Rs mn) Mar 15 Mar 16E Mar 17E Mar 18E
Profit before tax (2,870) (5,230) (4,733) (3,223)
Depreciation 4,184 4,276 4,339 4,405
Change in working capital (1,414) 71 (257) 511
Total tax paid (837) 1,714 1,550 1,049
Others 5,219 5,275 5,154 4,739
Cash flow from oper. (a) 4,283 6,106 6,053 7,482
Capital expenditure (1,254) (910) (922) (922)
Others (1) 0 0 0
Cash flow from inv. (b) (1,255) (910) (922) (922)
Free cash flow (a+b) 3,028 5,197 5,131 6,560
Equity raised/(repaid) (1) 0 0 0
Debt raised/(repaid) 2,607 (200) (1,000) (1,000)
Dividend (incl. tax) 0 (0) 0 (19)
Others (6,851) (4,849) (4,748) (4,450)
Cash flow from fin. (c) (4,245) (5,049) (5,748) (5,470)
Net chg in cash (a+b+c) (1,217) 147 (618) 1,091
Income Statement
Period end (Rs mn) Mar 15 Mar 16E Mar 17E Mar 18E
Net sales 45,611 43,964 46,975 49,421
Growth (%) 12.0 (3.6) 6.8 5.2
Operating expenses (38,446) (40,051) (42,667) (43,997)
Operating profit 7,165 3,913 4,308 5,424
EBITDA 7,165 3,913 4,308 5,424
Growth (%) 1.4 (45.4) 10.1 25.9
Depreciation (4,184) (4,276) (4,339) (4,405)
Other income 370 409 451 498
EBIT 3,351 45 420 1,517
Finance cost (5,219) (5,275) (5,154) (4,739)
Exceptional & extraordinary (1,002) 0 0 0
Profit before tax (2,870) (5,230) (4,733) (3,223)
Tax (current + deferred) 356 1,726 1,562 1,063
P/(L) for the period (2,514) (3,504) (3,171) (2,159)
P/L of Associates, (17) 366 317 216Min Int, Pref Div
Reported Profit/(Loss) (2,531) (3,138) (2,854) (1,943)
Adjusted net profit (1,530) (3,138) (2,854) (1,943)
Growth (%) (1,529.5) 105.1 (9.0) (31.9)
Balance Sheet
Period end (Rs mn) Mar 15 Mar 16E Mar 17E Mar 18E
Share capital 305 305 305 305
Reserves & surplus 17,285 14,147 11,292 9,369
Shareholders' funds 17,590 14,452 11,598 9,674
Minority Interest and others 315 331 347 365
Non-current liabilities 29,443 29,302 28,399 27,449
Long-term borrowings 27,128 26,928 25,928 24,928
Other non-current liabilities 2,315 2,374 2,471 2,521
Current liabilities 35,707 34,641 36,075 36,798
ST borrowings, Curr maturity 12,797 12,797 12,797 12,797
Other current liabilities 22,909 21,844 23,278 24,001
Total (Equity and Liab.) 83,055 78,726 76,419 74,286
Non-current assets 56,499 53,130 49,748 46,297
Fixed assets (Net block) 55,525 52,158 48,742 45,258
Non-current Investments 5 5 5 5
Long-term loans and advances 352 339 363 382
Other non-current assets 617 627 639 653
Current assets 26,556 25,597 26,672 27,989
Cash & current investment 738 885 267 1,358
Other current assets 25,818 24,712 26,404 26,630
Total (Assets) 83,055 78,726 76,419 74,286
Total debt 39,926 39,726 38,726 37,726
Capital employed 60,146 56,883 53,141 50,285

21METALS – 2QFY16 RESULTS REVIEW
B&K RESEARCH NOVEMBER 2015
Volume growth (QoQ)
(30)(20)(10)
01020304050
2QFY
14
3QFY
14
4QFY
14
1QFY
15
2QFY
15
3QFY
15
4QFY
15
1QFY
16
2QFY
16
%
Aluminium Copper Lead Zinc
(20)
(15)
(10)
(5)0
510
153Q
FY14
4QFY
14
1QFY
15
2QFY
15
3QFY
15
4QFY
15
1QFY
16
2QFY
16
%
0
5
10
15
20
25
30
%
Revenue EBITDA Margin (RHS)
Non-ferrous
Performance at a glance
The aggregate revenues grew by ~1% (Ex Hindustan Zinc) despite LME prices in 2Q for
aluminium, zinc and lead and copper falling sequentially by 9%,15%,12% and 13%,
respectively. Domestic realisations for aluminium, zinc and lead were lower by 2%, 8% and
4%, respectively. Higher volumes (capacity ramping up) coupled with INR depreciation of
~2% aided the revenue growth.
EBITDA margins (ex-Hindustan Zinc) witnessed a fall of 70 bps sequentially primarily on
account of lower realisations.
Revenue and EBITDA margin trend
Source: Company, B&K Research
Aggregate aluminium volumes grew by 4% while zinc and lead witnessed growth of 7% and
29%, respectively. Fall in domestic realisation were relatively lower on account of better
domestic premiums, improvement in product mix and INR depreciation of 2%.
Volume growth trend Realisation growth trend
Source: Company, B&K Research
Realisation growth (QoQ)
(20)(15)(10)
(5)05
101520
2QFY
14
3QFY
14
4QFY
14
1QFY
15
2QFY
15
3QFY
15
4QFY
15
1QFY
16
2QFY
16%
Aluminium Copper Zinc Lead

22METALS – 2QFY16 RESULTS REVIEW
B&K RESEARCH NOVEMBER 2015
Vedanta Maintain Outperformer
Weaker commodity prices hurt profitability...
2QFY16 performance
Vedanta reported operating performance below our expectations. EBITDA came in at Rs
40 bn versus our expectation of Rs 43.7 bn. Large part of the underperformance was
largely due to the aluminium (marred by lower realisations and premia and higher costs) and
oil & gas division (higher profit petroleum) which was partially negated by better performance
of Zinc India (lower than expected DMF and employee expenses) and power business
(higher than expected units generated at lower costs).
Other highlights and key takeaways from concalls
Zinc India business
• Mr Sunil Duggal has been appointed as new CEO. He is with Hindustan Zinc (HZ) since
2010 and has experience of ~30 years. Prior to joining HZ, he was working at Ambuja
Cements as President.
• As per media report, Rajasthan government has cancelled 601 mining leases. HZ
management assured that none of their mines (even those with prospecting licence) is
affected.
Zinc International business
• Mine metal production would gradually decline on account of gradual closure of Lisheen
mine by November 2015. The company maintained volume guidance of 220,000-
230,000 tonnes with an estimated cost of production of US$ 1,450-1,500/tonne.
• FY16 capex has been slashed from US$ 80 to US$ 40 which would lead to some delays
in project commissioning.
Iron ore business: Iron ore shipment from Goa has started. At current prices, Goa
operations would be break-even only. VEDL has requested the government to reduce
taxes (cumulative taxes are ~40% of selling price) to make operations profitable. The CoP
in Goa is ~US$ 20/tonne.
Aluminium business
• The company is going slow on ramping up of pots given the tough economic
environment. Start-up of additional pots at Balco II was put on hold. While Jharsuguda
II 312,000 tonne first line was delayed till 3QFY16.
• Management has lowered the aluminium volume guidance for FY16 to 0.9 mn tonnes
from over 1.0 mn tonnes a quarter ago.
• The company has temporarily shut high cost rolling facility at Balco which is expected
to save Rs 600 mn annually (from FY17). Vedanta has also reduced Lanjigarh capacity
by ~20% to 0.8 mn tonnes on Bauxite unavailability. The current cost of production at
Jharsuguda and Balco is ~US$ 1,600 and ~1,675/tonne, respectively.
• Management expect Chotia coal block to start producing from in the next two-three
weeks. Gare Palma IV/I coal block is still awaiting resolution.
LARGE CAP
Share Data
Price (Rs) 90
BSE Sensex 25,776
Reuters code SESA.BO
Bloomberg code VEDL IN
Market cap. (US$ mn) 4,028
6M avg. daily turnover (US$ mn) 18.5
Issued shares (mn) 2,965
Target price (Rs) 98
Performance (%) 1M 3M 12M
Absolute (12) 11 (62)
Relative (6) 11 (58)
Valuation Ratios
Yr to 31 Mar FY17E FY18E
EPS (Rs) 9.7 10.7
+/- (%) (8.3) 10.6
PER (x) 9.3 18.7
PBV (x) 0.5 0.5
Dividend/Yield (%) 2.1 0.0
EV/Sales (x) 0.6 0.6
EV/EBITDA (x) 2.4 2.3
Major shareholders (%)
Promoters 60
FIIs 22
MFs 3
BFSI's 5
Public & Others 10
0
100
200
300
400
500
600
Apr
-07
Mar
-08
Mar
-09
Feb-
10
Jan-
11
Jan-
12
Dec
-12
Dec
-13
Dec
-14
Nov
-15
Vedanta (Actual)Sensex
Relative performance

23METALS – 2QFY16 RESULTS REVIEW
B&K RESEARCH NOVEMBER 2015
Power business
• Talwandi Saboo (660 MW x 3): 1 Unit has operated at ~80% availability. Management
expects second unit to commission by end 3QFY16 and third and final unit to commission
in 4QFY16.
• Coal availability for IPP is still an issue. The company has procured 41% from linkage;
34% from e-auction and 25% imports (8-12% fall in import prices) during the quarter.
Debt
• The net debt has reduced to Rs 271 bn from Rs 324 bn a quarter ago on account of
higher cash flows from operations and release of working capital.
• The company would be refinancing US$ 1.5 bn in FY16 (US$ 0.5 bn already committed;
US$ 0.9 bn has in principal approval). The average cost of debt has come off by 30 bps
largely on account of reduction in spreads on bank loans.
Update on Cairn Vedanta merger: Approvals from stock exchanges have been
received. The management indicated they are in constant touch with the concerned parties
and remains optimistic about the merger to go through.
Outlook and valuation
We expect volume growth across major business segments. Ramping up of new smelters in
aluminium business (both Balco 0.375 mn tpa and Jharsuguda II – 1.25 mn tpa), re-starting
of iron ore mining in Karnataka and Goa (meaningful contribution from 2HFY16 only) and
commissioning of 1,980 MW (660*3) power plant at Talwandi Sabo would fuel the volume
growth for Vedanta in FY16 and FY17. The Cairn merger with Vedanta is still awaiting
shareholders approval, which we think is the biggest hurdle for the deal to go through. We
remain cautious on the commodity price outlook, thus Vedanta’s consolidated earnings
would stay exposed to this risk. We maintain our Outperformer rating on the stock with a
target price of Rs 98 (3.2x FY17E attributable EV/EBITDA).

24METALS – 2QFY16 RESULTS REVIEW
B&K RESEARCH NOVEMBER 2015
Vedanta
Valuations
Period end (x) Mar 15 Mar 16E Mar 17E Mar 18E
PER 8.7 8.6 9.3 18.7
PCE 4.1 2.4 2.3 2.1
Price/Book 1.0 0.5 0.5 0.5
Yield (%) 2.2 2.3 2.1 0.0
EV/EBITDA 4.0 2.5 2.4 2.3
Key Ratios
Period end (%) Mar 15 Mar 16E Mar 17E Mar 18E
Adjusted EPS (Rs) 21.9 10.5 9.7 10.7
Growth 0.3 (51.8) (8.3) 10.6
CEPS (Rs) 46.0 38.2 39.8 42.4
Book NAV/share (Rs) 181.7 189.9 197.3 192.9
Dividend/share (Rs) 4.1 2.1 1.9 0.0
Dividend payout ratio (10.3) 22.8 22.8 0.0
EBITDA margin 29.9 28.5 26.8 25.6
EBIT margin 24.2 21.7 19.9 19.0
Tax rate 11.9 13.0 13.0 13.0
RoCE 9.7 8.9 8.7 9.3
Total debt/Equity (x) 0.9 0.8 0.8 0.8
Net debt/Equity (x) 0.4 0.3 0.2 0.2
Du Pont Analysis - ROE
Net margin 8.8 4.3 3.7 3.6
Asset turnover (x) 0.4 0.4 0.4 0.4
Leverage factor (x) 3.2 3.5 3.4 3.5
Return on equity 10.2 5.7 5.0 5.5
Cash Flow Statement
Period end (Rs mn) Mar 15 Mar 16E Mar 17E Mar 18E
Profit before tax (99,251) 88,719 83,078 88,901
Depreciation 71,592 81,853 89,380 94,150
Change in working capital (60,467) 18,409 (8,494) (17,087)
Total tax paid (10,340) (13,701) (9,052) (9,722)
Others 26,816 35,610 38,154 43,962
Cash flow from oper. (a) (71,650) 210,890 193,066 200,204
Capital expenditure (70,820) (62,715) (96,246) (100,034)
Change in investments (16,965) 0 0 0
Others 70,024 31,938 34,410 34,382
Cash flow from inv. (b) (17,760) (30,777) (61,836) (65,652)
Free cash flow (a+b) (89,410) 180,113 131,230 134,552
Equity raised/(repaid) (199,650) 0 0 0
Debt raised/(repaid) (28,137) (11,112) (11,112) (11,112)
Dividend (incl. tax) (14,343) (14,126) (6,541) 0
Others 311,662 (96,559) (97,425) (149,062)
Cash flow from fin. (c) 69,532 (121,796) (115,078) (160,174)
Net chg in cash (a+b+c) (19,878) 58,316 16,152 (25,623)
Income Statement
Period end (Rs mn) Mar 15 Mar 16E Mar 17E Mar 18E
Net sales 737,095 722,586 785,124 885,060
Growth (%) 11.4 (2.0) 8.7 12.7
Operating expenses (516,650) (527,949) (586,059) (669,807)
Operating profit 220,446 194,637 199,065 215,253
Other operating income 0 11,546 11,547 11,760
EBITDA 220,446 206,183 210,612 227,013
Growth (%) 12.7 (6.5) 2.1 7.8
Depreciation (71,592) (81,853) (89,380) (94,150)
Other income 29,772 32,500 35,000 35,001
EBIT 178,626 156,829 156,232 167,864
Finance cost (56,588) (68,110) (73,154) (78,963)
Exceptional & extraordinary (221,289) 0 0 0
Profit before tax (99,251) 88,719 83,078 88,901
Tax (current + deferred) (14,484) (11,534) (10,800) (11,557)
P/(L) for the period (113,735) 77,186 72,278 77,344
P/L of Associates, Min Int, (42,723) (45,909) (43,608) (45,648)Pref Div
Reported Profit/(Loss) (156,458) 31,277 28,670 31,696
Adjusted net profit 64,832 31,277 28,670 31,696
Growth (%) 0.3 (51.8) (8.3) 10.6
Balance Sheet
Period end (Rs mn) Mar 15 Mar 16E Mar 17E Mar 18E
Share capital 2,965 2,965 2,965 2,965
Reserves & surplus 535,788 559,933 582,064 569,022
Shareholders' funds 538,753 562,898 585,029 571,987
Minority interests and others 355,297 373,062 391,715 411,301
Non-current liabilities 589,219 581,747 575,406 569,234
Long-term borrowings 520,252 510,252 500,252 490,252
Other non-current liabilities 68,967 71,495 75,154 78,982
Current liabilities 419,555 421,992 439,133 464,327
ST borrowings, curr maturity 257,271 256,159 255,047 253,934
Other current liabilities 162,284 165,834 184,086 210,392
Total (equity and liab.) 1,902,824 1,939,699 1,991,283 2,016,849
Non-current assets 1,276,246 1,254,709 1,274,928 1,301,805
Fixed assets (net block) 910,661 892,178 898,389 903,617
Non-current investments 2,134 2,134 2,134 2,134
Long-term loans and adv. 164,531 160,914 174,332 195,360
Other non-current assets 198,920 199,482 200,073 200,693
Current assets 626,579 684,990 716,355 715,044
Cash & current investment 450,889 509,205 525,357 499,734
Other current assets 175,690 175,785 190,998 215,310
Total (assets) 1,902,824 1,939,699 1,991,283 2,016,849
Total debt 777,523 766,411 755,299 744,186
Capital employed 1,740,540 1,773,865 1,807,197 1,806,457
Note: Merged numbers are from FY14 onwards

25METALS – 2QFY16 RESULTS REVIEW
B&K RESEARCH NOVEMBER 2015
0
50
100
150
200
250
300
Apr
-07
Mar
-08
Mar
-09
Feb-
10
Jan-
11
Jan-
12
Dec
-12
Dec
-13
Dec
-14
Nov
-15
Hindalco (Actual)Sensex
Hindalco Maintain Underperformer
Falling LME a concern...
2QFY16 performance
Hindalco standalone reported operating performance lower than our expectation (EBITDA
came in at Rs 6.03 bn versus our expectation of Rs 7.7 bn) primarily due to higher raw
material bill and higher other expenditure. Novelis posted sequentially better adjusted
EBITDA of US$ 182 mn in 2QFY16 primarily led by lower one-offs on account of price
(metal) fluctuations (US$ 53 mn in 2Q against US$ 85 mn in 1Q on account of metal price
lag). The EBITDA/tonne stood at US$ 231/tonne versus US$ 165/tonne in 1Q (2QFY15
stood at US$ 301/tonne).
Other highlights and key takeaways from mgmt discussion
Aluminium volumes to improve despite mothballing inefficient old capacity:
The company expects domestic aluminium business to report better volumes going forward
(ramping up relatively low cost of Mahan and Aditya). Hindalco has shut 1 line representing
~85,000 tonne pa at Hirakud facility.
Novelis: Metal premium lag impacted EBITDA by US$ 53 mn in 2Q. The company has
absorbed a large part of the metal lag hit. However, marginal effect would flow in 2H result
also. Higher use of recycled material and increased contribution from automotive segment
is expected to drive the profitability.
Debt and capex: Major domestic capex have been completed (except on recently acquired
coal mines). Novelis would do an annual capex of US$ 400 mn in FY16.
Outlook and valuation
Aluminium realisations (premia included) have come off substantially since March 2015
which would meaningfully impact the profitability of Hindalco. Though, we expect ramping
up of new facilities (Mahan, Aditya and Utkal) to drive the volume led growth, the profitability
would be negligible at current LME (including premia) and increased coal cost (~30% of
capacity backed by coal blocks won in auction at an average premium of ~Rs 3,000/
tonne). Higher TC/RC charges for copper would provide some support to the performance
of the company. Novelis performance was also impacted by sharp decline in premia (partial
hit to come in 2H as well). We expect company to report better YoY volumes. Majority of
premia hit have already factored in and we expect 2H EBITDA/tonne to be better. We
have reduced our standalone FY17 aluminium realisation by US$ 50/tonne. We have also
changed our FY16 and FY17 INR to 65 from 64 previously. We are not changing our
Novelis estimates. After factoring in all our FY16 EBITDA has increased by ~3% while
FY17 EBITDA grew by ~1% only. We are introducing our FY18 estimated where we are
assuming higher realisation at US$ 1650 (US$ 100/tonne better YoY) along with ~50,000
tonnes higher volumes YoY. In Novelis we have taken ~5% higher volumes. The EBITDA/
tonne is expected to be better at US$ 308 against US$ 269 in FY17 on account of better
volumes and improved product mix. We are valuing the company on FY17 earnings and
maintaining Underperformer rating on the stock with a target price of Rs 70 (6.8x FY17E
EV/EBITDA).
LARGE CAP
Share Data
Price (Rs) 74
BSE Sensex 25,776
Reuters code HALC.BO
Bloomberg code HNDL IN
Market cap. (US$ mn) 2,289
6M avg. daily turnover (US$ mn) 11.9
Issued shares (mn) 2,065
Target price (Rs) 70
Performance (%) 1M 3M 12M
Absolute (14) (6) (56)
Relative (8) (7) (51)
Valuation Ratios
Yr to 31 Mar FY17E FY18E
EPS (Rs) 9.9 17.0
+/- (%) 159.1 71.3
PER (x) 7.4 4.3
PBV (x) 0.4 0.3
Dividend/Yield (%) 2.0 2.0
EV/Sales (x) 0.7 0.6
EV/EBITDA (x) 6.8 5.5
Major shareholders (%)
Promoters 37
FIIs 29
MFs 2
BFSI's 16
Public & Others 16
Relative performance

26METALS – 2QFY16 RESULTS REVIEW
B&K RESEARCH NOVEMBER 2015
Hindalco
Valuations
Period end (x) Mar 15 Mar 16E Mar 17E Mar 18E
PER 9.5 19.2 7.4 4.3
PCE 4.2 3.1 2.4 1.9
Price/Book 0.7 0.4 0.4 0.3
Yield (%) 0.8 2.0 2.0 2.0
EV/EBITDA 9.3 8.3 6.8 5.5
Key Ratios
Period end (%) Mar 15 Mar 16E Mar 17E Mar 18E
Adjusted EPS (Rs) 13.5 3.8 9.9 17.0
Growth 8.7 (71.6) 159.1 71.3
CEPS (Rs) 30.9 23.6 30.7 39.7
Book NAV/share (Rs) 185.6 187.6 195.8 211.0
Dividend/share (Rs) 1.0 1.5 1.5 1.5
Dividend payout ratio 30.4 46.9 18.1 10.6
EBITDA margin 8.6 8.5 10.1 11.6
EBIT margin 6.2 5.4 7.0 8.3
Tax rate 11.2 13.2 14.1 13.8
RoCE 5.5 4.6 6.1 7.6
Total debt/Equity (x) 1.7 1.7 1.7 1.6
Net debt/Equity (x) 1.4 1.4 1.4 1.3
Du Pont Analysis - ROE
Net margin 2.7 0.8 1.9 3.1
Asset turnover (x) 0.7 0.7 0.7 0.8
Leverage factor (x) 3.6 3.7 3.7 3.6
Return on equity 7.1 2.1 5.2 8.4
Cash Flow Statement
Period end (Rs mn) Mar 15 Mar 16E Mar 17E Mar 18E
Profit before tax 3,402 8,944 23,712 40,584
Depreciation 35,906 40,788 42,904 46,900
Change in working capital 13,808 27,935 (10,651) (16,165)
Total tax paid (9,551) (9,608) (3,352) (5,591)
Others 30,737 36,627 40,536 44,093
Cash flow from oper. (a) 74,301 104,686 93,150 109,822
Capital expenditure (47,202) (65,622) (61,257) (56,887)
Change in investments 6,147 0 0 0
Others 11,047 9,341 9,156 9,339
Cash flow from inv. (b) (30,008) (56,281) (52,102) (47,548)
Free cash flow (a+b) 44,294 48,405 41,049 62,273
Equity raised/(repaid) 1,721 0 0 0
Debt raised/(repaid) 37,098 (4,390) 10,302 11,892
Dividend (incl. tax) (2,495) (6,255) (3,717) (3,717)
Others (77,741) (46,134) (47,179) (52,194)
Cash flow from fin. (c) (41,417) (56,779) (40,595) (44,019)
Net change in cash (a+b+c) 2,877 (8,374) 454 18,254
Income Statement
Period end (Rs mn) Mar 15 Mar 16E Mar 17E Mar 18E
Net sales 1,035,374 1,020,897 1,055,866 1,134,724
Growth (%) 18.7 (1.4) 3.4 7.5
Operating expenses (953,365) (934,538) (948,713) (1,003,146)
Operating profit 82,009 86,359 107,153 131,578
Other operating income 7,437 0 0 0
EBITDA 89,446 86,359 107,153 131,578
Growth (%) 7.9 (3.5) 24.1 22.8
Depreciation (35,906) (40,788) (42,904) (46,900)
Other income 11,047 9,341 9,156 9,339
EBIT 64,587 54,912 73,404 94,016
Finance cost (41,784) (45,968) (49,692) (53,432)
Exceptional & extraordinary (19,401) 0 0 0
Profit before tax 3,402 8,944 23,712 40,584
Tax (current + deferred) (2,564) (1,178) (3,352) (5,591)
P/(L) for the period 838 7,766 20,360 34,993
P/L of Associates, Min Int, Pref Div 7,704 161 177 195
Reported Profit/(Loss) 8,542 7,927 20,538 35,189
Adjusted net profit 27,943 7,927 20,538 35,189
Growth (%) 8.7 (71.6) 159.1 71.3
Balance Sheet
Period end (Rs mn) Mar 15 Mar 16E Mar 17E Mar 18E
Share capital 2,065 2,065 2,065 2,065
Reserves & surplus 381,220 385,430 402,250 433,722
Shareholders' funds 383,285 387,495 404,316 435,787
Minority interests and others 9,561 10,517 11,569 12,726
Non-current liabilities 667,116 660,495 677,116 681,085
Long-term borrowings 553,862 558,862 563,862 568,862
Other non-current liabilities 113,255 101,634 113,255 112,223
Current liabilities 371,426 375,780 386,916 410,617
ST borrowings, curr maturity 130,188 120,798 126,100 132,992
Other current liabilities 241,238 254,982 260,816 277,625
Total (equity and liab.) 1,431,389 1,434,288 1,479,917 1,540,214
Non-current assets 955,581 985,952 1,005,104 1,016,895
Fixed assets (net block) 729,098 759,800 778,153 788,140
Non-current investments 57,264 57,264 57,264 57,264
Long-term loans and adv. 23,687 23,355 24,155 25,959
Other non-current assets 145,532 145,532 145,532 145,532
Current assets 475,808 448,336 474,812 523,319
Cash & current investment 119,289 110,915 111,369 129,624
Other current assets 356,519 337,421 363,443 393,695
Total (assets) 1,431,389 1,434,288 1,479,917 1,540,214
Total debt 684,050 679,660 689,961 701,853
Capital employed 1,190,151 1,179,306 1,219,100 1,262,589

27METALS – 2QFY16 RESULTS REVIEW
B&K RESEARCH NOVEMBER 2015
Hindustan Zinc Maintain Outperformer
Volume driven growth...
2QFY16 performance
Hindustan Zinc’s (HZ) operating performance was better than our expectations on account
of better zinc and lead realisations; higher than expected by-products contribution and
DMF write-backs (Rs 1.4 bn versus our expectation of Rs 970 mn). EBITDA came in at Rs
21.6 bn versus our expectation of Rs 16.7 bn.
Other highlights and key takeaways from concalls
Management changes: Mr Sunil Duggal has been appointed as new CEO. He is with
HZ since 2010 and has experience of ~30 years. Prior to joining HZ, he was working at
Ambuja Cements as President.
Guidance: The company maintained the volume guidance of over 0.9 mn tonnes of
metal in FY16 and ~1.0 mn tonnes in FY17 backed by increase in the mining capacity of
Kayad, Sindesar Khurd and Zawar mines. Silver production guidance was maintained at
350-400 tonnes in FY16. Cost of production is expected to remain stable.
Lowered capex guidance: The company would spend ~US$ 200-225 mn annually on
expansion plan lower than previously envisaged capex of ~US$ 250 mn p.a.
Outlook and valuation
Better volumes backed by expansion of mines (SK, Zawar, Kayad and Rajpur Dariba)
would drive the next leg of growth. We believe that the concerns on slowdown in China
would keep the commodity prices under pressure over the medium-term. Though divestment
by GoI remains an inflection point for the stock, considering the improved government
finances (aided by low crude price), we do not expect this to happen anytime soon. The
stock has already reached our target price of Rs 152 (recommended Outperformer at Rs
122). We have reduced our zinc realisation for FY16 and FY17 from US$ 1,955 and US$
1,845 to US$ 1,810 and US$ 1,600, respectively. Lead realisations were also reduced to
US$ 1,750 and US$ 1,650 from US$ 1,805 and 1,750 for FY16 and FY17, respectively. We
have changed our INR/US$ assumption from 64.5 to 65. After factoring for everything,
our FY16 and FY17 EBITDA came down by ~1% and ~8%, respectively. We have also
introduced our FY18 estimates where we are taking almost flat volumes with zinc and lead
realisations of US$ 1,700 and US$ 1,750, respectively. At the current market price, we
believe most positives are factored in and upside is limited. We are valuing the company on
FY17 earnings and maintaining our Outperformer rating with a target price of Rs 160
(3.8x FY17E EV/EBITDA and 3.0x FY18E EV/EBITDA).
LARGE CAP
Share Data
Price (Rs) 142
BSE Sensex 25,776
Reuters code HZNC.BO
Bloomberg code HZ IN
Market cap. (US$ mn) 9,006
6M avg. daily turnover (US$ mn) 2.1
Issued shares (mn) 4,225
Target price (Rs) 160
Performance (%) 1M 3M 12M
Absolute (10) 17 (15)
Relative (4) 17 (6)
Valuation Ratios
Yr to 31 Mar FY17E FY18E
EPS (Rs) 19.8 20.9
+/- (%) (3.7) 5.5
PER (x) 7.1 6.8
PBV (x) 1.1 1.0
Dividend/Yield (%) 4.2 4.2
EV/Sales (x) 1.3 0.9
EV/EBITDA (x) 2.7 2.0
Major shareholders (%)
Promoters 65
GOI 30
FIIs 2
MFs 1
BFSI's 1
Public & Others 1
Relative performance
0
50
100
150
200
Apr
-07
Mar
-08
Mar
-09
Feb-
10
Jan-
11
Jan-
12
Dec
-12
Dec
-13
Dec
-14
Nov
-15
Hindus tan Zinc (Actual)Sensex

28METALS – 2QFY16 RESULTS REVIEW
B&K RESEARCH NOVEMBER 2015
Hindustan Zinc
Valuations
Period end (x) Mar 15 Mar 16E Mar 17E Mar 18E
PER 8.3 6.9 7.1 6.8
PCE 7.7 6.4 6.6 6.2
Price/Book 1.6 1.2 1.1 1.0
Yield (%) 2.7 3.5 4.2 4.2
EV/EBITDA 5.0 3.1 2.7 2.0
Key Ratios
Period end (%) Mar 15 Mar 16E Mar 17E Mar 18E
Adjusted EPS (Rs) 19.4 20.6 19.8 20.9
Growth 18.5 6.2 (3.7) 5.5
CEPS (Rs) 20.9 22.3 21.6 22.8
Book NAV/share (Rs) 102.6 117.3 130.1 144.0
Dividend/share (Rs) 4.4 5.0 6.0 6.0
Dividend payout ratio 27.0 28.4 35.5 33.6
EBITDA margin 50.2 49.4 46.4 46.9
EBIT margin 64.9 63.8 62.7 61.9
Tax rate 14.5 14.0 14.0 14.0
RoCE 22.5 20.6 17.7 16.9
Net debt/Equity (x) (0.7) (0.7) (0.7) (0.7)
Du Pont Analysis - ROE
Net margin 55.3 54.8 53.9 53.2
Asset turnover (x) 0.3 0.3 0.3 0.3
Leverage factor (x) 1.1 1.1 1.1 1.1
Return on equity 20.3 18.7 16.0 15.2
Cash Flow Statement
Period end (Rs mn) Mar 15 Mar 16E Mar 17E Mar 18E
Profit before tax 95,701 101,031 97,288 102,627
Depreciation 6,442 7,191 7,542 8,122
Change in working capital (8,617) (1,440) 2,296 (3,404)
Total tax paid (5,316) (13,154) (12,667) (13,362)
Others (27,975) (29,880) (32,874) (32,868)
Cash flow from oper. (a) 60,235 63,748 61,585 61,115
Capital expenditure (14,069) (18,124) (20,024) (22,999)
Change in investments (47,472) 0 0 0
Others 28,211 30,000 33,000 33,000
Cash flow from inv. (b) (33,330) 11,876 12,976 10,001
Free cash flow (a+b) 26,904 75,624 74,561 71,117
Debt raised/(repaid) 757 0 0 0
Dividend (incl. tax) (22,068) (24,718) (29,662) (29,662)
Others (593) (120) (126) (132)
Cash flow from fin. (c) (21,903) (24,838) (29,788) (29,794)
Net change in cash (a+b+c) 5,001 50,786 44,774 41,323
Income Statement
Period end (Rs mn) Mar 15 Mar 16E Mar 17E Mar 18E
Net sales 147,884 158,495 155,243 166,024
Growth (%) 8.5 7.2 (2.1) 6.9
Operating expenses (73,688) (80,153) (83,288) (88,143)
Operating profit 74,196 78,342 71,956 77,881
EBITDA 74,196 78,342 71,956 77,881
Growth (%) 7.5 5.6 (8.2) 8.2
Depreciation (6,442) (7,191) (7,542) (8,122)
Other income 28,211 30,000 33,000 33,000
EBIT 95,964 101,151 97,414 102,759
Finance cost (235) (120) (126) (132)
Exceptional & extraordinary (28) 0 0 0
Profit before tax 95,701 101,031 97,288 102,627
Tax (current + deferred) (13,921) (14,144) (13,620) (14,368)
P/(L) for the period 81,780 86,887 83,667 88,259
Reported Profit/(Loss) 81,780 86,887 83,667 88,259
Adjusted net profit 81,808 86,887 83,667 88,259
Growth (%) 18.5 6.2 (3.7) 5.5
Balance Sheet
Period end (Rs mn) Mar 15 Mar 16E Mar 17E Mar 18E
Share capital 8,451 8,451 8,451 8,451
Reserves & surplus 425,080 487,249 541,255 599,853
Shareholders' funds 433,531 495,700 549,706 608,303
Non-current liabilities 26,507 27,497 28,451 29,456
Long-term borrowings 1,321 1,321 1,321 1,321
Other non-current liabilities 25,186 26,176 27,130 28,135
Current liabilities 29,882 31,616 32,596 33,974
Other current liabilities 29,882 31,616 32,596 33,974
Total (equity and liab.) 489,920 554,813 610,752 671,734
Non-current assets 157,882 171,927 183,455 201,493
Fixed assets (net block) 114,509 125,441 137,923 152,800
Long-term loans and advances 43,373 46,485 45,532 48,693
Current assets 332,038 382,886 427,298 470,240
Cash & current investment 307,851 358,637 403,411 444,734
Other current assets 24,187 24,248 23,887 25,506
Total (assets) 489,920 554,813 610,752 671,734
Total debt 1,321 1,321 1,321 1,321
Capital employed 460,038 523,197 578,156 637,759

29METALS – 2QFY16 RESULTS REVIEW
B&K RESEARCH NOVEMBER 2015
Nalco Maintain BUY
Alumina to drive profits...
2QFY16 performance
Nalco’s operating performance was much better than our expectation. Both alumina as
well as aluminium volumes and realisations were better than our expectation leading to
outperformance. EBITDA came in at Rs 3.4 bn, 52% higher on QoQ basis (B&K estimate
stood at Rs 1.9 bn).
Other highlights and key takeaways from concalls
Volume guidance: The company is expected to produce ~370,000 tonnes of aluminium
in FY16 a tad higher than previous guidance of 360,000 tonnes owing to better availability
of e-auction coal at reasonable price. It is expected to produce alumina at full capacity in
FY16.
Increasing raw material security: Government has allotted Utkal D and E coal
blocks (non-operational) having combined reserve of ~100 mn tonnes to the company.
However, it will take time for these block to be operational (Utkal D is likely to commission
first); it would give much needed coal security for a part of the capacity. Also the company
is in advance stage of receiving Pottangi bauxite mine which would feed proposed 2 mn tpa
alumina refinery.
Cash position continues to improve: The net cash has improved to ~Rs 62 bn
(including Rs 8 bn on fixed maturity plan reported as long term investment) implying cash
per share of Rs 24 from Rs 22 in FY15.
Capex: FY16 capex is expected to be ~Rs 8 bn largely on 100 MW wind power plant.
Nalco would be setting up 1 mn tpa brownfield alumina plant at Damanjodi (backed by
Pottangi bauxite mine) with a capex of ~Rs 55 bn over the next four-five years.
Outlook and valuation
Aluminium LME and premia have both come off substantially since March 2015 which
has impact the profitability of aluminium division. However, impact on alumina division is
relatively lower (alumina prices are insulated from fall in premiums) which is expected to
drive the majority of the profits. Allotment of Utkal D and E blocks would ensure long term
coal security (both blocks having combined reserve of ~200 mn tonnes would take at least
24-30 months to commission). The company expects to maintain net cash (Rs 24/share)
status despite planned capex of Rs 55 bn over the next four-five years on 1 mn tpa alumina
refinery backed by Pottangi bauxite mine, gives us additional comfort. Given the steeper
fall in LME, we have reduced our realisation assumption by US$ 100/tonne to US$ 1,550/
tonne for FY17. Also we have factored in INR/US$ at 65 from previous assumption of
64.5. Consequently our FY17 EBITDA stands downward revised by ~9%. We are also
introducing FY18 numbers whereas we have assumed flat volumes with realisation of US$
1,650, ~US$ 100 higher YoY. On our revised earnings, we arrive at a target price of Rs 50;
the stock is quoting at an attractive valuation of 3.7x FY17E EV/EBITDA and 2.8x
FY18E EV/EBITDA. We maintain our Buy rating on the stock.
Remains our top pick in the sector.
MID CAP
Share Data
Price (Rs) 38
BSE Sensex 25,776
Reuters code NALU.BO
Bloomberg code NACL IN
Market cap. (US$ mn) 1,456
6M avg. daily turnover (US$ mn) 0.9
Issued shares (mn) 2,577
Target price (Rs) 50
Performance (%) 1M 3M 12M
Absolute (8) 27 (39)
Relative (2) 27 (33)
Valuation Ratios
Yr to 31 Mar FY17E FY18E
EPS (Rs) 3.6 4.5
+/- (%) (6.9) 25.0
PER (x) 10.5 8.4
PBV (x) 0.7 0.7
Dividend/Yield (%) 3.8 4.9
EV/Sales (x) 0.6 0.5
EV/EBITDA (x) 3.7 2.8
Major shareholders (%)
Promoters 81
FIIs 3
BFSI's 9
Public & Others 7
Relative performance
020406080
100120140160
Apr
-07
Mar
-08
Mar
-09
Feb-
10
Jan-
11
Jan-
12
Dec
-12
Dec
-13
Dec
-14
Nov
-15
Nalco (Actual)Sensex

30METALS – 2QFY16 RESULTS REVIEW
B&K RESEARCH NOVEMBER 2015
Nalco
Income Statement
Period end (Rs mn) Mar 15 Mar 16E Mar 17E Mar 18E
Net sales 73,828 69,877 69,247 73,481
Growth (%) 8.9 (5.4) (0.9) 6.1
Operating expenses (56,768) (57,576) (58,131) (59,038)
Operating profit 17,060 12,301 11,116 14,442
EBITDA 17,060 12,301 11,116 14,442
Growth (%) 82.6 (27.9) (9.6) 29.9
Depreciation (4,137) (4,337) (4,537) (4,737)
Other income 6,726 7,063 7,416 7,787
EBIT 19,650 15,027 13,996 17,492
Exceptional & extraordinary 1,484 0 0 0
Profit before tax 21,134 15,027 13,996 17,492
Tax (current + deferred) (7,916) (5,109) (4,759) (5,947)
P/(L) for the period 13,219 9,918 9,237 11,545
Reported Profit/(Loss) 13,219 9,918 9,237 11,545
Adjusted net profit 11,734 9,918 9,237 11,545
Growth (%) 69.6 (15.5) (6.9) 25.0
Balance Sheet
Period end (Rs mn) Mar 15 Mar 16E Mar 17E Mar 18E
Share capital 12,886 12,886 12,886 12,886
Reserves & surplus 115,087 120,595 125,509 131,517
Shareholders' funds 127,973 133,481 138,396 144,403
Non-current liabilities 14,133 14,820 15,540 16,297
Other non-current liabilities 14,133 14,820 15,540 16,297
Current liabilities 19,670 18,717 18,565 19,587
Other current liabilities 19,670 18,717 18,565 19,587
Total (equity and liab.) 161,777 167,018 172,501 180,287
Non-current assets 84,180 88,806 96,361 101,898
Fixed assets (net block) 71,952 75,966 82,880 87,743
Non-current Investments 10 10 10 10
Long-term loans and advances 12,219 12,829 13,471 14,144
Current assets 77,596 78,212 76,140 78,389
Cash & current investment 55,780 57,491 55,549 56,516
Other current assets 21,817 20,722 20,592 21,873
Total (assets) 161,777 167,018 172,501 180,287
Capital employed 142,106 148,301 153,936 160,700
Cash Flow Statement
Period end (Rs mn) Mar 15 Mar 16E Mar 17E Mar 18E
Profit before tax 21,134 15,027 13,996 17,492
Depreciation 4,137 4,337 4,537 4,737
Change in working capital (10,168) 1,326 (413) (671)
Total tax paid (5,882) (4,814) (4,178) (5,338)
Others (6,726) (7,063) (7,416) (7,787)
Cash flow from oper. (a) 2,494 8,813 6,525 8,434
Capital expenditure (254) (8,479) (11,584) (9,741)
Change in investments 2,940 0 0 0
Others 6,726 7,063 7,416 7,787
Cash flow from inv. (b) 9,413 (1,416) (4,168) (1,954)
Free cash flow (a+b) 11,907 7,396 2,357 6,480
Dividend (incl. tax) (5,156) (5,708) (4,323) (5,538)
Others (955) 23 24 26
Cash flow from fin. (c) (6,110) (5,686) (4,299) (5,512)
Net change in cash (a+b+c) 5,797 1,711 (1,942) 968
Key Ratios
Period end (%) Mar 15 Mar 16E Mar 17E Mar 18E
Adjusted EPS (Rs) 4.6 3.8 3.6 4.5
Growth 69.6 (15.5) (6.9) 25.0
CEPS (Rs) 6.2 5.5 5.3 6.3
Book NAV/share (Rs) 49.7 51.8 53.7 56.0
Dividend/share (Rs) 1.8 1.5 1.4 1.8
Dividend payout ratio 40.9 44.5 46.8 48.0
EBITDA margin 23.1 17.6 16.1 19.7
EBIT margin 26.6 21.5 20.2 23.8
Tax rate 40.3 34.0 34.0 34.0
RoCE 14.3 10.3 9.3 11.1
Net debt/Equity (x) (0.4) (0.4) (0.4) (0.4)
Du Pont Analysis - ROE
Net margin 15.9 14.2 13.3 15.7
Asset turnover (x) 0.5 0.4 0.4 0.4
Leverage factor (x) 1.3 1.3 1.2 1.2
Return on equity 9.4 7.6 6.8 8.2
Valuations
Period end (x) Mar 15 Mar 16E Mar 17E Mar 18E
PER 10.2 9.7 10.5 8.4
PCE 7.6 6.8 7.0 5.9
Price/Book 0.9 0.7 0.7 0.7
Yield (%) 3.8 3.9 3.8 4.9
EV/EBITDA 3.8 3.2 3.7 2.8

31METALS – 2QFY16 RESULTS REVIEW
B&K RESEARCH NOVEMBER 2015
PipesThe SAW pipe players under coverage have outperformed our expectation as they executed
better margins orders during the quarter. Seamless players continue to suffer from Chinese
dumping while stainless steel pipe players have also witnessed some slowdown in order
booking. Falling crude prices are impacting the cash flows of MENA region which is making
us cautious on the pace of new order book additions as many projects are getting delayed
or re-evaluated impacting the visibility beyond FY17. In India, government thrust on
infrastructure and water management (irrigation, interlinking river, smart cities), etc. would
drive the demand for HSAW as well as DI pipes (steadily growing). However, we expect
increasing competitive intensity (JSAW operating PSL’s mill) in HSAW business. This coupled
with delays in global orders execution is expected to put pressure on EBITDA/tonne going
forward. Stay cautious on the outlook for this sector.
Order book trend
(Rs bn) 2QFY14 3QFY14 4QFY14 1QFY15 2QFY15 3QFY15 4QFY15 1QFY16 2QFY16
Jindal SAW (US$ mn)
- SAW Pipes 230 278 475 685 655 660 630 615 500
- DI pipes 215 242 325 329 330 335 330 335 280
- Seamless pipes 30 40 20 19 15 15 10 15 10
Welspun Corp 35 55 58 64 71 66 72 58 52
Maharashtra Seamless 2 2 3 3 4 4 3 2 2
Ratnamani Metals & Tubes
- Stainless Steel pipes 5 5 5 5 4 4 4 4 4
- SAW pipes 3 3 6 8 6 5 5 6 10

32METALS – 2QFY16 RESULTS REVIEW
B&K RESEARCH NOVEMBER 2015
Jindal SAW Maintain Outperformer
Volume across segments to drive growth...
2QFY16 performance
Jindal SAW (JSAW) (standalone) reported EBITDA broadly in line with our estimates (at Rs
2.5 bn) despite lower revenues (lower SAW pipe volumes). However, EBITDA/tonne was
higher due to decline in other expenses (expiry of outsourced coating contract in Middle
East market during last quarter led to lower other expenses in 1Q). Blended EBITDA per
tonne (ex-pellets) for pipes was better at ~Rs 8,600 versus our estimate of ~Rs 7,900).
Order book: Standalone order book stood at ~US$ 790 mn (SAW pipes – US$ 500 mn;
DI – US$ 280 mn and seamless – US$ 10 mn) versus US$ 965 mn in 1Q implying no major
additions during the quarter. UAE DI pipe plant has an order book of ~100,000 tonnes
and US pipe mill has an order book of US$ 25-50 mn.
Outlook and valuation
Better utilisation of SAW pipe facilities along with ramping up of DI pipe facilities (Mundra
and UAE) is expected to drive volumes in FY16 and 1HFY17. Falling crude prices are
impacting the cash flows of MENA region countries which are in turn delaying the projects
impacting the demand and visibility beyond 2HFY17. We expect increasing competitive
intensity in HSAW business coupled with delays in execution of orders to put pressure on
EBITDA/tonne going forward. Significant fall in pellet prices would also impact the overall
EBITDA. JSAW would be hiving off the loss making subsidiary Jindal ITF into a separate
listed entity (some regulatory approvals pending). Deferring the steel mill capex for the time
being is a welcome step given the current scenario. We expect some reduction in debt going
forward due to lower capex. We have introduced our FY18 estimates where we are assuming
~0.1 mn tonnes lower SAW pipe volumes in standalone business as we expect the fall in
crude pieces would impact the execution of orders going forward. We have taken EBITDA/
tonne at Rs 6,800 almost Rs 1,500 lower YoY (deteriorating in product mix and increasing
competitive intensity).
Maintain Outperformer with a target price of Rs 75 (7.7x FY17E EV/EBITDA).
MID CAP
Relative performance
Share Data
Price (Rs) 63
BSE Sensex 25,776
Reuters code JIND.BO
Bloomberg code JSAW IN
Market cap. (US$ mn) 291
6M avg. daily turnover (US$ mn) 1.3
Issued shares (mn) 305
Target price (Rs) 75
Performance (%) 1M 3M 12M
Absolute (8) (1) (41)
Relative (2) (1) (35)
Valuation Ratios
Yr to 31 Mar FY17E FY18E
EPS (Rs) 8.8 6.5
+/- (%) 16.5 (25.5)
PER (x) 7.2 9.6
PBV (x) 0.5 0.4
Dividend/Yield (%) 1.6 1.3
EV/Sales (x) 0.8 0.8
EV/EBITDA (x) 7.4 7.8
Major shareholders (%)
Promoters 51
FIIs 10
MFs 11
BFSI's 2
Public & Others 26
0
50
100
150
200
250
300
Apr
-07
Apr
-08
Jun-
09
Jun-
10
Jul-1
1
Aug
-12
Sep-
13
Oct
-14
Nov
-15
Jindal Saw (Actual)Sensex

33METALS – 2QFY16 RESULTS REVIEW
B&K RESEARCH NOVEMBER 2015
Jindal SAW
Valuations
Period end (x) Mar 15 Mar 16E Mar 17E Mar 18E
PER 17.0 8.4 7.2 9.6
PCE 3.7 2.9 2.8 3.0
Price/Book 0.5 0.5 0.5 0.4
Yield (%) 1.5 1.6 1.6 1.3
EV/EBITDA 10.3 8.3 7.4 7.8
Key Ratios
Period end (%) Mar 15 Mar 16E Mar 17E Mar 18E
Adjusted EPS (Rs) 3.9 7.5 8.8 6.5
Growth 94.9 16.5 (25.5)
CEPS (Rs) 17.8 21.5 22.7 20.8
Book NAV/share (Rs) 127.1 131.2 136.4 141.9
Dividend/share (Rs) 1.0 1.0 1.0 0.8
Dividend payout ratio 135.0 16.2 13.8 15.0
EBITDA margin 11.2 11.6 11.5 10.5
EBIT margin 8.0 8.7 8.7 7.6
Tax rate 17.4 25.0 25.0 25.0
RoCE 5.9 6.9 7.4 6.5
Total debt/Equity (x) 2.2 1.9 1.6 1.5
Net debt/Equity (x) 2.0 1.8 1.5 1.4
Du Pont Analysis - ROE
Net margin 1.3 2.3 2.6 2.0
Asset turnover (x) 0.6 0.7 0.7 0.7
Leverage factor (x) 3.6 3.8 3.6 3.3
Return on equity 3.1 6.0 6.7 4.7
Cash Flow Statement
Period end (Rs mn) Mar 15 Mar 16E Mar 17E Mar 18E
Profit before tax 359 2,891 3,557 2,588
Depreciation 4,029 4,260 4,463 4,568
Change in working capital (11,014) (3,175) (339) 1,071
Total tax paid (231) (979) (770) (516)
Others 4,750 4,266 4,230 3,873
Cash flow from oper. (a) (2,106) 7,263 11,141 11,585
Capital expenditure (12,948) (2,557) (3,227) (3,617)
Change in investments (2,305) 0 0 0
Others 623 1,442 1,455 1,469
Cash flow from inv. (b) (14,631) (1,116) (1,772) (2,149)
Free cash flow (a+b) (16,736) 6,148 9,368 9,436
Equity raised/(repaid) 797 1,176 1,235 0
Debt raised/(repaid) 23,408 (4,000) (5,000) (5,000)
Dividend (incl. tax) (323) (349) (372) (388)
Others (5,071) (5,213) (5,316) (5,116)
Cash flow from fin. (c) 18,810 (8,386) (9,454) (10,504)
Net chg in cash (a+b+c) 2,074 (2,239) (86) (1,069)
Income Statement
Period end (Rs mn) Mar 15 Mar 16E Mar 17E Mar 18E
Net sales 83,247 98,755 106,533 104,938
Growth (%) 25.1 18.6 7.9 (1.5)
Operating expenses (73,890) (87,337) (94,283) (93,908)
Operating profit 9,356 11,418 12,250 11,030
Other operating income 0 0 0 0
EBITDA 9,356 11,418 12,250 11,030
Growth (%) 46.2 22.0 7.3 (10.0)
Depreciation (4,029) (4,260) (4,463) (4,568)
Other income 1,291 1,442 1,455 1,469
EBIT 6,618 8,599 9,242 7,930
Finance cost (5,398) (5,708) (5,685) (5,342)
Exceptional & extraordinary (861) 0 0 0
Profit before tax 359 2,891 3,557 2,588
Tax (current + deferred) (213) (723) (889) (647)
P/(L) for the period 147 2,169 2,668 1,941
P/L of Associates, 112 123 135 149Min Int, Pref Div
Reported Profit/(Loss) 259 2,292 2,803 2,090
Adjusted net profit 1,120 2,292 2,803 2,090
Growth (%) 104.6 22.3 (25.5)
Balance Sheet
Period end (Rs mn) Mar 15 Mar 16E Mar 17E Mar 18E
Share capital 580 609 640 640
Reserves & surplus 36,318 39,384 43,003 44,778
Shareholders' funds 36,898 39,993 43,642 45,418
Minority Interest and others 1,543 1,620 1,701 1,786
Non-current liabilities 47,596 44,058 39,394 34,588
Long-term borrowings 44,303 40,303 35,303 30,303
Other non-current liabilities 3,292 3,754 4,091 4,285
Current liabilities 57,826 62,124 64,345 64,125
ST borrowings, Curr maturity 38,994 38,994 38,994 38,994
Other current liabilities 18,832 23,130 25,351 25,131
Total (Equity and Liab.) 143,862 147,794 149,082 145,917
Non-current assets 73,216 71,841 70,770 69,785
Fixed assets (Net block) 69,317 67,614 66,379 65,428
Non-current Investments 172 172 172 172
Long-term loans and advances 2,191 2,519 2,683 2,649
Other non-current assets 1,536 1,536 1,536 1,536
Current assets 70,646 75,953 78,312 76,132
Cash & current investment 6,390 4,152 4,066 2,997
Other current assets 64,256 71,802 74,247 73,135
Total (Assets) 143,862 147,794 149,082 145,917
Total debt 83,297 79,297 74,297 69,297
Capital employed 125,030 124,664 123,732 120,786

34METALS – 2QFY16 RESULTS REVIEW
B&K RESEARCH NOVEMBER 2015
0
100
200
300
400
500
600
Apr
-07
Mar
-08
Mar
-09
Feb-
10
Jan-
11
Jan-
12
Dec
-12
Dec
-13
Dec
-14
Nov
-15
Welspun Corp (Actual)Sens ex
Welspun Corp Maintain Outperformer
Cautious outlook...
2QFY16 performance
Welspun Corp’s operating results were significantly better than our expectations primarily
on account of higher volumes. EBITDA came in better than our expectation at ~Rs 3.06
bn versus our estimate of Rs 2.17 bn. Blended EBITDA per tonne stood at ~Rs 9,400
against our estimate of ~Rs 7,750. . The company has executed better margins order
during the quarter (contribution from US Mill as well as exports from India was higher).
Order book: The current pipe order book stands at ~Rs 52 bn (~0.85 mn tonnes) as
against Rs 58 bn (~0.83 mn tonnes) in 1QFY16. Nearly 53% of the orders are from US and
29% from MENA region. The company has a strong bid pipeline of ~4 mn tonnes (~5%
conversion rate).
Outlook and valuation
Welspun Corp enjoys one of the best order books among domestic pipe players providing
reasonable earning visibility till 1HFY17 (pending bids of ~4 mn tonnes). Nearly half of
current order book is from US market which enjoys better EBITDA/tonne. Though, the
company has managed to maintain its order book, falling crude prices (Welspun Corp’s
dependence on oil & gas market is high) is making us cautious on the pace of new order
book additions as many projects are getting delayed or re-evaluated, impacting the visibility
beyond FY17. The domestic water pipeline demand expected to remain strong. However,
increasing competitive intensity (JSAW is operating PSL mills) would impact the EBITDA/
tonne of new orders. Given the company would not be incurring any capex; we expect net
debt to reduce gradually. We are introducing our FY18 numbers where we expect ~0.1 mn
tonnes lower volumes YoY. Also we expect EBITDA/tonne to be lower at Rs 7,000 against
Rs 8,100 in FY17 (fall in crude prices to impact order inflows along with increasing
competitive intensity to put pressure on EBITDA/tonne). Overall, EBITDA is expected to
be lower by ~20% YoY.
Maintain Outperformer with a target price of Rs 125 (4.7x FY17E EV/EBITDA).
MID CAP
Relative performance
Share Data
Price (Rs) 100
BSE Sensex 25,776
Reuters code wgsr.BO
Bloomberg code wlco IN
Market cap. (US$ mn) 396
6M avg. daily turnover (US$ mn) 2.7
Issued shares (mn) 263
Target price (Rs) 125
Performance (%) 1M 3M 12M
Absolute (10) (4) 34
Relative (4) (4) 48
Valuation Ratios
Yr to 31 Mar FY17E FY18E
EPS (Rs) 10.1 6.6
+/- (%) (1.4) (33.9)
PER (x) 9.9 15.0
PBV (x) 0.8 0.8
Dividend/Yield (%) 1.0 1.0
EV/Sales (x) 0.4 0.4
EV/EBITDA (x) 4.0 4.3
Major shareholders (%)
Promoters 41
FIIs 13
MFs 2
BFSI's 8
Public & Others 36

35METALS – 2QFY16 RESULTS REVIEW
B&K RESEARCH NOVEMBER 2015
Welspun Corp
Valuations
Period end (x) Mar 15 Mar 16E Mar 17E Mar 18E
PER 20.5 9.8 9.9 15.0
PCE 2.8 3.6 3.6 4.0
Price/Book 0.5 0.9 0.8 0.8
Yield (%) 0.9 1.0 1.0 1.0
EV/EBITDA 3.9 4.3 4.0 4.3
Key Ratios
Period end (%) Mar 15 Mar 16E Mar 17E Mar 18E
Adjusted EPS (Rs) 2.6 10.2 10.1 6.6
Growth (5.9) 288.6 (1.4) (33.9)
CEPS (Rs) 19.2 27.5 27.8 25.0
Book NAV/share (Rs) 106.4 115.4 124.3 129.8
Dividend/share (Rs) 0.5 1.0 1.0 1.0
Dividend payout ratio 22.9 11.8 11.9 18.1
EBITDA margin 10.0 11.4 10.8 9.3
EBIT margin 6.1 7.6 7.0 5.1
Tax rate 7.7 20.0 20.0 20.0
RoCE 7.2 10.0 9.7 6.8
Total debt/Equity (x) 1.0 0.8 0.6 0.4
Net debt/Equity (x) 0.6 0.5 0.4 0.2
Du Pont Analysis - ROE
Net margin 0.8 3.0 2.9 2.1
Asset turnover (x) 0.9 0.9 1.0 0.9
Leverage factor (x) 3.3 3.3 3.0 2.7
Return on equity 2.4 9.2 8.4 5.2
Cash Flow Statement
Period end (Rs mn) Mar 15 Mar 16E Mar 17E Mar 18E
Profit before tax 2,313 4,141 4,058 2,476
Depreciation 4,365 4,555 4,674 4,838
Change in working capital 2,068 (4,114) (325) 1,110
Total tax paid 105 (506) (471) (136)
Others 2,830 2,655 2,416 1,879
Cash flow from oper. (a) 11,680 6,732 10,351 10,168
Capital expenditure (1,412) (1,975) (1,371) (1,429)
Change in investments 3,350 (531) (1,592) 0
Others 1 (6) (6) (7)
Cash flow from inv. (b) 1,939 (2,512) (2,969) (1,436)
Free cash flow (a+b) 13,619 4,220 7,382 8,732
Equity raised/(repaid) (3) 0 0 0
Debt raised/(repaid) (7,206) (4,231) (4,231) (6,396)
Dividend (incl. tax) (154) (300) (298) (297)
Others (4,377) (3,004) (2,710) (1,774)
Cash flow from fin. (c) (11,739) (7,535) (7,239) (8,467)
Net chg in cash (a+b+c) 1,880 (3,314) 143 265
Income Statement
Period end (Rs mn) Mar 15 Mar 16E Mar 17E Mar 18E
Net sales 84,505 89,783 92,021 84,738
Growth (%) 9.7 6.2 2.5 (7.9)
Operating expenses (76,083) (79,532) (82,084) (76,876)
Operating profit 8,422 10,252 9,937 7,862
EBITDA 8,422 10,252 9,937 7,862
Growth (%) 25.8 21.7 (3.1) (20.9)
Depreciation (4,365) (4,555) (4,674) (4,838)
Other income 1,086 1,100 1,210 1,331
EBIT 5,143 6,796 6,473 4,355
Finance cost (2,830) (2,655) (2,416) (1,879)
Profit before tax 2,313 4,141 4,058 2,476
Tax (current + deferred) (177) (828) (812) (495)
P/(L) for the period 2,135 3,313 3,246 1,981
P/L of Associates, Min Int, (1,445) (630) (602) (232)Pref Div
Reported Profit/(Loss) 690 2,683 2,645 1,748
Adjusted net profit 690 2,683 2,645 1,748
Growth (%) (5.9) 288.6 (1.4) (33.9)
Balance Sheet
Period end (Rs mn) Mar 15 Mar 16E Mar 17E Mar 18E
Share capital 1,316 1,316 1,316 1,316
Reserves & surplus 26,672 29,040 31,369 32,802
Shareholders' funds 27,988 30,356 32,684 34,118
Minority interests and others 3,563 3,811 4,085 4,386
Non-current liabilities 32,897 29,234 25,588 19,959
Long-term borrowings 26,160 22,160 18,160 12,160
Other non-current liabilities 6,737 7,074 7,428 7,799
Current liabilities 33,707 30,104 30,616 28,311
ST borrowings, curr maturity 4,046 3,815 3,584 3,189
Other current liabilities 29,661 26,289 27,032 25,122
Total (equity and liab.) 98,155 93,505 92,974 86,774
Non-current assets 49,063 47,083 45,446 42,115
Fixed assets (net block) 47,415 44,832 41,528 38,116
Non-current investments 265 796 2,387 2,387
Long-term loans and advances 1,321 1,387 1,456 1,529
Other non-current assets 63 69 75 82
Current assets 49,092 46,422 47,528 44,659
Cash & current investment 11,111 7,797 7,939 8,204
Other current assets 37,981 38,626 39,588 36,455
Total (assets) 98,155 93,505 92,974 86,774
Total debt 30,205 25,975 21,744 15,349
Capital employed 68,494 67,216 65,942 61,652

36METALS – 2QFY16 RESULTS REVIEW
B&K RESEARCH NOVEMBER 2015
0
300
600
900
Apr
-07
Mar
-08
Mar
-09
Feb-
10
Jan-
11
Jan-
12
Dec
-12
Dec
-13
Dec
-14
Nov
-15
Ratnamani Metals &Tubes (Actual)Sensex
Ratnamani Metals & Tubes Maintain Outperformer
Niche play...
2QFY16 performance
Ratnamani Metals and Tubes (RMTL) reported sequentially much better operating
performance aided by both SS and CS segment (lower raw material incidence). Revenues
stood at Rs 4.3 bn, ~15% and 23% higher on QoQ and YoY basis, respectively. Sequentially
RMTL reported almost flat volumes in SS and ~15% higher in CS segment. While SS and
CS segment reported ~4% and ~7% better realisation. EBITDA stood at Rs 883 mn
versus Rs 558 mn in 4Q EBITDA margins stood at 20.5% versus 14.9% in 4Q.
Other highlights and key takeaways from concalls
Guidance: Management expects 10-15% volume growth in FY16. However, due to decline
in realisations, overall revenues may remain flat. Blended EBITDA margin guidance was
reduced by 50-100 bps to 17-19% (previous guidance was 18-20%) owing to higher
contribution from CG segment.
Order book: The current order book has increased by Rs 4.4 bn (primarily on account of
CS segment) to Rs 13.8 bn. Out of the total order book, ~Rs 4 bn is for stainless steel pipes
Rs 9.8 bn is for carbon steel pipes.
Capex: Capex guidance for FY16 maintained at Rs 500-700 mn and for FY17 Rs 1.2-1.3
bn. FY17 capex is higher as the company intends to expand SS segment capacity by 20,000
tpa (to be completed in three-four years in phases).
Working capital stretched: Working capital requirement has increased meaningfully
on account of higher order book and delays in delivery (customers are delaying dispatches).
This is expected to normalise going forward.
Outlook and valuation
We expect SS segment to drive the majority of profitability going forward. Growth in this
segment could be affected due to fall in crude prices, however, we expect the company to
largely maintain the margins owing to its superior product mix and leadership position.
Translation to Euro VI fuel standard and government plan to provide power to all would
be major growth drivers going forward. Outlook for CS segment also remains strong as the
companies continue to improve its order book. Water projects of Rajasthan, Telangana,
Gujarat, and Madhya Pradesh would drive the demand in this segment.
Given the order book additions were primarily on CS segment coupled with deteriorating
outlook of SS segment owing to fall in crude prices, we have changed the product mix of
SS: CS to 46:54 to 40:60 for FY16 and FY17. Consequently our EBITDA witnessed a fall
of ~7% for both the years.
Maintain Outperformer with a target price of Rs 650 (9.0x FY17E EV/EBITDA).
MID CAP
Share Data
Price (Rs) 572
BSE Sensex 25,776
Reuters code RMT.BO
Bloomberg code RMT IN
Market cap. (US$ mn) 402
6M avg. daily turnover (US$ mn) 0.2
Issued shares (mn) 47
Target price (Rs) 650
Performance (%) 1M 3M 12M
Absolute (12) (3) (4)
Relative (6) (3) 7
Valuation Ratios
Yr to 31 Mar FY17E FY18E
EPS (Rs) 40.4 43.0
+/- (%) 9.5 6.4
PER (x) 14.1 13.3
PBV (x) 2.2 1.9
Dividend/Yield (%) 1.1 1.1
EV/Sales (x) 1.4 1.3
EV/EBITDA (x) 7.9 7.4
Major shareholders (%)
Promoters 60
FIIs 13
MFs 1
Public & Others 26
Relative performance

37METALS – 2QFY16 RESULTS REVIEW
B&K RESEARCH NOVEMBER 2015
Ratnamani Metals & Tubes
Valuations
Period end (x) Mar 15 Mar 16E Mar 17E Mar 18E
PER 18.6 15.5 14.1 13.3
PCE 14.2 11.6 10.7 9.9
Price/Book 3.5 2.5 2.2 1.9
Yield (%) 0.8 0.9 1.1 1.1
EV/EBITDA 10.5 8.8 7.9 7.4
Key Ratios
Period end (%) Mar 15 Mar 16E Mar 17E Mar 18E
Adjusted EPS (Rs) 36.9 36.9 40.4 43.0
Growth 1.6 0.0 9.5 6.4
CEPS (Rs) 48.6 49.1 53.3 57.8
Book NAV/share (Rs) 194.4 224.9 258.0 293.2
Dividend/share (Rs) 5.5 5.4 6.1 6.5
Dividend payout ratio 17.9 17.5 18.2 18.2
EBITDA margin 17.9 17.8 17.7 17.2
EBIT margin 16.1 16.0 16.2 15.5
Tax rate 33.8 33.3 33.3 33.3
RoCE 28.4 25.2 24.2 22.7
Total debt/Equity (x) 0.0 0.1 0.0 0.0
Net debt/Equity (x) (0.1) (0.0) (0.1) (0.1)
Du Pont Analysis - ROE
Net margin 10.3 10.1 10.2 10.0
Asset turnover (x) 1.4 1.3 1.3 1.2
Leverage factor (x) 1.4 1.3 1.3 1.3
Return on equity 20.3 17.6 16.8 15.6
Cash Flow Statement
Period end (Rs mn) Mar 15 Mar 16E Mar 17E Mar 18E
Profit before tax 2,607 2,586 2,833 3,016
Depreciation 544 571 599 689
Change in working capital (903) (1,608) (532) (548)
Total tax paid (871) (837) (918) (978)
Others 94 142 160 95
Cash flow from oper. (a) 1,470 854 2,142 2,274
Capital expenditure (661) (881) (1,029) (1,269)
Change in investments 340 0 0 0
Cash flow from inv. (b) (321) (881) (1,029) (1,269)
Free cash flow (a+b) 1,149 (27) 1,113 1,005
Equity raised/(repaid) 4 0 0 0
Debt raised/(repaid) (426) 458 (360) (180)
Dividend (incl. tax) (309) (301) (343) (366)
Others (363) (141) (159) (95)
Cash flow from fin. (c) (1,095) 15 (863) (640)
Net chg in cash (a+b+c) 54 (11) 250 365
Income Statement
Period end (Rs mn) Mar 15 Mar 16E Mar 17E Mar 18E
Net sales 16,756 17,039 18,515 20,030
Growth (%) 23.8 1.7 8.7 8.2
Operating expenses (13,762) (14,012) (15,247) (16,581)
Operating profit 2,993 3,027 3,268 3,449
EBITDA 2,993 3,027 3,268 3,449
Growth (%) 5.6 1.1 8.0 5.5
Depreciation (544) (571) (599) (689)
Other income 251 273 324 351
EBIT 2,701 2,728 2,993 3,111
Finance cost (94) (142) (160) (95)
Profit before tax 2,607 2,586 2,833 3,016
Tax (current + deferred) (882) (861) (943) (1,004)
P/(L) for the period 1,725 1,725 1,890 2,011
Reported Profit/(Loss) 1,725 1,725 1,890 2,011
Adjusted net profit 1,725 1,725 1,890 2,011
Growth (%) 1.7 0.0 9.5 6.4
Balance Sheet
Period end (Rs mn) Mar 15 Mar 16E Mar 17E Mar 18E
Share capital 93 93 93 93
Reserves & surplus 8,990 10,415 11,962 13,608
Shareholders' funds 9,084 10,508 12,055 13,702
Non-current liabilities 562 544 569 595
Long-term borrowings 84 42 42 42
Other non-current liabilities 478 502 527 553
Current liabilities 2,610 2,879 2,682 2,671
ST borrowings, curr maturity 220 720 360 180
Other current liabilities 2,390 2,159 2,322 2,491
Total (equity and liab.) 12,256 13,931 15,306 16,967
Non-current assets 4,916 5,251 5,708 6,317
Fixed assets (net block) 4,666 4,976 5,405 5,985
Non-current investments 1 1 1 1
Long-term loans and advances 249 274 302 332
Current assets 7,340 8,680 9,599 10,650
Cash & current investment 957 946 1,196 1,561
Other current assets 6,383 7,734 8,403 9,089
Total (assets) 12,256 13,931 15,306 16,967
Total debt 304 762 402 222
Capital employed 9,866 11,772 12,984 14,477

38METALS – 2QFY16 RESULTS REVIEW
B&K RESEARCH NOVEMBER 2015
0200400600800
1,0001,2001,400
Apr
-07
Mar
-08
Mar
-09
Feb-
10
Jan-
11
Jan-
12
Dec
-12
Dec
-13
Dec
-14
Nov
-15
Maharashtra Seamles s(Actual)Sens ex
Maharashtra Seamless Maintain Underperformer
Demand outlook deteriorating...
2QFY16 performance
Maharashtra Seamless’s (MHS) operating performance was below our expectation owing
to higher than expected other expenditure. Revenues came in line with expectation at
stood at Rs 2.64 bn (B&K estimate was Rs 2.68 bn). Total pipes volumes were in line with
expectation at ~53,000 tonnes. The company reported EBITDA of Rs 27 mn versus our
expectation of Rs 74 mn. Other income came in lower at Rs 109 mn against our expectation
of Rs 170 mn further denting the PAT.
Other highlights and key takeaways from concalls
2H performance expected to remain subdued: The 1H performance was marred
by ~Rs 250 mn inventory losses (booked in 1Q) due to sharp correction in steel prices.
Therefore 2Q performance is expected to be better, provided price does not crash
significantly from current levels.
Net cash to support earnings: The cash and equivalents as of 1HFY16 stand at Rs 5.4
bn. The company expects other income from investments to support the net profit in a
meaningful way going forward.
Outlook and valuation
Continued Chinese dumping and slowdown in E&P activities owing to fall in crude prices is
taking a toll on the performance of the company. We expect that the implementation of
safeguard duty would aid the company to win back some portion of demand lost to Chinese
dumping. However, benefits of duty were below expectation owing to subdued demand
and price differential maintained by Chinese players. Also the order book of less than a
quarter gives us limited visibility on the future earnings of the company. Significant
investment in non core businesses (iron ore mine and rig business) during weak commodity
outlook is also a concern. Seamless pipe players have requested the government to put an
anti-dumping duty on Chinese imports which if implemented can be the only silver lining
for the company.
We have reduced our FY16 and FY17 seamless pipe volumes by ~9% and ~14%,
respectively. We have also toned down our realisation assumptions by ~7% to incorporate
the steeper than expected fall in realisations. However, we have increased the ERW pipe
volumes by ~10,000 tonnes (~17% higher) for both the years. After factoring in everything,
our FY16 and FY17 EBITDA have reduced to Rs 43 mn and Rs 268 mn from Rs 717 mn
and Rs 776 mn, respectively.
We value the core business (pipes) at 8.0x EV/EBITDA and arrived at a fair value of Rs
104. Also, we are also giving 60% discount to investments in iron ore business which gives
per share value of Rs 36. Thus, we are maintaining Underperformer rating with a target
price of Rs 140.
SMALL CAP
Share Data
Price (Rs) 151
BSE Sensex 25,776
Reuters code MHSM.BO
Bloomberg code MHS IN
Market cap. (US$ mn) 152
6M avg. daily turnover (US$ mn) 0.1
Issued shares (mn) 67
Target price (Rs) 140
Performance (%) 1M 3M 12M
Absolute (5) (0) (52)
Relative 1 (0) (46)
Valuation Ratios
Yr to 31 Mar FY17E FY18E
EPS (Rs) 7.7 10.3
+/- (%) 52.1 33.4
PER (x) 20.0 15.0
PBV (x) 0.5 0.5
Dividend/Yield (%) 3.5 3.5
EV/Sales (x) 0.5 0.5
EV/EBITDA (x) 20.7 13.4
Major shareholders (%)
Promoters 59
FIIs 9
MFs 7
Public & Others 25
Relative performance

39METALS – 2QFY16 RESULTS REVIEW
B&K RESEARCH NOVEMBER 2015
Maharashtra Seamless
Valuations
Period end (x) Mar 15 Mar 16E Mar 17E Mar 18E
PER 10.8 30.4 20.0 15.0
PCE 8.7 16.0 12.1 10.2
Price/Book 0.6 0.5 0.5 0.5
Yield (%) 2.5 3.2 3.5 3.5
EV/EBITDA 9.0 147.3 20.7 13.4
Key Ratios
Period end (%) Mar 15 Mar 16E Mar 17E Mar 18E
Adjusted EPS (Rs) 18.3 5.1 7.7 10.3
Growth 28.6 (72.2) 52.1 33.4
CEPS (Rs) 22.7 9.7 12.8 15.2
Book NAV/share (Rs) 338.0 332.8 329.8 329.4
Dividend/share (Rs) 5.0 5.0 5.5 5.5
Dividend payout ratio 32.9 114.9 83.1 62.3
EBITDA margin 8.1 0.4 2.5 3.6
EBIT margin 12.0 4.4 6.7 7.7
Tax Rate 23.2 23.2 23.2 23.2
RoCE 5.6 1.7 2.5 3.4
Net debt/Equity (x) (0.1) (0.1) (0.2) (0.2)
Du Pont Analysis - ROE
Net margin 9.0 3.1 4.9 5.7
Asset turnover (x) 0.4 0.4 0.4 0.4
Leverage factor (x) 1.4 1.4 1.3 1.3
Return on equity 5.5 1.5 2.3 3.1
Cash Flow Statement
Period end (Rs mn) Mar 15 Mar 16E Mar 17E Mar 18E
Profit before tax 1,596 444 676 901
Depreciation 292 308 339 (324)
Change in working capital (1,495) 982 804 (443)
Total tax paid (216) (87) (94) (143)
Others (620) (543) (571) (864)
Cash flow from oper. (a) (442) 1,105 1,153 38
Capital expenditure (152) (246) (250) (250)
Change in investments 1,167 224 235 247
Others 237 355 373 391
Cash flow from inv. (b) 1,252 332 357 387
Free cash flow (a+b) 811 1,437 1,510 425
Equity raised/(repaid) (277) 0 0 0
Debt raised/(repaid) (46) 5 5 5
Dividend (incl. tax) (468) (402) (390) (429)
Others (156) (319) (318) (318)
Cash flow from fin. (c) (947) (716) (703) (742)
Net change in cash (a+b+c) (136) 721 807 (317)
Income Statement
Period end (Rs mn) Mar 15 Mar 16E Mar 17E Mar 18E
Net sales 13,552 10,863 10,623 12,102
Growth (%) 12.4 (19.8) (2.2) 13.9
Operating expenses (12,455) (10,820) (10,354) (11,662)
Operating profit 1,097 43 268 440
EBITDA 1,097 43 268 440
Growth (%) 24.8 (96.1) 521.6 63.9
Depreciation (292) (308) (339) (324)
Other income 828 745 783 822
EBIT 1,632 480 712 937
Finance Cost (36) (36) (36) (36)
Profit before tax 1,596 444 676 901
Tax (current + deferred) (371) (103) (157) (209)
P/(L) for the period 1,226 341 519 692
Reported Profit/(Loss) 1,226 341 519 692
Adjusted net profit 1,226 341 519 692
Growth (%) 26.2 (72.2) 52.1 33.4
Balance Sheet
Period end (Rs mn) Mar 15 Mar 16E Mar 17E Mar 18E
Share Capital 335 335 335 335
Reserves & surplus 27,685 26,934 26,322 25,883
Shareholders' funds 28,020 27,269 26,657 26,218
Non-current liabilities 1,216 1,241 1,290 1,341
Long-term borrowings 8 8 8 8
Other Long term liab, Prov, DTL 1,209 1,233 1,282 1,334
Current liabilities 1,719 1,652 1,722 1,871
Short-term borrowings, curr maturity 96 101 106 112
Other current liab + provi 1,623 1,551 1,615 1,759
Total (equity and liab.) 30,956 30,162 29,668 29,430
Non-current assets 15,387 14,939 14,467 14,012
Fixed assets (net block) 11,976 11,505 11,007 10,524
Non-current investments 2,947 2,947 2,947 2,947
Long-term loans and advances 464 487 513 541
Current assets 15,569 15,222 15,201 15,418
Cash & current investment 3,414 4,134 4,941 4,624
Other current assets 12,155 11,088 10,260 10,794
Total (assets) 30,956 30,162 29,668 29,430
Total debt 104 109 114 120
Capital employed 29,333 28,611 28,053 27,671

40METALS – 2QFY16 RESULTS REVIEW
B&K RESEARCH NOVEMBER 2015
Ferrous – Change in estimates
FY16E FY17E Consensus FY18E
(Rs mn) Old New Old New FY16E FY17E %
Sales 1,390,942 1,209,925 1,470,506 1,283,042 1,298,106 1,390,213 1,370,054
EBITDA 134,640 108,302 153,462 146,013 106,444 140,516 173,586
Adj. PAT 478 (1,659) 11,094 8,878 6,526 16,190 26,262
Tata Steel EPS (Rs) 0.5 (1.7) 11.4 9.1 7.0 5.5 27.0
Net debt 677,505 660,940 664,717 664,419 - - 612,951
RoCE (%) 6.0 4.4 7.3 6.7 - - 8.6
RoE (%) 0.1 (0.5) 3.4 2.6 - - 7.5
Sales 213,285 203,322 257,588 265,307 227,894 263,453 319,807
EBITDA 44,998 40,310 60,653 53,566 48,851 61,815 69,841
Adj. PAT (10,526) (11,330) 405 (4,686) -7,091 1,339 9,156
Jindal Steel & Power EPS (Rs) (11.5) (12.4) 0.4 (5.1) -7.8 1.4 10.0
Net debt 395,017 392,082 408,952 416,361 - - 418,744
RoCE (%) 2.6 2.3 4.9 4.1 - - 6.6
RoE (%) (5.1) (5.5) 0.2 (2.4) - - 4.7
Sales 484,113 454,612 570,552 514,119 481,565 542,193 604,476
EBITDA 83,782 65,047 113,850 90,635 77,456 100,276 105,503
Adj. PAT 8,629 1,344 24,721 15,446 6,095 19,603 22,800
JSW Steel EPS (Rs) 35.7 5.6 102.3 63.9 26.8 83.0 94.3
Net debt 388,397 392,015 394,010 389,789 - - 376,824
RoCE (%) 7.8 5.6 11.3 8.9 - - 10.2
RoE (%) 3.8 0.6 10.3 6.7 - - 9.2
Sales 450,659 392,829 529,057 490,752 436,604 527,629 574,013
EBITDA 36,437 (22,550) 56,892 39,273 16,369 51,028 67,966
Adj. PAT 4,906 (30,227) 13,429 3,762 (7,253) 9,961 22,819
SAIL EPS (Rs) 1.2 (7.3) 3.3 0.9 -1.7 3.4 5.5
Net debt 340,065 346,860 414,653 455,392 - - 531,252
RoCE (%) 3.0 -4.1 4.5 3.0 - - 5.6
RoE (%) 1.1 -7.3 3.1 1.0 - - 5.8
Sales 89,289 76,552 100,930 79,632 81,678 89,990 92,072
EBITDA 49,939 39,807 58,617 42,330 42,558 45,716 50,643
Adj. PAT 47,613 38,913 54,316 41,224 39,909 40,646 45,989
NMDC EPS (Rs) 12.0 9.8 13.7 10.4 9.9 10.2 11.6
Net debt (157,451) (151,293) (116,670) (99,145) - - (43,910)
RoCE (%) 22.0 18.2 24.3 19.3 - - 21.8
RoE (%) 14.6 12.1 16.1 12.8 - - 14.2

41METALS – 2QFY16 RESULTS REVIEW
B&K RESEARCH NOVEMBER 2015
Ferrous – Change in estimates
FY16E FY17E Consensus FY18E
(Rs mn) Old New Old New FY16E FY17E %
Sales 31,743 25,097 43,250 39,597 31,780 43,291 57,095
EBITDA 2,051 (1,947) 5,037 2,800 2,064 5,054 5,079
Adj. PAT (5,421) (9,610) (6,323) (8,835) (5,494) (6,565) (8,611)
Monnet Ispat EPS (Rs) (82.3) (146.0) (96.0) (134.2) (83.4) (99.7) (131)
Net debt 125,096 127,423 130,692 136,224 - - 137,554
RoCE (%) (0.6) (3.5) 0.6 (1.0) - - (0.1)
RoE (%) (33.4) (68.1) (61.2) (180.7) - - 224.6
Sales 47,306 43,964 49,721 46,975 47,306 49,721 49,421
EBITDA 6,565 3,913 7,229 4,308 6,565 7,229 5,424
Adj. PAT (2,061) (3,138) (1,480) (2,854) (2,061) (1,480) (1,943)
Usha Martin EPS (Rs) (6.7) (10.3) (4.8) (9.3) (6.7) (4.8) (6.4)
Net debt 39,270 38,841 37,673 38,458 - - 36,368
RoCE (%) 4.6 0.1 5.9 0.8 - - 2.9
RoE (%) (12.8) (20.1) (10.3) (22.6) 0.0 0.0 (19.0)
Sales 25,925 22,935 27,058 23,245 24,463 25,873 24,031
EBITDA 3,970 2,600 4,313 3,097 3,388 4,570 3,525
Adj. PAT 492 (490) 701 (165) 226 921 220
Godawari Power & Iapat EPS (Rs) 15.0 (14.9) 21.4 (5.0) 6.9 23.1 6.7
Net debt 19,149 19,738 18,219 19,056 - - 18,076
RoCE (%) 9.1 4.9 10.0 6.7 - - 8.5
RoE (%) 5.2 (5.4) 7.0 (1.9) - - 2.5

42METALS – 2QFY16 RESULTS REVIEW
B&K RESEARCH NOVEMBER 2015
Non-ferrous – Change in estimates
FY16E FY17E Consensus FY18E
(Rs mn) Old New Old New FY16E FY17E
Sales 759,615 731,567 822,677 799,254 692,627 778,997 886,610
EBITDA 213,838 209,801 218,971 218,699 174,334 199,924 228,181
Adj. PAT 34,783 33,260 33,245 32,775 32,455 44,079 32,507
Vedanta EPS (Rs) 11.7 11.2 11.2 11.1 10.3 14.7 11.0
Net debt 256,430 256,430 226,438 226,438 - - 235,781
RoCE (%) 9.2 9.0 9.1 9.1 - - 9.2
RoE (%) 6.3 6.0 5.7 5.7 - - 5.6
Sales 1,018,292 1,020,897 1,070,205 1,055,866 1,044,877 1,125,934 1,134,724
EBITDA 83,866 86,359 105,641 107,153 86,251 105,806 131,578
Adj. PAT 5,908 7,927 19,313 20,538 7,494 18,951 35,189
Hindalco EPS (Rs) 2.9 3.8 9.4 9.9 4.0 9.5 17.0
Net debt 570,125 568,744 583,075 578,592 - - 572,230
RoCE (%) 4.4 4.6 6.0 6.1 - - 7.6
RoE (%) 1.5 2.1 4.9 5.2 - - 8.4
Sales 69,722 69,877 72,915 69,247 68,549 71,963 73,481
EBITDA 12,094 12,301 13,536 11,116 9,880 10,081 14,442
Adj. PAT 9,781 9,918 10,834 9,237 7,894 8,102 11,545
NALCO EPS (Rs) 3.8 3.8 4.2 3.6 3.1 3.2 4.5
Net debt (54,422) (57,491) (53,647) (55,549) - - (56,516)
RoCE (%) 10.2 10.3 10.8 9.3 - - 11.1
RoE (%) 7.5 7.6 7.9 6.8 - - 8.2
Sales 160,024 158,495 163,364 155,243 151,727 160,911 166,024
EBITDA 79,001 78,342 78,333 71,956 72,378 76,216 77,881
Adj. PAT 85,994 86,887 87,625 83,667 78,004 82,258 88,259
Hindustan Zinc EPS (Rs) 20.4 20.6 20.7 19.8 18.4 19.5 20.9
Net debt (357,525) (357,317) (405,288) (402,090) - - (443,413)
RoCE (%) 20.4 20.6 18.5 17.7 - - 16.9
RoE (%) 18.5 18.7 16.7 16.0 - - 15.2

43METALS – 2QFY16 RESULTS REVIEW
B&K RESEARCH NOVEMBER 2015
Pipes – Change in estimates
FY16E FY17E Consensus FY18E
(Rs mn) Old New Old New FY16E FY17E
Jindal SAW Sales 98,755 98,755 106,533 106,533 105,580 118,612 104,938
EBITDA 11,418 11,418 12,250 12,250 13,604 15,754 11,030
Adj. PAT 2,292 2,292 2,803 2,803 4,073 5,710 2,090
EPS (Rs) 7.5 7.5 8.8 8.8 13.5 18.6 6.5
Net debt 75,146 75,146 70,231 70,231 – – 66,300
RoCE (%) 6.9 6.9 7.4 7.4 – – 6.5
RoE (%) 6.0 6.0 6.7 6.7 – – 4.7
Welspun Corp Sales 89,783 89,783 92,021 92,021 90,357 96,408 84,738
EBITDA 10,252 10,252 9,937 9,937 9,920 10,547 7,862
Adj. PAT 2,683 2,683 2,645 2,645 2,564 3,110 1,748
EPS (Rs) 10.2 10.2 10.1 10.1 9.7 11.8 6.6
Net debt 18,178 18,178 13,805 13,805 – – 7,144
RoCE (%) 10.0 10.0 9.7 9.7 – – 6.8
RoE (%) 9.2 9.2 8.4 8.4 – – 5.2
Maharashtra Seamless Sales 12,014 10,863 12,697 10,623 11,823 13,261 12,102
EBITDA 717 43 776 268 706 1,010 440
Adj. PAT 859 341 908 519 708 938 692
EPS (Rs) 12.8 5.1 13.6 7.7 10.6 14.1 10.3
Net debt (3,393) (4,025) (3,813) (4,827) – – (4,504)
RoCE (%) 3.9 1.7 4.2 2.5 – – 3.4
RoE (%) 3.8 1.5 4.0 2.3 – – 3.1
Sales 17,563 17,039 19,086 18,515 17,811 20,031 20,030
EBITDA 3,266 3,027 3,567 3,268 3,174 3,706 3,449
Ratnamani Metals andAdj. PAT 1,930 1,725 2,158 1,890 1,859 2,200 2,011
EPS (Rs) 41.3 36.9 46.2 40.4 39.8 47.1 43.0Tubes
Net debt (1,412) (184) (2,333) (793) – – (1,339)
RoCE (%) 28.0 25.2 26.9 24.2 – – 22.7
RoE (%) 19.5 17.6 18.7 16.8 – – 15.6

44M
ET
AL
S – 2QFY
16 RE
SULT
S RE
VIE
W
B&
K R
ESE
AR
CH
NO
VE
MB
ER 2015
Valuation
CMP TP (Rs) Rating Adj EPS (Rs) PER (x) EV/EBITDA (x) P/BV (x) RoE (%)
Rs Old New FY16E FY17E FY18E FY16E FY17E FY18E FY16E FY17E FY18E FY16E FY17E FY18E FY16E FY17E
Ferrous
Tata Steel 224 250 255 OP (1.7) 9.1 27.0 – 24.6 8.3 8.1 6.0 4.8 0.6 0.6 0.6 (0.5) 2.6
Jindal Steel and Power 86 – – UR (12.4) (5.1) 10.0 – – 8.6 11.7 9.2 7.1 0.4 0.4 0.4 (5.5) (2.4)
JSW Steel 887 925 825 UP 5.6 63.9 94.3 159.4 13.9 9.4 9.3 6.7 5.6 1.0 0.9 0.8 0.6 6.7
SAIL 44 46 35 SELL (7.3) 0.9 5.5 – 48.3 8.0 – 16.2 10.5 0.5 0.5 0.5 (7.3) 1.0
NMDC 92 100 94 UR 9.8 10.4 11.6 9.4 8.8 7.9 5.3 6.3 6.3 1.1 1.1 1.1 12.1 12.8
Monnet Ispat 32 22 – SELL (146.0) (134.2) (130.8) – – – – 49.4 27.5 0.2 4.5 (0.3) (68.1) (180.7)
Usha Martin 14 18 13 UP (10.3) (9.3) (6.4) – – – 11.0 9.9 7.5 0.3 0.4 0.4 (20.1) (22.6)
Godawari Power and Ispat 69 80 71 UP (14.9) (5.0) 6.7 – – 10.3 8.5 6.9 5.8 0.3 0.3 0.3 (5.4) (1.9)
Non-Ferrous
Vedanta 90 98 98 OP 10.5 9.7 10.7 8.6 9.3 8.4 2.5 2.4 2.3 0.5 0.5 0.5 5.7 5.0
Hindalco 74 63 70 UP 3.8 9.9 17.0 19.2 7.4 4.3 8.3 6.8 5.5 0.4 0.4 0.3 2.1 5.2
Nalco 38 46 50 BUY 3.8 3.6 4.5 9.7 10.5 8.4 3.2 3.7 2.8 0.7 0.7 0.7 7.6 6.8
Hindustan Zinc 142 152 160 OP 20.6 19.8 20.9 6.9 7.1 6.8 3.1 2.7 2.0 1.2 1.1 1.0 18.7 16.0
Pipes
Jindal SAW 63 75 75 OP 7.5 8.8 6.5 8.4 7.2 9.7 8.3 7.3 7.8 0.5 0.5 0.4 6.0 6.7
Welspun Corp 100 125 125 OP 10.2 10.1 6.6 9.8 9.9 15.0 4.3 4.0 4.3 0.9 0.8 0.8 9.2 8.4
Maharashtra Seamless 151 161 140 UP 5.1 7.7 10.3 29.6 19.5 14.6 140.8 19.7 12.7 0.5 0.5 0.5 1.5 2.3
Ratnamani Metals 572 690 650 OP 36.9 40.4 43.0 15.5 14.1 13.3 8.8 7.9 7.4 2.5 2.2 1.9 17.6 16.8

45METALS – 2QFY16 RESULTS REVIEW
B&K RESEARCH NOVEMBER 2015
B&K Securities is the trading name of Batlivala & Karani Securities India Pvt. Ltd.
B&K Investment Ratings.
LARGE CAP MID CAP SMALL CAP(Market Cap > USD 2 bn) (Market Cap of USD 200 mn to USD 2 bn) (Market Cap <USD 200 mn)
BUY >+20% (absolute returns) >+25% (absolute returns) >+30% (absolute returns)
OUTPERFORMER +10% to +20% +15% to +25% +20% to +30%
UNDERPERFORMER +10% to -10% +15% to -15% +20% to -20%
SELL <-10% (absolute returns) <-15% (absolute returns) <-20% (absolute returns)
Disclaimer: This report was prepared, approved, published and distributed by Batlivala & Karani Securities India Private Limited ("B&K") located outsideof the United States (a "non-US Group Company"), which accepts responsibility for its contents. It is distributed in the U.S. by Enclave Capital, a U.S.registered broker dealer, on behalf of B&K, only to major U.S. institutional investors (as defined in Rule 15a-6 under the U.S. Securities Exchange Act of1934 (the "Exchange Act")) pursuant to the exemption in Rule 15a-6. Neither the report nor any analyst who prepared or approved the report is subject toU.S. legal requirements or the Financial Industry Regulatory Authority, Inc. ("FINRA") or other regulatory requirements pertaining to research reports orresearch analysts. No non-US Group Company is registered as a broker-dealer under the Exchange Act or is a member of the Financial Industry RegulatoryAuthority, Inc. or any other U.S. self-regulatory organization. Outside the United States, this report is distributed by B&K or an authorized affiliate of B&K.
The report has been compiled or arrived from sources believed to be reliable and in good faith, but no representation or warranty, express or implied is madeas to their accuracy, completeness or correctness. B&K has not verified the factual accuracy, assumptions, calculations or completeness of the information.Accordingly, B&K accepts no liability whatsoever for any direct or consequential loss or damage arising from (i) the use of this communication (ii) relianceof any information contained herein, (iii) any error, omission or inaccuracy in any such Information or (iv) any action resulting there from. B&K providesthe information for the purpose of the intended recipient's analysis and review and recipients are advised to verify the factual accuracy, assumptions,calculations and completeness of the information.
This report was produced by B&K solely for information purposes and for the use of the recipient. It is not to be reproduced under any circumstances andis not to be copied or made available to any person other than the recipient. All estimates, expressions of opinion and other subjective judgments containedherein are made as of the date of this document. Emerging securities markets may be subject to risks significantly higher than more established markets.In particular, the political and economic environment, company practices and market prices and volumes may be subject to significant variations. The abilityto assess such risks may also be limited due to significantly lower information quantity and quality. By accepting this document, you agree to be bound byall the foregoing provisions. This document does not constitute an offer of, or an invitation by or on behalf of B&K or its affiliates or any other companyto any person, to buy or sell any security.
Analyst Certification: Each of the analysts identified in this report certifies, with respect to the companies or securities that the individual analyses, that(1) the views expressed in this report reflect his or her personal views about all of the subject companies and securities and (2) no part of his or hercompensation was, is or will be directly or indirectly dependent on the specific recommendations or views expressed in this report.
Disclosures, applying to B&K and the Analyst (together with associates and family members)
Ownership interest in the issuer of the securities mentioned < 1%
Other financial interest in the issuer None
Other material conflict of interest None
Compensation/benefits received from issuer/3rd Parties in past 12 months:
Public offerings managed/co-managed for issuer None
Fees for merchant banking, investment banking or brokerage services (as percentage of issuer’s turnover) < 0.1%
Compensation for other services (as percentage of issuer’s turnover) < 0.1%
Analyst service as officer, director or employee of the issuer None
Involvement in market-making in the issuer’s securities None
B&K Universe Profile
By Market Cap (US$ mn) By Recommendation
92
64
23
0 3
129
0
20
40
60
80
100
120
140
160
Buy OP UP Sell NR UR
no. o
f com
pani
es
33
158
120
020
4060
80
100120
140160
180
> $2bn $200mn - $2bn <$200mn
no. o
f com
pani
es

B & K SECURITIES INDIA PRIVATE LTD.Equity Research Division: City Ice Bldg., 298, Ground/1st Floor, Perin Nariman Street, Behind RBI, Fort, Mumbai - 400 001, India. Tel.: 91-22-4031 7000, Fax: 91-22-2263 5020/30.
Registered Office: Room No. 3/4, 7 Lyons Range, Kolkata - 700 001. Tel.: 91-33-2243 7902.
Important US Regulatory Disclosures on Subject Companies
1. B&K or its Affiliates have not recently been the beneficial owners of 1% or more of the securities mentioned in this report.
2. B&K or its Affiliates have not managed or co-managed a public offering of the securities mentioned in the report in the past 12 months.
3. B&K or its Affiliates have not received compensation for investment banking services from the issuer of these securities in the past 12 months and donot expect to receive compensation for investment banking services from the issuer of these securities within the next three months.
4. However, one or more person of B&K or its affiliates may, from time to time, have a long or short position in any of the securities mentioned hereinand may buy or sell those securities or options thereon either on their own account or on behalf of their clients.
5. B&K or its Affiliates may, to the extent permitted by law, act upon or use the above material or the conclusions stated above or the research or analysison which they are based before the material is published to recipients and from time to time provide investment banking, investment management orother services for or solicit to seek to obtain investment banking, or other securities business from, any entity referred to in this report.
6. As of the publication of this report, Enclave Capital does not make a market in the subject securities.
Enclave Capital is the distributor of this document in the United States of America. Any US customer wishing to effect transactions in any securities referredto herein or options thereon should do so only by contacting a representative of Enclave Capital and any transaction effected by a U.S. customer in thesecurities described in this report must be effected through Enclave Capital (19 West 44th Street, suite 1700, New York, NY 10036).
B&K Research is also available on Bloomberg <BNKI>, Thomson First Call & Investext.
B&K RESEARCH NOVEMBER 2015