batman - best available technique minimising all nuclides · 2015-10-22 · batman - best available...
TRANSCRIPT

REPORT
BATMAN - Best Available Technique
Minimising All Nuclides
This report approved 2006-04-18
Lars-Gunnar Lindfors Scientific Director
Ulrika Bark Rune Bergström IVL Swedish Environmental Research Institute Ltd
Pernilla Svanberg Bernt Bengtsson Ringhals AB
B1673 April 2006
Report Summary
Organization
IVL Swedish Environmental Research Institute Project title BATMAN – Best Available Technique Minimising All Nuclides Address
Box 21060 100 31 Stockholm Project sponsor
Vattenfall AB, SIVL Telephone 08-598 563 00
Author Ulrika Bark, Rune Bergström, Pernilla Svanberg, Bernt Bengtsson
Title and subtitle of the report BATMAN - Best Available Technique Minimising All Nuclides Summary In a co-operation project between Ringhals nuclear power plant and IVL, a combination of techniques for separation and removal of radioactive substances from water has been tested and evaluated. The goal of the project was to reduce the outlet of water bound radioactivity with at least a factor of 50-100, which was fulfilled during the project. The techniques chosen were dead end filtration (as pre-treatment) followed by gas transfer membranes (GEM), cross flow membrane filtration (OF/RO) and ion exchange using ion exchange resin or electrical deionisation (EDI). The feed water to the test rig was preferably letdown water from PAR-coolant, which contained low levels of activity together with a varying concentration of boron (0-2000ppm) and Lithium (0-3.5ppm). In addition, miscellaneous wastewater from sinks and floor drains was treated in the same system. The test plant was set up on site at the Ringhals 2 pressurised water reactor (PAR) and designed to have a capacity of treating a maximum of 2.5 m3/hour. Keyword Membrane filtration, electrical deionisation, EDI, gas transfer membrane, GEM, Radioactive Wastewater, Low Level Waste, Nuclear Wastewater Bibliographic data
IVL Rapport B1673
The report can be ordered via Homepage: www.ivl.se, e-mail: [email protected], fax+46 (0)8-598 563 90, or via IVL, P.O. Box 21060, SE-100 31 Stockholm Sweden

BATMAN - Best Available Technique Minimising All Nuclide. IVL report B1673
Summary
In a co-operation project between Ringhals nuclear power plant and IVL, a combination of techniques for separation and removal of radioactive substances from water has been tested and evaluated. The goal of the project was to reduce the outlet of water bound radioactivity with at least a factor of 50-100, which was fulfilled during the project. The techniques chosen were dead end filtration (as pre-treatment) followed by gas transfer membranes (GEM), cross flow membrane filtration (OF/RO) and ion exchange using ion exchange resin or electrical deionisation (EDI). The feed water to the test rig was preferably letdown water from PAR-coolant, which contained low levels of activity together with a varying concentration of boron (0-2000ppm) and Lithium (0-3.5 ppm). In addition, miscellaneous wastewater from sinks and floor drains was treated in the same system. The test plant was set up on site at the Ringhals 2 pressurised water reactor (PAR) and designed to have a capacity of treating a maximum of 2.5m3 / hour.

BATMAN - Best Available Technique Minimising All Nuclide. IVL report B1673
1
Contents
Summary .............................................................................................................................................................1 1 Introduction ..............................................................................................................................................3
1.1 Commission and participants........................................................................................................3 1.2 Objectives.........................................................................................................................................3 1.3 Background ......................................................................................................................................3
2 Waste Water Sources & Composition ..................................................................................................5 2.1 Wastewater .......................................................................................................................................5 2.2 Feed water ........................................................................................................................................6 2.3 Activation Products ........................................................................................................................7 2.4 Fission products ..............................................................................................................................8 2.5 Noble gases ......................................................................................................................................9 2.6 Hydrogen, Nitrogen, and Oxygen ..............................................................................................10 2.7 Boron, Lithium and pH ...............................................................................................................10
3 Technical overview and design of the BATMAN system ...............................................................12 3.1 State of the art studies and choice of technique.......................................................................12 3.2 Additional concerns ......................................................................................................................13 3.3 The different techniques in the pilot plant................................................................................14
3.3.1 Particle separation – pre filtration........................................................................................14 3.3.1.1 Technical information..................................................................................................14
3.3.2 Gas separation.........................................................................................................................14 3.3.2.1 Technical description ...................................................................................................15
3.3.3 Membrane filtration ...............................................................................................................16 3.3.3.1 Technical description ...................................................................................................17
3.3.4 Membrane concentrate treatment........................................................................................19 3.3.4.1 Filtration.........................................................................................................................19 3.3.4.2 Ion Exchange ................................................................................................................19
3.3.5 Permeate treatment ................................................................................................................19 3.3.5.1 Ion exchanger................................................................................................................19 3.3.5.2 EDI.................................................................................................................................20
3.3.6 Process control .......................................................................................................................21 4 Performance – test program.................................................................................................................21
4.1 Feed water ......................................................................................................................................21 4.2 Particle separation - pre filtration ...............................................................................................22 4.3 Gas separation ...............................................................................................................................22 4.4 Membrane filtration ......................................................................................................................23 4.5 Concentrate treatment..................................................................................................................24
4.5.1 Lab scale tests..........................................................................................................................24 4.5.2 Filtration in pilot scale ...........................................................................................................25 4.5.3 Ion exchange in pilot scale....................................................................................................25
4.6 Permeate treatment .......................................................................................................................25 4.6.1 Ion exchange ...........................................................................................................................25 4.6.2 EDI...........................................................................................................................................25
4.7 Sampling and analyses ..................................................................................................................26 4.7.1 Measurement of surface dose rates .....................................................................................27 4.7.2 Exchange of filters and membranes ....................................................................................28 4.7.3 Exchange of ion exchange resin ..........................................................................................28

BATMAN - Best Available Technique Minimising All Nuclide. IVL report B1673
2
5 Results ......................................................................................................................................................28 5.1 Particle separation – pre filtration ..............................................................................................29 5.2 Gas Separation...............................................................................................................................30
5.2.1 Comments ...............................................................................................................................32 5.3 Membrane Filtration.....................................................................................................................32
5.3.1 Principle for separation of radioactivity and boron ..........................................................33 5.3.2 Separation of boron ...............................................................................................................33 5.3.3 Separation of radioactivity.....................................................................................................36 5.3.4 Separation of lithium..............................................................................................................39 5.3.5 Capacities for the membrane filtration ...............................................................................39 5.3.6 Membrane cleaning ................................................................................................................41 5.3.7 Operating experiences of the membrane filtration ...........................................................42
5.4 Concentrate Treatment ................................................................................................................42 5.4.1 Lab scale tests..........................................................................................................................42 5.4.2 Pilot scale tests ........................................................................................................................43
5.5 Permeate Treatment .....................................................................................................................45 5.5.1 Ion exchange ...........................................................................................................................45 5.5.2 EDI...........................................................................................................................................45
5.6 Process control ..............................................................................................................................45 5.7 Radiation levels and exposure .....................................................................................................46
6 Discussion and conclusions..................................................................................................................47 7 References ...............................................................................................................................................48
7.1 Basics & Preparatory work ..........................................................................................................48 7.2 Reports within the BATMAN-project.......................................................................................49 7.3 Other literature ..............................................................................................................................49
List of Appendices 1. List and performance of 30” cartridge filters (excel) 2. Nordcap drawing of the membrane filtration unit (PDF) 3. List and performance of 10” cartridge filters (excel) 4. BATMAN experimental data report (excel) 5. Exchange of cartridge filters in the housings (excel) 6. List over ion exchange resins (word) 7. Analyses of all samples, nuclear specific radioactivity for the whole project period (large
excel file, several work sheets) 8. Separation of radioactivity over the GEM (excel) 9. Total activity + Boron at different spots within the equipment. (excel) 10. Separation of radioactivity over the different membranes (excel) 11. Separation of radioactivity over the membrane unit (feed, concentrate, permeate) (excel) 12. Separation of chemical substances (non radioactive) (excel) 13. Operational data, membrane filtration unit (excel) 14. Flux (L/m2, h, bar) for the different membranes (excel) 15. Exchange of Ion exchange resin IX500, 600 and 700 (excel) 16. Surface dose rates (excel)
BATMAN - Best Available Technique Minimising All Nuclide. IVL report B1673
3
1 Introduction
1.1 Commission and participants
This report is the result of a research project, where IVL Swedish Environmental Research Institute Ltd. and Ringhals AB have worked together within a project named BATMAN – Best Available Technique Minimising All Nuclides.
The project was funded by Ringhals AB, together with the Swedish National Environmental Protection agency. A project team was established with representatives from Ringhals: Bernt Bengtsson, Pernilla Svanberg, Edward Rondolph, Jan Sandgren and Christer Gunnarsson, from IVL: Ulrika Bark, Rune Bergström and Östen Ekengren and from SSI, the Swedish Radiation Protection Authority: Synnöve Sundell Bergman. During the period, seven steering meetings and several working group meetings were held.
1.2 Objectives
The main objective of the project was to find alternative separation techniques in addition to evaporation, with the purpose to minimise the radioactivity in liquid effluents from the Swedish nuclear power plants. A specific target was to decrease the activity by a factor of 100 as an average of the treated effluents compared to the present situation at Ringhals as a reference, were only cartridge filtration and ion exchange were used. A second objective was that the total waste volumes should not increase with new technology and had to be applicable with the present waste management system. A third aim was that internal doses to staff could be manageable. Answers to these objectives was expected to be attained by setting up a pilot-scale research work, where the "Best Available Technique" (BAT) known from conventional industry applications was to be evaluated with radioactive effluents in a mid-scale pilot plant on-site a nuclear power plant. PWR:s (Pressurised Water Reactors) is in general considered to have a more complex wastewater situation due to the chemicals added to the reactor coolant. With high content of boron in the PAR wastewater, concentration by evaporation only can give a limited reduction of the wastewater volume, due to the solubility of boron. The tests were performed from a PAR point of view, were the results were expected to be applicable also to BWR: s (Boiling Water Reactors) conditions.
1.3 Background
The "BATMAN" project was initiated by Ringhals AB in order to find methods to further reduce the activity in the liquid effluents from the Ringhals site, which is one of the largest nuclear power sites in Europe, including one boiling water reactor (BWR) and three pressure water reactors (PAR). The Ringhals site normally ensures environmental performance by using different tools:
Environmental product declaration (EPD)
Certified in accordance with IS0 14 001
Registered in accordance with EMAS (Eco Management Audit Scheme)

BATMAN - Best Available Technique Minimising All Nuclide. IVL report B1673
4
Ringhals is also the first nuclear site in Sweden to perform an environmental approval by the environmental legislation in addition to the control made by the Swedish radiation protection authority.
Together, this ensures a work for continuous improvements, which with the objective to reach public confidence for the nuclear business made a strong motive for Ringhals to initiate this project.
As a sea-cooled site in a low population area, the doses to the environment caused by the liquid effluents from the Ringhals reactors are known to be very low, this partly due to a high dilution of the waste effluents in the cooling water. However, amount of activity (as Becquerel) that are released to the coolant are considered as high, compared to some of the European river-cooled sites, were waste evaporators are commonly used. To some extent, the situation is similar at the other sea-cooled sites even though evaporators are partly used.
An additional reason for the National Environmental Protection agency to support the project was to be prepared for future demands, expected due to European co-operation as a result of the OSPAR-convention (SINTRA). In the OSPAR work, there is clear statement to lower the release of activity to the North Atlantic. In later work, similar efforts have been stated for the Baltic Sea (HELCOM).
The specific objective of finding alternatives to evaporators, were that these are not longer available at the Swedish PAR: s. Evaporators are neither desirable at Swedish PAR: s due to compatibility problems with the liquid concentrate (high levels of boron) and present waste disposal system, using concreting. Due to the boron content and solubility in PAR water, the concentration factor will be limited compared with BWR: s and evaporation is also known to give rise to high-energy consumption and corrosion problems. One main objective from Ringhals was therefore to find methods to collect the separated activity on a solid phase to facilitate the solidification with cement.
Traditionally, Swedish nuclear plants have been using once-through filtration, ion exchange and evaporation as treatment methods for wastewater as well as for make up water production. Later, some centrifugal techniques and chemical absorption methods have been introduced in minor applications, while other methods such as cross flow filtration, electro-dialysis and electro-deionisation mainly been used for production of make up water. Before this project was initiated, Ringhals had performed minor pre-studies of different techniques via laboratory tests and examination papers. This showed promising results and was suggested to be included in the project.
The IVL Swedish Environment Research Institute Ltd that had wide experience with separation technology in non-nuclear applications was asked to collaborate with Ringhals. The project applied for financial support from the state, which was awarded via the National Environmental Protection agency while the Swedish Radiation Protection Authority was appointed to supervise the project.
The strategy for the project was decided to perform realistic mid-size pilot tests with several different separation techniques considered as BAT, using water containing low to medium levels of typical radioactive nuclides. In addition, the secondary aims concerning handling of final waste products and radiation concerns should be evaluated. Ringhals PAR unit 2 was chosen for the tests when suitable accommodations and connections were available with reasonable modifications and costs.
BATMAN - Best Available Technique Minimising All Nuclide. IVL report B1673
5
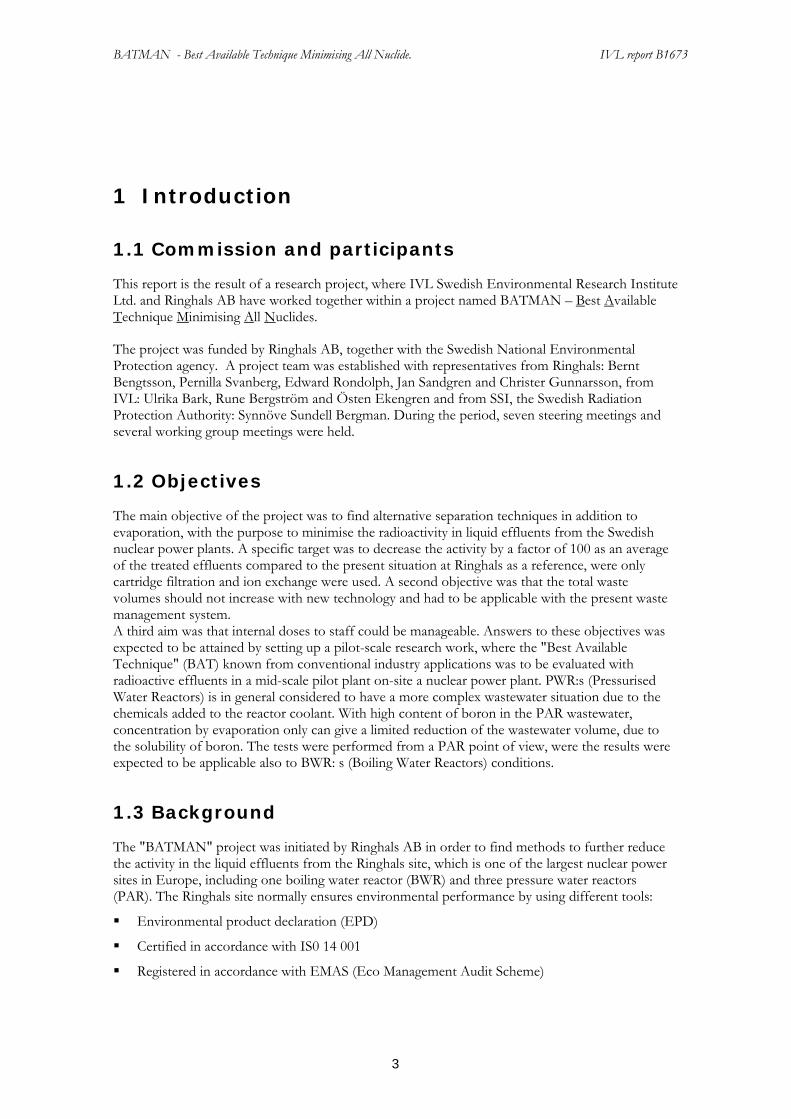
A rather long test period (2 years) was needed when only intermittent operation and test runs were available. Following a normal PAR operation cycle, the access of water to be treated is varying strongly due to the actual period within the cycle, operational disturbances; maintenance needs and scheduled stops/outages (Figure 1.3.1).
0200400600800
100012001400160018002000
M3Ringhals 2 - Montly Discharges from Aux. building
Figure 1.3.1 Monthly discharge of water at Ringhals 2 during the project period.
The project was initiated in 2001, equipment was purchased in 2002, and in operation in 2003-2004. After ending the tests in the beginning of 2005, Ringhals has continued to operate the equipment waiting for a full-scale installation.
2 Waste Water Sources & Composition
2.1 Wastewater
The main part of the wastewater production in a nuclear power plant is produced in the turbine part of the energy process from steam traps, drainage, sealing water and universal spills from main steam, condensate and feed water systems as well as auxiliary cooling systems. Therefore, the waste volumes containing radioactivity is much less in a PAR then a BWR (figure 2.1.1). In the Swedish PAR: s, only a small amount of the waste volumes is re-used when recycling some boron via evaporation, the main part is discharged to the sea.

BATMAN - Best Available Technique Minimising All Nuclide. IVL report B1673
6
0
5000
10000
15000
20000
25000
30000
35000
40000
45000
50000
1997 1998 1999 2000 2001 2002 2003 2004
(M3) R1(BWR) Reactor R1(BWR) Others R2(PWR) Reactor R3(PWR) Reactor R4(PWR) Reactor
Ringhals Site- Annual discharges of radioactive liquids
Figure 2.1.1 Annual discharge of radioactive liquid from the different reactors at Ringhals.
2.2 Feed water
Two main types of PAR-wastewater were treated within the test period:
Type A: “PAR coolant waste” containing a mixture of boron (0-2200 ppm) and 7lithium (0-3.5 ppm). When drained from the main coolant, the water was intermediate stored in hold up tanks, normally without access to oxygen or chemical intrusions before treatment within the test rig. Activity levels in this water are to be similar to reactor coolant during operation with exception of decay of short-life nuclides that are reduced when the water was stored during days to months before treatment.
As a precautionary measure in the beginning of the test period, the water was pre-treated in the ordinary waste purification systems using cartridge-filter (>5 µm nominal) and a mix-bed demineraliser before entering the test equipment. After the running-in period, the water was treated in the Batman system without any ordinary pre-treatment.
Type B: “Wastewater”, containing miscellaneous sources of drains from coolant and other radioactive water systems from the auxiliary building, sometimes together with floor-drains and collected in different waste tanks. Activity levels as well as chemical contamination are varying and traces of lubricants, saltwater, chromates and detergents could sometimes be present. Also, concentrations of suspended solids and colloids were expected to be higher then for the coolant in “type A”. To ensure a low risk for fouling or damaging the test equipment, this water was pre-treated in the ordinary waste systems using cartridge-filter (> 5 µm nominal) and a mix-bed demineraliser before entering the BATMAN test equipment.
The pre-treatment according to ordinary routines and operation modes was judge to not obstruct the evaluation of the test of new methods, rather facilitate this, when having a broad database and experience from this operating duty.

BATMAN - Best Available Technique Minimising All Nuclide. IVL report B1673
7
The total annual release from a Ringhals PAR is 2-10 GBq and the discharge of water is approx. 4000 m3. The feed water entering the test rig would therefore be expected to show an average of approx. 1000 Bq/kg in the feed water, which was also the experience in the tests (figure 2.2.1). This is also equivalent to the results attained with the present ordinary methods, using cartridge filtration in combination with the ion exchange, and to be compared with the test results attained by other techniques in this project.
0
5000
10000
15000
20000
2002-09-01
2002-12-10
2003-03-20
2003-06-28
2003-10-06
2004-01-14
2004-04-23
2004-08-01
2004-11-09
2005-02-17
Date
Act
ivity
(Bq/
kg)
Figure 2.2.1 Total activity variations in the feed water during the test period.
2.3 Activation Products
The main part of interest for this work is the activation products, formed by neutron activation of corrosion products released from the construction material in the coolant system. The activation products exist as particles, as well as ions and charged/uncharged colloids and complex compounds, not always known regarding chemical forms.
The main nuclides of interest for the environmental doses are Co-58, Co-60, Sb-124, Sb-125 and Ag-110. Other activation products such as Cr-51, Mn-45 and Fe-59 etc. are sometimes present in high concentrations, but of less interest for this project. A good separation of the main nuclides will in general, but not always, vouches for the others as well.
However, a general experience from the PAR: s is that Sb-124, Sb-125 and Ag-110m is more difficult to separate during reducing conditions and therefore sometimes accounts for a high contribution in the discharges.

BATMAN - Best Available Technique Minimising All Nuclide. IVL report B1673
8
030101 030401 030701 031001 040101 040401 040701 041001 050101
102
103
104
105
106
107
Ringhals 2 Reactor Coolant - Main Activation ProductsSb-124, Co-60, Co-58, Ag110mBq/kg
User: bebeDate: 2005-02-24 19:02:03Filename: H:\KEMIDATA\Origen\Batman
Aktiveringsprod
Figure 2.3.1 Main activation products within the test water at Ringhals 2.
2.4 Fission products
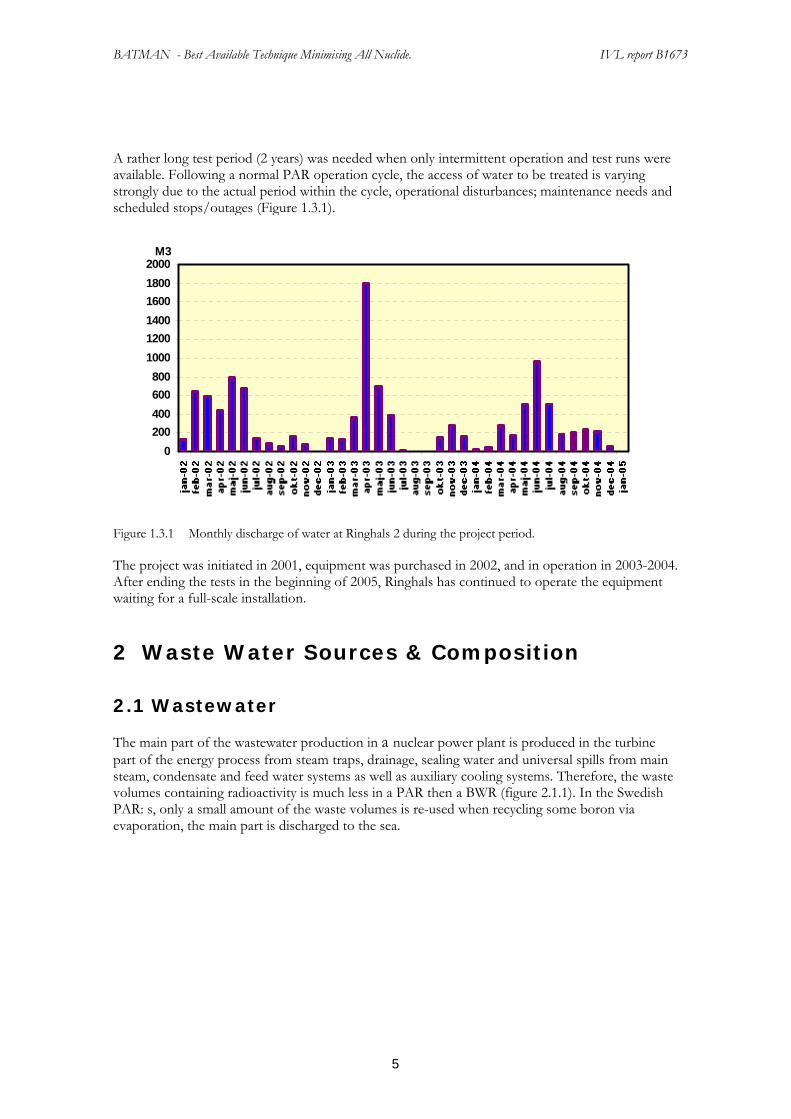
The second part of interest for this work is the fission products, formed in the fission of U-235 by neutrons of which Cs-134, Cs-137 and I-131 are of main interest to separate and reduce in the effluents. A general experience is that the Cesium- and Iodine-nuclides are weakly bounded to most ion resins and not very effectively removed.
At the end of the test period, a fuel leakage occurred, causing very high levels of fission product in the wastewater. When causing operational disadvantages, this was useful for the test program.
BATMAN - Best Available Technique Minimising All Nuclide. IVL report B1673
9
030101 030401 030701 031001 040101 040401 040701 041001 050101
101
102
103
104
105
106
Ringhals 2 Reactor Coolant - Main Fission Products
Cs-134, Cs-137, I-131Bq/kg
User: bebeDate: 2005-02-24 18:50:05Filename: H:\KEMIDATA\Origen\Batman
Fissionsprod
Figure 2.4.1 Main fission products in the test water from Ringhals. The concentrations show a sharp increase at the end of the test period, when a fuel leakage occurred.
2.5 Noble gases
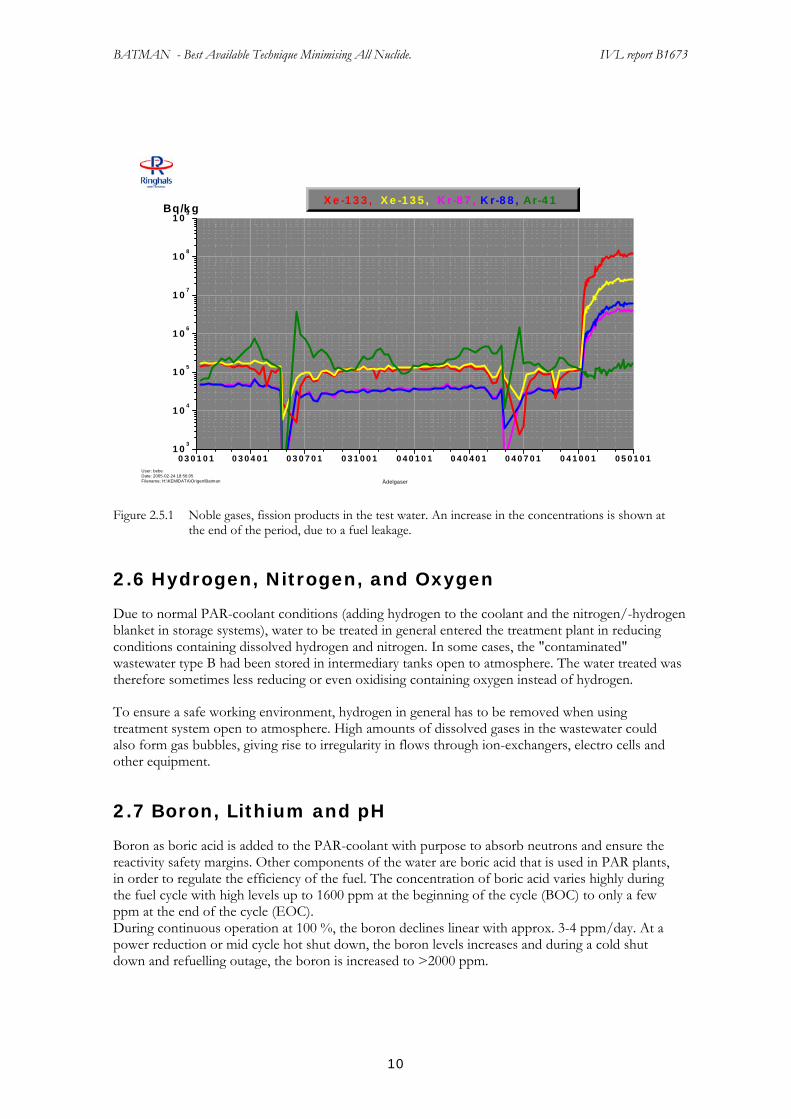
The third part of the radioactivity consists in dissolved noble gases such as Kr-85, Kr- 87, Kr-88, Xe-133, Xe-135 and Ar-41. Most of them are short-lived and decay in a way that they only in exceptional cases contribute to a problem when dissolved in liquids. During normal operation, Ar-41 is a dominant nuclide while the others will increase strongly when fuel leakage occurs, causing internal radiation problems as well as environmental doses when released to the atmosphere. The concentrations of noble gases in the feed water during the test varied to a high extent due to the decay during storage and the operation situation with a fuel leakage at the end of 2004.
BATMAN - Best Available Technique Minimising All Nuclide. IVL report B1673
10
030101 030401 030701 031001 040101 040401 040701 041001 050101103
104
105
106
107
108
109
Ringhals 2 Reactor Coolant - Main Fission Products
Xe-133, Xe-135, Kr-87, Kr-88, Ar-41Bq/kg
User: bebeDate: 2005-02-24 18:56:05Filename: H:\KEMIDATA\Origen\Batman
Ädelgaser
Figure 2.5.1 Noble gases, fission products in the test water. An increase in the concentrations is shown at the end of the period, due to a fuel leakage.
2.6 Hydrogen, Nitrogen, and Oxygen
Due to normal PAR-coolant conditions (adding hydrogen to the coolant and the nitrogen/-hydrogen blanket in storage systems), water to be treated in general entered the treatment plant in reducing conditions containing dissolved hydrogen and nitrogen. In some cases, the "contaminated" wastewater type B had been stored in intermediary tanks open to atmosphere. The water treated was therefore sometimes less reducing or even oxidising containing oxygen instead of hydrogen.
To ensure a safe working environment, hydrogen in general has to be removed when using treatment system open to atmosphere. High amounts of dissolved gases in the wastewater could also form gas bubbles, giving rise to irregularity in flows through ion-exchangers, electro cells and other equipment.
2.7 Boron, Lithium and pH
Boron as boric acid is added to the PAR-coolant with purpose to absorb neutrons and ensure the reactivity safety margins. Other components of the water are boric acid that is used in PAR plants, in order to regulate the efficiency of the fuel. The concentration of boric acid varies highly during the fuel cycle with high levels up to 1600 ppm at the beginning of the cycle (BOC) to only a few ppm at the end of the cycle (EOC). During continuous operation at 100 %, the boron declines linear with approx. 3-4 ppm/day. At a power reduction or mid cycle hot shut down, the boron levels increases and during a cold shut down and refuelling outage, the boron is increased to >2000 ppm.

BATMAN - Best Available Technique Minimising All Nuclide. IVL report B1673
11
Lithium is added to the PAR-coolant as balance to boron to stabilise the pH in the coolant, to ensure a low corrosion rate and release of corrosion products from construction material in the system that may be activated in the core. The main objective is to lower the corrosion rate of the steam generator tube surfaces (5-7000m2) made of Inconel 600 or 690 with 50-70 % Nickel, the source term of Co-58. An optimal pH is also necessary to avoid deposition and activation of corrosion products in the core, were the solubility of different compounds changes when passing the core due to the temperature (approx. 285ºC to 325ºC)
The pH in the coolant letdown varies through the fuel cycle from 7 to 9.5 (25°C) while during outages and shut-downs be as low as 4 when no lithium is present. The pH in the mixed wastewater is similar but could vary even more due to intrusion of impurities and chemicals.
030101 030301 030501 030701 030901 031101 040101 040301 040501 040701 040901 041101 0501016,5
7,0
7,5
8,0
8,5
9,0
User: pelaDate: 2005-10-26 09:34:55Filename: S:\Origin\R2\Användare\Pela\R2\20-313 Batman B Li, pH, H2
Graph1
pH-regime and HydrogenRINGHALS 2
(1)
[1] 20-313RC pH 25 C
0
200
400
600
800
1000
1200
1400
1600
1800
2000
2200
2400
[2] 20-313RC Boron (ppm)(2)
0
300
600
900
1200
1500
1800
2100
2400
2700
3000
3300
3600
[3] 20-313RC Lithium (ppb)
(3)
24
30
36
42
48
54
60
66
72
[4] 20-313RC Hydrogen (ml/kg)(4)
Figure 2.7.1 Variation of chemistry in the coolant letdown water (CVCS) during the test period.

BATMAN - Best Available Technique Minimising All Nuclide. IVL report B1673
12
3 Technical overview and design of the BATMAN system
3.1 State of the art studies and choice of technique
In the start up phase of the project a broad literature survey was made and an international conference was attended in order to get a good overview of the state of the art in the area (1, 2, 3). Based on experiences at Ringhals and with support from literature a concept of the pilot scale treatment plant was developed.
As a next step a series of lab scale tests were performed in order to find the proper range of membrane cut off. As background studies a couple of other tests also were performed; a study on gas transfer membrane – in order to investigate the possibility to separate radioactive gases from the water phase with membrane technology and also a lab scale test of different ion exchange materials were performed. These tests were partly performed as master thesis and accomplished at Ringhals (3-7).
With this theoretical and practical knowledge as a base, the different parts of the pilot plant were designed and erected. On an early stage membrane filtration was chosen as a core of the treatment processes with other techniques as complements.
Traditionally evaporation is a commonly used technique for treatment of these types of wastewater. It however has some drawbacks especially for PAR water that often have a high content of boric acid that might cause concentration during evaporation to be limited together with corrosion problems of the evaporation equipment. The technique is also relatively expensive.
Table 3.1.1 Compilation of some conceivable techniques and their area of use
Technique Particle separation
Ion separation
Energy consumption
Maintenance of equipment / personnel
Final product, waste
Macro filtration Low Low Solid
Membrane filtration
Medium High Liquid concentrate
Centrifugation Medium Medium Liquid sludge
Evaporation High Medium
Ion exchange /sorption
Low Medium Solid or liquid concentrate
EDI Medium Medium Liquid
Through experiences from literature studies and also experimental tests in small scale the general principles for the pilot plant were stated. The plant should consist of several different steps, where radioactive gas, particles, colloids and ions in the water streams are separated from the water. The test plant consists of many separate units, but can be run both each part separately and as a whole unit. The system is built up at Ringhals as the scheme below shows (see figure 3.1.1). The treatment plant is dimensioned for treating 2.5 m3 per hour.

BATMAN - Best Available Technique Minimising All Nuclide. IVL report B1673
13
Figure 3.1.1 System overview of the pilot scale treatment plant.
The water is led through the whole chain of different treatment techniques, described below. The system is flexible, with possibility of excluding some techniques in order to test all conceivable parameters and combinations. Descriptions of the different techniques are presented below.
3.2 Additional concerns
Compared to other types of industries nuclear plants have additional demands on any water treatment equipment to fulfil especially a safe radiation environment as well as taking care of any final waste products in a long term perspective. All the equipment in the Batman system was evaluated from this point of view to be easy available for service and simple maintenance such as exchange of membranes and filters in order to minimise the personal exposure for radiation. External and remote controlled systems were as far as possible included.
All waste categories had to fit into the system in Ringhals, where cementation of wastes is used and solid waste is preferable rather than liquids as final waste products. Some unfavourable materials such as Teflon were avoided and stainless steel material with welded fittings was chosen as far as possible to avoid hot spots to deposit.

BATMAN - Best Available Technique Minimising All Nuclide. IVL report B1673
14
3.3 The different techniques used in the pilot plant
3.3.1 Particle separation – pre filtration
For separation techniques such as GEM, OF/RO or EDI it is important to protect the equipment from particles that could block or damage the systems, causing disturbances in function or could shorten the lifetime of the equipment. For this purpose a pre treatment step was introduced where main particles could be separated. The equipment set up was chosen to be a dead end filtration rig with possibility to test a broad range of different cartridge filters. It is shown in figure 3.3.1.
Figure 3.3.1 Filtration panel with 4 modules for 30” filters.
3.3.1.1 Technical information
For the pre filtration rig filter housings for 30” cartridges with double o-ring (Code 7) fittings were chosen. In order to avoid any surface built up of radioactivity, the material chosen for the housings was stainless steel with a high surface finish. Mesh sizes of the filters tested ranged from 0.2 µm – 5 µm and in total approx. 20 different cartridge filters were tested. The filter system was flexible in order to be able to operate the filters all in parallel, in series or in a combination.
3.3.2 Gas separation
The wastewater system contained some dissolved hydrogen. The water in most cases also contained radioactive noble gases. In order to avoid any safety problems during operation and maintenance in the following parts of the treatment process, equipment for separation of gases was installed. Another objective with the treatment was to evaluate the technique to reduce the gaseous radioactivity of the water. It was also an important working environment aspect to keep the airborne radioactivity in the room low during the tests and reduce the risks for oxy-hydrogen gas to be formed in case of adding oxygen or peroxide to the water. The technique chosen for this purpose was Gas Transfer Membrane (GEM).

BATMAN - Best Available Technique Minimising All Nuclide. IVL report B1673
15
Figure 3.3.2.1 Principle of gas transfer membrane (picture from Liqui-cel).
The gas transfer membrane consists of hollow fibre membranes with hydrophobic membrane surfaces, through which gases but not water may pass. The process is driven by a difference in gas pressure on the inside and outside respectively of the membrane.
On the inside of the membranes the gas concentration is lowered, by vacuum or by letting in a low flow of a carrier gas. The gas in the water stream outside the membrane strives to equalise the concentration difference and passes through the membrane from the water phase into gas phase.
3.3.2.1 Technical description
Two membranes were assembled in a tube system with valves, which enables the possibilities of running one or both units in series or in parallel mode. The system also includes a vacuum pump with transmitters for vacuum and flow rate of water and valves for taking samples.
The equipment can be run in three different operational modes: - Vacuum mode, where the pressure inside of the tubes is lowered to a minimum. - Stripping mode, where a stripping gas is added inside the tubes - Combi mode, a combination of the two above where the pressure is lowered and a low flow of
air or a stripping gas is added.
Figure 3.3.2.1.1 The GEM module with the two membranes, valves, pressure transmitters and vacuum pump.

BATMAN - Best Available Technique Minimising All Nuclide. IVL report B1673
16
3.3.3 Membrane filtration
The core of the treatment plant is the membrane filtration unit. Membrane filtration is a treatment technique with many different application areas and several examples from the nuclear power industry show promising results. Membranes are used for many different purposes and through using different cut-off the separation can be adapted to the specific needs.
The principle of the membrane equipment in this case is to attain a high VRF (Volume Reduction Factor) of 100-500, which means that the concentrate stream is 1 - 0.2 % of the original volume. The principle for membrane filtration is shown in figure 3.3.3.1.
One important question when designing the system is to choose the proper cut-off for the membranes. The challenge is to find membranes that let through boric acid to a sufficient extent, not to cause precipitation, but still separate as much radioactivity as possible. This optimisation was done by means of practical tests. H3BO3 precipitates around 7-8000 ppm B at room temperature.
If the membrane separates 75 % of the boric acid the concentration within the system will increase 4 times compared to the original concentration.
There are different types of membranes on the market. Spiral wound membranes are the most common type, which have the largest range of different materials and cut off. The spiral wound membranes are also often the most cost-effective type. Other types are disc-, tubular and hollow fibre membranes.
Feed Permeate Concentrate
>3 m/s
. . .. . ..
Incomingsolution
Distance
Membrane
Permeate collections holes End support
Concentrate
Permeate
Collectionmaterial
Support layerPermeate flow(after passage through membrane)
Incomingsolution
Concentrate
Figure 3.3.3.1 Schematic figure of cross flow membrane filtration and a picture of a spiral wound membrane.

BATMAN - Best Available Technique Minimising All Nuclide. IVL report B1673
17
In the choice of membrane equipment, many different parameters were considered such as:
- Waste aspects: Which type of membrane generates the smallest volumes of waste?
- What is the best system solution in order to avoid storage of radioactive water in the system?
- The plant must be easy to handle, e.g. exchange of membranes must be quick and easy in order to minimise personal exposure for radioactivity.
- How can fouling be avoided?
- Space/efficiency?
- Which cut-off performs best?
Within the membrane filtration plant there were three different membranes with different cut-off. Through combining finer reverse osmosis membranes with coarser nano membranes the system was more flexible and armed for the complex situation of the varying content of boric acid in the water.
3.3.3.1 Technical description
The membrane filtration equipment had a dimensioning capacity of 2.5-3 m3 / hour and a maximum filtration pressure of 40 bar. Material in the parts of the equipment in contact with the water was acid resistant steel SS 2343. The equipment was fully automatic with a PLC control system. The principle for the equipment is shown in figure 3.3.3.1.1. Several different operational modes were possible such as keeping a constant capacity, flux or filtration pressure as well as volume reduction factor (VRF). Normally the equipment was operated with a constant flow through regulation of filtration pressure and a constant VRF, through regulation of the concentrate flow in relation to the permeate flow (a specific quota). The equipment could manage a very high concentration with a VRF up to 250. This corresponds to only 10 litres per hour at a feed flow of 2500 m3/hour.
The installation was equipped with three different pressure vessels in parallel, A-C, with three 4” spiral wound membranes in each. This enables the possibility to evaluate three different membrane types at the same time. Data for all membrane types tested are shown in table 3.3.3.1. Pre treated water is pumped with pump P1 via a filter to the high-lift pump, P2, a triple plunger pump. Pump P2 is frequency controlled in order to keep a steady level of flux or filtration pressure. The pump P3 circulates the water / concentrate through the three pressure vessels in parallel in order to attain a sufficient cross flow speed through the membranes. The concentrate is taken out from the circulation loop through regulation of a valve. The flow of treated water/ permeate from each membrane type can be regulated through manually controlled valves. Through a restriction of the permeate flow, overpressure on the permeate side of the membrane is attained. In order to be able to compare the capacities for the different membrane types, permeate flow rates or fluxes (l/m2, h) have been related to calculated trans membrane pressures (TMP). TMP is the difference between the average value of the pressure on the concentrate side and the pressure on the permeate side.
BATMAN - Best Available Technique Minimising All Nuclide. IVL report B1673
18
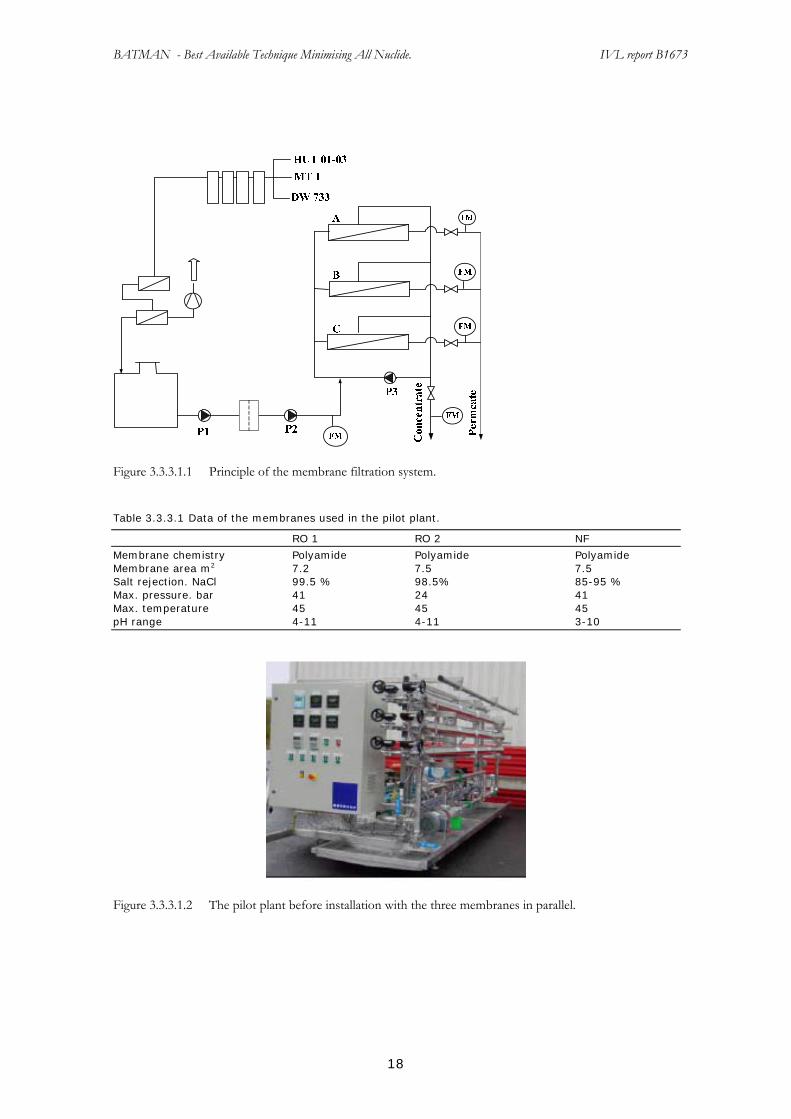
Figure 3.3.3.1.1 Principle of the membrane filtration system.
Table 3.3.3.1 Data of the membranes used in the pilot plant.
RO 1 RO 2 NF
Membrane chemistry Polyamide Polyamide Polyamide Membrane area m2 7.2 7.5 7.5 Salt rejection. NaCl 99.5 % 98.5% 85-95 % Max. pressure. bar 41 24 41 Max. temperature 45 45 45 pH range 4-11 4-11 3-10
Figure 3.3.3.1.2 The pilot plant before installation with the three membranes in parallel.

BATMAN - Best Available Technique Minimising All Nuclide. IVL report B1673
19
3.3.4 Membrane concentrate treatment
From the membrane filtration plant a small stream of concentrate was produced which needed further treatment in the system. This stream of concentrate was expected to be easier to treat in order to separate the radioactivity than the diluted feed.
The purpose of this treatment step was to bind the radioactivity on a solid and inert material. In this stage as well as in the membrane filtration the key is to separate radioactivity but let the boric acid through with the water. When choosing treatment methods, one must adapt to the existing waste system, since the final products are to be stored as radioactive waste. Some compounds are prohibited in the system, such as complexing agents. Techniques of main focus were sorption, ion exchange, activated carbon and filtration. In addition, small size equipment to destroy or reduce the content of organics and complexing agents could be used. However, this technique was not included in this project.
Since the radioactivity may exist as ions as well as in colloidal form, different filtration methods and resins were tested. The ionic radioactivity may appear both as positive and negative ions and the project includes tests of a large number of different resin types in lab scale.
When the content of radioactive ions and colloids are more concentrated in the water, they might aggregate into larger complexes and colloids, possible to separate with coarser filtration methods than would be possible at lower concentrations. Therefore, the concentrate was also treated by mechanical filtration similar to the ones used in the pre filtration (Chapter 3.3.1).
3.3.4.1 Filtration
As in the pre filtration step four filter housings were installed that could be connected in series or in parallel mode. Cut-off of the filters ranged between 0.02 µm – 5 µm.
3.3.4.2 Ion Exchange
Within this project several different adsorbents and ion exchange resins have been tested at laboratory scale. For the pilot scale equipment a well functioning nuclear grade resin was chosen. In the pilot scale treatment plant an ion exchanger was installed, adapted for the small concentrate stream of 10 litres per hour. The ion exchanger held 6 litres of ion exchange resin.
3.3.5 Permeate treatment
The purified water from the cross flow membrane filtration unit in some cases needed additional polishing treatment to further minimise the radioactivity. For that purpose, two different techniques were tested, such as ion exchange and EDI (Electrical DeIonisation).
3.3.5.1 Ion exchanger
An existing mobile ion exchanger was used, which contained 50-75 litres of resin. The resin used was a standard nuclear grade resin which is a mixed bed ion exchange resin that had showed good results in separating cat-ionic as well as an-ionic radioactive nuclides in pre-tests as well as in-situ at the plant.

BATMAN - Best Available Technique Minimising All Nuclide. IVL report B1673
20
3.3.5.2 EDI
As a complement or alternative to the traditional ion exchanger, an Electric DeIoniser was installed for polishing of permeate. The EDI unit was designed as a spiral wound membrane, as shown in figure 3.3.5.2.1.
AnionMembraneCation
Membrane
Electrolyte‘E’ Chamber
ConcentrateInlet
CATHODE
ElectrolyteCompartment(EChamber)
+AN
OD
E
Na+
Cl¯
OH¯
ConcentrateCompartment‘C’ Chamber
Compartment
(EChamber)
Electrolyte
Cl¯
Cl¯
OH¯
Cl¯
Na+
Dilute (feed water)‘D’ Chamber
Ion-ExchangeResin
Na+
Na+
H+
Cl¯
Cl¯Na+
Dilute (feedwater)
‘D’ Chamber
Ion-ExchangeResin
Na+
H+
Cl¯
OH¯
Cl¯
Na+
-
‘C’ Chamber‘C’ Chamber‘C’ Chamber
ElectrolyteOutlet
Product Water Concentrate Recycle
CAT
HO
DE
-
Figure 3.3.5.2.1 Principle for the spiral wound EDI equipment. ”D” stands for dilute. ”C” stands for concentrate (picture from Omexell).
Feed water enters the module from below and is diverted into vertically spiral cells known as the “D” (Dilute) chambers. The dilute stream flows vertically through ion-exchange resins located between two membranes, a cationic and an anionic membrane. DC current is applied across the cells. The cathode applies a negative DC charge and the anode applies a positive DC charge. The DC electrical field splits a small percentage of the water molecules into hydrogen (H+) and hydroxyl (OH-) ions. The H+ and OH- ions attach themselves to the cation and anion resin sites, continuously regenerating the resin. Hydrogen ions have a positive charge and will migrate through the cation resin, then through cation permeable membranes and into the concentrate chamber due to its attraction to the cathode. Likewise, hydroxyl ions have a negative charge and will migrate through the anion resin, then through anion permeable membranes and into the concentrate chamber due to its attraction to the anode. Cation membranes are permeable only to cations and will not allow anions or water to pass, and anion membranes are permeable only to anions and will not allow cations or water to pass. The H+ and OH- ions meet in the concentrate chamber to yield water.
Contaminant ions dissolved in the feed water, attach to their respective ion-exchange resin displacing H+ and OH- ions once within the resin bed, join in the migration of ions and permeate through the membrane into the “C” chambers. The contaminant ions are trapped in the C chamber and are swept away in the concentrate stream. The feed water continues passing through the dilute chamber and is purified. Dilute outlet is collected and exits the EDI module. The concentrate recycle loop enters the modules through the centre pipe from below and is diverted into vertically spiralled cells known as “C” (concentrate) chambers. The helically flowing concentrate stream returns into the centre pipe in the upper section of the module. A small amount of water is continuously bled from the “C” loop to prevent ion concentration from reaching the point of precipitation. The amount of concentrate bleed determines the water recovery. The concentrate

BATMAN - Best Available Technique Minimising All Nuclide. IVL report B1673
21
may be recycled as feed water to an RO unit to increase overall recovery or further treated by nuclide specific absorbers and resins using small-scale equipment.
3.3.6 Process control
Most parts of the test rig (IX/EDI excluded) were controlled through a tele-communicating control system manufactured by “T-box” systems. The system contains PLC, data logger, telelarm systems, and operator interface via Internet Explorer. The running of the pilot plant is controlled through operating windows on a local PC, where real time values, diagrams of history and alarm lists can be followed up. Alarms for different parameters, such as water levels, pressure, flow rates etc. could be chosen for three different levels: low level, high level and cut-out – when the equipment stops automatically. The alarms could also be sent to a pager.
4 Performance – test program
The conditions and operation modes for each test run have been described and documented through drawings of the flow directions in a process scheme over the entire pilot plant. The planning of the test runs has been made from an original planning and from attained results during the test period. The choice of water to be treated in each test depended to a high extent on the volumes of water gathered by operation and thereby the need to reduce of the water volumes in the storage tanks of the plant.
The test runs have been started up by operational staff or by staff from the chemistry department at Ringhals. All test runs have been followed up through logging of data and also with notes of special occurrences in a notebook. The data has been saved in the PLC together with an additional PC.
The pilot plant has a high degree of automation during operation. The membrane filtration plant can be driven at a constant permeate flow through regulation of filtration pressure or at a constant filtration pressure and regulation of feed flow. Meanwhile the outlet of concentrate has been regulated to constant VRF:s or at constant flow rates. For the important parameters for the operation safety two threshold values have been set, one for alarm and one value where the plant is stopped. Both alarms have been sent to paging receivers.
Measurement data have been logged as average values every 4 minutes from 24 points of transmitters and further processed in MS Excel through calculation of average values.
4.1 Feed water
Two types of radioactive water have been tested in the BATMAN system, process water from the reactor coolant (type A) and drainage water from the main process and floor drains (type B). Reactor coolant was feed to the system from collecting tanks (hold up tanks HUT 01, 02 or 03). In the beginning of the tests the water was treated with existing system of filters, ion exchange units and filters within circulation over each tank respectively. From the beginning of 2003 an adjustment of the system was made and the water (A) could be lead to the BATMAN system without pre treatment with ion exchange. The wastewater (B) was pre treated in an existing waste ion exchanger and filters during pumping to another storage tank. Water for the experiments and deionised water was chosen by manual switching of the inlet valves. The feed flow was regulated through a

BATMAN - Best Available Technique Minimising All Nuclide. IVL report B1673
22
regulating valve in order to keep a steady level in the buffering tank before the membrane filtration plant.
Permeate from the membrane filtration plant has been finally treated by ion exchange or EDI and thereafter discharged via a monitor tank to the sea. Concentrate from the membrane treatment was after treatment by ion exchange either brought back to the feed flow into the membrane filtration plant or to the waste drainage system. The latter one also means a return to the BATMAN system.
Water from the cleaning procedure of the membranes was taken care of by ion exchange or transported to a common wastewater treatment plant at the site. Drainage and leakage water from the pilot plant has been lead to a floor drain and then back to the system as wastewater.
4.2 Particle separation - pre filtration
For the pre filtration 30” of cartridge filters were chosen. Usually 4 filters in a series were used, where the pore size gradually was diminished. Pressure drop over the filters was registered. A high pressure drop, usually caused by clogging of the filters gave an alarm signal. At pressure-drops over the allowed limit (approx. 4-5 bar) or surface dose rates of radioactivity over approx. 5 milliSieverts per hour (mSv/h), the filters were exchanged. Measurements of radioactivity in the water were made before and after the filtration at several times.
4.3 Gas separation
The gas transfer membrane was operated as a pre treatment before membrane filtration in practically all tests where the membrane filtration is run. This was done in order to ensure a safe work environment for the employees concerning leakage of hydrogen and noble gases. Samples for analyse were taken before and after the GEM equipment at several occasions during the tests. A couple of more specific tests were accomplished in order to state the function and capacity of the technique at different operation such as “vacuum” mode and “combi” mode.
The capacity of the membranes was tested when operating the equipment with two different flow rates and analyses of the content of the water before and after the treatment with one and both membranes in a series respectively.
Table 4.3.1 Experimental outline with two different flow rates and one + two membrane modules in a series.
Flow rate Radioactivity after: Radioactivity after:
1500 L/hour One membrane Two membranes
600 L/hour One membrane Two membranes
Another variable is the possibility to vary between vacuum or “combi” mode. The latter one refers to the addition of a strip gas inside the hollow fibres, but with a low pressure maintained. The experiment was be performed through comparing the two operating modes regarding separation of gaseous radioactivity.
In this test two variables were tested:

BATMAN - Best Available Technique Minimising All Nuclide. IVL report B1673
23
- Flow rate (four levels)
- Vacuum / stripping mode (three levels)
Table 4.3.2 Experimental set up for testing of the impact of a stripping gas and different flow rates. The flow of stripping gas was not possible to measure and was regulated manually.
Test no. 1 2 3 4 5 6
Flow rate (L/hour) 2480 2050 1510 970 970 970
Vacuum pressure (Bar) 0.90 0.89 0.90 0.90 0.88 0.86
Gas flow - - - - smallest possible
Twice the amount in test 5
4.4 Membrane filtration
Water pre- treated by cartridge filtration and GEM has been gathered in a buffering container from where the water has been pumped into the membrane filtration plant. Usually the experiments have been made at a chosen capacity / feed flow and a chosen VRF with the concentrate flux as a fixed quota of the feed flow. A feed flow of 2 000 L/h and a quota of 200 corresponding to a concentrate flux of 10 L/h and a total permeate flux of 1 990 L/h was a common mode. With the constant capacity the filtration pressure has been adjusted automatically to the capacities of the membranes. If the filtration resistance was increased and the capacity thereby decreased the filtration pressure was automatically increased in order to keep the flow rate at a steady level.
The permeate flux from each membrane respectively has been held at around the same level through adjusting the regulating valves on each permeate pipe. A throttle of permeate flux leads to an increased pressure at the permeate side of the membrane which means that the real driving filtration pressure decreases. The pressure on the permeate side has therefore been measured in order to make it possible to calculate the flux as a function of the driving filtration pressure, trans-membrane pressure, TMP, for each membrane type respectively.
Initially estimations were made that cleaning of the membranes might be needed due to fouling of the membranes. High dose rates of radioactivity on the membranes might so make cleaning necessary.
The membranes have been cleaned with an acid cleaning solution, citric acid or an alkali cleaning solution, NaOH. On one occasion the detergent ”Ariel” with addition of NaOH to pH 9.5 was tested. Ordinary detergents for membrane cleaning contain a mix of interacting chemicals such as alkali, soda, lye, surfactants and complexing agents. Since complexing agents normally are prohibited within the water systems at Ringhals, the membrane cleaning processes normally were made with acid or alkali solutions instead of conventional cleaning chemicals.
100 L of cleaning solution was mixed and warmed up into 40-45°C in the cleaning tank. The cleaning solution was pumped through the membrane plant during 0.5-1 hour. The immersion heater could not be used during the circulation, which made the temperature fall and the cleaning effect decrease. After emptying the cleaning tank was filled with de-ionised water, which was circulated round the system for 5 - 10 minutes. Rinsing with de-ionised water was repeated until the cleaning chemicals had been rinsed away from the system and the conductivity and radioactivity had been reduced to an acceptable level.
BATMAN - Best Available Technique Minimising All Nuclide. IVL report B1673
24
4.5 Concentrate treatment
4.5.1 Lab scale tests
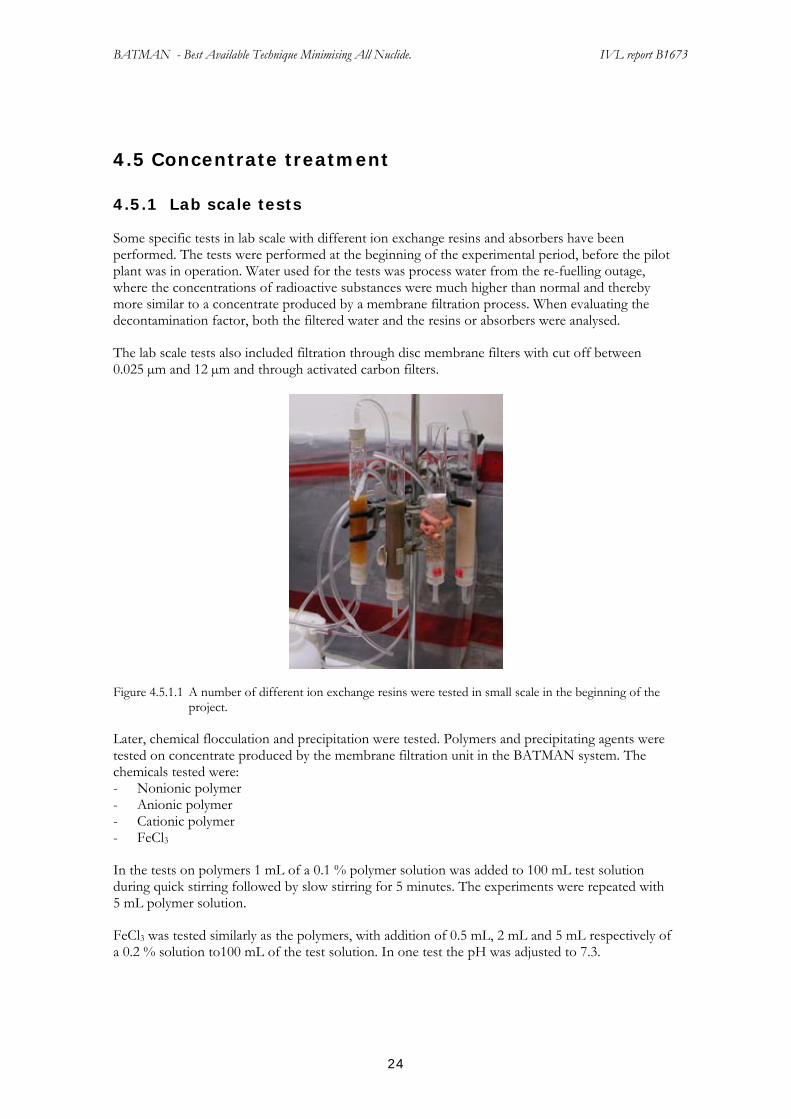
Some specific tests in lab scale with different ion exchange resins and absorbers have been performed. The tests were performed at the beginning of the experimental period, before the pilot plant was in operation. Water used for the tests was process water from the re-fuelling outage, where the concentrations of radioactive substances were much higher than normal and thereby more similar to a concentrate produced by a membrane filtration process. When evaluating the decontamination factor, both the filtered water and the resins or absorbers were analysed.
The lab scale tests also included filtration through disc membrane filters with cut off between 0.025 µm and 12 µm and through activated carbon filters.
Figure 4.5.1.1 A number of different ion exchange resins were tested in small scale in the beginning of the project.
Later, chemical flocculation and precipitation were tested. Polymers and precipitating agents were tested on concentrate produced by the membrane filtration unit in the BATMAN system. The chemicals tested were: - Nonionic polymer - Anionic polymer - Cationic polymer - FeCl3
In the tests on polymers 1 mL of a 0.1 % polymer solution was added to 100 mL test solution during quick stirring followed by slow stirring for 5 minutes. The experiments were repeated with 5 mL polymer solution.
FeCl3 was tested similarly as the polymers, with addition of 0.5 mL, 2 mL and 5 mL respectively of a 0.2 % solution to100 mL of the test solution. In one test the pH was adjusted to 7.3.
BATMAN - Best Available Technique Minimising All Nuclide. IVL report B1673
25
The test solutions thereafter were filtered through 0.6 µm paper filters.
4.5.2 Filtration in pilot scale
Experiments where two different filter cut off were used as pre treatment before ion exchange was performed within the BATMAN system. This aimed to test what impact the filtration had on the total separation of radioactivity for the concentrate treatment step and if there was a reason for using fine and more expensive dead end filters.
4.5.3 Ion exchange in pilot scale
When the membrane filtration was operated the concentrate treatment had been in online operation most of the time using different kinds of filtration and ion exchange. Several samples have been analysed in order to follow the effect of each treatment step.
In one of the tests activated carbon as further treatment after ion exchange was evaluated.
4.6 Permeate treatment
4.6.1 Ion exchange
All produced permeate from the membrane filtration plant was polished further by an ion exchanger, except for the last period of the project, when the EDI (further described below) replaced the permeate ion exchanger. The ion exchanger contained 50 litres of resin and two types of standard mix bed nuclear grade resin was evaluated Samples were taken out at several occasions.
4.6.2 EDI
An Electrical DeIonisation equipment with a capacity of 2 m3/h was installed within the BATMAN system at the end of the test period. A mix bed cell in hydrogen form was used for the tests while a cation and an anion cell was available for further evaluation which was not included in the program due to lack of time. The purpose of the technique was to further minimise the radioactivity in the permeate stream from the cross-flow membranes, before discharged to the sea. The EDI technique was to be used as a complement or as an alternative to conventional ion exchange and to evaluate the possibilities to reduce the waste volumes from resin.

BATMAN - Best Available Technique Minimising All Nuclide. IVL report B1673
26
Figure 4.6.2.1 EDI equipment. The white cylinder in the back is a spiral wound membrane.
All tests were made on membrane filtrated water (permeate) and the feed flow varied between 1500 L/h and 2000 L/h. The concentrate together with electrolyte consisted of <30% of the feed. The variable parameters on the EDI equipment were voltage and flow rate. Additionally it was possible to add a specific ion species as brine in order to increase the current density. Unfortunately, the equipment did not allow a fixed current to be set and this was varying between 0.5 A to 5.5 A while adjusting the voltage during the clean up phase. At equilibrium, the equipment operated most of the time at 1-5 A. Because of the late installation, only a smaller number of tests were performed with this technique than the other parts of the BATMAN system.
4.7 Sampling and analyses
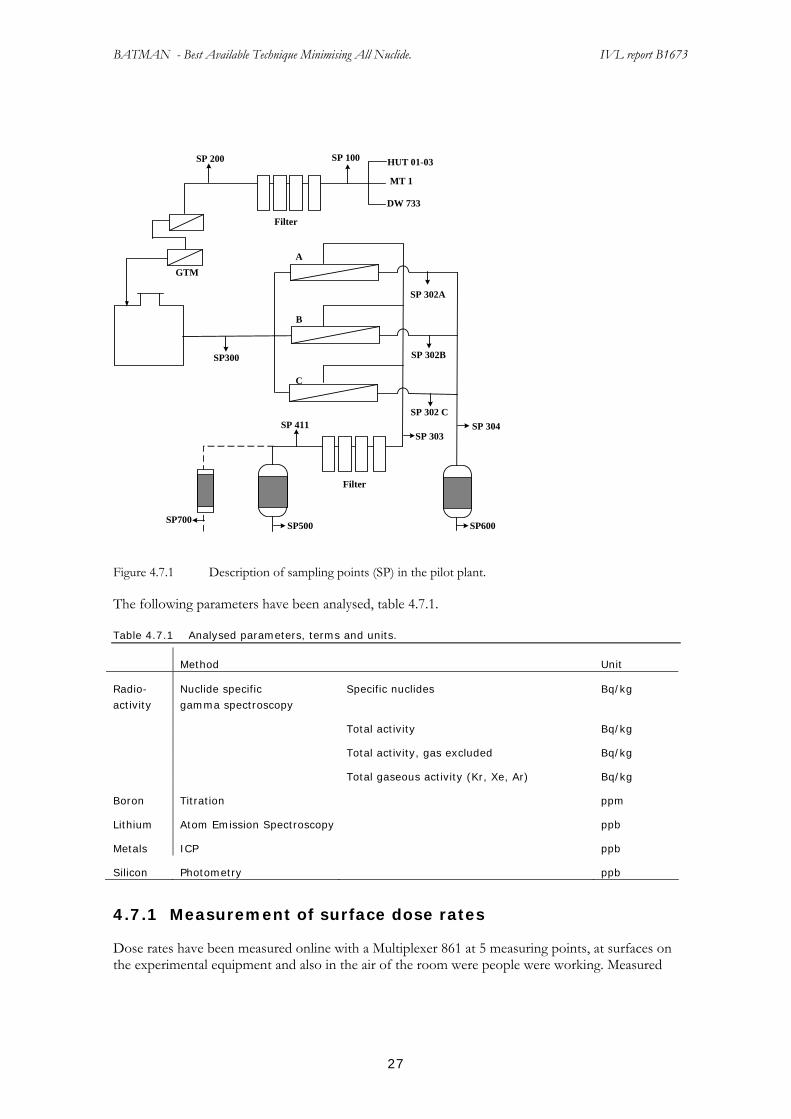
Random water samples have been taken from several sampling locations at the treatment equipment. The water samples were taken in 1 L plastic bottles. For the permeate samples unused bottles were used due to the low activity levels avoiding any cross contamination. The samples were analysed at the laboratory at Ringhals. A register of all sampling points on the equipment is presented in figure 4.7.1.
BATMAN - Best Available Technique Minimising All Nuclide. IVL report B1673
27
A
B
C
HUT 01-03
MT 1
DW 733
SP 302A
SP 302B
SP 302 C
SP 303
SP 100SP 200
GTM
Filter
SP300
SP 411
SP500 SP600SP700
Filter
SP 304
Figure 4.7.1 Description of sampling points (SP) in the pilot plant.
The following parameters have been analysed, table 4.7.1.
Table 4.7.1 Analysed parameters, terms and units.
Method Unit
Radio-activity
Nuclide specific gamma spectroscopy
Specific nuclides Bq/kg
Total activity Bq/kg
Total activity, gas excluded Bq/kg
Total gaseous activity (Kr, Xe, Ar) Bq/kg
Boron Titration ppm
Lithium Atom Emission Spectroscopy ppb
Metals ICP ppb
Silicon Photometry ppb
4.7.1 Measurement of surface dose rates
Dose rates have been measured online with a Multiplexer 861 at 5 measuring points, at surfaces on the experimental equipment and also in the air of the room were people were working. Measured

BATMAN - Best Available Technique Minimising All Nuclide. IVL report B1673
28
values were logged. Dose rates on filter housings and membrane vessels have also been measured by a hand meter, type Automess-AD3. All measured values are noted in the logbook.
4.7.2 Exchange of filters and membranes
Cartridge filters, pre-filters and concentrate filters, have been exchanged at too high pressure drops or at dose rates >5 mSv/h. The filter exchanges have been made together with staff from the radiation protection department. After drainage of water the filter housings have been removed and the cartridge filters have been put in double plastic bags. Radioactivity has been measured on the surface of the filters before discharged to waste.
During membrane exchanges the membranes have been rinsed with water and drained in order to minimise the radioactivity on the surface and thereby the personal exposure. The two gables of the pressure vessels have been dismounted and the three spiral wound membranes are pushed out towards the outlet end. The membranes have been put in double plastic bags and the radioactivity on the membrane surface has been measured. At some occasion gamma nuclide specific analyses have been performed.
4.7.3 Exchange of ion exchange resin
When the dose rates on the surface of the ion exchanger has been too high, the resin has been exchanged. Due to radiation reasons, the resin has not been used until saturation.
5 Results
In general, the BATMAN system as an average managed to reduce >99% of the radioactivity in the water excluding tritium and noble gases. The main part of the activity is separated by the membranes and is thereafter caught on the ion exchange resin in the concentrate treatment step. Figure 5.1 shows the average percentage separation of radioactivity at the different steps of the treatment plant, when treating type A wastewater, coolant water. The cleaned water for discharge normally contained less then 0.75 % of the original radioactivity.

BATMAN - Best Available Technique Minimising All Nuclide. IVL report B1673
29
Figure 5.1 Flow scheme for the radioactivity through the pilot plant. The figures symbolise the average separation by each technique respectively measured for a number of tests. The figures are based on test results from type A water. Measurements are made on total radioactivity excluding tritium and gaseous radioactivity, the radioactive gases removed by the GEM are not included in the calculation.
5.1 Particle separation – pre filtration
The pre-filters in front of the membrane equipment performed well most of the time, although several replacements were needed due to high differential pressure or high surface dose rates. For pre-treatment before membrane filtration manufacturers normally recommend 1-2 µm filters. In-situ experiences at the Ringhals site had indicated that using such filters in most cases were insufficient to reduce a considerable amount of radioactivity. The predominant amount of the source was expected to exist as colloidal or particles at lower size.
Since the content of the feed water varied highly during the test period, the use of different filters was difficult to evaluate. In the project filters with a cut off down to 0.2 µm was evaluated without showing a high degree of separation in the process water (type A). For this purpose other technique may be demanded, such as membrane filtration.
However, for all types of filtration tests made with water type A, gradually finer filters showed improving separation results.
For filtration of water containing higher turbidity and conductivity (type B) and water loaded with organics and chemicals, a higher degree of step by step pre treatment is necessary. Even though the separations in some of the tests were good. Pure particle filtration however is not enough to protect

BATMAN - Best Available Technique Minimising All Nuclide. IVL report B1673
30
following equipment such as cross flow filtration or ion exchange. In some cases micro- or ultra filtration might be better pre-treatment techniques and “selective” filters capturing traces of oils and other organics may be advisable.
Table 5.1.1 Separation of radioactivity over the particle filters. There is a significant separation, although not very high, except for the type B wastewater, which originates from unspecific sources such as floor drainage and probably contains a larger content of particle bound radioactivity.
Source of water Reduction of radioactivity Number of tests
PAR coolant waste (HUT, type A) 25% 12 Waste water (MT, type B) 73% 3
5.2 Gas Separation
The GEM equipment has shown good results during the experimental period. The reduction of radioactive gases has been satisfactory and the practical handling of the equipment has been robust and easy. Average separation of gaseous radioactivity by the GEM throughout the test period is around 85 %.
Separation of nobel gases by the GTM
0%20%40%60%80%
100%
2002
-12-
18
2003
-02-
19
2003
-04-
04
2003
-04-
10
2003
-05-
12
2003
-10-
08
2003
-11-
20
2004
-02-
10
2004
-02-
25
2004
-04-
23
2004
-05-
03
2004
-05-
03
2004
-05-
03
Date of test
% s
epar
atio
n
Figure 5.2.1 Separation degree of gaseous radioactivity over the GEM unit at 13 different test dates.
The capacity test, where two different flow rates were compared shows that the separation ability of radioactive gases was highly dependent on the flow rate (see table 5.2.1). The operation mode during this test was vacuum mode. At the higher flow rate a great share of the gaseous activity is removed after the first membrane and even more after the second one. With the smaller flow rate and two membranes in a series the radioactive gases were completely removed from the system. This indicates that the system might be under-sized for high concentrations of gases since the maximum flow rate through the system is 2.5 m3/hour. On the other hand the gas content in the test with the lower flow rate is unusually high.

BATMAN - Best Available Technique Minimising All Nuclide. IVL report B1673
31
Table 5.2.1 Analyses of radioactivity for the test with different flow rates through the gas transfer membranes. At the low flux and after both membranes the gas part of the radioactivity is removed to a very high degree.
Flow rate Before GEM After GEM, After GEM, Membrane 1 Membrane 2
L/hour Gaseous activity (Bq/kg)
1500 7190 1940 680 600 14410 650 10
The other specific test showed that introduction of a stripping gas might increase the efficiency of the membranes. In this test two variables were tested: - Flow rate (four levels) - Vacuum / stripping mode (three levels)
0,00E+00
2,00E+03
4,00E+03
6,00E+03
8,00E+03
1,00E+04
1,20E+04
1,40E+04
1,60E+04
1,80E+04
2480l/h
2050l/h
1510l/h
970l/h
970l/h*
970l/h**
2480l/h
2050l/h
1510l/h
970l/h
970l/h*
970l/h**
2480l/h
2050l/h
1510l/h
970l/h
970l/h*
970l/h**
SP-200
SP-200
SP-200
SP-200
SP-200
SP-200 SP-201
SP-201
SP-201
SP-201
SP-201
SP-201 SP-202
SP-202
SP-202
SP-202
SP-202
SP-202
0,00E+00
2,00E+05
4,00E+05
6,00E+05
8,00E+05
1,00E+06
1,20E+06
1,40E+06
1,60E+06
Kr-85mXe-131mXe-133mXe-135Xe-133Total gas
Kr-85m, Xe-131m, Xe-133m, Xe-135 Xe-133, Totalt
* = Small flow of stripping gas ** = Larger flow of stripping gas
Figure 5.2.2 Analysis results from GEM test with different flow rates and with and without stripping gas. SP-200 represents the feed flow, SP-201 represents the content after one membrane and SP-202 is the gas content after both membranes in the different tests.

BATMAN - Best Available Technique Minimising All Nuclide. IVL report B1673
32
0,0
10,0
20,0
30,0
40,0
50,0
60,0
70,0
80,0
90,0
100,0
2480 l/h 2050 l/h 1510 l/h 970 l/h 970 l/h * 970 l/h **
Kr-85mXe-131mXe-133Xe-133mXe-135Total gas
Small flow of Higher flow of stripping gas stripping gas
Figure 5.2.3 Percentage separation degree of gas by the GEM equipment. The separation degree for total radioactive gas is highest in the last test, where the flow is low (970L/h) and a stripping gas is added (**).
5.2.1 Comments
The tests show good results throughout the whole project period. The membranes have not been cleaned at all during the period and might suffer from biological activity on the surfaces. If that would be the case one might expect gradually decreased separation degrees, but no such effect has been shown. When designing full scale GEM equipment, cleaning possibilities of the equipment should be taken under consideration.
After separation by the GEM, the radioactive noble gases have to be stored and taken care of by the existing gas treatment system in order to decay before outlet in the air.
The results indicate that the stripping mode might give a slightly higher separation degree than the vacuum mode. There are however too few tests made to draw any clear conclusions about what mode gives the best separation.
5.3 Membrane Filtration
During the period December 2002 until November 2004 about 140 tests were performed on the membrane filtration plant. The treated volume is 4 500 m3. During 2003 2120 m3 was treated corresponding to 65 % of the produced water. During 2004 82 % of produced water was treated. The project was initiated in 2001, purchased in 2002, and in operation in 2003-2004.

BATMAN - Best Available Technique Minimising All Nuclide. IVL report B1673
33
5.3.1 Principle for separation of radioactivity and boron
The purpose of the membrane filtration was separating a maximum of radioactivity but letting the boric acid through the membranes. Boric acid has a rather low solubility in water and a high separation of boric acid would lead to precipitation of boron in the system with clogging and fouling of membranes and equipment as a result. A key task in the project was to find this balance.
During the membrane filtration the volume reduction factor, VRF, has been high, usually around 200. This means that substances separated by the membranes to a high degree are concentrated. The degree of concentration is an average value of the separation degree for all three membranes since there is only one common concentrate. The definition of separation degree over a membrane is the concentration in permeate that has passed through the membrane versus the concentration in the concentrate on the membrane side. This definition has been used for calculation of the separation degrees of boron. For calculations of the separation degrees for radioactivity the definition used has been the concentrations in permeate versus the concentrations in the feed. This definition is chosen since it is more interesting in this case i.e. how high the reduction of radioactivity with the treatment is. The principles for the calculations are illustrated in figure 5.3.1.1
1 000 1 000 0 %5 000 1 000 80%
2 000 L/hB 1 000 ppm
10 L/hB 5 000 ppm
1 990 L/hB ~1 000 ppm
Boron
Figure 5.3.1.1 Principle for the calculations of reduction of boron and radioactivity over the membranes.
In the example the feed flow is 2 000 L/h with the boron concentration 1 000 mg/L and a radioactivity of 5 000 Bq/kg. VRF is 200 which gives a concentrate flow of 10 L/h and a permeate flow of 1990 L/h.
The reduction of boron is assumed to be 80 %. This means an increase of the boron concentration to around 5000 mg/L in the system if the concentration in permeate is going to be equal to the concentration in the feed i.e. no build up of boron in the system. Looking at the relationship between the feed and permeate, the reduction of boron is 0 %, but the difference in concentration over the membrane shows a separation of 80 %.
The reduction of radioactivity is 90 % when calculations are based on concentrations in the feed versus concentrations in permeate. However, if the reduction is calculated from concentrations in concentrate versus concentrations in permeate, a reduction of 99.,5% is reached.
5.3.2 Separation of boron
For calculation of reduction degrees of boron for each membrane respectively a calculation model has been developed. An example is given for one experiment from 2003-10-08 and shown in figure 5.3.2.1. The model calculates the concentrations that load the membrane depending on the different concentrations out from membrane A, B and C.
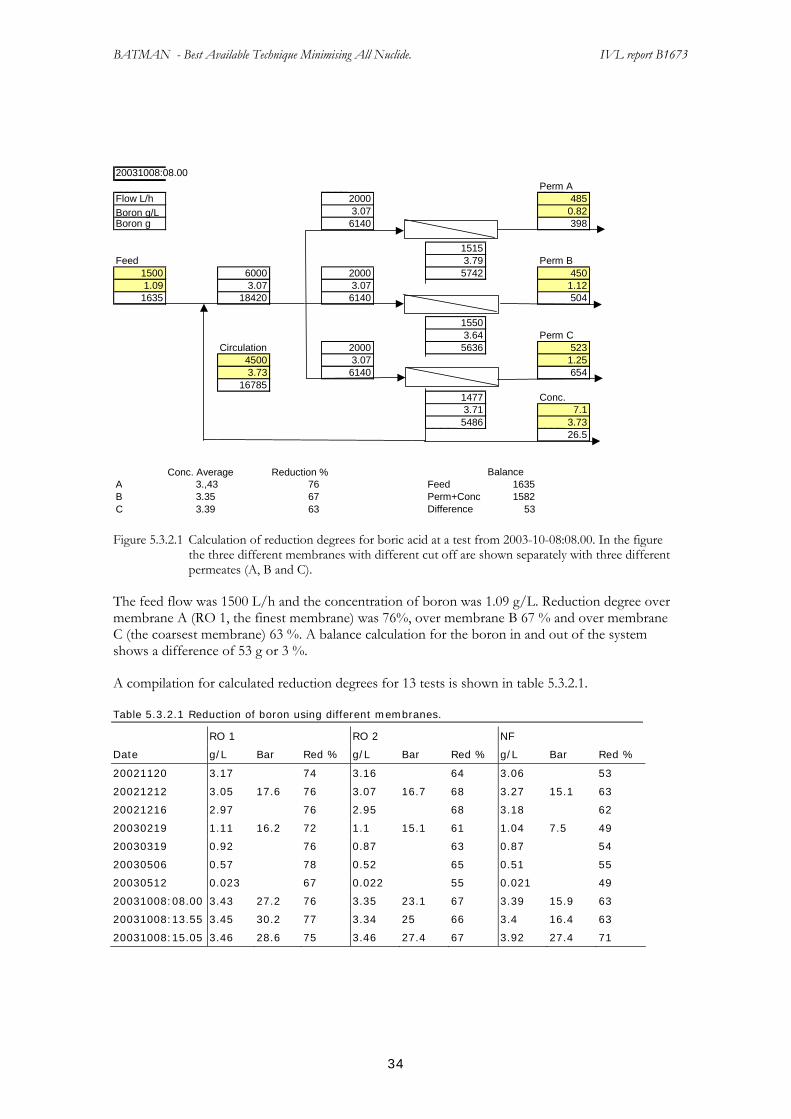
BATMAN - Best Available Technique Minimising All Nuclide. IVL report B1673
34
20031008:08.00
Perm A Flow L/h 2000 485 Boron g/L 3.07 0.82 Boron g 6140 398
1515Feed 3.79 Perm B
1500 6000 2000 5742 450 1.09 3.07 3.07 1.12
1635 18420 6140 504
15503.64 Perm C
Circulation 2000 5636 523 4500 3.07 1.25 3.73 6140 654
16785 1477 Conc. 3.71 7.1 5486 3.73
26.5
Conc. Average Reduction % BalanceA 3.,43 76 Feed 1635B 3.35 67 Perm+Conc 1582C 3.39 63 Difference 53
Figure 5.3.2.1 Calculation of reduction degrees for boric acid at a test from 2003-10-08:08.00. In the figure the three different membranes with different cut off are shown separately with three different permeates (A, B and C).
The feed flow was 1500 L/h and the concentration of boron was 1.09 g/L. Reduction degree over membrane A (RO 1, the finest membrane) was 76%, over membrane B 67 % and over membrane C (the coarsest membrane) 63 %. A balance calculation for the boron in and out of the system shows a difference of 53 g or 3 %.
A compilation for calculated reduction degrees for 13 tests is shown in table 5.3.2.1.
Table 5.3.2.1 Reduction of boron using different membranes.
RO 1 RO 2 NF
Date g/L Bar Red % g/L Bar Red % g/L Bar Red %
20021120 3.17 74 3.16 64 3.06 53
20021212 3.05 17.6 76 3.07 16.7 68 3.27 15.1 63
20021216 2.97 76 2.95 68 3.18 62
20030219 1.11 16.2 72 1.1 15.1 61 1.04 7.5 49
20030319 0.92 76 0.87 63 0.87 54
20030506 0.57 78 0.52 65 0.51 55
20030512 0.023 67 0.022 55 0.021 49
20031008:08.00 3.43 27.2 76 3.35 23.1 67 3.39 15.9 63
20031008:13.55 3.45 30.2 77 3.34 25 66 3.4 16.4 63
20031008:15.05 3.46 28.6 75 3.46 27.4 67 3.92 27.4 71

BATMAN - Best Available Technique Minimising All Nuclide. IVL report B1673
35
Figure 5.3.2.2 Illustration of the reduction of boron over the membrane filtration tests.
During the time from the start of the tests in November 2002 until May 2003 the concentrations of boron decreased from 1.19 to 0.01 g/L in the feed. Reduction degrees during this period were relatively constant. Membrane A (fine RO) showed an average value of 74 %, membrane B 63 % and membrane C 55 %.
Risk assessment of precipitation of boron
The principle for the membrane filtration is that the concentration of boron increases at the concentrate side of the membrane so that the concentration in the permeate increases to the same level as in the feed solution. This means that equilibrium is reached, where the amounts of boron in permeate and concentrate is equivalent to the amount in the feed. A high initial concentration of boron and/or a high separation of boron could lead to such increased boron concentrations that the solubility is exceeded resulting in precipitation and operational problems.
The maximum allowed concentration of boron in the feed depending on the separation degree for the membrane is calculated according to the following. The solubility for boron is approx. 8 g/L at 20°C. During passage through the three membranes in a series the concentration is increased due to permeate flow and separation degree. An increase of the concentration by 20% means that the concentration of boron in the concentrate from the first membrane is 8*0.8 = 6.4g/L. This gives an average concentration of (8+6.4)/2 = 7.2 g/L. Assuming that the concentration of boron in permeate is equal to that in the feed, maximum concentrations in the feed are calculated according to table 5.3.2.2.
Table 5.3.2.2 Calculation of maximum allowed feed concentration of boron.
Membrane Type Red B % Max. conc. B g/L
A RO 1 74 1.9 B RO 2 63 2.7 C NF 55 3.2
With membrane A (RO 1) alone the maximum boron concentration in the feed would be <2000ppm.
The calculations assume that the separation degrees at the higher concentrations (7 - 8g/L) are equal to those in the tests where the highest concentration was 3.2 g/L.
Higher concentrations may demand higher filtration pressure, which would increase the reduction degree and thereby reduce the maximum concentration of boron allowed in the feed.

BATMAN - Best Available Technique Minimising All Nuclide. IVL report B1673
36
The solubility for boron (boric acid) increases with an increased temperature. At 25°C the solubility is 9.5 g/L. This means that higher concentrations in the feed could be allowed if the temperature is increased.
5.3.3 Separation of radioactivity
From total activity reduction degrees have been calculated for a number of the tests. These are presented in table 5.3.3.1.
Table 5.3.3.1 Reduction degrees of radioactivity over the different membranes.
Feed RO Permeate RO 1 Permeate RO 2 Permeate NF
Bq/kg Bq/kg Red % Bq/kg Red % Bq/kg Red %
HUT 3 2002.12-12 10 300 147 98.6 306 97.0 67 99.3
HUT 3 2003-01-15 8 370 127 98.5 341 95.9 208 97.5
HUT 1 2003-05-12 2 780 91 96.7 225 91.9 286 89.7
MT 1 2003-06-24 17
2003 June Low reduction with membrane C. destroyed seal/o-ring
HUT 2 2003-10-08 4 540 107 97.6 345 92.4 413 90.9
HUT 2 2004-02-10 1 720 48 97.2 96 94.4 51 97.0
2004 April Changed to NF90
HUT 1 2004-04-07 635 40 93.7 80 87.4 25 96.1
HUT 1 2004-05-05 336 34 89.9 54 83.9 21 93.8
MT 1 2004-08-12 27 000 539 98.0 10 300 61.9 86 99.7
2004 Aug. New NF90
HUT 1 2004-08-27 2 970 643 78.4 209 93.0 165 94.4
HUT 2 2004-09-21 6 430 261 95.9 180 97.2 97 98.5
HUT 3 2004-11-15 1 870 262 86.0 243 87.0 162 91.3
In pressure vessel 1 the same membrane type, RO 1, has been used during the whole test period. Until April 2004 the reduction degrees were 97-98 % which is slightly higher than for membrane RO 2 and NF. Thereafter the reduction degrees were lower in a couple of tests. The reason for this might be lower concentrations in the feed water.
In pressure vessel 2 RO 2 membranes were used until April 2004. This membrane showed slightly lower reduction degrees than did RO 1. This difference is proportional to the difference in separation of salt for RO 1 and RO 2 respectively. Periodically the filtration pressure has approached 40 bars. The membrane RO 2 was a low-pressure membrane with a maximum pressure of 29 bars. For this reason it was exchanged to a more pressure resistant membrane. Meanwhile the possibilities of finding a membrane with similar separation degree but with parallel spacer were examined. When the efforts not succeeded within a reasonable time another membrane of the same type as in pressure vessel 3, a NF membrane was chosen. By that means performance and differences between a new membrane and one used for 1.5 year of operation could be compared.
The new NF membrane showed a much lower separation degree than the old NF membrane. A test was made where samples were taken from each one of the three membranes within the vessel. The first membrane showed much lower separation degree than the two following. The pressure vessel was opened and the connections for permeate were checked. No visible damage could be seen but the membranes were replaced with new NF membranes again. These new membranes

BATMAN - Best Available Technique Minimising All Nuclide. IVL report B1673
37
from August to November showed a higher reduction than RO 1, but slightly lower than the used NF membranes.
In pressure vessel 3 the same set of membranes, NF, been used all over the test period. The separation degree has mainly exceeded 90% during the whole test period except for June 2003 where the separation was drastically lower. The pressure vessel was opened finding a seal o-ring was leaking at an extension for the permeate connection between the membranes. The most probable reason was a high filtration pressure due to high conductivity / high salt concentrations in the feed combined with an incorrectly assembled seal o-ring. After exchange of the seal o-ring the same reduction degrees as before the drop was attained.
During the last half year of the test period the separation was higher than for the finer RO 1 membrane.
Separation of specific nuclides
Reduction degrees have been calculated for 5 different nuclides, Co-58, Co-60, Ag-110m, Sb-124 and Sb-125 for each membrane type respectively.
Co-58 shows in the majority of the evaluated tests the lowest separation degree, although the difference is not very obvious. Examples of differences in separation degrees are shown in table 5.3.3.2.
Both tests were made on process water (HUT, type A). The test made 2003-09-24 (the first one) showed a lower reduction degree for total activity with membrane B that is due to the low separation degree of Co-58. In the test made 2004-11-15 Sb-125 showed the lowest reduction degree. This has not been the case for the other tests.
Table 5.3.3.2 Examples of differences in separation degrees of different nuclides and by the different membranes
Test date Analysis Feed RO Permeate Membrane A (RO 1)
Permeate Membrane B (RO 2)
Permeate Membrane C (NF)
Bq/kg Bq/kg Red % Bq/kg Red % Bq/kg Red %
2003-09-24 Co-58 789 152 80.7 611 22.6 166 79.0
Co-60 177 4.3 97.6 15.9 91.0 4.6 97.4
Ag-110m 1 160 3.1 99.7 5 99.6 1.2 99.9
Sb-124 696 6.1 99.1 18.5 97.3 7 99.0
Sb-125
Tot act. 3 260 177 94.6 680 79.1 182 94.4
2004-11-15 Co-58 289 5.9 98.0 15.4 94.7 3 99.0
Co-60 205 2.7 98.7 7.3 96.4 1.2 99.4
Ag-110m 385 3.1 99.2
Sb-124 416 38.9 90.6 19.6 95.3 36.2 91.3
Sb-125 159 33.2 79.1 17.8 88.8 31.6 80.1
Tot act. 1 870 262 86.0 243 87.0 162 91.3

BATMAN - Best Available Technique Minimising All Nuclide. IVL report B1673
38
Balance calculation for total activity of the membrane filtration
The amount of activity in the feed has been calculated and compared with the sum of calculated amounts of total activity recovered in permeate and concentrate. The difference between the calculated total activity in incoming and in the outgoing water from the membrane unit is large. 10-95% of activity in incoming feed is recovered in permeate plus concentrate. Consistently the incoming amount exceeds the outgoing, which may indicate an accumulation of radioactivity on the membrane filtration equipment, which is expected.
Average distribution of the total activity has been calculated from 17 evaluated tests.
Feed Concentrate Permeate Sum outgoing
100 % 25-75 % 0-20 % 40-80 %
Low concentrations, mainly in permeates, affect the balance. The sources of error at low concentrations are high, which often the case is for permeates. When analysing samples with very low concentrations, the accuracy of measurement is lower. Since the volumes of permeate are very large this error might be large in total for such mass balances.
Calculations show that 10 % of incoming total activity is recovered in the permeate corresponding to a reduction of 90 %. This is probably a fair average figure of the reduction degree. This means that the concentrate stream should contain 90 %. The difference between 90 % and 47 % should in that case be explained by accumulation of activity and errors in the measuring data.
Table 5.3.3.3 shows the total reduction of radioactivity with the membrane filtration and following ion exchange procedure. In the table the results for type A and type B water are separated.
Table 5.3.3.3 Reduction of total activity with membrane filtration followed by ion exchanger. The ion exchanger has contributed to further minimise the outlet of radioactivity in the purified water. Type A represents reactor coolant waste, while Type B stands for other wastewater.
Type A Type B Membrane + Membrane + Membrane Ion Exchange Membrane Ion Exchange Red % Red % Red % Red %
2002-12-12 98.5 2002-12-18 93.9 99.9 2003-01-15 97.4 2001-01-21 91 99.9 2003-04-04 88.5 99.7 2003-04-10 79.9 99.3 2003-05-08 99.5 99.8 2003-05-12 93 99.6 2003-09-24 8.39 99.1 2003-10-08 93.1 99.4 2003-11-24 84.8 2004-04-23 78.2 98.6 2004-05-05 88.3 2004-06-22 97.9 2004-06-30 80 91.2 2004-07-14 81.5 87.1 2004-08-12 85.9 91.5 2004-08-27 91.1 97.5 2004-09-21 97.3 99.2 2004-11-15 89 99.6 2004-11-23 62.2 99.5

BATMAN - Best Available Technique Minimising All Nuclide. IVL report B1673
39
5.3.4 Separation of lithium
Lithium has been separated in a similar way as boron by the membrane filtration. Lithium is concentrated within the concentrate stream until the concentration in permeate is equal to that in the feed. At this equilibrium the concentration in the concentrate has been 10 times higher. This means that the reduction of lithium over the membrane is approx. 90 %, while the real reduction is very small, only the share which is separated by the concentrate stream. At VRF 200 and a concentration of lithium 10 times approx. 5 % was separated and 95 % was recovered in permeate.
A theoretical risk for precipitation of lithium-borate in concentrate exists. During the project period the concentrations have not been in such zone, but when designing a similar system, such risks as well as the risk of boric acid precipitation should be considered.
5.3.5 Capacities for the membrane filtration
Average values for measured permeate flows for each membrane type respectively have been used for calculating the flux (the flow per surface unit, L/m2, h). During the tests the filtration pressure has varied due to the chosen level for the feed and/or the content of the feed. The flux has therefore been calculated in relation to the filtration pressure, Trans Membrane Pressure, TMP, the difference between the filtration pressure on the concentrate side and the pressure on the “back side”; the permeate side. The flux is then expressed as L/m2, h, Bar.
For each membrane 70 tests calculations of flux have been made. For the comparison of calculated flux average values have been calculated per month. Average flux, temperatures and concentrations of boron are shown in figure 5.3.5.1.
The initially flux during the start of the tests in December 2002 was just below 2 for membrane RO 1, just over 2 for RO 2 and around 3 L/m2, h, bar for the NF membrane. These were expected differences in the flux due to the given cut off for the membranes. Until the revision in May, the fluxes increased to 4.5 and 7 L/m2, h, bar. This is mainly due to the increase in temperature, but might also be an effect of a decreased boron concentration. During this period mainly process water was treated.
After the refuelling outage, in June 2003, type B wastewater was treated. There was a considerable decrease in flux to below 1 L/m2, h, bar for both RO membranes and just below 1 for the NF membrane. The conductivity of the concentrate was very high, >4000 µS/cm (normal values are <50 µS/cm). The operational mode was set on constant flow-rate. In order to attain the flow rate the pressure was increased to the maximum pressure of 45 bars and the plant stopped. The membranes were cleaned by citric acid and another test was made with type B water, however, still with fluxes below 1 L/m2, h, bar.

BATMAN - Best Available Technique Minimising All Nuclide. IVL report B1673
40
0
1
2
3
4
5
6
7
8
9
10
2002
-12
2003
-02
2003
-04
2003
-06
2003
-08
2003
-10
2003
-12
2004
-02
2004
-04
2004
-06
2004
-08
Flux
l/m
2, h
,bar
A
B
C
0
5
10
15
20
25
30
35
40
45
2002
-12
2003
-02
2003
-04
2003
-06
2003
-08
2003
-10
2003
-12
2004
-02
2004
-04
2004
-06
2004
-08
Tem
p ºC
0
500
1000
1500
2000
2500
Boric acida ppm
Temp
Boric acid
Figure 5.3.5.1 Flux, temperature and boron in the tests.
During the start up phase in September an obvious smell of hydrogen sulphide from the concentrate was noted. The membranes were cleaned with the detergent Ariel and the pH was adjusted to 9.5. Initially type B water was treated. The fluxes were still low, 1-1.5 L/m2, h, bar. After another cleaning by citric acid the fluxes showed a small increase during a short period, but soon dropped again in December to 1-1.5 L/m2, h, bar.
Under February – May 2004 the fluxes increased in a similar way as in the former year, but at a lower level. The obvious increase for membrane B during April is due to the exchange of membrane RO 2 to NF. In June, after the refuelling outage, type B water was treated. The fluxes again were low, 1-1.5 L/m2, h, bar.

BATMAN - Best Available Technique Minimising All Nuclide. IVL report B1673
41
The final period, August to September was started with a cleaning of the membranes with NaOH solution with pH 10. The NF membranes in pressure vessel 2 (former RO 2) were exchanged to new NF membranes. The capacities were, for membrane A (RO 1) <1 L/m2, h, bar, for membrane B (the new NF) 3 L/m2, h, bar and for membrane C (old NF) 1.5 L/m2, h, bar.
Comments
An increase in temperature during membrane filtration means an increased flux. An increase from 20 to 30°C theoretically gives an increase by 45 % of the flux. For the tests a corresponding increase in temperature has given an increased flux of >100 %. This means that the increased flux before the refuelling outage not only is an effect of temperature, but probably also caused by a diminished concentration of boron in the system.
The flux has periodically been reduced to 1 L/m2, h, bar which looks like a relatively low value compared to the initial capacities. However 1 L/m2, h, bar corresponds to a flux of 35 L/(m2h) at a filtration pressure of 35 bar, which still is a relatively high flux for an RO membrane. When treating industrial wastewater the fluxes usually are below 10 L/m2, h, bar.
The membranes have lost capacity over time. The reason for that might be fouling or scaling of the membranes, which have not been removed during the cleaning procedures. The capacity has been reduced to 50-60% when looking at the periods February – May 2003 and 2004 respectively. The difference is even larger when comparing the new and the old NF membranes in April and May 2004.
5.3.6 Membrane cleaning
The membranes were cleaned 10 times due to deteriorated capacity. The cleanings were performed with 1% citric acid or NaOH for pH adjustment to pH>10. One cleaning was made with the detergent Ariel + NaOH at pH 9.5 for removal of microorganisms. The cleaning solution was heated and circulated through the system. After drainage of the cleaning solution the system was rinsed 4-6 times with circulating of clean water.
Initially citric acid was used since corrosion on hose couplings might have brought precipitated iron onto the membranes. The couplings were exchanged to acid proof steel and the risk for corrosion in the system was diminished. After longer periods of shutdowns of the pilot plant the water in the system was turbid and had an obvious smell. This indicates biologic activity in the system. The membranes were therefore cleaned with alkali solution. The effects of the cleaning procedures probably would have been larger with cleaning solutions containing surfactants, complexing agents and alkali. Today the use of surfactants and complexing agents are however not allowed in the waste system at Ringhals due to final waste regulations.
The temperature has dropped during the cleaning program, since the immersion heater could not be in use during the circulation of the water. The membrane filtration system had to be flushed up to 6 times to remove remaining cleaning chemicals from the system. This arose from difficulties to drain the fluid from the system effectively even when using compressed air. This needs to be attended in a future system. To minimise the exposure of radiation to the staff, the membrane cleaning should be automatically controlled.

BATMAN - Best Available Technique Minimising All Nuclide. IVL report B1673
42
5.3.7 Operating experiences of the membrane filtration
The chosen operation principles with a high VRF, a small volume of concentrate (0.5% of the feed), high separation of activity and a high rejection of boron within permeate agreed with the forecast. The membrane filtration equipment has proved to have a stable operational function with well controlled capacity through regulation of filtration pressure and when the VRF was held constant towards a predicted quota.
The individual control of the permeate flow and measuring of pressure and flow rates have been necessary since the differences in capacity between the membranes have been relatively large. A reduction of the permeate flow by creating an overpressure on the permeate side of the membrane is however not recommended by the membrane suppliers.
Cleaning procedures of the membranes can be improved. There is always a certain decrease in capacity for a membrane over time compared to a new one, but in this case the reduction is relatively large considering the cleanliness of the treated water. Furthermore the feed side of the membranes has had deposition of “fuzz”, bio sludge and/or precipitation. If a more powerful cleaning chemical may be used, that is suitable for the waste system or can be taken care of in a separate system, and if the temperature could be kept constantly high during the circulation, the cleaning result most likely would be improved. There have also been too large volumes of water left in the system after drainage, resulting in repeated rinsing to remove the cleaning chemicals from the system.
The PLC system, T box, has been suitable for the control of operation and alarms. However, the system had a limited capacity for storage of measuring data, which instead had to be transferred to another system for storage. The transference was supposed to be managed automatically through e-mail, but this did not work. Instead the transference had to be made manually.
There has been a build up of radioactivity on the membranes. One theory was that radioactivity was accumulated in stationary concentrate within the gaps between the membranes and the inner surface of the pressure vessels. This was taken care of by taking out membrane B and C and cutting a passage in the rubber sealing between the membrane and the inner surface allowing a small share of the concentrate to flow in the outside of the membrane.
The spiral wound membranes had a standard type spacer (the net forming the distance between the membrane surfaces where the concentrate flows). The spacer gives a turbulent flow and may cause accumulations of un-dispersed substances, precipitation or bio sludge. With another type of spacer using “straight channels” the risk for such accumulations are diminished.
5.4 Concentrate Treatment
5.4.1 Lab scale tests
A series of laboratory tests with different ion exchange resins was performed at the beginning of the project. Since the tests were performed before any concentrate had yet been produced within the BATMAN system, the water used for the tests was wastewater from the refuelling outage of Ringhals 2. The concentrations of radioactivity and compilation of nuclides were similar to the produced concentrate in the BATMAN system.

BATMAN - Best Available Technique Minimising All Nuclide. IVL report B1673
43
All the commercial resins showed good separation ability. The cationic resins efficiently removed the nuclides Co-58 and Co-60, while the anionic resins removed >90 % of the Sb-124 and Sb-125. Some nuclear grade mixed bed resins to a high degree removed all radioactivity in the solution.
Filtration through disc membrane filters with pore size between 0,025 µm – 12 µm showed a separation of 10-45 % of total radioactivity. Ag-110m showed a good separation degree with filter pore sizes below 1µm. Some nuclides are however not separated well even with the finest filters-see figure 5.4.1.1.
Figure 5.4.1 Filtration through paper filters. For Ag-110 m, pore sizes below 1µm give a significant separation. This is also reflected in the separation of total radioactivity. Some nuclides are not significantly separated with any of the tested filters.
Carbon filters were tested on the same water as the ion exchange and disc membrane filters above. The nuclides Co-58, Co-60 and Ag-110 m showed a separation of 85-100 %, while only 30-40 % of the Sb-124 and Sb-125 nuclides were separated.
Chemical flocculation and precipitation showed low separation degrees for all chemicals tested. The polymers gave reduction degrees of 4-17 %, while the precipitation agent FeCl3 contributed to a maximum separation degree of 36 %.
5.4.2 Pilot scale tests
Over all reduction of the total activity varies between the tests. The average results from the test period are shown in the table below. The reduction of total activity is higher for the pure process water (type A) than for the chemical contaminated wastewater from the waste system (type B).

BATMAN - Best Available Technique Minimising All Nuclide. IVL report B1673
44
Table 5.4.2.1 Average reduction of total activity for the two different types of water treated in the system. The “total” figures represent the reduction over both filters and ion exchange as one unit, while the figures for the filters and ion exchange respectively relates to the concentrations before and after each treatment step.
Filter Ion exchange: Total:
PAR coolant waste (type A water) 30 % 91 % 97 %
Wastewater (type B) 24 % 68 % 81 %
0102030405060708090
100
030115 030312 030512 031104 031216 040901 041116 041117 041117
Date
% R
educ
tion
Co-58Co-60Ag-110Sb-124Sb-125Tot Akt
Figure 5.4.2.1 Reduction of radioactivity in the concentrate treatment in the pilot plant at nine different
experiments on pure process water from the Hold Up Tank.
0102030405060708090
100
030121 030319 030505 040607 040616 040618 040715 041020
Date
%
Co-58Co-60Ag-110Sb-124Sb-125Tot Akt
Figure 5.4.2 Reduction of radioactivity over the concentrate treatment in the pilot plant at eight different
experiments made with water from the waste hold up tank.
The reduction of separate nuclides shows that the reduction of Ag-110 is in some cases lower than the rest of the nuclides in many of the tests.
Two filters with different cut off followed by ion exchange were tested and compared showed no significant difference in separation degree while using 0.2 µm or 1.0 µm filter.

BATMAN - Best Available Technique Minimising All Nuclide. IVL report B1673
45
The experiment where an active carbon filter was added as a polishing treatment step after the ion exchanger showed no significant further reduction of the radioactivity.
Comments
Ag-110 was not present in the water at the beginning of the experiments and is therefore not analysed in all laboratory tests.
The concentrate flow represents a very small share of the feed flow, most of the time 1/200 or 0.5 %. With a separation degree of 80 % of the radioactivity over the concentrate step, the total reduction over the treatment plant is considerably higher. The treated concentrate could also be recycled to the feed stream once again and further improve the separation.
5.5 Permeate Treatment
5.5.1 Ion exchange
The polishing step using ion exchange on the permeate shows that further minimising of radioactivity is possible to attain. Separation degrees for the membrane filtration unit and the following ion exchange step are shown in figure 5.3.2.3. The average separation over the ion exchanger is close to 90 %.
5.5.2 EDI
The EDI equipment was installed late in the project and few tests were made with this technique compared to the others. Therefore, the results are statistically accurate than for the other parts.
Initially the separation of radioactivity was 95-98 %, however in the last test the separation ranged between 60-80 %. The mass balances showed that only 40-75 % of the radioactivity in the incoming water was recovered in the outgoing streams. An increase of the surface dose rate on the EDI equipment was noted. A lower currency, 2.5 A, gave a lower separation degree than a currency of 4.4 and 5.5 A respectively. (8, 9, 10).
The nuclides Sb-124, Sb-125, Cs-137 and I-131 showed the lowest separation degrees. Separation of boron was low, around 1.5 %, while lithium was separated to 97-99 %.
Comments:
The ion exchange resin was from the beginning loaded with sodium ions and the outlet water in all tests showed increased concentrations of sodium. This might have affected the results of the tests. In a full-scale application a hydrogen-loaded resin may be preferable. A longer test period should be needed for a more complete evaluation of the technique.
5.6 Process control
The pilot plant control system had a proper function. The system for gathering of measuring data showed some weaknesses. The storage capacity of data in the T-box was limited, after only 2 days
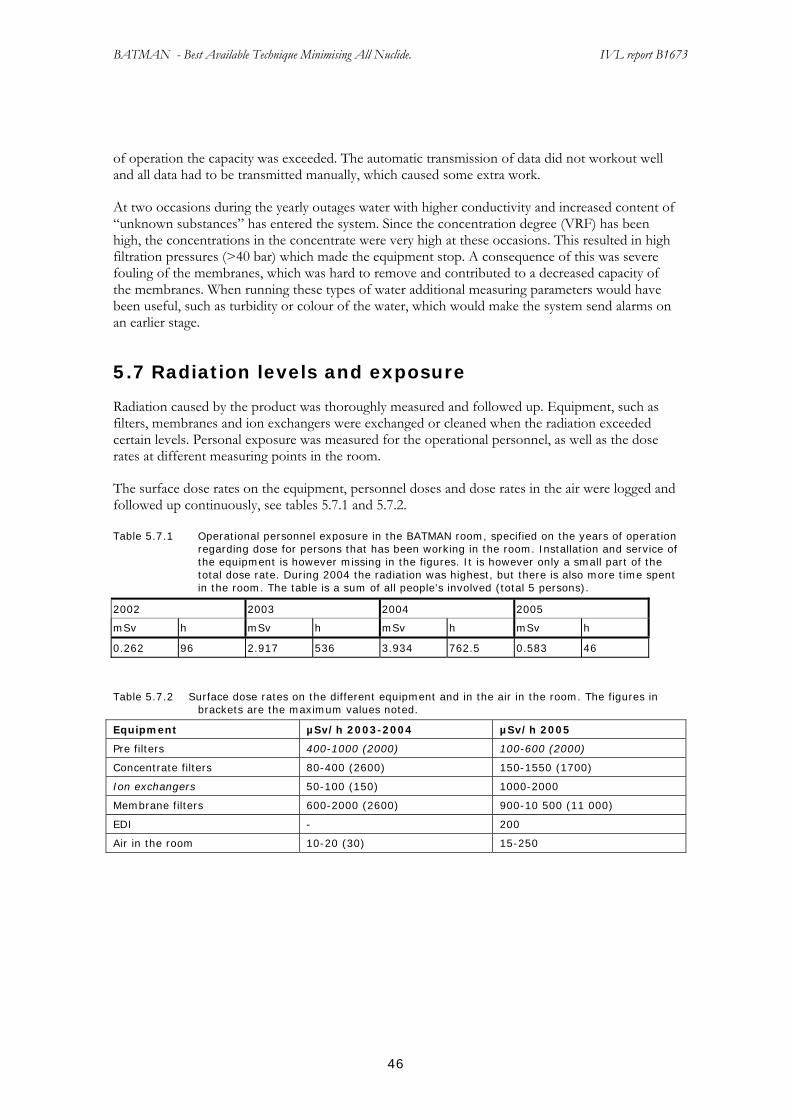
BATMAN - Best Available Technique Minimising All Nuclide. IVL report B1673
46
of operation the capacity was exceeded. The automatic transmission of data did not workout well and all data had to be transmitted manually, which caused some extra work.
At two occasions during the yearly outages water with higher conductivity and increased content of “unknown substances” has entered the system. Since the concentration degree (VRF) has been high, the concentrations in the concentrate were very high at these occasions. This resulted in high filtration pressures (>40 bar) which made the equipment stop. A consequence of this was severe fouling of the membranes, which was hard to remove and contributed to a decreased capacity of the membranes. When running these types of water additional measuring parameters would have been useful, such as turbidity or colour of the water, which would make the system send alarms on an earlier stage.
5.7 Radiation levels and exposure
Radiation caused by the product was thoroughly measured and followed up. Equipment, such as filters, membranes and ion exchangers were exchanged or cleaned when the radiation exceeded certain levels. Personal exposure was measured for the operational personnel, as well as the dose rates at different measuring points in the room.
The surface dose rates on the equipment, personnel doses and dose rates in the air were logged and followed up continuously, see tables 5.7.1 and 5.7.2.
Table 5.7.1 Operational personnel exposure in the BATMAN room, specified on the years of operation regarding dose for persons that has been working in the room. Installation and service of the equipment is however missing in the figures. It is however only a small part of the total dose rate. During 2004 the radiation was highest, but there is also more time spent in the room. The table is a sum of all people's involved (total 5 persons).
2002 2003 2004 2005
mSv h mSv h mSv h mSv h
0.262 96 2.917 536 3.934 762.5 0.583 46
Table 5.7.2 Surface dose rates on the different equipment and in the air in the room. The figures in brackets are the maximum values noted.
Equipment µSv/h 2003-2004 µSv/h 2005
Pre filters 400-1000 (2000) 100-600 (2000)
Concentrate filters 80-400 (2600) 150-1550 (1700)
Ion exchangers 50-100 (150) 1000-2000
Membrane filters 600-2000 (2600) 900-10 500 (11 000)
EDI - 200
Air in the room 10-20 (30) 15-250

BATMAN - Best Available Technique Minimising All Nuclide. IVL report B1673
47
6 Discussion and conclusions
The project has shown that it is possible to reduce the radioactivity in the outlet wastewater from Ringhals PAR with a factor 50-100 with the chosen system. Thereby the goal for the project was reached. For most nuclides it was possible to attain almost the same decontamination factor as with evaporation and the chosen technique has shown a high efficiency for treating PAR water containing high levels of boron. This indicates that the system would work out well or even better for BWR applications.
One important aim of the system was to find the proper membrane cut off with a sufficient separation of radioactivity while letting the boric acid pass through the membranes. This to avoid any risks of precipitation of boric acid that normally could appear at concentrations of 7-8000 ppm boron at room temperature and cause large problems in a membrane system. This was managed in the project, but since no wastewater situations are the same, this should be tested for each case. In BWR-applications, it is likely to believe that even denser RO-membranes could be used with a higher separation of the radioactivity.
In the tests, no significant difference in the separation degree of radioactivity was observed between the three different membrane types used, however, the less dense membrane showed higher fluxes.
The chemical content and concentrations in the incoming water to a high degree varies over the fuel cycle. This might be an important factor to take into consideration when designing a full-scale treatment plant. As example, a flexible system with possibility to change between filters with different cut off might be recommended.
In the project two different types of water have been used in the tests, type A (process water) and type B, which is wastewater of more unspecific origin. The latter type of water has sometimes caused trouble on the equipment, such as fouling and scaling of membranes and filters. If the two types of waters are to be treated in the same system, the type B water might need additional pre- treatment such as ultra-filtration and/or some additional filters to trap organics and oil traces before entering a following NF- or RO-system.
Pre-treatment using cartridge filters in general show tendencies for clogging. There are a huge number of filters of different types, materials and cut off grade on the market and some of them have been tested in the project. In general, the benefits using expensive and dense filters are shown to be small, as the source of activity in many cases appear to be colloid or as very small size particles. On the other hand, filters with capacity to remove organics such as traces of oil and grease may be beneficial to reduce fouling and improve the separation of high dense filters.
The gas separating system using gas transfer membranes showed very good results even though the membranes in the test turned out to have some small area to give high separation at high flow rates. The membranes were in operation during all the tests without any cleaning. In a stationary plant, a cleaning system might be considered since the membrane surfaces might be exposed for biological growth like any NF/RO-system and depending on the pre-treatment.
There has been a continuous build up of radioactivity within the systems, sometimes causing high dose-rates in the room and thereby causing a need for cleaning, mainly for the NF/RO-unit. Lesson learned from the pilot rig is to keep the volumes of cleaning solutions as small as possible and to have a good system for drainage. Ringhals like most nuclear facilities, cleaning agents with surfactants and other complexing need to be decomposed before the final storage together with

BATMAN - Best Available Technique Minimising All Nuclide. IVL report B1673
48
activity, therefore cleaning methods might to be further developed to fit the nuclear demands. The frequency of the membrane cleaning is highly dependent on the type of water treated. The build up of activity on the membrane surfaces deems to be related to the amount of chemical load of the feed water. When less chemically loaded water such as reactor coolant (type A) is treated the need of cleaning is less and might be totally excluded. The membranes might then be replaced only due to the dose rate level depending on the lifetime exceeded.
Although the membrane filtration process showed a good separation of radioactivity further treatment by ion exchange or EDI is advisable as a polishing step before discharged to the sea. Ion exchange using standard resins seems to give sufficient results but will give rise to higher waste volumes then using EDI. During the last part of the test period, EDI was evaluated as an alternative to the ion exchanger when treating the OF/RO-permeate. EDI with a continuously regeneration principle might have some advantages compared to conventional ion exchange when better separating weak ions with a low affinity, such as Cs-137 and Cs-134. This may be important when fuel leakage occur.
The treatment of concentrate from the OF/RO-unit using ion exchange and/or cartridge filtration in both directions shows good results. Treatment with conventional ion resins seems to separate a larger part of the radioactivity while the filters contributes to reduce the rest. This is some contradictory when not separated using similar filters and resins before entering the OF/RO-unit. A theoretic explanation is that high concentrations (VRF=200) give rise to agglomeration into bigger particles and it is also known that solution with higher ionic activity are easier to clean by ion exchange then diluted solutions. In such systems, the treated concentrate might also be fully or partly recycled to the feed flow of the OF/RO-unit to attain even better separation without causing any problems when the stream is a very small share of the feed flow.
The concentrates from the EDI have been treated with ion exchange in a similar way with good results. However, the flow rate has been much higher with a VRF of < 10 and could be further optimised.
Over all, a good separation of cesium and iodine nuclides seems to be most difficult to achieve. However, there is a large potential for reaching much higher separation degrees, mainly on the concentrates, since the range of selective ion exchange resins and absorbers is very large and constantly developing.
7 References
7.1 Basics & Preparatory work
1. Bark U, Fortkamp U: Litteratursammanställning Separationsteknik inom kärnkraftsapplikationer. (in Swedish)
2. BATMAN internal report no. 1 2002. IVL report A22024 3. EPRI International Low-Level Waste Conference and Exhibit Show June 25-27 2001 4. Workshop report on “low level waste and liquid separation technology in nuclear applications”
Ringhals NPP, Sweden, 12-14 June, 2001 5. Johansson L, Pichler U: Gas Transfer Membranes – Degassing of hydrogen and noble gas
from the reactor coolant system. Thesis, Ringhals Högskolan Borås 2001

BATMAN - Best Available Technique Minimising All Nuclide. IVL report B1673
49
6. Calås P: Avskiljning av radioaktiva ämnen med hjälp av CDI Thesis Ringhals Högskolan Borås 2002. (in Swedish)
7. Ståhlberg S: Testa upptagningsförmåga av radioaktivitet på jonbytare, Zeoliter och absorbers. Thesis, Ringhals Högskolan Borås 2003. (in Swedish)
8. Pernilla Svanberg: Massbalans och avskiljning på EDI-1. BATMAN internal report no. 12, Ringhals. (in Swedish)
9. Pernilla Svanberg: Massbalans och avskiljning vid olika strömstyrkor/Flöden på EDI-1. BATMAN internal report no. 13, Ringhals. (in Swedish)
10. Pernilla Svanberg: Massbalans och avskiljning vid olika strömstyrkor på EDI-1. BATMAN internal report no. 14, Ringhals. (in Swedish)
7.2 Reports within the BATMAN-project
1. Litteratursammanställning Separationsteknik inom kärnkraftsapplikationer. Ulrika Bark, Uwe Fortkamp, IVL. (in Swedish)
2. Choices of membrane for separation of radioactivity within project BATMAN, Ringhals 2. Ulrika Bark, Rune Bergström, IVL
3. Filtreringstest med 19 olika jonbytarmassor. Pernilla Calås, Ringhals. (in Swedish) 4. Filtreringstest med åtta olika Suprex- och Purolite-jonbytare. Pernilla Larsson, Ringhals. (in
Swedish) 5. Test av aktivt kolfilter, CunoZ. Pernilla Larsson, Ringhals. (in Swedish) 6. Filtreringstest av CUNO ZETA Plus, textila jonbytesfilter. Pernilla Larsson, Ringhals. (in
Swedish) 7. Avskiljning av radioaktiva ämnen med hjälp av CDI. Pernilla Calås, Thesis Ringhals. (in
Swedish) 8. V-Sep L-Test report Draft. Nordcap 9. R2-BATMAN, System- och funktionsbeskrivning. Bernt Bentsen, Ringhals. (in Swedish) 10. Testa upptagningsförmåga av radioaktivitet på jonbytare, Zeoliter och absorbers.
Sune Ståhlberg, Thesis, Ringhals. (in Swedish) 11. A lab scale test on treatment of radioactive waste water with different resins and filters.
Ulrika Bark, IVL 12. Massbalans och avskiljning på EDI-1. Pernilla Svanberg, Ringhals. (in Swedish) 13. Massbalans och avskiljning vid olika strömstyrkor/Flöden på EDI-1. Pernilla Svanberg,
Ringhals. (in Swedish) 14. Massbalans och avskiljning vid olika strömstyrkor på EDI-1. Pernilla Svanberg, Ringhals. (in
Swedish)
7.3 Other literature - “Crossflow microfiltration at AEA Technology” Nuclear engineering int. Aug. 1989 - “Improved PAR waste liquid processing using zeolite and organic ion-exchange materials”
Report summary, EPRI - Balint T, Panyor L Drozda T “The use of RO membranes in the separation of inactive and
radioactive components of liquid wastes originating from nuclear power plants” Hungarian oil and gas research institute veszprem, Hungary Synthetic Polymeric membranes 1987
- Bogovac D, Orrbeck T “Metod för upptagning av radioaktiv isotop med hjälp av zeoliter” Vattenfall AB Ringhals 4. 1998-05-26

BATMAN - Best Available Technique Minimising All Nuclide. IVL report B1673
50
- Bruggeman A, Jones C, Roofthooft R Severo A “Nuclear science and technology – Advanced processes for the treatment of low level liquid wastes at a pilot plant scale” Report, European Commission EUR 17446
- Bushart S, Hornibrook C “Improved cobalt removal” EPRI Licenced Material - Del Debbio, J.A., Donovan, R.I. ”Treatment of low level liquid radioactive wastes by
electrodialysis”. Westinghouse Idaho Nuclear Company 1986 - Freeman J. ”Wolf Creek´s liquid waste processing system improvements “zero” –
”concentrates drum drying” EPRI Licenced Material - Gutman R.G, Knibbs R.H “Review of nuclear and non-nuclear applications of membrane
processes – present problems and future r & d works” - Gutman RG, AERE Harwell “Membrane processes”. - Gutman, R.G. Harwell, A. ”Membrane processes” - Hobbs A.O, Ralegih P.E. et al. ”Review of operating LWR experience with membrane
technology” Waste management 1983 (conference) - Holt N.S. Hebditch D. .J “Oil removal from nuclear power station effluents by crossflow
membrane separation techniques” AEA - Hooper E W Kavanagh P “The novel absorber evaluation club – a review of recent studies”–
AEA Technology - Huang S D, Ho H, Li Y M, Lin C S. ”Adsorbing colloid flotation of heavy metal ions from
aqueous solutions at large ionic strength” Environ. Sci. Technol. (1995) 29 (9)1802-1807 - Huang S D, Su P G, Huang S P, Ho Y L, Tsai T Y “Adsorbing colloid flotation with
polyaluminium chloride: A powerful technique for removing heavy metals from wastewater” Sep. Sci. Technol. (2000) 35 (8) 1223-1232
- Huet Y, Menjeaud C, Poulat B “Application of reverse osmosis to the treatment of liquid effluents produced by nuclear power plants” Framatome
- Johansson L, Pichler U “Kontaktmembran – Vätgas- och ädelgasavskiljning från reaktorkylvatten” Thesis vid Högskolan i Borås, K 31/ 2001
- Kavanagh P, Goldsmith A, and Hebditch D.J. “Decontamination of nuclear power plant wast streams using seeded cross-flow filtration” AEA technology plc, UK Magnox electric plc, UK
- Kerkovius B Salih S “Koboltavskiljning från reaktorvatten med koboltselektiv jonbytarmassa” Vattenfall Ringhals rapport 1996-04-19
- Le V. T, Buckley L.P, McConeghy G. J. “Selective removal of dissolved radioactivity from aqueous wastes by a chemical treatment/ultrafiltration technique” Atomic Energy of Canada Ltd.
- Malin Willhelmsson “Ex-jobb 10p. Studier i olika zeoliters jonbyteskapacitet med avseende på nukliderna; Co-60, Ag-110m och Sb-124” Uppsala Universitet, avd. för kemiteknik.
- Netto J.F. Hardesty R. “Equipment – a comparison between capital purchase of treatment systems and outsourcing” Ultrapure Water Dec 1997
- Schuelke D, Kniazewycz G Markind J et al. “KLM´s boric acid reclamation system (BARS) – An update” Symposium on Waste Management at Tucson Arizona March 1-5 1987
- Supriya K, Sen Gupta Ph D, Saty Rimpelainen “Membranes – Liquid radwaste processing with spiral-wound reverse osmosis” Ultrapure Water Jan 1997
- Supriya K, Sen Gupta Ph D. “Membranes – Evaluation of spiral wound reverse osmosis for four radioactive waste processing applications” Ultrapure Water May/June 1997

BATMAN - Best Available Technique Minimising All Nuclide. IVL report B1673
51
- Supriya K, Sen Gupta, Slade J.A. “Waste treatment – Membrane treatment of radioactive waste liquids” Ultrapure water Nov 1993
- Supriya K. Sen Gupta Ph D. “Membranes – radwaste processing with microfiltration and reverse osmosis” Industrial water treatment July/Aug 1996
- Tusa E H, Paavola A, “Operating Experiences of Cesium Removal at Loviisa NPP, Finland” Presentationsmaterial från WANO konferens vid Ringhals 2001-06-12-14
- Waters A.”Protection against heavy metals – Guardsman ADF (adsorbing colloid flotation) Filtr. Sep. (1992) 29(6) 477
- Wilson JH, Anderson HM, Lewis CA. “Effective liquid waste processing utilizing membrane technologies” EPRI Licenced Material

Appendix 1
Cartridgefilter 30" BATMAN Name Number Code Cut-off Type (A/N) Sep. dP/10" Surface Dirt Cap. Tmax Pmax-45C Pmax-25C Appr. price In use Position Discarded Activity Reason Volume CommentsNo Manufacturer µm Abs/Nom. % 15 L/min m2/10" gram/10" bar bar SEK Date F4?? Date Act/dP m3
PF 3001 PTI Technologies (Danmill) Clariflow-B? 25-10730-002-2 0.2 A 99.9? 80? 0.63 120 2002-10-15 F103:1 2003-03-20PF 3002 SepTec Filter Posiflow/Soloflow-PE MP0133BC02 1,00 A 99.95-99.8 0.5 95 ? 625 2002-10-16 F102:1+F101:2 2003-05:28PF 3003 SepTec Filter Posiflow/Soloflow-PE MP0133BC02 1,00 A 99.95-99.8 0.5 625 2003-03-20 F103:2 2003-09-24PF 3004 SepTec Filter Posiflow/Soloflow-PE MP0133BC02 1,00 A 99.95-99.8 0.5 625 2003-05-28 F101:4 2004-04-29PF 3005 Domnick Hunter Prepor PES 539993571 ZCPS3-045C-BS5 0.45 A 30 0.69 70 5 2003-02-05 F102:2 2003-03-20PF 3006 Domnick Hunter Prepor PES 539993571 ZCPS3-045C-BS5 0.45 A 30 0.69 2004-04-29 F103:4PF 3007 PTI Technologies (Danmill) Spunflow QN 19040526 QN30P037S 3,00 N 90 65 2003-05-28 F100:2 2004-04-29PF 3008 PTI Technologies (Danmill) Spunflow QA 0.5 A 99.98 600 0.05 65 2002-10-15 F100:1 2002-04:22PF 3009 PTI Technologies (Danmill) Spunflow QA 0.5 A 99.98 600 0.05 65PF 3010 PTI Technologies (Danmill) Spunflow QN 19040526 QN30P037S 3,00 N 90 65 4 2002-10-15 F101:1 2003-02-05PF 3011 PTI Technologies (Danmill) Spunflow QN 19040526 QN30P037S 3,00 N 90 65 4 2004-04-29 F101:5 2004-06-07 aktPF 3012 PTI Technologies (Danmill) Pleatflow 19310103 G300105277S 1,00 99.9? 50? 0.5 65 4 2003-03-20 F102:3 2003-04-22PF 3013 PTI Technologies (Danmill) Pleatflow 19310103 G300105277S 1,00 A 0.5 65 4 2003-04-22 F102:4 2003-09-09PF 3016 PTI Technologies (Danmill) Spunflow-QN 19041239 QN30P017S 1? N 90 2004-06-07 F101:6PF 3017 PTI Technologies (Danmill) Spunflow-QN 19041239 QN30P017S 1,00 N 90PF 3018 SepTec Filter Posiflow/Soloflow-PE MP0133BC02 1,00 A 99.95-99.8 0.5 625 2003-09-09 F102:5 2004-04-29PF 3019 SepTec Filter Posiflow/Soloflow-PE MP0133BC02 1,00 A 99.95-99.8 0.5 625 2003-09-24 F103:3 2004-04-29PF 3020 SepTec Filter Posiflow/Soloflow-PE MP0133BC02 1,00 A 99.95-99.8 0.5 625 2004-04-29 F102:6PF 3021 SepTec Filter Posiflow/Soloflow-PE MP0133BC02 1,00 A 99.95-99.8 0.5 625PF 3022 SepTec Filter Posiflow/Soloflow-PE MP0133BC02 1,00 A 99.95-99.8 0.5 625PF 3023 PTI Technologies (Danmill) Spunflow QN 19041248 QN30PA57S 0.5 N 90 600 0.5 65PF 3024 PTI Technologies (Danmill) Spunflow QN 19041248 QN30PA57S 0.5 N 90 600 0.5 65PF 3025 PTI Technologies (Danmill) Polyflow 19222085 22-60730-012-2 1.2 A 99.9 120PF 3026 CUNO Norden AB MicroClean III G30Y8 1,00 N 80 350PF 3027 CUNO Norden AB MicroClean III G30B8 5,00 N 130 325 2004-04-29 F100:3PF 3028 PTI Technologies (Danmill) Polyflow 22-60730-012-2 1.2 A 99.9 80? 95
In useIn storageUsedOrdered but not deliveredDiscarded/broken
1

Appendix 2

Appendix 3
Cartridgefilter 10" BATMAN Cut-off Type Separation dP/10" Surface Dirt Cap. Tmax Pmax-45C Pmax-25C Appr. Price In use Position Discarded Reason Activity Volume CommentsNo Manufacturer Name Number Code µm Abs./Nom. % 5 L/min m2/10" gram/10" C bar bar SEK Date F4?? Date (dP/Akt) M3
PF 1001 PTI Technologies (Danmill) Clariflow Select 19251060 25-10710-W22-2-E 0.02 A 99.98 1 2460-3525 2002-10-15 F403:1 2003-05-28PF 1002 PTI Technologies (Danmill) Clariflow-WG 19251050 25-10710-001-2-WG 0.10 A 0.4 774-1100 2002-10-15 F402:1 2003-03-15PF 1003 PTI Technologies (Danmill) Clearflow-SP 19261010 SP-10710-002-G 0.20 A 150? 0.5 80 1109-1585 2002-10-15 F401:1 2003-03-20PF 1004 PTI Technologies (Danmill) Clearflow-SG 19261015 SG-10710-002-2-G 0.20 A 75? 0.5 80 1109-1586 2003-03-15 F402:2PF 1005 PTI Technologies (Danmill) Glastech II 19281920 28-19710-002-2 0.25 N 80-99 8 0.5 80 4.8 5.5 460-660 dPPF 1006 PTI Technologies (Danmill) Protector 19301074 30-60710-006-2 0.60 A 99.9 18 0.3 489-700 2002-10-15 F400:1 2003-03-20PF 1007 PTI Technologies (Danmill) Polyflow 19222087 22-10710-025-2 2.50 A 99.9 150 80 433-619 2003-03-20 F400:2 2003-09-09
PF 1008 PTI Technologies (Danmill) Carboflow MX 19500050 C09M17S 2.00 N 75 7 367-525Akt.kol Extruderat-flöde 250g/min ?
PF 1009 PTI Technologies (Danmill) Carboflow 19500060 C09FN7S 5.00 N 75 189-270 Akt.kol Natural FinPF 1010 SepTek Filter Posiflow/Soloflow-PE Tyvek MP0131BC02 1.00 A 99.95-99.8 0.5 95 ? 2003-05-28 F403:2 2003-09-24PF 1011 SepTek Filter Posiflow/Soloflow-PE Tyvek MP0131BC02 1.00 A 99.95-99.8 0.5 95 ? 2003-03-20 F401:2 2003-10-22PF 1012 SepTek Filter Posiflow/Soloflow-PE Tyvek MP0131BC02 1.00 A 99.95-99.8 0.5 95 ?PF 1013 SepTek Filter Posiflow/Soloflow-PE Tyvek MP0131BC02 1.00 A 99.95-99.8 0.5 95 ?PF 1014 PTI Technologies (Danmill) Polyflow 19222085 22-60730-012-2 1.20 A 99.9 80? 95 433-619PF 1015 PTI Technologies (Danmill) Polyflow 19222087 22-10710-025-2 2.50 A 99.9 80? 95 2003-09-09 F400:3 2003-10-22PF 1016 PTI Technologies (Danmill) Protector 19301074 30-60710-006-2 0.60 N?PF 1017 PTI Technologies (Danmill) Clearflow-SG 19261010 SP-10710-002-2-G 0.20 A 75? 0.5 80 80 2004-04-29 F401:5PF 1018 CUNO Norden AB MicroClean III 1619981 G10Y8 BD 1.0 N 45 200 2004-04-29 F400:6 Acryl/PhenolPF 1019 CUNO Norden AB MicroClean III 1619982 G10B8 BD 5.0 N 30 185 Acryl/PhenolPF 1020 CUNO Norden AB MicroClean III 1019991 G10Y2 BD 1.0 N 40 230 2003-11-03 F400:5 2004-04-29 Cellulosa/Glas/MelaminPF 1021 CUNO Norden AB MicroClean III 1019992 G10B2 BD 5.0 N 15 215 Cellulosa/MelaminPF 1022 CUNO Norden AB PolyNet 1019995 NT 10 T050 SOBD 5.0 A 99.9 30 82 2.5 3.5 355 2003-10-22 F400:4 2003-11-03PF 1023 CUNO Norden AB PolyNet 1019994 NT 10 T010 SOBD 1.00 A 99.9 225 82 2.5 3.5 400PF 1024 CUNO Norden AB BetaFine XL 10 PP 002 BOD 0.20 A 99.9 100 80 2.6 997 2003-11-03 F401:4 2004-04-29PF 1025 CUNO Norden AB BetaFine XL 10 PP 010 BOD 1.00 A 99.9 20 80 2.6 906PF 1026 CUNO Norden AB BetaFine XL 10 PP 050 BOD 5.00 A 99.9 10 80 2.6 715PF 1027 PTI Technologies (Danmill) Clearflow-SG 19261015 SG-10710-002-2-G 0.20 A 75? 0.5 80 1109-1586 2003-10-22 F401:3 2003-11-03
In useIn storageUsedOrdered but not deliveredDiscarded/broken

Appendix 4
Date Start operational Permeate Samplestime Date time time (h) Type Pretreatment Filt. GTM Feed VRF 1 2 3
2002-12-12 09:20 2002-12-12 12:02 02:42 HUT-3 ? 1234 12 2500 F 30 IX ? ? ?2002-12-13 2002-12-13 ca 02:00 HUT-3 ? 2500 K 100 IX ? ? ? 11:452002-12-16 2002-12-16 HUT-3 2500 IX ? ? ?2002-12-18 13:34 2002-12-18 15:30 01:56 HUT-3 ? ? ? 2500 IX ? ? ?2002-12-19 10:56 2002-12-19 12:00 01:04 HUT-1 ? ? ? 2500 IX ? ? ?2002-12-19 12:24 2002-12-19 13:24 01:00 733 ? ? ? 2500 K 200 IX ? ? ?2003-01-09 11:50 2003-01-09 15:00 03:10 HUT-3 ? ? 12 2500 K 200 IX ? ? ?2003-01-10 08:30 2003-01-10 14:45 06:15 HUT-3 ? 1234 12 2500 K 200 IX2003-01-13 10:05 2003-01-13 12:00 01:55 HUT-3 1234 12 2500 K 200 IX2003-01-14 08:25 2003-01-14 15:00 06:35 HUT-3 1234 12 2500 K 200 IX 12:202003-01-15 08:18 2003-01-15 15:14 06:56 HUT-3 1234 12 2500 K 200 IX IX 1234 12:30
2003-01-20 09:08 2003-01-20 15:10 06:02 HUT-1 1234 12 2500 K 200 IX IX 123420L concentrate to Sune
2003-01-21 09:10 2003-01-21 11:30 02:20 WHT via MT1 IX 1234 12 2000 K 200 IX IX 12342003-01-21 13:00 2003-01-21 15:05 02:05 WHT via MT1 IX 134 12 2500 K 200 IX IX 1234 14:402003-02-14 08:30 2003-02-14 13:58 05:28 HUT-2 12 2500 K 200 IX IX 12342003-02-17 08:04 2003-02-17 15:06 07:02 HUT-2 12 2500 K 200 IX IX 12342003-02-18 08:34 2003-02-18 12:42 04:08 HUT-2 12 2500 K200 IX2003-02-19 11:30 2003-02-19 15:10 03:40 HUT-3 12 2500 K200 IX 13:202003-02-20 07:50 2003-02-20 15:15 07:25 HUT-2 12 2500 K200 IX2003-02-21 08:50 2003-02-21 14:00 05:10 12 2500 K200 IX
2003-03-05 Citric acid 12Membrane cleaning 13:10
2003-03-10 14:48 2003-03-10 15:54 01:06 733 12 2600 K200 IX 733 test2003-03-11 09:46 2003-03-11 21:04 11:18 HUT-3 12 2450 K200 IX 15:452003-03-11 22:26 2003-03-12 13:00 14:34 HUT-3 12 2500 K200 IX 12:452003-03-12 14:18 2003-03-14 10:42 44:24 HUT-3 12 2250 K200 IX2003-03-14 11:32 2003-03-14 12:32 01:00 HUT-1 12 2250 K200 IX2003-03-17 10:30 2003-03-18 08:20 21:50 HUT-3 12 2500? K200 IX 13:302003-03-19 10:05 2003-03-19 18:10 08:05 MT-1 12 2400 K200 IX 17:152003-03-19 18:44 2003-03-20 05:25 10:41 WHT 12 2500 K200 IX2003-03-20 07:35 2003-03-20 15:15 07:40 HUT-1 12 2500? K200 IX2003-03-20 15:50 2003-03-20 16:26 00:36 HUT-1 12 2500 K200 IX2003-03-20 16:44 2003-03-21 05:30 12:46 12 2500 K200 IX2003-03-21 14:00 2003-03-22 14:25 24:25 HUT-1 12 2500 K200 IX2003-03-22 14:25 2003-03-22 16:10 01:45 733 12 2500 K200 IX2003-03-31 12 Exchange of IX2003-04-02 18:58 2003-04-04 12:20 41:22 HUT-3 none 12 2000 K200 IX 030404 08:40
ConcentrateBATMAN Experimental data report
Stop Feed Pretreatment membrane filtr.
1

Appendix 4
Date Start operational Permeate Samplestime Date time time (h) Type Pretreatment Filt. GTM Feed VRF 1 2 3
ConcentrateBATMAN Experimental data report
Stop Feed Pretreatment membrane filtr.
2003-04-06 08:12 2003-04-09 03:10 66:58 HUT-1 12 2000 K200 IX2003-04-10 08:14 2003-04-11 21:00 36:46 HUT-1 12 2350 K200 IX 11:002003-04-14 11:00 2003-04-15 00:02 13:02 MT-1 12 2000 K200 IX2003-04-15 13:00 2003-04-15 16:18 03:18 12 2000 K200 IX2003-04-16 02:08 2003-04-16 03:12 01:04 12 2000 K200 IX2003-04-16 13:52 2003-04-17 06:08 16:16 HUT-3 14 12 2000 K200 IX IX 1234 3522003-04-29 12:50 2003-05-01 13:40 48:40 HUT-1 1234 12 2000 K200 IX IX 1234 3522003-05-05 14:00 2003-05-05 15:00 01:00 WHT 1234 12 2000 K200 IX IX 1234 3522003-05-06 09:16 2003-05-06 21:00 11:44 MT-1 1234 12 2500 K200 IX IX 1234 352 13:102003-05-07 08:42 2003-05-08 16:26 31:44 HUT-1 1234 12 2400 K200 IX IX 124 3522003-05-08 16:42 2003-05-12 08:40 87:58 HUT-1 1234 12 2400 K200 IX IX 124 352 08:202003-05-12 10:38 2003-05-13 01:16 14:38 HUT-1 1234 12 2400? K200 IX IX 124 3522003-05-15 01:00 2003-05-15 09:58 08:58 HUT-1 F 1234 12 2000 K200 IX IX 124 3522003-05-20 12:48 2003-05-21 05:08 16:20 MT-1 IX+F 134 12 1400 K200 IX T2012003-05-22 10:04 2003-05-24 21:40 59:36 HUT-1 F 134 12 1800 K200 IX IX 1234 feed2003-05-28 17:05 2003-05-29 02:20 09:15 MT-1 IX+F 1234 12 2000 K200 IX IX 1234 feed Exchange of IX 28/52003-05-29 04:52 2003-05-29 07:44 02:52 MT-1 IX+F 1234 12 2000 K200 IX IX 1234 feed2003-05-29 09:44 2003-05-29 11:00 01:16 MT-1 IX+F 1234 12 1500 K200 IX IX 1234 feed
2003-06-03 2003-06-04 Citric acidmembrane cleaning 09:30
2003-06-05 14:20 2003-06-05 15:20 25:00 MT-1 IX+F 1234 12 2000 K200 IX IX 1234 3522003-06-16 10:18 2003-06-16 19:04 08:46 MT-1 IX+F 124 12 18-2000 K200 IX IX 234 3522003-06-17 08:40 2003-06-18 08:56 24:16 MT-1 IX+F 124 12 1200 K200 IX IX 234 3522003-06-24 10:25 2003-06-24 20:56 10:31 MT-1 IX+F 124 12 K200 IX IX 234 feed 14:002003-06-27 01:00 Rinse 7332003-08-13 ############ Boron test. 100liter. 1500ppm 11:002003-09-01 ############ Rinse 733 3times2002-09-02 ############ Exchange of o-ring2003-09-03 ############ Cleaning with Ariel Color + NaOH to pH9.5 rinsed minimum 5 times2003-09-16 ? 2003-09-16 23:15 #VALUE! MT1 IX+F 123 12 IX IX 123
2003-09-23 ? 2003-09-25 02:10 #VALUE! MT1 IX+F 1-2-3-4 12 1500 K200 IX IX 124 Sample 03-09-24 15:002003-10-05 12:16 2003-10-06 18:48 30:32 MT1 IX-F 1-2-3-4 12 1500 30L/H IX T201
2003-10-07 15:12 2003-10-08 08:16 17:04 HUT1 None 12 1500 K200 IX T304
Increased Circ.flow fr 4000 - 4500l/h. Sample 08:00
2003-10-08 08:18 2003-10-08 14:08 05:50 HUT1 None 12 1700 K200 IX T304 Sample 13:502003-10-08 14:08 2003-10-08 15:12 01:04 HUT1 None 12 2100 K200 IX T304 Sample 15:05
2

Appendix 4
Date Start operational Permeate Samplestime Date time time (h) Type Pretreatment Filt. GTM Feed VRF 1 2 3
ConcentrateBATMAN Experimental data report
Stop Feed Pretreatment membrane filtr.
2003-10-08 ############ Concentrate treatment Sample 16:252003-11-03 15:40 ############ Concentrate treatment Sample 16:252003-11-04 ############ Concentrate treatment
2003-11-05 09:04 2003-11-05 12:35 03:31 HT 1-2-3-4 12 IX
Fast increase of pressure to 25 bar. thereafter to 30bar. stopped the plant.
2003-11-19 08:52 2003-11-22 14:44 77:52 HT2 None 1-2-3-4 12 2000 IX IX 12Some concentrate to T304
2003-11-22 17:44 2003-11-23 17:30 23:46 MT1 1-2-3-4 12 2000 IX IX 122003-11-28 13:05 2003-11-29 16:00 26:55 HT1 None 1-2-3-4 12 2000 K200 IX T304
2003-11-29 18:03 2003-11-29 22:55 04:52 HT1 None 1-2-3-4 12 2000 K200 IX T304 Trip since T304 was full2003-12-04 09:05 2003-12-05 18:42 24:55 HT1 F 1-2-3-4 12 1900 K200 IX IX 12 3522003-12-05 20:11 2003-12-05 ? 4? HT1 F 1-2-3-4 12 1900 K200 IX IX 12 3522003-12-06 11:05 2003-12-07 02:05 15:00 MT1 IX+F 1-2-3-4 12 1900 K200 IX IX 122003-12-15 Exchange of IX2004-02-10 13:48 2004-02-10 15:28 01:40 HT2 F 1-2-3-4 12 1900 K200 IX+T304+T201 can Test 1 sample 13:202004-02-21 10:08 2004-02-22 14:20 28:12 MT1 (from WHTIX+F 1-2-3-4 12 1500 K200 IX T2012004-03-02 21:44 2004-03-04 03:24 30:40 IX+F 1-2-3-4 12 2000 K200 IX T2012004-03-16 09:56 2004-03-18 04:56 67:00 HT2 IX+F 1-2-3-4 12 2000 K200 IX T201/3042004-03-26 10:10 2004-03-26 22:45 12:35 MT1 IX+F 1-2-3-4 12 2000 K200 IX T201/3042004-03-29 13:30 2004-03-31 05:10 39:40 HT2 F 1-2-3-4 12 2000 K200 IX T201/3042004-03-31 05:10 2004-03-31 16:05 10:55 HT3 F 1-2-3-4 12 2000 K200 IX T201/3042004-04-05 14:00 2004-04-05 14:12 00:12 733 12 2000 K100 IX T201/304 after 5 rinses with 733
2004-04-06 11:08 2004-04-06 11:16 00:08 733 12 2000 K100 IX T201/304After membrane exchange in B
2004-04-06 13:16 2004-04-06 13:32 00:16 733 12 2000 K100 IX T201/304After exchange of washers
2004-04-07 08:36 2004-04-07 10:24 01:48 HT1 F 1-2-3-4 12 2000 K200 IX T201/304
Immediately after membrane exchange in B
2004-04-21 2004-04-22 MT1 IX+F 1-2-3-4 12 2000 K200 IX T2012004-04-22 02:48 2004-04-22 08:36 05:48 MT1 IX+F 1-2-3-4 12 2000 K200 IX T2012004-04-22 2004-04-23 HT1 ? 1-2-3-4 12 2000 K200 IX T201/304 sample 08:302004-04-23 13:44 2004-04-25 05:24 39:40 HT1 ? 1-2-3-4 12 2000 K200 IX T201/3042004-04-28 733 122004-04-29 733 12
3

Appendix 4
Date Start operational Permeate Samplestime Date time time (h) Type Pretreatment Filt. GTM Feed VRF 1 2 3
ConcentrateBATMAN Experimental data report
Stop Feed Pretreatment membrane filtr.
2004-04-29 13:20 2004-04-30 05:35 16:15 HT1 F 1234 12 2000 K200 IX T201/304After citric acid cleaning
2004-04-30 07:40 2004-05-01 02:05 18:25 HT1 F 1234 12 2000 K200 IX T201/3042004-05-02 01:14 2004-05-02 04:15 03:01 MT1 IX+F 1234 12 ? K200 IX T201/3042004-05-02 13:30 2004-05-03 12:30 23:00 HT1 F 1234 12 1500 K200 IX T201/3042004-05-04 20:35 2004-05-05 22:00 25:25 HT1 F 1234 12 1500-2000 K200 IX T201/3042004-05-06 17:35 2004-05-08 02:45 33:10 HT1 F 1234 12 1500 K200 IX T201/3042004-05-08 16:20 2004-05-11 16:30 72:10 HT1 F 1234 12 1500-2000 K200 IX T201/3042004-05-12 18:35 2004-05-13 00:00 05:25 HT12004-05-14 00:00 2004-05-16 01:00 49:00 HT12005-05-17 20:15 2004-05-18 07:25 ############2005-05-18 08:30 2004-05-18 09:45 ############ MT1 20002004-05-18 17:04 2004-05-18 21:07 04:03 MT12004-05-18 21:07 ############ HT1
2004-05-27 20:00 20:002004-06-01 08:25 2004-06-01 21:12 12:47 MT1 20002004-06-05 05:30 ############ MT1 20002004-06-05 17:25 2004-06-06 06:20 12:55 HT32004-06-06 14:05 2004-06-06 14:26 00:21 MT12004-06-06 20:40 2004-06-07 04:20 07:402004-06-08 09:05 2004-06-08 11:20 02:15 MT1 15002004-06-08 12:10 2004-06-08 13:30 01:20 MT1 16002004-06-08 14:05 2004-06-09 03:40 13:35 MT12004-06-10 00:35 2004-06-10 17:00 16:25 MT12004-06-10 18:30 2004-06-10 21:50 03:20 MT1
2004-06-11 11:50 11:502004-06-12 09:15 2004-06-12 13:05 03:50 MT1 1600-20002004-06-12 13:40 2004-06-13 21:52 08:122004-06-13 03:35 2004-06-13 09:15 05:402004-06-13 11:30 2004-06-14 02:52 15:222004-06-14 16:00 2004-06-14 17:00 01:00 MT12004-06-14 17:00 2004-06-14 17:25 00:25 MT12004-06-14 18:15 2004-06-14 19:00 00:45 MT12004-06-14 20:50 2004-06-14 21:40 00:50 MT12004-06-15 08:20 2004-06-15 13:36 05:16 MT12004-06-18 11:00 2004-06-18 11:16 00:16 733 After cleaning
2004-06-18 11:40 2004-06-18 11:52 00:12 733After cleaning. several rinses
4

Appendix 4
Date Start operational Permeate Samplestime Date time time (h) Type Pretreatment Filt. GTM Feed VRF 1 2 3
ConcentrateBATMAN Experimental data report
Stop Feed Pretreatment membrane filtr.
2004-06-19 17:10 2004-06-19 17:20 00:102004-06-19 17:30 ############ 12002004-06-19 19:00 2004-06-19 19:12 00:122004-06-20 21:36 2004-06-21 10:30 12:54 MT1
2004-06-22 08:30 2004-06-22 09:15 00:45After citric acid cleaning
2004-06-22 09:40 2004-06-22 10:10 00:302004-06-22 10:15 2004-06-22 12:13 01:58 11:002004-06-22 12:45 2004-06-23 05:20 16:35 1100-14002004-06-23 21:15 ############ MT1 11002004-06-24 03:50 ############ 11002004-06-24 16:35 2004-06-24 18:15 01:40 MT12004-06-24 18:30 ############2004-06-24 19:45 ############2004-06-24 20:50 ############2004-06-24 21:40 ############2004-06-25 08:40 2004-06-25 10:00 01:202004-06-25 10:50 ############2004-06-26 03:48 2004-06-26 05:08 01:20 ?2004-06-30 11:08 2004-06-30 11:12 00:04 733 After cleaning
2004-06-30 11:24 2006-06-30 11:36 00:12 733After cleaning. several rinses
2004-06-30 13:20 ############ HT-2 1500-1800After NaOH cleaning 14:15
2004-06-30 18:45 ############2004-06-30 21:05 ############2004-06-30 22:20 ############
2004-07-02 10:50 2004-07-04 09:30 46:40 MT-1 (HT-2) ? 1234 12 1100 K100 IX 12 IXByte massa IX700 SBM11
2004-07-05 01:28 2004-07-07 00:30 47:02 MT-1 (WHT) IX+F 1234 12 1000 K100 IX T2012004-07-07 05:05 2004-07-07 17:20 12:15 MT-1 (WHT) IX+F 1234 12 950 K100 IX 2 IX2004-07-08 11:10 2004-07-09 13:32 26:22 MT-1 (HT-1) IX+F 1234 12 1000 K100 IX 1 IX2004-07-10 21:40 2004-07-12 11:00 37:20 HT-1 F 1234 12 1050 K100 IX ?2004-07-13 12:48 2004-07-14 13:36 24:48 MT-1 IX+F 1234 12 1000 IX T3042004-07-15 13:20 2004-07-15 13:30 00:10 733 2000 K100 IX After cleaning2004-08-11 13:00 2004-08-11 16:25 03:25 HT-1 ? 1234 12 ? K200 IX ?2004-08-11 16:30 2004-08-11 20:24 03:54 HT-1 ? 1234 12 ? K200 IX ?2004-08-11 21:40 2004-08-11 22:21 00:41 HT-1 ? 1234 12 ? K200 IX ?
5

Appendix 4
Date Start operational Permeate Samplestime Date time time (h) Type Pretreatment Filt. GTM Feed VRF 1 2 3
ConcentrateBATMAN Experimental data report
Stop Feed Pretreatment membrane filtr.
2004-08-12 00:02 2004-08-12 02:52 02:50 HT-1 ? 1234 12 1200 K200 IX ?2004-08-12 09:20 2004-09-12 20:30 11:10 HT-1 ? 123 12 1400 K200 IX T304 14:00
2004-08-26 12:04 2004-08-26 12:30 00:26 733 2300 K200After cleaning and exchange of membrane
2004-08-26 14:25 2004-08-27 09:24 18:59 MT--2 (HT-1) F 123 12 2000 K200 IX T3042004-08-30 03:30 2004-08-30 21:36 18:06 ? 123 12 200 K200 IX ?2004-08-31 13:20 2004-08-31 15:45 02:25 HT-2 F 123 12 2000 K200 EDI-1 12 IX2004-09-01 08:35 2004-09-01 14:12 05:37 HT-2 F 123 12 2000 K200 EDI-1 12 IX2004-09-07 11:30 2004-09-07 23:40 12:10 MT-1 IX+F 123 12 1700 K200 IX 12 IX2004-09-08 00:50 2004-09-08 11:10 10:20 MT-1 IX+F 123 12 1700 K200 IX 12 IX2004-09-09 10:36 2004-09-09 14:04 03:28 MT-1 IX+F 123 12 1450 K200 IX 12 IX2004-09-16 13:10 2004-09-16 13:18 00:08 733 1700 K50 After cleaning2004-09-21 08:48 2004-09-21 13:52 05:04 HT-2 F 1234 12 2000 EDI-1 12 IX Yes2004-09-29 08:08 2004-09-29 13:16 05:08 HT-2 F 1234 12 2000 K200 EDI-1 12 IX 09:30. 11:00. 13:10
6
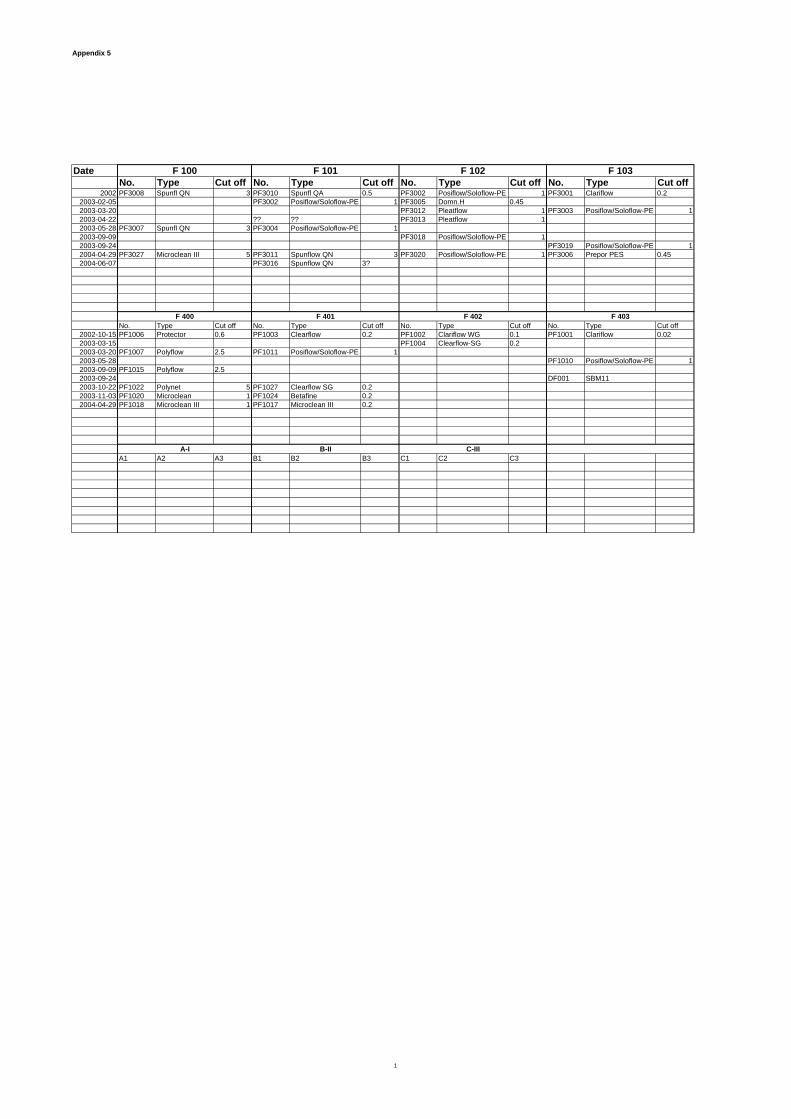
Appendix 5
DateNo. Type Cut off No. Type Cut off No. Type Cut off No. Type Cut off
2002 PF3008 Spunfl QN 3 PF3010 Spunfl QA 0.5 PF3002 Posiflow/Soloflow-PE 1 PF3001 Clariflow 0.22003-02-05 PF3002 Posiflow/Soloflow-PE 1 PF3005 Domn.H 0.452003-03-20 PF3012 Pleatflow 1 PF3003 Posiflow/Soloflow-PE 12003-04-22 ?? ?? PF3013 Pleatflow 12003-05-28 PF3007 Spunfl QN 3 PF3004 Posiflow/Soloflow-PE 12003-09-09 PF3018 Posiflow/Soloflow-PE 12003-09-24 PF3019 Posiflow/Soloflow-PE 12004-04-29 PF3027 Microclean III 5 PF3011 Spunflow QN 3 PF3020 Posiflow/Soloflow-PE 1 PF3006 Prepor PES 0.452004-06-07 PF3016 Spunflow QN 3?
No. Type Cut off No. Type Cut off No. Type Cut off No. Type Cut off2002-10-15 PF1006 Protector 0.6 PF1003 Clearflow 0.2 PF1002 Clariflow WG 0.1 PF1001 Clariflow 0.022003-03-15 PF1004 Clearflow-SG 0.22003-03-20 PF1007 Polyflow 2.5 PF1011 Posiflow/Soloflow-PE 12003-05-28 PF1010 Posiflow/Soloflow-PE 12003-09-09 PF1015 Polyflow 2.52003-09-24 DF001 SBM112003-10-22 PF1022 Polynet 5 PF1027 Clearflow SG 0.22003-11-03 PF1020 Microclean 1 PF1024 Betafine 0.22004-04-29 PF1018 Microclean III 1 PF1017 Microclean III 0.2
A1 A2 A3 B1 B2 B3 C1 C2 C3
F 103
F 400 F 401 F 402 F 403
F 100 F 101 F 102
A-I B-II C-III
1

Appendix 6 List over tested ion exchange resins Name Supplier Type Functional group Matrix Amberlite IRC 718
Rohm & Haas Chel. Iminidiacetic Macroporous styrene-DVB
Amberlite IRC 748
Rohm & Haas Chel. Iminodiacetic acid Macroporous styrene-DVB
Duolite GT 73
Rohm & Haas WAC Thiol- Macroporous styrene copolymer
Amberlite IRN97 H
Rohm & Haas SAC Sulphonic acid Gel Polystyrene DVB
Duolite C 467
Rohm & Haas Chel. aminophosphonic Macroporous styrene-DVB copolymer
Dow C-400 Dow (dowex) SAC Sulphonic acid Gel polystyrene-DVB Dow A-550 Dow (dowex) SBA Quaternary Amine Gel, Styrene-DVB MSC-1 (H) Dow (dowex) SAC Sulphonic acid Macroporous Styrene-DVB 575C NG (H)
Dow (dowex) SAC Sulphonic acid Gel styrene-DVB
A1-400 Dow (dowex) SBA Quaternary Amine Styrene-DVB, copolymer MSA-1 C Dow (dowex) SBA Quaternary Amine Macroporous Styrene-DVB DT-30 DTS Zeolite, metal aluminosilicate DT-47 DTS Inorganic Al, metal aluminosilicate DT-90 DTS Carbon based DT-30A DTS Zeolite Co-Treat Selion Sodium titanium Oxide Cs-Treat Selion Inorganic matrix, (Hexacyanoferrate) SBM11 Suprex MB (SAC
+SBA) Mix of SBH and SBROH
SBMR72 Suprex MB (SAC +SBA)
Mix of SBHC 75 and SBROH
SBMC11eq Suprex MB (SAC +SBA)
Mix of SBHC 350 and SBOHC 550
SBROH Suprex SBA Tertiary amine, type 1
Gel
A-501P Purolite SBA R-(CH3)3N+ Macroporous crosslinked polystyrene NRW 160 Purolite SAC Sulphonic acid Gel Polystyrene-DVB NRW 354 Purolite MB Sulphonic acid and
quaternary ammonium
Gel, Polystyrene-DVB Mix of NRW 160 and NRW305
S920 Purolite Chel. Thiouronium Macroporous, Polystyrene-DVB MEI HZO 74 MEI (MEL
Chemicals) Hydrous zirconium oxide
MEI SZP PP 204 F
MEI (MEL Chemicals)
Sodium zirconium phosphate
MEI SZP PP 141 J
MEI (MEL Chemicals)
Sodium zirconium phosphate
MEI HCP PP 142 F
MEI (MEL Chemicals)
Hydrous zirconium oxide
Octolig 21 Metre-General Chel. Silica gel (amorphous silicon oxide) Aldex RSB Aldex
Chemicals Company Ltd.
Metall X Solmetex Mixed metal oxide-hydroxide (inorganic matrix)
Clearit Bergsskolan Kompetens-utveckling AB
Inorganic matrix
Prolup SAC – Strongly acidic cation; WAC – Weakly acidic cation; SBA – Strong base anion; Chel – chelating

Appendix 7
HUT3HUT3 Feed 300 Perm 302A Perm 302B Perm 302C Perm f ix conc eed membraFeed 300 Perm 304 conc 303 sep. memb sep. tot
021210 13:30
021212 11:45
021212 11:45
021212 11:45
021212 11:45
021212 11:45
021212 11:45
021213 10:45
021213 10:45
021213 10:45
B 1211 1039 716 966 1198 1002 3581 1035 1010 3538 3.56Li 2.96E+03Co-58 2.50E+02 3.90E-01Co-60 9.48E+01Nb-95 4.46E-01Zr-97 1.05E+02 2.62E+02 100.00Ag-110m 5.19E+02 2.24E+02 9.94E-01 8.62E-01 3.62E+03 99.62Sb-124 5.14E+03 7.92E+03 1.17E+02 2.43E+02 5.36E+01 1.27E+02 4.06E+05 98.40Sr-92 6.62E+02Sb-125 1.30E+03 2.09E+03 2.86E+01 6.31E+01 1.26E+01 3.26E+01 1.07E+05 98.44
5.02E+01Cs-138 3.32E+02 2.03E+05Xe-133 2.42E+03 1.53E+00 1.79E+00 2.26E+00 1.15E+00Tot 7.30E+03 1.03E+04 1.47E+02 3.06E+02 6.71E+01 1.60E+02 5.20E+05 0.00E+00 98.45
HUT3Feed 300 Perm 302A Perm 302B Perm 302C Perm f ix Perm after ix conc after ixc after filter 411 sep. memb sep. tot021216 14:50
021216 14:45
021216 14:48
021216 14:50
021216 14:52
021216 14:55
021218 10:55
021218 10:55
B 1035 700 944 1201 1005 998 2.90Co-58 3.39E-01Nb-95Ag-110m 2.90E+02 5.56E+00 4.80E+00 7.23E+00 5.96E+00 3.96E+02 97.95Sb-124 8.81E+03 9.42E+01 3.12E+02 6.28E+01 1.45E+02 2.53E+01 98.35Sr-92Sb-125 2.25E+03 2.40E+01 7.73E+01 1.61E+01 3.73E+01 98.34Cs-138Xe-133 1.44E+02 1.56E+02 1.55E+02 1.32E+02 1.28E+02 1.29E+02 1.59E+01 10.90Tot 1.13E+04 1.24E+02 3.94E+02 8.65E+01 1.88E+02 0.00E+00 4.22E+02 0.00E+00 98.34
HUT1SP100 SP111 SP300 SP302A SP302B SP303C SP304 ERM after ix SP303 sep. memb sep. tot021218 14:35
021218 14:35
021218 14:35
021218 14:35
021218 14:35
021218 14:35
021218 14:35
021218 14:35
030120 11:00
B 596 601 608 409 571 791 614 626 2218 -3.02 -5.03Li 19850Be-7 5.76E+02 9.73E+00 5.08E+00F-18 1.43E+02 4.97E+01 3.21E+01 8.57E+00 2.76E+01 5.08E+01 2.53E+01 82.32 100.00Na-24 1.33E+02 2.05E+02 1.42E+02 7.69E+01 9.79E+01 9.86E+01 2.16E+01 83.81 100.00Mn-54 6.76E+01 4.09E-01 1.67E+00 4.44E+00 2.06E+00 96.96 100.00Co-58 5.85E+02 1.24E+02 7.18E+01 3.16E+00 1.18E+01 3.09E+01 1.49E+01 97.46 100.00Co-60 2.31E+02 6.16E-01 2.25E+00 5.94E+00 3.28E+00 4.09E-01 98.58 99.82Nb-95 9.77E+01 100.00 100.00Nb-97 8.57E+01 1.21E+01Ag-110m 4.19E+02 100.00 100.00Sb-122 3.31E+02 1.31E+02 1.03E+02 9.77E-01 100.00 100.00Sb-124 1.47E+03 1.15E+03 1.16E+03 3.30E+01 1.07E+02 1.63E+01 5.43E+01 96.30 100.00
1

Appendix 7
Tc-99m 1.64E+02 2.40E+02 1.15E+02 8.28E-01 3.95E+00 100.00 100.00Sb-125 3.57E+02 3.85E+02 8.54E+00 2.73E+01 5.00E+00 1.40E+01 96.06 100.00Cs-137 7.61E+01 1.13E+02 7.72E+01 5.84E+01 7.64E+01 8.22E+01 7.38E+01 3.01 100.00I-131 1.58E+02 1.82E+02 1.00E+02 1.32E+00 1.95E+00 1.39E+00 99.12 100.00I-133 1.13E+03 1.10E+03 7.15E+02 6.02E+00 1.18E+01 3.87E-01 100.00 99.97Xe-133 3.39E+03 2.39E+03 1.10E+03 1.04E+03 9.84E+02 1.07E+03 5.33E+02 8.46E+02 84.30 75.08Xe-135 7.08E+02 4.91E+02 1.77E+02 1.37E+02 1.26E+02 1.46E+02 8.16E+00 3.37E+01 98.85 95.23
Tot exkl gas 5.35E+03 3.38E+03 3.48E+03 1.90E+02 3.82E+02 3.17E+02 2.11E+02 7.96E-01 96.07 99.99
Tot gas 4.10E+03 2.88E+03 1.27E+03 1.17E+03 1.11E+03 1.21E+03 5.41E+02 8.79E+02 86.81 78.56Tot 9.46E+03 6.26E+03 4.75E+03 1.36E+03 1.49E+03 1.53E+03 7.52E+02 8.80E+02 92.05 90.69
2

Appendix 7
HUT3HUT3 Feed 300 Perm 302A Perm 302B Perm 302C Perm f ix conc conc after ix sep. memb sep. tot
030115 12:30
030115 12:30
030115 12:30
030115 12:30
030115 12:30
030115 12:30
030115 12:30
Cr-51 9.15E+03Co-58 1.06E+02 9.54E+00 3.39E+01 9.90E+01 4.95E+01 2.81E+03 53.45Co-60 1.77E+00 6.30E+00 1.90E+01 7.77E+00Nb-95Zr-97Ag-110m 3.11E+02 8.98E-01 1.22E+04 2.55E+03 100.00Sb-122 1.83E+03Sb-124 5.79E+03 7.91E+01 2.12E+02 5.08E+01 1.11E+02 7.47E+05 9.85E+01 98.08Sr-92Sb-125 2.10E+03 2.77E+01 7.77E+01 1.61E+01 3.95E+01 2.79E+05 98.12Cs-134 2.33E+00Cs-137 8.48E+00 1.06E+01 2.09E+01 1.37E+01Cs-138 6.28E+01 100.00Xe-133 4.55E+02 4.12E+02 4.83E+02 5.23E+02 3.41E+02 1.34E+02 25.09Xe-133m 7.04E+00 9.86E+00 1.11E+01 3.69E+00Xe-135 3.39E+01 1.51E+01 1.83E+01 4.22E+01 1.19E+01 65.06Tot exkl gas 8.37E+03 1.27E+02 3.41E+02 2.08E+02 2.22E+02 1.05E+06 2.65E+03 97.35Tot 8.86E+03 5.61E+02 8.52E+02 7.85E+02 5.78E+02 1.05E+06 2.78E+03 93.48
3

Appendix 7
MT1 (WHT)WHT part WHT filtrat Feed 100 Feed 300 Perm 302A Perm 302B Perm f ixPerm after ix conc conc after ixonc after f 411 sep. memb sep. tot
030120 12:30
030120 12:30
030121 14:40
030121 14:40
030121 14:40
030121 14:40
030121 14:40
030121 14:40
030121 14:40
030121 14:40
030121 14:40
pH 6.1 6 6.4 6.4 5.7 6 5.3 4.5 4.5 5.00 1.64kond 3.7 3.7 2.6 3.6 62 3.2 1.6 11.6 10.6 -1575.68 13.51B 369 365 246 340 358 360 3020? 1.92 2.44Mn-54 3.70E+02 6.77E+01 5.09E+01 9.51E-01 1.01E+03 98.13 100.00Cr-51 6.11E+03Co-58 1.06E+03 7.55E+02 1.47E+02 1.47E+02 1.60E+00 2.23E+00 1.06E+01 5.75E+03 2.69E+00 92.83 100.00Co-60 3.11E+03 2.05E+02 5.87E+02 5.57E+02 9.45E+03 6.04E+00 100.00 100.00Nb-95 2.74E+03 1.10E+00Zr-97 4.76E+02 1.23E+02 3.59E+02 3.52E+02 9.47E+03 7.14E+01 3.65E+00 100.00 100.00Ag-110m 1.04E+04 1.93E+03 2.98E+03 2.87E+03 4.02E+00 8.53E+04 4.57E+02 1.91E+01 99.86 100.00Sb-124 4.89E+02 6.11E+02 1.67E+03 1.53E+03 2.49E+01 5.88E+01 4.20E+02 5.63E+00 2.12E+05 6.03E+01 1.64E+01 72.48 99.66Sr-92 3.85E+02 4.69E+05Sb-125 1.04E+03 1.05E+03 1.22E+01 2.96E+01 1.56E+02 2.00E+00 1.25E+05 2.30E+01 7.02E+00 85.10 99.81Te-132 3.92E+02Xe-133 2.85E+01 3.68E+01 2.01E+01 3.41E+01 2.70E+02 1.04E+02
Totalt 1.91E+04 3.63E+03 6.84E+03 6.55E+03 6.71E+01 1.27E+02 6.13E+02 4.17E+01 9.23E+05 8.91E+02 1.50E+02 90.64 99.39Totalt exkl ga 1.91E+04 3.63E+03 6.84E+03 6.55E+03 3.86E+01 9.05E+01 5.93E+02 7.63E+00 9.23E+05 6.21E+02 4.62E+01 90.94 99.89
4

Appendix 7
HUT 2 SP100 SP300 SP302A SP302B SP302C SP303 perm after ixconc after ix SP411 sep. memb sep. tot030219 13:20
030219 13:20
030219 13:20
030219 13:20
030219 13:20
030219 13:20
030219 13:20
030219 13:20
030219 13:20
pH 5.7 5.6 6 6 5.4 5.4 5.3 5.3 4.9 -3.57 7.02kond 1.7 1.9 1.5 2 1.8 5.4 2.6 5.9 5.9 7.02 -52.94B 434 433 308 430 532 1239 426 1786 2.23 1.84LiBe-7 1.23E+00 2.77E+00 2.84E+00 3.86E+01F-18 7.10E+00Na-24Mn-54 5.02E-01 9.85E+00Co-58 1.35E+00 7.55E-01 2.82E+00 4.59E+01 7.77E-01 1.42E+01 1.98E+00 -32.35Co-60 1.30E+01 3.81E+00 1.30E+02 4.86E+01 100.00Zr-97 4.32E+00 4.83E+00 3.30E+02 8.66E+01 2.57E+00 100.00Ag-110m 2.11E+01 3.15E+01 5.41E-01 2.07E+03 1.60E+03 5.04E+01 98.28 100.00Sn-113 4.23E+00Sb-122 3.13E-01 1.19E+01Sb-124 1.42E+00 8.22E+00 6.97E+00 1.29E+01 2.22E+01 1.13E+03 7.45E+00 3.84E+02 1.98E+02 -70.77 -425.39Sr-92 8.31E+01Tc-99mSb-125 4.62E+00 9.20E+00 1.49E+01 8.23E+02 2.65E+02 1.32E+02 -160.37Cs-137Cs-138 4.33E+02Kr-85m 1.95E+00 2.31E+00Xe-133 1.66E+03 3.42E+02 6.18E+02 5.65E+02 4.88E+02 5.64E+02 5.89E+02 4.38E+02 2.01E+02 -63.06 64.48Xe-133m 2.65E+01 6.90E+00 1.17E+01 9.64E+00 1.04E+01 1.27E+01 1.47E+00 -53.44 52.10Xe-135 3.83E+02 6.61E+01 1.26E+02 1.17E+02 1.08E+02 1.23E+02 1.31E+02 1.06E+01 -77.23 65.74Sb-125 5.08E+00 4.98E+00
Tot 2.11E+03 4.70E+02 7.73E+02 7.17E+02 6.50E+02 5.23E+03 7.48E+02 3.38E+03 6.26E+02 -51.88 64.49Tot exkl gas 3.99E+01 5.48E+01 1.46E+01 2.49E+01 4.30E+01 4.55E+03 1.32E+01 2.93E+03 4.24E+02 49.82 66.90
5

Appendix 7
Tvättank förafter tvät after tvätt
030305 13:10
030305 14:30
pH 5.11 2.27kond 43.4 2.1Fe 30 1950
HUT3 ?SP100 SP303 perm after ix SP303 sep. memb sep. tot030311 15:45
030311 15:45
030311 16:45
030311 16:45
pH kond 74.3 30.1 2.1 5.2B 448 1246 452 428Fe
HUT3 ?SP100 SP303 SP304 perm after ix SP411 sep. tot030312 12:45
030312 12:45
030312 12:45
030312 12:45
030312 12:45
BLiBe-7 8.60E+00 5.56E+00F-18 2.51E+00 8.51E+00 100.00Na-24 8.28E+00Mn-54 8.37E-01 8.30E+03 100.00Co-58 2.02E+00 6.02E+00 3.10E-01 100.00Co-60 3.72E-01 1.09E+01 3.53E-01 100.00Zr-97Ag-110m 1.06E+00 2.06E+02 4.10E+00 2.38E+01 100.00Sn-113 4.07E+00Sb-122 6.00E-01 6.79E+00 100.00Sb-124 2.39E+00 2.85E+02 2.08E+01 2.46E+00 7.83E+01 -2.76Ar-41 7.27E+01 2.96E+00 4.39E+00 93.96Kr-85m 2.06E+01 2.07E+00 2.38E+00 88.40Kr-87 1.13E+01 2.48E+00 100.00Kr-88 2.59E+01 100.00Xe-133 2.23E+03 6.29E+02 4.28E+02 4.61E+02 5.63E+02 79.30Xe-133m 4.77E+01 1.46E+01 9.25E+00 8.97E+00 1.18E+01 81.19Xe-135 7.14E+02 1.83E+02 1.43E+02 1.47E+02 8.01E+01 79.42Sb-125 1.49E+02 1.30E+01 1.46E+00 6.79E+01
Tot 3.13E+03 9.83E+03 6.23E+02 6.27E+02 8.31E+02 79.95Tot exkl gas 9.80E+00 9.00E+03 3.82E+01 3.92E+00 1.76E+02 60.03
6

Appendix 7
HUT1 ?feed permeat sep. memb sep. tot
030317 13:30
030317 13:30
BLiBe-7 5.15E+01 100.00F-18 4.48E+02 100.00Cr-51 4.40E+01 100.00Mn-54 1.06E+01 100.00Co-57 9.34E-01 100.00Co-58 4.24E+02 100.00Fe-59 1.63E+00 100.00Co-60 8.28E+01 100.00Nb-95 4.07E+01 100.00Zr-95 1.78E+01 100.00Ag-110m 4.46E+01 100.00Sn-113 2.56E+00 100.00Sb-124 1.86E+02 9.24E+00 95.03Tc-99m 2.85E+00 100.00Sb-125 2.14E+01 4.34E+00 79.74Cs-137 1.26E+01 100.00I-131 9.10E+00 1.10E-01 98.79Xe-133 7.36E+02 3.91E+00 99.47
Tot 2.14E+03 1.76E+01 99.18Tot exkl gas 1.40E+03 1.37E+01 99.02
7

Appendix 7
MT1 (WHT)SP302A SP302B SP302C SP303 SP304 perm after ix SP411 sep. memb sep. tot030319 17:15
030319 17:15
030319 17:15
030319 17:15
030319 17:15
030319 17:15
030319 17:15
B 221 323 400 1022 315 315 1127Be-7 4.67E+00 3.85E+00 4.15E+00 6.87E+01Mn-54 4.30E-01 3.17E+03Cr-51Co-58 4.48E+00 1.73E+00 2.10E+01 1.61E+04 1.03E+01 2.10E+01Co-60 3.72E+04 7.73E+00Nb-95Zr-97 1.36E+03Ag-110m 1.32E+00 2.53E+00 8.12E+04 2.45E+00 6.08E+02Sb-124 6.19E+00 1.51E+01 1.96E+01 2.48E+04 1.36E+01 2.50E+00 9.39E+01Sr-92Sb-125 4.62E+00 1.31E+01 1.52E+01 2.18E+04 8.13E+01Te-132Cs-137 3.30E-01 2.57E-01 5.97E-01Ce-144 5.63E+00Xe-133 5.69E+00
Totalt 1.56E+01 3.61E+01 6.32E+01 1.86E+05 3.05E+01 2.50E+00 8.92E+02Totalt exkl ga 1.56E+01 3.61E+01 6.32E+01 1.86E+05 3.05E+01 2.50E+00 8.86E+02
8

Appendix 7
HUT 3SP100 SP300 SP303 SP304 perm after ix sep. memb sep. tot030404 08:40
030404 08:40
030404 08:40
030404 08:40
030404 08:40
Be-7 7.13E+01 7.04E+01 3.15E+02 1.88E+01 73.29 100.00Mn-54 1.86E+01 1.39E+01 8.31E+01 3.41E+00 75.40 100.00Cr-51 1.42E+01 100.00Co-58 1.28E+02 9.64E+01 5.84E+02 2.57E+01 73.29 100.00Fe-59 3.24E+00 100.00Co-60 1.40E+01 1.10E+01 1.54E+02 2.33E+00 2.20E-01 78.86 98.43As-76 4.28E+00 100.00Nb-95 1.17E+00 1.09E+00 100.00 100.00Zr-97 2.31E-01Ag-110m 5.26E+00 4.82E+00 3.95E+02 3.21E+00 100.00 38.92Sn-113 4.68E+00 2.56E+00 100.00 100.00Sb-122 1.32E+02 1.29E+02 1.86E+04 100.00 100.00Sb-124 1.99E+02 1.92E+02 2.94E+04 9.75E+00 94.92 100.00W-187 2.16E+01 2.31E+01 2.98E+03 100.00 100.00Ar-41 2.26E+03 4.36E+01 100.00 100.00Mo-99 7.47E+01 8.58E+01 1.56E+04 2.45E+00 97.14 100.00Tc-99m 2.91E+02 2.87E+02 2.33E+04 3.60E+01 87.45 100.00Sb-125 1.69E+01 2.10E+01 3.30E+03 2.59E+00 87.67 100.00Te-132Cs-134 3.15E+00Cs-136 2.08E+00 2.32E+00 2.56E+00 -10.03 100.00Cs-137 2.73E+01 2.74E+01 2.68E+01 2.12 100.00Cs-138 1.14E+04Ba-140 4.59E+00 100.00La-140 1.59E+00 100.00Ce-144 2.84E+01 1.04E+01 3.29E+03 100.00 100.00Am-241 1.31E+03I-130 1.67E+00 100.00I-131 1.31E+02 1.30E+02 9.64E+03 7.82E+00 93.97 100.00I-132 8.21E+00 6.50E+02 100.00I-133 2.36E+02 2.40E+02 1.73E+04 1.43E+01 2.43E-01 94.03 99.90Kr-85m 1.65E+02 100.00Kr-88 3.25E+02 100.00Xe-133 4.32E+03 1.95E+01 7.52E+02 1.75E+01 1.77E+01 10.41 99.59Xe-133m 1.37E+02 1.58E+00 98.85Xe-135 3.61E+03 2.22E+00 3.73E+00 4.07E+00 -68.32 99.89
Totalt 1.22E+04 1.43E+03 1.39E+05 1.77E+02 2.73E+01 87.62 99.78Totalt exkl ga 1.42E+03 1.36E+03 1.38E+05 1.56E+02 3.90E+00 88.58 99.73
9

Appendix 7
HUT 1SP100 SP300 SP303 SP500 SP411 SP304 SP 600 sep. memb sep. tot030410 11:00
030410 11:00
030410 11:00
030410 11:00
030410 11:00
030410 11:00
030410 11:00
BorBe-7 8.64E+01 6.16E+01 1.98E+01 67.91 100.00Mn-54 6.10E-01 5.08E-01 1.07E+00 -74.95Cr-51Co-57 2.74E+00 100.00Co-58 1.97E+01 1.76E+01 2.42E+02 4.34E+00 1.07E+01 39.52 100.00Fe-59Co-60 1.24E+00 6.36E+00 8.22E-01 1.32E-01 33.44As-76 8.30E-01Sr-85 1.41E-01Nb-95 4.82E-01Nb-97 3.47E+03Zr-97Ag-110m 3.15E+00 1.10E+01 2.23E+00 100.00Sn-113 1.58E+00 9.82E-01 4.03E-01 100.00 100.00Sb-122 1.25E+02 1.22E+02 1.91E+04 1.61E+00 100.00 100.00Sb-124 1.61E+02 1.71E+02 2.61E+04 3.50E+00 1.21E+01 1.41E+01 2.77E+00 91.73 98.28Ar-41 1.62E+03 100.00Mo-99Tc-99m 1.51E+01 1.25E+00 2.59E+02 1.24E+00 0.32 100.00Sb-125 1.05E+01 9.84E+00 1.79E+03 1.02E+01 2.58E+00 73.77 100.00Cs-134 3.31E+00Cs-134m 1.30E+03 100.00Cs-136 7.52E-01 5.90E-01 21.57Cs-137 2.76E+01 2.75E+01 9.49E+01 2.85E+01 -3.60 100.00Ce-144 1.36E+02 100.00I-131 1.17E+02 1.47E+00 3.04E-01Kr-85 2.39E+02 3.25E+01 86.41Kr-88 3.03E+02 100.00Xe-133 9.94E+03 1.01E+00 1.19E+01 1.15E+01 2.49E+00 2.79E+00 -146.14 99.97Xe-133m 3.02E+02 8.72E-01 100.00 100.00Xe-135 7.20E+03 1.16E+00 1.17E+00 1.32E+00 1.68E+00 99.98
Totalt 2.15E+04 4.19E+02 5.12E+04 4.26E+01 3.72E+01 8.76E+01 4.00E+01 79.10 99.81Totalt exkl ga 3.51E+03 4.17E+02 5.12E+04 2.96E+01 2.45E+01 8.38E+01 3.05E+00 79.92 99.91
10

Appendix 7
MT1 (WHT)WHT MT1 SP100 SP-300 SP302A SP302B SP302C SP303 SP304 SP500 SP600 SP411 sep. memb sep. tot
030505 16:00
030506 12:35
030506 13:10
030506 13:10
030506 13:10
030506 13:10
030506 13:10
030506 13:10
030506 13:10
030506 13:10
030506 13:10
030506 13:10
B (ppm) 183 127 181 228 613 180 1.64Li (ppb) 524 416 585 574 3700 DL 100.00Al 0 0 0 33.1 0 5.3Co 4.3 3.4 3.7 7.4 1.8 4.2 51.35Cr 4.9 4.7 4.3 10.8 0.4 3.4 90.70Cu 29.4 5.2 2.6 87 0 1.2 100.00Fe 181.9 139 94.3 852.7 0 1.5 100.00Mn 26.8 0 0 1.4 0 0.3Ni 7.5 2 0.7 7.2 0.3 4.9 57.14Zn 121.3 2.9 1.2 21.2 0.4 2.1 66.67B-7 1.93E+00 3.83E+00 3.38E+00 3.25E+00 5.79E+01 5.71E+01K-42 2.72E+03 1.04E+03Mn-54 2.66E+01 2.15E+02 1.47E+02 1.06E+02 2.25E-01 1.10E+03 2.64E+02 2.61E+00 100.00 100.00Cr-51 4.75E+01 3.63E+01 5.19E+02 1.12E+02 100.00 100.00Co-57 4.66E+00 3.94E+00 3.68E+01 7.30E+00 6.49E-01 100.00 100.00Co-58 1.20E+02 3.58E+02 2.48E+02 1.78E+02 5.59E-01 1.02E+00 1.69E+00 1.88E+03 1.38E+00 5.14E+02 3.27E-01 1.16E+02 99.23 99.87Fe-59 1.03E+01Co-60 2.45E+02 2.83E+03 1.88E+03 1.42E+03 1.27E+04 3.45E+03 8.17E+00 100.00 100.00Zn-65 2.18E+01 1.31E+01 3.56E+01 100.00 100.00Nb-95 7.68E+01 8.36E+01 4.64E+01 100.00 100.00Zr-95 3.42E+01 1.97E+01 1.83E+02 5.14E+01 100.00 100.00Zr-97 1.20E+02Ag-110m 3.03E+02 2.35E+03 1.97E+03 1.65E+03 1.05E+00 6.17E-01 2.27E+04 9.04E+03 2.45E+02 100.00 100.00Sn-113 1.00E+01 4.76E+00 2.04E+01 100.00 100.00Sb-122 1.37E+01 9.33E+00 1.22E+03 1.04E+01 100.00 100.00Sb-124 4.22E+01 3.77E+02 3.31E+02 3.13E+02 3.07E+00 1.18E+01 5.52E+00 3.30E+04 7.04E+00 3.68E+02 6.38E+00 2.27E+01 97.75 98.07Sr-92Sb-125 2.43E+02 1.83E+02 1.66E+02 1.25E+00 4.21E+00 3.12E+00 9.12E+03 3.23E+00 2.47E+02 2.48E+00 1.20E+01 98.05 98.64I-131 1.10E+02 3.69E+01Cs-137 3.08E+00 4.17E+00 4.58E+00 3.81E+00
Totalt 8.12E+02 6.37E+03 4.97E+03 3.96E+03 1.09E+01 2.57E+01 1.85E+01 8.52E+04 1.87E+01 1.53E+04 9.19E+00 5.84E+02 99.53 99.82
11

Appendix 7
HUT 1SP100 SP-300 SP302A SP302B SP302C SP303 SP304 SP500 SP600 SP411 sep. memb sep. tot
030512 08:20
030512 08:20
030512 08:20
030512 08:20
030512 08:20
030512 08:20
030512 08:20
030512 08:20
030512 08:20
030512 08:20
Bor 9.9 9.9 7.7 10 11 25 9.9 0.00 100.00Litium 546 547 459 560 602 1540 544 0.55 100.00Be-7 1.16E+03 9.82E+02 4.84E+01 1.66E+02 2.10E+02 2.35E+03 1.36E+02 1.80E+02 9.98E+01 86.12 100.00K-42 2.24E+03 100.00Mn-54 8.77E+00 5.28E+00 5.44E+01 1.13E+02 6.81E-01 100.00 100.00Cr-51 6.52E+01 3.65E+01 4.34E+02 1.81E+02 100.00 100.00Co-57 1.37E+00 1.01E+00 9.19E+00 100.00 100.00Co-58 8.29E+02 6.21E+02 5.59E-01 1.57E+00 6.80E+00 3.62E+03 2.78E+00 4.59E+03 8.05E+01 99.55 100.00Fe-59 7.54E+00Co-60 8.97E+01 6.78E+01 6.95E+02 1.37E+03 8.31E-01 100.00 100.00Zn-65 1.36E+01As-76 3.44E-01Sr-85Nb-95 2.24E+01 3.54E+00 100.00 100.00Nb-97Zr-95 6.48E+00 2.04E+01 100.00Zr-97 6.45E+01 7.71E+01 3.11E+02 1.84E+01 100.00 100.00Ag-110m 3.83E+01 3.54E+01 7.95E+02 5.33E+02 2.78E+01 100.00 100.00Sn-113 5.99E+00 3.55E+00 2.13E+01 100.00 100.00Sb-122 7.76E+01 7.96E+01 2.32E+00 3.28E+00 2.19E+00 1.21E+04 2.25E+00 8.05E+01 2.22E-01 97.17 99.71Sb-124 8.22E+02 8.01E+02 2.40E+01 3.08E+01 3.48E+01 1.15E+05 3.10E+01 1.02E+03 7.71E+00 5.71E+01 96.13 99.06Ar-41Mo-99Tc-99mSb-125 5.10E+01 4.86E+01 2.26E+00 3.21E+00 7.75E+03 5.81E+01 1.63E+00 1.58E+01 100.00 96.81Cs-134 3.14E+00 2.57E+00Cs-134mCs-136 4.49E-01 3.69E-01Cs-137 2.20E+01 2.13E+01 1.57E+01 2.11E+01 2.55E+01 1.07E+02 2.03E+01 4.33 100.00Ce-144I-131 1.10E+00Kr-85Kr-88Xe-133 1.20E+03 7.65E-01 1.15E+00 8.82E-01 1.16E+00 3.33E+00 99.90Xe-133m 2.29E+01 100.00Xe-135 4.43E-01
Totalt 6.72E+03 2.78E+03 9.17E+01 2.25E+02 2.88E+02 1.43E+05 1.96E+02 8.51E+03 1.15E+01 3.05E+02 92.94 99.83Totalt exkl ga 5.50E+03 2.78E+03 9.09E+01 2.25E+02 2.86E+02 1.43E+05 1.95E+02 8.51E+03 9.90E+00 3.02E+02 92.97 99.82
12
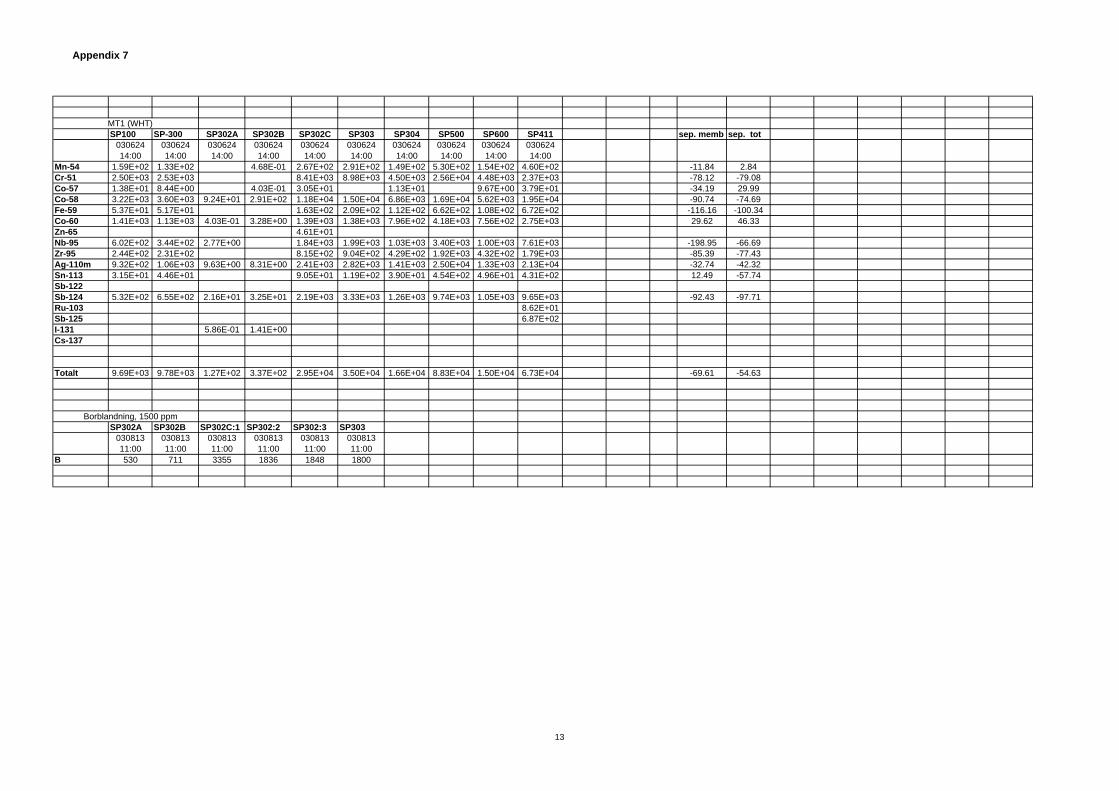
Appendix 7
MT1 (WHT)SP100 SP-300 SP302A SP302B SP302C SP303 SP304 SP500 SP600 SP411 sep. memb sep. tot
030624 14:00
030624 14:00
030624 14:00
030624 14:00
030624 14:00
030624 14:00
030624 14:00
030624 14:00
030624 14:00
030624 14:00
Mn-54 1.59E+02 1.33E+02 4.68E-01 2.67E+02 2.91E+02 1.49E+02 5.30E+02 1.54E+02 4.60E+02 -11.84 2.84Cr-51 2.50E+03 2.53E+03 8.41E+03 8.98E+03 4.50E+03 2.56E+04 4.48E+03 2.37E+03 -78.12 -79.08Co-57 1.38E+01 8.44E+00 4.03E-01 3.05E+01 1.13E+01 9.67E+00 3.79E+01 -34.19 29.99Co-58 3.22E+03 3.60E+03 9.24E+01 2.91E+02 1.18E+04 1.50E+04 6.86E+03 1.69E+04 5.62E+03 1.95E+04 -90.74 -74.69Fe-59 5.37E+01 5.17E+01 1.63E+02 2.09E+02 1.12E+02 6.62E+02 1.08E+02 6.72E+02 -116.16 -100.34Co-60 1.41E+03 1.13E+03 4.03E-01 3.28E+00 1.39E+03 1.38E+03 7.96E+02 4.18E+03 7.56E+02 2.75E+03 29.62 46.33Zn-65 4.61E+01Nb-95 6.02E+02 3.44E+02 2.77E+00 1.84E+03 1.99E+03 1.03E+03 3.40E+03 1.00E+03 7.61E+03 -198.95 -66.69Zr-95 2.44E+02 2.31E+02 8.15E+02 9.04E+02 4.29E+02 1.92E+03 4.32E+02 1.79E+03 -85.39 -77.43Ag-110m 9.32E+02 1.06E+03 9.63E+00 8.31E+00 2.41E+03 2.82E+03 1.41E+03 2.50E+04 1.33E+03 2.13E+04 -32.74 -42.32Sn-113 3.15E+01 4.46E+01 9.05E+01 1.19E+02 3.90E+01 4.54E+02 4.96E+01 4.31E+02 12.49 -57.74Sb-122Sb-124 5.32E+02 6.55E+02 2.16E+01 3.25E+01 2.19E+03 3.33E+03 1.26E+03 9.74E+03 1.05E+03 9.65E+03 -92.43 -97.71Ru-103 8.62E+01Sb-125 6.87E+02I-131 5.86E-01 1.41E+00Cs-137
Totalt 9.69E+03 9.78E+03 1.27E+02 3.37E+02 2.95E+04 3.50E+04 1.66E+04 8.83E+04 1.50E+04 6.73E+04 -69.61 -54.63
Borblandning, 1500 ppmSP302A SP302B SP302C:1 SP302:2 SP302:3 SP303
030813 11:00
030813 11:00
030813 11:00
030813 11:00
030813 11:00
030813 11:00
B 530 711 3355 1836 1848 1800
13

Appendix 7
MT1(WHT)SP100 SP300 SP302A SP302B SP302C SP303 SP304 SP600 sep. memb sep. tot
030924 15:00
030924 15:00
030924 15:00
030924 15:00
030924 15:00
030924 15:00
030924 15:00
030924 15:00
Be-7 9.84E+01 9.41E+01 8.99E+00 1.85E+01 2.02E+03 1.16E+01 87.68 100.00Mn-54 3.43E+01 2.65E+01 2.59E+00 8.81E+00 2.83E+00 9.43E+02 6.28E+00 2.25E-01 76.28 99.35Cr-51 1.53E+02 1.01E+02 <6.79E+02 5.57E+00 94.50 100.00Co-57 3.67E+00 < 3.92E-01 2.40E+00 4.30E-01 1.80E+02 9.75E-01 73.44 100.00Co-58 9.32E+02 7.89E+02 1.52E+02 6.11E+02 1.66E+02 5.32E+04 3.30E+02 6.25E+00 58.10 99.33Fe-59 1.70E+01 2.00E+01 100.00 100.00Co-60 2.45E+02 1.77E+02 4.27E+00 1.59E+01 4.65E+00 2.44E+03 3.03E+01 1.05E+00 82.86 99.57Zn-65 6.16E+00 100.00Nb-95 1.01E+02 6.37E+01 3.46E+03 100.00 100.00Zr-95 5.16E+01 3.46E+01 1.99E+02 100.00 100.00Ag-110m 1.30E+03 1.16E+03 3.14E+00 5.00E+00 1.23E+00 1.29E+04 8.57E+00 5.65E+00 99.26 99.57Sn-113 2.20E+01 1.83E+01 1.17E+02 100.00 100.00Sb-124 8.03E+02 6.96E+02 6.09E+00 1.85E+01 7.04E+00 8.20E+03 1.14E+01 1.53E+01 98.36 98.10Sb-125 1.07E+02 8.88E+01 1.15E+03 1.20E+02 -35.10 100.00I-131Cs-137
Totalt 3.88E+03 3.26E+03 1.77E+02 6.80E+02 1.82E+02 8.48E+04 5.25E+02 2.85E+01 83.92 99.27
14

Appendix 7
HUT2SP100 SP300 SP302A SP302B SP302C SP303 SP304 SP600 sep. memb sep. tot sep. förfilter
031008 08:00
031008 08:00
031008 08:00
031008 08:00
031008 08:00
031008 08:00
031008 08:00
031008 08:00
B 1092 1094 819 1125 1248 3732 1078 1086Li 1680 1650 1460 1920 1310 15200 1800 125Be-7 1.62E+02 9.87E+01 100.00 100.00 38.89K-42 4.71E+01 100.00 100.00Mn-54 1.54E+02 1.07E+02 1.01E+00 3.44E+00 6.63E+00 4.21E+02 4.50E+00 95.80 100.00 30.27Cr-51 9.40E+01 7.46E+01 100.00 100.00 20.66Co-57 6.60E+00 8.62E+00 6.98E-01 9.85E-01 1.00E+00 88.35 100.00Co-58 1.70E+03 1.44E+03 4.15E+01 1.69E+02 3.54E+02 2.00E+04 2.09E+02 2.07E+00 85.44 99.88 15.38Co-60 1.27E+03 9.47E+02 1.44E+00 5.82E+00 1.22E+01 7.47E+02 7.63E+00 99.19 100.00 25.32Nb-95 7.49E+01 5.40E+01 100.00 100.00 28.01Zr-95 3.34E+01 2.17E+01 100.00 100.00 35.07Ag-110m 2.56E+02 2.32E+02 1.52E+03 4.84E+00 100.00 98.11 9.45Sn-113 1.69E+01 1.07E+01 100.00 100.00 36.55Sb-122 1.35E+01 1.28E+01 5.17E+02 100.00 100.00 5.32Sb-124 1.28E+03 1.33E+03 4.91E+01 1.37E+02 2.25E+01 2.65E+05 7.18E+01 94.60 100.00Sb-125 2.13E+02 1.84E+02 5.90E+00 1.76E+01 3.36E+04 9.66E+00 1.89E+01 94.76 91.09 13.22Cs-136 1.08E+00 1.33E+00 2.07E+00 1.09E+00Cs-137 1.33E+01 7.37E+00 9.41E+00 1.38E+01 1.07E+01 19.56I-131 5.54E+00 6.56E+00 100.00 100.00Xe-133 6.65E+02 2.09E+02 2.49E+02 2.20E+02 2.47E+02 2.34E+02 2.16E+02 -12.11 67.52 68.56Xe-133m 3.00E+00 2.26E+01 3.19E+00Xe-135 5.63E+01 1.99E+01 2.32E+01 2.10E+01 2.16E+01 2.02E+01 100.00 64.05 64.62
Totalt 6.04E+03 4.77E+03 3.83E+02 5.86E+02 6.81E+02 3.22E+05 5.72E+02 2.65E+02 87.99 95.61 21.17Totalt exkl ga 5.32E+03 4.54E+03 1.07E+02 3.45E+02 4.13E+02 3.22E+05 3.15E+02 2.58E+01 93.05 99.51 14.79
15

Appendix 7
HUT2SP300 SP302A SP302B SP302C SP303 sep. memb sep. tot031008 13:55
031008 13:55
031008 13:55
031008 13:55
031008 13:55
B 1090 813 1136 1251 3766Li 1650 1300 1930 1310 16650Be-7 1.30E+02 1.73E+03 100.00Na-24 3.75E+00 3.95E+01Mn-54 7.03E+01 1.13E+00 5.18E+00 9.85E+00 6.25E+02 92.34Cr-51 5.95E+01 100.00Co-57 5.67E+00 7.39E-01 2.74E+00 79.54Co-58 1.46E+03 4.17E+01 1.94E+02 4.09E+02 2.50E+04 85.26Co-60 1.49E+02 1.69E+00 7.87E+00 1.37E+01 9.35E+02 94.79Nb-95 2.60E+01 2.07E+02 100.00Zr-95 1.68E+01 100.00Ag-110m 1.66E+02 8.72E+02 100.00Sb-122 1.10E+01 1.34E+03 100.00Sb-124 1.33E+03 4.14E+01 1.27E+02 1.84E+01 2.17E+05 95.31Sb-125 1.55E+02 4.70E+00 1.57E+01 2.77E+04 95.63Cs-136 9.81E-01 1.56E+00 1.30E+00Cs-137 7.07E+00 1.08E+01 1.61E+01I-131 5.87E+00 1.29E+00 2.82E+00 6.37E+02 76.64Xe-133 1.44E+02 1.37E+02 1.72E+02 1.54E+02 -7.34Xe-135 8.07E+00
Totalt 3.72E+03 2.36E+02 5.36E+02 6.40E+02 2.76E+05 87.36Totalt exkl ga 3.58E+03 9.87E+01 3.64E+02 4.78E+02 2.76E+05 91.24
16

Appendix 7
HUT2SP302A SP302B SP302C SP303 SP600 sep. memb sep. tot031008 15:05
031008 15:05
031008 15:05
031008 15:05
031008 15:05
B 850 1152 1147 4068 0.82Li 1560 2350 1000 22200 42 8.73Be-7 100.00Na-24Mn-54 1.25E+00 5.09E+00 5.96E+00 6.83E+02 93.39Cr-51 100.00Co-57 8.89E-01 9.24E-01 1.10E+02 87.56Co-58 4.22E+01 1.95E+02 2.43E+02 3.16E+04 87.39Co-60 8.83E+00 7.21E+00 9.48E+00 1.24E+03 94.16Nb-95 100.00Zr-95 100.00Ag-110m 5.52E+02 100.00Sb-122 2.79E+00 1.50E+03 92.88Sb-124 3.66E+01 1.31E+02 2.20E+01 2.24E+05 95.79Sb-125 5.00E+00 1.65E+01 3.05E+00 2.93E+04 95.31Cs-136 9.61E-01 1.73E+00 2.22E+00Cs-137 7.21E+00 1.06E+01 1.10E+01I-131 3.62E-01 1.21E+00 1.04E+00 5.89E+02 84.09Xe-133 1.19E+02 1.53E+02 1.31E+02 6.67Xe-135
Totalt 2.63E+03 4.03E+03 2.58E+03 3.16E+05 19.54Totalt exkl ga 1.02E+02 3.71E+02 2.99E+02 2.90E+05 92.33
concbehandling HUT2 från 031008SP405 SP500 SP402 SP500031104 15:40
031103 15:40
031103 16:25
031103 16:25
Na-24 6.01E+01Cr-51 1.25E+03 8.92E+01 1.03E+03 4.25E+01Mn-54 3.24E+02 1.84E+01 3.32E+02 1.96E+01Co-57 1.00E+02Co-58 1.50E+04 3.15E+02 1.69E+04 3.25E+02Co-60 7.39E+02 1.19E+02 1.31E+03 1.27E+02Nb-95 3.32E+01Zr-95 1.80E+01 1.29E+01Ag-110m 1.05E+03 1.27E+03 1.88E+03 1.26E+03Sb-124 1.44E+05 2.85E+02 1.54E+05 3.90E+02Sb-125 2.37E+04 5.47E+01 2.58E+04 7.48E+01
Totalt 1.86E+05 2.21E+03 2.01E+05 2.32E+03
17
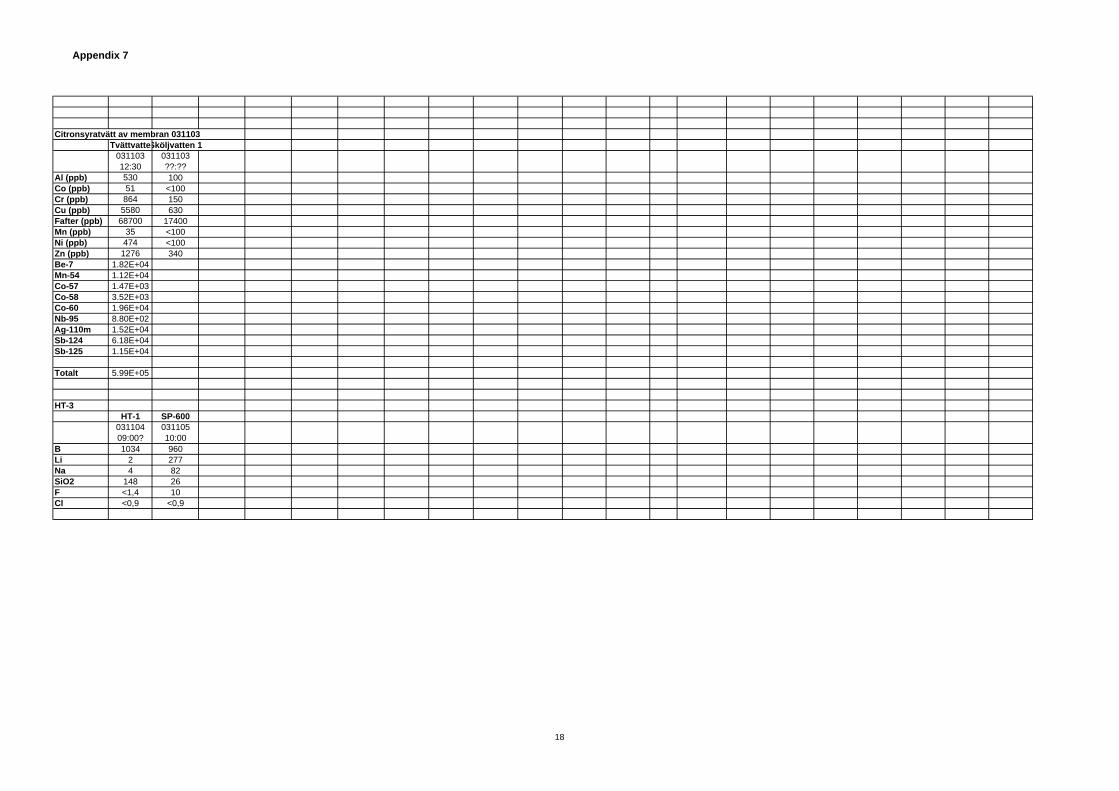
Appendix 7
Citronsyratvätt av membran 031103TvättvattenSköljvatten 1
031103 12:30
031103 ??:??
Al (ppb) 530 100Co (ppb) 51 <100Cr (ppb) 864 150Cu (ppb) 5580 630Fafter (ppb) 68700 17400Mn (ppb) 35 <100Ni (ppb) 474 <100Zn (ppb) 1276 340Be-7 1.82E+04Mn-54 1.12E+04Co-57 1.47E+03Co-58 3.52E+03Co-60 1.96E+04Nb-95 8.80E+02Ag-110m 1.52E+04Sb-124 6.18E+04Sb-125 1.15E+04
Totalt 5.99E+05
HT-3HT-1 SP-600
031104 09:00?
031105 10:00
B 1034 960Li 2 277Na 4 82SiO2 148 26F <1,4 10Cl <0,9 <0,9
18

Appendix 7
HT HT-2 HT-1inför batmankörning
031118 08:04
031124 10:13
F-18 6.84E+02 5.72E+01Cr-51 2.54E+02Mn-54 1.64E+02 1.98E+01Co-58 1.52E+03 2.32E+02Co-60 9.74E+02 8.22E+01Nb-95 7.22E+02 4.71E+01Zr-95 3.38E+02 2.74E+01Ag-110m 6.58E+01 9.74E+01Sn-113 5.57E+01Sb-124 2.23E+02 1.45E+02Sb-125 8.22E+01Xe-133 4.46E+02 8.43E+02Xe-135 6.61E+01 9.35E+01
Totalt 5.59E+03 1.65E+03Totalt exkl ga 5.08E+03 7.08E+02
concbehandling HT-2 från 031119?T304 SP405 conc after ix
031124 10:13
031124 10:13
031124 10:13
K-42 4.51E+04Cr-51 9.39E+00Mn-54 7.62E+01 7.71E+01 1.20E+01Co-57 2.97E+01 3.39E+01 8.92E-01Co-58 5.56E+03 6.03E+03 1.40E+02Co-60 3.25E+02 2.79E+02 8.39E+01Zn-65 2.12E+00Nb-95 8.40E+01 5.00E+01Zr-95 8.44E+00Ag-110m 1.97E+02 8.67E+01 1.33E+02Sn-113 2.00E+00Sb-124 8.86E+03 1.06E+04 4.77E+01Sb-125 1.92E+03 2.10E+03 1.18E+01Xe-133 1.13E+01
Totalt 1.70E+04 6.44E+04 5.12E+02Totalt exkl ga 1.70E+04 6.44E+04 5.01E+02
19

Appendix 7
HT-1 HT-1 SP-100 SP300 SP303 SP302A SP302B SP302C SP304 SP600031124 10:13
03112815:25
03112815:25
03112815:25
03112815:25
03112815:25
03112815:25
03112815:25
03112815:25
B 940 913 912 2987 737 953 972 898 898Li 88 224 226 1990 227 355 104 211 112Na 4 4 10 12 3 4 4 4 42SiO2 137 131 131 19810 49 136 87 90 95F <2 <2 <2 <2 <2 <2 <2 5Cl <1 4 3 1 1 2 2 2SO4 1 4 4 <1,5 3 3 3 5NO2 <4 <4 <4 <4 <4 <4 <4 <4NO3 <4 3 <4 <4 <4 <4 <4 <4Be-7 5.43E+01 4.19E+01 3.71E+00 4.08E+00Cr-51 9.66E+00 3.52E+01Mn-54 1.98E+01 1.43E+01 1.01E+01 5.78E+01 7.03E-01 8.27E-01 3.22E+00Co-57 9.52E-01 1.67E+00 1.62E+01 3.96E-01 4.01E-01 3.02E-01 5.62E-01Co-58 2.32E+02 1.60E+02 2.88E+02 4.06E+03 2.62E+01 6.53E+01 7.68E+01 4.64E+02Co-60 8.22E+01 4.98E+01 3.25E+01 2.96E+02 8.34E-01 2.29E+00 3.06E+00 3.23E+01Nb-95 4.71E+01 1.11E+01 1.74E+01 4.85E-01 8.41E-01 1.58E+01Zr-95 2.74E+01 5.77E+00 3.87E+00 3.33E+00Ag-110m 9.74E+01 6.69E+01 4.79E+01 1.07E+03 2.09E+00 1.59E+00 2.49E+00 4.10E+01Sn-113 2.34E+00 1.52E+00Sb-122 1.13E+01 1.14E+01 6.23E+02 4.36E+00Sb-124 1.45E+02 1.73E+02 1.69E+02 1.04E+04 5.88E+00 4.98E+00 9.73E+00 2.72E+02Sb-125 3.75E+01 3.74E+01 2.37E+03 1.77E+01Am-241 1.32E+02Cs-136 1.37E+00 8.26E-01 7.35E-01 9.99E-01Cs-137 2.00E+00 3.85E+00 2.30E+00 2.32E+00 2.46E+00I-131 4.31E+00 4.33E+00 2.07E+02 4.06E-01 4.09E-01Xe-133 8.43E+02 1.19E+03 2.57E+02 2.73E+02 2.83E+02 2.58E+02 2.59E+02 2.83E+02Xe-133m 1.76E+01 5.29E+00Xe-135 9.35E+01
Totalt 1.59E+03 1.81E+03 9.26E+02 1.92E+04 3.11E+02 3.65E+02 2.59E+02 3.67E+02 1.17E+03Totalt exkl ga 6.51E+02 6.04E+02 6.69E+02 1.92E+04 3.86E+01 8.24E+01 4.01E-01 1.02E+02 8.91E+02
20

Appendix 7
concbehandling div conc från kubiktanken OBS kört genom permeat ixSP-500031124 10:13
Be-7 3.80E+02Mn-54 3.00E+01Co-58 5.87E+02Co-60 2.80E+02Ag-108m 3.39E+01Ag-110m 8.45E+03Sn-113 5.62E+01Sb-124 3.01E+03Sb-125 1.18E+03
concbehandling HT-1 från 031128-29T 304 T 304 SP-405 SP-405 SP-700 SP-700
031216 14:00
031216 15:05
031216 12:50
031216 15:05
031216 12:50
031216 15:05
Be-7 3.01E+02 2.63E+02 3.47E+02 4.03E+02Cr-51 2.02E+02 2.41E+02Mn-54 9.34E+01 8.81E+01 7.92E+01 8.75E+01 4.11E+00 4.40E+00Co-57 1.53E+01 2.32E+01Co-58 3.01E+03 3.04E+03 2.83E+03 2.98E+03 7.07E+01 7.73E+01Co-60 2.05E+02 2.25E+02 1.76E+02 1.88E+02 3.31E+01 3.13E+01Ag-110m 7.52E+02 7.58E+02 8.52E+02 6.69E+02 5.67E+02 5.72E+02Sb-124 1.99E+04 2.03E+04 2.06E+04 2.13E+04 5.28E+01 4.49E+01Re-188 4.89E+02Sb-125 5.31E+03 5.27E+03 5.39E+03 5.33E+03 2.29E+01 1.10E+01I-131 9.53E+01 9.49E+01 1.01E+02 8.81E+01 2.59E+00 3.35E+00
Totalt 2.99E+04 3.03E+04 3.04E+04 3.15E+04 7.53E+02 7.44E+02
21

Appendix 8
GTM date Type of water Total activity Gaseous act. Total act. Gaseous act. % separation Total act. Gaseous act. % separation
2002-12-18 A 6260 2880 4750 1270 56%2003-01-21 B 6840 65502003-02-19 A 2110 2070 470 415 80%2003-04-04 A 12200 10780 1360 0 100%2003-04-10 A 21500 17990 419 2 100%2003-05-12 A 6720 1220 2780 0 100%2003-09-24 3880 32602003-10-08 A 6040 720 4770 230 68%2003-11-20 A 1810 1206 926 257 79%2004-02-10 A 2250 800 1700 340 58%2004-02-25 A 2840 2268 962 418 82%2004-04-23 6570 5130 1310 1048 80%2004-05-03 A 7390 6633 2040 1495 77% 767 215 97%2004-05-03 A 8260 7190 3050 1940 73% 1770 680 91%2004-05-03 A 16600 14410 2220 650 95% 1510 10 100%
Before GTM After GTMAfter one membrane
1

Appendix 9
Date Time SP 100 SP 111 SP 300 SP 302 A SP 302 b SP 302 C SP 303 SP 304 SP 600 SP 500 SP 411
In prefilterUt prefilter Feed RO Perm RO1 Perm RO2 Perm NF conc.
collecting perm
Perm before ix
Perm after ix
conc after ix
conc after filt.
HUT 32002-12-12 11:45 Boron 1039 716 966 1198 3581 1002 9942002-12-12 11:45 Tot act. 10 300 147 306 67 520 000 160 3.6
2002-12-13 10:45 Boron 1035 3538 1010
2002-12-16 14:45 Boron 1035 700 944 1201 3420 1005 9982002-12-16 14:45 Tot act 11 300 124 394 86 188 0
HUT 12002-12-18 10:55 Tot act. 422 0
2002-12-18 14:35 Boron 596 601 608 409 571 791 2441 614 6262002-12-18 14:35 Tot act 5 350 3 338 3 480 190 382 317 311 000 211 0.79
HUT 32003-01-15 12:30 Tot act 8 370 127 341 208 1 050 000 222 2 650
MT 1 WHT part WHT filt2003-01-20 12:30 Tot act 19 100 3 6302003-01-21 14:40 Boron 369 365 246 340 358 360 3020??2003-01-21 14:40 Tot act 6 840 6 550 38.6 90.5 923 000 593 7.63 621 46.2
HUT 22003-02-19 13:20 Boron 434 433 308 430 532 1239 426 17862003-02-19 13:20 Tot act 39.9 54.8 14.6 24.9 43 4 550 13.2 2 930 424
HUT 32003-03-11 15:45 Boron 448 1 2462003-03-11 16:45 Boron 428 452
2003-03-12 12:45 Tot act 9.8 9 000 38.2 3.92 176
1

Appendix 9
Date Time SP 100 SP 111 SP 200 SP 201 SP 202 SP 300 SP 302 A SP 302 b SP 302 C SP 303 SP 304 SP 600 SP 500 SP 411 SP 700
In prefilterOut prefilter In GTM Out GTM1 Out GTM2 Feed RO Perm RO1 Perm RO2 Perm NF Conc.
Collecting perm
Perm before ix
Perm after ix
Conc after ix
after filtr
HUT 1 ?2003-03-17 13:30 Tot act. 1 400 13.7
MT 12003-03-19 17:15 Boron 221 323 400 1022 315 315 11272003-03-19 17:15 Tot act. 15.6 36.1 63.2 186 000 30.5 2.5 886
HUT 32003-0404 08:40 Tot act. 1 420 1 360 138 000 156 3.9
HUT 12003-04-10 11:00 Tot act. 3 510 417 51 200 83.8 3.05 29.6 24.5
MT1 (WHT)2003-05-06 13:10 Boron 183 127 181 228 613 180
Tot act. 4 970 3 960 10.9 25.7 18.5 85 200 18.7 9.19 15 300 584
HUT 12003-05-12 08:20 Boron 9.9 9.9 7.7 10 11 25 9.9
Tot act. 5 500 2 780 90.9 225 286 14 300 195 9.9 8 510 302
MT1(WHT)2003-06-24 14:00 Tot act. 9 690 9 780 127 337 29 500 35 000 16 600 15 000 88 300 67 300
Boron solution2003-08-13 11:00 Boron 1 500 530 711 3355 1 800
MT1(WHT)2003-09-24 15:00 Tot act. 3 880 3 260 177 680 182 84 800 525 28.5
HUT 22003-10-08 08:00 Boron 1092 1094 819 1125 1248 3732 1078 1086
Li 1.68 1.65 1.46 1.92 1.31 15.2 1.8 125Tot act. 5 320 4 540 107 345 413 322 000 315 25.8
HUT 22003-10-08 13:55 Boron 1090 813 1136 1251 3766
Li 1.65 1.3 1.93 1.31 16.55Tot act. 3 580 98.7 36.4 478 276 000
HUT 22003-10-08 15:05 Boron 850 1152 1147 4068
2

Appendix 9
Date Time SP 100 SP 111 SP 200 SP 201 SP 202 SP 300 SP 302 A SP 302 b SP 302 C SP 303 SP 304 SP 600 SP 500 SP 411 SP 700
In prefilterOut prefilter In GTM Out GTM1 Out GTM2 Feed RO Perm RO1 Perm RO2 Perm NF Conc.
Collecting perm
Perm before ix
Perm after ix
Conc after ix
after filtr
Li 1.56 2.35 1 22.2 0.042Tot act. 102 371 299 290 000
HUT 12003-11-28 15:25 Tot act. 1 810 926 311 365 259 19 200 367 1 170
Tot excl. 604 669 39 82 0.4 19 200 102 891
HUT 22004-02-10 13:20 Tot act. 3 180 2 250 1 710 2 000 309 381 350 50 600 240
Tot excl. 2 110 1 450 1 360 1 720 48 96 51 50 600 4.7
HUT 22004-02-25 11:30 Tot act. 3 420 2 840 962 1 060 520 594 553 11 600 531
Tot excl. 690 572 544 567 11.5 41.6 7.5 11 200 0.87
apr-04 Exchange to NF
HUT 12004-04-07 09:55 Tot act. 1 980 1 110 1 440 1 410
Tot excl. 635 40 80 25
HUT 12004-04-23 08:30 Tot act. 6 570 1 310 1 060 1 110 1 000 31 000 1 040 1 010
Tot excl. 1 440 262 32.4 110 25.8 30 500 57.2 3.7
HUT 12004-05-05 08:10 Tot act. 7 390 2 040 767 698 193 142 82.3 46 700 207 165
Tot excl. 757 545 552 336 34 54 21 46 700 39 10.2Tot gas 6 640 1 500 216
HUT 12004-05-07 08:30 Tot act. 8 260 3 050 1 770
Flow 1500 L/h Tot excl. 1 070 1 110 1 090Tot gas 7 180 1 940 677
08:55 Tot act. 16 600 2 220 1 510Flow 600 L/h Tot excl. 2 190 1 570 1 500
Tot gas 14 400 655 1.7
WHT before Batman2004-05-17 04:00 Tot act. 8 900
Tot excl. 8 900
3
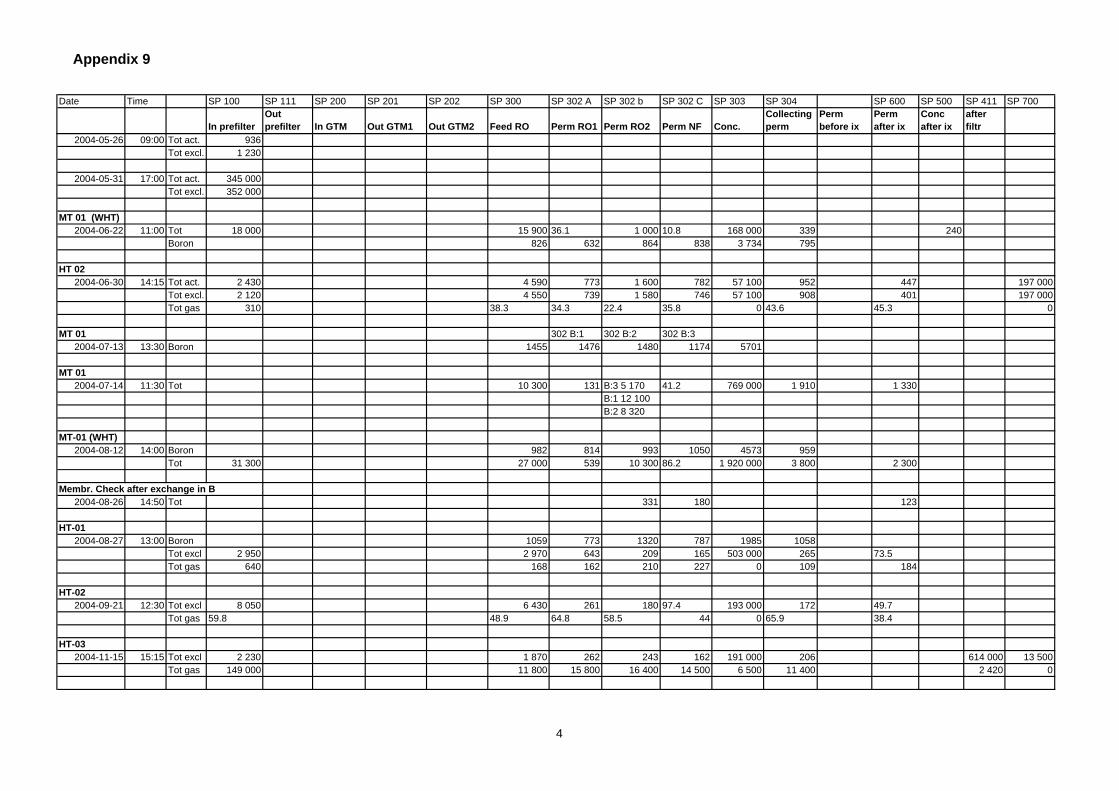
Appendix 9
Date Time SP 100 SP 111 SP 200 SP 201 SP 202 SP 300 SP 302 A SP 302 b SP 302 C SP 303 SP 304 SP 600 SP 500 SP 411 SP 700
In prefilterOut prefilter In GTM Out GTM1 Out GTM2 Feed RO Perm RO1 Perm RO2 Perm NF Conc.
Collecting perm
Perm before ix
Perm after ix
Conc after ix
after filtr
2004-05-26 09:00 Tot act. 936Tot excl. 1 230
2004-05-31 17:00 Tot act. 345 000Tot excl. 352 000
MT 01 (WHT)2004-06-22 11:00 Tot 18 000 15 900 36.1 1 000 10.8 168 000 339 240
Boron 826 632 864 838 3 734 795
HT 022004-06-30 14:15 Tot act. 2 430 4 590 773 1 600 782 57 100 952 447 197 000
Tot excl. 2 120 4 550 739 1 580 746 57 100 908 401 197 000Tot gas 310 38.3 34.3 22.4 35.8 0 43.6 45.3 0
MT 01 302 B:1 302 B:2 302 B:32004-07-13 13:30 Boron 1455 1476 1480 1174 5701
MT 012004-07-14 11:30 Tot 10 300 131 B:3 5 170 41.2 769 000 1 910 1 330
B:1 12 100B:2 8 320
MT-01 (WHT)2004-08-12 14:00 Boron 982 814 993 1050 4573 959
Tot 31 300 27 000 539 10 300 86.2 1 920 000 3 800 2 300
Membr. Check after exchange in B2004-08-26 14:50 Tot 331 180 123
HT-012004-08-27 13:00 Boron 1059 773 1320 787 1985 1058
Tot excl 2 950 2 970 643 209 165 503 000 265 73.5Tot gas 640 168 162 210 227 0 109 184
HT-022004-09-21 12:30 Tot excl 8 050 6 430 261 180 97.4 193 000 172 49.7
Tot gas 59.8 48.9 64.8 58.5 44 0 65.9 38.4
HT-032004-11-15 15:15 Tot excl 2 230 1 870 262 243 162 191 000 206 614 000 13 500
Tot gas 149 000 11 800 15 800 16 400 14 500 6 500 11 400 2 420 0
4

Appendix 9
Date Time SP 100 SP 111 SP 200 SP 201 SP 202 SP 300 SP 302 A SP 302 b SP 302 C SP 303 SP 304 SP 600 SP 500 SP 411 SP 700
In prefilterOut prefilter In GTM Out GTM1 Out GTM2 Feed RO Perm RO1 Perm RO2 Perm NF Conc.
Collecting perm
Perm before ix
Perm after ix
Conc after ix
after filtr
HT-032004-11-23 08:05 Tot excl 3 400 2 420 91 300 914 6 800
Tot gas 293 000 29 900 28 200 24 800 39 400
5

Appendix 9
Concentrate treatment T304 SP405 SP402 SP500 SP7006L ion exchange
After ion exchange
Date Time Analyse
HUT2 from31008
2003-11-04 15:40 Tot 186 000 2 21016:25 201 000 2 320
HT2 from 31119
2003-11-24 10:13 Tot 17 000 64 400 512Tot excl.g 17 000 64 400 501
Various fr. 1 m3 t.2003-11-24 10:13 xxx
Run through permeate ix SP 500 !!
HT 1 from 031128-292003-12-16 12:50 Tot 29 900 30 400 753
15:05 Tot 30 300 31 500 744
Concentrate from ?2004-03-04 10:30 Tot 14 400 3 360
11:20 Tot 14 300 2 820
Concentrate from ?2004-04-06 11:00 Tot 16 000 10 300 2 110
Konc from HT1 12 20 L/h andl 13:15 flow 60 L/h2004-04-27 12:00 Tot 26 600 4 860
Tot excl 26 500 4 78013:15 Tot 25 100 4 220
Tot excl 25 100 4 130
Konc HT1 + some WHT2004-05-18 10:20 Tot 76 900 12 200
Tot excl 74 100 12 100
Concentrate sample from HT 01 April 20042004-06-07 11:15 Tot 49 600
Konc HT 01 + WHTKonc HT 01 + WHT
14:10 Tot
Konc HT 01 + WHT2004-06-16 14:10 Tot 79 700 68 900 51 600
Konc HT 01 + WHT2004-06-18 13.30 Tot 36 700 49 200 6 470
Konc HT 01 + WHT2004-07-07 14:15 Tot 505 000 404 000
Konc HT 01 + WHT T 2012004-07-15 13:30 Tot 186 000 170 000 107 000
6

Appendix 10
Water Date Analyse Feed RO Permeate A Permeate B Permeate CBq/kg Bq/kg Red % Bq/kg Red % Bq/kg Red %
HUT 1 2003-12-18 Cr-51Co-58 72 3,2 95,6 11,8 83,6 11,8 83,6Co-60Ag-110mSb-124 1 160 33 97,2 107 90,8 107 90,8Sb-125 385 8,5 97,8 27 93,0 27 93,0Tot act. 3 480 190 94,5 382 89,0 382 89,0
HUT 3 2003-01-15 Cr-51Co-58 106 9,5 91,0 34 67,9 99 6,6Co-60Ag-110m 311 0,9 99,7Sb-124 5 790 79 98,6 212 96,3 51 99,1Sb-125 2 100 28 98,7 78 96,3 16 99,2Tot act. 8 370 127 98,5 341 95,9 208 97,5
MT 1 2003-09-24 Cr-51Co-58 789 152 80,7 611 22,6 166 79,0Co-60 177 4,3 97,6 15,9 91,0 4,6 97,4Ag-110m 1 160 3,1 99,7 5 99,6 1,2 99,9Sb-124 696 6,1 99,1 18,5 97,3 7 99,0Sb-125Tot act. 3 260 177 94,6 680 79,1 182 94,4
HUT 2 2003-10-08 Cr-51Co-58 1 440 41,5 97,1 169 88,3 354 75,4Co-60 947 1,4 99,9 5,8 99,4 122 87,1Ag-110mSb-124 1 330 49 96,3 137 89,7 22,5 98,3Sb-125 184 5,9 96,8 17,6 90,4Tot act. 4 540 107 97,6 345 92,4 413 90,9
HUT 2 2004-02-10 Cr-51Co-58 746 17,8 97,6 50 93,3 20,2 97,3Co-60 152 2,2 98,6 3,4 97,8 1,4 99,1Ag-110mSb-124 407 5,9 98,6 14,8 96,4 4,6 98,9Sb-125 86 5,8 93,3 4 95,3Tot act. 1 720 47,5 97,2 96 94,4 50 97,1
HUT 2 2004-02-25 Cr-51Co-58 232 6,5 97,2 22,6 90,3 4,3 98,1Co-60 72 1,7 97,6 1,7 97,6 0,8 98,9Ag-110m 28,4 1,8 93,7 3,6 87,3 0,7 97,5Sb-124 120 1,3 98,9 2,5 97,9 1 99,2Sb-125Tot act. 567 11,5 98,0 41,6 92,7 7,5 98,7
1

Appendix 10
Water Date Analyse Feed RO Permeate A Permeate B Permeate CBq/kg Bq/kg Red % Bq/kg Red % Bq/kg Red %
HUT 1 2004-05-05 Cr-51Co-58 2,7 0,2 92,6 0,52 80,7 0,23 91,5Co-60 6,6 0,28 95,8 1,5 77,3 0,5 92,4Ag-110mSb-124 121 6,1 95,0 8,7 92,8 1,6 98,7Sb-125 13 1 92,5 2,2 83,5Tot act. 336 34 89,9 54 83,9 21 93,8
HUT 2 2004-06-30 Cr-51 281 27,1 90,4Co-58 1 650 209 87,33 746 54,8 110 93,3Co-60 254 5,2 97,95 43,4 82,9 3,1 98,8Ag-110m 198 5,1 97,42 46,8 76,4 3,2 98,4Sb-124 572 26,9 95,30 65,7 88,5 8,8 98,5Sb-125 366 10,3 97,19 36,2 90,1 2,7 99,3Tot act. 4 550 739 83,8 1 580 65,3 746 83,6
HUT 1 2004-08-27 Cr-51 120 16,2 86,5Co-58 57 119 -109,5 22,1 61,1 29,6 47,9Co-60 9,9 3,8 61,6 15,5 -56,6Ag-110m 57 35 38,6 42,1 26,1 32 43,9Sb-124 615 124 79,8 42,9 93,0 30 95,1Sb-125 2 110 342 83,8 84 96,0 72 96,6Tot act. 2 970 643 78,4 209 93,0 165 94,4
HUT 1 2004-09-21 Cr-51Co-58 1 830 44 97,6 78 95,7 25,5 98,6Co-60 532 11,4 97,9 21,7 95,9 7,4 98,6Ag-110m 94 5,5 94,1 3,4 96,4 5,8 93,8Sb-124 2 710 146 94,6 24,8 99,1 33 98,8Sb-125 439 26,2 94,0 6,6 98,5 7,2 98,4Tot act. 6 430 261 95,9 180 97,2 97 98,5
HUT 3 2004-11-15 Cr-51Co-58 289 5,9 98,0 15,4 94,7 3 99,0Co-60 205 2,7 98,7 7,3 96,4 1,2 99,4Ag-110m 385 3,1 99,2Sb-124 416 38,9 90,6 19,6 95,3 36,2 91,3Sb-125 159 33,2 79,1 17,8 88,8 31,6 80,1Tot act. 1 870 262 86,0 243 87,0 162 91,3
2

Appendix 11
Reduction of tot. activityDate Water
Flow Tot act Tot act Flow Tot act Tot act Share of Tot act Tot act Share of Total ofL/h Bq/kg k Bq/h L/h Bq/kg k Bq/h feed % Bq/kg k Bq/h feed % feed %
20021212 HUT 3 2500 10 300 25 750 31 520 000 16 120 63 160 395 1.5 64.120021218 HUT 1 2 500 3 480 8 700 25 311 000 7 775 89 210 520 6.0 95.320030115 HUT 3 2 500 8 370 20 925 12.5 1 050 000 13 125 63 220 547 2.6 65.320030120 MT 1 2 500 6 550 16 375 12.5 923 000 11 538 70 590 1468 9.0 79.420030219 HUT 2 2 500 55 138 12.5 4 500 56 41 25 62 45.2 86.120030404 HUT 3 2 000 1 360 2 720 10 138 000 1 380 51 160 318 11.7 62.420030506 WHT 2 500 3 960 9 900 12.5 85 200 1 065 11 20 50 0.5 11.320030512 HUT 1 2 400 2 780 6 672 12 143 000 1 716 26 195 466 7.0 32.720031008 HUT 1 500 4 540 6 810 7.1 322 000 2 286 34 315 470 6.9 40.520031128 HUT 1 2000 669 1 338 9.9 19 200 190 14 102 203 15.2 29.420040210 HUT 2 1900 1 720 3 268 9.2 50 600 466 14 350 662 20.3 34.520040225 HUT 2 567 0 11 200 0 #DIV/0! 20 0 #DIV/0! #DIV/0!20040423 HUT 1 1952 262 511 9.6 30 500 293 57 57 111 21.6 78.920040505 HUT 1 1797 336 604 7.6 46 700 355 59 39 70 11.6 70.320040622 WHT 1022 18 000 18 396 9.4 168 000 1 579 9 339 343 1.9 10.520040812 WHT 1453 27 000 39 231 7.8 1 920 000 14 976 38 3 800 5492 14.0 52.220040827 HUT 1 1999 2 970 5 937 9.9 503 000 4 980 84 265 527 8.9 92.820040921 HUT 2 1994 6 430 12 821 46.4 193 000 8 955 70 172 335 2.6 72.5
0 0 #DIV/0! 0 #DIV/0! #DIV/0!0 0 #DIV/0! 0 #DIV/0! #DIV/0!
Feed Concentrate Permeate
1
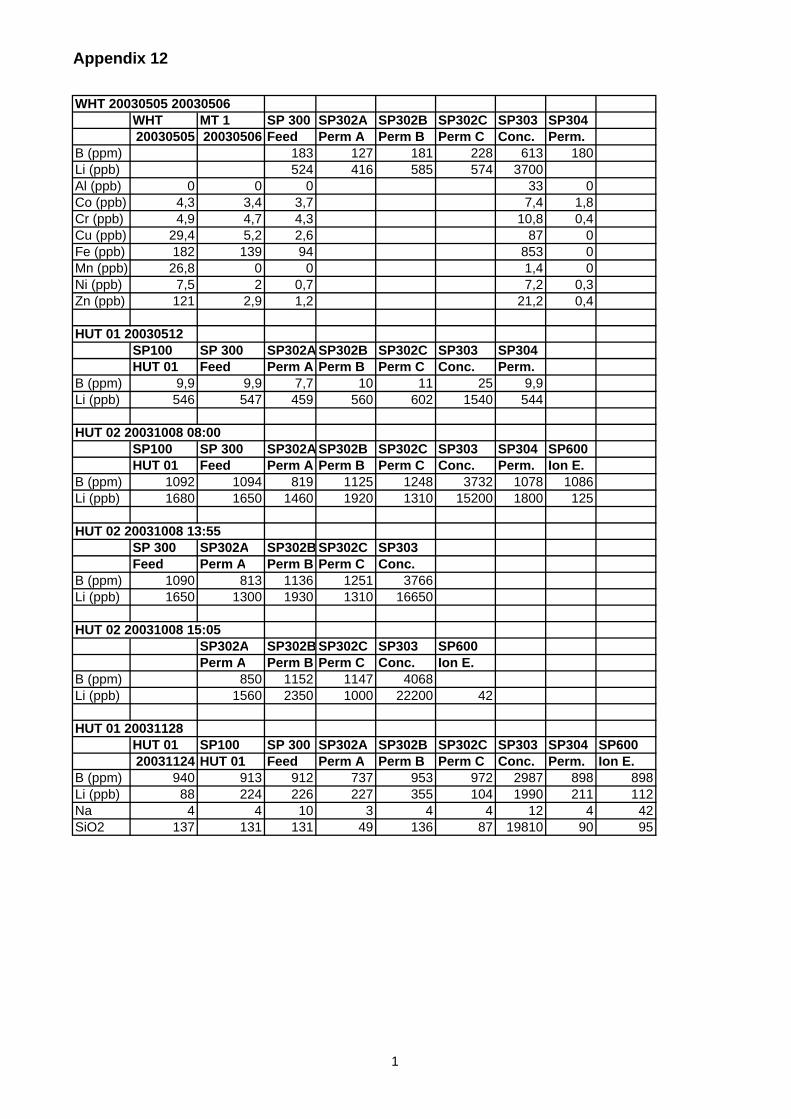
Appendix 12
WHT 20030505 20030506WHT MT 1 SP 300 SP302A SP302B SP302C SP303 SP30420030505 20030506 Feed Perm A Perm B Perm C Conc. Perm.
B (ppm) 183 127 181 228 613 180Li (ppb) 524 416 585 574 3700Al (ppb) 0 0 0 33 0Co (ppb) 4,3 3,4 3,7 7,4 1,8Cr (ppb) 4,9 4,7 4,3 10,8 0,4Cu (ppb) 29,4 5,2 2,6 87 0Fe (ppb) 182 139 94 853 0Mn (ppb) 26,8 0 0 1,4 0Ni (ppb) 7,5 2 0,7 7,2 0,3Zn (ppb) 121 2,9 1,2 21,2 0,4
HUT 01 20030512SP100 SP 300 SP302A SP302B SP302C SP303 SP304HUT 01 Feed Perm A Perm B Perm C Conc. Perm.
B (ppm) 9,9 9,9 7,7 10 11 25 9,9Li (ppb) 546 547 459 560 602 1540 544
HUT 02 20031008 08:00SP100 SP 300 SP302A SP302B SP302C SP303 SP304 SP600HUT 01 Feed Perm A Perm B Perm C Conc. Perm. Ion E.
B (ppm) 1092 1094 819 1125 1248 3732 1078 1086Li (ppb) 1680 1650 1460 1920 1310 15200 1800 125
HUT 02 20031008 13:55SP 300 SP302A SP302B SP302C SP303Feed Perm A Perm B Perm C Conc.
B (ppm) 1090 813 1136 1251 3766Li (ppb) 1650 1300 1930 1310 16650
HUT 02 20031008 15:05SP302A SP302B SP302C SP303 SP600Perm A Perm B Perm C Conc. Ion E.
B (ppm) 850 1152 1147 4068Li (ppb) 1560 2350 1000 22200 42
HUT 01 20031128HUT 01 SP100 SP 300 SP302A SP302B SP302C SP303 SP304 SP60020031124 HUT 01 Feed Perm A Perm B Perm C Conc. Perm. Ion E.
B (ppm) 940 913 912 737 953 972 2987 898 898Li (ppb) 88 224 226 227 355 104 1990 211 112Na 4 4 10 3 4 4 12 4 42SiO2 137 131 131 49 136 87 19810 90 95
1

Appendix 13
Test Operation Temp FeedConc. Flow Comments
Acc volume
time (h) C Start Stop L/h Start Stop Volume Start Stop A B C A B C2002-12-12 02:42 19.7 - - 2498 - - 6.2 20.0 20.0 672.838 745.72 1053.98 2.2 3.1 4.7 6.22002-12-13 ca 02:00 - - - - 5.0 - - - - - - - - 11.22002-12-16 00:00 - - 2490 - - ca 1.6 - - 672.519 732.471 1059.76 - - - 12.82002-12-18 01:56 20.3 - - 2493 - - 5.0 20.0 18.4 778.748 843.645 844.169 1.8 2.9 7.9 17.82002-12-19 01:04 - - - - 2.7 18.4 18.4 781.384 859.303 840.674 2.0 3.1 8.1 20.52002-12-19 01:00 26.1 - - 2502 - - 2.5 - - 847.499 910.412 720.479 - - - 23.02003-01-09 03:10 19.5 - - 2513 - - 7.9 18.6 23.3 801.299 837.575 829.978 2.9 4.0 10.5 30.92003-01-10 06:15 - - - - - - 15.6 - - - - - - - - 46.52003-01-13 01:55 - - - - - - 4.8 - - - - - - - - 51.32003-01-14 06:35 - - - - - - 16.5 - - - - - - - - 67.82003-01-15 06:56 21.5 - - 2501 102.9 120.3 17.4 22.2 21.7 773.138 844.193 858.297 2.5 3.6 - 85.22003-01-20 06:02 18.5 - - 2504 120.3 134.1 13.8 22.0 20.6 776.602 858.061 840.446 2.5 3.7 9.7 99.02003-01-21 02:20 - - - - 134.1 - 4.7 - - - - - - - - 103.72003-01-21 02:05 - - - - - - 5.2 - - - - - - - - 108.92003-02-14 05:28 19.5 2499 - - 13.7 19.3 19.9 768.693 861.866 835.845 2.9 4.1 9.9 122.62003-02-17 07:02 20.2 2502 17.6 19.2 18.1 783.3 867.6 827.6 2.8 4.1 9.7 140.22003-02-18 04:08 22.2 2501 10.3 17.5 17.3 798 881.9 806.4 2.8 4.0 9.2 150.52003-02-19 03:40 23.4 2500 9.2 16.8 16.4 794.7 887 793.9 2.7 3.9 8.9 159.72003-02-20 07:25 - - ca 18.5 - - - - - - - - 178.22003-02-21 05:10 - - ca 12.9 - - - - - - - - 191.1
2003-03-05 00:00 - - - - - - - - - - -Membrane cleaning 191.1
2003-03-10 01:06 26.5 2603 2.9 12.4 14.2 908.7 872.1 791.9 3.3 5.9 8.6 193.92003-03-11 11:18 24.4 2456 27.8 15.4 16.3 826 814.7 802.5 3.0 5.5 8.7 221.72003-03-11 14:34 25.4 2500 36.4 16.3 15.9 843.2 835 811.7 2.9 5.5 8.6 258.22003-03-12 44:24 27 2250 99.9 13.5 11.4 760.3 741.6 767.4 2.2 4.2 6.9 358.12003-03-14 01:00 21.8 2249 2.2 15.0 16.3 733.2 712 781.9 2.4 4.4 7.6 360.32003-03-17 21:50 - - ca 54.6 - - - - - - - - 414.92003-03-19 08:05 20.3 2404 19.4 - - 805.7 740.4 840.5 2 4.3 8 434.32003-03-19 10:41 24.8 2489 26.6 19 16.1 850.5 789.7 851.9 2.1 4.5 8.3 460.92003-03-20 07:40 - - ca 19.2 - - - - - - - - 480.12003-03-20 00:36 26.5 2497 1.5 15.8 15.7 845.2 787 855.6 1.9 4.3 7.9 481.62003-03-20 12:46 - - ca 31.9 - - - - - - - - 513.52003-03-21 24:25 - - ca 61.0 - - - - - - - - 574.52003-03-22 01:45 - - ca 4.4 - - - - - - - - 578.92003-03-31 00:00 - - - - - - - - - - - 578.92003-04-02 41:22 31.7 2002 82.8 12.2 9.9 703.1 643.1 641.4 2.5 4.2 6.1 661.82003-04-06 66:58 32.5 2004 132.2 10.5 13.5 701 639.8 650.7 2.6 4.3 6.2 794.02003-04-10 36:46 39.1 2347 86.3 - - 955.5 773.6 620.6 4.3 6.6 8.5 880.2
BATMAN Driftsdata Nr. Period
Pressure drop Sum flow m3 Filtr.pressure bar. Permeate flow L/h Permeate pressure. bar
1

Appendix 13
Test Operation Temp FeedConc. Flow Comments
Acc volume
time (h) C Start Stop L/h Start Stop Volume Start Stop A B C A B C
BATMAN Driftsdata Nr. Period
Pressure drop Sum flow m3 Filtr.pressure bar. Permeate flow L/h Permeate pressure. bar
2003-04-14 13:02 32.7 2005 1060 26.1 - 10.6 691.8 635.2 662.4 2.3 4.1 5.8 906.42003-04-15 03:18 32.7 2004 6.6 9.4 9.8 681.3 640.8 663.1 1.5 3.2 4.9 913.02003-04-16 01:04 27.6 1997 2.1 10.7 10.4 699.1 612.6 687 1.5 3.1 5.2 915.12003-04-16 16:16 30.5 1998 32.5 10.3 10.4 683.9 628.5 674 1.8 3.5 5.3 947.62003-04-29 48:40 37.7 2001 97.4 8.2 8.4 738 648.6 610.8 1.5 3.3 4.6 1045.02003-05-05 01:00 - - ca 2 - - - - - - - - 1047.02003-05-06 11:44 23.4 2499 29.3 16.5 20 952 768.3 760.9 4.1 6.5 10.2 1076.32003-05-07 31:44 34.5 2374 75.3 15.1 13.1 866.1 763.8 745.7 3.9 6.2 8.5 1151.62003-05-08 87:58 39.4 2399 211.0 12.9 13.5 887.234 782.194 725.084 4.1 6.5 8.5 1362.72003-05-12 14:38 - - ca 15 - - - - - - - - 1377.72003-05-15 08:58 33.2 2027 18.2 10.1 10 701.3 647.8 678.9 2.1 3.8 5.6 1395.82003-05-20 16:20 23.6 1398 22.8 13.2 11.9 473.403 461.989 457.859 4.1 4.6 6.9 1418.72003-05-22 59:36 35.9 1774 105.7 9.9(1400) 13.4(1850 425.5 513.4 804 3.7 4 3.5 1524.42003-05-28 09:15 - 2000 18.5 - - - - - - - - 1542.92003-05-29 02:52 25.1 1994 5.7 19.6 20 587.5 609.5 794.3 0.8 1 3.8 1548.62003-05-29 01:16 25 1494 1.9 14.1 13.7 427.606 447.124 611.11 0.2 0.4 1.9 1550.5
2003-06-03 00:00Membrane cleaning 1550.5
2003-06-05 25:00 27 2155 53.9 559 598 862 2.5 4.4 6.2 1604.42003-06-16 08:46 30.2 1859 16.3 34.2 42 578 512 768 2.2 3.7 5.1 1620.72003-06-17 24:16 30.7 0.08 0.08 1202 29.2 25 30.7 359 310 501 0.4 1.2 1.5 1649.92003-06-24 10:31 31.8 1476 15.5 355 351 759 3.9 4.2 11.6 1665.4
2003-06-27 01:00 - - - - - - - - - - - - - - - - #VALUE!2003-08-13 ######### - - - - - - - - - - - - - - - - #VALUE!2003-09-01 ######### - - - - - - - - - - - - - - - - #VALUE!2002-09-02 ######### - - - - - - - - - - - - - - - - #VALUE!2003-09-03 ######### - - - - - - - - - - - - - - - - #VALUE!2003-09-16 #VALUE! 24.8 1330 30.9 17.5 17.5 ? ? 349 2.6 5.3 8.5 106 1696.32003-09-23 #VALUE! 25.4 1498 20.4 25.5 25.4 515 466 507 0.2 4.6 10.5 7.5 1716.72003-10-05 30:32 26.4 1499 46 22.2 19 498 451 481 0.3 4.5 9.7 29.7 1762.7
2003-10-08(I) 17:04 25.9 1501 25.6 19 26.2 485 450 523 0.21 4.3 11.5 7.1 1788.32003-10-08(II) 05:52 25.4 1699 10.0 30.9 30.5 567 504 595 0.5 5.7 14.3 8.4 1798.32003-10-08(III) 01:04 25.5 2097 2.2 30.5 30.3 507 567 934 1.9 3.1 3.1 10.2 1800.5
2003-10-08 - - - - - - - - - - - - - - - - - #VALUE!2003-11-03 - - - - - - - - - - - - - - - - - #VALUE!2003-11-04 - - - - - - - - - - - - - - - - - #VALUE!2003-11-05 03:31 25 2028 7.1 29.5 29.5 545.7 598.8 818.0 2.6 3.9 8.3 10.2 1807.62003-11-19 77:52 2002 155.8 19.8 19.2 563.5 634.5 778.2 3.1 4.5 8.2 8.0 1963.42003-11-22 23:46 1999 47.5 17.8 21.8 577.2 622.2 781.4 3.7 7.5 20.2 7.9 2010.9
2

Appendix 13
Test Operation Temp FeedConc. Flow Comments
Acc volume
time (h) C Start Stop L/h Start Stop Volume Start Stop A B C A B C
BATMAN Driftsdata Nr. Period
Pressure drop Sum flow m3 Filtr.pressure bar. Permeate flow L/h Permeate pressure. bar
2003-11-28 26:55 24.9 1999 53.8 26.5 24.8 528.5 599.8 855.4 3.4 7.8 24.9 9.9 2064.72003-11-29 04:52 28 2005 9.7 25 24.5 539 609 844 2.2 3.5 7.8 9.9 2074.42003-12-04 24:55 - - - - - - 47 - - - - - - - - - 2121.42003-12-05 4? - - - - - - 9 - - - - - - - - - 2130.42003-12-06 15:00 21.4 1899 30.9 25.6 31.2 613 551 714 2.4 3.6 7.6 9.6 2161.32003-12-15 - - - - - - - - - - - - - - - - - Exchange of IX
2004-02-10 01:40 20.1 1900 2372.5 2375.8 3.2 31.5 32.7 477 577 643 0.4 0.78 5.3 9.2 2164.52004-02-21 28:12 22.3 1501 2375.8 2418.4 42.3 20.3 19.6 496 456 543 0.9 1.3 3.8 7.1 2206.82004-03-02 30:40 24.9 2000 61.3 21.6 21.8 574 652 744 1.4 1.8 6.2 10.0 2268.12004-03-16 67:00 1999 2613.9 133.9 17.8 - - - - - - - - 2402.02004-03-26 12:35 2006 25.2 - - - - - - - - - 2427.22004-03-29 39:40 25.5-29.1 2000.5 79.4 24.0 18.0 562.9 653.2 758.3 1.4 1.9 6.2 9.9 2506.62004-03-31 10:55 22.9-25.2 2003 2828.9 21.9 24.0 21.9 566.7 643.7 760.6 1.4 1.9 6.4 10.0 2528.52004-04-05 00:12 25.1 2024 16.6 645.0 640.1 698.1 1.4 1.9 6.0 19.9 2528.52004-04-06 00:08 22.6 2018 14.9 636.5 616.0 723.4 1.5 10.2 2.7 20.02004-04-06 00:16 24 2011 13.8 607.6 702.5 660.4 1.5 9.3 2.7 19.9 2528.52004-04-07 01:48 27 2046 3.6 13.5 13.3 551.3 767.7 700.7 1.5 8.7 2.7 14.3 2532.12004-04-21 00:00 - 2004 - - - - - - - - - 2532.12004-04-22 05:48 25.5 1881 10.5 17.0 15.5 538.9 738.7 687.4 1.5 8.9 2.7 9.8 2542.62004-04-22 00:00 - 2000 - - - - - - - - - 2542.62004-04-23 39:40 32 1952 77.4 13.3 12.2 490.9 737.1 675.1 1.6 7.9 2.8 9.6 2620.02004-04-28 1997 13.8 14.7 514.0 679.0 719.0 0.3 10.7 3.3 20.22004-04-29 23.6 1994 679.0 646.0 591.0 1.8 10.6 5.0 9.52004-04-29 16:15 - - 3008.5 32.5 - - - - - - - - - 2652.52004-04-30 18:25 - - 36.8 - - - - - - - - - 2689.32004-05-02 03:01 - - 6.7 - - - - - - - - - 2696.02004-05-02 23:00 35.5 1501 3119.2 34.5 8.8 8.3 425.0 556.5 479.5 1.3 5.6 3 7.2 2730.5
2004-05-04 25:25 36.4 1797 45.7 8.8 503.0 604.0 457.0 1.4 6.0 3.3 7.6
Varying feed flow. average values calculated on a smaller share 2776.2
2004-05-06 33:10 36.9 1500 49.8 8.1 8 459.3 551.9 451.1 1.3 5.5 3.0 7.1 2826.0
2004-05-08 72:10 40.8 1710 3333.4 123.4 7.6 7.5 564.6 654.5 685.0 1.3 5.8 4.3 7.5
Varying feed flow. average values calculated on a smaller share 2949.4
2004-05-12 05:25 2949.4
3

Appendix 13
Test Operation Temp FeedConc. Flow Comments
Acc volume
time (h) C Start Stop L/h Start Stop Volume Start Stop A B C A B C
BATMAN Driftsdata Nr. Period
Pressure drop Sum flow m3 Filtr.pressure bar. Permeate flow L/h Permeate pressure. bar
2004-05-14 49:00 2949.42005-05-17 ######### 2949.42005-05-18 ######### 2949.42004-05-18 04:03 2949.42004-05-18 ######### 2949.41900-01-00 20:00 2949.42004-06-01 12:47 25 1999.9 25.6 18.3 22 519.0 847.4 584.5 2.1 9.9 4.8 9.8 2975.02004-06-05 ######### 2975.02004-06-05 12:55 2975.02004-06-06 00:21 2975.02004-06-06 07:40 26.5 1999 15.3 32.9 42 552.9 846.6 573.5 2.3 10.1 5.1 10.1 2990.32004-06-08 02:15 2990.32004-06-08 01:20 2990.32004-06-08 13:35 2990.32004-06-10 16:25 2990.32004-06-10 03:20 28.1 1600.4 5.3 30.5 31.1 414.6 597.0 554.1 1.8 6.9 3.6 9.2 2995.61900-01-00 11:50 2995.62004-06-12 03:50 2995.62004-06-12 08:12 29.4 1600 13.1 30.9 42 448.0 589.2 526.3 1.8 6.8 3.5 9.4 3008.72004-06-13 05:40 3008.7
2004-06-13 15:22 29.7 1199 18.4 30.5 31.5 808.9 372.7 1.3 4.4 2.3 9.3
Permeate flow A = sum Permeate flow A+C 3027.1
2004-06-14 01:00 3027.12004-06-14 00:25 3027.12004-06-14 00:45 3027.1
2004-06-14 00:50 28.1 1201 1 39.5 41.2 819.7 381.6 1.2 4.2 2.3 9.7
Permeate flow A = sum Permeate flow A+C 3028.1
2004-06-15 05:16 28.3 1160 6.1 38 38 839.5 321.9 1.2 1.9 1.4 9.2
Permeate flow A = sum Permeate flow A+C 3034.2
2004-06-18 00:16 28.4 1901 37.7 472.4 795.0 646.4 2.3 3.2 2.6 9.3733 after cleaning 3034.2
2004-06-18 00:12 28.8 1998 28.8 493.9 832.5 679.0 2.5 3.4 2.8 14.3After several rinses 3034.2
4

Appendix 13
Test Operation Temp FeedConc. Flow Comments
Acc volume
time (h) C Start Stop L/h Start Stop Volume Start Stop A B C A B C
BATMAN Driftsdata Nr. Period
Pressure drop Sum flow m3 Filtr.pressure bar. Permeate flow L/h Permeate pressure. bar
2004-06-19 00:10 3034.22004-06-19 ######### 3034.2
2004-06-19 00:12 22.1 1250 0.25 41.1 42 791.6 459.4 1.6 2.2 1.8 9.2
Permeate flow A = sum Permeate flow A+C 3034.4
2004-06-20 12:54 24.8 981 12.7 35 35 622.3 355.8 1.1 1.6 1.2 10.0
Permeate flow A = sum Permeate flow A+C 3047.1
2004-06-22 00:45 3047.12004-06-22 00:30 3047.12004-06-22 01:58 3047.12004-06-22 16:35 28.5 1022 16.9 35 35 320.903 361.1 329.9 1.2 1.8 1.3 9.4 3064.02004-06-23 ######### 3064.02004-06-24 ######### 3064.02004-06-24 01:40 3064.02004-06-24 ######### 3064.02004-06-24 ######### 3064.02004-06-24 ######### 3064.02004-06-24 ######### 3064.02004-06-25 01:20 3064.02004-06-25 ######### 3064.0
2004-06-26 01:20 28.4 844 1.1 35 35.0 825.5 0.8 1.3 0.9 9.8
Permeate flow A = sum Permeate flow A+C 3065.1
2004-06-30 00:04 26.7 1453 23.9 179.6 295.2 948.5 0.4 1.0 0.7 97.9Rinse with 733 after cleaning 3065.1
2004-06-30 00:12 28.5 2438 35.1 535.3 686.6 1032.7 2.5 3.3 3.3 147.7Further rinse with 733 3065.1
2004-06-30 ######### 3065.12004-06-30 ######### 3065.12004-06-30 ######### 3065.12004-06-30 ######### 3065.12004-07-02 46:40 27.9 1169 54.5 35 - - 493.518 1.1 1.6 1.3 11.3 3119.62004-07-05 47:02 28.7 1016 47.8 35 - - 393.5 1.0 1.5 1.2 9.5 3167.42004-07-07 12:15 29 955 11.7 35 - - - 1.1 1.6 1.2 9.5 3179.12004-07-08 26:22 30.6 1043 27.5 35 - - - 1.1 2.0 1.3 9.6 3206.6
5

Appendix 14
DateType Pressu Flow Perm Filt press Flux Flow Perm Filt pressuFlux Flow Perm Filt press Flux
Bar L/h pressure BBar L/m2.h.barL/h pressure BBar L/m2.h.barL/h pressure Bar L/m2.h.bar2002-12-12 HUT3 20 672 2.2 17.8 1.66 745 3.1 16.9 1.93 1054 4.7 15.3 3.022002-12-18 HUT3 18.4 779 1.8 16.6 2.06 843 2.9 15.5 2.39 844 7.9 10.5 3.532002-12-19 HUT1 18.4 781 2 16.4 2.09 859 3.1 15.3 2.46 840 8.1 10.3 3.582003-01-09 HUT3 23.5 801 2.9 20.6 1.71 838 4 19.5 1.88 830 10.5 13 2.802003-01-15 HUT3 22 773 2.5 19.5 1.74 844 3.6 18.4 2.01 858 9.7 12.3 3.062003-01-20 HUT1 21 776 2.5 18.5 1.84 858 3.7 17.3 2.18 840 9.7 11.3 3.262003-02-14 HUT2 19.4 768 2.9 16.5 2.04 862 4.1 15.3 2.47 836 9.9 9.5 3.862003-02-17 HUT2 19.2 783 2.8 16.4 2.09 867 4.1 15.1 2.52 828 9.7 9.5 3.822003-02-18 HUT2 17.2 798 2.8 14.4 2.43 882 4 13.2 2.93 806 9.2 8 4.422003-02-19 HUT3 16.4 795 2.7 13.7 2.55 887 3.9 12.5 3.11 794 8.9 7.5 4.64
2003-03-10 7 33 14.1 909 3.3 10.8 3.69 872 5.9 8.2 4.66 791 8.6 5.5 6.31Citric acid cleaning
2003-03-11:1 HUT3 16.3 826 3 13.3 2.72 815 5.5 10.8 3.31 802 8.7 7.6 4.632003-03-11:2 HUT3 16 843 2.9 13.1 2.82 835 5.5 10.5 3.49 812 8.6 7.4 4.81
2003-03-12 HUT3 13.2 760 2.2 11 3.03 742 4.2 9 3.62 767 6.9 6.3 5.342003-03-14 HUT1 16 733 2.4 13.6 2.36 712 4.4 11.6 2.69 782 7.6 8.4 4.082003-03-19 WHT 17.2 850 2.1 15.1 2.47 790 4.5 12.7 2.73 852 8.3 8.9 4.202003-03-20 HUT1 15.7 845 1.9 13.8 2.69 787 4.3 11.4 3.03 787 7.9 7.8 4.432003-04-02 HUT3 10.8 703 2.5 8.3 3.71 643 4.2 6.6 4.27 641 6.1 4.7 5.982003-04-06 HUT1 10.7 701 2.6 8.1 3.80 640 4.3 6.4 4.39 651 6.2 4.5 6.352003-04-14 MT1 10.6 692 2.3 8.3 3.66 635 4.1 6.5 4.28 662 5.8 4.8 6.052003-04-15 9.4 681 1.5 7.9 3.78 640 3.2 6.2 4.53 663 4.9 4.5 6.462003-04-16 10.8 699 1.5 9.3 3.30 612 3.1 7.7 3.49 687 5.2 5.6 5.382003-04-16 HUT3 10.3 684 1.8 8.5 3.53 628 3.5 6.8 4.05 674 5.3 5 5.912003-04-29 HUT1 8.2 738 1.5 6.7 4.83 649 3.3 4.9 5.81 611 4.6 3.6 7.442003-05-06 MT1 19.5 952 4.1 15.4 2.71 768 6.5 13 2.59 761 10 9.5 3.512003-05-07 HUT1 13.8 866 3.9 9.9 3.84 763 6.2 7.6 4.40 745 8.5 5.3 6.172003-05-08 HUT1 13 887 4.1 8.9 4.37 782 6.5 6.5 5.28 725 8.5 4.5 7.072003-05-15 HUT1 9.8 701 2.1 7.7 3.99 648 3.8 6 4.74 679 5.6 4.2 7.092003-05-20 MT1 12 473 4.1 7.9 2.63 462 4.6 7.4 2.74 458 6.9 5.1 3.942003-05-22 HUT1 13.4 425 3.7 9.7 1.92 513 4 9.4 2.39 804 3.5 9.9 3.562003-05-29 MT1 19.8 588 0.8 19 1.36 609 1 18.8 1.42 794 3.8 16 2.18
RO 1 Membrane A RO 2 Membrane B NF 1 Membrane CFeed
1

Appendix 14
DateType Pressu Flow Perm Filt press Flux Flow Perm Filt pressuFlux Flow Perm Filt press Flux
Bar L/h pressure BBar L/m2.h.barL/h pressure BBar L/m2.h.barL/h pressure Bar L/m2.h.bar
RO 1 Membrane A RO 2 Membrane B NF 1 Membrane CFeed
2003-05-29 MT1 13.9 428 0.2 13.7 1.37 447 0.4 13.5 1.45 611 1.9 12 2.23
2003-06-03Citric acid cleaning
2003-06-16 MT1 35.3 578 2.2 33.1 0.77 512 3.7 31.6 0.71 768 5.1 30.2 1.122003-06-17 MT1 27.4 359 0.4 27 0.58 310 1.2 26.2 0.52 501 1.5 25.9 0.85
2003-09-04 Ariel c 21.4 735 0.3 21.1 1.53 525 7.1 14.3 1.61 545 13.3 8.1 2.95Ariel cleaning
2003-09-23 MT1 25.4 515 0.2 25.2 0.90 466 4.6 20.8 0.98 507 10.5 14.9 1.492003-10-05 MT1 20.2 498 0.3 19.9 1.10 451 4.5 15.7 1.26 481 9.7 10.5 2.01
2003-10-08:1 27.4 485 0.2 27.2 0.78 450 4.3 23.1 0.85 523 11.5 15.9 1.442003-10-08:2 30.7 567 0.5 30.2 0.82 504 5.7 25 0.88 595 14.3 16.4 1.59
2003-10-08:3 30.5 606 1.9 28.6 0.93 566 3.1 27.4 0.91 983 3.1 27.4 1.57Citric acid cleaning
2003-11-04 Citric a 15 560 0.2 14.8 1.66 640 1.7 13.3 2.11 750 4.9 10.1 3.262003-11-05 HT 29.5 546 2.6 26.9 0.89 599 3.9 25.6 1.03 818 8.3 21.2 1.692003-11-19 HT2 19.5 564 3.1 16.4 1.51 634 4.5 15 1.85 778 8.2 11.3 3.022003-11-22 MT1 21 577 2.3 18.7 1.35 622 3.7 17.3 1.58 781 7.5 13.5 2.542003-11-28 HT1 25 528 2.1 22.9 1.01 600 3.4 21.6 1.22 855 7.8 17.2 2.182003-11-29 HT1 24.5 539 2.2 22.3 1.06 609 3.5 21 1.27 844 7.8 16.7 2.222003-12-06 MT1 31 611 2.5 28.5 0.94 542 3.6 27.4 0.87 728 7.6 23.4 1.362004-02-10 HUT2 32 477 0.4 31.6 0.66 577 0.78 31.22 0.81 643 5.3 26.7 1.062004-02-21 MT1 20 496 0.9 19.1 1.14 456 1.3 18.7 1.07 543 3.8 16.2 1.472004-03-02 21.6 574 1.4 20.2 1.25 652 1.8 19.8 1.44 744 6.2 15.4 2.122004-03-29 HT2 20.3 563 1.4 18.9 1.31 653 1.9 18.4 1.56 758 6.4 13.9 2.392004-03-31 HT3 23.6 567 1.4 22.2 1.12 644 1.9 21.7 1.30 761 6.4 17.2 1.942004-04-05 733 16.6 645 1.4 15.2 1.86 640 1.9 14.7 1.91 698 6 10.6 2.89 B NF90
2004-04-06:1 733 14.9 636 1.5 13.4 2.08 616 10.2 4.7 5.75 723 2.7 12.2 2.602004-04-06:2 733 13.8 608 1.5 12.3 2.17 702 9.3 4.5 6.84 660 2.7 11.1 2.61
2004-04-07 HT1 13.4 551 1.5 11.9 2.03 768 8.7 4.7 7.17 701 2.7 10.7 2.872004-04-22 MT1 16.2 539 1.5 14.7 1.61 739 8.9 7.3 4.44 687 2.7 13.5 2.23
2004-04-23 HT1 12.8 491 1.6 11.2 1.92 737 7.9 4.9 6.60 675 2.8 10 2.96Citric acid cleaning
2004-04-28 733 14.2 514 0.3 13.9 1.62 679 10.7 3.5 8.51 719 3.3 10.9 2.89
2

Appendix 14
DateType Pressu Flow Perm Filt press Flux Flow Perm Filt pressuFlux Flow Perm Filt press Flux
Bar L/h pressure BBar L/m2.h.barL/h pressure BBar L/m2.h.barL/h pressure Bar L/m2.h.bar
RO 1 Membrane A RO 2 Membrane B NF 1 Membrane CFeed
2004-05-02 HT1 8.5 425 1.3 7.2 2.59 556 5.6 2.9 8.41 479 3 5.5 3.822004-05-04 HT1 8.8 503 1.4 7.4 2.98 604 6 2.8 9.46 457 3.3 5.5 3.64
2004-05-06 HT1 8 459 1.3 6.7 3.00 552 5.5 2.5 9.68 451 3 5 3.9639 degrees C
2004-05-08 HT1 7.5 565 1.3 6.2 4.00 655 5.8 1.7 16.90 685 4.3 3.2 9.392004-06-01 MT1 20.7 519 2.1 18.6 1.22 847 9.9 10.8 3.44 584 4.8 15.9 1.612004-06-06 MT1 38.2 552 2.3 35.9 0.67 846 10.1 28.1 1.32 573 5.1 33.1 0.762004-06-10 MT1 30.8 415 1.8 29 0.63 597 6.9 23.9 1.10 554 3.6 27.2 0.89
2004-06-12 MT1 36 448 1.8 34.2 0.57 589 6.8 29.2 0.88 526 3.5 32.5 0.71After cleaning
2004-06-18 733 37.7 472 2.3 35.4 0.58 795 3.2 34.5 1.01 646 2.6 35.1 0.812004-06-18 733 28.8 493 2.5 26.3 0.82 832 3.4 25.4 1.44 679 2.8 26 1.15
2004-06-22 -733 35 321 1.2 33.8 0.42 361 1.8 33.2 0.48 330 1.3 33.7 0.43Citric acid cleaning
2004-06-30:1 733 23.9 180 0.4 23.5 0.34 295 1 22.9 0.57 948 0.7 23.2 1.79
2004-06-30:2 733 35.1 535 2.5 32.6 0.72 687 3.3 31.8 0.95 1032 3.3 31.8 1.42After cleaning
2004-07-15 733 25.1 485 0.4 24.7 0.86 758 1.1 24 1.39 648 8.2 16.9 1.682004-08-12:1 HT1 29 400 1.3 27.7 0.63 310 6.1 22.9 0.59 488 1.7 27.3 0.78
2004-08-12:2 HT1 38 421 1.6 36.4 0.51 435 6.3 31.7 0.60 564 1.7 36.3 0.68After cleaning
2004-08-26:1 733 15.4 460 0.4 15 1.35 1034 10.5 4.9 9.26 725 0.5 14.9 2.132004-08-26:2 MT2 H 16.6 361 2.4 14.2 1.12 883 10.3 6.3 6.15 733 2.5 14.1 2.28
2004-08-30 ? 17.6 269 2.4 15.2 0.78 954 10.4 7.2 5.81 749 2.5 15.1 2.182004-08-31 HT2 22.6 336 1.9 20.7 0.71 963 11.9 10.7 3.95 656 1.9 20.7 1.392004-09-01 HT2 24.1 343 1.8 22.3 0.67 980 12.1 12 3.58 980 1.9 22.2 1.942004-09-07 MT1 21.8 390 1.4 20.4 0.84 715 8.2 13.6 2.31 557 1.5 20.3 1.202004-09-08 MT1 33.3 466 1.4 31.9 0.64 564 5.9 27.4 0.90 622 1.5 31.8 0.86
2004-09-09 MT1 35 388 1.2 33.8 0.50 482 4.2 30.8 0.69 503 1.2 33.8 0.65After cleaning
2004-09-16 733 12.7 90 0.4 12.3 0.32 834 7.1 5.6 6.53 727 0.5 12.2 2.612004-09-21 HT2 24.6 320 2 22.6 0.62 906 10.3 14.3 2.78 674 2 22.6 1.312004-09-29 HT2 26.9 331 2 24.9 0.58 918 10.7 16.2 2.49 689 2.1 24.8 1.22
3
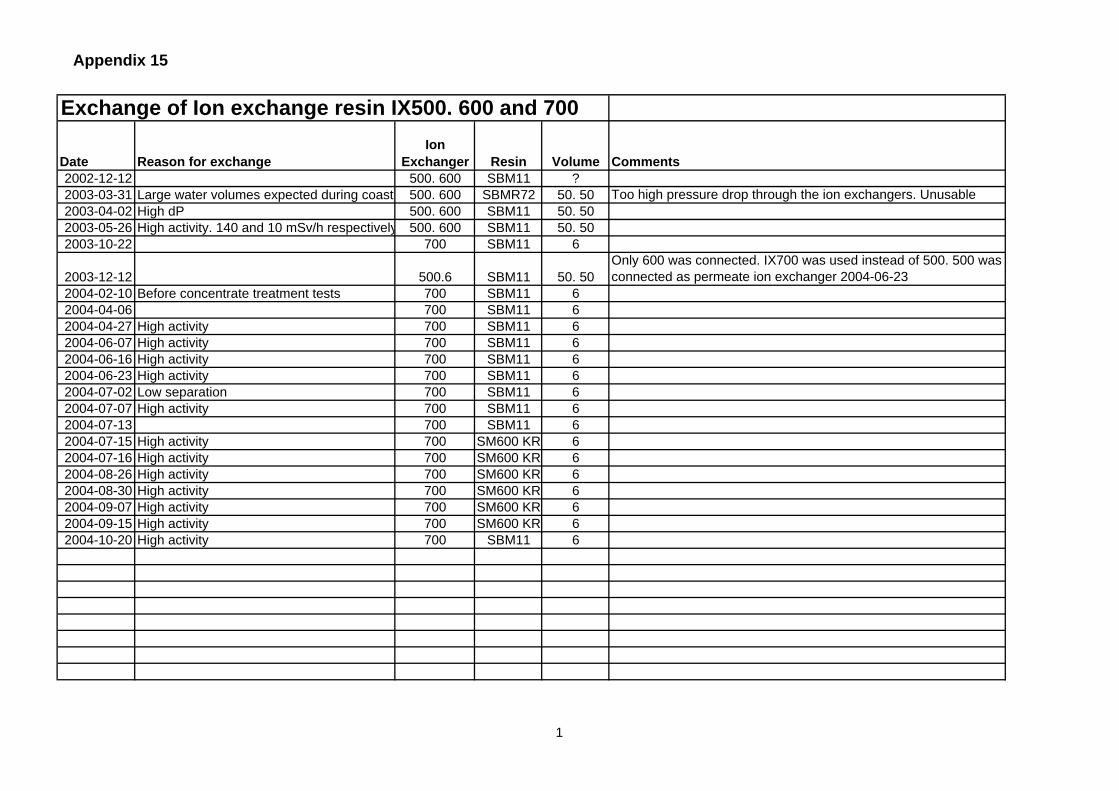
Appendix 15
Exchange of Ion exchange resin IX500. 600 and 700
Date Reason for exchangeIon
Exchanger Resin Volume Comments2002-12-12 500. 600 SBM11 ?2003-03-31 Large water volumes expected during coast 500. 600 SBMR72 50. 50 Too high pressure drop through the ion exchangers. Unusable2003-04-02 High dP 500. 600 SBM11 50. 502003-05-26 High activity. 140 and 10 mSv/h respectively 500. 600 SBM11 50. 502003-10-22 700 SBM11 6
2003-12-12 500.6 SBM11 50. 50Only 600 was connected. IX700 was used instead of 500. 500 was connected as permeate ion exchanger 2004-06-23
2004-02-10 Before concentrate treatment tests 700 SBM11 62004-04-06 700 SBM11 62004-04-27 High activity 700 SBM11 62004-06-07 High activity 700 SBM11 62004-06-16 High activity 700 SBM11 62004-06-23 High activity 700 SBM11 62004-07-02 Low separation 700 SBM11 62004-07-07 High activity 700 SBM11 62004-07-13 700 SBM11 62004-07-15 High activity 700 SM600 KR 62004-07-16 High activity 700 SM600 KR 62004-08-26 High activity 700 SM600 KR 62004-08-30 High activity 700 SM600 KR 62004-09-07 High activity 700 SM600 KR 62004-09-15 High activity 700 SM600 KR 62004-10-20 High activity 700 SBM11 6
1
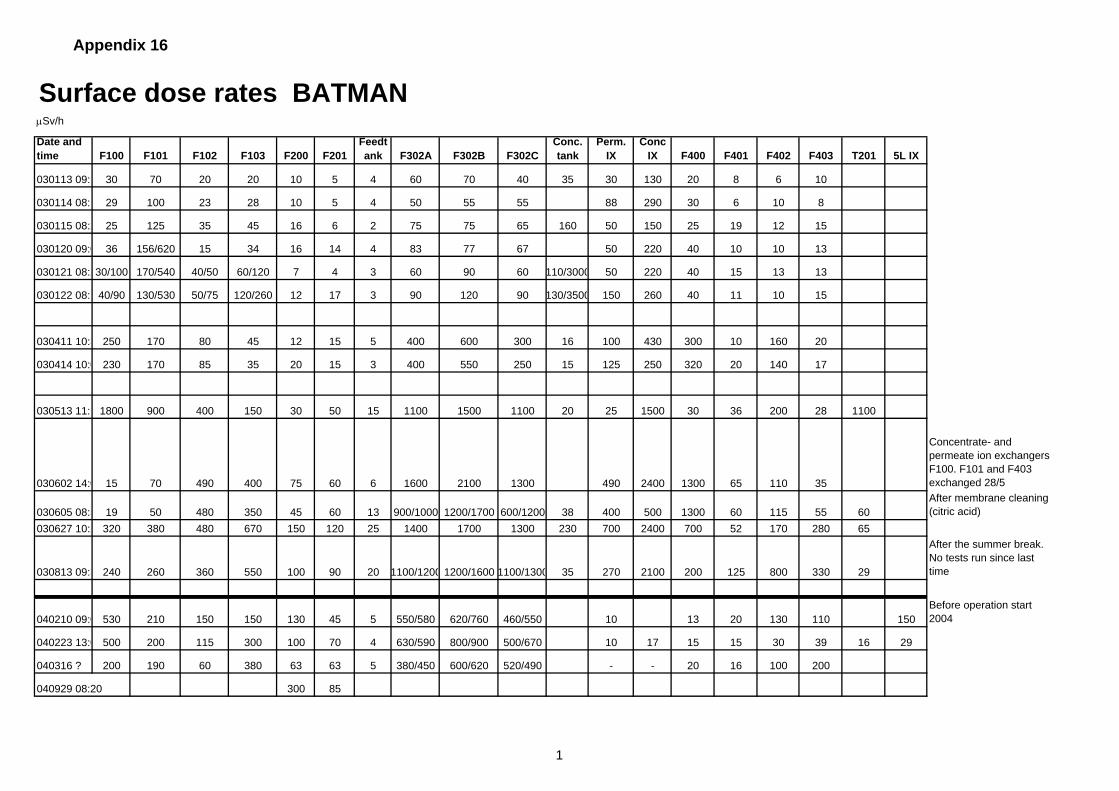
Appendix 16
Surface dose rates BATMANµSv/h
Date and time F100 F101 F102 F103 F200 F201
Feedtank F302A F302B F302C
Conc. tank
Perm. IX
Conc IX F400 F401 F402 F403 T201 5L IX
030113 09:1 30 70 20 20 10 5 4 60 70 40 35 30 130 20 8 6 10
030114 08:1 29 100 23 28 10 5 4 50 55 55 88 290 30 6 10 8
030115 08:2 25 125 35 45 16 6 2 75 75 65 160 50 150 25 19 12 15
030120 09:0 36 156/620 15 34 16 14 4 83 77 67 50 220 40 10 10 13
030121 08:230/100 170/540 40/50 60/120 7 4 3 60 90 60 110/3000 50 220 40 15 13 13
030122 08:1 40/90 130/530 50/75 120/260 12 17 3 90 120 90 130/3500 150 260 40 11 10 15
030411 10:3 250 170 80 45 12 15 5 400 600 300 16 100 430 300 10 160 20
030414 10:0 230 170 85 35 20 15 3 400 550 250 15 125 250 320 20 140 17
030513 11:1 1800 900 400 150 30 50 15 1100 1500 1100 20 25 1500 30 36 200 28 1100
030602 14:0 15 70 490 400 75 60 6 1600 2100 1300 490 2400 1300 65 110 35
Concentrate- and permeate ion exchangers F100. F101 and F403 exchanged 28/5
030605 08:5 19 50 480 350 45 60 13 900/1000 1200/1700 600/1200 38 400 500 1300 60 115 55 60After membrane cleaning (citric acid)
030627 10:2 320 380 480 670 150 120 25 1400 1700 1300 230 700 2400 700 52 170 280 65
030813 09:3 240 260 360 550 100 90 20 1100/1200 1200/1600 1100/1300 35 270 2100 200 125 800 330 29
After the summer break. No tests run since last time
040210 09:0 530 210 150 150 130 45 5 550/580 620/760 460/550 10 13 20 130 110 150Before operation start 2004
040223 13:0 500 200 115 300 100 70 4 630/590 800/900 500/670 10 17 15 15 30 39 16 29
040316 ? 200 190 60 380 63 63 5 380/450 600/620 520/490 - - 20 16 100 200
040929 08:20 300 85
1