bats of southern wyoming - uw · little brown myotis, are more susceptible to the disease than...
TRANSCRIPT

BATS OF SOUTHERN WYOMING: DISTRIBUTION & MIGRATION
YEAR 1 REPORT 2012
Prepared by: Hannah Griscom, Zoologist
Mark Andersen, GIS Specialist Douglas Keinath, Lead Zoologist
Wyoming Natural Diversity Database University of Wyoming
1000 E. University Ave., Department 3381 Laramie, Wyoming 82071
Prepared for:
Bureau of Land Management 5353 Yellowstone
Cheyenne, WY 82009
Suggested Citation: Griscom, H.R., M.D. Andersen, and D.A. Keinath. 2012. Bats of southern Wyoming:
distribution and migration, year 1 report. Prepared for the USDI Bureau of Land Management by the Wyoming
Natural Diversity Database, University of Wyoming, Laramie, Wyoming.

Bats of Southern Wyoming, Wyoming Natural Diversity Database, 2012
2

Bats of Southern Wyoming, Wyoming Natural Diversity Database, 2012
3
TABLE OF CONTENTS EXECUTIVE SUMMARY ....................................................................................................................................... 5
INTRODUCTION .................................................................................................................................................... 6
Study Objectives ................................................................................................................................................... 9
METHODS ............................................................................................................................................................... 9
Field Surveys ........................................................................................................................................................ 9
Mist Net Surveys............................................................................................................................................................. 10
Acoustic Surveys ............................................................................................................................................................ 11
Habitat Analyses ................................................................................................................................................ 12
Habitat as a predictor of bat richness and activity ........................................................................................................... 12
Habitat as a predictor of species presence ....................................................................................................................... 13
Distribution and Migration Models ................................................................................................................... 14
Summer Distribution Models .......................................................................................................................................... 14
Migration Stopover Models ............................................................................................................................................ 16
Bat Exposure to Wind Energy Development ................................................................................................................... 20
RESULTS ............................................................................................................................................................... 21
Mist Net and Acoustic Surveys ........................................................................................................................... 21
Habitat Analyses ................................................................................................................................................ 22
Bat Richness and Activity ............................................................................................................................................... 22
Species Presence ............................................................................................................................................................. 23
Distribution, Migration & Exposure Models ..................................................................................................... 23
DISCUSSION ......................................................................................................................................................... 24
Distribution and Habitat .................................................................................................................................... 24
Management Implications and Important Bat Habitat ...................................................................................... 26
ACKNOWLEDGEMENTS .................................................................................................................................... 28
LITERATURE CITED ........................................................................................................................................... 29
TABLES ................................................................................................................................................................. 32
FIGURES ................................................................................................................................................................ 38
APPENDICES ........................................................................................................................................................ 44
APPENDIX A: SPECIES ACCOUNTS .............................................................................................................. 45
Little Brown Myotis (Myotis lucifugus) .......................................................................................................................... 46
Western Small-footed Myotis (Myotis ciliolabrum) ....................................................................................................... 47
Hoary Bat (Lasiurus cinereus) ........................................................................................................................................ 48
Long-legged Myotis (Myotis volans) .............................................................................................................................. 49
Silver-haired Bat (Lasionycteris noctivagans) ................................................................................................................ 50
Western Long-eared Myotis (Myotis evotis) ................................................................................................................... 51
Big Brown Bat (Eptesicus fuscus) ................................................................................................................................... 52
Fringed Myotis (Myotis thysanodes) ............................................................................................................................... 53
Pallid Bat (Antrozous pallidus) ....................................................................................................................................... 54

Bats of Southern Wyoming, Wyoming Natural Diversity Database, 2012
4
Townsend’s Big-eared Bat (Corynorhinus townsendii) .................................................................................................. 55
Eastern Red Bat (Lasiurus borealis) ............................................................................................................................... 56
APPENDIX B: LITERATURE REVIEW OF BAT MIGRATION & WIND TURBINE FATALITIES ................. 57
APPENDIX C: 2011 MIST NET CAPTURE RESULTS ..................................................................................... 66
APPENDIX D: 2011 SPECIES OCCURRENCES ............................................................................................. 68
APPENDIX E: WYOMING BAT SPECIES IDENTIFICATION KEY ................................................................ 76
APPENDIX F: WYOMING ANABAT CALL KEY .............................................................................................. 81
APPENDIX G: 2011 BLANK DATASHEETS .................................................................................................... 86

Bats of Southern Wyoming, Wyoming Natural Diversity Database, 2012
5
EXECUTIVE SUMMARY
We conducted bat surveys throughout southern Wyoming to gain a better understanding of
species composition, distribution, habitat, and migration. The impetus for this work is the
ongoing expansion of wind energy development and its potential impact on resident and
migratory bats. Previous studies have suggested that the location of wind turbines in relation
to bat habitat and movement could significantly mitigate the number of bats killed annually.
Our aim is to better understand bat distribution and migration in order to map it in relation to
areas of high wind energy potential. The result is a tool for managers and planners to use in
mitigating the potential impacts of proposed wind energy facilities on bats. Our work is also
intended to provide a baseline of bat health in the face of White-nose Syndrome, a disease that
has devastated bat populations elsewhere, and is predicted to spread to Wyoming in the near
future.
We completed 17 mist net and 76 acoustic surveys in 2011 which resulted in 333 occurrences
of 11 bat species. Several species typically associated with forests were commonly found in
sagebrush steppe and one species was found far south of its purported range. All three of
Wyoming’s migratory bat species (hoary, silver-haired, and eastern red bat) were found in the
study area, and the hoary and silver-haired bat were widespread. Most species exhibited a
male-biased sex ratio suggesting that females may be raising young elsewhere. No evidence of
White-nose Syndrome was detected in 2011.
Summer and migration models were created to represent bat use in Southern Wyoming.
Summer distribution models were derived primarily from 2011 survey data using Maxent for 9
of the 11 species detected. Because of a lack of empirical data from migrating bats, migration
models were deduced for hoary, silver-haired, and eastern red bat based on stopover habitat
and behavior documented in the literature. All models were then superimposed in order to
highlight important bat areas and habitat features. As a result of the modeling effort, summer
species richness is predicted to be highest along major rivers, lakes, and foothill drainages in

Bats of Southern Wyoming, Wyoming Natural Diversity Database, 2012
6
the study area, especially in proximity to cliffs, rocks, or cave formations. Important stopover
habitat for migratory bats is predicted primarily along riparian corridors and foothills that have
both forest cover and perennial water nearby. Wind farms built along drainages and in
forested areas could have a higher likelihood of bat conflicts, suggesting mitigation measures
may be warranted.
Combined summer species richness and migration stopover maps were then overlaid with The
Nature Conservancy’s recently completed wind energy potential map to identify areas that
have both a high likelihood of bat use and wind energy development. These areas generally fall
into the following regions: (1) south of Rawlins on both sides of Hwy 71, (2) along the Medicine
Bow and Rock Rivers as they flow into Shirley Basin, (3) the Laramie Mountain Foothills and
Boulder Ridge, and (4) the Seminoe and Shirley Mountains. All presented models have serious
shortfalls in the amount of input data and the accuracy of predictive layers, so caution should
be used in their interpretation. The models are best used as conceptual tools to show us where
bats may spend most of their time, but they do not account for bat movement between areas
of use, and they should not be applied at the fine-scale planning level.
Other products presented in this report are a literature review of bat migration in relation to
wind energy, detailed information and maps of each species detected, raw occurrence and
capture data, species keys, and blank datasheets. This report represents the first year of an
ongoing study. Survey efforts in 2012 will focus on stratified sampling of different habitat types
and documenting occurrences during the fall migration season. This information will be used to
improve the habitat, distribution and migration models presented herein, with specific
attention to modeling migration flight paths through the study area.
INTRODUCTION
Little is known about bat distribution and habitat use in southern Wyoming. This is due to a lack
of systematic survey effort and a general perception that sagebrush shrublands support few

Bats of Southern Wyoming, Wyoming Natural Diversity Database, 2012
7
species and at low densities. Recent distribution maps produced by the Wyoming Natural
Diversity Database (WYNDD) have provided a much-needed tool for bat management (Keinath
et al. 2010), but they also highlight the dearth of bat occurrences available for generating these
maps and the resulting uncertainty associated with them. This gap in our understanding of
where bats occur and how they use the landscape has become particularly problematic in
southern Wyoming due to increasing pressure from wind energy. Several wind facilities on
public land are already operational, approximately four more are under construction, and
numerous others are being considered by the Bureau of Land Management (BLM); the principle
manager of public land in southern Wyoming.
The potential conflict between bats and wind power facilities stems from bat fatalities caused
by moving turbine blades, a phenomenon that has been well documented in Wyoming and
around the world (Young et al. 2003, Kunz et al. 2007, Arnett et al. 2008). When bats fly too
close to moving rotor blades, they are either hit by the blades themselves or by the vortex of
pressure surrounding the blades ‘barotrauma’ (Cryan and Barclay 2009). Although these bat
fatalities occur at a fairly low rate (2 bats/turbine/year in Wyoming; Young et al. 2003), bat
reproductive rates are naturally low, and as wind turbines become more numerous, the ability
of bat populations to recover from the impact is unknown.
Concern about the trend has generated an impressive amount of funding and research to find
ways to mitigate the impact of wind energy to bats. The most promising line of research
indicates that minor modifications to turbine operations, such as shutting down rotors on low
wind speed nights during bat migration, could drastically reduce the number of bats killed at
wind energy facilities (Arnett et al. 2008; Appendix B). Another line of research has focused on
the location of wind turbines in relation to bat habitat. Although results are not consistent
across studies, some have shown that fatalities can be reduced by placing turbines in locations
where fewer bats are likely to come into contact with them in the first place (Baerwald and
Barclay 2009). This is the focus of our work here. Our aim is to better understand bat
distribution and migration so that we can map it in relation to areas with high wind energy

Bats of Southern Wyoming, Wyoming Natural Diversity Database, 2012
8
potential. This tool will be available to managers and planners seeking ways to mitigate the
impact of wind energy on bats. Eventually we would like to expand the work to provide a
bat/wind energy exposure map for all of Wyoming.
Another challenge currently facing bats in North America is White-nose Syndrome, a disease
that has devastated entire populations of cave-roosting bats in the eastern United States since
2006. Although not present in Wyoming yet, White-nose Syndrome (WNS) has spread
westward and was documented in Oklahoma in 2010 (BCI 2010). Some species, such as the
little brown myotis, are more susceptible to the disease than others, perhaps because they
consistently hibernate in large colonies. The surveys described in this report represent an
important baseline inventory of bat health and abundance in southern Wyoming and lay the
groundwork for future bat monitoring. Ongoing monitoring in Wyoming will be important to
measure the potential impacts of WNS, wind turbines, and other potential stressors in coming
years.
Two basic life-history strategies are used by the roughly 14 bat species that inhabit southern
Wyoming; ‘hibernate’ or ‘migrate’. The majority escape winter by hibernating deep within
caves from October to April. They breed in the fall before entering hibernation and females
delay egg implantation until April or May when they emerge to raise their young (Adams 2003).
The other life-history strategy is to escape winter by migrating to a warmer climate. In
Wyoming, this tactic is only employed by three foliage-roosting species; the hoary, silver-
haired, and eastern red bat (Popa-Lisseanu and Voigt 2009). These three species have been the
main focus of the wind energy fatality debate because they comprise roughly 80% of turbine
fatalities and are typically killed during their fall migration southwards (See Appendix B for
details). However, year-round residents are also at risk for being killed by wind turbines and
account for approximately 20% of turbine fatalities (Johnson 2005, Jain et al. 2011). Wind
turbines also have the potential to fragment habitat for all bats by creating ground and air
barriers that prevent or restrict movement across the landscape. Because of these potential
direct and indirect impacts to migratory and resident bats, we focus on both year-round

Bats of Southern Wyoming, Wyoming Natural Diversity Database, 2012
9
resident and migratory bats by modeling the distribution of all species during summer months
as well as modeling the stopover habitat likely used by the three migrating species as they
move through the study area.
Study Objectives
Most of the funding for this project is provided by the Wyoming Office of the BLM. Although all
reports, maps, and data will be freely available to the public, the BLM expects to see the most
benefit by using the information to help fulfill their multiple-use mandate on public lands in
southern Wyoming. This report details the results of the first year of a multi-year research
effort which has two overarching objectives:
(1) To conduct an inventory of bat species and their habitats in southern Wyoming. This
involves targeted bat surveys using mist nets and passive recording devices. Our aim is to
better understand which species live where, how common they are, and what habitat
features are most important for their conservation.
(2) To model zones of bat vulnerability to impacts from wind energy development during
the summer and migrating seasons. By overlaying these models with a wind energy
potential map, we can begin to see where bats might be most vulnerable to impacts from
wind turbines both in the summer and migration seasons.
METHODS
Field Surveys
Our study area in 2011 encompassed most of the Rawlins Field Office of the BLM in south-
central Wyoming (Fig.1). Because the study area is quite large (48,000 km2), we elected to
focus surveys within several sub-regions according to the following criteria developed in

Bats of Southern Wyoming, Wyoming Natural Diversity Database, 2012
10
consultation with BLM biologists; current wind energy development pressure, abundance of
suitable mist netting sites, and public access to those sites. This resulted in six focal areas; (1)
Laramie plains and foothills, (2) greater Chokecherry-Sierra Madre project areas, (3) North
Platte River riparian corridor, (4) Seminoe Mountain foothills, (5) Shirley Basin, and (6) lower
Sweetwater River (Fig.1).
We trained and deployed one crew of two people from June 15 to August 31 to conduct 2 types
of surveys; mist net (active) and acoustic (passive). Capturing live bats with mist nets allowed
us to verify species presence, inspect individuals for disease, assess physical condition, and
collect demographic information. Passive surveys with multiple remote recording devices
allowed us to efficiently collect species presence information from multiple sites every night.
Basic weather information, time of sunset, and moon phase were recorded at all sites. General
habitat categories were also assigned using the WYGFD Wildlife Observation System categories
(Table 1).
When choosing survey locations, we avoided high elevation sites on US Forest Service lands in
the study area in order to focus on sagebrush and foothills habitats, but also to avoid
duplicating a concurrent survey effort by the Wyoming Game and Fish Department (WYGFD:
Grenier pers. comm.). Passive bat monitoring results from a wildlife inventory of the Ferris
Mountains (Estes-Zumpf and Keinath 2012) and mist netting results from the Pathfinder Wind
Energy Project (Lockman pers. comm.) were also incorporated into our modeling analyses.
Mist Net Surveys
Two to four mist nets1 were suspended between aluminum poles in single or double-high
arrangements to catch bats while feeding or drinking. Most nets were placed over water but
some were suspended under a forest canopy. We opened nets at dusk and closed them at
1:00am, although nets were closed earlier in the event of inclement weather limiting bat
1 Avinet.com: bat -specific mist nets: 38mm mesh, black polyester, USA made.

Bats of Southern Wyoming, Wyoming Natural Diversity Database, 2012
11
activity such as high wind or persistent rain. We checked nets every 15 minutes and carefully
removed, processed, and released bats within 45 minutes of capture. All sites were mist netted
for one night only. We also kept a stationary recorder (Anabat) running at mist net sites to
detect any additional bat species not captured in nets.
In addition to recording species, sex, age, and reproductive status, wing damage index was
scored and a wing photo was taken of each bat. Wing damage is the primary way that White-
nose Syndrome is detected in non-hibernating bats and we followed the 2011 bat handling
protocol laid out by the WYGFD both in handling and preventing potential contamination
between bats. Specifically, with regards to cross-contamination, all bat processing equipment
was cleaned/washed with Lysol between each processed bat.
Acoustic Surveys
We deployed two kinds of acoustic recorders to capture bat echolocations for species
identification; Anabats2 and Song Meters3. Although both devices are effective echolocation
recorders, the Song Meter appears to have at least two advantages over the Anabat. First, it
has a multi-directional microphone which allows it to pick up more bat activity around the
recorder (see Table 1 for greater efficiency values). Second, although questionable files were
reviewed by hand, most of the post-processing was automated through the use of Sonobat4
software. In contrast, Anabat files need to be reviewed and identified individually by hand. We
consulted with Anabat expert Dr. Michael O’Farrell5 for the identification of 30% of our 2011
Anabat data, and combined that information with the key in Appendix F to identify the rest of
the Anabat files ourselves using AnalookW6.
2 Anabat SD1 Bat Detector. Columbia, MO www.titley-scientific.com
3 Song Meter SM2Bat. Ultrasonic monitoring. Concord, MA www.wildlifeacoustics.com
4 SonoBat 3, Wyoming species package, Arcata, CA. www.sonobat.com (Szewczak 2011)
5 O’Farrell Biological Consulting, http://mammalogist.org/consulting/consulting.htm
6 Analook W, viewing software for Anabat files, http://users.lmi.net/corben/Beta/ (Corben 2011)

Bats of Southern Wyoming, Wyoming Natural Diversity Database, 2012
12
Definitions of Common Terms Mist net capture: Positive identification of a bat species captured in a mist net at one site. Acoustic recording: Positive identification of a bat species from an Anabat or Sonobat file. Occurrence: The positive detection of a species at a site (mist net or acoustic). Often one occurrence is comprised of several mist net captures and/or acoustic recordings from one site.
Because bats need to drink and roost in trees
or rock formations every day, we targeted
sampling of sites with permanent water,
trees, and/or rock formations. To test our
assumption that bats are more common in
these habitats, however, we also conducted
acoustic surveys in dry grassland and
sagebrush sites. Most acoustic surveys were
stationary where recording took place at one
location for one night. Typically, these
stationary monitoring sites were strategically
selected to maximize exposure to foraging bats. In addition, six mobile acoustic surveys were
conducted from a vehicle. Prior to surveying, two sections of the same road were identified;
one 2-mile section surrounded by open sagebrush, and one 2-mile section surrounded by
forested or riparian habitat. Eight stops were made along each section by stopping every
0.25miles and recording for 15min before proceeding to the next stop.
Habitat Analyses
Habitat as a predictor of bat richness and activity
Because bats are dependent on landscapes that contain both roosting habitat (e.g. caves, rock
crevices, and/or trees) and foraging habitat (e.g. water bodies), our assumption was that they
are more likely to be found in such habitats than in dry sagebrush. Testing this assumption is a
coarse-scale approach to understanding how bats are generally distributed and use the
landscape of southern Wyoming. We tested this assumption two ways; using mobile acoustic
surveys and conducting a qualitative assessment with aerial imagery.

Bats of Southern Wyoming, Wyoming Natural Diversity Database, 2012
13
Mobile Surveys: Pooled mobile survey data collected at ‘sagebrush’ stops was compared to
pooled data collected at ‘forest/riparian’ stops. The paired design of surveying both habitats on
the same night and in the same area helped control for differences in activity due weather and
local environmental factors. Two metrics were compared using a paired t-test and Chi-square
test; number of species and number of bats passing over (no. of Anabat call files).
Aerial Imagery: A qualitative assessment using aerial imagery involved comparing site
attributes between the 7 most active and the 7 least active sites (based on number of Anabat
call files). Local and landscape context attributes were characterized and recorded for each
site. Local attributes (within 1km) included presence of water, water feature type, water
feature size, presence of rocks/cliffs, presence of deciduous trees, and presence of coniferous
trees. Landscape context attributes (within 5km) included landform type (mountains, foothills,
plains), presence of possible cave-formations, and water sources. Attributes that were
repeatedly seen at the most active sites and not seen at the least active sites were tagged as
potential variables explaining heavy bat use.
Habitat as a predictor of species presence
Chi-square analysis is an appropriate tool for handling categorical data such as habitat type and
was used to search for possible habitat relationships from 2011 field surveys. Compared with
the approach above, this was a more fine-scale analysis to look for positive or negative
relationships between species and habitat types. The test was conducted by comparing the
prevalence of a habitat type at all sites sampled to the prevalence of that type where only
‘species A’ was found. All habitat types were compared for all species. The Chi-square value
for each comparison was used to determine if there was a positive or negative relationship
between the species and the habitat type at the 95% confidence level.

Bats of Southern Wyoming, Wyoming Natural Diversity Database, 2012
14
Distribution and Migration Models
Two types of models were produced to reflect two distinct patterns of seasonal distribution and
habitat usage by bats within the study area. The first type of model was created to represent
predicted summer distribution of eleven bat species using inductive methods that relate known
bat occurrences to environmental parameters. The second type of model represents migration
stopover habitat used by the three migratory bat species in the study area. Because we
currently have very few migrating bat occurrences, we were forced to use a deductive, or
knowledge-based approach in creating this model.
Summer Distribution Models
We used Maxent, a commonly applied algorithm for predicting species distributions (Phillips et
al. 2006), to model the spatial distribution of eleven bat species detected in 2011 during the
summer season. Maxent can generate useful models with relatively limited training data
(Hernandez et al. 2006), and does not require absence data for model building. Multiple
iterations of modeling via Maxent were used to arrive at a set of final models for all species.
Final summer models for each species were combined to generate a single map representing
bat richness in summer across the study area.
Summer Input Data
Occurrence (i.e., species presence) data used for model building came primarily from 2011
surveys and secondarily from existing datasets within WYNDD’s database. Any existing dataset
occurrences that were outside the study area, were old (pre-1980), or imprecise (>1km) were
removed from the analysis (Table 6).
Additionally, opportunistically collected observation data often exhibit strong spatial biases that
reflect sampling effort or intensity, rather than habitat preferences by the species (Jimenez-
Valverde and Lobo 2006, Johnson and Gillingham 2008). Thus, we followed methods described
by Keinath et al. (2010) to subsample occurrence data to reduce spatial biases in the data. All

Bats of Southern Wyoming, Wyoming Natural Diversity Database, 2012
15
occurrence data were first attributed with a Point Quality Index (PQI), based on the mapping
precision, age, and certainty of taxonomic identification for each point (Table 7). Then, any
points for a given species within 1600 m of a higher quality (i.e., higher PQI) point for the
species were eliminated. This reduces spatial biases in occurrence data at a fine scale. Next, a
multi-pass filtering algorithm was run that iteratively selected the highest PQI point within each
occupied 12-digit Hydrologic Unit Code boundary (HUC; Simley and Carswell 2009), until points
were being drawn from a subset of HUCs representing less than 20% of the original set of
occupied HUCs, or until there were no additional points left for the species. Points selected
using this routine comprised the final model training dataset as shown in the last column of
Table 6. Ten-thousand randomly placed “background” points were then generated to compare
to this training dataset.
Summer Predictor Data Layers
Predictor data layers used to generate summer season models were resampled to match the
extent of the study area from datasets created by previous researchers (Keinath et al. 2010).
These predictors spanned basic categories of environmental variation, including climate,
topography, hydrology, soil and substrate, land cover and landscape metrics, as well as
variables intended to identify unique habitat features important to bats (e.g., caves, cliffs, and
rock outcrops). Occurrence training data and background points were attributed with each of
the potential predictors.
Summer Model Building & Selection
We constructed initial models of all eleven summer target species in Maxent using 79 predictor
layers from Keinath et al. (2010), using 10-fold cross-validation. Cross-validation was used to
reduce the possibility of overfitting models to noise in the training data, by ensuring that
variables included in the final models were those that were most important in predicting
occurrence across each of the 10-folds of training data (Baumann 2003). Selected variables
from Keinath et al. were excluded from these initial runs, as they were not deemed to be
biologically meaningful for bats, and may have produced misleading results. For example, the

Bats of Southern Wyoming, Wyoming Natural Diversity Database, 2012
16
“Distance to Roads” variable likely would have shown an inverse relationship with bat
distribution because many of the bat occurrence data were collected from or near roads for
ease of sampling. Once the cross-validation models were run, those variables that explained
none of the variation were excluded from the final models. Maxent is robust to over-fitting
even with large numbers of predictors and relatively small numbers of samples (e.g., Bedia et
al. 2011), so no further variable reduction was done. Models with ten or fewer training data
points (eastern red bat and Townsend’s big-eared bat) were not used in subsequent model
overlays because we had low confidence in their accuracy.
Logistic output rasters were generated from the final models constructed for each of the
remaining nine species. Though not strictly interpretable as logistic probability, these rasters
provide an indication of relative habitat suitability for all the cells in a study area (Phillips et al.
2006). Binary versions (predicted absent/predicted present) were then created for each
species by applying a threshold (specifically, the “Minimum Training Presence” threshold
identified by Maxent) to each logistic raster.
A predicted summer bat species richness map was generated by combining the above binary
versions of each species’ model. This was done by first performing a simple additive overlay,
and then standardizing the resulting raster so that it ranged from 0 to 1. We standardized
model output so that it could be overlaid with the subsequent models described below. In this
final summer richness model, a value of 0 indicates that none of the target species were
predicted present, and 1 indicates that all of the 9 target species were predicted present.
Migration Stopover Models
Appendix B is a literature review of bat migration behavior and physiology in relation to wind
turbine fatality trends. It is intended to provide background information, support for model
parameters, and provide a starting point for improved model iterations in coming years. Here
we discuss the main points pertinent to model creation.

Bats of Southern Wyoming, Wyoming Natural Diversity Database, 2012
17
Bat migration spans several weeks and is composed of two repeating phases; ‘migration flight’
and ‘stopover’ (McGuire et al. 2012, Fleming and Eby 2003, Taylor et al. 2011). Migration flight
occurs at night when bats fly approximately 30-50km in a southward direction, occasionally
stopping to eat and drink along the way (see Appendix B for details). At the end of a migration
flight, foliage-roosting bats such as our three species of interest, find a suitable roost tree and
enter torpor during the following day. They then stay near this roost for one or more days,
resting and stocking up on food and water until conditions are favorable for another migration
flight (McGuire et al. 2012, Taylor et al. 2011, Fleming and Eby 2003).
In order to accurately represent bat migration, we need to model both the ‘migration flight’
and ‘stopover’ phases of migration. In fact, migration flight might be more important to model
as bats tend to fly higher (in the turbine rotor-swept zone) during these periods (Appendix B).
The problem is there is very little information available about the routes that bats take during
migration flights, and the information that does exist, is inconsistent with regards to bats’ use
of flight ‘corridors’ (Appendix B). Surveys in 2012 will focus on collecting empirical data on
migration flight in an effort to represent this important phase directly. But for now we assume
that our species of interest fly between stopover locations using irregular paths that we cannot
model. In contrast, much more is known about the summer roosting and foraging habits of
migrating bats which is assumed to be consistent with stopover habitat. Because stopover
habitat represents the starting and ending points for migration flights, and because bats are
somewhat vulnerable to wind turbines while ‘stopping over’, we are providing a reasonable
representation of bat habitat use during migration.
Stopover habitat was modeled separately for each of the three migratory species (hoary bat,
silver-haired bat, and eastern red bat) using Multi-Criteria Decision Analysis methods (Belton
and Stewart 2002). In this deductive approach, information about the roosting and feeding
behavior of all three species from Adams (2003) and NatureServe (2012) was used to pull out
landscape features thought to influence the selection of stopover habitat. These were
incorporated into a multiplicative, weighted model that ranked the value of cells based on the

Bats of Southern Wyoming, Wyoming Natural Diversity Database, 2012
18
listed criteria shown in Table 8. Because all species are foliage-roosters, the presence of trees
was the first condition necessary to define stopover habitat. Eastern red bats have
predominantly been documented roosting in deciduous trees, so any deciduous tree cover
above 0% was included in its model (Table 8a). Silver-haired and hoary bats use both deciduous
and coniferous species (Adams 2003), so any type of tree cover above 0% was included for
them (Table 8b & 8c).
Bats can lose up to 30% of their body weight in an eight-hour period, primarily due to metabolic
evaporation (Adams 2003). Although some water can be derived from food, in most cases, bats
need to replenish this water by drinking at least once a day (this is especially true during
migration when metabolic demands are higher (Fleming and Eby 2003)). Therefore, we
determined that proximity of perennial water to tree roosts was another condition of stopover
habitat. A logarithmically declining relationship between the roost site and distance to
perennial water was assumed because, all other variables being equal, a bat would be much
more likely to use a water source 100m from its roost than a water source 1000m from its
roost. For all species, a threshold of 5km was established between a potential roost site and
perennial water. This is based on home range estimates of similar-sized bats from the
literature (see Appendix B for details). Bats also need to eat while stopping over during
migration, but because all three species have been documented feeding on insects near water
or trees, the first two conditions of the models were deemed to fulfill foraging needs.
Based on differences in flight behavior and habitat (Adams 2003), some information is available
about the types of water the three species prefer to eat and drink from. Eastern red bats are
typically associated with riparian forests and, as a result, usually forage along large rivers (Table
8a.; stream order of 2 or more) and secondarily at large and medium-sized ponds. Hoary bats
are fast flyers that pursue prey by aerial hawking. As a result, they are most comfortable
foraging and drinking at large, open water bodies, rather than narrow rivers and streams.
Silver-haired bats are typically found at ponds or open water in forested environments. They
are agile flyers and as such, can also forage within the confines of streams and rivers.

Bats of Southern Wyoming, Wyoming Natural Diversity Database, 2012
19
Although hoary bats and silver-haired bats undoubtedly occur at high elevations and may even
use them when migrating, we decided to use an elevation cutoff of 2600m (8530ft) in order to
focus on lower-elevation BLM lands where wind energy development is most prevalent. In the
case of eastern red bat, a cutoff of 2500m (8200ft) was used for biological reasons. Eastern red
bats are primarily recorded along lower-elevation cottonwood forests in Wyoming, and have
not been documented above 2500m to our knowledge.
As described above, predictive layers used in the migration stopover models include tree cover,
elevation, water body and stream data. Conifer and deciduous canopy cover was derived from
GAP Ecological Systems and LANDFIRE using methods described in Keinath et al. (2010).
National Elevation Dataset (NED-1-arc second) data was used as the elevation input (Keinath et
al. 2010). Water bodies, such as ponds and reservoirs, were selected from those present in the
National Hydrography Dataset (Simley and Carswell 2009). Stream data used in the deductive
model was derived from Enhanced 100k Digital Line Graph (DLG) stream data generated for the
Wyoming GAP project layer (Merrill et al. 1996). This dataset contains Strahler stream order
information (Strahler 1952), which allowed streams to be scored for relative importance based
on their stream order (a proxy for size).
After migration stopover models were generated for each migratory species, they were
combined and standardized into one map in order to overlay with summer distribution and
wind potential maps. To do this, the models for each of the three species were converted to a
binary format (i.e., a value of 1 was assigned when stopover suitability scores were greater than
0; a value of 0 was assigned when the stopover suitability score was 0). These three binary
models were then combined via simple additive overlay, and standardized so as to range from 0
to 1, where 0 indicates absence of stopover habitat for all species, and 1 indicates presence of
stopover habitat for all species.

Bats of Southern Wyoming, Wyoming Natural Diversity Database, 2012
20
Bat Exposure to Wind Energy Development
The standardized migration and summer overlay models (representing three and nine species,
respectively), were then combined by taking their mean value (i.e., summing the layers and
dividing by two), to generate a raster representing bat habitat importance for summer and
migration seasons. This layer was then combined with a layer representing projected wind
energy development (Copeland et al. in prep.; see below), using a multiplicative overlay, and
the resulting layer was linearly rescaled so as to range from 0 (lowest predicted exposure) to 1
(highest predicted exposure). An exposure value of 1 would indicate that an area of high
predicted bat richness for summer and migration seasons overlapped with an area with a high
level of suitability for wind energy development.
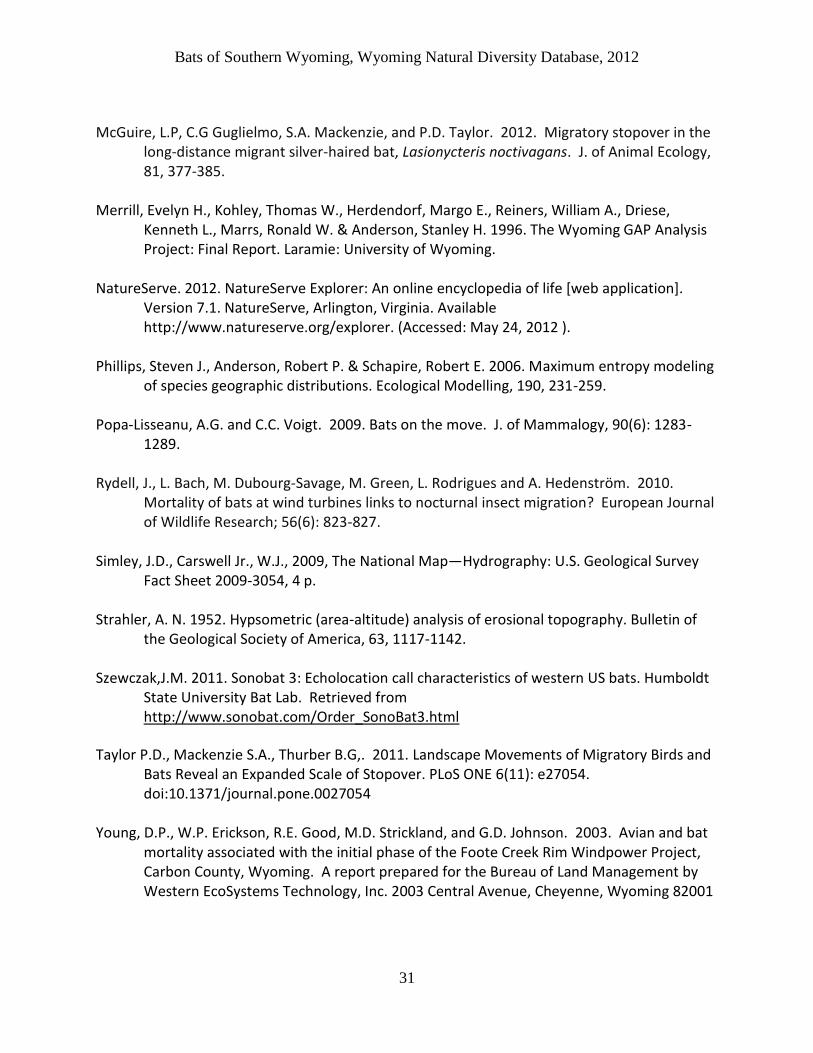
The potential for wind energy development (Copeland et al. in prep.; The Nature Conservancy,
Lander, WY) was mapped through a two-step process that used a predictive model to represent
wind resource potential, followed by adjustments reflecting short-term development indicators
and legal or operational constraints. Operational wind turbine locations were used as a
response variable in a maximum entropy model with average wind resource potential at 50-m
height, percent slope, and topographic position as predictor variables. Areas with model values
below the logistic threshold of 0.314 (maximum training sensitivity plus specificity) were
eliminated and the remaining values were rescaled to range from 0 (very low potential for wind
farms) to 1 (very high potential for wind farms). The rescaled values were adjusted based on
density of existing meteorological towers (met towers indicated increased likelihood of
development), distance to proposed high-capacity electrical transmission lines (areas with
access to existing lines have increased likelihood of development), proposed wind farm
boundaries (areas in planned farms have increased likelihood of development), and current
land tenure (private lands have fewer stipulations and have increased likelihood of
development). Further adjustments were made for legally protected lands (less likely
development), airport runway air space (no development allowed within 1524 meters), urban
areas (no development allowed), mountainous areas above 2743 meters in elevation (less
likelihood of development), and lakes (no development).

Bats of Southern Wyoming, Wyoming Natural Diversity Database, 2012
21
RESULTS
Mist Net and Acoustic Surveys
In 2011, we conducted 17 nights of mist netting and captured 68 bats representing 7 species
(Table 4). Roughly 75% of captures were little brown myotis and big brown bats, while there
where only a few captures of hoary bat, long-legged myotis, silver-haired bat, western long-
eared myotis, and eastern red bat. Sex ratios were heavily biased towards males in all species
except little brown myotis, which had an equal balance of males and females. Consistent with
this pattern, the only species for which juveniles were captured (often in tandem with females)
was little brown myotis. No evidence of White-nose Syndrome was found on any of the
captured bats. Orange mites were found embedded in the skin of 9 bats captured in the
Laramie Mountains, however this condition is somewhat common in Wyoming and not
currently considered a threat to bat populations (WYGFD; Grenier pers. comm.).
A total of 70 stationary acoustic surveys (61 Anabat, 9 Song Meter) and 6 mobile surveys were
completed in 2011. This resulted in about 800 hours of recording, 5500 Anabat files, and 300
species occurrences. Acoustic surveys were more efficient than mist netting in generating
species occurrences (Table 2), though species identification from acoustic files can be difficult
for some taxa. Of the acoustic devices, the Song Meter picked up almost twice as many species
on average as the Anabat per night of sampling. This is probably due to its more sensitive and
multi-directional microphone. Mobile acoustic surveys did not produce comprehensive species
lists for sampled sites, but because 16 locations were sampled in one night instead of one, they
were the most efficient at generating occurrences.
In addition to the 7 species identified during mist netting, 4 additional bat species were
identified from acoustic recordings alone; western small-footed myotis, fringed myotis, pallid
bat, and Townsend’s big-eared bat (Table 3). This underscores the value of acoustic surveys as
an efficient tool for detecting and identifying bats, especially in open habitats where bats are

Bats of Southern Wyoming, Wyoming Natural Diversity Database, 2012
22
better able to evade mist nets (Lockman, pers. comm.). This is best exemplified by the western
small-footed myotis which was the second most abundant bat detected in the study area, but
was never captured in a mist net (Table 3). Physical confirmation of small-footed myotis would
be valuable in future surveys as its echolocations can be confused with other species, but we
have high confidence in our identifications as they closely match those made by Michael
O’Farrell. More detailed information about the ecology, habitat, and distribution of all 11
species is presented in Appendix A.
The species we detected during 2011 field surveys generally match existing range maps for bats
in our study area (Adams 2003; Clark and Stromberg 1987; Keinath et al. 2010), however there
were two exceptions. The pallid bat was routinely found south of its documented range (as far
as 100km) and Yuma bat (Myotis yumanensis) recordings were detected 150km north of its
documented range. An official extension of the pallid bat’s range should be considered in light
of our results, however the Yuma bat observation should be treated more cautiously. Several
Yuma bat calls were identified by Sonobat at one site near Green Mountain. These calls were
then reviewed by hand and visually verified, however, the observation was isolated and would
represent a considerable range expansion for the species. Acoustic and mist net surveys should
target the area in future years to confirm or refute the observation.
Habitat Analyses
Bat Richness and Activity
No differences in either richness or bat activity were found between ‘sagebrush’ and
‘forested/riparian’ stops during mobile surveys. Chi-square and t-test results indicated that
neither bat activity (number of files) nor the number of species differed significantly between
habitat types. Results from the aerial photo comparison of the 7 most active and the 7 least
active acoustic survey sites yielded more results. The presence of water was generally
associated with more bat activity, and isolated perennial water sources (streams or ponds with
no other sources of water within 5km) were especially likely to have high bat activity. Low

Bats of Southern Wyoming, Wyoming Natural Diversity Database, 2012
23
activity sites were generally more than 5km from any water source. Foothill riparian areas
surrounded by sagebrush hillsides had an inordinately high amount of bat activity as did
perennial water sources with cliff features nearby. These qualitative observations were also
born out in the summer species richness model shown in Figure 3 and discussed below.
Species Presence
Chi-square analyses of species presence relative to habitat types did not yield any statistically
significant positive or negative relationships. This is not to say that all species are generalists in
the study area, but rather that our methods and sample size were not sufficient to pick up
species-habitat affinities. Because many sites did not fit exclusively into one category (e.g.,
both willows and sagebrush were present), we allowed classification using multiple categories.
In retrospect, this was not the right approach to take as it had the effect of obscuring real
differences between sites and resulting in weak statistical relationships. There were however,
indications of positive and negative relationships as interpreted by above-average chi-square
scores (Table 5). These weak relationships were detected in 6 out of 11 species. Silver-haired
bat had a positive association with water compared to the suite of sites sampled. Western
long-eared myotis and big brown bat were positively associated with conifer and deciduous
trees. Fringed myotis was more often found near conifers and the pallid bat near rocks or cliffs.
All these relationships have support in the literature (Adams 2003) although species were also
documented outside what is typically considered their habitat and range, as discussed in the
next section.
Distribution, Migration & Exposure Models
Individual species models for the summer and migration seasons are displayed under their
respective species account in Appendix A. Between 30 and 52 predictive variables were used to
create each species’ summer distribution model. There is considerable overlap in predicted
species distribution because, in many cases, several species were detected at the same site.
Despite this, subtle differences are evident between most species. For example, little brown

Bats of Southern Wyoming, Wyoming Natural Diversity Database, 2012
24
bat is predicted to occur at water bodies throughout the plains and sagebrush, whereas
western long-eared myotis is predicted to be confined to the foothill zone. Figure 3 displays the
combined species richness model for 9 species during the summer season. High richness areas
predominately occur along main rivers and foothill drainages. Individual migration stopover
models are displayed in the hoary bat, silver-haired bat, and eastern red bat species accounts in
Appendix A. Figure 4 displays the combined migration stopover model which clearly identifies
riparian corridors and forested foothills below 2600 meters in elevation as important migration
stopover areas.
DISCUSSION
Distribution and Habitat
One of the biggest discoveries of the 2011 season was the routine detection of forest-
associated species in open sagebrush. This is especially true of long-legged myotis and silver-
haired bat which typically occur in forests, but were the fourth and fifth most abundant species
caught in our surveys. Overall, the bat species assemblage resembled what one would expect
to see in Rocky Mountain foothills even though many of the sites were in open sagebrush
steppe. The lack of tree and rock cover at many of our sites raises questions about where these
forest bats are roosting and how far they might be traveling between roosting and foraging
sites. Future analyses comparing ‘distance to nearest tree’ between ‘tree bats’ and ‘non-tree
bats’ may help address these questions by seeing if there is a maximum threshold distance for
‘tree bats’.
One area that was surprisingly rich (9 of 11 species) was the Atlantic Rim region between
Rawlins and the Sierra Madre Mountains. This seems to be an ecotone where low-elevation

Bats of Southern Wyoming, Wyoming Natural Diversity Database, 2012
25
and forest-associated species routinely overlap. It is possible that the isolated aspen stands on
leeward sides of bluffs in the area are providing valuable roosting habitat for several species.
Hoary bats were the third most abundant species (47 occurrences). They were widespread and
detected as far as 14km from trees and 7km from water. This is significant because hoary bats
are the most frequently killed species at wind turbines and appear to move easily through the
sagebrush landscape of southern Wyoming. Another migratory species; silver-haired bat was
found throughout the study area but in closer association to trees and water (within 7km and
3km, respectively). We only detected three eastern red bats. Two were in cottonwood habitat
along the Laramie River and the other was in the Shirley Mountains in a forest opening. The
study area encompasses the far western edge of the species’ range which might explain why
they are somewhat uncommon.
Another interesting result from our 2011 surveys was the conspicuous absence of females and
juveniles in all but two species; little brown myotis and big brown bat (Table 4). Bats often
segregate by sex during the summer so that females can raise young in the best habitat (Adams
2003; Cryan 2003). Further mist netting efforts will help clarify whether sagebrush and foothills
habitat in southern Wyoming provides suitable juvenile-rearing habitat, but initial results
indicate that females of most species are probably rearing young elsewhere. The exception;
little brown myotis, displayed a balanced sex ratio, reproductive females, and juveniles. This
suggests that maternity colonies exist at various locations across the study area. The highest
number of reproductive little brown myotis females and young were captured along the
Sweetwater River near Jeffrey City indicating that there is probably at least one maternity
colony in the Granite Mountains.
One potential pitfall of using ‘number of acoustic recordings’ to measure bat activity is that the
particular placement of the recorder within a site can have a large influence on the number of
calls it picks up. Certain features such as canyon pinch points, irrigation canals, and breaks in a
forest canopy seem to draw and concentrate bats as they forage. This is helpful information for
maximizing the number of species and recordings surveyors pick up, but it calls into question

Bats of Southern Wyoming, Wyoming Natural Diversity Database, 2012
26
our ability to compare activity across sites. Another factor that complicates habitat analysis is
the fact that bat activity seems to vary greatly with insect abundance, weather variables, and
the probable interaction between the two (Rydell et al. 2010).
Management Implications and Important Bat Habitat
Bat species richness during the summer season is predicted highest along major rivers, lakes,
and foothill drainages of the study area (Figure 3). Drainages close to rock formations in the
Ferris, Seminoe, and Laramie Mountains pull out as especially important in supporting species
richness. Bats are known to rely heavily on water, especially in desert environments (Adams
2003). Although our sites were somewhat skewed towards having water and trees nearby,
most available habitat types were amply sampled (Table 1) and not found to be positive
predictors of species presence in the modeling process. Although ongoing surveys in dry
environments will help confirm this trend, our results indicate that bats are most likely to be
found near water, trees, and rock formations in the study area. Species richness is only one
measure of ‘bat value’ on the landscape, whereas density of bats (regardless of species) could
be another. We did not have an effective way to measure bat density and can only make
general statements about the kinds of features that appeared to drive the number of acoustic
calls recorded. These features are similar to those predicting high species richness and include
large, isolated water bodies, and riparian foothills (especially when near cliff or rock
formations).
The combined migration stopover model (Figure 4) was derived from an imposed rule-set based
on what is known about the roosting and foraging habits of hoary, silver-haired, and eastern
red bats. We deemed tree cover within 5km of perennial water and below 8,500ft to be
suitable stopover habitat. Not surprisingly, forested foothills pulled out as important for all
species with low-elevation riparian corridors a close second. However, we believe that low-
elevation riparian corridors are underrepresented in this map because the forest layer used
seems to erroneously omit some patches of lower-elevation forest cover.

Bats of Southern Wyoming, Wyoming Natural Diversity Database, 2012
27
The bat exposure map is an overlay of all summer, migration, and wind energy potential
models. Several regions pull out as having high predicted bat use and high potential for wind
energy development:
1.) One region is south of Rawlins on both sides of Highway 71. There are at least two wind
energy projects (Chokecherry and Sierra Madre) projected to begin construction in this area
within the next few years. Distribution and migration models highlight the aspen stands and
east-running drainages in this area as important bat habitat.
2.) Another area of overlap is along the Medicine Bow and Rock Rivers as they flow north into
Shirley Basin and the nearby Freezeout Mountains. Existing wind energy facilities are already
expanding in this region, but avoiding placing wind turbines near water bodies and river
corridors may help mitigate some impact there.
3.) Another region is the lower Laramie Mountains/foothills, and extending around to Boulder
Ridge along the Colorado border. The Boulder Ridge area is slated for a large wind energy
project in the near future. Avoiding placing turbines within approximately 5km of forests may
help ameliorate bat fatalities there (based on model results and home range estimates from
Appendix B).
4.) Other regions of bat exposure are the Seminoe Mountains, Shirley Mountains and upper
Laramie Mountains. Once again, foothills drainages are pulling out as important bat habitat,
although to our knowledge, no current wind energy developments are proposed in these areas
thus far.
There are some major weaknesses inherent to the models presented in this report, and caution
should be used in their interpretation. First, when applying these models in a planning context,
they should be used as conceptual tools rather than for fine-scale planning and decision-
making. The maps are predicting general areas of habitat use, but limitations in input layers,
predictive layers, and differences in map scales lead to multiplicative errors that will make
interpretation at scales less than 2km very inaccurate. Second, a relatively small number of bat

Bats of Southern Wyoming, Wyoming Natural Diversity Database, 2012
28
occurrences were used to create the summer distribution maps (Table 6). This, in combination
with oversampling mesic sites undoubtedly skewed the results to favor water features and
probably does not represent the full spectrum of bat habitat use on the landscape. Third, bats
are opportunistic and move easily between roosting and foraging sites. Although our maps may
predict where bats spend most of their time, they do not account for movement between areas
of heavy use. For example, although ridgetops did not pull out as important habitat features
for bats in our models, bats undoubtedly fly over ridgetops in order to access roosting and
foraging habitat and may even forage above ridgetops when insect swarms are present (Rydell
et al. 2010, McCracken et al. 2008). Third, the lack of predicted species richness in the
southwest corner of the study area is most likely an artifact of little sampling in that region
rather than a true reflection of available bat habitat. Future surveys will focus on sampling
within the Great Divide Basin. Similarly, little data from elevations above 8,500ft were used in
these models and they do not accurately depict species richness or migratory use of high-
elevation conifer habitat.
As a result of one season of surveys and modeling, we now have a clearer picture of which
species inhabit the area and what habitats are most important to conserve. Collectively,
perennial water sources, especially near rock formations and in foothill regions, appear to be
important as well as forested areas for migrating bats. Survey efforts will continue in 2012 and
we plan to survey twice as many sites in a variety of habitats and extending into the fall
migration season. This information will be used to improve the habitat, distribution and
migration models presented here.
ACKNOWLEDGEMENTS
Dennis Saville, Wildlife Program Lead for the Wyoming State Office of the BLM has been instrumental in
establishing this project and continues to provide logistical support and administrative guidance. Charlie
Morton, Frank Blomquist, and Mary Read, Biologists with the Rawlins Field Office of the BLM have lent
us equipment and provided logistical support. Dave Lockman, Wildlife Biologist with KC Harvey
Environmental, LLC provided data and field advice. Martin Grenier, Nongame Mammal Biologist with

Bats of Southern Wyoming, Wyoming Natural Diversity Database, 2012
29
the Wyoming Game and Fish Department has provided technical advice. Paula O’Briant and Ken Brown,
WYNDD Technicians, worked tirelessly to complete the field surveys for this report.
LITERATURE CITED
Adams, R.A. 2003. Bats of the Rocky Mountain West. University Press of Colorado, Boulder, Colorado.
Arnett, E. B., Brown, W. K., Erickson, W. P., Fiedler, J. K., Hamilton, B. L., Henry, T. H., . . .
Tankersley, R. D., J.R. (2008). Patterns of bat fatalities at wind energy facilities in North aAmerica. Journal of Wildlife Management, 72(1), 61-78.
Bat Conservation International (BCI). 2010. White-nose syndrome jumps to a ‘Gateway to the
West’ *Press release+. Retrieved from http://www.batcon.org/pdfs/whitenose/WNSCaveMyotisinOklahomaFINAL.pdf [Nov. 2011].
Baerwald, E.F. and R.M.R. Barclay. 2009. Geographic variation in activity and fatality of
migratory bats at wind energy facilities. J. of Mammalogy; 90(6): 1341-1349. Baumann, K. 2003. Cross-validation as the objective function for variable-selection techniques.
Trends in Analytical Chemistry 22(6) p.3s95-406. Bedia, J., J. Busque, and J.M Gutierrez. 2011. Predicting plant species distribution across an
alpine rangeland in northern Spain. A comparison of probabilistic methods. Applied Vegetation Science 14(3) p.415-432.
Belton, S., and T.S. Stewart. 2002. Multiple Criteria Decision Analysis. An Integrated Approach.
Kluwer Academic Publishers, Massachusetts 2002. Corben, C. 2011. AnalookW - an introduction to the software, user manual for Anabat
detectors. Retrieved from http://users.lmi.net/corben/Beta/ [Nov. 2011]. Cryan, P.M. 2003. Seasonal distribution of migratory tree bats (Lasiurus and Lasionycteris) in
North America. J. of Mammalogy; 84(2): 579-593. Cryan, P.M. and R.M.R. Barclay. 2009. Causes of bat fatalities at wind turbines: hypothesis and
predictions. J. of Mammalogy 90(6):1330-1340. Estes-Zumpf, W. A., and D. Keinath. 2012. Inventory of sensitive animal species in the Ferris
Mountain Wilderness Study Area, Wyoming. Prepared for the National Landscape Conservation System Research and Science Program and the Bureau of Land

Bats of Southern Wyoming, Wyoming Natural Diversity Database, 2012
30
Management Rawlins Field Office by the Wyoming Natural Diversity Database, Laramie, Wyoming. 31 January, 2012.
Fleming, T.H. and P. Eby. 2003. Ecology of bat migration. Pages 156-208 in T.H. Kunz and M.B.
Fenton, editors. Bat ecology. University of Chicago Press, Chicago, Illinois, USA. Grenier, Martin. Non-game Mammal Biologist and lead Bat Biologist with the Wyoming Game
and Fish Department, Lander, Wyoming. Hernandez, Pilar A., Graham, Catherine H., Master, Lawrence L. and Albert, Deborah L. (2006).
The effects of sample size and species characteristics on performance of different species distribution modeling methods. Ecography, 29, 773-785.
Jimenez-Valverde, A. and J. M. Lobo. 2006. The ghost of unbalanced species distribution data in
geographical model predictions. Diversity and Distributions 12:521-524. Jain, A.A., R.R. Koford, A.W. Hancock, and G.G. Zenner. 2011. Bat mortality and activity at a
northern Iowa wind resource area. American Midland Naturalist, 165(1) p.185-200. Johnson, G.D. 2005. A review of bat mortality at wind-energy developments in the United
States. Bat Research News, 46(2) p.45-49. Johnson, C. J. and M. P. Gillingham. 2008. Sensitivity of species-distribution models to error,
bias, and model design: An application to resource selection functions for woodland caribou. Ecological Modelling 213:143-155.
Keinath, D.A., M.D. Andersen and G.P. Beauvais. 2010. Range and modeled distribution of
Wyoming's species of greatest conservation need. Report prepared by the Wyoming Natural Diversity Database, Laramie, Wyoming for the Wyoming Game and Fish Department, Cheyenne, Wyoming and the U.S. Geological Survey, Fort Collins, Colorado. August 20, 2010.
Keinath, D.A. 2005. Bat inventory of the greater Yellowstone network; final report. Report
prepared by the Wyoming Natural Diversity Database, Laramie, Wyoming for the USDI National Park Service. October 2005.
Kunz, T.H, E.B. Arnett, W.P. Erickson, A.R. Hoar, G.D. Johnson, R. P. Larkin, M.D. Strickland, R.W.
Thresher and M.D. Tuttle. Ecological Impacts of Wind Energy Development on Bats: Questions, Research Needs, and Hypotheses. Frontiers in Ecology and the Environment, Vol. 5, No. 6 (Aug., 2007), pp. 315-324.
Lockman, Dave. Wildlife Biologist with KC Harvey Environmental, LLC and lead biologist with the
Pathfinder Wind Energy Project in central Wyoming.
Bats of Southern Wyoming, Wyoming Natural Diversity Database, 2012
31
McGuire, L.P, C.G Guglielmo, S.A. Mackenzie, and P.D. Taylor. 2012. Migratory stopover in the
long-distance migrant silver-haired bat, Lasionycteris noctivagans. J. of Animal Ecology, 81, 377-385.
Merrill, Evelyn H., Kohley, Thomas W., Herdendorf, Margo E., Reiners, William A., Driese,
Kenneth L., Marrs, Ronald W. & Anderson, Stanley H. 1996. The Wyoming GAP Analysis Project: Final Report. Laramie: University of Wyoming.
NatureServe. 2012. NatureServe Explorer: An online encyclopedia of life [web application].
Version 7.1. NatureServe, Arlington, Virginia. Available http://www.natureserve.org/explorer. (Accessed: May 24, 2012 ).
Phillips, Steven J., Anderson, Robert P. & Schapire, Robert E. 2006. Maximum entropy modeling
of species geographic distributions. Ecological Modelling, 190, 231-259. Popa-Lisseanu, A.G. and C.C. Voigt. 2009. Bats on the move. J. of Mammalogy, 90(6): 1283-
1289. Rydell, J., L. Bach, M. Dubourg-Savage, M. Green, L. Rodrigues and A. Hedenström. 2010.
Mortality of bats at wind turbines links to nocturnal insect migration? European Journal of Wildlife Research; 56(6): 823-827.
Simley, J.D., Carswell Jr., W.J., 2009, The National Map—Hydrography: U.S. Geological Survey
Fact Sheet 2009-3054, 4 p. Strahler, A. N. 1952. Hypsometric (area-altitude) analysis of erosional topography. Bulletin of
the Geological Society of America, 63, 1117-1142. Szewczak,J.M. 2011. Sonobat 3: Echolocation call characteristics of western US bats. Humboldt
State University Bat Lab. Retrieved from http://www.sonobat.com/Order_SonoBat3.html
Taylor P.D., Mackenzie S.A., Thurber B.G,. 2011. Landscape Movements of Migratory Birds and Bats Reveal an Expanded Scale of Stopover. PLoS ONE 6(11): e27054. doi:10.1371/journal.pone.0027054
Young, D.P., W.P. Erickson, R.E. Good, M.D. Strickland, and G.D. Johnson. 2003. Avian and bat
mortality associated with the initial phase of the Foote Creek Rim Windpower Project, Carbon County, Wyoming. A report prepared for the Bureau of Land Management by Western EcoSystems Technology, Inc. 2003 Central Avenue, Cheyenne, Wyoming 82001

Bats of Southern Wyoming, Wyoming Natural Diversity Database, 2012
32
TABLES
Table 1. Habitat types attributed at survey sites.
Habitat Type - percent of sampled sites where type was present
Shrubland/ shrub steppe - 51%
Grassland - 30%
Wetland/ open water - 62%
Rock outcrop/cliff /canyon - 32%
Conifer forest - 33%
Deciduous forest (cottonwoods) - 16%
Riparian shrub (willows) - 37%
Foothills chaparral - 0%
Badlands - 0%
Disturbed/ reclaimed/ mined/ oil & gas - 0%
Table 2. The number of occurrences and efficiency by survey method.
Survey method
No. of species
occurrences* No. of sites surveyed Efficiency++
Mist Net 28 17 1.6/night
Anabat 191 61 3.1/night
Song Meter 45 9 5.0/night
Mobile Survey
(Anabat) 68 6 11.3/night * An 'occurrence' is the detection of a species at a site (regardless of number of captures or recordings).
++ Efficiency is the average number of species occurrences per survey night.

Bats of Southern Wyoming, Wyoming Natural Diversity Database, 2012
33
Table 3. Bat species detected during 2011 surveys in southern Wyoming, their relative
abundance and seasonal residency.
Common Name Scientific Name Relative Abundance
No. of mist
net
occurrences
No. of
acoustic
occurrences
Season of
residency in
Southern
Wyoming
Little Brown Myotis Myotis lucifugus common 10 65 year-round
Western Small-footed Myotis Myotis ciliolabrum common 0 51 year-round
Hoary Bat Lasiurus cinereus common 6 41 spring-fall only
Long-legged Myotis Myotis volans common 3 44 year-round
Silver-haired Bat Lasionycteris noctivagans less common 4 26 spring-fall only
Western Long-eared Myotis Myotis evotis less common 1 25 year-round
Big Brown Bat Eptesicus fuscus less common 3 21 year-round
Fringed Myotis Myotis thysanodes less common 0 14 year-round
Pallid Bat Antrozous pallidus less common 0 13 year-round
Townsend's Big-eared Bat Corynorhinus townsendii uncommon 0 2 year-round
Eastern Red Bat Lasiurus borealis uncommon 1 2 spring-fall only
Table 4. Sex and age information of captured bats in southern Wyoming.
Common Name Males (repro2) Female (repro
1) Adults Juveniles
Little Brown Myotis 17(2) 18(6) 32 3
Hoary Bat 6 0 6 0
Long-legged Myotis 5 0 5 0
Silver-haired Bat 6 1 7 0
Western Long-eared Myotis 1 0 1 0
Big Brown Bat 12(3) 1(1) 13 0
Eastern Red Bat 0 1 1 0
Total mist net captures = 68 1 = number of females pregnant, lactating, or post-lactating females are in parentheses.
2 = number of males with descended testicles in parentheses.

Bats of Southern Wyoming, Wyoming Natural Diversity Database, 2012
34
Table 5. Chi-square analysis of habitat preferences in relation to all sites sampled (none
were statistically significant).
Species
Conifer
Tree
Decid.
Tree
Willows
Water
Rock/
Cliff
Shrub
Grass
Little Brown Myotis
Western Small-footed Myotis -
Hoary Bat
Long-legged Myotis
Silver-haired Bat +
Western Long-eared Myotis + +
Big Brown Bat + +
Fringed Myotis +
Pallid Bat +
Townsend's Big-eared Bat
Eastern Red Bat
Table 6. Occurrence record numbers and elimination by species.
Species
Total
WYNDD
Database
Records
Old and/or
Imprecise
Records
(Removed)
Records
Outside
Study
Area
(Removed)
Records
w/in
1600m of
Better
Point
(Removed)
Removed
via
Iterative
Stratified
Selection
Records
in Final
Modeling
Set
Little brown myotis 530 202 239 37 2 50 Western small-footed
myotis 215 4 148 21 1 41
Hoary bat 197 4 132 22 2 37
Long-legged myotis 236 6 153 33 0 44
Silver-haired bat 261 2 207 19 0 33 Western long-eared
myotis 172 12 121 14 0 25
Big brown bat 406 238 136 9 0 23
Fringed myotis 75 1 58 2 1 13
Pallid bat 41 3 22 2 0 14 Townsend’s big-eared
bat 125 16 93 6 0 10
Eastern red bat 14 0 9 0 0 5
Totals 2,272 488 1,318 165 6 295

Bats of Southern Wyoming, Wyoming Natural Diversity Database, 2012
35
Table 7. Scoring system used to evaluate the quality of occurrence records based on
spatial precision (A), age of record (B), and taxonomic certainty of identification
(C).
A. Spatial Precision of Occurrence Record
Score Definition Example
4 Location uncertainty ≤ 30 meters Location via GPS
3 Location uncertainty > 30 meters and ≤ 100 m Location via 7.5’ quad map
2 Location uncertainty > 100 meters and ≤ 300 ms Location via 100k quad map
1 Location uncertainty > 300 meters and ≤ 600 m Location via large-scale map or
detailed written directions
B. Age of Occurrence Record
Score Calendar Year
of Observation
Definition
4 ≥ 2000 Observation made within roughly 10 years of model creation
3 1990 - 1999 Observation made within roughly 20 years of model creation
2 1980 - 1989 Observation made within roughly 30 years of model creation
C. Taxonomic Certainty of Occurrence Record
Score Category Definition
4 Confirmed
Identification
Adequate supporting information exists within the occurrence
record to consider it a valid observation of the species in question
2 Questionable
Identification
Supporting information within the occurrence record is insufficient
to confirm correct identification of the species (e.g., no supporting
documentation or observer credentials), but neither is there any
reason to assume that the record is in error
U Likely
Misidentification
Unused: There is reason to believe that the observation could be
erroneous. (e.g., extra-limital observation by amateur biologists of
species that are easily misidentified)

Bats of Southern Wyoming, Wyoming Natural Diversity Database, 2012
36
Table 8. Landscape criteria and equations used to generate migratory stopover habitat
models for eastern red bat (a), hoary bat (b), and silver-haired bat (c). Generated from
roosting, foraging, and home range information from Adams (2003), NatureServe (2012) and
sources detailed in Appendix B.
Table 8a. Stopover habitat model for eastern red bat (Lasiurus borealis)
Criteria Values Scores
Deciduous Tree Cover
(decid)
0%
>0%
0
1
Distance to Water (waterdist) >5000m
<5000m
0
1 to 0, where values decline
logarithmically as a function of distance,
between from a value of 1 at a distance
of 0 m to a value of 0 at a distance of
5000m
Elevation (elev) >2500m
<2500m
0
1
Type of Water Feature
(watertype)
Streams (Strahler Order > 2)
Streams (Strahler Order = 2)
Medium/Large Ponds (>0.25 ha)
Small Ponds (<0.25 ha)
Small Streams (Strahler Order = 1)
1
0.8
0.72
0.61
0.5
Equation:
Lasiurus borealis Stopover Habitat Suitability = decid * waterdist * elev * watertype
Table 8b. Stopover habitat model for hoary bat (Lasiurus cinereus)
Criteria Values Scores
Tree Cover (tree) 0%
>0%
0
1
Distance to Water (waterdist) >5000m
<5000m
0
1 to 0, where values decline
logarithmically as a function of distance,
between from a value of 1 at a distance
of 0 m to a value of 0 at a distance of
5000m
Elevation (elev) >2600m
<2600m
0
1
Type of Water Feature
(watertype)
Medium/Large Ponds (>0.25 ha)
Small Ponds (<0.25 ha)
Streams (Strahler Order > 2)
Streams (Strahler Order = 2)
Small Streams (Strahler Order = 1)
1
0.9
0.9
0.6
0.2
Equation:
Lasiurus cinereus Stopover Habitat Suitability = tree * waterdist * elev * watertype

Bats of Southern Wyoming, Wyoming Natural Diversity Database, 2012
37
Table 8c. Stopover habitat model for silver-haired bat (Lasionycteris noctivagans)
Criteria Values Scores
Tree Cover (tree) 0%
>0%
0
1
Distance to Water (waterdist) >5000m
<5000m
0
1 to 0, where values decline
logarithmically as a function of distance,
between from a value of 1 at a distance
of 0 m to a value of 0 at a distance of
5000m
Elevation (elev) >2600m
<2600m
0
1
Type of Water Feature
(watertype)
Any pond/water body
Small Streams (Strahler Order = 1)
Streams (Strahler Order > 2)
Streams (Strahler Order = 2)
1
0.8
0.7
0.5
Equation:
Lasionycteris noctivagans Stopover Habitat Suitability = tree * waterdist * elev * watertype

Bats of Southern Wyoming, Wyoming Natural Diversity Database, 2012
38
FIGURES
Figure 1. Overall study area (blue) and focal survey regions (red). Focal survey regions are (1) Laramie plains and foothills,
(2) greater Chokecherry-Sierra Madre project areas, (3) North Platte River riparian corridor, (4) Seminoe Mountain foothills,
(5) Shirley Basin, and (6) lower Sweetwater River

Bats of Southern Wyoming, Wyoming Natural Diversity Database, 2012
39
Figure 2. Locations of bat surveys, recordings & captures in 2011.

Bats of Southern Wyoming, Wyoming Natural Diversity Database, 2012
40
Figure 3. Combined summer distribution model of nine bat species documented in southern Wyoming.

Bats of Southern Wyoming, Wyoming Natural Diversity Database, 2012
41
Figure 4. Combined migration stopover model for the three migratory bat species documented in southern Wyoming.
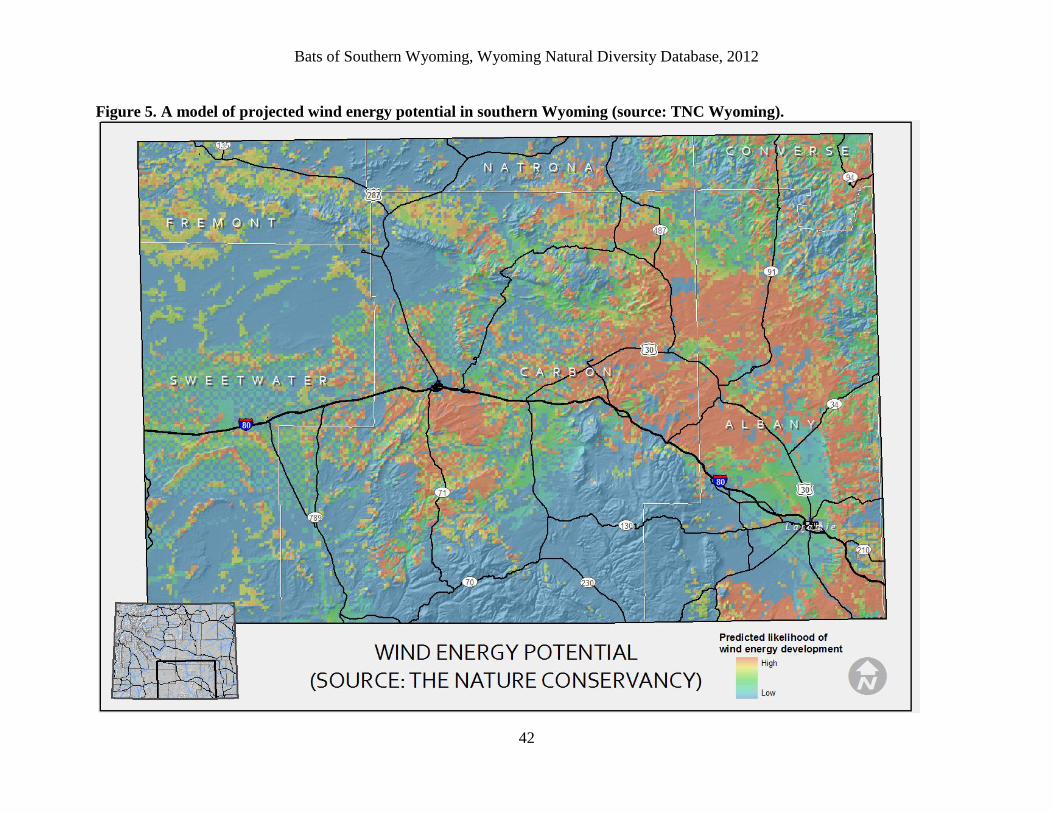
Bats of Southern Wyoming, Wyoming Natural Diversity Database, 2012
42
Figure 5. A model of projected wind energy potential in southern Wyoming (source: TNC Wyoming).
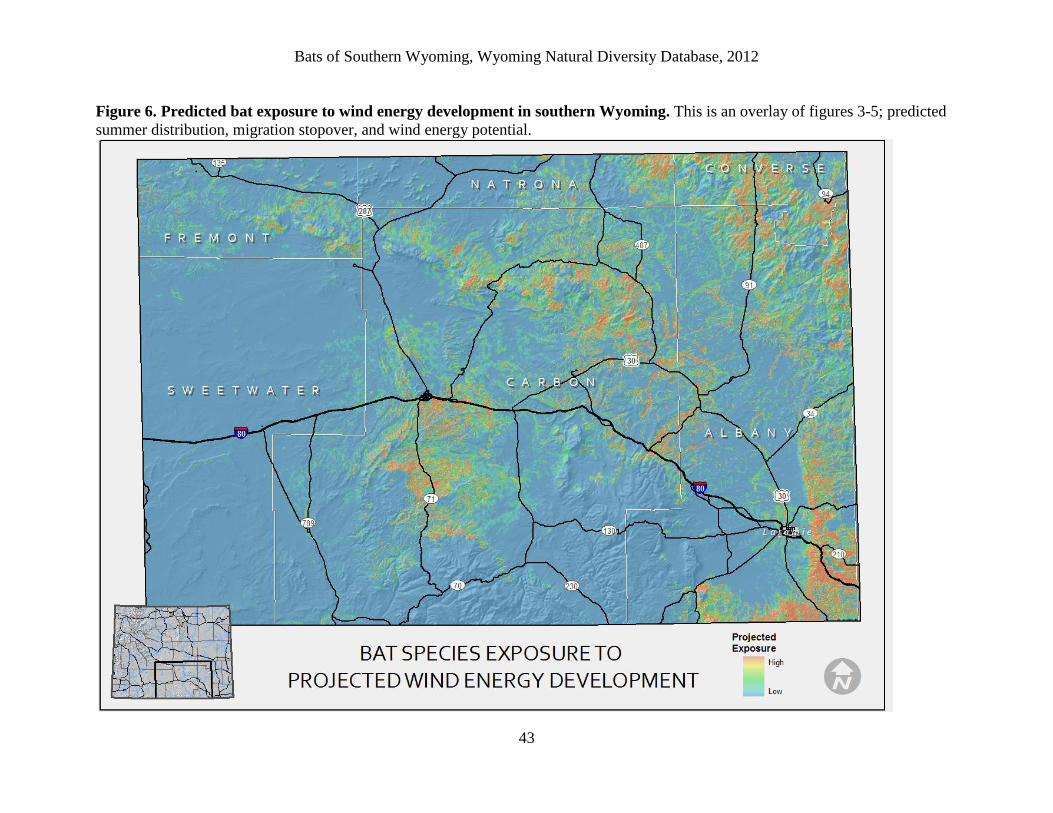
Bats of Southern Wyoming, Wyoming Natural Diversity Database, 2012
43
Figure 6. Predicted bat exposure to wind energy development in southern Wyoming. This is an overlay of figures 3-5; predicted
summer distribution, migration stopover, and wind energy potential.

Bats of Southern Wyoming, Wyoming Natural Diversity Database, 2012
44
APPENDICES

Bats of Southern Wyoming, Wyoming Natural Diversity Database, 2012
45
APPENDIX A: SPECIES ACCOUNTS

Bats of Southern Wyoming, Wyoming Natural Diversity Database, 2012
46
Little Brown Myotis (Myotis lucifugus)
Species Ecology
Because of its behavioral and ecological versatility,
the little brown myotis ranges widely across North
America and Wyoming. It is a year-round resident,
although females are thought to migrate as far as
several hundred kilometers between summer
maternity and winter hibernating roosts (Adams
2003). The little brown myotis is most common in
conifer forest, streamside riparian and urban areas;
usually found near open water and absent from hot, arid lowlands. During summer, the little brown bat uses a
wide variety of roosts including buildings, trees (cavities and loose bark), bridges, rock crevices, caves, and
abandoned mines. It is one of the most common species in Wyoming's buildings. It mainly forages over
water, often within a few feet of the surface, but also in open woodlands and forest openings. Although an
opportunistic feeder, it mainly eats small, soft-bodied, flying insects, particularly emerging aquatic insects
(e.g., caddisflies, mayflies, midges, mosquitoes).
Notes
Little brown myotis was the most
common species captured in mist
nets (35 individuals) and in
acoustic recordings (65
occurrences). It appears to be
widespread and common in
southern Wyoming, although
usually associated with water.
Several reproductive females were
captured along with young-of-the-
year indicating nearby maternity
roosts. The presence of permanent
water, cliffs, and cave formations
were all significant drivers in the species’ summer distribution (see map above).
© Doug Keinath,
WYNDD

Bats of Southern Wyoming, Wyoming Natural Diversity Database, 2012
47
Western Small-footed Myotis (Myotis ciliolabrum)
Species Ecology
The western small-footed myotis has a range encompassing
southern Canada and extending through the Rocky Mountain
states to Arizona and New Mexico. It is found throughout most
of Wyoming, but is excluded from high mountains and most of
northeastern Wyoming (Keinath et al. 2010). It is commonly
associated with middle and low-elevation arid, rocky areas (such
as canyons, cliffs, rock outcrops, and badlands) within a variety
of habitats (e.g., montane forest, juniper woodlands, sagebrush
steppe, shortgrass prairie). It is a year-round resident, known to
hibernate is small colonies, a few of which have been identified
in north-central and southwestern Wyoming (Adams 2003).
Diurnal roosts are varied, but tend to be rock shelters (crevices,
overhangs, cliffs, and under rocks), caves, and abandoned mines. Unlike many other species, it will roost
at ground level. Small-footed myotis typically forages along cliffs and rocky slopes in dry areas, but can
forages over water. It is highly maneuverable, often foraging low to the ground (i.e., <10 ft) among
boulders, shrubs, and trees, feeding on a variety of small, soft-bodied insects, especially moths.
Notes
Western small-footed myotis was the
second most common species detected
(51 acoustic occurrences), although no
individuals were captured in mist nets.
This might be because they were most
often detected in rugged terrain near
rock outcrops rather than over open
water where mist nets are placed.
Although presence of water pulled out
as an important predictor of summer
distribution (see right), it was less
important than the presence of rocks and cliffs.
© Doug Keinath,
WYNDD
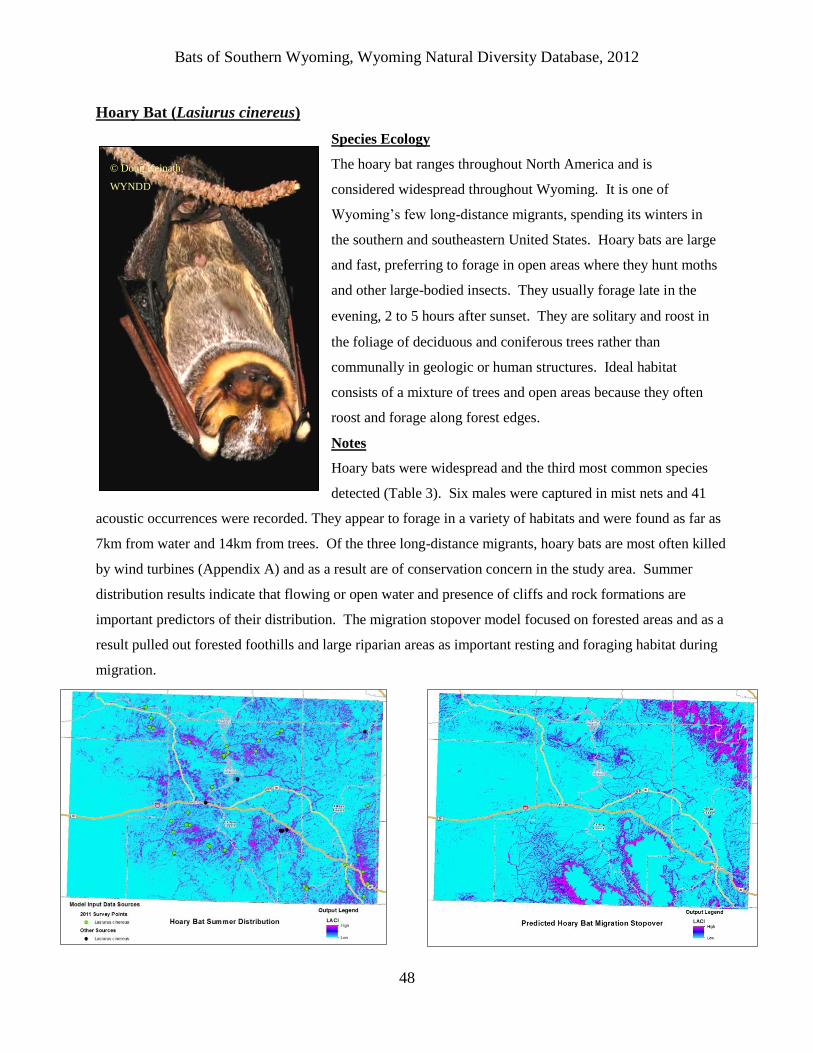
Bats of Southern Wyoming, Wyoming Natural Diversity Database, 2012
48
Hoary Bat (Lasiurus cinereus)
Species Ecology
The hoary bat ranges throughout North America and is
considered widespread throughout Wyoming. It is one of
Wyoming’s few long-distance migrants, spending its winters in
the southern and southeastern United States. Hoary bats are large
and fast, preferring to forage in open areas where they hunt moths
and other large-bodied insects. They usually forage late in the
evening, 2 to 5 hours after sunset. They are solitary and roost in
the foliage of deciduous and coniferous trees rather than
communally in geologic or human structures. Ideal habitat
consists of a mixture of trees and open areas because they often
roost and forage along forest edges.
Notes
Hoary bats were widespread and the third most common species
detected (Table 3). Six males were captured in mist nets and 41
acoustic occurrences were recorded. They appear to forage in a variety of habitats and were found as far as
7km from water and 14km from trees. Of the three long-distance migrants, hoary bats are most often killed
by wind turbines (Appendix A) and as a result are of conservation concern in the study area. Summer
distribution results indicate that flowing or open water and presence of cliffs and rock formations are
important predictors of their distribution. The migration stopover model focused on forested areas and as a
result pulled out forested foothills and large riparian areas as important resting and foraging habitat during
migration.
© Doug Keinath,
WYNDD

Bats of Southern Wyoming, Wyoming Natural Diversity Database, 2012
49
Long-legged Myotis (Myotis volans)
Species Ecology
Long-legged myotis occurs throughout
western North America from Alaska to
northern Mexico. Prior to these surveys,
it was thought to be limited to mid and
high elevation forests in Wyoming.
Females are known to form maternity
colonies in tree cavities, loose bark, and
rock crevices near permanent water,
however males will roost more broadly.
It is considered a year-round Wyoming
resident and hibernates in caves and mines. The long-legged myotis is a rapid, direct flier that
pursues moths and other insects.
Notes
Typically associated with forests,
long-legged myotis were more
common than expected in the study
area which is dominated by
sagebrush and open forests. We
caught 5 males in mist nets and
collected 44 acoustic occurrences.
Distance to water and tree cover
were nevertheless important in
predicting summer distribution (see
right).
© Doug Keinath,
WYNDD
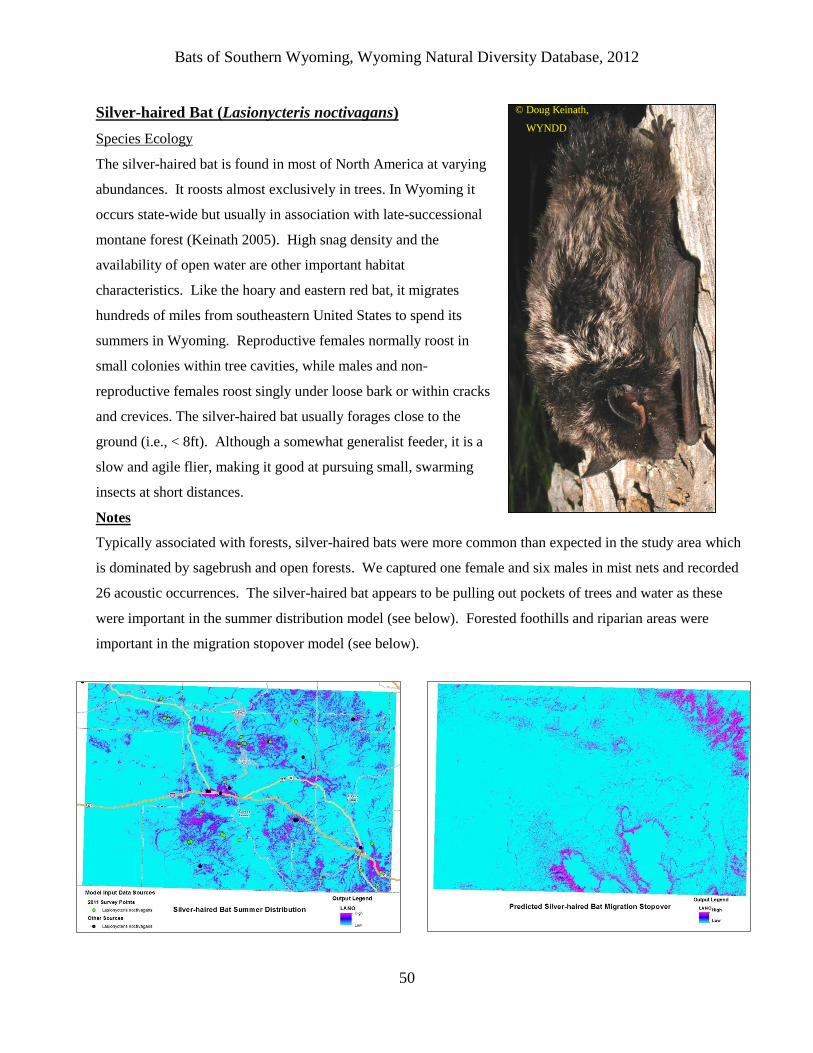
Bats of Southern Wyoming, Wyoming Natural Diversity Database, 2012
50
Silver-haired Bat (Lasionycteris noctivagans)
Species Ecology
The silver-haired bat is found in most of North America at varying
abundances. It roosts almost exclusively in trees. In Wyoming it
occurs state-wide but usually in association with late-successional
montane forest (Keinath 2005). High snag density and the
availability of open water are other important habitat
characteristics. Like the hoary and eastern red bat, it migrates
hundreds of miles from southeastern United States to spend its
summers in Wyoming. Reproductive females normally roost in
small colonies within tree cavities, while males and non-
reproductive females roost singly under loose bark or within cracks
and crevices. The silver-haired bat usually forages close to the
ground (i.e., < 8ft). Although a somewhat generalist feeder, it is a
slow and agile flier, making it good at pursuing small, swarming
insects at short distances.
Notes
Typically associated with forests, silver-haired bats were more common than expected in the study area which
is dominated by sagebrush and open forests. We captured one female and six males in mist nets and recorded
26 acoustic occurrences. The silver-haired bat appears to be pulling out pockets of trees and water as these
were important in the summer distribution model (see below). Forested foothills and riparian areas were
important in the migration stopover model (see below).
© Doug Keinath,
WYNDD

Bats of Southern Wyoming, Wyoming Natural Diversity Database, 2012
51
Western Long-eared Myotis (Myotis evotis)
Species Ecology
Western long-eared myotis looks similar
to the northern long-eared myotis but has
even longer ears and opaque skin on its
tail. It ranges throughout temperate
western North America. In Wyoming,
the species is most common at
intermediate elevations and foothills
(Keinath et al. 2010). It is primarily a
foliage gleaner, capturing insects on bark
and leaves by listening to the flutter of
their wings. For this reason, it prospers in vegetatively complex environments ranging from
sagebrush shrubland to thick conifer forests (Adams 2003). It roosts in small groups under the
bark or in the hollows of snags, in caves, or human structures. Primary food sources are moths
and small beetles. Long-eared myotis are colonial and after feeding they often gather in night
roosts that are near, but separate from, day roosts. Little is known about the hibernation habits of
western long-eared myotis, but it is assumed that they hibernate in relatively small groups in
caves or mines (Adams 2003).
Notes
Western long-eared myotis was less
common relative to other species
(Table 3). . One male was captured
and 25 acoustic occurrences
recorded. It was positively associated
with conifer and deciduous trees (habitat
analysis; Table 5) and cliffs and rugged
terrain (summer distribution; figure
right).
© Paula O’Briant WYNDD

Bats of Southern Wyoming, Wyoming Natural Diversity Database, 2012
52
Big Brown Bat (Eptesicus fuscus)
Species Ecology
The big brown bat is found across most of North
America. Although it has been documented in
sagebrush, it is most often associated with forested
habitats and ranges from low-elevation riparian to high-
elevation conifer habitats in Wyoming. They are beetle-
eating specialists, but will also take other winged insects.
Big brown bats are year-round residents and hibernate
alone or in small groups in caves, abandoned mines, or
human structures. Females form large maternity
colonies in the summer which disband in August or
September when they join up with the males, mate,
and find hibernacula.
Notes
Big brown bats were positively associated
with conifer and deciduous trees (habitat
analysis; Table 5) and water and rock
formations (summer distribution; figure
right). They were the second most abundant
species caught in mist nets (13 captures), but
relatively few (21) acoustic occurrences were
recorded. Of the individuals caught in mist
nets, 1 reproductive female was captured, 3
reproductive males, and 9 non-reproductive
males. This provides some evidence of
juvenile rearing and breeding in the study
area.
© Paula O’Briant,
WYNDD

Bats of Southern Wyoming, Wyoming Natural Diversity Database, 2012
53
Fringed Myotis (Myotis thysanodes)
Species Ecology
The fringed myotis ranges across most of western
North America preferring dry woodlands at mid-
elevations. In Wyoming, the species occurs primarily
in the sagebrush steppe and open forests of the
mountain foothills (Keinath et al., 2010). Fringed
myotis are thought to migrate intermediate distances
between summer roosts and winter hibernacula, but
very little information is available about its migration
habits (Adams 2003). It has been documented
roosting in rock crevices, caves, mines, and buildings,
but it was also found throughout Grand Teton National
Park in the apparent absence of such features, leading Keinath (2005) to assume that snags were also used as
roosts. Fringed myotis primarily eat beetles and moths which they catch within the forest canopy or along
forest edges.
Notes
Fringed myotis was somewhat
uncommon in the study area. This could
be because of its association with conifer
trees (see above and Table 5). This
preference was reinforced in summer
distribution modeling (see left) where it
had a negative correlation with
sagebrush and a positive correlation with
flowing water. No fringed myotis were
captured in mist nets but 14 acoustic
occurrences were recorded.
© Hannah Griscom,
WYNDD

Bats of Southern Wyoming, Wyoming Natural Diversity Database, 2012
54
Pallid Bat (Antrozous pallidus)
Species Ecology
The pallid bat inhabits low desert
shrublands, juniper woodlands,
grasslands, and nearby cottonwood-
riparian zones. It is most common in
low, arid regions with rocky outcrops.
Roost structures are usually rock
crevices and buildings, but also rock
piles, tree cavities, shallow caves, and
abandoned mines. It likely hibernates
in narrow crevices within caves and abandoned mines. The pallid bat emerges about 1 hour after
sunset to forage. It
primarily gleans large insect
prey from the ground and
vegetation, but also forages
in flight within about 3 m
(10 ft) of the ground.
Notes
Pallid bat was somewhat
uncommon in southern
Wyoming; none were
captured in mist nets, and 13
acoustic occurrences were
recorded. As further
confirmation of habitat preferences discussed above, we found a positive correlation with rock/cliff
habitat (Table 5). Areas with bare ground and cliffs pulled out as important predictors in the summer
distribution model (see above) in addition to water features.
© Doug Keinath
WYNDD

Bats of Southern Wyoming, Wyoming Natural Diversity Database, 2012
55
Townsend’s Big-eared Bat (Corynorhinus townsendii)
Species Ecology
The most critical and restrictive feature of Townsend's
big-eared bat ecology is the requirement for large
cavern-like structures for roosting during all stages of
its life-cycle. Maternity roosts are even more limiting,
as they must be consistently warm throughout the
breeding season. This results in a general preference
for warm, low-mid elevation habitats. Otherwise,
habitat use is fairly general and driven by prey
availability. Townsend’s big-eared bat forages
primarily along edge habitats (e.g., forest edges,
intermittent streams), but also in forests and along
vegetated stream corridors. All reports indicate that it is an agile flier specializing on moths,
which it captures on the wing. It occurs in Wyoming year-round, migrating short distances to
hibernate in thermally-stable caves.
Survey & Modeling Notes
The range for Townsend’s big-eared bat
only overlaps with the northern quarter of
our study area (Adams 2003, Keinath et al.
2010). Unsurprisingly, we only recorded 2
occurrences of Townsend’s big-eared bat
and they were both near Green Mountain,
indicating that there may be a communal
roosting cave in that area. The map to the
right shows where these occurrences were
in relation to existing data points in
WYNDD’s database. There was
insufficient input data to produce a reliable
summer distribution model for Townsend’s
big-eared bat in southern Wyoming.

Bats of Southern Wyoming, Wyoming Natural Diversity Database, 2012
56
Eastern Red Bat (Lasiurus borealis)
Species Ecology
The eastern red bat has a wide range across central and
eastern North America, but only occurs in far eastern
Wyoming. It is one of three species that migrates from
the southern and eastern United States to spend its
summers in Wyoming. The red bat primarily roosts in
the foliage of deciduous trees, hanging upside down,
apparently imitating a dried leaf. It is generally solitary,
except during fall migration. In Wyoming, most records
are from riparian areas near perennial water where it preys by aerial pursuit on moths and other insects.
Survey & Modeling Notes
Eastern red bats were uncommon in the study area
with one mist net capture and two acoustic
occurrences (see green points in map below). There
were insufficient data overall to produce a summer
distribution model, however a migration stopover
model was created (right) based on its assumed
affinity for deciduous trees and water. The stopover
model pulled out extensive areas of aspen in the
Sierra Madre and Laramie Mountains that are below
2500m elevation, but it is likely that cottonwood
forests along river valleys are more commonly used
during migration than the aspen at these higher
elevations.
© Hannah Griscom
WYNDD

Bats of Southern Wyoming, Wyoming Natural Diversity Database, 2012
57
APPENDIX B: LITERATURE REVIEW OF BAT MIGRATION & WIND
TURBINE FATALITIES
This literature review focuses on the behavior and physiology of migratory bats in relation to
wind turbine fatalities. We provide a detailed explanation of the parameters we used to build
the migration model (Figure 4) and provide starting points to improve future iterations.
Although most of this review is focused on migratory bats, year-round residents are also at risk
for being killed by wind turbines (Johnson 2005, Jain et al. 2011). Wind turbines also have the
potential to fragment bat habitat by creating ground and air barriers that prevent or restrict
movement across the landscape. Because of these potential direct and indirect impacts to
migratory and resident bats, we have presented distribution models for all species in the body
of this report. Here, however, our focus is only on migratory bats.
Trends in bat fatalities at wind energy facilities
Bat fatalities at wind energy facilities have been documented across North America, and have
been the focus of much scientific attention in recent years. By studying the common patterns
observed across different facilities, the factors driving bat fatalities and possible mitigation
measures have begun to emerge in the literature. We now know that bats are killed by direct
impact or internal hemorrhage when they fly too close to moving turbine blades (Baerwald et
al. 2008). Although all species are at risk (Kunz et al. 2007, Jain et al. 2011) migratory species
represent about 75-83% of the bats killed by turbines (Kunz et al. 2007, Johnson 2005) and
hoary bats comprise about half of all fatalities (Arnett et al. 2008). Also, these migratory
species are more likely to be killed during fall migration than during spring migration (Arnett et
al. 2008, Young et al. 2003, and others). Many studies also show that bat fatalities increase
sharply on nights when wind speeds are low, moon illumination is low, cloud cover is high,
barometric pressure is low, and temperatures are warm (Baerwald and Barclay 2011, Cryan and
Brown 2007). These conditions are probably favorable to mass migration events, and it has
been suggested that shutting down wind turbines under such conditions during August and
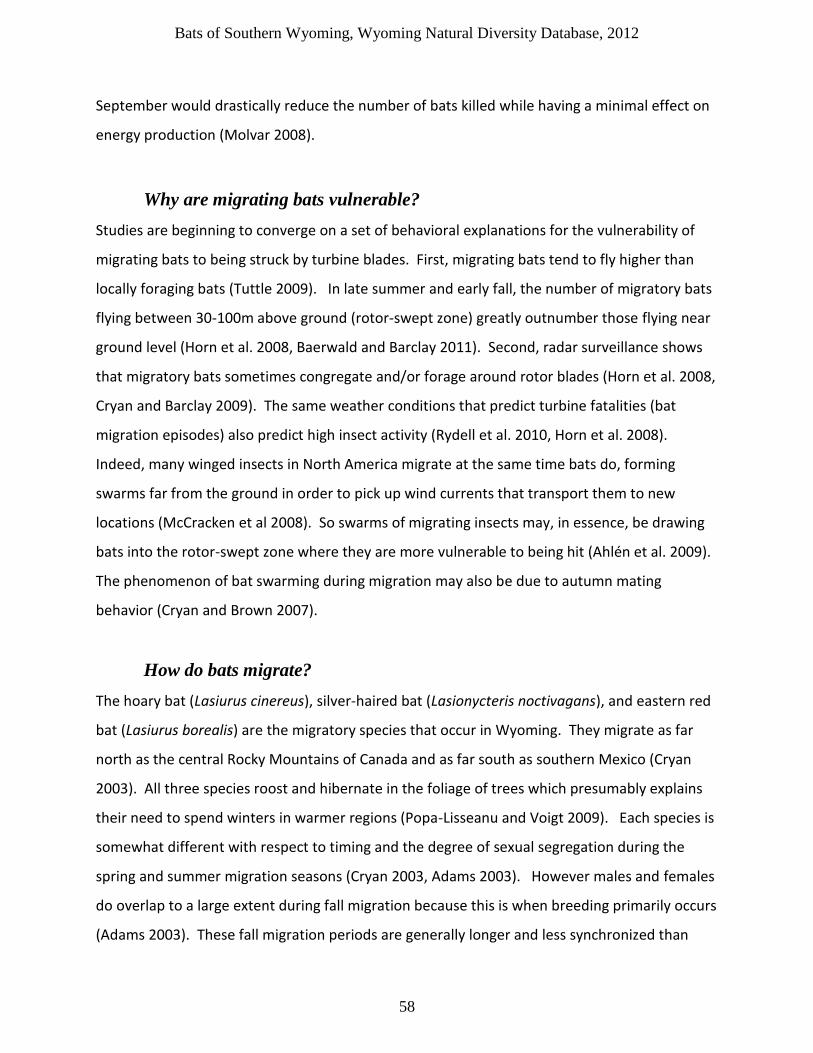
Bats of Southern Wyoming, Wyoming Natural Diversity Database, 2012
58
September would drastically reduce the number of bats killed while having a minimal effect on
energy production (Molvar 2008).
Why are migrating bats vulnerable?
Studies are beginning to converge on a set of behavioral explanations for the vulnerability of
migrating bats to being struck by turbine blades. First, migrating bats tend to fly higher than
locally foraging bats (Tuttle 2009). In late summer and early fall, the number of migratory bats
flying between 30-100m above ground (rotor-swept zone) greatly outnumber those flying near
ground level (Horn et al. 2008, Baerwald and Barclay 2011). Second, radar surveillance shows
that migratory bats sometimes congregate and/or forage around rotor blades (Horn et al. 2008,
Cryan and Barclay 2009). The same weather conditions that predict turbine fatalities (bat
migration episodes) also predict high insect activity (Rydell et al. 2010, Horn et al. 2008).
Indeed, many winged insects in North America migrate at the same time bats do, forming
swarms far from the ground in order to pick up wind currents that transport them to new
locations (McCracken et al 2008). So swarms of migrating insects may, in essence, be drawing
bats into the rotor-swept zone where they are more vulnerable to being hit (Ahlén et al. 2009).
The phenomenon of bat swarming during migration may also be due to autumn mating
behavior (Cryan and Brown 2007).
How do bats migrate?
The hoary bat (Lasiurus cinereus), silver-haired bat (Lasionycteris noctivagans), and eastern red
bat (Lasiurus borealis) are the migratory species that occur in Wyoming. They migrate as far
north as the central Rocky Mountains of Canada and as far south as southern Mexico (Cryan
2003). All three species roost and hibernate in the foliage of trees which presumably explains
their need to spend winters in warmer regions (Popa-Lisseanu and Voigt 2009). Each species is
somewhat different with respect to timing and the degree of sexual segregation during the
spring and summer migration seasons (Cryan 2003, Adams 2003). However males and females
do overlap to a large extent during fall migration because this is when breeding primarily occurs
(Adams 2003). These fall migration periods are generally longer and less synchronized than

Bats of Southern Wyoming, Wyoming Natural Diversity Database, 2012
59
spring migrations (Cryan 2003, Furnamkiewicz and Kucharska 2009), perhaps as an adaptation
to increase breeding opportunities or decrease competition for resources (Flemming and Eby
2003). In any case, the lengthened migration period may be another factor contributing to
higher fatality rates during fall migration compared with spring migration.
A bat’s journey from summer to winter grounds spans several weeks and is composed of two
repeating phases; ‘migration flight’ and ‘stopover’ (McGuire et al. 2012, Fleming and Eby 2003,
Taylor et al. 2011). Migration flights occur at night and end at a stopover site. For foliage-
roosting bats such as our three species of interest, bats find a suitable tree roost and enter
torpor during the following day. They then stay near this roost for one or more days, resting
and stocking up on food and water until conditions are favorable for another migration flight
(McGuire et al. 2012, Taylor et al. 2011, Fleming and Eby 2003). In order to accurately
represent bat migration, we need to be able to model both ‘migration flight/habitat’ and
‘stopover habitat’.
Migration Flight
Do bats use ‘corridors’?
Because southern Wyoming has few trees, potential stopover habitat is limited and fairly easy
to identify. However we know from the fatality studies described above that bats are at least
as vulnerable during migration flight as they are while foraging around stopover locations. So
how do we model their migration flights? Do they follow established corridors? Do they fly
straight south, regardless of terrain, or do they try to stay near patches of feeding and drinking
habitat? Unfortunately, there is no clear answer to these questions as there is evidence for and
against the ‘corridor’ concept.
Several studies have documented bats flocking during migration flights (Fleming and Eby 2003)
suggesting that they do concentrate together. They may also cluster during stopover periods,
as Ruczynski et al. (2007) documented that N. noctula relied on conspecific echolocations to
identify suitable tree roosts. Furmankiewicz and Kucharska (2009) documented more migratory

Bats of Southern Wyoming, Wyoming Natural Diversity Database, 2012
60
bats along a major riparian corridor in Poland than in adjacent habitat. In Alberta, Canada,
Baerwald and Barclay (2009) showed that turbines placed closer to mountains and trees were
more likely to kill migratory bats than turbines in open grasslands. Valdez and Cryan (2009)
documented large numbers of hoary bats foraging along cottonwood riparian forests in New
Mexico during spring migration. Indeed, it seems logical that foliage-roosting bats would prefer
to migrate through mesic and forested habitats in the otherwise dry Rocky Mountain region as
this would allow them to stop, rest, and refuel when needed. However a number of studies
(summarized by Arnett et al. 2008) looked at the number of turbine fatalities in relation to
nearby habitat types and found no relationship, indicating that bats fly somewhat evenly or
unpredictably across the landscape. Because of the conflicting results of the aforementioned
studies, and lacking empirical data of our own, we are forced to assume that the hoary, silver-
haired, and eastern red bat do not use migration corridors in southern Wyoming. For this
reason, we elected not to model migration flight in this report.
How far is a typical migration flight?
Bats are capable of sustained flights over 50km when conditions require it. For example,
Pipistrellus nathusii can fly more than 150km in one night when crossing the Baltic Sea (Ahlén
1997). There are also examples of bats migrating over the open ocean 15-30 miles from the
coastline (Ahlén et al. 2009, Cryan and Brown 2007). However, after reviewing many studies,
Fleming and Eby (2003) conclude that most migratory bat species travel roughly 30-50km per
night, broken up by periodic bouts of feeding and drinking. Unlike birds, migratory bats do not
accumulate fat reserves prior to migration, and water loss during flight is about 3% of body
mass for every hour of flight (Fleming and Eby 2003). These metabolic demands of flight are
the primary limitation on the distance bats can travel before refueling. In a physiological model
of optimal migration distance, Hedenström (2009) arrived at 24-46km per night for a 10g bat
(similar to the body mass of silver-haired and eastern red bat). Other studies have arrived at
similar estimates, with larger bats able to travel further. For example, Petersons (2004)
estimated the average flight distance for migratory Pipistrellus nathusii (5-15g) to be 48km per
night whereas the grey-headed flying fox (Pteropus poliocephalus; 500g-1000g) travels 50-
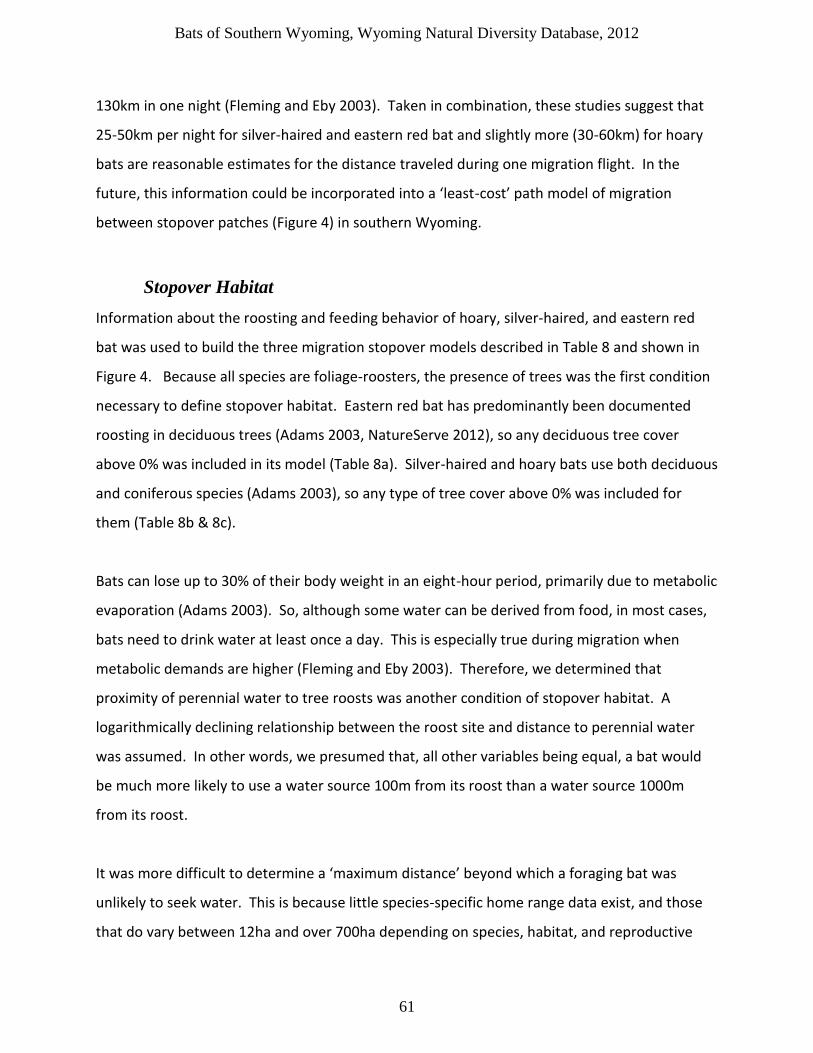
Bats of Southern Wyoming, Wyoming Natural Diversity Database, 2012
61
130km in one night (Fleming and Eby 2003). Taken in combination, these studies suggest that
25-50km per night for silver-haired and eastern red bat and slightly more (30-60km) for hoary
bats are reasonable estimates for the distance traveled during one migration flight. In the
future, this information could be incorporated into a ‘least-cost’ path model of migration
between stopover patches (Figure 4) in southern Wyoming.
Stopover Habitat
Information about the roosting and feeding behavior of hoary, silver-haired, and eastern red
bat was used to build the three migration stopover models described in Table 8 and shown in
Figure 4. Because all species are foliage-roosters, the presence of trees was the first condition
necessary to define stopover habitat. Eastern red bat has predominantly been documented
roosting in deciduous trees (Adams 2003, NatureServe 2012), so any deciduous tree cover
above 0% was included in its model (Table 8a). Silver-haired and hoary bats use both deciduous
and coniferous species (Adams 2003), so any type of tree cover above 0% was included for
them (Table 8b & 8c).
Bats can lose up to 30% of their body weight in an eight-hour period, primarily due to metabolic
evaporation (Adams 2003). So, although some water can be derived from food, in most cases,
bats need to drink water at least once a day. This is especially true during migration when
metabolic demands are higher (Fleming and Eby 2003). Therefore, we determined that
proximity of perennial water to tree roosts was another condition of stopover habitat. A
logarithmically declining relationship between the roost site and distance to perennial water
was assumed. In other words, we presumed that, all other variables being equal, a bat would
be much more likely to use a water source 100m from its roost than a water source 1000m
from its roost.
It was more difficult to determine a ‘maximum distance’ beyond which a foraging bat was
unlikely to seek water. This is because little species-specific home range data exist, and those
that do vary between 12ha and over 700ha depending on species, habitat, and reproductive

Bats of Southern Wyoming, Wyoming Natural Diversity Database, 2012
62
status (Fleming and Eby 2003). In New Hampshire, Veilleux et al. (2009) documented a 156ha
foraging range for a hoary bat which equals a 600m circular radius around the roost. In
contrast, pregnant little brown myotis only ranged about 300m from their maternity roost site
(Henry et al. 2002). The studies cited by Fleming and Eby (2003) indicate that most small-to-
medium sized bats range between 300m and 1000m from their roost sites with some species
going as far as 3km. We determined, therefore, that 5km was probably the maximum distance
that foliage-roosting bats would want to range in search of water. With a lack of species-
specific information, we applied this same threshold across all three species (Table 8). Bats also
need to eat while stopping over during migration, but because all three species have been
documented feeding on insects near water or trees, the first two conditions of the models
fulfilled foraging needs.
Based on differences in flight behavior and habitat (Adams 2003), some information is available
about the types of water the three species prefer to eat and drink from. Eastern red bats are
typically associated with riparian forests and, as a result, usually forage along large rivers (Table
8a.; stream order of 2 or more) and secondarily at large and medium-sized ponds. Hoary bats
are fast flyers and pursue prey by aerial hawking. As a result, they are most comfortable
foraging and drinking at large, open water bodies, rather than narrow rivers and streams.
Silver-haired bats are typically found at ponds or open water in forested environments. They
are agile flyers and as such, can also forage within the confines of streams and rivers.
Future Model Improvements
Upcoming surveys in 2012 will focus more on tracking migration activity in different habitats in
Southern Wyoming and will hopefully lead to better empirical information about bat migration
flight and stopover patterns. This information can be combined with what is known about
migration flight behavior and distance (above) to create ‘least-cost’ path models of migration
between patches of stopover habitat. In creating future iterations of the ‘bat exposure’ map, it
may be more accurate to weigh the migration model higher than the summer distribution

Bats of Southern Wyoming, Wyoming Natural Diversity Database, 2012
63
model (1.5:1) because migratory bats comprise 75% of turbine fatalities are therefore 1.5 times
more vulnerable to turbine fatalities.
Literature Cited
Adams, R.A. 2003. Bats of the Rocky Mountain West. University Press of Colorado, Boulder, Colorado.
Ahlén, I. 1997. Migratory behavior of bats at south Swedish coasts. International Journal of
Mammalian Biology, 62(6) p.375-380 Ahlén, I., H.J. Baagoe, and L.Bach. 2009. Behavior of Scandinavian bats during migration and
foraging at sea. Journal of Mammalogy, 90(6) p.1318-1323. Arnett, E.B., W.K. Brown, W.P. Erickson, et al. 2008. Patterns of bat fatalities at wind energy
facilities in North America. Journal of Wildlife Management, 72(1) p.61-78. Baerwald, E.F., G.H. D’Amours, B.J. Klug, and R.M.R. Barclay. 2008. Barotrauma is a significant
cause of bat fatalities at wind turbines. Current Biology, 18(16) p.R695-R696. Baerwald, E.F. and R.M.R. Barclay. 2009. Geographic variation in activity and fatality of
migratory bats at wind energy facilities. Journal of Mammology, 90(6):1341-1349. Baerwald, E.F. and R.M.R. Barclay. 2011. Patterns of activity and fatality of migratory bats at a
wind energy facility in Alberta, Canada. Journal of Wildlife Management, 75(5) p.1103-1114.
Cryan, P.M. 2003. Seasonal distribution of migratory tree bats (Lasiurus and Lasionycteris) in
North America. Journal of Mammalogy, 84(2) p.579-593. Cryan, P.M. and A.C. Brown. 2007. Migration of bats past a remote island offers clues toward
the problem of bat fatalities at wind turbines. Biological Conservation, 139 p.1-11. Cryan, P.M. and R.M.R. Barclay. 2009. Causes of bat fatalities at wind turbines: hypotheses and
predictions. Journal of Mammalogy, 90(6) p.1330-1340. Fleming, T.H. and P. Eby. 2003. Ecology of bat migration. Pages 156-208 in T.H. Kunz and M.B.
Fenton, editors. Bat ecology. University of Chicago Press, Chicago, Illinois, USA. Furmankiewicz, J. and M. Kucharska. 2009. Migration of bats along a large river valley in
southwestern Poland. Journal of Mammalogy, 90(6) p.1310-1317.
Bats of Southern Wyoming, Wyoming Natural Diversity Database, 2012
64
Hedenström, A. 2009. Optimal migration strategies in bats. J. of Mammalogy, 90(6): 1298-
1309. Henry, M., D.W. Thomas, R. Vaudry, and M. Carrier. 2002. Foraging distances and home range
of pregnant and lactating little brown bats. Journal of Mammalogy, 83(3): 767-774. Horn, J.W., E.B. Arnett, and T.H. Kunz. 2008. Behavioral responses of bats to operating wind
turbines. Journal of Wildlife Management, 72(1) p.123-132. Jain, A.A., R.R. Koford, A.W. Hancock, and G.G. Zenner. 2011. Bat mortality and activity at a
northern Iowa wind resource area. American Midland Naturalist, 165(1) p.185-200. Johnson, G.D. 2005. A review of bat mortality at wind-energy developments in the United
States. Bat Research News, 46(2) p.45-49. Kunz, T. H., E. B. Arnett, W. P. Erickson, A. R. Hoar, G. D. Johnson, R. P. Larkin, M. D. Strickland,
R. W. Thresher, and M. D. Tuttle. 2007. Ecological impacts of wind energy development on bats: questions, research needs, and hypotheses. Frontiers of Ecology and Environment, 5: 315-324.
McCracken, G.F., E.H. Gillam, J.K. Westbrook et al. 2008. Brazilian free-tailed bats (Tadarida
brasiliensis : Molossidae, Chiroptera) at high altitude: links to migratory insect populations. Integrative and Comparative Biology, 48(1) p.107-118.
McGuire, L.P, C.G Guglielmo, S.A. Mackenzie, and P.D. Taylor. 2012. Migratory stopover in the
long-distance migrant silver-haired bat, Lasionycteris noctivagans. J. of Animal Ecology, 81, 377-385.
Molvar, E.M. 2008. Wind power in Wyoming: Doing it Smart from the Start. Laramie, WY:
Biodiversity Conservation Alliance, 55 pp. http://www.voiceforthewild.org/ WindPowerReport.pdf (accessed 5/18/2012).
NatureServe. 2012. NatureServe Explorer: An online encyclopedia of life [web application].
Version 7.1. NatureServe, Arlington, Virginia. Available http://www.natureserve.org/explorer. (Accessed: May 24, 2012 ).
Petersons, G. 2004. Seasonal migrations of north-eastern populations of Nathusius’ bat
Pipistrellus nathusii (Chiroptera). Myotis, 41-2, p.29-56. Popa-Lisseanu, A.G. and C.C. Voigt. 2009. Bats on the move. J. of Mammalogy, 90(6): 1283-
1289.

Bats of Southern Wyoming, Wyoming Natural Diversity Database, 2012
65
Reimer, J.P, E.F. Baerwald, and R.M.R. Barclay. 2010. Diet of hoary and silver haired bats while migrating through southwestern Alberta in late summer and autumn. American Midland Naturalist, 164(2) pp. 230-237.
Ruczynski, I., E.K.V. Kalko, B.M., and B.M. Siemers. 2007. The sensory basis of roost finding in a
forest bat, Nyctalus noctula. Journal of Experimental Biology, 210(2) p. 3607-3615. Rydell, J., L. Bach, M. Dubourg-Savage, M. Green, L. Rodrigues, and A. Hedenstrom. 2010.
Mortality of bats at wind turbines links to nocturnal insect migration? European Journal of Wildlife Research, 56 p.823-827.
Taylor P.D., Mackenzie S.A., Thurber B.G,. 2011. Landscape Movements of Migratory Birds and
Bats Reveal an Expanded Scale of Stopover. PLoS ONE 6(11): e27054. doi:10.1371/journal.pone.0027054
Tuttle, M.D. 2009. Deadly Flights. Science, 325 p.386-387. Valdez, E.W. and P.M. Cryan. 2009. Food habits of the hoary bat (Lasiurus cinereus) during
spring migration through New Mexico. Southwestern Naturalist, 54(2) p. 195-200. Young, D.P., W.P. Erickson, R.E. Good, M.D. Strickland, and G.D. Johnson. 2003. Avian and bat
mortality associated with the initial phase of the Foote Creek Rim windpower project, Carbon, County, Wyoming. A report prepared for Pacificorp, Inc, SeaWest Windpower Inc., and the Rawlins District Office of the Bureau of Land Management by Western EcoSystems Technology, Inc., Cheyenne, Wyoming. http://www.west-inc.com/reports/fcr_final_mortality.pdf (accessed May, 2012)

Bats of Southern Wyoming, Wyoming Natural Diversity Database, 2012
66
APPENDIX C: 2011 MIST NET CAPTURE RESULTS
Site Name UTM Zone (NAD 1983)
Easting Northing SPECIES 4 letter code
Bat ID #
TOC 24hr
Sex (m/f)
Age j/a
Repro code
FA mm
Th mm
E mm
Wt g
Keel y/n
WDI code
Photo #
BvrCrkPond 13 327490 4590447 MYLU 1 2230 f a n 39 5.7 11.3 7 n 0-P 1093-1094
BvrCrkPond 13 327490 4590447 MYLU 2 2300 f a p 39.2 9.2 10 n 1 1095-1096
BvrCrkPond 13 327490 4590447 MYLU 3 2300 f a p 38.7 7.9 12 n 0 1097-1100
BvrCrkPond 13 327490 4590447 MYLU 4 2325 f a n 37 8 n 1 1101-1103
Laezenbynets 13 450997 4558334 LACI 1 2215 m a n - - - 27 - 0 1072-7074
Laezenbynets 13 450997 4558334 LANO 1 2300 m a n - - - 10 n 1-P 1084-1085
Laezenbynets 13 450997 4558334 MYLU 2 2255 f a p 39.2 6 9.7 11 n 2 1078-1080
Laezenbynets 13 450997 4558334 MYLU 4 2315 f a n 36.8 6.9 11.5 8 - 0-P 1086-1088
Laezenbynets 13 450997 4558334 MYLU 5 0105 f a n 38 5.7 10.9 11 n 1 1089-1092
Laezenbynets 13 450997 4558334 MYLU 1 2230 f a n 36.6 8.2 12.7 8 n 0-P 1075-1076
Laezenbynets 13 450997 4558334 MYLU 3 2300 m a n 41 6.4 10.7 9 n 0 1080-1083
Mirmile 13 345561 4672180 EPFU 4 0015 f a l 20 y 0 1117-1118
Mirmile 13 345561 4672180 EPFU 3 2353 m a d 13 y 0 1115
Mirmile 13 345561 4672180 EPFU 1 2110 m a d 18 y 0 1105
Mirmile 13 345561 4672180 EPFU 2 2319 m a n 16.5 y 0 1113
Mirmile 13 345561 4672180 EPFU 5 0015 m a n 16 y 1 1119
Mirmile 13 345561 4672180 LACI 1 2110 m a n 22 n 0 1110
Mirmile 13 345561 4672180 LANO 1 2335 m a n 46.2 13.2 12.5 n 2 1114
Mirmile 13 345561 4672180 MYLU 1 2110 f a n 37.5 7 13.8 10 n 1 1104
Mirmile 13 345561 4672180 MYLU 2 2110 m a n 36.2 6.2 11.5 7 n 2 1106
Mirmile 13 345561 4672180 MYLU 3 2110 m a n 36.5 5.8 11.9 7 n 0 1107
Mirmile 13 345561 4672180 MYLU 4 2110 m a d 38.6 7 n 0 1108
Mirmile 13 345561 4672180 MYLU 5 2110 m a n 39.3 7 n 0 1109
Mirmile 13 345561 4672180 MYLU 6 2110 m a n 37.1 7 n 0 1111
Mirmile 13 345561 4672180 MYLU 7 2110 m a n 6 n 0 1112
Mirmile 13 345561 4672180 MYLU 8 0015 m a n 37 8 n 1 1116
OptimistNet 13 449339 4573253 LABO 1 2215 f a n 41.1 7.2 15 n 0 1167
OptimistNet 13 449339 4573253 LACI 1 2130 m a n 55 24 n 0 1166
OptimistNet 13 449339 4573253 MYLU 1 2115 m a n 38.7 10.5 n 0 1165
Pole Creek 13 465237 4566890 LACI 1 2345 m a n 52.9 10.9 12.9 30 n 0 -
Pole Creek 13 465237 4566890 MYLU 1 2221 m a n 36.1 6.5 10 7 n 0-P 1034-1038
QCreekNets 13 369864 4673009 EPFU 1 2200 m a d 43.4 17 y 0-P 1132
QCreekNets 13 369864 4673009 EPFU 2 2300 m a n 45.7 18 y 1-P 1134

Bats of Southern Wyoming, Wyoming Natural Diversity Database, 2012
67
QCreekNets 13 369864 4673009 EPFU 3 0035 m a n 45.8 16 y 0 1139
QCreekNets 13 369864 4673009 LANO 2 2200 m a n 41.4 8.5 n 0 1131
QCreekNets 13 369864 4673009 LANO 1 2145 m a n 43.5 8.5 n 0 1130
QCreekNets 13 369864 4673009 LANO 3 2240 m a n 37.9 12 0 1133
QCreekNets 13 369864 4673009 MYEV 1 2145 m a n 39 5.2 21.4 13 y 0 1127-1129
QCreekNets 13 369864 4673009 MYLU 1 2306 m a n 38.1 7.1 11.8 10 n 0 1135
QCreekNets 13 369864 4673009 MYLU 2 0020 m a n 38.3 5.5 14.3 8.5 n 0-P 1137
QCreekNets 13 369864 4673009 MYLU 3 0035 m a n 37.9 8 n P 1138
QCreekNets 13 369864 4673009 MYVO 1 2345 m a n 40.6 4.9 8 y 1 1136
SAGE RES NETS 13 308204 4608620 MYLU 4 2200 f a n 39.7 5.9 8 n 0 1143-1144
SAGE RES NETS 13 308204 4608620 MYLU 2 2145 f j n 39.2 6.2 6 n 0-P 1141
SAGE RES NETS 13 308204 4608620 MYLU 1 2145 m a d 38.6 5.9 8 n 0 1140
SAGE RES NETS 13 308204 4608620 MYLU 3 2145 m a n 37.7 6.6 8 n 0-P 1142
Sb2 13 372393 4682320 LACI 1 2145 m a n 52.7 29 n 0 1120
Sb2 13 372393 4682320 MYLU 1 0015 m a n 40.7 6 12.5 9 n 0 1121
Sb2 13 372393 4682320 MYVO 1 0015 m a n 39.3 5.9 9.6 7 y 0 1122-1126
SweetWaterNets 13 271116 4711970 MYLU 1 2058 f a L 38.9 6.2 7 n 0 1145
SweetWaterNets 13 271116 4711970 MYLU 2 2115 f a L 37.8 5.5 7 n 0 1146
SweetWaterNets 13 271116 4711970 MYLU 3 2115 f a n 36.6 6.5 n P 1147
SweetWaterNets 13 271116 4711970 MYLU 4 2115 f a L 37.3 6 n 0 1148
SweetWaterNets 13 271116 4711970 MYLU 5 2115 f a n 37.4 6 n 0 1149
SweetWaterNets 13 271116 4711970 MYLU 6 2230 f j n 37.7 6.4 7 n 0 1150
SweetWaterNets 13 271116 4711970 MYLU 7 0015 f j n 39.2 13.3 7 n 0 1151
SweetWaterNets 13 271116 4711970 MYLU? - 2115 - - - - - - 8 - - -
Turtle 1 13 469220 4556660 EPFU 3 2215 m a n 48.4 8.9 12.1 20 y 1-P
Turtle 1 13 469220 4556660 EPFU 4 005 m a n 45.1 7.5 12.2 17 y 1-P 1062-1063
Turtle 1 13 469220 4556660 EPFU 5 0030 m a n 13 y 1-P 1066
Turtle 1 13 469220 4556660 EPFU 1 2145 m a n 45 7.6 10.1 14 y 1-P 1043-1046
Turtle 1 13 469220 4556660 EPFU 2 2150 m a n 47.8 7 11.5 15 y 0-P 1047-1049
Turtle 1 13 469220 4556660 LACI 1 2335 m a n 24 0 1056-1061
Turtle 1 13 469220 4556660 LANO 1 2320 f a n 10 n 1-P
Turtle 1 13 469220 4556660 LANO 2 0015 m a n 12 2-P 1064
Turtle 1 13 469220 4556660 MYLU 1 2255 m a n 39 6.8 11.8 8 y 0-P
Turtle 1 13 469220 4556660 MYVO 1 2215 m a n 38.6 6.7 8.9 9 y 0
Turtle 1 13 469220 4556660 MYVO 2 2245 m a n 40.3 3.6 5.9 10 y 1-P
Turtle 1 13 469220 4556660 MYVO 3 0030 m a n 37.3 7 y 1065

Bats of Southern Wyoming, Wyoming Natural Diversity Database, 2012
68
APPENDIX D: 2011 SPECIES OCCURRENCES
Scientific Name Common Name Date Survey Type Easting NAD83_13N
Northing NAD83_13N
Antrozous pallidus Pallid Bat 8/6/2011 Recording-Anabat 277255 4703299
Antrozous pallidus Pallid Bat 7/5/2011 Recording-Anabat 297416 4583677
Antrozous pallidus Pallid Bat 7/20/2011 Recording-Anabat 349562 4677205
Antrozous pallidus Pallid Bat 8/7/2011 Recording-Anabat 329426 4637886
Antrozous pallidus Pallid Bat 8/22/2011 Recording-Anabat 465850 4545383
Antrozous pallidus Pallid Bat 8/6/2011 Recording-Anabat 275358 4694592
Antrozous pallidus Pallid Bat 8/3/2011 Recording-Anabat 308204 4608620
Antrozous pallidus Pallid Bat 8/21/2011 Recording-Anabat 329558 4638006
Antrozous pallidus Pallid Bat 7/20/2011 Recording-Anabat 347216 4671545
Antrozous pallidus Pallid Bat 7/18/2011 Recording-Anabat 341441 4669410
Antrozous pallidus Pallid Bat 6/22/2011 Recording-Anabat 465196 4566830
Antrozous pallidus Pallid Bat 6/15/2011 Recording-Anabat 310549 4681335
Antrozous pallidus Pallid Bat 8/4/2011 Recording-Song Meter 309474 4619358
Corynorhinus townsendii Townsend's Big-eared Bat 8/4/2010 Capture-mist net 337788 4699352
Corynorhinus townsendii Townsend's Big-eared Bat 8/6/2011 Recording-Anabat 275358 4694592
Corynorhinus townsendii Townsend's Big-eared Bat 8/5/2011 Recording-Song Meter 278906 4693595
Eptesicus fuscus Big Brown Bat 7/24/2011 Capture-mist net 369864 4673009
Eptesicus fuscus Big Brown Bat 7/18/2011 Capture-mist net 345561 4672180
Eptesicus fuscus Big Brown Bat 6/23/2011 Capture-mist net 469220 4556660
Eptesicus fuscus Big Brown Bat 8/21/2011 Recording-Anabat 415787 4543954
Eptesicus fuscus Big Brown Bat 7/22/2011 Recording-Anabat 370378 4672612
Eptesicus fuscus Big Brown Bat 7/23/2011 Recording-Anabat 392966 4691619
Eptesicus fuscus Big Brown Bat 8/22/2011 Recording-Anabat 465850 4545383
Eptesicus fuscus Big Brown Bat 8/6/2011 Recording-Anabat 275358 4694592
Eptesicus fuscus Big Brown Bat 8/3/2011 Recording-Anabat 308204 4608620
Eptesicus fuscus Big Brown Bat 8/5/2011 Recording-Anabat 272447 4711766
Eptesicus fuscus Big Brown Bat 6/24/2011 Recording-Anabat 412918 4554038
Eptesicus fuscus Big Brown Bat 8/6/2011 Recording-Anabat 278621 4695383
Eptesicus fuscus Big Brown Bat 7/19/2011 Recording-Anabat 340939 4669590
Eptesicus fuscus Big Brown Bat 8/21/2011 Recording-Anabat 414833 4552533
Eptesicus fuscus Big Brown Bat 8/21/2011 Recording-Anabat 414921 4552028
Eptesicus fuscus Big Brown Bat 8/22/2011 Recording-Anabat 449339 4573253
Eptesicus fuscus Big Brown Bat 7/20/2011 Recording-Anabat 347216 4671545
Eptesicus fuscus Big Brown Bat 7/18/2011 Recording-Anabat 341441 4669410
Eptesicus fuscus Big Brown Bat 6/22/2011 Recording-Anabat 465237 4566890
Eptesicus fuscus Big Brown Bat 6/22/2011 Recording-Anabat 465237 4566890
Eptesicus fuscus Big Brown Bat 8/22/2011 Recording-Song Meter 465961 4545415
Eptesicus fuscus Big Brown Bat 8/4/2011 Recording-Song Meter 309474 4619358
Eptesicus fuscus Big Brown Bat 8/3/2011 Recording-Song Meter 308204 4608620
Eptesicus fuscus Big Brown Bat 7/18/2011 Recording-Song Meter 345337 4672092

Bats of Southern Wyoming, Wyoming Natural Diversity Database, 2012
69
Lasionycteris noctivagans Silver-haired Bat 7/24/2011 Capture-mist net 369864 4673009
Lasionycteris noctivagans Silver-haired Bat 7/18/2011 Capture-mist net 345561 4672180
Lasionycteris noctivagans Silver-haired Bat 6/28/2011 Capture-mist net 450997 4558334
Lasionycteris noctivagans Silver-haired Bat 6/23/2011 Capture-mist net 469220 4556660
Lasionycteris noctivagans Silver-haired Bat 7/6/2011 Recording-Anabat 327490 4590447
Lasionycteris noctivagans Silver-haired Bat 7/5/2011 Recording-Anabat 297264 4582951
Lasionycteris noctivagans Silver-haired Bat 7/5/2011 Recording-Anabat 297416 4583677
Lasionycteris noctivagans Silver-haired Bat 7/6/2011 Recording-Anabat 327004 4590347
Lasionycteris noctivagans Silver-haired Bat 6/24/2011 Recording-Anabat 461089 4581959
Lasionycteris noctivagans Silver-haired Bat 7/5/2011 Recording-Anabat 299142 4584239
Lasionycteris noctivagans Silver-haired Bat 7/23/2011 Recording-Anabat 392966 4691619
Lasionycteris noctivagans Silver-haired Bat 8/6/2011 Recording-Anabat 275358 4694592
Lasionycteris noctivagans Silver-haired Bat 7/9/2011 Recording-Anabat 342362 4585431
Lasionycteris noctivagans Silver-haired Bat 7/19/2011 Recording-Anabat 343925 4677604
Lasionycteris noctivagans Silver-haired Bat 8/5/2011 Recording-Anabat 272447 4711766
Lasionycteris noctivagans Silver-haired Bat 7/19/2011 Recording-Anabat 341483 4669371
Lasionycteris noctivagans Silver-haired Bat 7/19/2011 Recording-Anabat 340939 4669590
Lasionycteris noctivagans Silver-haired Bat 8/21/2011 Recording-Anabat 329069 4637415
Lasionycteris noctivagans Silver-haired Bat 8/21/2011 Recording-Anabat 414983 4551603
Lasionycteris noctivagans Silver-haired Bat 7/7/2011 Recording-Anabat 328919 4589389
Lasionycteris noctivagans Silver-haired Bat 8/22/2011 Recording-Anabat 449339 4573253
Lasionycteris noctivagans Silver-haired Bat 7/18/2011 Recording-Anabat 341441 4669410
Lasionycteris noctivagans Silver-haired Bat 7/19/2011 Recording-Anabat 347185 4671471
Lasionycteris noctivagans Silver-haired Bat 6/23/2011 Recording-Anabat 451036 4558319
Lasionycteris noctivagans Silver-haired Bat 6/15/2011 Recording-Anabat 311197 4681098
Lasionycteris noctivagans Silver-haired Bat 7/23/2011 Recording-Song Meter 393080 4691157
Lasionycteris noctivagans Silver-haired Bat 8/22/2011 Recording-Song Meter 465961 4545415
Lasionycteris noctivagans Silver-haired Bat 8/4/2011 Recording-Song Meter 309474 4619358
Lasionycteris noctivagans Silver-haired Bat 8/3/2011 Recording-Song Meter 308204 4608620
Lasionycteris noctivagans Silver-haired Bat 8/5/2011 Recording-Song Meter 278906 4693595
Lasiurus borealis Eastern Red Bat 8/22/2011 Capture-mist net 449339 4573253
Lasiurus borealis Eastern Red Bat 7/24/2011 Recording-Anabat 369864 4673009
Lasiurus borealis Eastern Red Bat 8/21/2011 Recording-Anabat 414983 4551603
Lasiurus cinereus Hoary Bat 7/21/2011 Capture-mist net 372393 4682320
Lasiurus cinereus Hoary Bat 8/22/2011 Capture-mist net 449339 4573253
Lasiurus cinereus Hoary Bat 7/18/2011 Capture-mist net 345561 4672180
Lasiurus cinereus Hoary Bat 6/28/2011 Capture-mist net 450997 4558334
Lasiurus cinereus Hoary Bat 6/22/2011 Capture-mist net 465237 4566890
Lasiurus cinereus Hoary Bat 6/23/2011 Capture-mist net 469220 4556660
Lasiurus cinereus Hoary Bat 8/3/2011 Recording-Anabat 296769 4602087
Lasiurus cinereus Hoary Bat 8/4/2011 Recording-Anabat 308675 4608786
Lasiurus cinereus Hoary Bat 8/6/2011 Recording-Anabat 277076 4702332
Lasiurus cinereus Hoary Bat 8/21/2011 Recording-Anabat 331081 4641562
Lasiurus cinereus Hoary Bat 7/6/2011 Recording-Anabat 327490 4590447

Bats of Southern Wyoming, Wyoming Natural Diversity Database, 2012
70
Lasiurus cinereus Hoary Bat 7/5/2011 Recording-Anabat 297264 4582951
Lasiurus cinereus Hoary Bat 7/5/2011 Recording-Anabat 297416 4583677
Lasiurus cinereus Hoary Bat 7/23/2011 Recording-Anabat 389015 4688993
Lasiurus cinereus Hoary Bat 7/24/2011 Recording-Anabat 369864 4673009
Lasiurus cinereus Hoary Bat 8/5/2011 Recording-Anabat 271116 4711970
Lasiurus cinereus Hoary Bat 6/24/2011 Recording-Anabat 461089 4581959
Lasiurus cinereus Hoary Bat 7/9/2011 Recording-Anabat 342224 4585136
Lasiurus cinereus Hoary Bat 7/23/2011 Recording-Anabat 392966 4691619
Lasiurus cinereus Hoary Bat 8/6/2011 Recording-Anabat 275358 4694592
Lasiurus cinereus Hoary Bat 8/4/2011 Recording-Anabat 311442 4608089
Lasiurus cinereus Hoary Bat 7/9/2011 Recording-Anabat 342362 4585431
Lasiurus cinereus Hoary Bat 7/9/2011 Recording-Anabat 342391 4586162
Lasiurus cinereus Hoary Bat 7/19/2011 Recording-Anabat 343925 4677604
Lasiurus cinereus Hoary Bat 8/5/2011 Recording-Anabat 272447 4711766
Lasiurus cinereus Hoary Bat 6/24/2011 Recording-Anabat 412918 4554038
Lasiurus cinereus Hoary Bat 8/2/2011 Recording-Anabat 294873 4611960
Lasiurus cinereus Hoary Bat 7/19/2011 Recording-Anabat 342042 4668317
Lasiurus cinereus Hoary Bat 7/19/2011 Recording-Anabat 341943 4668498
Lasiurus cinereus Hoary Bat 7/19/2011 Recording-Anabat 341620 4668498
Lasiurus cinereus Hoary Bat 7/19/2011 Recording-Anabat 340939 4669590
Lasiurus cinereus Hoary Bat 8/21/2011 Recording-Anabat 415428 4553265
Lasiurus cinereus Hoary Bat 8/21/2011 Recording-Anabat 415095 4552907
Lasiurus cinereus Hoary Bat 8/21/2011 Recording-Anabat 414983 4551603
Lasiurus cinereus Hoary Bat 7/7/2011 Recording-Anabat 328919 4589389
Lasiurus cinereus Hoary Bat 7/18/2011 Recording-Anabat 341441 4669410
Lasiurus cinereus Hoary Bat 8/1/2011 Recording-Anabat 355807 4577040
Lasiurus cinereus Hoary Bat 6/23/2011 Recording-Anabat 451036 4558319
Lasiurus cinereus Hoary Bat 6/15/2011 Recording-Anabat 310549 4681335
Lasiurus cinereus Hoary Bat 8/3/2011 Recording-Anabat & Song Meter 308204 4608620
Lasiurus cinereus Hoary Bat 7/23/2011 Recording-Song Meter 393080 4691157
Lasiurus cinereus Hoary Bat 7/21/2011 Recording-Song Meter 372393 4682320
Lasiurus cinereus Hoary Bat 8/22/2011 Recording-Song Meter 465961 4545415
Lasiurus cinereus Hoary Bat 8/4/2011 Recording-Song Meter 309474 4619358
Lasiurus cinereus Hoary Bat 8/21/2011 Recording-Song Meter 469280 4625256
Lasiurus cinereus Hoary Bat 7/18/2011 Recording-Song Meter 345337 4672092
Lasiurus cinereus Hoary Bat 8/5/2011 Recording-Song Meter 278906 4693595
Myotis ciliolabrum Western Small-footed Myotis 8/3/2011 Recording-Anabat 296769 4602087
Myotis ciliolabrum Western Small-footed Myotis 8/4/2011 Recording-Anabat 308675 4608786
Myotis ciliolabrum Western Small-footed Myotis 8/6/2011 Recording-Anabat 277076 4702332
Myotis ciliolabrum Western Small-footed Myotis 8/21/2011 Recording-Anabat 331081 4641562
Myotis ciliolabrum Western Small-footed Myotis 8/21/2011 Recording-Anabat 331463 4642617
Myotis ciliolabrum Western Small-footed Myotis 7/6/2011 Recording-Anabat 327490 4590447
Myotis ciliolabrum Western Small-footed Myotis 7/5/2011 Recording-Anabat 297264 4582951
Myotis ciliolabrum Western Small-footed Myotis 7/5/2011 Recording-Anabat 297416 4583677

Bats of Southern Wyoming, Wyoming Natural Diversity Database, 2012
71
Myotis ciliolabrum Western Small-footed Myotis 7/22/2011 Recording-Anabat 378659 4686717
Myotis ciliolabrum Western Small-footed Myotis 7/6/2011 Recording-Anabat 327004 4590347
Myotis ciliolabrum Western Small-footed Myotis 7/24/2011 Recording-Anabat 369864 4673009
Myotis ciliolabrum Western Small-footed Myotis 8/5/2011 Recording-Anabat 271116 4711970
Myotis ciliolabrum Western Small-footed Myotis 7/20/2011 Recording-Anabat 349562 4677205
Myotis ciliolabrum Western Small-footed Myotis 6/24/2011 Recording-Anabat 461089 4581959
Myotis ciliolabrum Western Small-footed Myotis 8/7/2011 Recording-Anabat 329426 4637886
Myotis ciliolabrum Western Small-footed Myotis 8/1/2011 Recording-Anabat 349500 4590311
Myotis ciliolabrum Western Small-footed Myotis 7/5/2011 Recording-Anabat 299142 4584239
Myotis ciliolabrum Western Small-footed Myotis 7/7/2011 Recording-Anabat 328768 4589629
Myotis ciliolabrum Western Small-footed Myotis 7/9/2011 Recording-Anabat 342224 4585136
Myotis ciliolabrum Western Small-footed Myotis 7/22/2011 Recording-Anabat 382371 4685547
Myotis ciliolabrum Western Small-footed Myotis 7/23/2011 Recording-Anabat 392966 4691619
Myotis ciliolabrum Western Small-footed Myotis 8/22/2011 Recording-Anabat 465850 4545383
Myotis ciliolabrum Western Small-footed Myotis 8/6/2011 Recording-Anabat 275358 4694592
Myotis ciliolabrum Western Small-footed Myotis 8/4/2011 Recording-Anabat 311442 4608089
Myotis ciliolabrum Western Small-footed Myotis 7/19/2011 Recording-Anabat 343925 4677604
Myotis ciliolabrum Western Small-footed Myotis 8/5/2011 Recording-Anabat 272447 4711766
Myotis ciliolabrum Western Small-footed Myotis 6/24/2011 Recording-Anabat 412918 4554038
Myotis ciliolabrum Western Small-footed Myotis 7/19/2011 Recording-Anabat 341483 4669371
Myotis ciliolabrum Western Small-footed Myotis 7/19/2011 Recording-Anabat 340939 4669590
Myotis ciliolabrum Western Small-footed Myotis 7/19/2011 Recording-Anabat 340693 4669686
Myotis ciliolabrum Western Small-footed Myotis 7/19/2011 Recording-Anabat 340425 4669566
Myotis ciliolabrum Western Small-footed Myotis 8/4/2011 Recording-Anabat 297002 4602678
Myotis ciliolabrum Western Small-footed Myotis 8/21/2011 Recording-Anabat 414921 4552028
Myotis ciliolabrum Western Small-footed Myotis 8/21/2011 Recording-Anabat 414983 4551603
Myotis ciliolabrum Western Small-footed Myotis 7/18/2011 Recording-Anabat 345561 4672180
Myotis ciliolabrum Western Small-footed Myotis 7/20/2011 Recording-Anabat 347216 4671545
Myotis ciliolabrum Western Small-footed Myotis 7/18/2011 Recording-Anabat 341441 4669410
Myotis ciliolabrum Western Small-footed Myotis 7/19/2011 Recording-Anabat 347185 4671471
Myotis ciliolabrum Western Small-footed Myotis 6/23/2011 Recording-Anabat 451036 4558319
Myotis ciliolabrum Western Small-footed Myotis 6/10/2011 Recording-Anabat 308011 4684708
Myotis ciliolabrum Western Small-footed Myotis 6/13/2011 Recording-Anabat 314737 4684002
Myotis ciliolabrum Western Small-footed Myotis 6/15/2011 Recording-Anabat 311197 4681098
Myotis ciliolabrum Western Small-footed Myotis 7/21/2011 Recording-Anabat & Song Meter 372393 4682320
Myotis ciliolabrum Western Small-footed Myotis 8/3/2011 Recording-Anabat & Song Meter 308204 4608620
Myotis ciliolabrum Western Small-footed Myotis 7/23/2011 Recording-Song Meter 393080 4691157
Myotis ciliolabrum Western Small-footed Myotis 8/22/2011 Recording-Song Meter 465961 4545415
Myotis ciliolabrum Western Small-footed Myotis 8/4/2011 Recording-Song Meter 309474 4619358
Myotis ciliolabrum Western Small-footed Myotis 8/21/2011 Recording-Song Meter 469280 4625256
Myotis ciliolabrum Western Small-footed Myotis 7/18/2011 Recording-Song Meter 345337 4672092
Myotis ciliolabrum Western Small-footed Myotis 7/20/2011 Recording-Song Meter 340994 4670875
Myotis ciliolabrum Western Small-footed Myotis 8/5/2011 Recording-Song Meter 278906 4693595
Myotis evotis Western Long-eared Myotis 7/24/2011 Capture-mist net 369864 4673009

Bats of Southern Wyoming, Wyoming Natural Diversity Database, 2012
72
Myotis evotis Western Long-eared Myotis 7/6/2011 Recording-Anabat 327490 4590447
Myotis evotis Western Long-eared Myotis 7/5/2011 Recording-Anabat 297264 4582951
Myotis evotis Western Long-eared Myotis 8/5/2011 Recording-Anabat 271116 4711970
Myotis evotis Western Long-eared Myotis 6/24/2011 Recording-Anabat 461089 4581959
Myotis evotis Western Long-eared Myotis 7/22/2011 Recording-Anabat 370378 4672612
Myotis evotis Western Long-eared Myotis 7/5/2011 Recording-Anabat 299142 4584239
Myotis evotis Western Long-eared Myotis 7/23/2011 Recording-Anabat 392966 4691619
Myotis evotis Western Long-eared Myotis 8/22/2011 Recording-Anabat 465850 4545383
Myotis evotis Western Long-eared Myotis 8/6/2011 Recording-Anabat 275358 4694592
Myotis evotis Western Long-eared Myotis 8/3/2011 Recording-Anabat 308204 4608620
Myotis evotis Western Long-eared Myotis 7/19/2011 Recording-Anabat 343925 4677604
Myotis evotis Western Long-eared Myotis 8/5/2011 Recording-Anabat 272447 4711766
Myotis evotis Western Long-eared Myotis 8/6/2011 Recording-Anabat 279018 4695815
Myotis evotis Western Long-eared Myotis 7/20/2011 Recording-Anabat 347216 4671545
Myotis evotis Western Long-eared Myotis 7/18/2011 Recording-Anabat 341441 4669410
Myotis evotis Western Long-eared Myotis 6/28/2011 Recording-Anabat 450997 4558334
Myotis evotis Western Long-eared Myotis 6/22/2011 Recording-Anabat 465237 4566890
Myotis evotis Western Long-eared Myotis 6/23/2011 Recording-Anabat 469220 4556660
Myotis evotis Western Long-eared Myotis 6/15/2011 Recording-Anabat 311197 4681098
Myotis evotis Western Long-eared Myotis 6/15/2011 Recording-Anabat 310549 4681335
Myotis evotis Western Long-eared Myotis 8/22/2011 Recording-Song Meter 465961 4545415
Myotis evotis Western Long-eared Myotis 8/4/2011 Recording-Song Meter 309474 4619358
Myotis evotis Western Long-eared Myotis 7/18/2011 Recording-Song Meter 345337 4672092
Myotis evotis Western Long-eared Myotis 7/20/2011 Recording-Song Meter 340994 4670875
Myotis evotis Western Long-eared Myotis 8/5/2011 Recording-Song Meter 278906 4693595
Myotis lucifugus Little Brown Myotis 7/6/2011 Capture-mist net 327490 4590447
Myotis lucifugus Little Brown Myotis 7/24/2011 Capture-mist net 369864 4673009
Myotis lucifugus Little Brown Myotis 8/5/2011 Capture-mist net 271116 4711970
Myotis lucifugus Little Brown Myotis 7/21/2011 Capture-mist net 372393 4682320
Myotis lucifugus Little Brown Myotis 8/3/2011 Capture-mist net 308204 4608620
Myotis lucifugus Little Brown Myotis 8/22/2011 Capture-mist net 449339 4573253
Myotis lucifugus Little Brown Myotis 7/18/2011 Capture-mist net 345561 4672180
Myotis lucifugus Little Brown Myotis 6/28/2011 Capture-mist net 450997 4558334
Myotis lucifugus Little Brown Myotis 6/22/2011 Capture-mist net 465237 4566890
Myotis lucifugus Little Brown Myotis 6/23/2011 Capture-mist net 469220 4556660
Myotis lucifugus Little Brown Myotis 8/3/2011 Recording-Anabat 296769 4602087
Myotis lucifugus Little Brown Myotis 8/6/2011 Recording-Anabat 277442 4703673
Myotis lucifugus Little Brown Myotis 8/6/2011 Recording-Anabat 277255 4703299
Myotis lucifugus Little Brown Myotis 8/6/2011 Recording-Anabat 277033 4702672
Myotis lucifugus Little Brown Myotis 8/6/2011 Recording-Anabat 277076 4702332
Myotis lucifugus Little Brown Myotis 8/6/2011 Recording-Anabat 277071 4702003
Myotis lucifugus Little Brown Myotis 8/6/2011 Recording-Anabat 277067 4701685
Myotis lucifugus Little Brown Myotis 8/21/2011 Recording-Anabat 330815 4640829
Myotis lucifugus Little Brown Myotis 8/21/2011 Recording-Anabat 415787 4543954

Bats of Southern Wyoming, Wyoming Natural Diversity Database, 2012
73
Myotis lucifugus Little Brown Myotis 7/6/2011 Recording-Anabat 327490 4590447
Myotis lucifugus Little Brown Myotis 7/5/2011 Recording-Anabat 297264 4582951
Myotis lucifugus Little Brown Myotis 7/5/2011 Recording-Anabat 297416 4583677
Myotis lucifugus Little Brown Myotis 7/23/2011 Recording-Anabat 389015 4688993
Myotis lucifugus Little Brown Myotis 7/22/2011 Recording-Anabat 378659 4686717
Myotis lucifugus Little Brown Myotis 7/6/2011 Recording-Anabat 327004 4590347
Myotis lucifugus Little Brown Myotis 7/20/2011 Recording-Anabat 349562 4677205
Myotis lucifugus Little Brown Myotis 6/24/2011 Recording-Anabat 461089 4581959
Myotis lucifugus Little Brown Myotis 8/7/2011 Recording-Anabat 329426 4637886
Myotis lucifugus Little Brown Myotis 8/1/2011 Recording-Anabat 349500 4590311
Myotis lucifugus Little Brown Myotis 7/7/2011 Recording-Anabat 328768 4589629
Myotis lucifugus Little Brown Myotis 7/9/2011 Recording-Anabat 342224 4585136
Myotis lucifugus Little Brown Myotis 7/22/2011 Recording-Anabat 382371 4685547
Myotis lucifugus Little Brown Myotis 7/23/2011 Recording-Anabat 392966 4691619
Myotis lucifugus Little Brown Myotis 8/22/2011 Recording-Anabat 465850 4545383
Myotis lucifugus Little Brown Myotis 8/6/2011 Recording-Anabat 275358 4694592
Myotis lucifugus Little Brown Myotis 7/9/2011 Recording-Anabat 342362 4585431
Myotis lucifugus Little Brown Myotis 7/9/2011 Recording-Anabat 342391 4586162
Myotis lucifugus Little Brown Myotis 7/19/2011 Recording-Anabat 343925 4677604
Myotis lucifugus Little Brown Myotis 8/5/2011 Recording-Anabat 272447 4711766
Myotis lucifugus Little Brown Myotis 6/24/2011 Recording-Anabat 412918 4554038
Myotis lucifugus Little Brown Myotis 7/7/2011 Recording-Anabat 328808 4589156
Myotis lucifugus Little Brown Myotis 8/2/2011 Recording-Anabat 295121 4612141
Myotis lucifugus Little Brown Myotis 8/6/2011 Recording-Anabat 279018 4695815
Myotis lucifugus Little Brown Myotis 8/6/2011 Recording-Anabat 279202 4694896
Myotis lucifugus Little Brown Myotis 8/6/2011 Recording-Anabat 278325 4694580
Myotis lucifugus Little Brown Myotis 8/6/2011 Recording-Anabat 278487 4694291
Myotis lucifugus Little Brown Myotis 7/19/2011 Recording-Anabat 341685 4669262
Myotis lucifugus Little Brown Myotis 7/19/2011 Recording-Anabat 341483 4669371
Myotis lucifugus Little Brown Myotis 7/19/2011 Recording-Anabat 341943 4668498
Myotis lucifugus Little Brown Myotis 7/19/2011 Recording-Anabat 341220 4669430
Myotis lucifugus Little Brown Myotis 7/19/2011 Recording-Anabat 340939 4669590
Myotis lucifugus Little Brown Myotis 7/19/2011 Recording-Anabat 340693 4669686
Myotis lucifugus Little Brown Myotis 7/19/2011 Recording-Anabat 340425 4669566
Myotis lucifugus Little Brown Myotis 8/21/2011 Recording-Anabat 329069 4637415
Myotis lucifugus Little Brown Myotis 8/21/2011 Recording-Anabat 329292 4637700
Myotis lucifugus Little Brown Myotis 8/21/2011 Recording-Anabat 415428 4553265
Myotis lucifugus Little Brown Myotis 8/21/2011 Recording-Anabat 414983 4551603
Myotis lucifugus Little Brown Myotis 7/7/2011 Recording-Anabat 328919 4589389
Myotis lucifugus Little Brown Myotis 7/20/2011 Recording-Anabat 347216 4671545
Myotis lucifugus Little Brown Myotis 7/18/2011 Recording-Anabat 341441 4669410
Myotis lucifugus Little Brown Myotis 7/19/2011 Recording-Anabat 347185 4671471
Myotis lucifugus Little Brown Myotis 8/1/2011 Recording-Anabat 355807 4577040
Myotis lucifugus Little Brown Myotis 6/23/2011 Recording-Anabat 451036 4558319

Bats of Southern Wyoming, Wyoming Natural Diversity Database, 2012
74
Myotis lucifugus Little Brown Myotis 6/22/2011 Recording-Anabat 465196 4566830
Myotis lucifugus Little Brown Myotis 6/9/2011 Recording-Anabat 308553 4684854
Myotis lucifugus Little Brown Myotis 6/13/2011 Recording-Anabat 314737 4684002
Myotis lucifugus Little Brown Myotis 6/15/2011 Recording-Anabat 311197 4681098
Myotis lucifugus Little Brown Myotis 6/15/2011 Recording-Anabat 310549 4681335
Myotis lucifugus Little Brown Myotis 7/23/2011 Recording-Song Meter 393080 4691157
Myotis lucifugus Little Brown Myotis 8/22/2011 Recording-Song Meter 465961 4545415
Myotis lucifugus Little Brown Myotis 8/4/2011 Recording-Song Meter 309474 4619358
Myotis lucifugus Little Brown Myotis 8/21/2011 Recording-Song Meter 469280 4625256
Myotis lucifugus Little Brown Myotis 7/18/2011 Recording-Song Meter 345337 4672092
Myotis lucifugus Little Brown Myotis 7/20/2011 Recording-Song Meter 340994 4670875
Myotis lucifugus Little Brown Myotis 8/5/2011 Recording-Song Meter 278906 4693595
Myotis thysanodes Fringed Myotis 7/24/2011 Recording-Anabat 369864 4673009
Myotis thysanodes Fringed Myotis 7/20/2011 Recording-Anabat 349562 4677205
Myotis thysanodes Fringed Myotis 7/22/2011 Recording-Anabat 370378 4672612
Myotis thysanodes Fringed Myotis 7/19/2011 Recording-Anabat 343925 4677604
Myotis thysanodes Fringed Myotis 7/18/2011 Recording-Anabat 345561 4672180
Myotis thysanodes Fringed Myotis 7/18/2011 Recording-Anabat 341441 4669410
Myotis thysanodes Fringed Myotis 7/19/2011 Recording-Anabat 347185 4671471
Myotis thysanodes Fringed Myotis 6/28/2011 Recording-Anabat 450997 4558334
Myotis thysanodes Fringed Myotis 6/23/2011 Recording-Anabat 469220 4556660
Myotis thysanodes Fringed Myotis 6/13/2011 Recording-Anabat 314737 4684002
Myotis thysanodes Fringed Myotis 6/15/2011 Recording-Anabat 311197 4681098
Myotis thysanodes Fringed Myotis 6/15/2011 Recording-Anabat 310549 4681335
Myotis thysanodes Fringed Myotis 8/22/2011 Recording-Song Meter 465961 4545415
Myotis thysanodes Fringed Myotis 8/4/2011 Recording-Song Meter 309474 4619358
Myotis volans Long-legged Myotis 7/24/2011 Capture-mist net 369864 4673009
Myotis volans Long-legged Myotis 7/21/2011 Capture-mist net 372393 4682320
Myotis volans Long-legged Myotis 6/23/2011 Capture-mist net 469220 4556660
Myotis volans Long-legged Myotis 8/3/2011 Recording-Anabat 296769 4602087
Myotis volans Long-legged Myotis 8/21/2011 Recording-Anabat 330815 4640829
Myotis volans Long-legged Myotis 8/21/2011 Recording-Anabat 331081 4641562
Myotis volans Long-legged Myotis 7/6/2011 Recording-Anabat 327490 4590447
Myotis volans Long-legged Myotis 7/23/2011 Recording-Anabat 389015 4688993
Myotis volans Long-legged Myotis 7/22/2011 Recording-Anabat 378659 4686717
Myotis volans Long-legged Myotis 7/6/2011 Recording-Anabat 327004 4590347
Myotis volans Long-legged Myotis 8/5/2011 Recording-Anabat 271116 4711970
Myotis volans Long-legged Myotis 6/24/2011 Recording-Anabat 461089 4581959
Myotis volans Long-legged Myotis 8/7/2011 Recording-Anabat 329426 4637886
Myotis volans Long-legged Myotis 8/1/2011 Recording-Anabat 349500 4590311
Myotis volans Long-legged Myotis 7/5/2011 Recording-Anabat 299142 4584239
Myotis volans Long-legged Myotis 7/7/2011 Recording-Anabat 328768 4589629
Myotis volans Long-legged Myotis 7/9/2011 Recording-Anabat 342224 4585136
Myotis volans Long-legged Myotis 7/22/2011 Recording-Anabat 382371 4685547

Bats of Southern Wyoming, Wyoming Natural Diversity Database, 2012
75
Myotis volans Long-legged Myotis 7/23/2011 Recording-Anabat 392966 4691619
Myotis volans Long-legged Myotis 7/21/2011 Recording-Anabat 372393 4682320
Myotis volans Long-legged Myotis 8/6/2011 Recording-Anabat 275358 4694592
Myotis volans Long-legged Myotis 8/4/2011 Recording-Anabat 311442 4608089
Myotis volans Long-legged Myotis 7/19/2011 Recording-Anabat 343925 4677604
Myotis volans Long-legged Myotis 8/5/2011 Recording-Anabat 272447 4711766
Myotis volans Long-legged Myotis 7/7/2011 Recording-Anabat 328808 4589156
Myotis volans Long-legged Myotis 7/19/2011 Recording-Anabat 341483 4669371
Myotis volans Long-legged Myotis 7/19/2011 Recording-Anabat 341220 4669430
Myotis volans Long-legged Myotis 7/19/2011 Recording-Anabat 340939 4669590
Myotis volans Long-legged Myotis 7/19/2011 Recording-Anabat 340693 4669686
Myotis volans Long-legged Myotis 8/21/2011 Recording-Anabat 414921 4552028
Myotis volans Long-legged Myotis 7/18/2011 Recording-Anabat 345561 4672180
Myotis volans Long-legged Myotis 7/20/2011 Recording-Anabat 347216 4671545
Myotis volans Long-legged Myotis 7/18/2011 Recording-Anabat 341441 4669410
Myotis volans Long-legged Myotis 7/19/2011 Recording-Anabat 347185 4671471
Myotis volans Long-legged Myotis 8/1/2011 Recording-Anabat 355807 4577040
Myotis volans Long-legged Myotis 6/23/2011 Recording-Anabat 451036 4558319
Myotis volans Long-legged Myotis 6/28/2011 Recording-Anabat 450997 4558334
Myotis volans Long-legged Myotis 6/22/2011 Recording-Anabat 465237 4566890
Myotis volans Long-legged Myotis 6/22/2011 Recording-Anabat 465196 4566830
Myotis volans Long-legged Myotis 6/9/2011 Recording-Anabat 308553 4684854
Myotis volans Long-legged Myotis 6/10/2011 Recording-Anabat 308011 4684708
Myotis volans Long-legged Myotis 6/13/2011 Recording-Anabat 314737 4684002
Myotis volans Long-legged Myotis 6/15/2011 Recording-Anabat 311197 4681098
Myotis volans Long-legged Myotis 6/15/2011 Recording-Anabat 310549 4681335
Myotis volans Long-legged Myotis 8/22/2011 Recording-Song Meter 465961 4545415
Myotis volans Long-legged Myotis 8/3/2011 Recording-Song Meter 308204 4608620
Myotis volans Long-legged Myotis 8/5/2011 Recording-Song Meter 278906 4693595

Bats of Southern Wyoming, Wyoming Natural Diversity Database, 2012
76
APPENDIX E: WYOMING BAT SPECIES IDENTIFICATION KEY
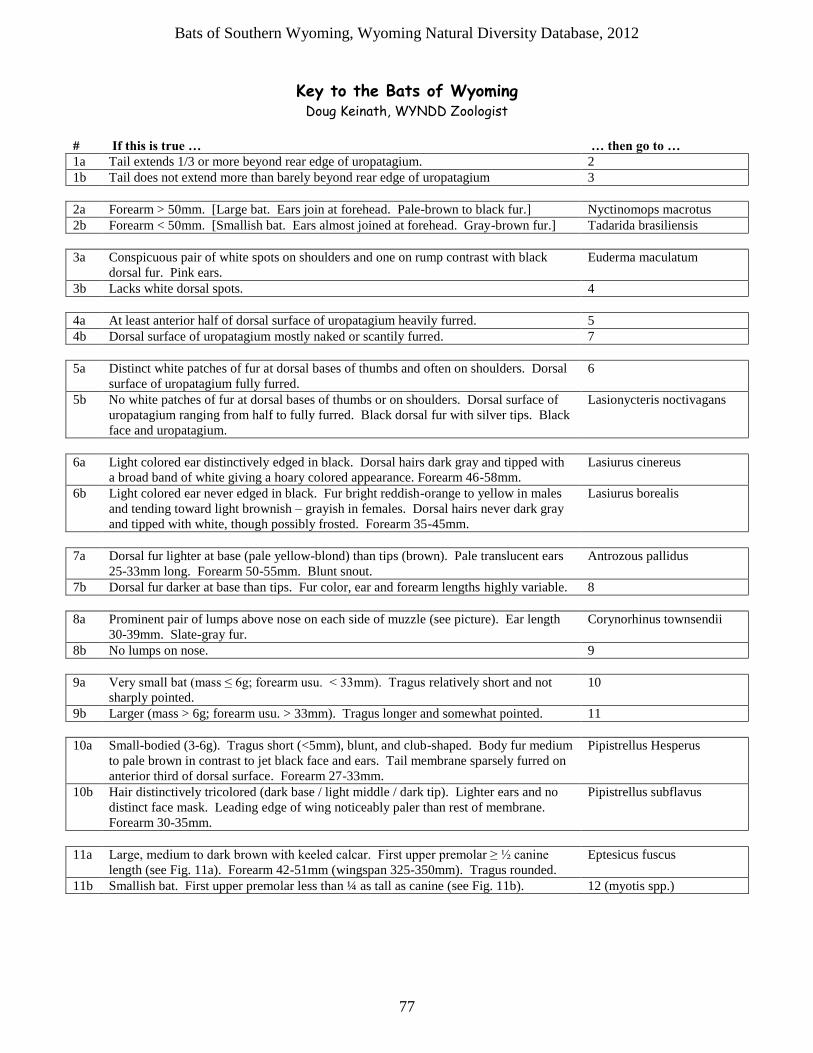
Bats of Southern Wyoming, Wyoming Natural Diversity Database, 2012
77
Key to the Bats of Wyoming Doug Keinath, WYNDD Zoologist
# If this is true … … then go to …
1a Tail extends 1/3 or more beyond rear edge of uropatagium. 2
1b Tail does not extend more than barely beyond rear edge of uropatagium 3
2a Forearm > 50mm. [Large bat. Ears join at forehead. Pale-brown to black fur.] Nyctinomops macrotus
2b Forearm < 50mm. [Smallish bat. Ears almost joined at forehead. Gray-brown fur.] Tadarida brasiliensis
3a Conspicuous pair of white spots on shoulders and one on rump contrast with black
dorsal fur. Pink ears.
Euderma maculatum
3b Lacks white dorsal spots. 4
4a At least anterior half of dorsal surface of uropatagium heavily furred. 5
4b Dorsal surface of uropatagium mostly naked or scantily furred. 7
5a Distinct white patches of fur at dorsal bases of thumbs and often on shoulders. Dorsal
surface of uropatagium fully furred.
6
5b No white patches of fur at dorsal bases of thumbs or on shoulders. Dorsal surface of
uropatagium ranging from half to fully furred. Black dorsal fur with silver tips. Black
face and uropatagium.
Lasionycteris noctivagans
6a Light colored ear distinctively edged in black. Dorsal hairs dark gray and tipped with
a broad band of white giving a hoary colored appearance. Forearm 46-58mm.
Lasiurus cinereus
6b Light colored ear never edged in black. Fur bright reddish-orange to yellow in males
and tending toward light brownish – grayish in females. Dorsal hairs never dark gray
and tipped with white, though possibly frosted. Forearm 35-45mm.
Lasiurus borealis
7a Dorsal fur lighter at base (pale yellow-blond) than tips (brown). Pale translucent ears
25-33mm long. Forearm 50-55mm. Blunt snout.
Antrozous pallidus
7b Dorsal fur darker at base than tips. Fur color, ear and forearm lengths highly variable. 8
8a Prominent pair of lumps above nose on each side of muzzle (see picture). Ear length
30-39mm. Slate-gray fur.
Corynorhinus townsendii
8b No lumps on nose. 9
9a Very small bat (mass ≤ 6g; forearm usu. < 33mm). Tragus relatively short and not
sharply pointed.
10
9b Larger (mass > 6g; forearm usu. > 33mm). Tragus longer and somewhat pointed. 11
10a Small-bodied (3-6g). Tragus short (<5mm), blunt, and club-shaped. Body fur medium
to pale brown in contrast to jet black face and ears. Tail membrane sparsely furred on
anterior third of dorsal surface. Forearm 27-33mm.
Pipistrellus Hesperus
10b Hair distinctively tricolored (dark base / light middle / dark tip). Lighter ears and no
distinct face mask. Leading edge of wing noticeably paler than rest of membrane.
Forearm 30-35mm.
Pipistrellus subflavus
11a Large, medium to dark brown with keeled calcar. First upper premolar ≥ ½ canine
length (see Fig. 11a). Forearm 42-51mm (wingspan 325-350mm). Tragus rounded.
Eptesicus fuscus
11b Smallish bat. First upper premolar less than ¼ as tall as canine (see Fig. 11b). 12 (myotis spp.)

Bats of Southern Wyoming, Wyoming Natural Diversity Database, 2012
78
Myotis species # If this is true … … then go to …
12a Calcar keeled. (see Fig. 12a) 13
12b Calcar NOT keeled. (see Fig. 12b) 15
Fig. 12a. Keeled calcar (go to 12)
Fig. 12b. Keel absent (go to 14)
13a Forearm 38-42mm (wingspan 250-270mm). Body fur uniformly dark brown or
grayish brown with no distinctively darker face mask. [Underside of wing furred
from side to elbow.]
Myotis volans
13b Forearm 29-36mm. Body fur medium to very light tan or reddish brown with
clearly darker face mask. [Underside of wing not furred from side to elbow.]
14
14a Thumb length < 4.2mm. Tail does NOT extend beyond uropatagium. Braincase
has an abruptly rising profile (convex forehead). Length of bare snout width
across nostrils. Dorsal fur dull, pale colored, with slightly-contrasting dark
brown face mask.(Fig. 14a)
Myotis californicus
14b Thumb length > 4.2mm. Tail often extends slightly beyond uropatagium. No
distinct rise in braincase profile (sloping forehead). Length across snout 1.5
times width across nostrils. Dorsal fur slightly shiny, pale colored, and sharply
contrasting with black face mask. (Fig. 14b)
Myotis ciliolabrum
Fig. 14a. M. californicus: Rising braincase. Length of bare snout
width across nostrils.
Fig 14b. M.ciliolabrum: Shallow braincase. Length across
snout 1.5 times width across nostrils
15a Distinct fringe of hair extending 1.0-1.5mm beyond edge of uropatagium (picture).
Ears darkly pigmented and 16-20mm long. Belly fur light. Forearm 39-46mm.
Myotis thysanodes
15b Fringe absent (no more than scattered hairs on edge of uropatagium). 16
16a Ear length ≥17mm. 17
16b Ear length ≤ 16mm. 18
17a Ears, wings, and uropatagium are blackish and opaque. Ear length 17-24mm
(WY: 17-23mm, but usu. ~20mm). Ears extend past end of nose when laid
down. Fur light brown with hairs black at base. [May have an inconspicuous
fringe of hairs on the posterior uropatagium.]
Myotis evotis
17b Ears, wings, and uropatagium are brownish and translucent. Ear length 15-19mm
(WY: 15-16mm).
Myotis septentrionalis
18a Dorsal body fur brown to reddish-brown, long and glossy. Forearm usually 36.5-
40.5mm (BC Range: 33.0-40.3mm). Ears dark, 14-16mm long, with short tragus.
Myotis lucifugus
Fig. 11a. First upper premolar ½ as
tall as canine (Eptesicus fuscus)
Fig. 11b. First upper premolar < ¼ as
tall as canine (Myotis spp.)
Keeled
calcar
Long
Ears

Bats of Southern Wyoming, Wyoming Natural Diversity Database, 2012
79
Forehead with a gradual slope (Fig. 18a), skull usually greater than 14mm.
Ventral fur light-tipped but never white. Many foot hairs extend beyond toes.
18b Dorsal body fur brown to reddish-brown, short and dull. Forearm usually 32-
36mm (BC Range: 30.0-38.0mm). Ears paler, 12-14mm long. Forehead with
steep slope (Fig. 18b), skull usually less than 14mm. Ventral fur with whitish tips.
Myotis yumanensis
Fig. 18a. M. lucifugus:
Forehead with gradual
slope
Fig. 18b. M. yumanensis:
Forehead with steep slope

Bats of Southern Wyoming, Wyoming Natural Diversity Database, 2012
80
Supplementary Images for the Wyoming Bat Key
Uropatagial fringe of Myotis thysanodes
Face and tragus of P. hesperus Nose folds of C. townsendii Finger joint of juvenile (tapered, epiphesial plates visible) and
adult (nobby and opaque) finger joints, as seen by illuminating the wing from behind (From Nagorsen and Brigham, 1993)
Bat Anatomy (from AZ bat conservation
workshop)
Standard Bat Measurements (from The Bats of Texas)
JUV.
ADULT
JUV.
ADULT

Bats of Southern Wyoming, Wyoming Natural Diversity Database, 2012
81
APPENDIX F: WYOMING ANABAT CALL KEY
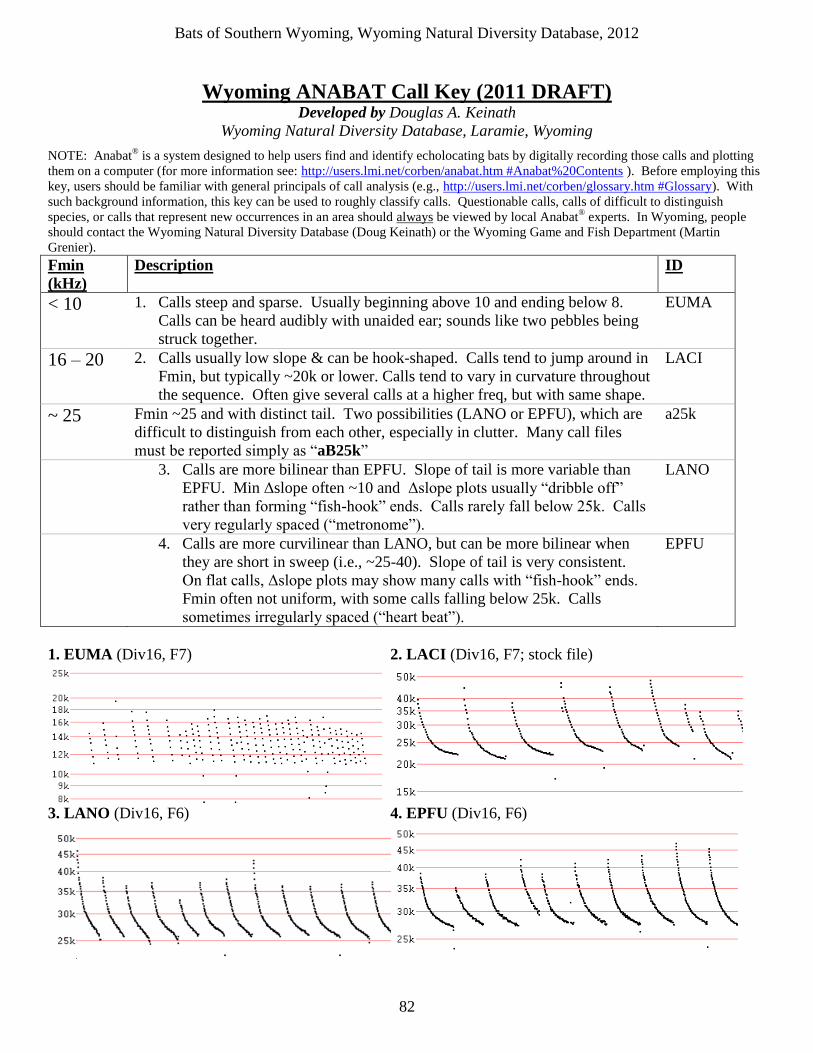
Bats of Southern Wyoming, Wyoming Natural Diversity Database, 2012
82
Wyoming ANABAT Call Key (2011 DRAFT) Developed by Douglas A. Keinath
Wyoming Natural Diversity Database, Laramie, Wyoming
NOTE: Anabat® is a system designed to help users find and identify echolocating bats by digitally recording those calls and plotting
them on a computer (for more information see: http://users.lmi.net/corben/anabat.htm #Anabat%20Contents ). Before employing this
key, users should be familiar with general principals of call analysis (e.g., http://users.lmi.net/corben/glossary.htm #Glossary). With
such background information, this key can be used to roughly classify calls. Questionable calls, calls of difficult to distinguish
species, or calls that represent new occurrences in an area should always be viewed by local Anabat® experts. In Wyoming, people
should contact the Wyoming Natural Diversity Database (Doug Keinath) or the Wyoming Game and Fish Department (Martin
Grenier).
Fmin
(kHz)
Description ID
< 10 1. Calls steep and sparse. Usually beginning above 10 and ending below 8.
Calls can be heard audibly with unaided ear; sounds like two pebbles being
struck together.
EUMA
16 – 20 2. Calls usually low slope & can be hook-shaped. Calls tend to jump around in
Fmin, but typically ~20k or lower. Calls tend to vary in curvature throughout
the sequence. Often give several calls at a higher freq, but with same shape.
LACI
~ 25 Fmin ~25 and with distinct tail. Two possibilities (LANO or EPFU), which are
difficult to distinguish from each other, especially in clutter. Many call files
must be reported simply as “aB25k”
a25k
3. Calls are more bilinear than EPFU. Slope of tail is more variable than
EPFU. Min Δslope often ~10 and Δslope plots usually “dribble off”
rather than forming “fish-hook” ends. Calls rarely fall below 25k. Calls
very regularly spaced (“metronome”).
LANO
4. Calls are more curvilinear than LANO, but can be more bilinear when
they are short in sweep (i.e., ~25-40). Slope of tail is very consistent.
On flat calls, Δslope plots may show many calls with “fish-hook” ends.
Fmin often not uniform, with some calls falling below 25k. Calls
sometimes irregularly spaced (“heart beat”).
EPFU
1. EUMA (Div16, F7) 2. LACI (Div16, F7; stock file)
3. LANO (Div16, F6) 4. EPFU (Div16, F6)
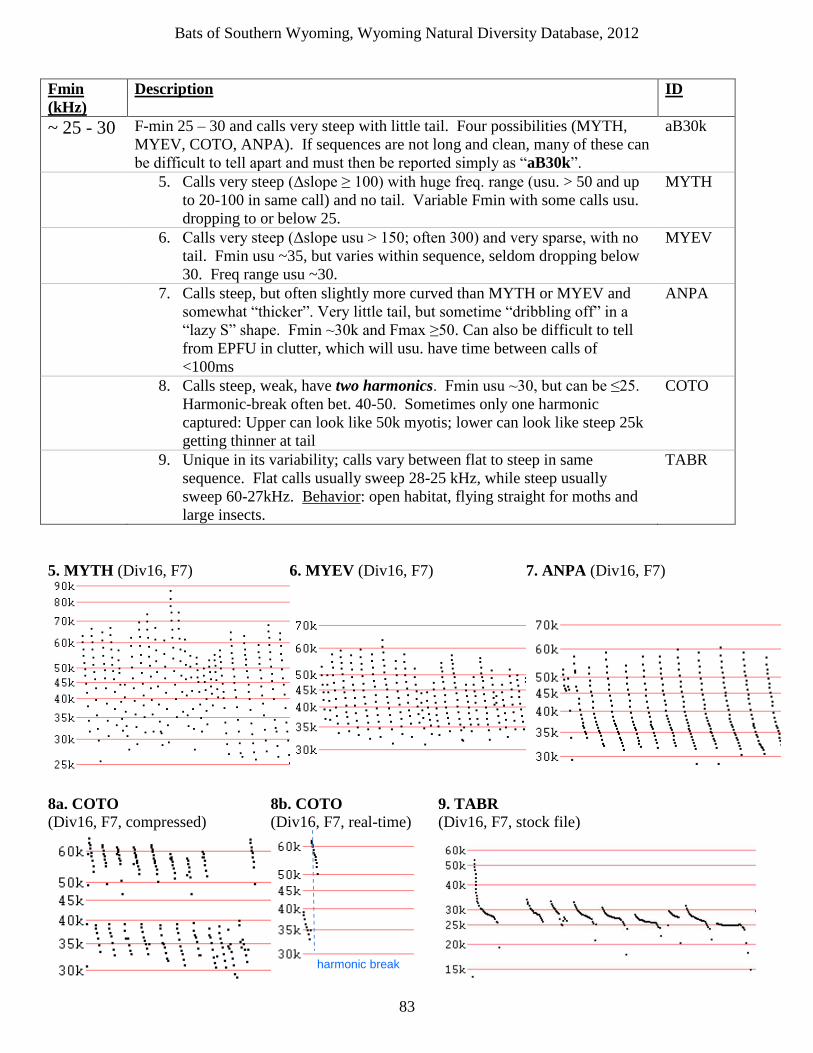
Bats of Southern Wyoming, Wyoming Natural Diversity Database, 2012
83
Fmin
(kHz)
Description ID
~ 25 - 30 F-min 25 – 30 and calls very steep with little tail. Four possibilities (MYTH,
MYEV, COTO, ANPA). If sequences are not long and clean, many of these can
be difficult to tell apart and must then be reported simply as “aB30k”.
aB30k
5. Calls very steep (Δslope ≥ 100) with huge freq. range (usu. > 50 and up
to 20-100 in same call) and no tail. Variable Fmin with some calls usu.
dropping to or below 25.
MYTH
6. Calls very steep (Δslope usu > 150; often 300) and very sparse, with no
tail. Fmin usu ~35, but varies within sequence, seldom dropping below
30. Freq range usu ~30.
MYEV
7. Calls steep, but often slightly more curved than MYTH or MYEV and
somewhat “thicker”. Very little tail, but sometime “dribbling off” in a
“lazy S” shape. Fmin ~30k and Fmax ≥50. Can also be difficult to tell
from EPFU in clutter, which will usu. have time between calls of
<100ms
ANPA
8. Calls steep, weak, have two harmonics. Fmin usu ~30, but can be ≤25.
Harmonic-break often bet. 40-50. Sometimes only one harmonic
captured: Upper can look like 50k myotis; lower can look like steep 25k
getting thinner at tail
COTO
9. Unique in its variability; calls vary between flat to steep in same
sequence. Flat calls usually sweep 28-25 kHz, while steep usually
sweep 60-27kHz. Behavior: open habitat, flying straight for moths and
large insects.
TABR
5. MYTH (Div16, F7) 6. MYEV (Div16, F7) 7. ANPA (Div16, F7)
8a. COTO
(Div16, F7, compressed) 8b. COTO
(Div16, F7, real-time) 9. TABR (Div16, F7, stock file)
harmonic break

Bats of Southern Wyoming, Wyoming Natural Diversity Database, 2012
84
Fmin
(kHz)
Description ID
~ 27 - 35 10. Calls increases in frequency at end, creating a slight hook shape (like hoary bat).
Calls sweep steeply from over 50k to just below 40k, with numerous calls often
shifted downward so Fmin can be as low as 27k.
LABO
~ 40 Fmin usually at 40k, with some potentially falling above or below. Four possibilities
(MYLU, MYCI, MYSE, MYVO). 40k myotis are very difficult to distinguish from
each other, especially in clutter. Many call files must be reported simply as “aM40k”.
aM40k
11. Gently curved slope throughout call (but often get more bilinear in clutter and
may “dribble off” at the end). Clean calls often sweep from ~100 to just over
40. On clean calls, Δslopemin can be as low as 40, but usually higher.
Sometimes alternate curved call with a more linear one. Behavior: MYLU
classically feed over water, which can result in “wobbly” calls.”
MYLU
12. Calls steep and regularly have a small “toe” at or just before the end, resulting
in a “golfclub” or “S” shaped call. Even with a toe, calls usually have
Δslopemin near 80. Clean calls usually straighter than MYLU, but can be more
curvilinear than MYVO. Calls can have a wobble in the middle of the call
(usually ≤50k). Behavior: MYCI feed around vegetation, like MYCA.
MYCI
13. Calls look similar to MYEV, but lower frequency limit is roughly 40kHz.
Calls typically sweep from 80kHz to just over 40kHz. Clean calls are straighter
than MYLU and MYCI and less vertical than MYVO. Behavior: MYSE feed
around vegetation, often forests, gleaning and aerially pursuing insects.
MYSE
14. Calls steep often with “wiggly look”; like MYLU in clutter, but greater call
spacing. Calls tend to be more linear (or bilinear) than MYLU and have less
“toe” than MYCI. Calls can have a wobble high in the sweep (usually ≥50k).
Δslope is usually high (~100) but can drop to ~60. Difficult to distinguish from
other 40k myotis
MYVO
10. LABO (Div8, F7) 11. MYLU (Div16, F7)
12. MYCI (Div16, F7) 13. MYSE (from Adams 2003) 14. MYVO (Div 16, F7)
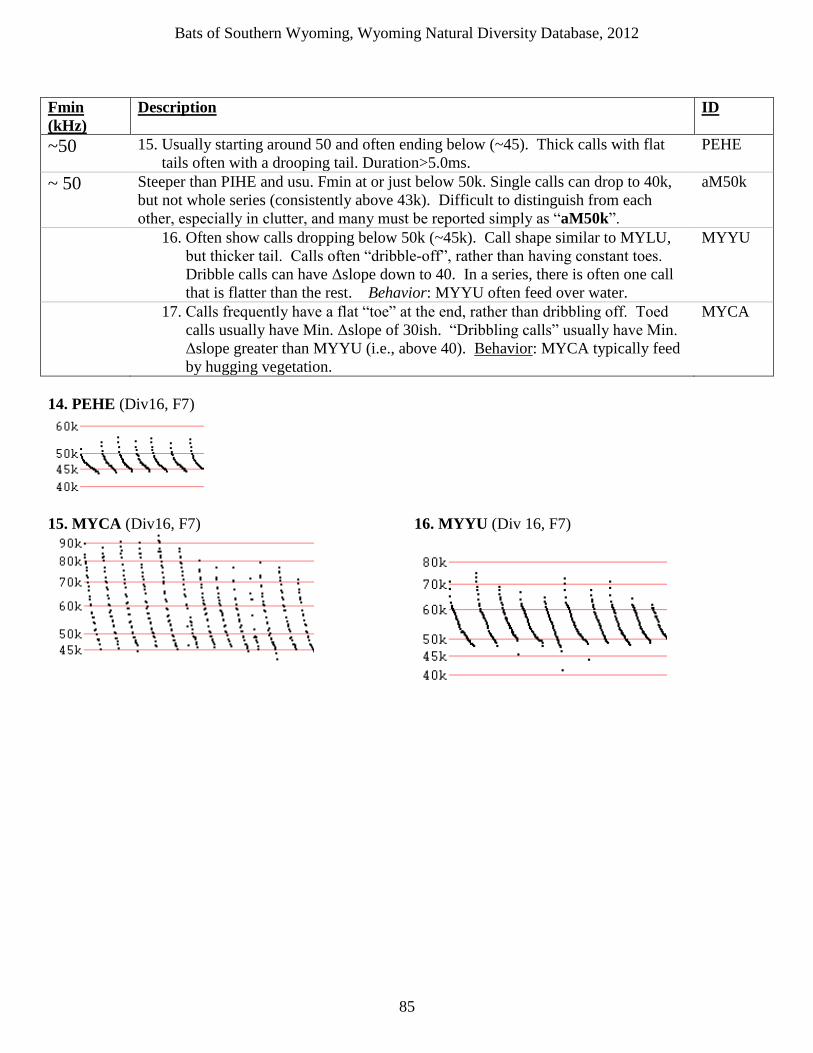
Bats of Southern Wyoming, Wyoming Natural Diversity Database, 2012
85
Fmin
(kHz)
Description ID
~50 15. Usually starting around 50 and often ending below (~45). Thick calls with flat
tails often with a drooping tail. Duration>5.0ms.
PEHE
~ 50 Steeper than PIHE and usu. Fmin at or just below 50k. Single calls can drop to 40k,
but not whole series (consistently above 43k). Difficult to distinguish from each
other, especially in clutter, and many must be reported simply as “aM50k”.
aM50k
16. Often show calls dropping below 50k (~45k). Call shape similar to MYLU,
but thicker tail. Calls often “dribble-off”, rather than having constant toes.
Dribble calls can have Δslope down to 40. In a series, there is often one call
that is flatter than the rest. Behavior: MYYU often feed over water.
MYYU
17. Calls frequently have a flat “toe” at the end, rather than dribbling off. Toed calls usually have Min. Δslope of 30ish. “Dribbling calls” usually have Min.
Δslope greater than MYYU (i.e., above 40). Behavior: MYCA typically feed
by hugging vegetation.
MYCA
14. PEHE (Div16, F7)
15. MYCA (Div16, F7) 16. MYYU (Div 16, F7)

Bats of Southern Wyoming, Wyoming Natural Diversity Database, 2012
86
APPENDIX G: 2011 BLANK DATASHEETS

Bats of Southern Wyoming, Wyoming Natural Diversity Database, 2012
87
ANABAT / SONGMETER RECORDING FORM (307-766-3013; P.O. Box 3381, UW, WYNDD, Laramie, WY 82071)
SITE INFORMATION
Site Name: Location (eg. drainage, Hwy):
Date: Elevation (m): County: Land Owner:
GPS EPE (m): CF Card #: UTM Zone/GPS Datum:
Observer Names:
GPS Location of recording unit (UTM): Easting _________________________; Northing ____________________________
BAT CALL DOWNLOAD
Download Date:____________________ Download Location &Folder Name:_______________________________________
HABITAT
Site Description:
Type of habitat where mistnet or recorder placed (choose from below):
Type of habitat in the surrounding 2 km (choose from below):
Distance to nearest rock outcrop/cliff:______________m Distance to nearest open water:_______________m
Distance to nearest conifer stand:______________m Distance to nearest deciduous tree stand:______________m
SESSION INFORMATION: ANABAT/SONGMETER
Date (mm/dd/yy): Time of civil sunset (24hr): Phase of Moon:
Time Activated: Time deactivated (24hr):
Division Ratio: Sensitivity/Sample Rate: Height above Ground:
ANABAT Configuration: Sketch (grid cell size: ________m) Notes
ACOUSTIC ANALYSIS (call file # is of a representative call for that spp)
Species 1 (call file#): # of calls: Species 5 (call file#): # of calls:
Species 2 (call file#): # of calls: Species 6 (call file#): # of calls:
Species 3 (call file#): # of calls: Comments:
Species 4 (call file#): # of calls:
Habitat Types 1. Shrubland/ shrub steppe
2. Grassland 3. Wetland/ open water
4. Rock outcrop
5. Cliff (canyon, mountain) 6. Cave
7. Conifer forest
8. Deciduous forest 9. Foothills chaparral
10. Riparian shrub (ex. willows)
11. Badlands 12. Disturbed/ reclaimed/ mined/ oil & gas

Bats of Southern Wyoming, Wyoming Natural Diversity Database, 2012
88
MISTNETTING FORM (307-766-3013; P.O. Box 3381, UW, WYNDD, Laramie, WY 82071)
SITE INFORMATION
Site Name: Location (eg. drainage, Hwy):
Date: Elevation (m):
County: Land Owner:
GPS EPE (m): CF Card #: UTM Zone/GPS Datum:
Observer Names:
GPS Location of recording unit (UTM): Easting _________________________; Northing ____________________________
BAT CALL DOWNLOAD
Download Date:____________________ Download Location &Folder Name:_______________________________________
HABITAT
Site Description:
Type of habitat where mistnet or recorder placed (choose from below):
Type of habitat in the surrounding 2 km (choose from below):
Distance to nearest rock outcrop/cliff:______________m Distance to nearest open water:_______________m
Distance to nearest conifer stand:______________m Distance to nearest deciduous tree stand:______________m
SESSION INFORMATION:
Date (mm/dd/yy): Time of civil sunset (24hr): Phase of Moon:
Time Nets Open (24 hr): Time Nets Closed (24hr):
Division Ratio: Sensitivity/Sample Rate:
Net Configuration and Anabat Placement: Sketch (grid cell size: ________m) NOTES
No. of Nets Set:
#6m: _______
#9m: _______
#12m: _______
#18m: _______
Canopy Net: _____
(circle net size): 6m, 9m, 12m, 18,
Harp Net: _______
CLIMATE DATA
Beginning Temperature (oC): Ending Temperature (oC):
Beginning Baro. Pressure (inHg): Ending Baro. Pressure (inHg):
Beginning Wind (mph): Ending Wind (mph):
Beginning Relative Humidity (%): Ending Relative Humidity (%):
Beginning Cloud Cover (%): Ending Cloud Cover (%):
Precip in last 24 hrs (Y/N): NOTES:
Habitat Types
1. Shrubland/ shrub steppe
2. Grassland
3. Wetland/ open water
4. Rock outcrop
5. Cliff (canyon, mountain)
6. Cave
7. Conifer forest
8. Deciduous forest
9. Foothills chaparral
10. Riparian shrub (ex. willows)
11. Badlands
12. Disturbed/ reclaimed/ mined/ oil & gas

Bats of Southern Wyoming, Wyoming Natural Diversity Database, 2012
89
* Bat ID # = number of that species captured tonight ** Repro = Males: N (Non-reproductive), D (descended); Females: N (non-reproductive), P (pregnant), L (lactating), PL (post-lactating) TOC = Time of Capture, FA = Forearm Length, Th. = thumb length, E = ear length, V# = number of specimen if collected. *** WDI: 0=No damage, 1=Light damage, 2=Moderate damage, 3=Heavy damage; Add “-P” to score if there is current physical damage.
________________________________________________________________________________________________________________________________
CAPTURE TOTALS M/F M/F M/F
ANPA MYCA MYTH TOTAL BATS
COTO MYCI MYVO TOTAL SPECIES
EPFU MYEV MYYU TOTAL ADULTS
EUMA MYLU PEHE TOTAL JUVENILES
LABO MYSE NYMA TOTAL MALES
LACI LANO TABR TOTAL FEMALES
PESU
____________________________________________________________________________________________________________________________________
ACOUSTIC ANALYSIS (call file # is of a representative call for that spp)
SPECIES
4 letter
code
Bat ID
#
*
TOC
24hr Sex
m/f Age
j/a
Repro
**
FA
mm
Th
mm
E
mm
Wt g
Keel
y/n
WDI
*** Photo #
V
#
Release
time
Recorde
d?
y/n
Notes (fungus?, dentition, fringe, fur, etc)
Species 1 (call file#): # of calls: Species 5 (call file#): # of calls:
Species 2 (call file#): # of calls: Species 6 (call file#): # of calls:
Species 3 (call file#): # of calls: Comments:
Species 4 (call file#): # of calls: