battery-less wireless human detection sensor networks
TRANSCRIPT
Design and implementation of lighting control system usingbattery-less wireless human detection sensor networks
Tao YU†a), Yusuke KUKI††, Gento MATSUSHITA††, Daiki MAEHARA†, Student Members,Seiichi SAMPEI††, Fellow, and Kei SAKAGUCHI†, Member
SUMMARY Artificial lighting is responsible for a large portion of total energy consumption and has great potential for energy saving. This paper designsan LED light control algorithm based on users’ localization using multiple battery-less binary human detection sensors. The proposed lighting control systemfocuses on reducing office lighting energy consumption and satisfying users’ illumination requirement. Most current lighting control systems use infraredhuman detection sensors, but the poor detection probability, especially for a static user, makes it difficult to realize comfortable and effective lighting control.To improve the detection probability of each sensor, we proposed to locate sensors as close to each user as possible by using a battery-less wireless sensornetwork, in which all sensors can be placed freely in the space with high energy stability. We also proposed to use a multi-sensor-based user localizationalgorithm to capture user’s position more accurately and realize fine lighting control which works even with static users. The system is actually implementedin an indoor office environment in a pilot project. A verification experiment is conducted by measuring the practical illumination and power consumption.The performance agrees with design expectations. It shows that the proposed LED lighting control system reduces the energy consumption significantly,57% compared to the batch control scheme, and satisfies user’s illumination requirement with 100% probability.key words: proof-of-concept, energy saving, LED light control, battery-less wireless human detection sensor network, multi-sensor user localization
1. Introduction
It has become a crucial issue to make more efforts on the optimization of energy usage, because of the limited resources and theconsequent increase in energy cost. A better energy usage results in fewer energy bills, less grid load and less environmentalimpact. Energy consumed by artificial lighting system constitutes a big portion of total energy consumption. In Japan, annualenergy consumption of lighting amounts to 150.6 TWh, accounting for 16% of national energy consumption [1]. Therefore, itwill make a notable positive impact for energy conservation to make lighting energy usage more efficient and to reduce energyconsumption.
User occupancy is one of the key factors of an energy-efficient lighting control system [2]. In conventional occupancy-based batch lighting control systems, when the presence of any user is detected in an area, a controller switches all or severalcorresponding lights on, and when the absence is detected for a given delay period, it switches off the lights. Experimentalstudy shows that in such system 20-26% energy can be saved compared with manual switching [3].
Occupancy sensors have been used for detecting user’s presence or absence. In [4]–[6], user occupancy or position isdetected using infrared sensors by dividing the space into partitions according to sensor coverages and then differentiatingthe single triggered sensor or the set of triggered sensors. In [7], multiple infrared sensors are integrated as a sensor node toincrease the detection capacities. Ultrasonic sensors [8], [9], RFID [10] and surveillance cameras [11] are also employed toobtain more accurate information of user’s occupancy. Past studies are inadequate for the application of intelligent lightingcontrols in three main aspects. First, in long-term uninterruptible surveillance, to avoid the frequent battery changes, sensorshave to be located in the ceiling or on the wall near the power source. The placements are limited and far from users, whichgreatly weaken the detection accuracy. Second, for infrared-sensor-based schemes, there is a lack of consideration of its largeinevitable detection errors especially for a static object, but in an indoor environment user quite probably stays somewhere.Thus the systems would suffer from the possible incorrect light switching operations when detection error happens, or useris out of the coverage. Third, for schemes using ultrasonic sensors, RFID and surveillance cameras, although more accurateinformation of user’s occupancy can be obtained for lighting controls, their consumed power and price are relatively high,and they are more invasive and difficult to install in existing rooms, compared with infrared sensors. Therefore, to address
†The authors are with Tokyo Institute of Technology.††The authors are with Osaka University.a) E-mail: [email protected]
arX
iv:1
704.
0480
2v1
[cs
.SY
] 1
6 A
pr 2
017

2
wireless powertransmission
access point access point BEMS Server
Control
commands
LEDController
DALIlink
LED light & wireless power transmitter
access link
Multi-hopcommunication
battery-less humaninfrared detection sensors
sensor coverage
lights
sensorcoverage
access link
Fig. 1 Illustration of LED control system using battery-less sensor network.
the challenges, we design a localization scheme for lighting control by using multiple battery-less infrared sensors to detectuser’s occupancy and positions with low energy consumption and easy installation.
Since the goal of the lighting control is to change the ON/OFF status or dimmer level of LED lights to create an areawith convenient and productive illumination with minimum power consumption, the artificial lighting and environment illu-mination cannot be separately considered. Adaptively making the best use of environment illumination, such as daylight andreflected light, can highly decrease the requirement of artificial lighting. Therefore, combining both of them when designing alighting project would efficiently increase the energy efficiency [6], [12]–[16]. Moreover, all research to date has detailed onlysimulations or small-scale testbeds. Our system has been implemented and applicated in a practical indoor office environmentin E3-315, Osaka University, Japan [17]. The image of the system is illustrated in Fig. 1.
In this paper, we design an LED lighting control scheme which bases on user’s position and environment illuminationlevel. It mainly focuses on the power consumption of the lighting system and the satisfaction of user’s illumination require-ment. It is suitable for office/home automation and can be easily installed in almost any environment without restriction. Todeal with the poor detection probability of infrared sensors, we built a battery-less human detection network [18][19], bywhich the sensors can be located anywhere in the space without restriction, so that they can be close to each user as muchas possible, instead of being inflexibly embedded in walls or ceilings, which are far from detection objects. And a seriesof distributed sensors with overlapping coverage were deployed, instead of single sensor for one LED light and one area inconventional lighting control systems. Based on the sensing measurements from multiple sensors and user’s illumination re-quirement, the BEMS (Building Energy Management System) server estimates user’s positions by a multi-sensor-based userlocalization algorithm, and generates control commands for switching ON/OFF or changing dimmer level of LED lights bysolving an optimization problem in each control period. LED lights are set by LED controller.
And a verification experiment is also conducted. In the experiment, the power consumption is logged by a power loggerin office’s electricity box, and the test user measures the practical illumination in his positions while walking around in theoffice. The experimental results show that the LED light control system can reduce power consumption by 57% without anyloss of user satisfaction.
The paper is organized as follows. Section 2 describes the configuration and deployment of the LED light control systemusing a battery-less wireless human detection sensor networks. Section 3 discusses the proposed LED light control algorithm.Section 4 discusses user localization scheme. Section 5 shows the results of a light control experiment in the office. Finally,

3
LED light
18m7.
2m
1.9m
2.1m
0.7m
0.5m
LED LightControllerController
BEMS
Fig. 2 LED light and controller.
Sec. 6 concludes this paper.
2. System description
The overall image and structure of the LED light control system are illustrated in Fig. 1. It has been deployed in a practicalindoor office environment in E3-315 of Osaka University. As shown in this figure, all LED lights are controlled by an LEDlight controller through a DALI (Digital Addressable Lighting Interface) link [20][21], in accordance with the commandsgenerated by the BEMS server. And to capture user’s location and to perform position-based light control, a battery-lesswireless human detection sensor network is also implemented in the office [18][19]. Multiple battery-less infrared humandetection sensors are placed on the desks with overlapped sensing coverages. The sensing measurements from sensors aretransmitted to the BEMS server through multi-hop communication. The details of the system configuration and deploymentwill be described in this section.
2.1 LED lights and controller
LED lights are suitable for energy-efficient lighting control systems because compared to the fluorescent and incandescentlight sources, LED lights have many merits including faster switching response time, lower energy consumption, higherphysical robustness and longer lifespan.
In the target office of this work, shown in Fig. 2, the LED lighting system consists of a plenty of LED light blockswhich are spatially distributed on the ceiling of illuminated space. By adjusting the emitting illumination of the spatiallydistributed LED lights, it can offer more flexible illumination distribution and light rendering than conventional light sources.This adjustable illumination distribution can also save the energy spent on the illumination into areas where illumination isnot actually required.
All of the LED lights are connected to an LED light controller. The controller receives control commands from the BEMSserver and then sends the commands to LED lights through a wired DALI link, which is a global industry standard protocolspecifically designed for artificial lighting systems. The adoption of industrial standards simplifies the development and setupof such complex systems. Each DALI loop can control up to 64 devices each of which is fully addressable. The BEMS servercan collect the sensing information from human detection sensors networks and create the LED control commands.
2.2 Human detection sensor network
As is in most current conventional lighting control systems, binary infrared human detection sensor, which relies on detectingchanges in the temperature pattern in the sensor’s detection zone, is employed in this work, because its energy consumptionand price are much lower than other types of human detection sensors (e.g., ultrasonic sensor and microwave sensor). Thesensor of this work consumes only 150 µW in intermittent data transmission mode. The chief drawback of currently available

4
Amplifier Synthesizer
InsideOutside
TxAntenna
CPU
TxAntenna
600
600
LED light
Unit:mm
Fig. 3 LED light and energy transmitter.
Fig. 4 Battery-less sensors.
infrared sensors is their low efficiency in detecting a static object and tiny movements. This makes it difficult to realizecomfortable and effective lighting control.
To address the poor detection probability, instead of placing the sensors in the ceiling or on the walls, we proposed tomore flexibly locate sensors close to each user as much as possible, by building a battery-less wireless sensor network in thetarget office, as shown in Fig. 1. That is to say, in this work, all sensors are battery-less and activated by multiple wirelessenergy transmitters, which are embedded in the ceiling LED lights, as shown in Fig. 3 and Fig. 4. Because of wirelesspower transmission and wireless sensing data communication, sensors can be put anywhere in the room rather than such fixedlocations as walls and ceilings. More sensors can be deployed in hot areas and at user’s side for more accurate detection.Moreover, there is almost no need for follow-up maintenance, such as recharging or changing the batteries.
On the transmitting side, the power of each energy transmitter is 1 W. Moreover, carrier shift diversity is employed[18][19], by which the interference among multiple energy transmitters can be effectively avoided, and hence the continuousand seamless coverage of energy supply can be achieved in the office. The energy efficiency of power transmitter can befurther increased in the future by using intermittent energy transmission, high efficient rectennas, beaming control, energyharvesting sensors, etc. [22]–[24]
On the other hand, the sensor’s function is simple. The binary infrared human detection sensor cannot directly givethe information of user’s location and movement. In each transmission process, it can only output 1-bit sensing information,which represents an estimation whether the user is present (1) or absent (0) in its coverage. To solve this problem, we proposedto deploy a distributed set of sensors with overlapping coverages in the human detection sensor network, instead of a singlesensor for one LED light and one area.
And to sense the environment illumination, illumination sensors are embedded alone with each human detection sensorand also activated by wireless power transmission, as shown in Fig. 4. Thus the illumination sensors are much closer to user’sworking surface and can be placed more flexibly, compared with the conventional illumination sensors which are located inthe ceiling.
And on the receiving side, with the consideration of power conversion efficiency of rectenna, the sensors in a battery-lesssensor node needs 400 µW to be activated battery-lessly.

5
2.3 Multi-hop communication network
The communication system is one of the core parts of any intelligent lighting control system. Wired communications forsensors will result in not only costly remodeling and rewiring work, but also inflexible sensor placement. In this work, sensorsand BEMS server form the networks wirelessly, so that sensors can be easily deployed and integrated into the existing roomswithout much restriction of installation. It is an accessible and economical solution for light control systems. To note, thecommunication between controller and light is through a wired DALI link.
Each sensor node detects user’s presence/absence status, measures the illumination, and then sends the sensing data toan access point through a wireless channel. The available power for a sensor is limited because it is activated by wirelesspower transmission. Therefore, to guarantee the converge of the wireless sensor network without significantly increasing thepower consumption of the RF module in each sensor node, it is sensible and necessary to introduce multi-hop communicationnetwork. Thus a hierarchical communication network is built, in which the access points have two wireless modules: sensingmeasurements collection, and multi-hop communication network among access points [25] to create a backhaul network.
Moreover, to reduce power consumption of sensors and extend the effective coverage of wireless power transmission,an intermittent data transmission scheme is employed. The sensor’s sensing module, which is responsible for a very smallamount of power compared to the RF module, is always active, but the RF module has two working modes (transmissionmode/sleep mode), and intermittently transmits the output to the access points [19].
2.4 Implementation cost
The LED lights and light controller (DALI) are all common retail productions and have no difference from those used in ourdaily life or in any other LED lighting control systems. The wireless power transmission system is also a general-purposesystem and can continuously supply energy wirelessly to variety kinds of sensors and devices. We expect that in the future itwould be located at ceilings or integrated into lights as a standard feature in every room [19]. Therefore, the only specializedpart in this work is the wireless sensor network. It includes sensors, wireless modules, development board, USB interface,APs for sensing data transmission and APs for multi-hop communication. They totally cost around 60,000JPY in this work,and they could be much cheaper if mass produced.
3. Illumination control
The illumination control in this work mainly focuses on minimizing the lighting power consumption while satisfying user’sillumination requirements, based on the user’s position and illumination preference.
3.1 Consumed power of LED lights
The power efficiency of LED lights, i.e., the ratio of consumed power to emitting illumination, is a function of many factors,which includes temperature, optical loss, working time, electrical and spectral efficiency, etc. [30][31] If the LED light is notoverheated, its power efficiency can be controlled to be a constant level in stable environments, such as indoor facilities. Thusthe relationship between emitting illumination and power consumption of LED lights can be considered as:
Cl = rl F l (1)
where Cl is the consumed power of LED light l, rl denotes the power efficiency factor of LED light l, and F l is the LED light’semitting illumination.
Therefore, the overall power consumption CAll of the LED light control system is given by summation of the powerconsumed by all LED lights and the other devices as:
CAll = CS +
I∑l
Cl = CS +
I∑l
rl F l (2)

6
LED light 1 LED light 2
lights fromLED light 1
Position 1(x$ , y$)
lights fromLED light 2
Position 2(x) , y))
attenuation coefficients
refle
ctin
gsu
rfac
e
reflectors(e.g., walls)
reflections
h+,,-,$
working plane
h+.,-.$
h+.,-.)
h+,,-,)
Fig. 5 Lighting model.
where I denotes the number of LED lights, and CS is the system’s overhead power consumption which includes the powerconsumed by the wireless power transmitter, wireless access point, BEMS server and LED light controller, etc. Note thatcompared to LED lights’ power (maximum 100 W per LED light in this work), CS is relatively small (around tens of watts).Therefore, it is treated as constant standby power here. Moreover, this part of energy consumption could be further decreased,e.g., by using lower energy cost devices and more efficient wireless energy transmission.
3.2 Lighting model
Figure 5 illustrates the geometry of LED lights in the ceiling and illuminated positions in working surface, which is a flatplane at desk height in the space. The illumination distribution of each position can be denoted by:
F lx,y = F l hl
x,y = swl F lfull hl
x,y (3)
where F lx,y is the received illumination in position (x, y) contributed by LED light l. F l = swlF l
full denotes luminous power ofthe LED light l, which is related to its maximum emitting illumination Ffull and current switch status swl of working dimmerlevel. hl
x,y is lth LED light’s attenuation factor, which indicates the path loss in light’s propagation from an LED light to anilluminated position. Obviously, the attenuation factor depends on the specification of LED lights (e.g. the physical shapeand beaming angle of LED lights), the system geometry (e.g. the spatial relationship between LED lights and illuminatedpositions) and the target environment (e.g. building materials which result in light reflection). In most practical cases, suchparameters will be nearly constant after setting up the system, so the factor hl
x,y can also be consequently considered astime-invariant.
Theoretically, the LOS (Line of Sight) propagation of lights from LED can be conveniently approximated by the gener-alized Lambertian source model, and hl
x,y can be accordingly defined by Lambertian functions following the Lambert’s cosinelaw [26]. However practically, various common furnishing and building materials, such as walls and furniture surfaces, areefficient diffuse reflectors of visible light. In comparison with LOS propagation, it is much more complicated and cumbersometo analytically model the effect of multiple diffuse reflections by reflectors of different materials in the complex circumstanceof a practical room. The illumination contributions from reflections are unneglectable and necessary to be taken into consid-eration for the total illumination of each illuminated position. For example, the typical indoor smooth white wall can reflectalmost 90% of light. If there is a lack of such consideration of reflection, the system has to cost extra energy to satisfy theillumination requirement near reflectors, and this will consequently decrease the systems energy saving performance.
In the most cases, the dominated indoor reflectors, such as white walls and large smooth surfaces of furniture, are fixedafter the construction of the room. Therefore, alternatively in this work, rather than model-based calculation, we practicallyobtain hl
x,y by respectively measuring F′l (the measured emitting illumination from LED light l) and F′x,y (the measuredreceived illumination at illuminated position), while other LED lights are off, using illumination sensors:
hlx,y = F′x,y / F′l (4)

7
[m]0 1 2 3 4
[m]
0
1
2
3
4
5
6
7
Illu
min
ance
/ lu
x
0
100
200
300
400
500
600
700
800
900
Fig. 6 Measured illumination.
Figure 6 gives an example of the measured received illumination from a full-on LED light in the left quarter of the office,which is shown in the dashed box in Fig. 2. Dividing it by the LED light’s maximum emitting illumination, the attenuationfactor can be derived. The benefits of such method are that both of direct illumination and the multiple diffuse reflections oflights in the practical room are well involved in total illumination without complicated environment and lighting model.
In an illuminated position, its total illumination is contributed by the direct and reflected illumination from all LED lights.It is denoted as:
Fx,y =
I∑l=1
F lx,y =
I∑l=1
swlF lfullh
lx,y (5)
The environment illumination in each position is approximated by that of the closest illumination sensor, which is co-located beside the infrared human detection sensor and spatially distributed in the office.
Fenx,y ≈ Fen
N(x,y) (6)
where Fenx,y denotes the environment illumination in position (x, y). N(x, y) is the position of nearest illumination sensor to
(x, y).
FenN(x,y) = F s − FN(x,y)
= F s −
I∑l=1
swlF lfullh
lN(x,y) (7)
where F s is the illumination measurements from illumination sensors. FN(x,y) is the illumination contributed by LED lights.
3.3 LED light control
In an office, only the illuminations on and around occupants or some specified objects which need to be illuminated (e.g.,a notice board) are necessary. And only when the necessary illuminations are higher than a satisfaction level, they areproductive and can increase the efficiency at work and the health of people. Therefore, we consider a localized illuminationcontrol scheme.
From the analysis above, given the location of user and the satisfaction illumination level, the optimization problem ofillumination control can be derived:
8
sensor sensor
sensor
(𝑥#$%, 𝑦#$%)
View angleof a sensor
(𝑥#, 𝑦#)
User
User
sensor
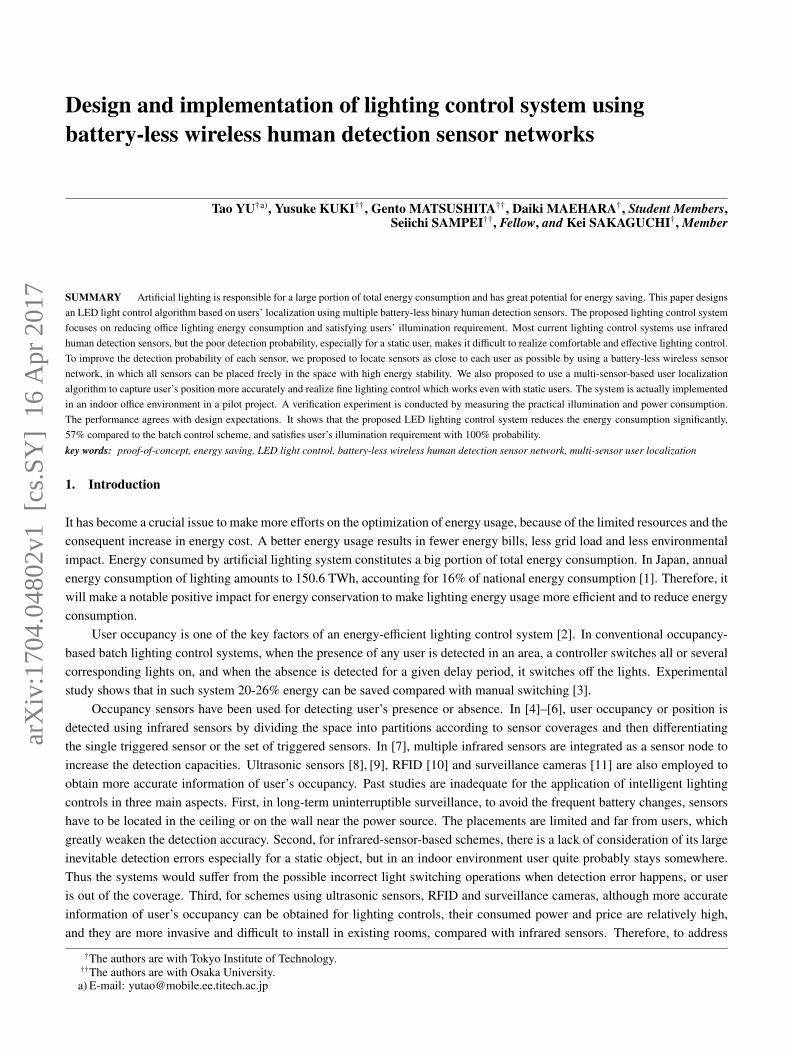
Fig. 7 User moving model.
min
sw1,sw2...CAll =
∑l
rlswlF lfull + CS
s.t.Fx,y > Fmin
u;x,y − Fenx,y (x, y) ∈ Gu u = 1, 2...U
0 ≤ swl ≤ 1 l = 1, 2...L
(8)
where Fenx,y denotes the environment illumination on position (x, y), which is obtained from illumination sensors. Fmin
u;x,y is theminimum satisfaction illumination of user u, which can vary in different positions. U is the number of users. Switch statusswl ∈ [0, 1] indicates a certain dimmer level of LED light l.
Note that currently in the verification experiments only ON/OFF control is conducted, i.e., swl = 1 or 0. Therefore,some other considerations on illumination distribution (e.g., contrast ratio of illumination in an area [28] to increase users’satisfaction) are not implemented. The more flexible and convenient dimmer control scheme will be conducted soon.
4. User localization
To realize the localized illumination control presented in Sec. 3, a battery-less wireless human detection sensor network isimplemented to detect user’s position and moving status. As described in Sec. 2, a series of battery-less infrared humandetection sensors are distributed in the target room. The binary sensing measurements are used to estimate user’s movingstates.
4.1 State transition model
In this paper we consider a 4-D state space S ⊂ R4, with the state vector s = [x, y, vx , vy]T , s ∈ S, where x, y and vx, vyrepresent user’s position and velocity in x-axis and y-axis respectively.
The state transition model takes into account that in the target indoor environment, user’s motion typically has two modeswith different characteristics. Static Mode: user stays in some location for a period. Moving Mode: user walks followingcertain moving-pattern. Therefore, we use a switching-mode approach to model it based on the consideration above.
User’s state transition rules in the two modes are different. In the moving mode, as shown in Fig. 7, the states transitionfollows a variable acceleration motion. Normal distribution is adopted here as the model for the variable accelerations [27].Additionally, to model the non-uniform acceleration or non-rectilinear motion within a time interval, two normally distributeddeviations are added to user’s position in both x- and y-axis respectively. On the other hand, in the static mode, user’s currentstate should either be the same as last state with probability PrS(), or turn into moving mode with probability 1 − PrS().Naturally this mode should only contain the states with zero velocity. The self-transition probability PrS() is a predefinedfunction of user’s last state. For example, in an office environment, in the area near the desk, user is more likely to maintainthe static mode with higher PrS(). The transitions of other states will follow the moving model.

9
Therefore, the state transition model can be written as:
ut = ut−1 + (Aut−1 + rt + nt) I(ut−1) (9)
with
A =
0 0 ∆t 00 0 0 ∆t0 0 1 00 0 0 1
, rt =
at,x∆t2/2at,y∆t2/2
at,x∆tat,y∆t
, nt =
nt,xnt,y00
,where, ut = s ∈ S is user’s state in time t. A is the state transition matrix for linear motion in moving mode. ∆t is the timeinterval. at,x, at,y∼N
(0, σ2
a
)are the independent normal accelerations in x-axis and y-axis. As described above, the deviation
movement is modeled by normal velocities followingN(0, σ2
v
). Therefore, the deviations nt,x, nt,y∼N
(0, σ2
n
)with σn = σv∆t.
I(ut−1) is an indicator function for user’s moving mode, which is related to user’s last state ut−1. It is given by:
I(ut−1) =
0 with Prob. PrS(ut−1)1 with Prob. 1 − PrS(ut−1)
(10)
Therefore, the transition probabilities that user is in state m in time t − 1 and in state j in time t can be written as:
Ti j =
PrS(si) when i = j[1−PrS(si)]PrM(ut = sj |ut−1 = si)
when i , j(11)
withPrM(ut = sj |ut−1 = si, ξt, Σs) ∼ N (ξt ,Σs)
where ξt and Σs are mean vector and covariance matrix respectively:
ξt = [xt−1 + vt−1,x∆t, yt−1 + vt−1,y∆t, vt−1,x, vt−1,y]T ,
Σs =
σ2v∆t2+
σ2a∆t4
4 0 σ2a∆t3
2 0
0 σ2v∆t2+
σ2a∆t4
4 0 σ2a∆t3
2σ2v ∆t3
2 0 σ2a∆t2 0
0 σ2v ∆t3
2 0 σ2a∆t2
For convenience, ξt and Σs are left out in the following content from the probability equation.
In the practical case, the moving model should be modified according to the real environment. The transition probabilitiesfrom or to invalid positions, e.g., positions in the invalid area, such as furniture’s location, or out of the edges of the targetarea, should set to be 0. When the state transition model is non-linear, generally there is no analytic expression of the resultof the Maximum Likelihood estimation, so that the transition process should be converted into a discrete form to search allpossible states.
4.2 Sensing model
Because all sensors in this work are activated by wireless power transmission, the power consumption becomes one of the mostimportant determining factors in choosing the sensor. Therefore, the sensors employed in this work are infrared directionalbinary human detection sensors. The sensors cannot directly give the information of user’s location or moving status. Thesensing outputs are binary only. The output 1 represents that the sensor detects the user in its coverage. And the output 0represents that sensor does not detect any user in its coverage. Moreover, the infrared sensor is the cheapest solution amongall types of sensors which can be used in localization, such as ultrasonic sensors and microwave sensors.
The employed sensors are directional sensors with fan-shaped sensing coverage, comparing with the disk-shaped cov-erage of omni-directional sensors. Considering the working mechanism of infrared sensors, distinct sensing-boundary in thefan-shape’s two edges of radii are assumed. And we also assume that the detection probability is uniform within the effectivecoverage radius R, and when outside of effective coverage, it decreases exponentially with the distance. Fig. 8 illustrates the

10
Wk
𝛼
effectivecoverage uncertain
coverage
sensor nodeuncovered area
Fig. 8 Directional sensing coverage model.
directional coverage model. Therefore, the likelihood function of sensor detection is given by:
Pr(bk |xi, yi) =
PDcik when bk = 11 − PDcik when bk = 0
(12)
where
cik =
0 when aik >
α2
e−ληβ
when R < dik and aik <α2
1 when R ≥ dik and aik <α2
(13)
where bk is the output sensing measurement of sensor k. (xi, yi) denotes the position of object. PD is the detection probabilitywithin the sensor’s effective coverage radius R. dik is the distance between sensor k and position (xi, yi). aik is the anglebetween sensor’s working direction Wk and the vector from sensor k to position (xi, yi). α is the view angle of the sensor. cik
is the attenuation factor of detection probability according to distance. η = dik −R. λ, β are parameters shaping the attenuationof detection probability.
Due to the mechanism that typically infrared sensor detects the fluctuation of infrared radiation impinging upon it fromthe objects in front of the sensor, the detection probabilities are different from the static and moving objects. By detectingthe infrared radiation changes from the background and the moving object in its field of view, the sensor is sensitive tomoving object, such as a walking human. While it is quite insensitive to static objects or small movements, because thetiny temperature changes may be treated as environment noises. This poses difficulties for the current infrared sensor basedlighting control systems, because the user may stay somewhere even for a long time in an office.
And according to our test, the false alarm probability of the employed infrared sensors is negligible and can be assumedto be 0.
4.3 User localization algorithm
To estimate user’s state, multi-sensor is deployed with overlapped coverage. Therefore, by combining the sensing measure-ments from multi-sensors, the large detection error of infrared human detection sensor can be overcome. In this section, amaximum likelihood estimation algorithm and a non-uniform resolution approximation algorithm are presented. The resultwill be used for LED light control in the next section.
User’s state is estimated by maximizing the accumulated likelihood function that user is currently in certain state giventhe sensor outputs, which is given by:
arg maxut
L (ut|Bt) = arg maxut
Pr (Bt|ut) (14)
where Bt = [b1, b2, ..., bt], and bt = [bt,1, bt,2, ..., bt,N] is the sensing vector of all sensors at time t, and N is the number ofsensors. All the sensing measurements are temporally and spatially conditionally independent. Therefore, for convenience ofcalculation, the accumulated likelihood can be separated into two parts: current likelihood and historical likelihood:
11
20 40 60 80 100Grid size (cm)
80
100
120
140
160
180
RMSE
(cm
)
Localization error
Fig. 9 Localization error.
L (ut = si|Bt) = Pr (Bt|ut = si)
= Pr (bt|ut = si) Pr (Bt−1|ut = si)
(15)
In our cases, the detection probability of employed sensor varies when the user is static (namely, ut−1 = si, ut = si) andmoving (namely, ut−1 = si, ut = sj , j , i). Therefore, current likelihood is further separated into these two cases andcalculated as:
Pr (bt|ut = si)
=
M∑j=1
Pr(bt|ut−1 = s j,ut = si
)Ti j
= Pr (bt |ut−1 = si,ut = si) Tii
+
M∑j=1, j,i
Pr(bt|ut−1 = sj ,ut = si
)Ti j (16)
where M = |S| denotes the number of states in state space. Tii and Ti j are the transition probability between two successivestates for a static and moving status correspondingly. They are defined by the movement model and can be derived fromEq. (11).
The historical likelihood can be calculated as:
Pr (Bt−1|ut = si)
=
M∑j=1
Pr(Bt−1|ut−1 = s j
)Ti j
=
M∑j=1
L(ut−1 = s j|Bt−1
)Ti j (17)
where L(ut−1 = s j|Bt−1) is the accumulated likelihood in the previous time step t − 1.Generally, it is difficult to obtain the closed form of result for Eq. (14). The numerical calculation should be done on
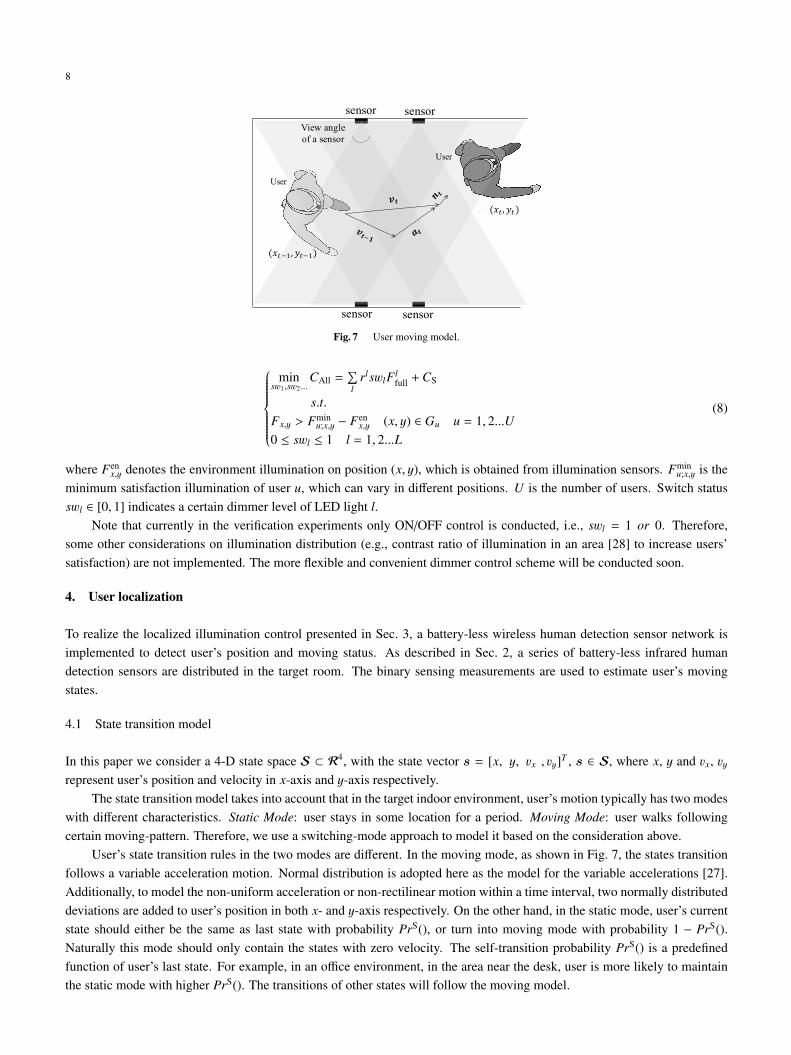
discrete states in the state space. The estimation error is inevitable because of the grid search and the sensing capability ofthe employed directional infrared binary human detection sensors. Figure 9 shows the relationship between grid size and thelocalization error.
Therefore, to compensate the estimation error and avoid loss of user satisfaction, not only the position with maximumlikelihood, but the illumination requirement in all the positions in a set GT should be satisfied. The set of location candidatesGT contains positions whose current total likelihood is larger than threshold Thc.
GT = {(xi, yi)|L (ut = si|Bt) > Thc, si ∈ S} (18)
Apparently the setting of Thc affects the performance of LED lights control and should balance the power consumptionand user’s satisfaction. Currently in the verification experiments, Thc is set empirically. The optimized threshold should

12Entrance
sensorsdesk
4.2[m]
7.2 [m]
sensorcoverage
overlappingcoveragefu
rniture
(a) Top view diagram of target space.
[m]0 1 2 3 4 5 6 7
[m]
4
3.5
3
2.5
2
1.5
1
0.5
0
real position estimated position sensors possible positions
(b) Experiments results.
Fig. 10 Results of user localization experiments.
depend on locations, because of the location-invariant estimation accuracy, which is caused by the non-uniform deploymentof directional sensors and user’s nonuniform moving patterns in a restricted indoor space. And the illumination distributionresulted from LED lights’ spatial distribution should also be taken into consideration. The theoretical analyses of optimizedthresholds will be included in the future work.
4.4 User localization experiment
An experiment is conducted to verify the performance of the battery-less human detection sensor network. Because theproposed lighting control system is mainly designed for such indoor environments as office, the target space is a typicalindoor office environment. It includes desks and pathways, and the size is 7.2 m × 4.2 m, as shown in Fig. 10(a). Humandetection sensors are placed on the desks. In the experiment, a user walks around in the space, from top right corner to downright corner.
The real positions and experimental results are shown in 10(b). The black line denotes user’s real routes, and the red xdenotes the position with maximum likelihood. The ellipses indicate the area of all possible positions, which are positions withprobabilities higher than a threshold, as described in Sec 4. Although the sensing capacity of a single binary infrared sensoris very coarse and cannot directly give the information of user’s position, but by deploying a series of distributed sensors, theestimated positions are close to real routes. The performance is also related to user’s moving status, the number and placementof sensors. Additionally, although it is a single user experiment, it is easy to extend to multi-user cases if the number of usersis known. With the consideration of calculation amount and to ensure the accuracy of LED control, the space is divided intogrids whose size is 30cm × 30cm. And it results in the localization error of 91 cm. Note that the real positions of the userare derived from the video of the experiment, so there could exist difference between the localization error in experiment andtheoretically in Fig. 9.
5. Lighting control experiment
The LED light control system is implemented in an indoor office environment. To evaluate the performance, an experimentis conducted. The test user walks in the office. Meanwhile the user measures and records the illumination by a handheldillumination meter at working surface height. And at the same time, the real-time lighting power consumption of the office isrecorded by a power logger, which is installed in the cable box and clipped on the electricity cable. The illumination meterand power logger are shown in Fig. 11.

13
Fig. 11 Experiment devices.
desk
4.2[m]
7.2 [m]
furniture startstay
stay
end
sensors
LED
Fig. 12 Experiment environment and walking path.
5.1 Experiment environment
The experiment area is a part of the office. Seven LED lights are under the ON/OFF control by the controller. Wirelesspower transmitters are embedded in all LED lights. Eight battery-less human detection sensors are put on the desk to detectuser’s location and track user’s motion. By our measurements, practical false alarm probability of the employed sensor isapproximately 0, and for moving user detection probability is about 0.8, while for a static user it is only 0.1 which is quite lowand makes it almost impossible to effectively detect the user. The reason is discussed in Sec. 4.2. And the minimum requiredillumination is set to be 400 lux according to the standard of indoor lighting levels of Japan [32].
The full-on working power consumption of an LED light is 100 W. Each wireless power transmitter transmits power of1 W, which is quite small compared to the power consumption of LED light and can be further decreased by optimization ofenergy transmission.
The walking path is as shown in Fig. 12. To simulate the real office user, the test user also switches between movingmode and static mode. If the system works well, only the lights near user’s location and path will be turned on, while otherswill be turned off to save the power.
5.2 Experimental result
The performance of proposed scheme is compared with the individual control, batch control and the ideal case of perfect userlocalization. In individual control, each LED light is individually triggered by a single sensor which is embedded beside LED
14
Time (s)0 20 40 60 80 100 120
Pow
er (k
W)
0
0.1
0.2
0.3
0.4
0.5
0.6
0.7
Measured power consumption of proposed schemeSimulation result of individual controlSimulation reslut of perfect user location detectionMeasured power consumption of batch control
Fig. 13 Experimental result of power consumption.
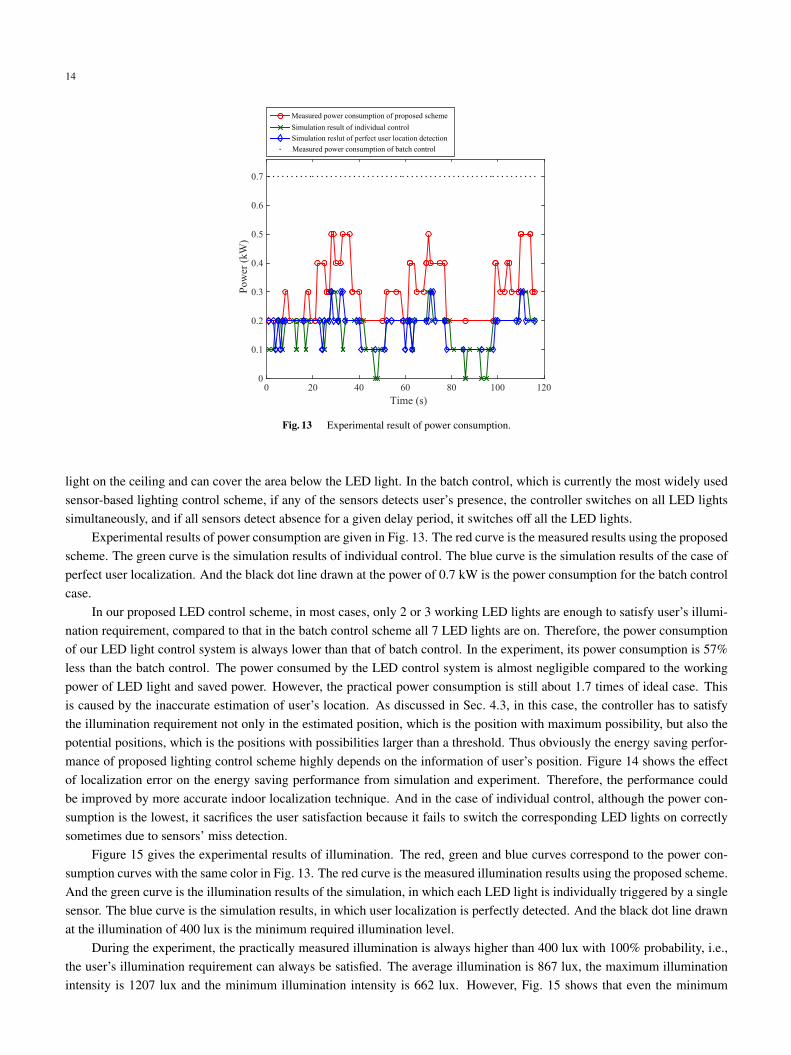
light on the ceiling and can cover the area below the LED light. In the batch control, which is currently the most widely usedsensor-based lighting control scheme, if any of the sensors detects user’s presence, the controller switches on all LED lightssimultaneously, and if all sensors detect absence for a given delay period, it switches off all the LED lights.
Experimental results of power consumption are given in Fig. 13. The red curve is the measured results using the proposedscheme. The green curve is the simulation results of individual control. The blue curve is the simulation results of the case ofperfect user localization. And the black dot line drawn at the power of 0.7 kW is the power consumption for the batch controlcase.
In our proposed LED control scheme, in most cases, only 2 or 3 working LED lights are enough to satisfy user’s illumi-nation requirement, compared to that in the batch control scheme all 7 LED lights are on. Therefore, the power consumptionof our LED light control system is always lower than that of batch control. In the experiment, its power consumption is 57%less than the batch control. The power consumed by the LED control system is almost negligible compared to the workingpower of LED light and saved power. However, the practical power consumption is still about 1.7 times of ideal case. Thisis caused by the inaccurate estimation of user’s location. As discussed in Sec. 4.3, in this case, the controller has to satisfythe illumination requirement not only in the estimated position, which is the position with maximum possibility, but also thepotential positions, which is the positions with possibilities larger than a threshold. Thus obviously the energy saving perfor-mance of proposed lighting control scheme highly depends on the information of user’s position. Figure 14 shows the effectof localization error on the energy saving performance from simulation and experiment. Therefore, the performance couldbe improved by more accurate indoor localization technique. And in the case of individual control, although the power con-sumption is the lowest, it sacrifices the user satisfaction because it fails to switch the corresponding LED lights on correctlysometimes due to sensors’ miss detection.
Figure 15 gives the experimental results of illumination. The red, green and blue curves correspond to the power con-sumption curves with the same color in Fig. 13. The red curve is the measured illumination results using the proposed scheme.And the green curve is the illumination results of the simulation, in which each LED light is individually triggered by a singlesensor. The blue curve is the simulation results, in which user localization is perfectly detected. And the black dot line drawnat the illumination of 400 lux is the minimum required illumination level.
During the experiment, the practically measured illumination is always higher than 400 lux with 100% probability, i.e.,the user’s illumination requirement can always be satisfied. The average illumination is 867 lux, the maximum illuminationintensity is 1207 lux and the minimum illumination intensity is 662 lux. However, Fig. 15 shows that even the minimum

15
0 20 40 60 80 100 120 140Localization error (cm)
20
40
60
80
Pow
er sa
ving
rate
(%) Power saving rate
Experiment
Ideal case
Fig. 14 Power saving rate.
Time (s)0 20 40 60 80 100 120
Illum
inan
ce (
lux)
0
200
400
600
800
1000
1200
Measured illuminance of proposed schemeSimulation result of individual controlSimulation reslut of perfect user location detectionMinimum required illuminance
Fig. 15 Experimental result of illumination.
practical illumination is larger than the required illumination, which is pre-set to be 400 according to the standard of indoorlighting levels of Japan. This is because in the current stage only ON/OFF LED light control is conducted. In the case ofdimmer control, the results should be improved. The illumination of individual control sometimes drops lower than 400 luxand even to 0 lux, due to the miss detection of infrared sensors, especially for a static user.
Additionally, the measured illumination curve in Fig. 15 seems to be fluctuating severely when the test user is moving,but in practice, such fluctuation is generally imperceptible for users with the naked eyes, especially when walking. On theother hand, in the case that the testing user is staying somewhere in the room to simulate daily working status, the number ofworking LED lights does not change and hence the illumination is quite stable.
6. Conclusion
In this work, we designed an LED light control system based on user’s location using a battery-less sensor network, andimplemented it in a practical indoor office environment. To address the challenge of energy stability, all sensors were battery-less and activated by multiple wireless energy transmitters embedded in LED ceiling lights. We deployed a distributed set ofsensors to overcome the detection errors of infrared sensors. By processing the output of the multiple sensors, user locationand motion are detected, tracked and predicted by a maximum likelihood algorithm. LED lights’ switch states were controlledbased on the user location detection and pre-set minimum required illumination. The experimental result shows that this LED

16
light control system reduces the energy consumption significantly, 57%, compared to the batch control scheme, and satisfiesusers illumination requirement with 100% probability.
Acknowledgement
This work is partially supported by Grants-in-Aid for Scientific Research from Japan Society for the Promotion of Sciencewith project number of 24246069.
References
[1] The Institute of Energy Economics, Japan, “Electricity saving potential of LED lighting”, [Oneline]. Available: https://eneken.ieej. or.jp/data/3893.pdf[2] M. Haq, M. Hassan, H. Abdullah, H. Rahman, M. Abdullah and D. Said, “A review on lighting control technologies in commercial buildings, their
performance and affecting factors”, Renew. Sustain. Energy Rev., vol.33, pp.268-279, 2014.[3] J. Jennings, F. Rubinstein, D. DiBartolomeo and S. Blanc, “Comparison of control options in private offices in an advanced lighting controls testbed”,
IES J., vol.29, no.2, pp.39-60, 2000.[4] B. Song, H. Choi and H. Lee, “Surveillance Tracking System Using Passive Infrared Motion Sensors in Wireless Sensor Network”, Proc. IEEE ICN
2008, pp.1-5, Apr. 2008.[5] Miyazaki, Toshiaki, and Yuki Kasama, “Estimation of the number of humans and their movement paths in a room using binary infrared sensors”, Proc.
ACM ICUIMC 2012, pp.91-97, Feb. 2012.[6] D. Caicedo and A. Pandharipande, “Distributed illumination control with local sensing and actuation in networked lighting systems”, IEEE Sensors
J., vol.13, no.3, pp.1092-1104, 2013.[7] B. Yang, J. Luo, and Q. Liu, “A novel low-cost and small-size human tracking system with pyroelectric infrared sensor mesh network”, Infrared Phys.
Techn., vol.63, pp.147-156, 2014.[8] A. Pandharipande and D. Caicedo, “Daylight integrated illumination control of LED systems based on enhanced presence sensing”, Energy Build.,
vol.43, no.4, pp.944-950, 2014.[9] R. Harle and A. Hopper, “The potential for location-aware power management”, Proc. ACM UbiComp 2008, pp.302-311, Sep. 2008.
[10] N. Li, G. Calis and B. Becerik-Gerber, “Measuring and monitoring occupancy with an RFID based system for demand-driven HVAC operations”,Automat. Constr., vol.24, pp.89-99, 2012.
[11] D. Liu, Y. Du, Q. Zhao and X. Guan, “Vision-based indoor occupants detection system for intelligent buildings”, Proc. IEEE IST 2012, pp.273-278,July 2012.
[12] G. Parise and L. Martirano, “Daylight impact on energy performance of internal lighting”, IEEE Trans. Ind. Appl., vol.49, no.1, pp.242-249, 2013.[13] L. Martirano, “Lighting systems to save energy in educational classrooms”, Proc. IEEE EEEIC 2011, pp.1-5, May 2011.[14] S. Matta and S.M. Mahmud, “An intelligent light control system for power saving”, Proc. 36th Annu. Conf. IEEE IES, pp.3316-3321, Nov. 2010.[15] Y. Wen, J. Granderson and A. Agogino, “Towards embedded wireless-networked intelligent daylighting systems for commercial building”, Proc. IEEE
SUTC 2006, vol.1, pp.6-12, Dec. 2006.[16] L. Yeh, C. Lu, C. Kou, Y. Tseng and C. Yi, “Autonomous light control by wireless sensor and actuator networks”, IEEE Sensors J., vol.10, no.6, pp.
1029-1041, 2010.[17] T. Yu, Y. Kuki, G. Matsushita, D. Maehara, S. Sampei, K. Sakaguchi, “Deployment of LED light control system using battery-less wireless human
detection sensor networks”, Proc. IEEE RFID-TA 2015, pp.14-19, Sep. 2015.[18] D. Maehara, G. Matsushita, Y. Kuki, K. Sakaguchi, S. Sampei and K. Araki, “[Requested Talk] Development of battery-less sensor networks for LED
light control system”, Proc. IEICE SR2014, vol.114, no.284, SR2014-78, pp.109-116, Dec. 2014.[19] D. Maehara, G. Tran, K. Sakaguchi and K. Araki, “Experimental study on battery-less sensor network activated by multi-point wireless energy
transmission”, IEICE Trans. Commun., vol.E99-B, no.4, pp.905-916, 2016.[20] “AC and/or DC-supplied electronic control gear for tubular fluorescent lamps - Performance Requirements”, IEC Std. 60929, 2014.[21] “Digital addressable lighting interface”, IEC Std. 62386, under deliberation.[22] A. Kansal, J. Hsu, S. Zahedi and M. Srivastava, “Power management in energy harvesting sensor networks”, ACM Trans. Embed. Comput. Syst.,
vol.6, no.4, pp.32, 2007.[23] B. Strassner and K. Chang, “Microwave power transmission: historical milestones and system components”, Proc. IEEE, vol.101, no.6, pp.1379-1396,
2013.[24] Z. Xiang, M. Tao, “Robust beamforming for wireless information and power transmission”, IEEE Wireless Commun. Lett., vol.1, no.4, pp.372-375,
2012.[25] “IEEE standard for local and metropolitan area networks - Part 15.4: Low-rate wireless personal area networks (LR-WPANs)”, IEEE Std. 802.15.4g,
2011.[26] J. Kahn and J. Barry, “Wireless infrared communications”, Proc. IEEE, vol.85, pp.265-298, 1997.[27] J. Calusdian, “A personal navigation system based on inertial and magnetic field measurements”, Ph.D. dissertation, Naval Postgraduate School,

17
Monterey, CA, USA, 2010.[28] P. Boyce, “Human factors in lighting”, Talor & Francis, London, 2003.[29] Y. Luo, Z. Feng, Y. Han and H. Li, “Design of compact and smooth free-form optical system with uniform illumination for LED source”, Opt. Express,
vol.18, pp.9055-9063, 2010.[30] S. Muthu and J. Gaines, “Red, green and blue LED-based white light source: implementation challenges and control design”, Proc. IEEE IAS Annn.
Conf., vol.1, pp.515-522, Oct. 2003.[31] N. Narendran and Y. Gu, “Life of LED-based white light sources”, J. Display. Technol., vol.1, no.1, pp.167-171, 2005.[32] “General rules of recommended lighting levels”, JIS Z-9110:2011, 2011.
Tao Yu received the B.E. degree in communication engineering from Taiyuan Institute of Technology, China, in 2008, andthe M.E. degree in signal and information processing from Communication University of China, in 2010. He is currently workingtoward the Ph.D. degree in the department of Electrical and Electronic Engineering, Tokyo Institute of Technology. His researchinterests are building energy management and sensor networks.
Kuki Yusuke received the B.E. degree in electronic and information engineering from Osaka University, Osaka, Japan in2013, and the M.E. degree in electrical, electronic and information engineering from Osaka University, Osaka, Japan in 2016.
Gento Matsushita received the B.E. degree in electronic and information engineering from Osaka University, Osaka, Japanin 2014, and the M.E. degree in electrical, electronic and information engineering from Osaka University, Osaka, Japan in 2016,where he conducted the research of wireless energy transmission, wireless sensor network systems and low-power circuit design.
Daiki Maehara received the B.E. and M.E. degrees in electrical and electronic engineering from Tokyo Institute of Technology,Japan, in 2011 and 2013 respectively. He is currently a Ph.D. student at Tokyo Institute of Technology. He received the Best PaperAward from both IEICE SR technical committee and IEICE Communication Society in 2013 and 2014 respectively. His researchinterests are wireless energy transmission, RFID, sensor network systems and low-power circuit design.

18
Seiichi Sampei received the B.E., M.E., and Ph.D degrees in electrical engineering from Tokyo Institute of Technology, Japan,in 1980, 1982 and 1991, respectively. From 1982 to 1993, he was with the Communications Research Laboratory, Ministry ofPosts and Telecommunications. During 1991 to 1992, he was at the University of California, Davis, as a visiting researcher. In1993, he joined the Faculty of Engineering, Osaka University, and he is currently a Professor in the department of Informationand Communications Technology, Osaka University. He has developed active modulation, intelligent radio transmission/access,cognitive wireless networking, and wireless distributed network techniques. He received the Shinohara Young Engineering Award,the Achievements Award and Communications Society Best Paper Award from the IEICE, the Telecom System Technology Awardfrom the Telecommunications Advancement Foundation, the DoCoMo Mobile Science Award from the Mobile CommunicationFund, and the Ericsson Telecommunications Award. He is a member of the Institute of Image Information and Television Engi-neers(ITE) and a Fellow of IEEE.
Kei Sakaguchi Kei Sakaguchi received the M.E. degree in Information Processing from Tokyo Institute Technology in 1998,and the Ph.D degree in Electrical & Electronics Engineering from Tokyo Institute Technology in 2006. Currently, he is working atTokyo Institute of Technology in Japan as a Professor and at the same time he is a Senior Scientist at Fraunhofer HHI in Germany.He received the Outstanding Paper Awards from SDR Forum and IEICE in 2004 and 2005 respectively, and three Best PaperAwards from IEICE communication society in 2012, 2013, and 2015. He also received the Tutorial Paper Award from IEICEcommunication society in 2006. He served as a TPC co-chair in the IEEE 5G Summit in 2016, a General co-chair in the IEEEWDN-5G in 2017, and a Industrial Workshop co-chair in the IEEE Globecom in 2017. His current research interests are in 5Gcellular networks, millimeter-wave communications, and wireless energy transmission. He is a member of IEICE and IEEE.