bauxite and alumina - jrj.com.cnpg.jrj.com.cn/acc/res/cn_res/indus/2016/6/15/4d94aa4d-da2a-4cba...
TRANSCRIPT

Deutsche Bank Markets Research
Australasia
Australia
M&M - Diversified Resources
Industry
Bauxite and Alumina
Date
15 June 2016
Forecast Change
Global deep dive: China well supplied
Downgrading seaborne alumina and bauxite price forecasts
________________________________________________________________________________________________________________
Deutsche Bank AG/Sydney
Deutsche Bank does and seeks to do business with companies covered in its research reports. Thus, investors should be aware that the firm may have a conflict of interest that could affect the objectivity of this report. Investors should consider this report as only a single factor in making their investment decision. DISCLOSURES AND ANALYST CERTIFICATIONS ARE LOCATED IN APPENDIX 1. MCI (P) 057/04/2016.
Paul Young
Research Analyst
(+61) 2 8258-2587
Anna Mulholland, CFA
Research Analyst
(+44) 20 754-18172
Jorge Beristain, CFA
Research Analyst
(+1) 203 863-2381
Sharon Ding
Research Analyst
(-) - -
Grant Sporre
Research Analyst
(+44) 20 754-58170
George Buzhenitsa
Research Analyst
(+971) 4 361-1734
Rene Kleyweg
Research Analyst
(+44) 20 754-18178
Key Changes
Company Target Price Rating
RIO.AX 56.50 to 54.20(AUD) -
S32.AX 1.70 to 1.60(AUD) -
NHY.OL 33.00 to 31.00(NOK) -
AWC.AX 1.65 to 1.40(AUD) Buy to Hold
2600.HK 3.00 to 2.80(HKD) -
0486.HK 2.55 to 2.45(HKD) -
Source: Deutsche Bank
Companies Featured
Rio Tinto (RIO.AX),AUD42.96 Buy
South32 (S32.AX),AUD1.57 Hold
Norsk Hydro (NHY.OL),NOK31.15 Hold
Alumina (AWC.AX),AUD1.36 Hold
Alcoa (AA.N),USD9.10 Buy
Chalco (2600.HK),HKD2.36 Hold
China Hongqiao Group Ltd. (1378.HK),HKD5.18
Buy
United Company RUSAL (0486.HK),HKD2.32
Hold
Vedanta Resources (VED.L),GBP373.00 Hold
Source: Deutsche Bank
China is the world's largest alumina producer and largest consumer of third party seaborne bauxite importing around 40% of their bauxite needs. Our recent field trip to Henan province in China uncovered that alumina refineries began restarting at US$245-250/t (seaborne Eq price). Also, our seaborne bauxite SD model shows that China is well supplied until 2020. We are downgrading our alumina price forecasts by an average 15% with 2016 down to US$236/t (vs. spot at US$246/t) and lowering our bauxite price forecast from 2018 onwards. We are downgrading AWC to a HOLD. In our global alumina/bauxite coverage we prefer Hongqiao, Alcoa, and Rio Tinto (all BUYs).
Seaborne alumina: Chinese restarts and capacity growth weigh on price Based on new capacity build and restarts we expect a 7% increase in Chinese alumina production in 2016 to 61.5Mt and then a further 6% growth to 65Mt in 2017. The recent recovery in the Chinese domestic alumina price to RMB1,950/t (US$250/t seaborne equivalent) has resulted in 4.5Mt of restarts. We see RMB1,900/t (US$245/t) as the critical price level. Above this, more idled capacity will restart and below this more capacity will be curtailed. However this “equilibrium price” level continues to decline as new low cost refineries are brought on-line. As such, this should weigh on alumina imports and we have downgraded our seaborne alumina price forecasts by 6% in 2016 to US$236/t and by 13% in 2017 to US$245/t. We have also downgraded our long run price by 9% to US$290/t (real). We see this as the price required to incentivize restarts of high-cost curtailed refineries in the Atlantic.
Seaborne bauxite: oversupplied until 2020 Chinese bauxite imports have increased from 30Mt in 2010 to 56Mt in 2015, and are forecast to increase to 80Mtpa by 2020. China appears to be well supplied until the end of the decade however. Our Chinese bauxite SD model predicts a rising market surplus, increasing to 10Mt in 2018. This is mainly due to increasing exports from Australia and Guinea, which is offsetting a drop from Malaysia. We also see the risk that Indonesia resumes exports in 2017. In addition, we estimate that China has 34Mt or 40 weeks of supply of imported bauxite stocks. Over the long run, we see China’s bauxite deposits declining in quality, pushing the market into deficit by 2021, even with Rio Tinto’s 22Mtpa Amrun project. The bauxite price has declined from US$75/t in 2014 to US$46/t, and we expect prices to stay under pressure over the medium term.
Hongqiao, Rio Tinto, Alcoa/AWC best positioned The largest sellers of third party alumina are AWC and Alcoa (AWAC JV) and Chalco while Rio Tinto is the largest seller of third-party bauxite. Chinese companies Hongqiao and Chalco are the largest third party buyers of bauxite to supply their domestic alumina refineries. The most integrated and lowest cost company is China Hongqiao. From a valuation and market position perspective, we prefer Hongqiao, Alcoa and Rio Tinto (all BUYs).
Valuation and sector risks Our PT’s are set broadly in-line with our DCF derived valuations. Company risks include adverse commodity and currency movements (pg. 28). This report changes price targets, recommendations and estimates for several companies under coverage; for details, please see Figure 10.
15 June 2016
M&M - Diversified Resources
Bauxite and Alumina
Page 2 Deutsche Bank AG/Sydney
Table Of Contents
Chinese alumina well supplied until 2020 .......................... 3 Downgrading seaborne alumina and bauxite prices ........................................... 3 Company exposures ........................................................................................... 4 Changes to our estimates and ratings: AWC down to Hold ............................... 5 Valuation metrics: we prefer Rio, Alcoa and Hongqiao ...................................... 6 Company summaries: Rio, Hongqiao best positioned ........................................ 6
Chinese Alumina market .................................................. 10 Chinese alumina price driving seaborne alumina price .................................... 10 Chinese Supply/Demand .................................................................................. 12 The Chinese cost curve ..................................................................................... 16 The Global cost curve ....................................................................................... 18
Seaborne Bauxite market ................................................. 19 China well supplied until 2020 .......................................................................... 19 The seaborne bauxite price ............................................................................... 22 Global seaborne (China bound) bauxite costs and margins .............................. 23
Company Financials ......................................................... 27 Valuation and risks ........................................................................................... 27

15 June 2016
M&M - Diversified Resources
Bauxite and Alumina
Deutsche Bank AG/Sydney Page 3
Chinese alumina well supplied until 2020
Downgrading seaborne alumina and bauxite prices
The seaborne bauxite market is rapidly increasing in size due to the reliance of
China’s domestic alumina refineries on imported bauxite. We have compiled a
detailed Chinese bauxite supply demand model which includes both domestic
and imported bauxite based on a contained aluminium unit basis. Our recent
field trip to Henan province, in China helped us validate numerous data points
and provided more real time data on Chinese alumina production growth,
costs and the level of curtailments and restarts.
Starting with alumina, the recovery in the Chinese domestic alumina price to
RMB1,950/t (US$250/t seaborne equivalent) has resulted in 4.5Mt of restarts.
We see RMB1,900/t (US$245/t) as the critical price level. Above this, more
idled capacity will restart and below this more capacity will be curtailed.
However the Chinese cost curve continues to decline as new low cost
refineries are brought on-line. With China adding new low-cost alumina
capacity and with imports flat lining, we expect the seaborne alumina price to
closely track the equilibrium price in China over the near to medium term. As
such, we have downgraded our seaborne alumina price forecasts by 6% in
2016 to US$236/t and by 13% in 2017 to US$245/t. We have also downgraded
our long run price by 9% to US$290/t (real). We see this as the price required
to incentivize restarts of high-cost curtailed refineries in the Atlantic basin
where market dynamics are dislocated from Chinese supply and demand.
China appears to be well supplied with bauxite until the end of the decade due
to increasing domestic production and an increase in bauxite exports from
Australia and Guinea. In addition, we estimate that China has around 34Mt of
imported bauxite stocks or c. 40 weeks of supply. We forecast a 2Mt surplus
in 2016 but a 10Mt surplus in 2018. However the market should move into
deficit by around 2021 even with the ramp-up of Rio Tinto’s 20Mtpa Amrun.
We have downgraded our bauxite price forecasts to reflect our views on future
market balance and margins.
Figure 1: Alumina, bauxite and aluminium price forecasts
1Q16 2Q16 3Q16 4Q16 2016 2017 2018 2019 2020 2021 L/T (real) L/T (nominal)
Alumina Index (US$/t) FOB
Previous 222 256 260 270 250 280 310 326 342 345 320 350
Revised 222 256 240 235 236 245 260 270 280 290 290 317
% change 0% 0% -8% -13% -6% -13% -16% -17% -18% -16% -9% -9%
Bauxite Index (US$/t) CIF
Previous 48 45 45 45 46 50 53 55 58 59 55 60
Revised 48 45 50 50 48 50 45 40 50 55 50 55
% change 0% 0% 11% 11% 5% 0% -15% -28% -13% -7% -9% -9%
Aluminium (USc/lb)
Previous 69 71 69 69 70 72 77 82 87 91 88 96
Revised 69 71 69 69 70 72 77 82 87 91 88 96
% change 0% 0% 0% 0% 0% 0% 0% 0% 0% 0% 0% 0%
Source: Deutsche Bank, Bloomberg Finance LP, CM Group

15 June 2016
M&M - Diversified Resources
Bauxite and Alumina
Page 4 Deutsche Bank AG/Sydney
Company exposures
Earnings exposure to spot alumina and bauxite prices
Alumina and bauxite pricing structure varies widely between producer and
customers. The largest sellers of third party bauxite and alumina are AWC and
Alcoa (AWAC JV), Rio Tinto and Norsk Hydro. The AWAC JV is 60% owned by
Alcoa and 40% owned by AWC. The largest buyers of third party bauxite and
alumina are Chinese companies Xinfa and Chalco.
Figure 2: Long/short alumina position (Mt)* - 2016 data Figure 3: Long/short bauxite position (Mt)* - 2016 data
12.5
7.5
3.21.8
0.7 0.1 0.0
-2
0
2
4
6
8
10
12
14
Net position - alumina (Mt)
27.5
5.0 3.00.0
-3.4-6.9
-10.9
-25
-15
-5
5
15
25
35
Net position - bauxite (Mt)
Source: Deutsche Bank, company dat. * excludes intersegment sales
Source: Deutsche Bank, company data * excludes intersegment sales
The major producers of alumina and seaborne bauxite
Global alumina production was around 115Mt in 2015 and is forecast to grow
modestly in 2016. The Top 5 producers of alumina are Chalco, followed by
Xinfa, then Rusal, Hongqiao and Rio Tinto.
Figure 4: Major global alumina producers (Mt) – 2016
data
Figure 5: Major global alumina producers (%) -2016 data
16.4
12.6 12.2
9.68.0 7.7
5.6 5.3 5.1 4.8
0.0
2.0
4.0
6.0
8.0
10.0
12.0
14.0
16.0
18.0
Others26%
Chalco14%
Xinfa11%
Rusal10%
Hongqiao8%
Rio Tinto7%
Alcoa7%
Norsk Hydro
5%
South324%
AWC4%
Jingjiang Group
4%
Source: Deutsche Bank, company data, Wood Mackenzie
Source: Deutsche Bank, company data, Wood Mackenzie
Global bauxite production is around 260Mtpa but the contestable market is
around half that at c. 140Mtpa. China imported 56Mt of bauxite in 2015 but
consumes a total of around 130Mt. Looking at those companies that supply
China, the world’s largest exporter to China is Rio Tinto (predominately from
the Australian assets), followed by Malaysian companies, then and Guinea is
now in the number 3 position.

15 June 2016
M&M - Diversified Resources
Bauxite and Alumina
Deutsche Bank AG/Sydney Page 5
Figure 6: Major global bauxite companies (Mt) supplying
China – 2016 data
Figure 7: Major global bauxite producers (%) supplying
China – 2016 data
21.5
10.3 10.28.4
1.6 1.2 0.7
0.0
5.0
10.0
15.0
20.0
25.0
Rio Tinto40%
Malaysia19%
Hongqiao19%
India -Orissa15%
Brazil3%
Dovemco2%
Bosai Minerals
1%Others
1%
Source: Deutsche Bank, China customs, Bloomberg Finance LP, CM Group, Aladdiny
Source: Deutsche Bank, China customs, Bloomberg Finance LP, CM Group, Aladdiny
Figure 8: Major countries supplying bauxite to China (Mt)
– 2016 data
Figure 9: Major countries supplying bauxite to China (Mt)
– 2016 data
21.2
10.3 10.28.4
2.4 1.2 0.8
0.0
5.0
10.0
15.0
20.0
25.0
Australia39%
Malaysia19%
Guinea19%
India15%
Brazil4%
Dominican Republic
2%
Ghana2% Others
0.4%
Source: Deutsche Bank, China customs, Bloomberg Finance LP, CM Group, Aladdin
Source: Deutsche Bank, China customs, Bloomberg Finance LP, CM Group, Aladdin
Changes to our estimates and ratings: AWC down to Hold
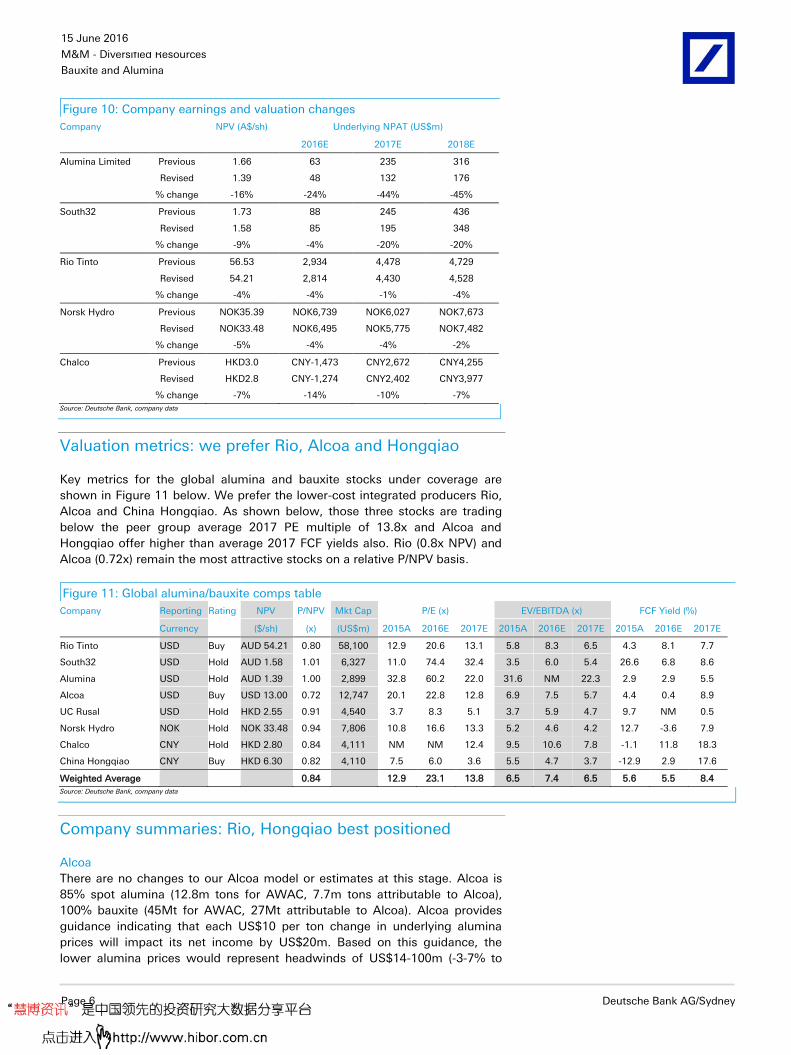
Company earnings, valuation and recommendation changes for stocks in our
global coverage universe with exposure to spot bauxite and alumina are shown
in Figure 10 below. The largest cuts have been to our AWC and South32
estimates followed by Chalco then Rio Tinto. We have downgraded our AWC
recommendation from BUY to HOLD.
15 June 2016
M&M - Diversified Resources
Bauxite and Alumina
Page 6 Deutsche Bank AG/Sydney
Figure 10: Company earnings and valuation changes
Company NPV (A$/sh) Underlying NPAT (US$m)
2016E 2017E 2018E
Alumina Limited Previous 1.66 63 235 316
Revised 1.39 48 132 176
% change -16% -24% -44% -45%
South32 Previous 1.73 88 245 436
Revised 1.58 85 195 348
% change -9% -4% -20% -20%
Rio Tinto Previous 56.53 2,934 4,478 4,729
Revised 54.21 2,814 4,430 4,528
% change -4% -4% -1% -4%
Norsk Hydro Previous NOK35.39 NOK6,739 NOK6,027 NOK7,673
Revised NOK33.48 NOK6,495 NOK5,775 NOK7,482
% change -5% -4% -4% -2%
Chalco Previous HKD3.0 CNY-1,473 CNY2,672 CNY4,255
Revised HKD2.8 CNY-1,274 CNY2,402 CNY3,977
% change -7% -14% -10% -7%
Source: Deutsche Bank, company data
Valuation metrics: we prefer Rio, Alcoa and Hongqiao
Key metrics for the global alumina and bauxite stocks under coverage are
shown in Figure 11 below. We prefer the lower-cost integrated producers Rio,
Alcoa and China Hongqiao. As shown below, those three stocks are trading
below the peer group average 2017 PE multiple of 13.8x and Alcoa and
Hongqiao offer higher than average 2017 FCF yields also. Rio (0.8x NPV) and
Alcoa (0.72x) remain the most attractive stocks on a relative P/NPV basis.
Figure 11: Global alumina/bauxite comps table
Company Reporting Rating NPV P/NPV Mkt Cap P/E (x) EV/EBITDA (x) FCF Yield (%)
Currency ($/sh) (x) (US$m) 2015A 2016E 2017E 2015A 2016E 2017E 2015A 2016E 2017E
Rio Tinto USD Buy AUD 54.21 0.80 58,100 12.9 20.6 13.1 5.8 8.3 6.5 4.3 8.1 7.7
South32 USD Hold AUD 1.58 1.01 6,327 11.0 74.4 32.4 3.5 6.0 5.4 26.6 6.8 8.6
Alumina USD Hold AUD 1.39 1.00 2,899 32.8 60.2 22.0 31.6 NM 22.3 2.9 2.9 5.5
Alcoa USD Buy USD 13.00 0.72 12,747 20.1 22.8 12.8 6.9 7.5 5.7 4.4 0.4 8.9
UC Rusal USD Hold HKD 2.55 0.91 4,540 3.7 8.3 5.1 3.7 5.9 4.7 9.7 NM 0.5
Norsk Hydro NOK Hold NOK 33.48 0.94 7,806 10.8 16.6 13.3 5.2 4.6 4.2 12.7 -3.6 7.9
Chalco CNY Hold HKD 2.80 0.84 4,111 NM NM 12.4 9.5 10.6 7.8 -1.1 11.8 18.3
China Hongqiao CNY Buy HKD 6.30 0.82 4,110 7.5 6.0 3.6 5.5 4.7 3.7 -12.9 2.9 17.6
Weighted Average 0.84 12.9 23.1 13.8 6.5 7.4 6.5 5.6 5.5 8.4
Source: Deutsche Bank, company data
Company summaries: Rio, Hongqiao best positioned
Alcoa
There are no changes to our Alcoa model or estimates at this stage. Alcoa is
85% spot alumina (12.8m tons for AWAC, 7.7m tons attributable to Alcoa),
100% bauxite (45Mt for AWAC, 27Mt attributable to Alcoa). Alcoa provides
guidance indicating that each US$10 per ton change in underlying alumina
prices will impact its net income by US$20m. Based on this guidance, the
lower alumina prices would represent headwinds of US$14-100m (-3-7% to

15 June 2016
M&M - Diversified Resources
Bauxite and Alumina
Deutsche Bank AG/Sydney Page 7
both DBe net income and EPS) over 2016-2018 while EBITDA could be 1-5%
lower over the same time frame. This is based on our estimates that Alcoa
produces 13.2m tons of alumina in both 2017 and 2018 and most of this (8.9m
tons or 68%) is sold to third parties.
Alumina (AWC)
The cut to our alumina and bauxite prices has reduced our AWC earnings by
around 50% and our NPV by 16% from A$1.66 to A$1.39/sh. As the stock is
trading within 10% of our revised NPV we are downgrading our
recommendation from BUY to HOLD. AWC has a strong balance sheet (c. 5%
gearing), low growth capex, and is paying out FCF in dividends on a six month
trailing basis. The portfolio clean-up is almost complete with the high cost
Point Comfort and Suriname refineries to be fully curtailed by the end of 2Q16.
This should lower costs another US$15/t with the potential for costs to drop
below US$180/t with further productivity gains.
Following the closure of the Atlantic refineries, Alcoa and AWC (AWAC JV) are
in a position to increase third party bauxite exports to China from Brazil and
Guinea. We already assume that AWAC increases bauxite exports from 2Mt in
2015 to 6Mtpa from 2018 onwards.
Chalco
Chalco produced 17.9mt of bauxite from its self-owned mines in 2015,
accounting for 55% of total annual bauxite production. The company procures
the rest (45%) of its bauxite supplies mainly from domestic suppliers and, to a
lesser extent, international suppliers. Average cost per tonne was 251.6 RMB/t
for self-produced bauxite and 383 RMB/t for bauxite supplied by third party in
2015. A decrease in seaborne bauxite price will lower the unit cost of bauxite
in alumina production, but the effect is limited because Chalco will be
procuring a larger percentage of its bauxite used for alumina production
through self-owned mines currently under development in Laos and Indonesia.
In 2015, Chalco supplied approximately 5.3mt of alumina produced from their
own refineries to their own aluminum smelters, accounting for roughly 40% of
annual alumina production. The other 60% of alumina produced are sold to
Chalco’s customers through Chalco Trading. The company’s alumina segment
will be affected by the decrease in alumina price, but at the same time, Chalco
has managed to lower its alumina unit cost substantially last quarter (DBe,
12%YoY decline in 2016E), we thus revise up the 2016E bottom line from
RMB1.5bn losses to RMB1.3bn losses. Given the limited room for further cost
reduction in 2017 and 2018, we cut the NPAT estimates by 10% and 7%,
respectively.
Hongqiao
China Hongqiao mainly secures its bauxite by signing long-term contracts with
Australia (10y, 6Mtpa), India (3y, 3Mtpa) and Malaysia at fixed rate. With the
completion of its Guinean bauxite project in late 2015, the company expects
15mt and 30mt bauxite supply from Guinea in 2016 and 2017, respectively.
However, we take a more conservative view on Guinean exports in our supply
& demand analysis. In terms of alumina capacity, we expect another 2Mt new
capacity to be ramped up this year which will bring its total alumina capacity
to 9mt by 2016, indicating a 70%+ self-sufficient rate. With most of the bauxite
secured at a fixed rate and most alumina feed its own smelters, the downgrade
in seaborne bauxite and alumina price will have limited impact on Hongqiao’s
bottom line in coming years.

15 June 2016
M&M - Diversified Resources
Bauxite and Alumina
Page 8 Deutsche Bank AG/Sydney
Norsk Hydro
Our earnings estimates for Hydro drop by 7% in each of 2016 and 2017 and
4% in 2018, primarily due to the cut in our alumina price forecasts. Our NPV
decreases by 5% to NOK33.5 per share and we reduce our target price to
NOK31 as a result.
Hydro is a fully integrated aluminium producer, with interests in two low-cost
bauxite mines which serve its one low-cost alumina refinery. In bauxite, Hydro
has a 5% stake in the 18Mtpa MRN mine, and a 45% off-take agreement, and
it owns 100% of the 10Mtpa Paragominas mine. In alumina, Hydro has a 92%
stake in the low-cost Alunorte alumina refinery. With nameplate capacity of
6.3Mtpa, Alunorte is the world’s largest alumina refinery.
At present, Hydro is slightly long bauxite: its annual bauxite production is
18.1Mt (10Mt from Paragominas and 45% of MRN’s 18Mt output) and, at 2.6t
of bauxite: 1t alumina, it can therefore produce 7Mt alumina compared with
Alunorte’s 6.3Mt capacity. All of Paragominas’ bauxite goes to Alunorte, whilst
2.5-35Mt of MRN’s production – 14 to 19% of capacity - is sold to third-parties,
at spot prices.
Hydro is also long alumina. Its internal needs are around 4Mt each year for
which it has production from Alunorte of around 6Mt in 2015 and it also
sources 2.3Mt of alumina on long-term contracts. This leaves it in a long
position of between 3 and 4Mt each year which it sells on spot to third parties.
Hydro is debottlenecking Paragominas to 11Mtpa by 2018. There is an option
to expand the mine further, to 14.8Mt, but this would require an increase in the
capacity of the 250km pipeline which connects the mine to the Alunorte
refinery and management is not considering such an expansion at present.
Hydro is also debottlenecking Alunorte to 6.6Mt by 2018.
South 32
Around two thirds of South 32’s 5.3Mtpa of alumina production is sold to third
parties and close to 100% of all alumina is sold at spot. The cut to our alumina
price forecasts has reduced our S32 earnings by around 20% and our NPV by
9% from A$1.73 to A$1.58/sh. Alumina remains S32’s largest earnings
contributor, representing c. 20% of EBITDA and 31% of NPV.
South32 is on track to "significantly exceed" the original US$350m cost out
target. Guidance on an asset by asset basis aligns very closely with our US$1b
cost reduction estimate when including both controllable and uncontrollable
costs. The Worsley alumina refinery in Western Australia is a significant part of
the group wide cost out. The Alumar refinery in Brazil is already extremely low
cost.
Rio Tinto
Our Rio Tinto earnings have reduced by 2-3% each year and our NPV by 4% (to
A$54.2/sh) due to the impact of both the lower bauxite and alumina price
forecasts. We now value the aluminium division at US$20.2b, of which
US$7.9b is the bauxite and alumina assets. On our forecasts, bauxite exports
will contribute around 10% of Rio’s earnings going forward.

15 June 2016
M&M - Diversified Resources
Bauxite and Alumina
Deutsche Bank AG/Sydney Page 9
Rio currently produces around 44Mtpa of bauxite from the Gove, Weipa, Boke
and MRN mines, of which 27Mtpa is sold to external parties (mostly China),
and the balance is consumed by Rio’s three large alumina refineries. The
recent approval of the US$1.9b, 22.8Mtpa Amrun bauxite project (previously
named South of Embley) near Weipa will lift Rio’s bauxite exports to 36Mtpa
from late 2019 onwards. Around half of Amrun’s 22.8Mtpa of bauxite will
offset depletion at the East Weipa deposit. Rio has designed Amrun to allow a
further expansion to 50Mtpa. The closure of the Gove alumina refinery in 2014
reduced Rio’s third party alumina market position from 2.1Mt to 0.8Mtpa.
Therefore our lower alumina price forecasts have only a minor impact on cash
flow and earnings.
Despite our downgrades, the restructuring of Rio’s aluminium continues to
improve free cash flow and returns. We continue to believe that Rio has a
global best-in-class aluminium portfolio with significant bauxite resources,
increasing third party sales, and low cost aluminium smelters which mostly
use low cost hydro power. There are three parts to the transformation strategy;
Part 1: Reducing costs (overheads, procurement) and capex (sustaining and
Kitimat growth), Part 2: Shedding high cost assets (Gove, Sebree etc), and Part
3: Heading upstream (increasing bauxite exports).
Rusal
UC Rusal’s backward-integrated business model (~80% in bauxites, ~100% in
alumina) implies that any changes to main input costs should be viewed along
with the corresponding impact on aluminum prices. While reduced bauxite
price forecasts for 2016-2020 bodes well for margins (all else being equal), the
ramp up of Dian-Dian project in Guinea gradually should drive the company’s
self-sufficiency in bauxites to 100% by 2020E.
Vedanta
As Vedanta’s bauxite and alumina production and usage is all captive/internal,
feeding its two aluminium smelters (Korba and Jharsuguda), there is no impact
on our forecasts from the changes in our bauxite and alumina assumptions.
Vedanta sources bauxite for its Lanjigarh alumina refinery from its own BALCO
mines and from domestic and international imports. In FY16, Vedanta sourced
its required 3.4Mt of bauxite from the three sources mentioned, split equally.
Lanjigarh is ramping up towards 2Mtpa capacity – extra bauxite will be sought
from a mix of own mines and third parties – and the company recently secured
approval to expand the refinery to 4Mt over time, although Vedanta is not
actively pursuing this option at present.

15 June 2016
M&M - Diversified Resources
Bauxite and Alumina
Page 10 Deutsche Bank AG/Sydney
Chinese Alumina market
Chinese alumina price driving seaborne alumina price
The seaborne alumina price rebounded from a low of US$197/t in early 2016 to
reach US$261/t in mid May. It has since softened to US$246/t. The Chinese
alumina price is mostly driven by i) the domestic aluminium price and
ii) refining capacity shuts and restarts, in our view. The domestic alumina price
is then driving the seaborne alumina price (Figures 12 and 13). The Chinese
aluminium price has rallied since late 2015 from a low of RMB9,800/t to
RMB12,700/t due to a sharp recovery in demand, combined with smelter
curtailments and a lag on smelter restarts. This has resulted in a lift in Chinese
domestic alumina pricing over the first few months of 2016, however pricing
has softened more recently.
Domestic alumina prices in the North (NAX Index) and South (SAX Index) have
rebounded with the NAX bouncing from a low of RMB1,596/t in early 2016 to
reach a peak of RMB2,010/t in mid May, and is currently trading at
RMB1,994/t. The implied linkage of Chinese alumina to aluminium is currently
around 17%, up from a low of 13% in late 2015. Smelters monitor the linkage
closely. The linkage is well down from the peak of 22% in late 2014, but there
is now more idled alumina capacity.
The rebound in the Chinese aluminium price has incentivized smelter restarts.
We understand that over 200kt of capacity has already resumed production.
Furthermore, we estimate that around 3.8Mt of new smelting capacity will be
brought on-line over the next two years with over 1Mt already being brought
on-line by the end of May. Our analysis shows that c. 85% of Chinese smelters
is now cash flow positive. As a result, the aluminium price has started to level
out with the northern Chinese domestic aluminium price sitting at around
RMB12,500/t.
Figure 12: Chinese alumina price (NAX and SAX) vs. the
Chinese aluminium price (RMB/t)
Figure 13: Chinese domestic (NAX and SAX unadjusted
in US$/t) and Australian (US$/t FOB) alumina price
0
5,000
10,000
15,000
20,000
1000
1500
2000
2500
3000
Jan-12 Jan-13 Jan-14 Jan-15 Jan-16
(RMB/t)(RMB/t)
Chinese - NAXChinese - SAXChinese domestic aluminium price - RHS
150
200
250
300
350
400
450
500
Jan-12 Jan-13 Jan-14 Jan-15 Jan-16
US$/t
Chinese (NAX) (USD/t) Chinese (SAX) (USD/t)
Seaborne (Australia)
Source: Deutsche Bank, Platts, CM Group, Platts. Note: NAX (Northern China), SAX (Southern China)
Source: Deutsche Bank, Platts, CM Group, Platts. Note: NAX (Northern China), SAX (Southern China)

15 June 2016
M&M - Diversified Resources
Bauxite and Alumina
Deutsche Bank AG/Sydney Page 11
Figure 14: Chinese alumina production and imports (Mt)
Figure 15: Chinese aluminium production and net
exports (Mt)
5358 62 65 67 69 71 73 75
0.0
1.0
2.0
3.0
4.0
5.0
6.0
0.0
20.0
40.0
60.0
80.0
100.0 (Mt)(Mt)
Alumina productionNet alumina imports/(exports) - RHS
2831 32 34 35 36 37 38 38
-3.0
-2.5
-2.0
-1.5
-1.0
-0.5
0.0
0.0
10.0
20.0
30.0
40.0
50.0 (Mt)(Mt)
Aluminium productionNet aluminium imports/(exports) - RHS
Source: Deutsche Bank, Bloomberg Finance LP, CM Group, Platts
Source: Deutsche Bank, Bloomberg Finance LP, CM Group, Platts
The seaborne alumina price is currently trading at a slight premium to the
Chinese alumina price after adjusting for VAT (17.5%), shipping, port and
inland freight (US$12-13/t combined) and quality differential (US$1-2/t).
Chinese imports of alumina are sensitive to this price arbitrage, even on a
monthly basis. China (likely traders rather than smelters) has even exported
small quantities of alumina in times when the seaborne price is more
expensive than the domestic price.
We think that the equilibrium alumina price in China is currently around
RMB1,900/t. This is around the 80th percentile on the all-in cost curve and
equates to a seaborne price of around US$245-250/t. When the alumina price
climbed above RMB1,900/t during 1Q16, higher cost refineries began
restarting. Below this level, capacity is likely to be curtailed.
Figure 16: Chinese alumina as a % of the aluminium
price (linkage)
Figure 17: Australian vs. the Chinese domestic alumina
price after VAT and freight adjustments
12%
14%
16%
18%
20%
22%
24%
150
200
250
300
350
400
450
500 US$/t Chinese (NAX) adjusted
Seaborne (Australia)
Source: Deutsche Bank, Bloomberg Finance LP, CM Group, Platts
Source: Deutsche Bank, Bloomberg Finance LP, CM Group, Platts

15 June 2016
M&M - Diversified Resources
Bauxite and Alumina
Page 12 Deutsche Bank AG/Sydney
Chinese Supply/Demand
We expect Chinese aluminium production to increase by around 6% to 32.3Mt
in 2016. By 2020 we expect Chinese aluminium production to increase to
36.7Mt but think there is upside risk to this estimate based on proposed
capacity additions. Over the medium term we expect China to continue to
export over 2Mt of aluminum per annum (mostly in the form of semis).
China produced 57.7Mt of alumina in 2015, a 10% increase on 2014. Based on
new capacity build and restarts we expect a 7% increase in production in 2016
to 61.5Mt and then a further 6% growth to 65Mt in 2017. A significant amount
of new build is currently underway and many new large refineries are in the
planning and approval stage. We forecast production to increase by 3-6% per
annum (or 2.0-3.5Mtpa) until at least 2022. Alumina imports fell in 2015 due to
high smelter stocks at the end of 2014 and sluggish aluminium demand.
Looking at the alumina market balance, we expect a tighter market in 2016,
mainly due to timing and ramp-up of refinery restarts. From 2017 onwards,
new lower cost refining capacity additions should keep pace with smelter
additions, with alumina imports the balancing item. As a result, we forecast
flat imports of around 3-4Mt for the next few years but then a drop in imports
to 3Mt in 2021 as refining additions outpace new smelting capacity. Longer
term, the level of imports will depend on the price arbitrage between the
seaborne price and Chinese domestic price.
Figure 18: Chinese Alumina Supply Demand balance
2014 2015 2016E 2017E 2018E 2019E 2020E 2021E 2022E
Aluminium
Aluminium production (kt) 27,600 30,500 32,323 33,668 34,654 35,716 36,688 37,586 38,223
Net aluminium imports/(exports)
(kt) -755 -2,525 -2,412 -2,284 -1,898 -1,584 -1,192 -847 -382
Aluminium consumption (kt) 26,845 27,975 29,912 31,384 32,756 34,131 35,497 36,739 37,841
Production (% change) 11% 11% 6% 4% 3% 3% 3% 2% 2%
Alumina
Chinese demand (kt) 55,752 61,610 65,293 68,010 70,001 72,146 74,111 75,924 77,211
Chinese production (kt) 52,680 57,690 61,500 65,000 66,950 68,959 71,027 73,158 75,353
Production (% change) 7% 10% 7% 6% 3% 3% 3% 3% 3%
Alumina imports (kt) 5,075 4,654 4,240 3,000 3,000 3,500 3,500 3,000 3,000
Alumina exports (kt) 118 310 172 200 200 200 200 200 200
Alumina consumption (kt) 57,637 62,033 65,568 67,800 69,750 72,259 74,327 75,958 78,153
Market balance (kt) 1,885 423 275 -210 -251 113 217 34 942
Source: Deutsche Bank, Aladdiny, CM Group, Wood Mackenzie

15 June 2016
M&M - Diversified Resources
Bauxite and Alumina
Deutsche Bank AG/Sydney Page 13
Figure 19: Chinese alumina S&D balance and seaborne price forecasts
327
299
236245
260270
280290
317
0
100
200
300
400
-1,000
0
1,000
2,000
3,000
2014 2015 2016E 2017E 2018E 2019E 2020E 2021E 2022E
Chinese alumina market balance Seaborne alumina price
Source: Deutsche Bank, Aladdiny, CM Group, Wood Mackenzie
Refinery restarts accelerating
Since 2014 there have been almost 19Mt of refining capacity curtailments.
This has mostly occurred in Shandong, Henan and Shanxi provinces where
refineries are more reliant on imported bauxite. The average utilization rate of
the Chinese alumina fleet was around 75% in early 2016. This has since
increased as refineries have restarted with the recovery in the alumina price.
Figure 20: Chinese refining production and idled capacity in late 2015
16.3
9.7
15.2
3.8
7.5
2.3
54.8
7.0
4.0
4.4
0.9
0.42.3
18.9
0
10
20
30
40
50
60
70
80
Shandong Henan Shanxi Guizhou Guangxi Other Total
Mtpa
Operating Idle
Source: Deutsche Bank, Aladdiny, CM Group
We estimate that 9.8Mtpa of the 18.9Mt of curtailed refining capacity was
actually closed during 4Q15 as the price declined to a low of RMB1,596/t. The
largest refineries that were shut during 4Q15 are those owned by Chalco and
Xinfa in Shandong, Shanxi and Henan provinces which rely on imported
bauxite and are non-integrated.
15 June 2016
M&M - Diversified Resources
Bauxite and Alumina
Page 14 Deutsche Bank AG/Sydney
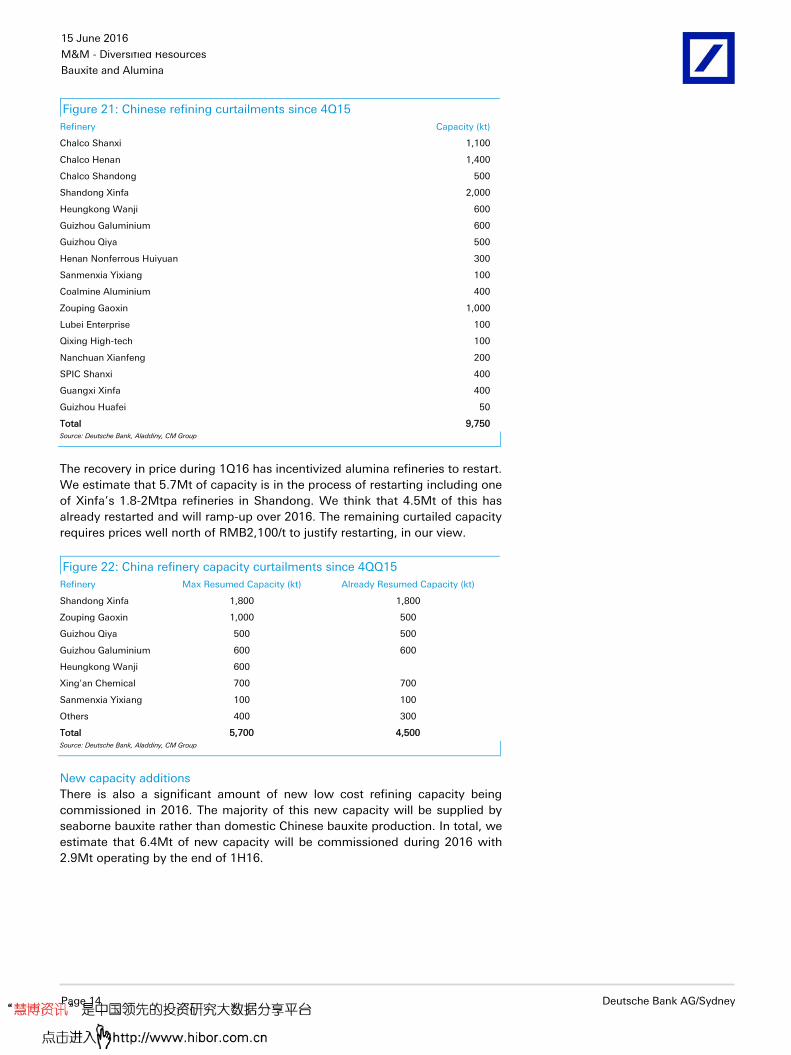
Figure 21: Chinese refining curtailments since 4Q15
Refinery Capacity (kt)
Chalco Shanxi 1,100
Chalco Henan 1,400
Chalco Shandong 500
Shandong Xinfa 2,000
Heungkong Wanji 600
Guizhou Galuminium 600
Guizhou Qiya 500
Henan Nonferrous Huiyuan 300
Sanmenxia Yixiang 100
Coalmine Aluminium 400
Zouping Gaoxin 1,000
Lubei Enterprise 100
Qixing High-tech 100
Nanchuan Xianfeng 200
SPIC Shanxi 400
Guangxi Xinfa 400
Guizhou Huafei 50
Total 9,750 Source: Deutsche Bank, Aladdiny, CM Group
The recovery in price during 1Q16 has incentivized alumina refineries to restart.
We estimate that 5.7Mt of capacity is in the process of restarting including one
of Xinfa’s 1.8-2Mtpa refineries in Shandong. We think that 4.5Mt of this has
already restarted and will ramp-up over 2016. The remaining curtailed capacity
requires prices well north of RMB2,100/t to justify restarting, in our view.
Figure 22: China refinery capacity curtailments since 4QQ15
Refinery Max Resumed Capacity (kt) Already Resumed Capacity (kt)
Shandong Xinfa 1,800 1,800
Zouping Gaoxin 1,000 500
Guizhou Qiya 500 500
Guizhou Galuminium 600 600
Heungkong Wanji 600
Xing'an Chemical 700 700
Sanmenxia Yixiang 100 100
Others 400 300
Total 5,700 4,500
Source: Deutsche Bank, Aladdiny, CM Group
New capacity additions
There is also a significant amount of new low cost refining capacity being
commissioned in 2016. The majority of this new capacity will be supplied by
seaborne bauxite rather than domestic Chinese bauxite production. In total, we
estimate that 6.4Mt of new capacity will be commissioned during 2016 with
2.9Mt operating by the end of 1H16.

15 June 2016
M&M - Diversified Resources
Bauxite and Alumina
Deutsche Bank AG/Sydney Page 15
Figure 23: Chinese refining capacity additions in 2016
Refinery New Capacity (kt) Comment Operational Capacity H1 (kt)
Shanxi Fusheng 800 Process slow, pipes and equipment settled, likely to operate in H2 when the market recovers
Shanxi Huaxing 1,000 Running smoothly, anticipate a trial run in Q2 1,000
Jinzhong Chemical 1,600 Plan to start in end April, phase II operate in Q4 800
Xinfa Chemical 200 Technology innovation, may complete in the middle of the year
200
Xinghua Technology 350 Equipment based on Phase I, product type and the market restricted operation, anticipate the preliminary start in the middle of the year
Senze Coal and Aluminium 700 Trial run in May, fully operation in Q3 according to the market
Zouping Gaoxin 500 Involve many projects, partial capacities converted to 2015, the other calculated into 2016
500
Yunnan Wenshan 1,000 Increased by 200ktpa from technology innovation 2015, Phase III of 800 ktpa plan to complete end 2016, with uncertainties
200
Guangxi Huayin 200 200 ktpa from technology innovation 200
Total 6,350 2,900
Source: Deutsche Bank, Aladdiny, CM Group
The majority of new refining capacity in China is still being added in the central
provinces (Shanxi, Shaanxi, Henan provinces) and Shandong (see Figure 23).
Close to 5Mtpa of new capacity could come on-line in 2018 alone. There are
also numerous new “super sized” 4Mtpa refineries being proposed. The first is
Chalco and Shenhua’s recent JV announcement to study a new 4Mtpa refinery
on the coast in Hebei. If approved, first production from the new refinery is
likely in 2018. The refinery would likely consume up to 8-10Mtpa of seaborne
bauxite (ratio of 2.6-2.7:1) through Huanghua Port and the alumina produced
will likely be sold to central and western China, such as Inner Mongolia and
Xinjiang. The second is Hunan-based Zengshi Group’s plans to build a 4Mtpa
alumina project. The project is to include a 1Mtpa primary aluminium smelter
and an associated thermal power plant.
There is also one large scale coastal alumina capacity expansion currently
taking place by Xinfa in Shandong. Production is expected to reach 4Mtpa in
2017 and 5Mtpa by 2020. This is a low and high temperature Bayer process
refinery, with c. 50% of capacity operating at high temperature. Hongqiao also
plans to expand one of their Shandong refineries by 2Mtpa. The Eastern coast
(Shandong) refineries are expected to remain reliant on low temperature
imported bauxite and are not configured to process higher temperature
domestic bauxite. There are seven large alumina refineries which use imported
bauxite for production, which we estimate have a total capacity of around
20Mtpa.
Reviewing the major Chinese alumina producers, Hongqiao, Xinfa and Chalco
remain the largest producers (Figure 25).

15 June 2016
M&M - Diversified Resources
Bauxite and Alumina
Page 16 Deutsche Bank AG/Sydney
Figure 24: Chinese alumina capacity growth (by region). Figure 25: Major Chinese alumina producers (2016 data)
0.0
1.0
2.0
3.0
4.0
5.0
6.0
7.0
2015E 2016E 2017E 2018E
(Mt)
Central China Eastern China
Western China Southern China
16.4
12.6
9.6
4.8
0.0
2.0
4.0
6.0
8.0
10.0
12.0
14.0
16.0
18.0
Chalco Xinfa Hongqiao Jingjiang Group
Source: Deutsche Bank, Chinese NBS data
Source: Deutsche Bank, Wood Mackenzie
The Chinese cost curve
The Chinese domestic cost curve continues to fall with the addition of new
larger, low-cost more efficient refining capacity. Industry experts suggest that
average all-in costs (50th percentile) have fallen 13% YoY from RMB2,236/t in
2015 to RMB1,954/t in 2016. This includes sustaining capex, VAT and
financing costs. In seaborne alumina terms, this translates to a fall from
US$289/t to US$253/t when adjusting for VAT. Our all-in Chinese cost curve
(shown in Figure 26) based on just C1 costs + sustaining capex shows a lower
average cost, with the RMB1,950/t level representing the 80th percentile,
however on the ground evidence shows that a price of around RMB1,900/t is
the trigger point for restarts. The highest cost refineries are in Shandong and
Henan and the lowest cost refineries are located in the south in Guizhou and
Guangxi provinces. During early 1Q16 we estimate that over 50% of Chinese
refineries were unprofitable.
With the recent drop in energy and bauxite costs in China and the level of
integration increasing, we expect the equilibrium price to continue to move
lower in 2017. The seaborne alumina price should continue to be priced
around the Chinese domestic alumina equilibrium price. At prices below
US$240-250/t (FOB ex Australia) we think higher cost refineries will curtail
production and above this level we think refineries will restart.
The majority of new greenfield and brownfield refineries are integrated with
smelter and power plants and hence are lowering the Chinese cost curve
further. Over the long run we expect costs to move higher in RMB terms as
labour and power costs rise and as refineries become more reliant on imported
bauxite. However we only see this pressure occurring early next decade; we
expect imported bauxite to exceed domestic production from 2020.

15 June 2016
M&M - Diversified Resources
Bauxite and Alumina
Deutsche Bank AG/Sydney Page 17
Figure 26: Chinese 2016 domestic all-in alumina cost curve (RMB/t)
Weiq
iao
(W
eiq
iao
gro
up
)
Xin
fa H
ua
yu
(X
infa
)
Xia
oyi (H
an
gzh
ou
-Jin
jian
g)
Lu
ne
ng J
inb
ei (C
hin
a p
ow
er)
Pin
ggu
o (
Ch
alc
o)
Jia
oko
u (
Xin
fa)
Zh
on
gzh
ou
(C
ha
lco
)
Sh
an
do
ng (
Ch
alc
o)
Jin
gxi (X
infa
)
Gu
ixi H
ua
yin
(G
ua
ngxi
Inv.
/Cha
lco/M
inm
eta
ls)
Sh
an
xi (C
ha
lco)
Ka
ima
n (
Ha
ngzh
ou
-Jin
jian
g)
Sh
an
xi X
iao
yi (X
infa
)
Nan
sh
an
(N
an
sh
an
gro
up
)
Ea
st H
op
e (
Sa
nm
en
xia
)
50th percentile (RMB1,693/t)
90th percentile (RMB2,054/t)
0
500
1,000
1,500
2,000
2,500
3,000
3,500
4,000
0 10,000 20,000 30,000 40,000 50,000 60,000
All-
in c
osts
(R
MB
/t)
Cumulative production (kt)
DB Chinese Domestic All-in Alumina Cost Curve 2016 (RMB/t)
DBe restart level
(RMB1,900/t)
Source: Deutsche Bank, Wood Mackenzie, CM Group
Figure 27: Chinese 2016 domestic all-in alumina cost curve (US$/t)
Weiq
iao
(W
eiq
iao
gro
up
)
Xin
fa H
ua
yu
(X
infa
)
Xia
oyi (H
an
gzh
ou
-Jin
jian
g)
Lu
ne
ng J
inb
ei (C
hin
a p
ow
er)
Pin
ggu
o (
Ch
alc
o)
Sa
nm
en
xia
(E
ast h
op
e g
rou
p)
Jia
oko
u (
Xin
fa)
Zh
on
gzh
ou
(C
ha
lco
)
Sh
an
do
ng (
Ch
alc
o)
Jin
gxi (X
infa
)
Gu
ixi H
ua
yin
(G
ua
ngxi
Inv.
/Ch
alc
o/M
inm
eta
ls)
Sh
an
xi (C
ha
lco
)
Ka
ima
n (
Ha
ngzh
ou
-Jin
jian
g)
Sh
an
xi X
iao
yi (X
infa
)
Na
nsh
an
(N
an
sh
an
gro
up
)
50th percentile(US$269/t)
90th percentile (US$327/t)
0
100
200
300
400
500
600
0 10,000 20,000 30,000 40,000 50,000 60,000
All-
in c
osts
(U
S$
/t)
Cumulative production (kt)
DB Chinese Domestic All-in Alumina Cost Curve 2016 (US$/t)
Source: Deutsche Bank, Wood Mackenzie, CM Group
15 June 2016
M&M - Diversified Resources
Bauxite and Alumina
Page 18 Deutsche Bank AG/Sydney
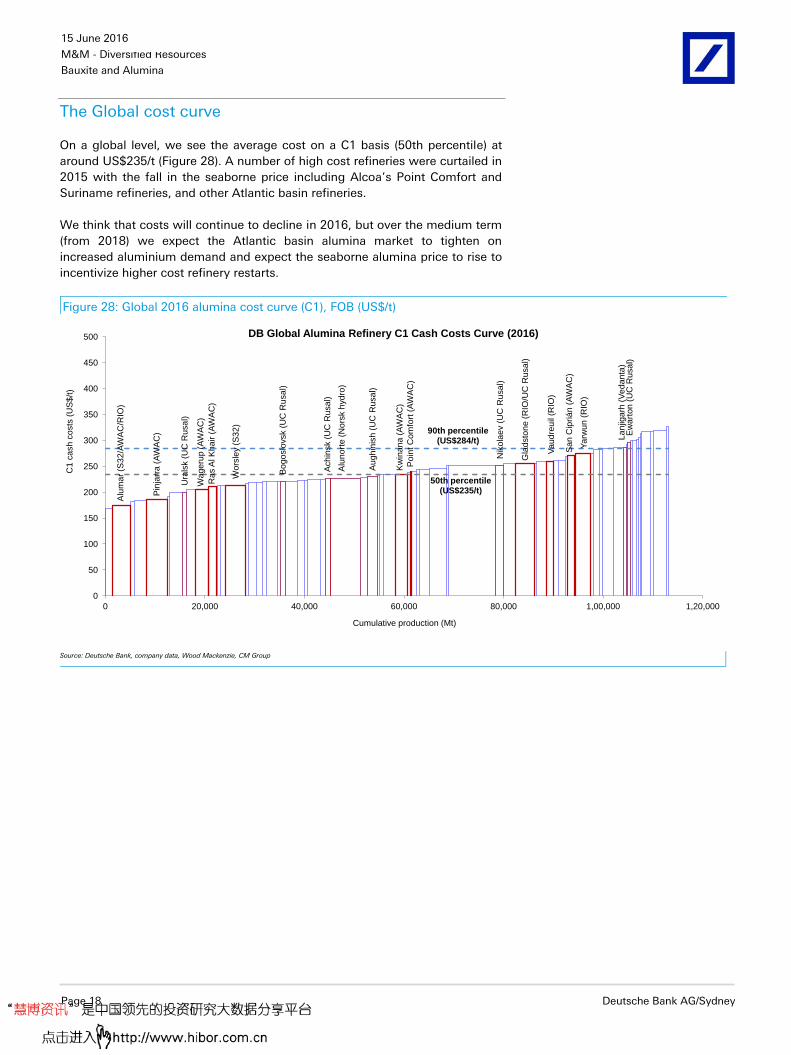
The Global cost curve
On a global level, we see the average cost on a C1 basis (50th percentile) at
around US$235/t (Figure 28). A number of high cost refineries were curtailed in
2015 with the fall in the seaborne price including Alcoa’s Point Comfort and
Suriname refineries, and other Atlantic basin refineries.
We think that costs will continue to decline in 2016, but over the medium term
(from 2018) we expect the Atlantic basin alumina market to tighten on
increased aluminium demand and expect the seaborne alumina price to rise to
incentivize higher cost refinery restarts.
Figure 28: Global 2016 alumina cost curve (C1), FOB (US$/t)
Alu
ma
r (S
32
/AW
AC
/RIO
)
Pin
jarr
a (
AW
AC
)
Wageru
p (
AW
AC
)
Ras A
l K
ha
ir (
AW
AC
)
Wors
ley (
S3
2)
Kw
ina
na
(A
WA
C)
Po
int C
om
fort
(A
WA
C)
Gla
dsto
ne
(R
IO/U
C R
usa
l)
Va
ud
reu
il (R
IO)
Sa
n C
ipriá
n (
AW
AC
)
Ya
rwu
n (
RIO
)
Ach
insk (
UC
Rusa
l)
Alu
no
rte (
No
rsk h
yd
ro)
Bo
go
slo
vsk (
UC
Rusa
l)
Ura
lsk (
UC
Rusa
l)
Ew
art
on
(U
C R
usa
l)
Nik
ola
ev (
UC
Ru
sa
l)
Au
gh
inis
h (
UC
Rusa
l)
La
njig
arh
(V
ed
an
ta)
50th percentile (US$235/t)
90th percentile (US$284/t)
0
50
100
150
200
250
300
350
400
450
500
0 20,000 40,000 60,000 80,000 1,00,000 1,20,000
C1 c
ash
co
sts
(U
S$
/t)
Cumulative production (Mt)
DB Global Alumina Refinery C1 Cash Costs Curve (2016)
Source: Deutsche Bank, company data, Wood Mackenzie, CM Group
15 June 2016
M&M - Diversified Resources
Bauxite and Alumina
Deutsche Bank AG/Sydney Page 19
Seaborne Bauxite market
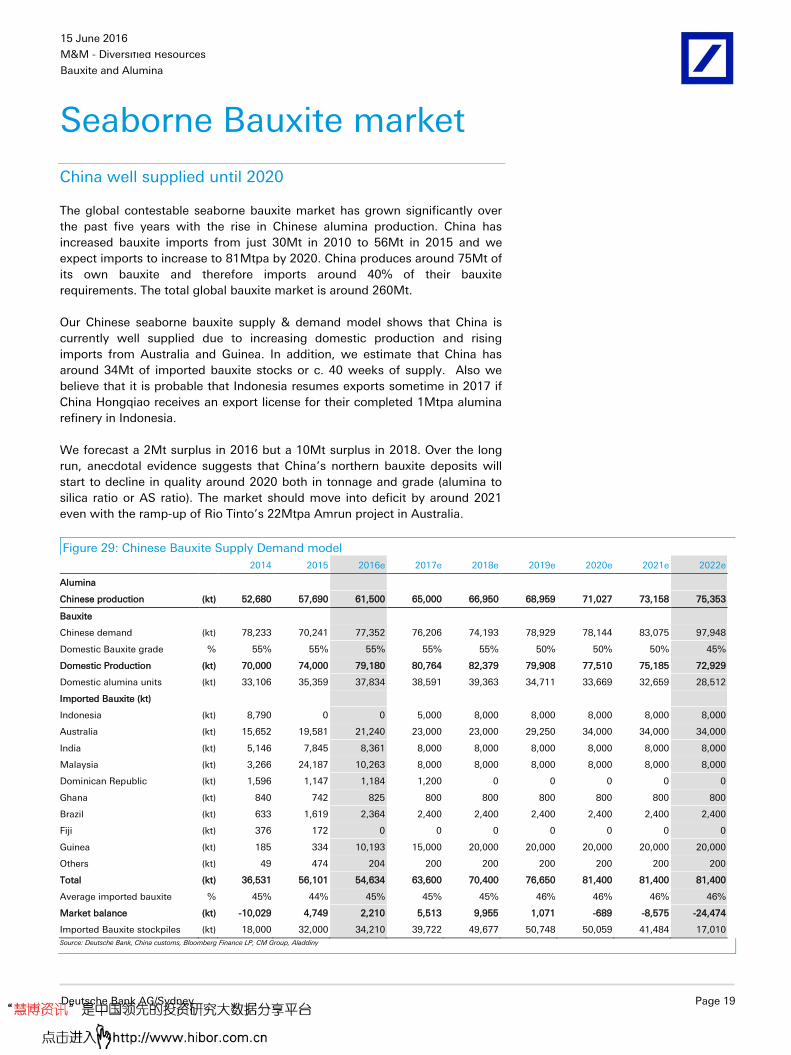
China well supplied until 2020
The global contestable seaborne bauxite market has grown significantly over
the past five years with the rise in Chinese alumina production. China has
increased bauxite imports from just 30Mt in 2010 to 56Mt in 2015 and we
expect imports to increase to 81Mtpa by 2020. China produces around 75Mt of
its own bauxite and therefore imports around 40% of their bauxite
requirements. The total global bauxite market is around 260Mt.
Our Chinese seaborne bauxite supply & demand model shows that China is
currently well supplied due to increasing domestic production and rising
imports from Australia and Guinea. In addition, we estimate that China has
around 34Mt of imported bauxite stocks or c. 40 weeks of supply. Also we
believe that it is probable that Indonesia resumes exports sometime in 2017 if
China Hongqiao receives an export license for their completed 1Mtpa alumina
refinery in Indonesia.
We forecast a 2Mt surplus in 2016 but a 10Mt surplus in 2018. Over the long
run, anecdotal evidence suggests that China’s northern bauxite deposits will
start to decline in quality around 2020 both in tonnage and grade (alumina to
silica ratio or AS ratio). The market should move into deficit by around 2021
even with the ramp-up of Rio Tinto’s 22Mtpa Amrun project in Australia.
Figure 29: Chinese Bauxite Supply Demand model
2014 2015 2016e 2017e 2018e 2019e 2020e 2021e 2022e
Alumina
Chinese production (kt) 52,680 57,690 61,500 65,000 66,950 68,959 71,027 73,158 75,353
Bauxite
Chinese demand (kt) 78,233 70,241 77,352 76,206 74,193 78,929 78,144 83,075 97,948
Domestic Bauxite grade % 55% 55% 55% 55% 55% 50% 50% 50% 45%
Domestic Production (kt) 70,000 74,000 79,180 80,764 82,379 79,908 77,510 75,185 72,929
Domestic alumina units (kt) 33,106 35,359 37,834 38,591 39,363 34,711 33,669 32,659 28,512
Imported Bauxite (kt)
Indonesia (kt) 8,790 0 0 5,000 8,000 8,000 8,000 8,000 8,000
Australia (kt) 15,652 19,581 21,240 23,000 23,000 29,250 34,000 34,000 34,000
India (kt) 5,146 7,845 8,361 8,000 8,000 8,000 8,000 8,000 8,000
Malaysia (kt) 3,266 24,187 10,263 8,000 8,000 8,000 8,000 8,000 8,000
Dominican Republic (kt) 1,596 1,147 1,184 1,200 0 0 0 0 0
Ghana (kt) 840 742 825 800 800 800 800 800 800
Brazil (kt) 633 1,619 2,364 2,400 2,400 2,400 2,400 2,400 2,400
Fiji (kt) 376 172 0 0 0 0 0 0 0
Guinea (kt) 185 334 10,193 15,000 20,000 20,000 20,000 20,000 20,000
Others (kt) 49 474 204 200 200 200 200 200 200
Total (kt) 36,531 56,101 54,634 63,600 70,400 76,650 81,400 81,400 81,400
Average imported bauxite % 45% 44% 45% 45% 45% 46% 46% 46% 46%
Market balance (kt) -10,029 4,749 2,210 5,513 9,955 1,071 -689 -8,575 -24,474
Imported Bauxite stockpiles (kt) 18,000 32,000 34,210 39,722 49,677 50,748 50,059 41,484 17,010
Source: Deutsche Bank, China customs, Bloomberg Finance LP, CM Group, Aladdiny
15 June 2016
M&M - Diversified Resources
Bauxite and Alumina
Page 20 Deutsche Bank AG/Sydney
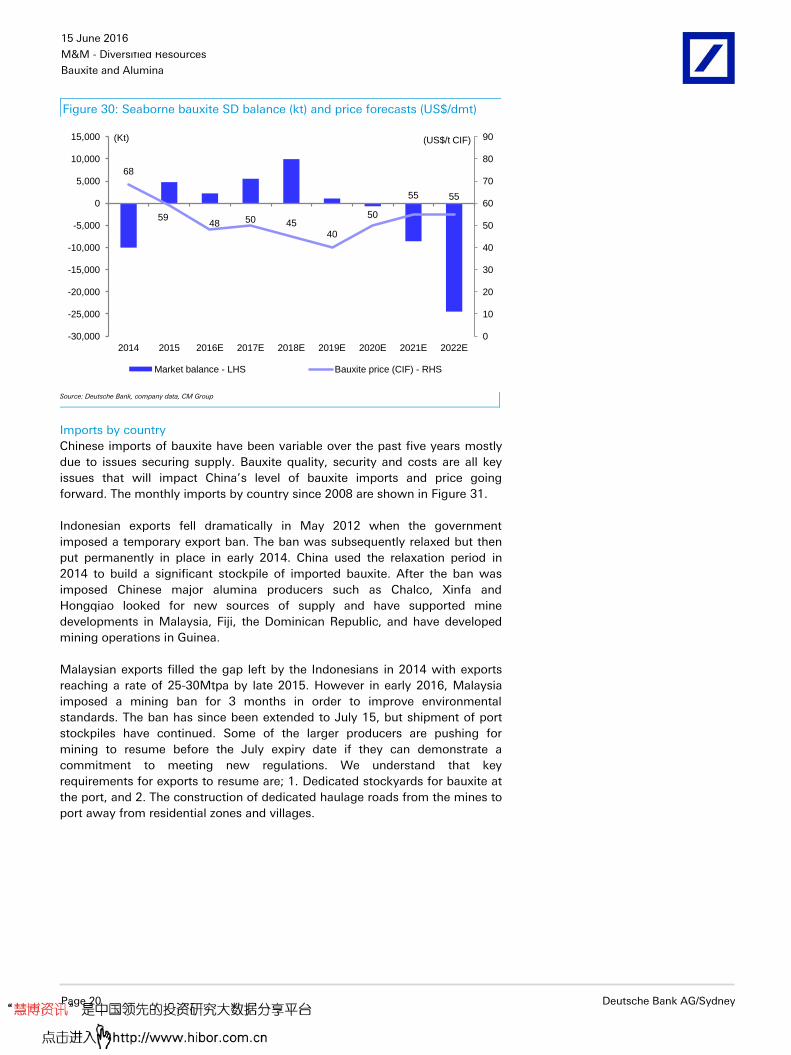
Figure 30: Seaborne bauxite SD balance (kt) and price forecasts (US$/dmt)
(Kt) (US$/t CIF)
68
5948 50 45
40
50
55 55
0
10
20
30
40
50
60
70
80
90
-30,000
-25,000
-20,000
-15,000
-10,000
-5,000
0
5,000
10,000
15,000
2014 2015 2016E 2017E 2018E 2019E 2020E 2021E 2022E
Market balance - LHS Bauxite price (CIF) - RHS
Source: Deutsche Bank, company data, CM Group
Imports by country
Chinese imports of bauxite have been variable over the past five years mostly
due to issues securing supply. Bauxite quality, security and costs are all key
issues that will impact China’s level of bauxite imports and price going
forward. The monthly imports by country since 2008 are shown in Figure 31.
Indonesian exports fell dramatically in May 2012 when the government
imposed a temporary export ban. The ban was subsequently relaxed but then
put permanently in place in early 2014. China used the relaxation period in
2014 to build a significant stockpile of imported bauxite. After the ban was
imposed Chinese major alumina producers such as Chalco, Xinfa and
Hongqiao looked for new sources of supply and have supported mine
developments in Malaysia, Fiji, the Dominican Republic, and have developed
mining operations in Guinea.
Malaysian exports filled the gap left by the Indonesians in 2014 with exports
reaching a rate of 25-30Mtpa by late 2015. However in early 2016, Malaysia
imposed a mining ban for 3 months in order to improve environmental
standards. The ban has since been extended to July 15, but shipment of port
stockpiles have continued. Some of the larger producers are pushing for
mining to resume before the July expiry date if they can demonstrate a
commitment to meeting new regulations. We understand that key
requirements for exports to resume are; 1. Dedicated stockyards for bauxite at
the port, and 2. The construction of dedicated haulage roads from the mines to
port away from residential zones and villages.

15 June 2016
M&M - Diversified Resources
Bauxite and Alumina
Deutsche Bank AG/Sydney Page 21
Figure 31: Chinese monthly bauxite imports (by country)
0
1,000
2,000
3,000
4,000
5,000
6,000
7,000
8,000
9,000
Jan-
08
May
-08
Sep
-08
Jan-
09
May
-09
Sep
-09
Jan-
10
May
-10
Sep
-10
Jan-
11
May
-11
Sep
-11
Jan-
12
May
-12
Sep
-12
Jan-
13
May
-13
Sep
-13
Jan-
14
May
-14
Sep
-14
Jan-
15
May
-15
Sep
-15
Jan-
16
(kt)
Indonesia Australia India Malaysia Dominican Republic Ghana Brazil Fiji Guinea Others
Source: Deutsche Bank
Our key base case assumptions for bauxite exports by country are as follows;
Australia: exports to China increased from 15.6Mt to 2014 to 19.6Mt
in 2015 with the ramp-up of Rio’s Gove mine and increased
productivity at Weipa. Exports should increase to 34Mtpa by 2020
with the ramp-up of Rio’s 22Mtpa Amrun mine south of Weipa.
Roughly half of Amrun is replacing depletion at the East Weipa
deposit. Amrun has the potential to be expanded to 50Mtpa and
therefore can fill the deficit from 2020 onwards.
Malaysia: we expect the current mining ban to be lifted in the next 3-6
months and for exports to remain steady at around 8-10Mtpa.
However there might be upside risk to this number (recall exports
reached 25-30Mtpa in 2015). There is about 3.7Mt of bauxite inventory
in Kuantan including that at Kuantan Port, which is subject to many
export restrictions.
Guinea: Hongqiao completed the construction of its Guinean bauxite
project in October 2015. The company is currently loading 2-3 cape
size vessels per week and is targeting exports of 15Mt in 2016 and
30Mt in 2017. Rio Tinto and Alcoa are also looking at increasing
exports to third parties after the closure of the Point Comfort refinery.
Rusal is also seeking to develop a 6Mtpa export bauxite mine with the
first shipment targeted for 2018. We model peak exports of 20Mtpa
but believe Guinean exports have the potential to exceed 30Mtpa.
India: exports have been steadily increasing over the past few years.
We assume 8Mtpa of exports from 2017 onwards.
Indonesia: we are taking the conservative line and assume that
Indonesia resumes exports sometime in 2017 with China Hongqiao
possibly gaining an export license for their completed 1Mtpa alumina
refinery.

15 June 2016
M&M - Diversified Resources
Bauxite and Alumina
Page 22 Deutsche Bank AG/Sydney
The seaborne bauxite price
The bauxite market is largely a producer-to-customer market with varying
terms for both volume and price. For example, we believe that Rio Tinto sells
the majority of its third party bauxite to China via contracts with three years
duration on volume and three months to one year on price. Over the past three
years, Rio Tinto’s realised third party bauxite price has been steady at
US$47/wmt.
In China though, over 50% of domestic bauxite is traded on the spot or third-
party market. The seaborne spot market is still in the early stages of formation.
CM Group developed a “Bauxite Index” several years ago and this Index is
starting to gain traction. Their Value-In-Use (VIU) Index price shows that
seaborne bauxite is still priced mostly on a linkage basis to alumina on a 3-6
month lag.
The CM Group “Bauxite Index” price (VIU adjusted basis) rallied in 2014,
increasing by c. 50% to US$75/t CIF due to the impact of the Indonesian ban.
The price then fell as Malaysian exports began and has since dropped to
US$46/t. We expect the bauxite price to stay under pressure over the next few
years as the market moves into oversupply based on our forecasts.
We expect the market to tighten around 2020, unless additional projects come
to market. This is a highly probable outcome as numerous companies, such as
Alcoa and Rio Tinto have mentioned exporting to third parties out of Guinea
and Brazil, to provide just one example. Over the long run, we see the marginal
producer being the Atlantic basin exporters such as Ghana and Guinea. This is
mostly based on our view of increasing freight rates with a recovering oil price.
Our long run price of US$50/dmt is set at our estimate for long run delivered
cost from Guinea to China.
Figure 32: Seaborne bauxite price (US$/t CFR, VIU adjusted, delivered to
China)
40.0
45.0
50.0
55.0
60.0
65.0
70.0
75.0
80.0
Jun-12 Oct-12 Feb-13 Jun-13 Oct-13 Feb-14 Jun-14 Oct-14 Feb-15 Jun-15 Oct-15 Feb-16
US
D/d
mt
– 1st Indonesian export ban introduced
– 1st ban lifted
– 2nd Indonesian export ban introduced - prices rise quickly
– Malaysian bauxite emerged....export volumes soared, prices collapsed
– More washed Malaysian bauxite - more higher-prices ROW cargoes
– Low Aa price and ramped-up Bx stock let to a market strongly in favour of buyers
Source: Deutsche Bank, CM Group
15 June 2016
M&M - Diversified Resources
Bauxite and Alumina
Deutsche Bank AG/Sydney Page 23
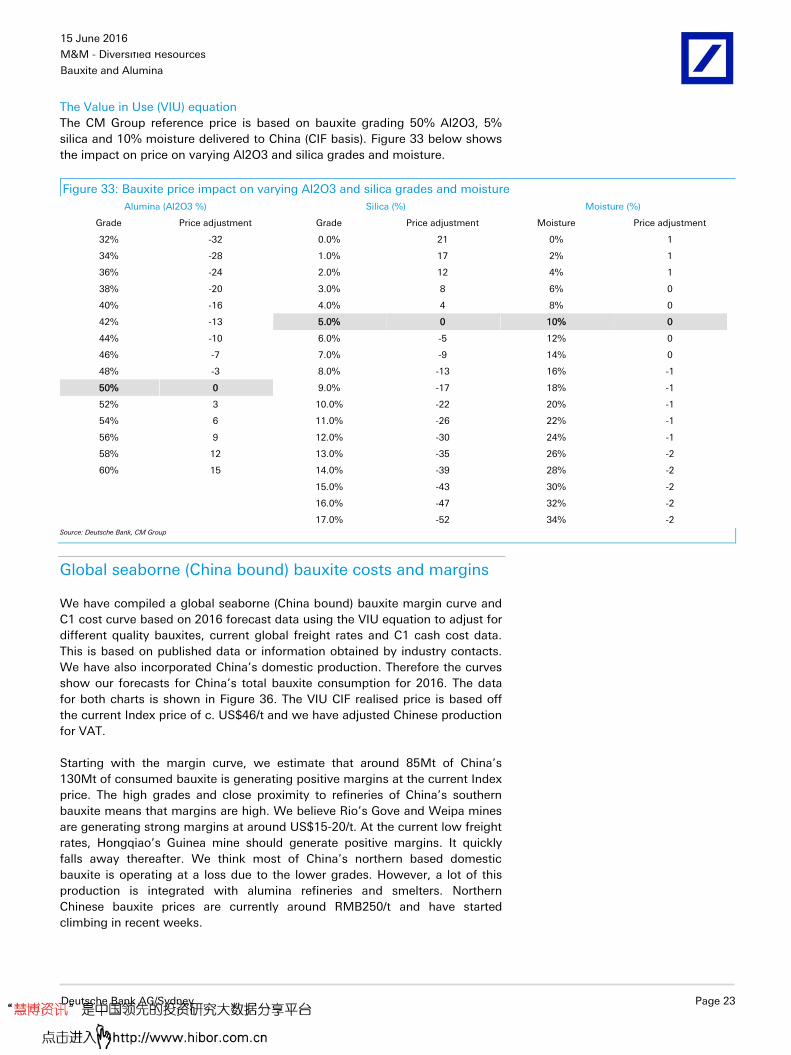
The Value in Use (VIU) equation
The CM Group reference price is based on bauxite grading 50% Al2O3, 5%
silica and 10% moisture delivered to China (CIF basis). Figure 33 below shows
the impact on price on varying Al2O3 and silica grades and moisture.
Figure 33: Bauxite price impact on varying Al2O3 and silica grades and moisture
Alumina (Al2O3 %) Silica (%) Moisture (%)
Grade Price adjustment Grade Price adjustment Moisture Price adjustment
32% -32 0.0% 21 0% 1
34% -28 1.0% 17 2% 1
36% -24 2.0% 12 4% 1
38% -20 3.0% 8 6% 0
40% -16 4.0% 4 8% 0
42% -13 5.0% 0 10% 0
44% -10 6.0% -5 12% 0
46% -7 7.0% -9 14% 0
48% -3 8.0% -13 16% -1
50% 0 9.0% -17 18% -1
52% 3 10.0% -22 20% -1
54% 6 11.0% -26 22% -1
56% 9 12.0% -30 24% -1
58% 12 13.0% -35 26% -2
60% 15 14.0% -39 28% -2
15.0% -43 30% -2
16.0% -47 32% -2
17.0% -52 34% -2
Source: Deutsche Bank, CM Group
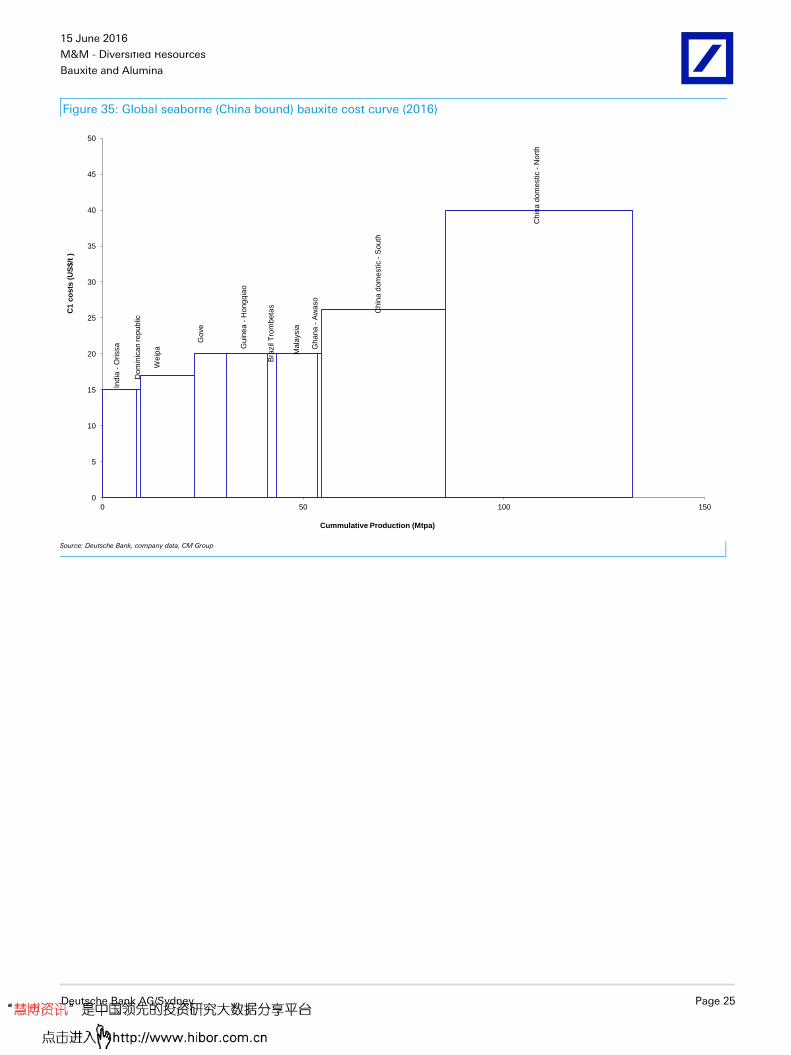
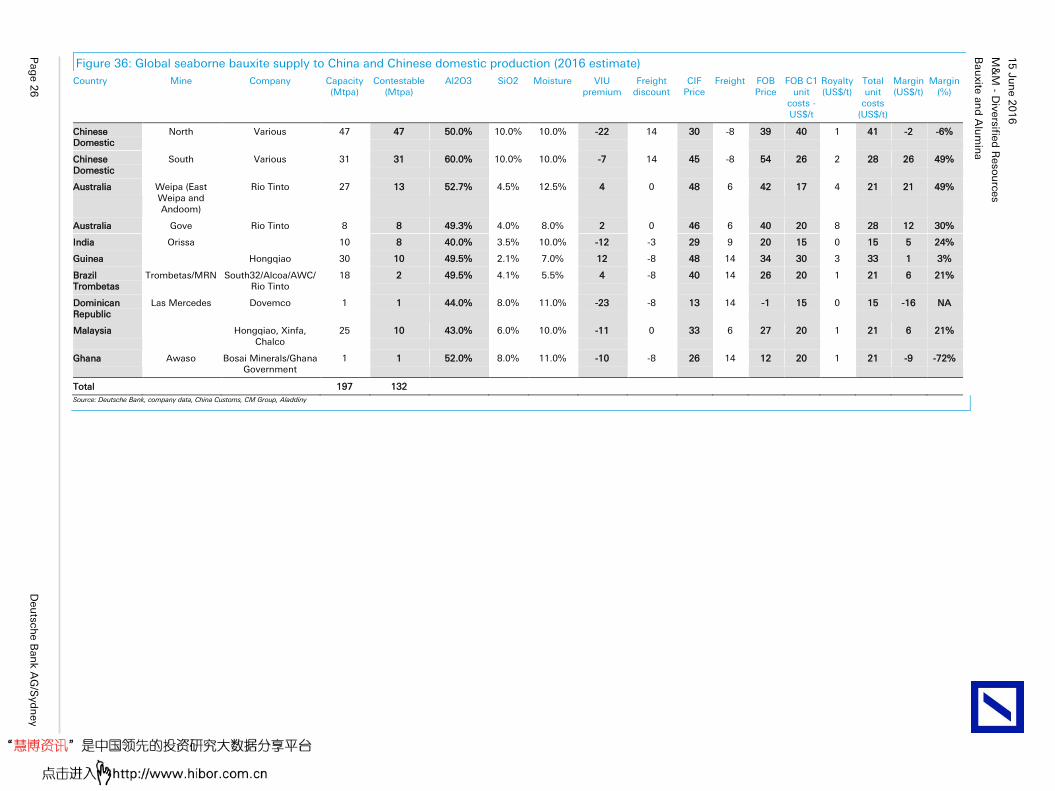
Global seaborne (China bound) bauxite costs and margins
We have compiled a global seaborne (China bound) bauxite margin curve and
C1 cost curve based on 2016 forecast data using the VIU equation to adjust for
different quality bauxites, current global freight rates and C1 cash cost data.
This is based on published data or information obtained by industry contacts.
We have also incorporated China’s domestic production. Therefore the curves
show our forecasts for China’s total bauxite consumption for 2016. The data
for both charts is shown in Figure 36. The VIU CIF realised price is based off
the current Index price of c. US$46/t and we have adjusted Chinese production
for VAT.
Starting with the margin curve, we estimate that around 85Mt of China’s
130Mt of consumed bauxite is generating positive margins at the current Index
price. The high grades and close proximity to refineries of China’s southern
bauxite means that margins are high. We believe Rio’s Gove and Weipa mines
are generating strong margins at around US$15-20/t. At the current low freight
rates, Hongqiao’s Guinea mine should generate positive margins. It quickly
falls away thereafter. We think most of China’s northern based domestic
bauxite is operating at a loss due to the lower grades. However, a lot of this
production is integrated with alumina refineries and smelters. Northern
Chinese bauxite prices are currently around RMB250/t and have started
climbing in recent weeks.

15 June 2016
M&M - Diversified Resources
Bauxite and Alumina
Page 24 Deutsche Bank AG/Sydney
Over the long run, we think depletion levels in Northern China and rising
freight rates will determine the long run marginal cost and therefore the long
run price.
Figure 34: Global seaborne (China bound) bauxite margin curve (2016)
Chin
a d
om
estic -
South
Weip
a
Gove
Guin
ea -
Hongqia
o
Mala
ysia
Bra
zil
Tro
mbeta
s
India
-O
rissa
Guin
ea
Chin
a d
om
estic -
Nort
h
Ghana -
Aw
aso
Dom
inic
an republic
-25
-20
-15
-10
-5
0
5
10
15
20
25
30
35
40
0 50 100 150
Marg
in (U
S$/t
)
Cummulative Production (Mtpa)
Source: Deutsche Bank, company data, CM Group
Looking at costs, our recent trip to Henan province uncovered that Northern
bauxite is being delivered to local refineries at a cost of around RMB260/t
(US$40/t) and Southern bauxite at just RMB170/t (US$26/t). We think that
Indian exports are the lowest cost.
15 June 2016
M&M - Diversified Resources
Bauxite and Alumina
Deutsche Bank AG/Sydney Page 25
Figure 35: Global seaborne (China bound) bauxite cost curve (2016) In
dia
-O
rissa
Dom
inic
an republic
Weip
a
Gove
Guin
ea -
Hongqia
o
Bra
zil
Tro
mbeta
s
Mala
ysia
Ghana -
Aw
aso
Chin
a d
om
estic -
South
Chin
a d
om
estic -
Nort
h
0
5
10
15
20
25
30
35
40
45
50
0 50 100 150
C1 c
os
ts (
US
$/t
)
Cummulative Production (Mtpa)
Source: Deutsche Bank, company data, CM Group
Bau
xite
an
d A
lum
ina
M&
M - D
iversifie
d R
eso
urc
es
15
Ju
ne 2
01
6
Pag
e 2
6
Deu
tsch
e B
an
k A
G/S
yd
ney
Figure 36: Global seaborne bauxite supply to China and Chinese domestic production (2016 estimate)
Country Mine Company Capacity (Mtpa)
Contestable (Mtpa)
Al2O3 SiO2 Moisture VIU premium
Freight discount
CIF Price
Freight FOB Price
FOB C1 unit
costs - US$/t
Royalty (US$/t)
Total unit
costs (US$/t)
Margin (US$/t)
Margin (%)
Chinese Domestic
North Various 47 47 50.0% 10.0% 10.0% -22 14 30 -8 39 40 1 41 -2 -6%
Chinese Domestic
South Various 31 31 60.0% 10.0% 10.0% -7 14 45 -8 54 26 2 28 26 49%
Australia Weipa (East Weipa and Andoom)
Rio Tinto 27 13 52.7% 4.5% 12.5% 4 0 48 6 42 17 4 21 21 49%
Australia Gove Rio Tinto 8 8 49.3% 4.0% 8.0% 2 0 46 6 40 20 8 28 12 30%
India Orissa 10 8 40.0% 3.5% 10.0% -12 -3 29 9 20 15 0 15 5 24%
Guinea Hongqiao 30 10 49.5% 2.1% 7.0% 12 -8 48 14 34 30 3 33 1 3%
Brazil Trombetas
Trombetas/MRN South32/Alcoa/AWC/Rio Tinto
18 2 49.5% 4.1% 5.5% 4 -8 40 14 26 20 1 21 6 21%
Dominican Republic
Las Mercedes Dovemco 1 1 44.0% 8.0% 11.0% -23 -8 13 14 -1 15 0 15 -16 NA
Malaysia Hongqiao, Xinfa, Chalco
25 10 43.0% 6.0% 10.0% -11 0 33 6 27 20 1 21 6 21%
Ghana Awaso Bosai Minerals/Ghana Government
1 1 52.0% 8.0% 11.0% -10 -8 26 14 12 20 1 21 -9 -72%
Total 197 132
Source: Deutsche Bank, company data, China Customs, CM Group, Aladdiny

15 June 2016
M&M - Diversified Resources
Bauxite and Alumina
Deutsche Bank AG/Sydney Page 27
Company Financials
Our detailed company financial estimates are shown from Page 28 onwards.
Valuation and risks
For the mining sector, our company valuations are based on DCF-derived NPVs
over the life of the operations and projects. An NPV multiple is applied in
some cases when setting the share price target. Multiples applied to DB
stocks are dependent on the company’s product types, exposure to
commodity prices, earnings growth and upside potential, and risks associated
with the development of projects. Forward multiples are also taken into
consideration at times when setting price targets. Typically though, PTs are set
broadly in-line with NPVs.
Risks associated with the mining sector include deviations in the commodity
and currency prices away from DB forecast assumptions. Other risks specific
to the sector are potential variations to capex budgets and schedules
associated with project development. For those operations in production,
operations can be affected by mechanical and technical challenges as well as
inclement weather. The operating costs can vary over time as the price of
labour, consumables and fuels change.
Alumina: We have set our PT broadly in line with our life-of-mine derived DCF
NPV, which assumes a LT Al price of US88c/lb (real), Index alumina of
US$290/t (real), US$350/t caustic soda, 0.75 AUDUSD and 10% nominal
WACC (in-line with the sector). We calculate our AWC valuation by
discounting AWC's operating cash flows from the alumina and aluminium
production. Key downside risks include; a drop in both the aluminium and
alumina price, alumina supply to emerge from inland China and aluminium
supply to emerge from Western China, the threat of China subsidizing loss-
making refineries, currency price strength and cost pressure from rising
caustic soda, labour, and energy (natural gas).Key upside risks include higher
commodity prices, lower operating currencies along with further efficiency
gains from assets.

15 June 2016
M&M - Diversified Resources
Bauxite and Alumina
Page 28 Deutsche Bank AG/Sydney
Model updated:06 June 2016
Running the numbers
Australasia
Australia
M&M - Diversified Resources
Rio Tinto Reuters: RIO.AX Bloomberg: RIO AU
Buy Price (15 Jun 16) AUD 42.96
Target Price AUD 54.20
52 Week range AUD 37.03 - 56.34
Market Cap (m) AUDm 77,546
USDm 57,046
Company Profile
Rio Tinto is a global diversified mining company with interests in aluminum, borax, coal, copper, diamonds, gold, iron ore, titanium dioxide feedstock, uranium and zinc. Rio Tinto's key mining operations are located in Australia, New Zealand, South Africa, South America, the United States, Europe, and Canada. Rio Tinto's management structure is based primarily on six principal global products businesses Aluminium, Diamonds, Copper, Energy (coal and uranium), Industrial Minerals, and Iron Ore supported by worldwide exploration and technology groups.
Price Performance
30
40
50
60
70
Jun 14Sep 14Dec 14Mar 15Jun 15Sep 15Dec 15Mar 16
Rio Tinto ALL ORDINARIES (Rebased)
Margin Trends
10
20
30
40
50
13 14 15 16E 17E 18E
EBITDA Margin EBIT Margin
Growth & Profitability
0
5
10
15
20
25
-30
-20
-10
0
10
13 14 15 16E 17E 18E
Sales growth (LHS) ROE (RHS)
Solvency
0
5
10
15
20
25
30
0
10
20
30
40
13 14 15 16E 17E 18E
Net debt/equity (LHS) Net interest cover (RHS)
Paul Young
+61 2 8258-2587 [email protected]
Fiscal year end 31-Dec 2013 2014 2015 2016E 2017E 2018E
Financial Summary
DB EPS (USD) 5.50 5.02 2.50 1.56 2.45 2.51
Reported EPS (USD) 1.97 3.52 -0.48 1.56 2.45 2.51
DPS (USD) 1.92 2.15 2.15 1.10 1.23 1.25
BVPS (USD) 24.78 24.95 20.69 19.48 19.37 19.16
Valuation Metrics Price/Sales (x) 2.1 2.2 2.1 1.9 1.7 1.6
P/E (DB) (x) 10.7 11.1 16.1 20.3 12.9 12.6
P/E (Reported) (x) 29.8 15.9 nm 20.3 12.9 12.6
P/BV (x) 2.7 2.1 1.6 1.6 1.6 1.6
FCF yield (%) 3.8 7.5 3.4 8.2 7.9 7.2
Dividend yield (%) 3.3 3.8 5.3 3.5 3.9 4.0
EV/Sales 2.7 2.7 2.7 2.5 2.2 2.1
EV/EBITDA 8.2 6.4 7.0 8.2 6.3 6.0
EV/EBIT 11.6 8.5 10.7 16.0 10.5 10.2
Income Statement (USDm)
Sales 51,171 47,664 34,829 30,760 33,242 34,762
EBITDA 16,613 19,775 13,460 9,374 11,897 12,142
EBIT 11,822 14,915 8,815 4,785 7,085 7,099
Pre-tax profit 3,505 9,552 -726 3,891 6,254 6,380
Net income 3,665 6,527 -866 2,814 4,430 4,528
Cash Flow (USDm)
Cash flow from operations 15,078 14,286 7,089 8,187 9,292 9,792
Net Capex -10,946 -6,503 -4,600 -3,503 -4,807 -5,667
Free cash flow 4,132 7,783 2,489 4,684 4,485 4,125
Equity raised/(bought back) 0 0 -2,028 0 0 0
Dividends paid -3,322 -3,710 -4,076 -2,662 -2,209 -2,458
Net inc/(dec) in borrowings 2,122 -3,034 -1,681 -2,683 -1,740 -2,059
Other investing/financing cash flows 202 1,168 2,239 0 0 0
Net cash flow 2,914 2,191 -5,340 -662 536 -392
Change in working capital 207 1,468 1,219 231 -466 338
Balance Sheet (USDm)
Cash and cash equivalents 10,216 12,423 9,366 8,704 9,240 8,848
Property, plant & equipment 70,827 68,693 61,057 59,970 59,965 60,589
Goodwill 1,349 1,228 892 892 892 892
Other assets 28,633 25,483 20,249 19,717 19,974 19,780
Total assets 111,025 107,827 91,564 89,283 90,071 90,109
Debt 28,271 24,918 23,149 20,466 18,726 16,667
Other liabilities 29,425 28,315 24,373 26,946 29,724 32,254
Total liabilities 57,696 53,233 47,522 47,412 48,450 48,921
Total shareholders' equity 53,502 54,594 44,128 41,871 41,621 41,188
Net debt 18,055 12,495 13,783 11,762 9,486 7,819
Key Company Metrics
Sales growth (%) 0.4 -6.9 -26.9 -11.7 8.1 4.6
DB EPS growth (%) 9.8 -8.7 -50.2 -37.7 57.4 2.2
Payout ratio (%) 97.0 61.1 nm 70.6 50.0 50.0
EBITDA Margin (%) 32.5 41.5 38.6 30.5 35.8 34.9
EBIT Margin (%) 23.1 31.3 25.3 15.6 21.3 20.4
ROE (%) 22.0 20.2 10.9 7.8 12.6 13.0
Net debt/equity (%) 33.7 22.9 31.2 28.1 22.8 19.0
Net interest cover (x) 27.8 25.5 12.6 8.8 14.7 19.3
DuPont Analysis
EBIT margin (%) 23.1 31.3 25.3 15.6 21.3 20.4
x Asset turnover (x) 0.4 0.4 0.3 0.3 0.4 0.4
x Financial cost ratio (x) 1.0 1.0 0.9 0.9 0.9 0.9
x Tax and other effects (x) 0.3 0.5 -0.1 0.7 0.7 0.7
= ROA (post tax) (%) 3.2 6.0 -0.9 3.1 4.9 5.0
x Financial leverage (x) 2.5 2.4 2.4 2.5 2.6 2.6
= ROE (%) 7.9 14.2 -2.1 7.8 12.6 13.0
annual growth (%) na 79.2 na na 62.8 3.0
x NTA/share (avg) (x) 25.0 24.9 23.0 20.1 19.4 19.3
= Reported EPS 1.97 3.52 -0.48 1.56 2.45 2.51
annual growth (%) na 78.5 na na 57.4 2.2
Source: Company data, Deutsche Bank estimates
15 June 2016
M&M - Diversified Resources
Bauxite and Alumina
Deutsche Bank AG/Sydney Page 29
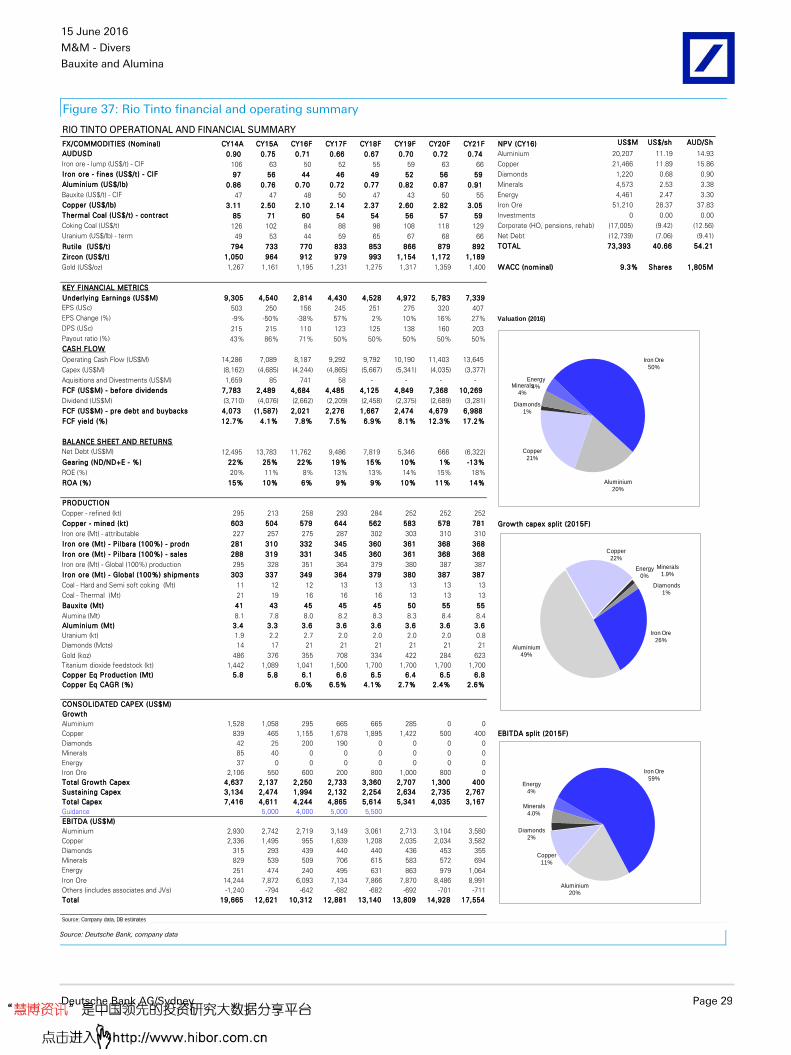
Figure 37: Rio Tinto financial and operating summary
RIO TINTO OPERATIONAL AND FINANCIAL SUMMARY
FX/COMMODITIES (Nominal) CY14A CY15A CY16F CY17F CY18F CY19F CY20F CY21F NPV (CY16) US$M US$/sh AUD/Sh
AUDUSD 0.90 0.75 0.71 0.66 0.67 0.70 0.72 0.74 Aluminium 20,207 11.19 14.93
Iron ore - lump (US$/t) - CIF 106 63 50 52 55 59 63 66 Copper 21,466 11.89 15.86
Iron ore - f ines (US$/t ) - CIF 97 56 44 46 49 52 56 59 Diamonds 1,220 0.68 0.90
Aluminium (US$/lb) 0.86 0.76 0.70 0.72 0.77 0.82 0.87 0.91 Minerals 4,573 2.53 3.38
Bauxite (US$/t) - CIF 47 47 48 50 47 43 50 55 Energy 4,461 2.47 3.30
Copper (US$/lb) 3.11 2.50 2.10 2.14 2.37 2.60 2.82 3.05 Iron Ore 51,210 28.37 37.83
Thermal Coal (US$/t ) - contract 85 71 60 54 54 56 57 59 Investments 0 0.00 0.00
Coking Coal (US$/t) 126 102 84 88 98 108 118 129 Corporate (HO, pensions, rehab) (17,005) (9.42) (12.56)
Uranium (US$/lb) - term 49 53 44 59 65 67 68 66 Net Debt (12,739) (7.06) (9.41)
Rut ile (US$/t ) 794 733 770 833 853 866 879 892 TOTAL 73,393 40.66 54.21
Zircon (US$/t ) 1,050 964 912 979 993 1,154 1,172 1,189
Gold (US$/oz) 1,267 1,161 1,195 1,231 1,275 1,317 1,359 1,400 WACC (nominal) 9.3% Shares 1,805M
KEY FINANCIAL METRICS
Underlying Earnings (US$M) 9,305 4,540 2,814 4,430 4,528 4,972 5,783 7,339
EPS (USc) 503 250 156 245 251 275 320 407
EPS Change (%) -9% -50% -38% 57% 2% 10% 16% 27% Valuation (2016)
DPS (USc) 215 215 110 123 125 138 160 203
Payout ratio (%) 43% 86% 71% 50% 50% 50% 50% 50%
CASH FLOW
Operating Cash Flow (US$M) 14,286 7,089 8,187 9,292 9,792 10,190 11,403 13,645
Capex (US$M) (8,162) (4,685) (4,244) (4,865) (5,667) (5,341) (4,035) (3,377)
Aquisitions and Divestments (US$M) 1,659 85 741 58 - - - -
FCF (US$M) - before dividends 7,783 2,489 4,684 4,485 4,125 4,849 7,368 10,269
Dividend (US$M) (3,710) (4,076) (2,662) (2,209) (2,458) (2,375) (2,689) (3,281)
FCF (US$M) - pre debt and buybacks 4,073 (1,587) 2,021 2,276 1,667 2,474 4,679 6,988
FCF yield (%) 12.7% 4.1% 7.8% 7.5% 6.9% 8.1% 12.3% 17.2%
BALANCE SHEET AND RETURNS
Net Debt (US$M) 12,495 13,783 11,762 9,486 7,819 5,346 666 (6,322)
Gearing (ND/ND+E - %) 22% 25% 22% 19% 15% 10% 1% -13%
ROE (%) 20% 11% 8% 13% 13% 14% 15% 18%
ROA (%) 15% 10% 6% 9% 9% 10% 11% 14%
PRODUCTION
Copper - refined (kt) 295 213 258 293 284 252 252 252
Copper - mined (kt ) 603 504 579 644 562 583 578 781 Growth capex split (2015F)
Iron ore (Mt) - attributable 227 257 275 287 302 303 310 310
Iron ore (Mt) - Pilbara (100%) - prodn 281 310 332 345 360 361 368 368
Iron ore (Mt) - Pilbara (100%) - sales 288 319 331 345 360 361 368 368
Iron ore (Mt) - Global (100%) production 295 328 351 364 379 380 387 387
Iron ore (Mt) - Global (100%) shipments 303 337 349 364 379 380 387 387
Coal - Hard and Semi soft coking (Mt) 11 12 12 13 13 13 13 13
Coal - Thermal (Mt) 21 19 16 16 16 13 13 13
Bauxite (Mt) 41 43 45 45 45 50 55 55
Alumina (Mt) 8.1 7.8 8.0 8.2 8.3 8.3 8.4 8.4
Aluminium (Mt) 3.4 3.3 3.6 3.6 3.6 3.6 3.6 3.6
Uranium (kt) 1.9 2.2 2.7 2.0 2.0 2.0 2.0 0.8
Diamonds (Mcts) 14 17 21 21 21 21 21 21
Gold (koz) 486 376 355 708 334 422 284 623
Titanium dioxide feedstock (kt) 1,442 1,089 1,041 1,500 1,700 1,700 1,700 1,700
Copper Eq Product ion (Mt) 5.8 5.8 6.1 6.6 6.5 6.4 6.5 6.8
Copper Eq CAGR (%) 6.0% 6.5% 4.1% 2.7% 2.4% 2.6%
CONSOLIDATED CAPEX (US$M)
Growth
Aluminium 1,528 1,058 295 665 665 285 0 0
Copper 839 465 1,155 1,678 1,895 1,422 500 400 EBITDA split (2015F)
Diamonds 42 25 200 190 0 0 0 0
Minerals 85 40 0 0 0 0 0 0
Energy 37 0 0 0 0 0 0 0
Iron Ore 2,106 550 600 200 800 1,000 800 0
Total Growth Capex 4,637 2,137 2,250 2,733 3,360 2,707 1,300 400
Sustaining Capex 3,134 2,474 1,994 2,132 2,254 2,634 2,735 2,767
Total Capex 7,416 4,611 4,244 4,865 5,614 5,341 4,035 3,167
Guidance 5,000 4,000 5,000 5,500
EBITDA (US$M)
Aluminium 2,930 2,742 2,719 3,149 3,061 2,713 3,104 3,580
Copper 2,336 1,495 955 1,639 1,208 2,035 2,034 3,582
Diamonds 315 293 439 440 440 436 453 355
Minerals 829 539 509 706 615 583 572 694
Energy 251 474 240 495 631 863 979 1,064
Iron Ore 14,244 7,872 6,093 7,134 7,866 7,870 8,486 8,991
Others (includes associates and JVs) -1,240 -794 -642 -682 -682 -692 -701 -711
Total 19,665 12,621 10,312 12,881 13,140 13,809 14,928 17,554
Source: Company data, DB estimates
Aluminium20%
Copper11%
Diamonds2%
Minerals4.0%
Energy4%
Iron Ore59%
Aluminium 20%
Copper21%
Diamonds 1%
Minerals4%
Energy4%
Iron Ore50%
Aluminium49%
Copper22%
Diamonds1%
Minerals1.9%
Energy0%
Iron Ore26%
Source: Deutsche Bank, company data
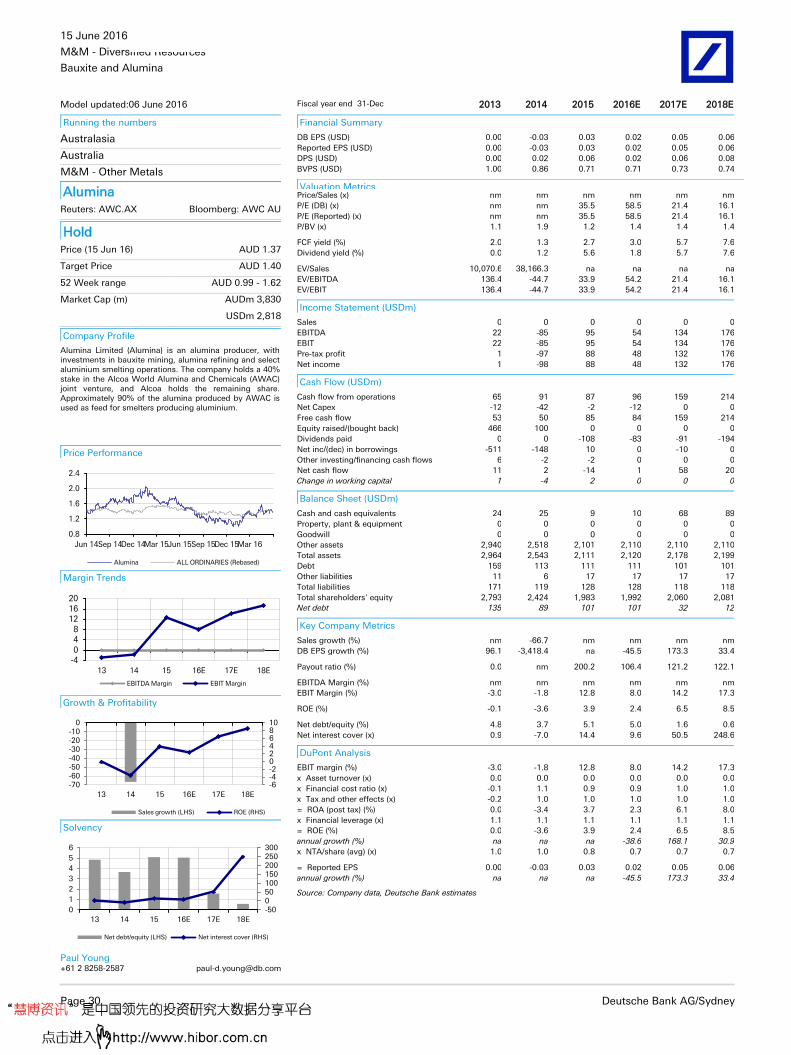
15 June 2016
M&M - Diversified Resources
Bauxite and Alumina
Page 30 Deutsche Bank AG/Sydney
Model updated:06 June 2016
Running the numbers
Australasia
Australia
M&M - Other Metals
Alumina Reuters: AWC.AX Bloomberg: AWC AU
Hold Price (15 Jun 16) AUD 1.37
Target Price AUD 1.40
52 Week range AUD 0.99 - 1.62
Market Cap (m) AUDm 3,830
USDm 2,818
Company Profile
Alumina Limited (Alumina) is an alumina producer, with investments in bauxite mining, alumina refining and select aluminium smelting operations. The company holds a 40% stake in the Alcoa World Alumina and Chemicals (AWAC) joint venture, and Alcoa holds the remaining share. Approximately 90% of the alumina produced by AWAC is used as feed for smelters producing aluminium.
Price Performance
0.8
1.2
1.6
2.0
2.4
Jun 14Sep 14Dec 14Mar 15Jun 15Sep 15Dec 15Mar 16
Alumina ALL ORDINARIES (Rebased)
Margin Trends
-4048
121620
13 14 15 16E 17E 18E
EBITDA Margin EBIT Margin
Growth & Profitability
-6-4-20246810
-70-60-50-40-30-20-10
0
13 14 15 16E 17E 18E
Sales growth (LHS) ROE (RHS)
Solvency
-50050100150200250300
0
1
2
3
4
5
6
13 14 15 16E 17E 18E
Net debt/equity (LHS) Net interest cover (RHS)
Paul Young
+61 2 8258-2587 [email protected]
Fiscal year end 31-Dec 2013 2014 2015 2016E 2017E 2018E
Financial Summary
DB EPS (USD) 0.00 -0.03 0.03 0.02 0.05 0.06
Reported EPS (USD) 0.00 -0.03 0.03 0.02 0.05 0.06
DPS (USD) 0.00 0.02 0.06 0.02 0.06 0.08
BVPS (USD) 1.00 0.86 0.71 0.71 0.73 0.74
Valuation Metrics Price/Sales (x) nm nm nm nm nm nm
P/E (DB) (x) nm nm 35.5 58.5 21.4 16.1
P/E (Reported) (x) nm nm 35.5 58.5 21.4 16.1
P/BV (x) 1.1 1.9 1.2 1.4 1.4 1.4
FCF yield (%) 2.0 1.3 2.7 3.0 5.7 7.6
Dividend yield (%) 0.0 1.2 5.6 1.8 5.7 7.6
EV/Sales 10,070.6 38,166.3 na na na na
EV/EBITDA 136.4 -44.7 33.9 54.2 21.4 16.1
EV/EBIT 136.4 -44.7 33.9 54.2 21.4 16.1
Income Statement (USDm)
Sales 0 0 0 0 0 0
EBITDA 22 -85 95 54 134 176
EBIT 22 -85 95 54 134 176
Pre-tax profit 1 -97 88 48 132 176
Net income 1 -98 88 48 132 176
Cash Flow (USDm)
Cash flow from operations 65 91 87 96 159 214
Net Capex -12 -42 -2 -12 0 0
Free cash flow 53 50 85 84 159 214
Equity raised/(bought back) 466 100 0 0 0 0
Dividends paid 0 0 -108 -83 -91 -194
Net inc/(dec) in borrowings -511 -148 10 0 -10 0
Other investing/financing cash flows 6 -2 -2 0 0 0
Net cash flow 11 2 -14 1 58 20
Change in working capital 1 -4 2 0 0 0
Balance Sheet (USDm)
Cash and cash equivalents 24 25 9 10 68 89
Property, plant & equipment 0 0 0 0 0 0
Goodwill 0 0 0 0 0 0
Other assets 2,940 2,518 2,101 2,110 2,110 2,110
Total assets 2,964 2,543 2,111 2,120 2,178 2,199
Debt 159 113 111 111 101 101
Other liabilities 11 6 17 17 17 17
Total liabilities 171 119 128 128 118 118
Total shareholders' equity 2,793 2,424 1,983 1,992 2,060 2,081
Net debt 135 89 101 101 32 12
Key Company Metrics
Sales growth (%) nm -66.7 nm nm nm nm
DB EPS growth (%) 96.1 -3,418.4 na -45.5 173.3 33.4
Payout ratio (%) 0.0 nm 200.2 106.4 121.2 122.1
EBITDA Margin (%) nm nm nm nm nm nm
EBIT Margin (%) -3.0 -1.8 12.8 8.0 14.2 17.3
ROE (%) -0.1 -3.6 3.9 2.4 6.5 8.5
Net debt/equity (%) 4.8 3.7 5.1 5.0 1.6 0.6
Net interest cover (x) 0.9 -7.0 14.4 9.6 50.5 248.6
DuPont Analysis
EBIT margin (%) -3.0 -1.8 12.8 8.0 14.2 17.3
x Asset turnover (x) 0.0 0.0 0.0 0.0 0.0 0.0
x Financial cost ratio (x) -0.1 1.1 0.9 0.9 1.0 1.0
x Tax and other effects (x) -0.2 1.0 1.0 1.0 1.0 1.0
= ROA (post tax) (%) 0.0 -3.4 3.7 2.3 6.1 8.0
x Financial leverage (x) 1.1 1.1 1.1 1.1 1.1 1.1
= ROE (%) 0.0 -3.6 3.9 2.4 6.5 8.5
annual growth (%) na na na -38.6 168.1 30.9
x NTA/share (avg) (x) 1.0 1.0 0.8 0.7 0.7 0.7
= Reported EPS 0.00 -0.03 0.03 0.02 0.05 0.06
annual growth (%) na na na -45.5 173.3 33.4
Source: Company data, Deutsche Bank estimates

15 June 2016
M&M - Diversified Resources
Bauxite and Alumina
Deutsche Bank AG/Sydney Page 31
Figure 38: AWC financial and operating summary
ALUMINA LTD OPERATIONAL AND FINANCIAL SUMMARY DATA
FX/COMMODITY ASSUMPTIONS 2013A 2014A 2015A 2016F 2017F 2018F 2019F 2020F 2021F NPV (CY16)
AUDUSD 0.97 0.90 0.75 0.71 0.66 0.67 0.70 0.72 0.74 US$m US$ps
Aluminium - (USc/lb) 86 86 76 70 72 77 82 87 91 AWAC (40%) 3,526 1.26
Alumina sales on Index (%) 53% 68% 75% 85% 95% 95% 95% 95% 95% Corporate (209) (0.07)
Alumina index - (US$/t ) 326 327 299 238 245 260 270 280 290 Total 3,317 1.18
Alumina intersegment - (US$/t) 274 279 241 222 231 247 262 277 292 Provisions (320) (0.11)
Average alumina pr ice - (US$/t ) 304 304 297 237 245 259 267 277 286 Less: Net debt 101 0.04
Contract Al/alumina Linkage (%) 14.5% 14.8% 14.5% 14.5% 14.5% 14.5% 14.5% 14.5% 14.5% Valuat ion (US$) 3,536 1.26
Index Al/alumina Linkage (%) 17.3% 17.3% 18.0% 15.5% 15.4% 15.3% 15.0% 14.6% 14.4% Valuat ion (A$) 3,901 1.39
Achieved Al/alumina Linkage (%) 15.7% 16.4% 16.5% 15.5% 15.6% 15.4% 15.2% 15.3% 14.9%
Oil (WTI) - (US$/bbl) 98 93 49 41 52 65 65 66 67 Shares (m) 2806
Caustic Soda (US$/t) 370 370 340 330 301 306 310 315 320
Bauxite pr ice (US$/t CIF) 69 58 48 50 45 40 50 55 WACC (nominal) 10.0%
WACC (real) 8.4%
KEY FINANCIAL METRICS
AWAC
AWAC EBITDA (US$M) 269 301 989 610 836 996 986 1082 1207
AWAC cash f low: post capex & tax (US$M) -145 -94 451 371 471 585 578 645 732
AWC
Dividend Received from AWAC (US$M) 107 119 106 115 179 234 231 258 293
AWC FCF - post growth capex (US$M) 56 50 85 84 159 214 205 236 270
Underlying Earnings (US$M) -3 -98 88 48 132 176 161 188 221
Net Debt (US$M) 135 89 101 101 32 12 16 -2 -20
Gearing (ND/E - %) 5% 4% 5% 5% 2% 1% 1% 0% -1%
ROE (%) 0% -4% 4% 2% 6% 8% 8% 9% 11%
ROA (%) 1% -3% 4% 3% 6% 8% 8% 9% 10%
EPS (USc) 0.0 -3.5 3.1 1.7 4.7 6.3 5.8 6.7 7.9
EPS (Ac) 0.0 -3.9 4.2 2.4 7.1 9.3 8.3 9.3 10.7
DPS (USc) 0.0 1.6 6.3 1.8 5.7 7.6 7.3 8.4 9.6
DPS (Ac) 0.0 1.8 8.4 2.6 8.6 11.4 10.5 11.7 13.0
Payout rat io (%) 0% 0% 123% 173% 69% 111% 129% 116% 114%
CFPS (USc) - post growth capex 2.1 1.8 3.0 3.0 5.7 7.6 7.3 8.4 9.6
CFPS (Ac) - post growth capex 2.1 2.0 4.0 4.2 8.6 11.4 10.5 11.7 13.0
Product ion split (2016)
MARGINS
EBITDA (US$/t ) - Alumina and Bauxite 44 56 82 48 63 77 79 84 92
D&A (US$/t) 28 25 20 24 23 23 24 25 26
EBIT (US$/t) 16 31 62 23 40 54 54 59 67
EBITDA (%) 5% 5% 18% 16% 22% 25% 24% 25% 27%
EBIT (%) -3% -2% 13% 8% 14% 17% 16% 18% 20%
PRODUCTION (kt )
Kwinana 2,210 2,195 2,401 2,409 2,402 2,402 2,402 2,409 2,402
Pinjarra 4,251 4,191 4,236 4,250 4,238 4,238 4,238 4,250 4,238
Wagerup 2,612 2,594 2,622 2,631 2,623 2,623 2,623 2,631 2,623
Point Comfort 1,616 2,240 1,705 200 - - - - -
Suralco (Paranam) 1,326 1,329 1,095 - - - - - -
Jamalco (55%) 848 819 - - - - - - -
Alumar (Sao Luis) (39%) 1,368 1,371 1,405 1,409 1,405 1,405 1,405 1,409 1,405
San Ciprian 1,568 1,348 1,513 1,518 1,514 1,514 1,514 1,518 1,514
Raz Az Zawr (Ma'aden JV) (25%) - 13 163 378 452 452 452 453 452
Alumina 15,800 16,100 15,140 12,794 12,635 12,635 12,635 12,670 12,635 Operat ing cost split (2016)
Point Henry (99%) 173 86 - - - - - - -
Portland (55%) 182 182 167 168 169 170 171 172 172
Aluminium 356 268 167 168 169 170 171 172 172
Bauxite sales (Mt) - 1.6 2.0 5.0 6.0 6.0 6.0 6.0 6.0
CASH COSTS
Bauxite costs (US$/t CIF) 43 40 33 34 34 34 35 35
Alumina (US$/t FOB) 260 248 215 189 182 182 188 193 194
Aluminium (US$/lb) 0.96 0.92 0.76 0.74 0.71 0.73 0.77 0.77 0.79
CAPEX (US$M)
AWC - Expansionary 27 32 3 5 0 0 0 0 0
AWAC - Sustaining 350 260 172 150 200 201 204 207 210
AWC share of sustaining 140 104 69 60 80 80 82 83 84
AWC total 167 136 71 65 80 80 82 83 84
Source: Deutsche Bank estimates, company data
Caustic11%
Energy29%
bauxite32%
Labour21%
Other7%
Kwinana19%
Pinjarra33%
Wagerup20%
Point Comfort
2%
Alumar (Sao Luis) (39%)11%
San Ciprian
12%
Source: Deutsche Bank, company data

15 June 2016
M&M - Diversified Resources
Bauxite and Alumina
Page 32 Deutsche Bank AG/Sydney
Model updated:06 June 2016
Running the numbers
Australasia
Australia
M&M - Diversified Resources
South32 Reuters: S32.AX Bloomberg: S32 AU
Hold Price (15 Jun 16) AUD 1.57
Target Price AUD 1.60
52 Week range AUD 0.89 - 2.08
Market Cap (m) AUDm 8,359
USDm 6,149
Company Profile
South32 will be a mid cap diversified miner. The company's asset portfolio includes Illawarra met coal, the Cannington silver/lead/zinc mine, the Cerro Matoso nickel mine, The Groote Eylandt manganese mine, Samancor manganese (Hotazel and Metalloys), the Worsley and Alumar alumina refineries, the Hillside, Mozal, Bayside and Alumar aluminium smelters and Energy coal South Africa. Operations are located in Australia (along with head office), South Africa, Mozambique, Brazil and Columbia.
Price Performance
0.8
1.2
1.6
2.0
2.4
May 15 Aug 15 Nov 15 Feb 16 May 16
South32 ALL ORDINARIES (Rebased)
Margin Trends
48
1216202428
14 15 16E 17E 18E
EBITDA Margin EBIT Margin
Growth & Profitability
0
2
4
6
8
-30-25-20-15-10-505
14 15 16E 17E 18E
Sales growth (LHS) ROE (RHS)
Solvency
0
5
10
15
20
-15
-10
-5
0
5
14 15 16E 17E 18E
Net debt/equity (LHS) Net interest cover (RHS)
Paul Young
+61 2 8258-2587 [email protected]
Fiscal year end 30-Jun 2014 2015 2016E 2017E 2018E
Financial Summary
DB EPS (USD) 0.08 0.11 0.02 0.04 0.07
Reported EPS (USD) 0.02 0.01 -0.32 0.04 0.07
DPS (USD) 0.00 0.00 0.00 0.01 0.03
BVPS (USD) 2.43 2.07 1.76 1.80 1.85
Valuation Metrics Price/Sales (x) nm 1.2 1.1 1.1 1.1
P/E (DB) (x) na 16.2 72.3 31.5 17.6
P/E (Reported) (x) na 332.1 nm 31.5 17.6
P/BV (x) na 0.7 0.7 0.6 0.6
FCF yield (%) na 13.0 6.7 8.8 10.1
Dividend yield (%) na 0.0 0.4 1.3 2.3
EV/Sales na 1.2 1.1 1.0 0.9
EV/EBITDA na 5.1 5.8 4.9 3.9
EV/EBIT na 9.5 19.7 12.9 8.2
Income Statement (USDm)
Sales 8,344 7,743 5,762 5,641 5,766
EBITDA 1,428 1,849 1,086 1,198 1,369
EBIT 605 1,001 320 453 648
Pre-tax profit 150 459 -1,521 329 541
Net income 103 28 -1,690 195 348
Cash Flow (USDm)
Cash flow from operations 1,419 1,838 915 1,011 1,164
Net Capex -590 -629 -502 -467 -542
Free cash flow 829 1,209 413 544 622
Equity raised/(bought back) 0 0 0 0 0
Dividends paid 0 0 0 -51 -111
Net inc/(dec) in borrowings -205 0 -188 0 0
Other investing/financing cash flows -260 -929 13 0 0
Net cash flow 157 1,023 242 493 511
Change in working capital 1,562 136 -679 0 0
Balance Sheet (USDm)
Cash and cash equivalents 364 644 882 1,375 1,886
Property, plant & equipment 13,393 9,550 8,537 8,182 7,864
Goodwill 0 0 0 0 0
Other assets 3,928 5,295 3,581 3,581 3,581
Total assets 17,685 15,489 13,000 13,137 13,331
Debt 344 1,046 813 813 813
Other liabilities 4,391 3,408 2,840 2,745 2,657
Total liabilities 4,735 4,454 3,653 3,558 3,470
Total shareholders' equity 12,950 11,035 9,347 9,579 9,861
Net debt -20 402 -69 -562 -1,073
Key Company Metrics
Sales growth (%) nm -7.2 -25.6 -2.1 2.2
DB EPS growth (%) na 29.3 -85.2 129.7 78.4
Payout ratio (%) 0.0 0.0 nm 40.0 40.0
EBITDA Margin (%) 17.1 23.9 18.8 21.2 23.7
EBIT Margin (%) 7.3 12.9 5.6 8.0 11.2
ROE (%) 6.9 4.8 0.8 2.1 3.6
Net debt/equity (%) -0.2 3.6 -0.7 -5.9 -10.9
Net interest cover (x) 3.2 16.7 2.8 3.6 6.1
DuPont Analysis
EBIT margin (%) 7.3 12.9 5.6 8.0 11.2
x Asset turnover (x) 0.9 0.5 0.4 0.4 0.4
x Financial cost ratio (x) 0.7 0.9 0.6 0.7 0.8
x Tax and other effects (x) 0.2 0.0 -8.2 0.6 0.6
= ROA (post tax) (%) 1.2 0.2 -11.9 1.5 2.6
x Financial leverage (x) 1.4 1.4 1.4 1.4 1.4
= ROE (%) 1.6 0.2 -16.6 2.1 3.6
annual growth (%) na -85.3 na na 73.7
x NTA/share (avg) (x) 1.2 2.3 1.9 1.8 1.8
= Reported EPS 0.02 0.01 -0.32 0.04 0.07
annual growth (%) na -72.7 na na 78.4
Source: Company data, Deutsche Bank estimates

15 June 2016
M&M - Diversified Resources
Bauxite and Alumina
Deutsche Bank AG/Sydney Page 33
Figure 39: South32 financial and operating summary
SOUTH32 OPERATIONAL AND FINANCIAL SUMMARY DATA
FX/COMMODITIES (Nominal) FY14A FY15A FY16F FY17F FY18F FY19F FY20F FY21F FY22F NPV (FY16) US$M US$/sh A$/sh
AUDUSD 0.92 0.84 0.72 0.68 0.66 0.68 0.71 0.73 0.74 Alumina 2,409 0.45 0.60
ZARUSD 10.44 11.48 14.75 16.39 16.51 14.37 13.23 13.87 14.77 Aluminium 1,744 0.33 0.44
BRLUSD 2.30 2.67 3.85 4.28 4.50 4.36 3.92 3.70 3.70 Manganese South Africa 52 0.01 0.01
Zinc (US¢/lb) 90 100 79 80 86 92 99 105 112 Manganese Australia 869 0.16 0.22
Lead (US¢/lb) 96 90 79 80 86 91 97 103 109 Nickel (Cerro Matoso) 452 0.08 0.11
Silver (US$/oz) 20.6 17.4 15.1 15.3 16.3 17.0 18.0 19.3 20.9 Met coal (Illawarra) 925 0.17 0.23
Aluminium (USc/lb) 82 86 70 70 75 80 84 89 94 Energy Coal (RSA) 562 0.11 0.14
Alumina (US$/t) - Index 321 332 253 241 253 270 280 285 304 Cannington 807 0.15 0.20
Nickel (US$/lb) 6.9 7.0 4.2 4.4 5.1 5.7 6.4 7.1 7.8 Corporate (incl. Exploration) -35 -0.01 -0.01
Hard coking coal (US$/t) 141 117 87 86 93 103 113 124 134 Provisions and rehab -1,538 -0.29 -0.39
SA export coal price (US$/t) 90 65 52 49 48 51 56 58 59 Less: Net debt 69 0.01 0.02
Newcastle export coal price (US$/t) 92 78 65 57 53 56 56 58 59 TOTAL 6,316 1.19 1.58
SA domestic thermal coal price (US$/t) 22 21 14 14 15 17 19 19 18
Manganese ore (US$/dmtu) 5.1 3.7 2.6 2.6 2.7 2.7 2.8 3.1 3.2
Manganese alloy (US$/t) - ferromanganese 1,047 936 893 907 920 1,032 1,019 1,024 1,044 WACC (nominal) 10.0%
WACC (real) 8.4%
KEY FINANCIAL METRICS
Underlying Earnings (US$M) 446 575 85 195 348 286 296 495 718 Shares on issue (m) 5,324
EPS (USc) 8 11 2 4 7 5 6 9 13
EPS Change (%) 29% -85% 130% 78% -18% 4% 67% 45%
DPS (USc) 0 0 0.4 1.5 2.6 2.1 2.2 3.7 5.4 Valuation (FY16)
Payout ratio (%) 0% 0% 28% 40% 40% 40% 40% 40% 40%
CASH FLOW
Operating Cash Flow (US$M) 1,419 1,838 915 1,011 1,164 1,063 1,066 1,270 1,455
Capex (incl. exploration) and divestments (US$M) -384 -157 -485 -467 -542 -446 -434 -475 -446
Free Cash Flow (US$M) - before dividends 1,035 1,681 430 544 622 617 632 796 1,009
Dividend (US$M) 0 0 0 -51 -111 -139 -114 -119 -198
Other Cash flow (US$M) -673 -658 0 0 0 0 0 0 0
Acquisitions (US$M) 0 0 0 0 0 0 0 0 0
Free Cash Flow (US$M) - before debt 362 1,023 430 493 511 477 518 677 811
Free Cash Flow yield (%) 18% 32% 10% 13% 15% 14% 14% 18% 22%
P/FCF 3 10 8 7 7 7 6 5
BALANCE SHEET AND RETURNS
Net Debt (US$M) 402 -69 -562 -1,073 -1,550 -2,068 -2,745 -3,557
Gearing (ND/(ND+E) - %) 4% -1% -6% -12% -18% -24% -25% -30%
ROE (%) 5% 1% 2% 4% 3% 3% 5% 6%
ROA (%) 6% 2% 4% 6% 5% 5% 8% 11%
PRODUCTION
Alumina (kt) - total 5,178 5,147 5,270 5,285 5,292 5,318 5,345 5,345 5,345
Alumina (kt) - third party sales 2,830 3,139 3,342 3,333 3,340 3,366 3,393 3,393 3,393
Aluminium (kt) 1,174 1,004 964 976 976 976 976 976 976
Manganese Ore (kt) 4,431 4,624 4,274 4,408 4,408 4,468 4,468 4,468 4,468
Manganese Alloy (kt) 329 359 204 235 235 235 235 235 235
Nickel (kt) 44 40 37 36 31 27 27 27 27
Met Coal (Mt) 7.5 8.9 8.3 9.5 8.9 9.0 9.0 9.0 9.0
Thermal Coal (Mt) - total 30.4 34.3 32.0 31.0 31.0 23.3 16.5 15.0 15.0
Thermal Coal (Mt) - exports 13.3 16.4 15.9 15.7 15.6 14.4 9.1 7.6 7.6
Silver (Moz) - payable 25.2 22.6 21.4 19.5 16.3 14.3 14.5 13.5 10.0
Lead (kt) - payable 187 183 175 168 149 124 118 113 91
Zinc (kt) - payable 58 72 81 78 75 65 61 57 49
Copper Eq Production (Mt) 1.42 1.42 1.33 1.35 1.31 1.22 1.16 1.15 1.12
Copper Eq Yoy growth (%) 0% -6% 1% -3% -7% -5% -2% -2% EBITDA split (2016F)
COSTS
Absolute (US$M) - excludes Manganese 6,924 6,094 4,797 4,443 4,397 4,624 4,731 4,686 4,640
Unit costs (US$/lb Cu Eq) - incl. royalties 2.2 1.9 1.6 1.5 1.5 1.7 1.8 1.9 1.9
Change in unit costs (%) -22% -12% -16% -9% 2% 13% 7% 1% 1%
Unit costs by assets
Cerro Matoso (US$/lb) 5.1 5.1 3.9 3.5 3.9 4.6 4.8 4.9 5.1
SA coal exports (US$/t) 60 42 34 33 35 41 45 43 41
SA coal domestic (US$/t) 22 19 12 12 13 15 17 16 15
Aluminium (US$/lb) 0.85 0.83 0.68 0.60 0.62 0.73 0.82 0.80 0.78
Alumina (US$/t) 271 242 213 191 185 193 203 211 218
Illawarra coal (US$/t) 98 74 62 59 57 59 62 64 66
Cannington (US$/oz of silver) - pre by-product credits 25 25 22 22 24 25 26 27 32
Manganese ore (US$/t) 107 92 76 69 70 75 79 81 82
Manganese alloy (US$/t) 1,043 875 808 786 789 838 880 894 902
EBITDA (US$M)
Alumina 216 466 274 253 330 358 381 377 406
Aluminium 315 584 250 295 374 189 100 238 387
Manganese (60%) 375 253 105 151 169 209 204 245 274
Nickel 87 133 5 53 54 41 71 102 128
Met Coal 135 167 79 122 174 241 203 246 291
Energy Coal 197 276 259 211 161 91 126 132 156
Lead/silver/zinc 460 342 308 300 293 266 273 282 230
Corporate and unallocated (ex manganese) -357 -372 -193 -188 -188 -204 -189 -210 -224
Total (adjusted for EAUs) 1,428 1,849 1,086 1,198 1,369 1,191 1,169 1,412 1,648
CAPEX (US$M)
Alumina 56 62 67 68 68 70 71 114 116
Aluminium 44 86 57 69 74 74 76 77 78
Manganese (60%) 130 139 90 78 138 58 56 57 57
Nickel 56 36 20 15 15 16 16 16 16
Met Coal 309 308 200 114 108 105 107 108 110
Energy Coal 65 98 82 82 87 73 56 50 49
Lead/silver/zinc 60 39 35 40 50 50 53 53 20
Total Capex 720 768 550 467 542 446 434 475 446
Sustaining Capex 428 609 496 467 482 446 434 475 446
Growth Capex 291 159 54 0 60 0 0 0 0
Consolidated Capex (excludes Manganese) 590 629 461 389 403 388 378 418 389
Source: Company data, DB estimates
Alumina31%
Aluminium22%
Manganese South Africa
1%
Manganese Australia
11%
Nickel (Cerro Matoso)
6%
Met coal (Illawarra)
12%
Energy Coal (RSA)
7%
Lead/silver/zinc
(Cannington)8%
Alumina19%
Aluminium17%
Manganese (60%)
7%Nickel
0%Met Coal
5%
Energy Coal18%
Lead/silver/zinc
21%
Corporate and
unallocated (ex
manganese)-13%
Source: Deutsche Bank, company data
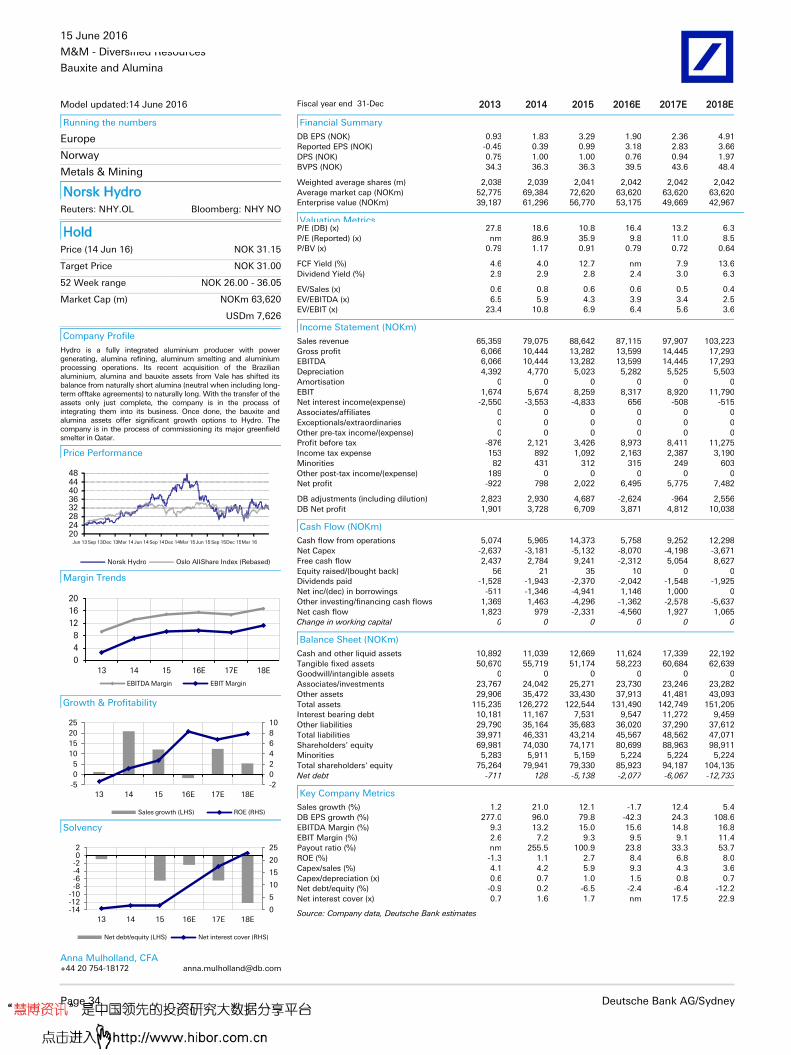
15 June 2016
M&M - Diversified Resources
Bauxite and Alumina
Page 34 Deutsche Bank AG/Sydney
Model updated:14 June 2016
Running the numbers
Europe
Norway
Metals & Mining
Norsk Hydro Reuters: NHY.OL Bloomberg: NHY NO
Hold Price (14 Jun 16) NOK 31.15
Target Price NOK 31.00
52 Week range NOK 26.00 - 36.05
Market Cap (m) NOKm 63,620
USDm 7,626
Company Profile
Hydro is a fully integrated aluminium producer with power generating, alumina refining, aluminum smelting and aluminium processing operations. Its recent acquisition of the Brazilian aluminium, alumina and bauxite assets from Vale has shifted its balance from naturally short alumina (neutral when including long-term offtake agreements) to naturally long. With the transfer of the assets only just complete, the company is in the process of integrating them into its business. Once done, the bauxite and alumina assets offer significant growth options to Hydro. The company is in the process of commissioning its major greenfield smelter in Qatar.
Price Performance
20 24 28 32 36 40 44 48
Jun 13 Sep 13 Dec 13 Mar 14 Jun 14 Sep 14 Dec 14 Mar 15 Jun 15 Sep 15 Dec 15 Mar 16
Norsk Hydro Oslo All - Share Index (Rebased)
Margin Trends
0
4
8
12
16
20
13 14 15 16E 17E 18E
EBITDA Margin EBIT Margin
Growth & Profitability
-2
0
2
4
6
8
10
-5
0
5
10
15
20
25
13 14 15 16E 17E 18E
Sales growth (LHS) ROE (RHS)
Solvency
0
5
10
15
20
25
-14-12-10-8-6-4-202
13 14 15 16E 17E 18E
Net debt/equity (LHS) Net interest cover (RHS)
Anna Mulholland, CFA
+44 20 754-18172 [email protected]
Fiscal year end 31-Dec 2013 2014 2015 2016E 2017E 2018E
Financial Summary
DB EPS (NOK) 0.93 1.83 3.29 1.90 2.36 4.91
Reported EPS (NOK) -0.45 0.39 0.99 3.18 2.83 3.66
DPS (NOK) 0.75 1.00 1.00 0.76 0.94 1.97
BVPS (NOK) 34.3 36.3 36.3 39.5 43.6 48.4
Weighted average shares (m) 2,038 2,039 2,041 2,042 2,042 2,042
Average market cap (NOKm) 52,775 69,384 72,620 63,620 63,620 63,620
Enterprise value (NOKm) 39,187 61,296 56,770 53,175 49,669 42,967
Valuation Metrics P/E (DB) (x) 27.8 18.6 10.8 16.4 13.2 6.3
P/E (Reported) (x) nm 86.9 35.9 9.8 11.0 8.5
P/BV (x) 0.79 1.17 0.91 0.79 0.72 0.64
FCF Yield (%) 4.6 4.0 12.7 nm 7.9 13.6
Dividend Yield (%) 2.9 2.9 2.8 2.4 3.0 6.3
EV/Sales (x) 0.6 0.8 0.6 0.6 0.5 0.4
EV/EBITDA (x) 6.5 5.9 4.3 3.9 3.4 2.5
EV/EBIT (x) 23.4 10.8 6.9 6.4 5.6 3.6
Income Statement (NOKm)
Sales revenue 65,359 79,075 88,642 87,115 97,907 103,223
Gross profit 6,066 10,444 13,282 13,599 14,445 17,293
EBITDA 6,066 10,444 13,282 13,599 14,445 17,293
Depreciation 4,392 4,770 5,023 5,282 5,525 5,503
Amortisation 0 0 0 0 0 0
EBIT 1,674 5,674 8,259 8,317 8,920 11,790
Net interest income(expense) -2,550 -3,553 -4,833 656 -508 -515
Associates/affiliates 0 0 0 0 0 0
Exceptionals/extraordinaries 0 0 0 0 0 0
Other pre-tax income/(expense) 0 0 0 0 0 0
Profit before tax -876 2,121 3,426 8,973 8,411 11,275
Income tax expense 153 892 1,092 2,163 2,387 3,190
Minorities 82 431 312 315 249 603
Other post-tax income/(expense) 189 0 0 0 0 0
Net profit -922 798 2,022 6,495 5,775 7,482
DB adjustments (including dilution) 2,823 2,930 4,687 -2,624 -964 2,556
DB Net profit 1,901 3,728 6,709 3,871 4,812 10,038
Cash Flow (NOKm)
Cash flow from operations 5,074 5,965 14,373 5,758 9,252 12,298
Net Capex -2,637 -3,181 -5,132 -8,070 -4,198 -3,671
Free cash flow 2,437 2,784 9,241 -2,312 5,054 8,627
Equity raised/(bought back) 56 21 35 10 0 0
Dividends paid -1,528 -1,943 -2,370 -2,042 -1,548 -1,925
Net inc/(dec) in borrowings -511 -1,346 -4,941 1,146 1,000 0
Other investing/financing cash flows 1,369 1,463 -4,296 -1,362 -2,578 -5,637
Net cash flow 1,823 979 -2,331 -4,560 1,927 1,065
Change in working capital 0 0 0 0 0 0
Balance Sheet (NOKm)
Cash and other liquid assets 10,892 11,039 12,669 11,624 17,339 22,192
Tangible fixed assets 50,670 55,719 51,174 58,223 60,684 62,639
Goodwill/intangible assets 0 0 0 0 0 0
Associates/investments 23,767 24,042 25,271 23,730 23,246 23,282
Other assets 29,906 35,472 33,430 37,913 41,481 43,093
Total assets 115,235 126,272 122,544 131,490 142,749 151,205
Interest bearing debt 10,181 11,167 7,531 9,547 11,272 9,459
Other liabilities 29,790 35,164 35,683 36,020 37,290 37,612
Total liabilities 39,971 46,331 43,214 45,567 48,562 47,071
Shareholders' equity 69,981 74,030 74,171 80,699 88,963 98,911
Minorities 5,283 5,911 5,159 5,224 5,224 5,224
Total shareholders' equity 75,264 79,941 79,330 85,923 94,187 104,135
Net debt -711 128 -5,138 -2,077 -6,067 -12,733
Key Company Metrics
Sales growth (%) 1.2 21.0 12.1 -1.7 12.4 5.4
DB EPS growth (%) 277.0 96.0 79.8 -42.3 24.3 108.6
EBITDA Margin (%) 9.3 13.2 15.0 15.6 14.8 16.8
EBIT Margin (%) 2.6 7.2 9.3 9.5 9.1 11.4
Payout ratio (%) nm 255.5 100.9 23.8 33.3 53.7
ROE (%) -1.3 1.1 2.7 8.4 6.8 8.0
Capex/sales (%) 4.1 4.2 5.9 9.3 4.3 3.6
Capex/depreciation (x) 0.6 0.7 1.0 1.5 0.8 0.7
Net debt/equity (%) -0.9 0.2 -6.5 -2.4 -6.4 -12.2
Net interest cover (x) 0.7 1.6 1.7 nm 17.5 22.9
Source: Company data, Deutsche Bank estimates

15 June 2016
M&M - Diversified Resources
Bauxite and Alumina
Deutsche Bank AG/Sydney Page 35
Model updated:13 April 2016
Running the numbers
North America
United States
Metals & Mining
Alcoa Reuters: AA.N Bloomberg: AA UN
Buy Price (14 Jun 16) USD 9.10
Target Price USD 13.00
52 Week range USD 6.74 - 12.02
Market Cap (m) USDm 12,447
EURm 11,102
Company Profile
Alcoa is a global leader in aluminum with a capacity of ~6% of world supply. It operates an integrated mine-to-metal model with aluminum and related products accounting for ~75% of sales. Performance of the upstream commodities business is primarily dependent on the LME aluminum and alumina price. Over the past few years, Alcoa's mid- and downstream businesses have gained significance due to acquisitions and leverage to faster-growing end markets such as Auto and Aerospace. Alcoa has announced its intention to split itself into two entities by YE16.
Price Performance
4
8
12
16
20
Jun 13 Sep 13Dec 13Mar 14 Jun 14Sep 14Dec 14Mar 15 Jun 15 Sep 15Dec 15Mar 16
Alcoa S&P 500 INDEX (Rebased)
Margin Trends
4
8
12
16
13 14 15 16E 17E 18E
EBITDA Margin EBIT Margin
Growth & Profitability
-25-20-15-10-5051015
-10
-5
0
5
10
15
13 14 15 16E 17E 18E
Sales growth (LHS) ROE (RHS)
Solvency
0
1
2
3
4
5
6
0
10
20
30
40
50
60
13 14 15 16E 17E 18E
Net debt/equity (LHS) Net interest cover (RHS)
Jorge Beristain, CFA
+1 203 863-2381 [email protected]
Fiscal year end 31-Dec 2013 2014 2015 2016E 2017E 2018E
Financial Summary
DB EPS (USD) 0.32 0.91 0.58 0.41 0.73 0.91
Reported EPS (USD) -2.09 0.23 -0.14 0.34 0.73 0.91
DPS (USD) 0.12 0.12 0.12 0.12 0.12 0.12
BVPS (USD) 9.69 10.46 9.64 9.19 9.68 10.47
Valuation Metrics Price/Sales (x) 0.4 0.7 0.7 0.6 0.5 0.5
P/E (DB) (x) 26.5 15.9 20.1 22.3 12.5 10.0
P/E (Reported) (x) nm 63.5 nm 26.9 12.5 10.0
P/BV (x) 1.1 1.5 1.0 1.0 0.9 0.9
FCF yield (%) 8.3 8.5 4.4 0.4 9.1 11.0
Dividend yield (%) 1.4 0.8 1.0 1.3 1.3 1.3
EV/Sales 0.8 1.0 1.0 1.0 0.8 0.8
EV/EBITDA 6.8 6.9 6.9 7.4 5.6 4.8
EV/EBIT 15.4 11.2 11.4 13.5 8.6 7.0
Income Statement (USDm)
Sales 23,032 23,906 22,534 20,847 23,028 24,420
EBITDA 2,546 3,556 3,248 2,714 3,472 3,820
EBIT 1,125 2,185 1,968 1,499 2,256 2,612
Pre-tax profit 682 1,665 1,443 958 1,805 2,177
Net income -2,285 268 -172 463 1,005 1,261
Cash Flow (USDm)
Cash flow from operations 1,972 2,668 1,834 1,451 2,215 2,556
Net Capex -1,193 -1,219 -1,180 -1,400 -1,066 -1,166
Free cash flow 779 1,449 654 51 1,149 1,390
Equity raised/(bought back) 0 500 0 0 0 0
Dividends paid -128 -139 -151 -158 -158 -166
Net inc/(dec) in borrowings -510 504 259 0 0 0
Other investing/financing cash flows -45 -2,752 -1,615 9 -69 -2
Net cash flow 96 -438 -853 -97 922 1,222
Change in working capital 297 -48 -444 -428 -229 -132
Balance Sheet (USDm)
Cash and cash equivalents 1,437 1,877 1,919 1,832 2,703 3,863
Property, plant & equipment 17,639 16,426 14,815 15,259 15,109 15,068
Goodwill 3,415 5,247 5,406 5,402 5,402 5,402
Other assets 13,251 13,861 14,597 13,985 14,527 14,871
Total assets 35,742 37,411 36,737 36,478 37,741 39,203
Debt 8,319 8,823 9,082 9,069 9,069 9,069
Other liabilities 13,901 13,775 13,326 12,646 12,907 13,058
Total liabilities 22,220 22,598 22,408 21,715 21,976 22,127
Total shareholders' equity 13,522 14,813 14,329 14,764 15,764 17,076
Net debt 6,882 6,946 7,163 7,237 6,366 5,206
Key Company Metrics
Sales growth (%) -2.8 3.8 -5.7 -7.5 10.5 6.0
DB EPS growth (%) 33.1 179.6 -36.1 -29.5 77.4 25.5
Payout ratio (%) nm 52.7 nm 35.4 16.5 13.2
EBITDA Margin (%) 11.1 14.9 14.4 13.0 15.1 15.6
EBIT Margin (%) 4.9 9.1 8.7 7.2 9.8 10.7
ROE (%) -19.2 2.3 -1.4 3.7 7.7 9.0
Net debt/equity (%) 50.9 46.9 50.0 49.0 40.4 30.5
Net interest cover (x) 2.5 4.6 4.0 2.9 4.3 5.0
DuPont Analysis
EBIT margin (%) 4.9 9.1 8.7 7.2 9.8 10.7
x Asset turnover (x) 0.6 0.7 0.6 0.6 0.6 0.6
x Financial cost ratio (x) 0.6 0.8 0.7 0.7 0.8 0.8
x Tax and other effects (x) -3.4 0.2 -0.1 0.5 0.6 0.6
= ROA (post tax) (%) -6.0 0.7 -0.5 1.3 2.7 3.3
x Financial leverage (x) 3.2 3.2 3.0 3.0 2.9 2.8
= ROE (%) -19.2 2.3 -1.4 3.7 7.7 9.0
annual growth (%) na na na na 107.2 16.8
x NTA/share (avg) (x) 10.9 9.7 9.7 9.1 9.4 10.1
= Reported EPS -2.09 0.23 -0.14 0.34 0.73 0.91
annual growth (%) na na na na 114.2 25.5
Source: Company data, Deutsche Bank estimates

15 June 2016
M&M - Diversified Resources
Bauxite and Alumina
Page 36 Deutsche Bank AG/Sydney
Model updated:13 June 2016
Running the numbers
Asia
China
Metals & Mining
Chalco Reuters: 2600.HK Bloomberg: 2600 HK
Hold Price (14 Jun 16) HKD 2.36
Target Price HKD 2.80
52 Week range HKD 2.16 - 4.35
Market Cap (m) HKDm 31,918
USDm 4,113
Company Profile
Aluminum Corporation of China Limited is a producer of alumina and primary aluminum in China. The Company refines bauxite into alumina and smelts alumina to produce primary aluminum.
Price Performance
2.0
3.0
4.0
5.0
6.0
Jun 14Sep 14Dec 14Mar 15Jun 15Sep 15Dec 15Mar 16
Chalco HANG SENG INDEX (Rebased)
Margin Trends
-8
-4
0
4
8
12
13 14 15 16E 17E
EBITDA Margin EBIT Margin
Growth & Profitability
-50
-40
-30
-20
-10
0
10
-20
-15
-10
-5
0
5
10
13 14 15 16E 17E
Sales growth (LHS) ROE (RHS)
Solvency
0
1
1
2
2
0
50
100
150
200
250
300
13 14 15 16E 17E
Net debt/equity (LHS) Net interest cover (RHS)
Sharon Ding
- - - [email protected]
Fiscal year end 31-Dec 2013 2014 2015 2016E 2017E
Financial Summary
DB EPS (CNY) 0.07 -1.20 0.01 -0.09 0.16
Reported EPS (CNY) 0.07 -1.20 0.01 -0.09 0.16
DPS (CNY) 0.00 0.00 0.00 0.00 0.00
BVPS (CNY) 3.3 2.1 2.6 2.5 2.7
Weighted average shares (m) 13,524 13,524 14,214 14,904 14,904
Average market cap (CNYm) 31,680 33,125 39,286 27,103 29,867
Enterprise value (CNYm) 127,795 126,441 115,686 104,522 106,426
Valuation Metrics P/E (DB) (x) 32.5 nm 190.4 nm 12.4
P/E (Reported) (x) 32.5 nm 190.4 nm 12.4
P/BV (x) 0.65 1.36 0.80 0.80 0.75
FCF Yield (%) nm 16.8 nm 11.8 18.3
Dividend Yield (%) 0.0 0.0 0.0 0.0 0.0
EV/Sales (x) 0.8 0.9 0.9 0.9 0.8
EV/EBITDA (x) 10.1 nm 9.5 10.6 7.9
EV/EBIT (x) 23.4 nm 23.0 36.9 16.4
Income Statement (CNYm)
Sales revenue 169,431 141,772 123,446 121,715 127,107
Gross profit 9,986 7,876 9,643 12,913 16,954
EBITDA 12,690 -3,502 12,147 9,886 13,557
Depreciation 6,957 6,955 6,869 6,796 6,811
Amortisation 278 287 255 255 255
EBIT 5,456 -10,744 5,023 2,834 6,491
Net interest income(expense) -5,233 -5,670 -5,138 -4,689 -4,338
Associates/affiliates 661 440 308 439 516
Exceptionals/extraordinaries 0 0 0 0 0
Other pre-tax income/(expense) 0 0 0 0 0
Profit before tax 883 -15,975 193 -1,416 2,669
Income tax expense 340 1,075 -230 0 0
Minorities -224 -833 217 -142 267
Other post-tax income/(expense) 207 0 0 0 0
Net profit 975 -16,217 206 -1,274 2,402
DB adjustments (including dilution) 0 0 0 0 0
DB Net profit 975 -16,217 206 -1,274 2,402
Cash Flow (CNYm)
Cash flow from operations 8,251 13,773 7,231 12,529 10,466
Net Capex -8,557 -8,220 -8,058 -9,000 -5,000
Free cash flow -305 5,553 -827 3,529 5,466
Equity raised/(bought back) 0 0 7,897 0 0
Dividends paid 0 0 0 0 0
Net inc/(dec) in borrowings 8,555 829 -12,752 -3,529 -8,338
Other investing/financing cash flows -7,166 -8,555 3,374 -4,689 -4,338
Net cash flow 1,084 -2,174 -2,308 -4,690 -7,211
Change in working capital 2,090 11,237 163 2,120 -3,689
Balance Sheet (CNYm)
Cash and other liquid assets 12,426 17,932 22,488 17,798 10,587
Tangible fixed assets 100,606 94,032 89,875 92,079 90,268
Goodwill/intangible assets 10,852 10,978 10,439 10,184 9,929
Associates/investments 20,446 20,042 20,718 20,718 20,718
Other assets 55,177 49,648 45,750 42,701 46,470
Total assets 199,507 192,632 189,269 183,479 177,971
Interest bearing debt 119,643 119,936 108,149 104,619 96,281
Other liabilities 26,162 33,067 30,823 29,979 30,140
Total liabilities 145,805 153,003 138,972 134,598 126,421
Shareholders' equity 44,358 28,276 38,840 37,566 39,968
Minorities 9,344 11,353 11,457 11,316 11,583
Total shareholders' equity 53,702 39,629 50,297 48,882 51,551
Net debt 107,217 102,004 85,661 86,821 85,694
Key Company Metrics
Sales growth (%) nm -16.3 -12.9 -1.4 4.4
DB EPS growth (%) na na na na na
EBITDA Margin (%) 7.5 -2.5 9.8 8.1 10.7
EBIT Margin (%) 3.2 -7.6 4.1 2.3 5.1
Payout ratio (%) 0.0 nm 0.0 nm 0.0
ROE (%) 2.2 -44.7 0.6 -3.3 6.2
Capex/sales (%) 5.3 6.0 7.2 7.4 3.9
Capex/depreciation (x) 1.3 1.2 1.2 1.3 0.7
Net debt/equity (%) 199.7 257.4 170.3 177.6 166.2
Net interest cover (x) 1.0 nm 1.0 0.6 1.5
Source: Company data, Deutsche Bank estimates
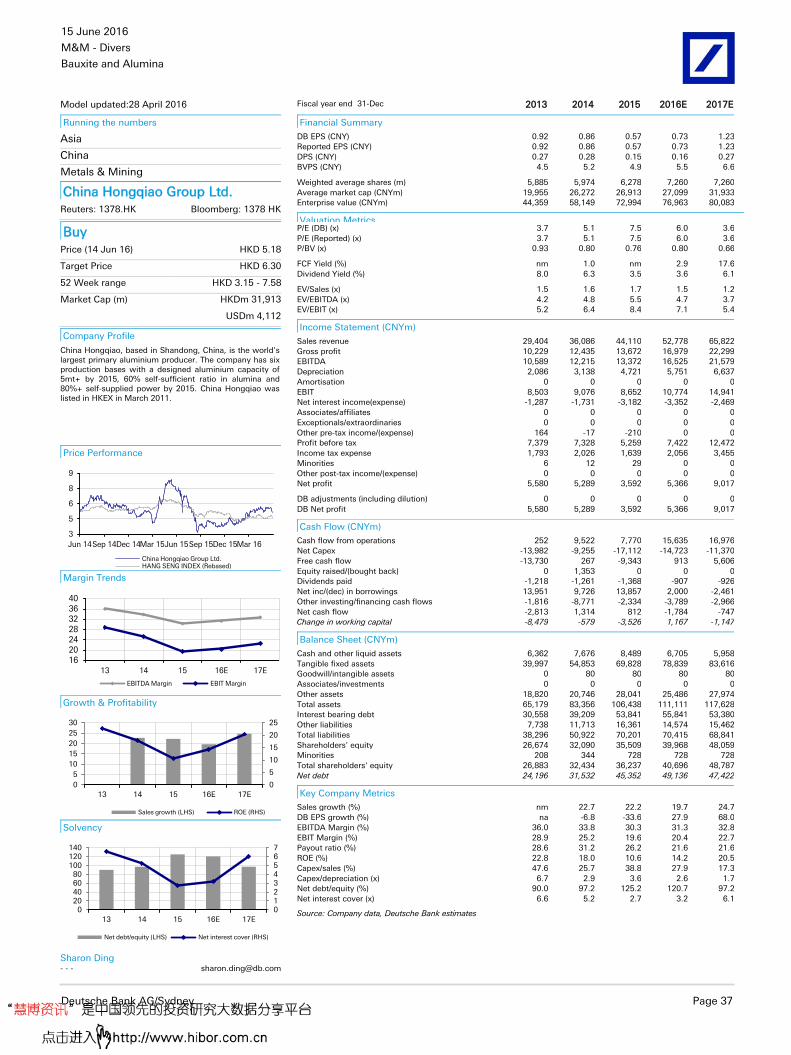
15 June 2016
M&M - Diversified Resources
Bauxite and Alumina
Deutsche Bank AG/Sydney Page 37
Model updated:28 April 2016
Running the numbers
Asia
China
Metals & Mining
China Hongqiao Group Ltd. Reuters: 1378.HK Bloomberg: 1378 HK
Buy Price (14 Jun 16) HKD 5.18
Target Price HKD 6.30
52 Week range HKD 3.15 - 7.58
Market Cap (m) HKDm 31,913
USDm 4,112
Company Profile
China Hongqiao, based in Shandong, China, is the world's largest primary aluminium producer. The company has six production bases with a designed aluminium capacity of 5mt+ by 2015, 60% self-sufficient ratio in alumina and 80%+ self-supplied power by 2015. China Hongqiao was listed in HKEX in March 2011.
Price Performance
3
5
6
8
9
Jun 14Sep 14Dec 14Mar 15Jun 15Sep 15Dec 15Mar 16
China Hongqiao Group Ltd.HANG SENG INDEX (Rebased)
Margin Trends
16202428323640
13 14 15 16E 17E
EBITDA Margin EBIT Margin
Growth & Profitability
0
5
10
15
20
25
0
5
10
15
20
25
30
13 14 15 16E 17E
Sales growth (LHS) ROE (RHS)
Solvency
01234567
020406080
100120140
13 14 15 16E 17E
Net debt/equity (LHS) Net interest cover (RHS)
Sharon Ding
- - - [email protected]
Fiscal year end 31-Dec 2013 2014 2015 2016E 2017E
Financial Summary
DB EPS (CNY) 0.92 0.86 0.57 0.73 1.23
Reported EPS (CNY) 0.92 0.86 0.57 0.73 1.23
DPS (CNY) 0.27 0.28 0.15 0.16 0.27
BVPS (CNY) 4.5 5.2 4.9 5.5 6.6
Weighted average shares (m) 5,885 5,974 6,278 7,260 7,260
Average market cap (CNYm) 19,955 26,272 26,913 27,099 31,933
Enterprise value (CNYm) 44,359 58,149 72,994 76,963 80,083
Valuation Metrics P/E (DB) (x) 3.7 5.1 7.5 6.0 3.6
P/E (Reported) (x) 3.7 5.1 7.5 6.0 3.6
P/BV (x) 0.93 0.80 0.76 0.80 0.66
FCF Yield (%) nm 1.0 nm 2.9 17.6
Dividend Yield (%) 8.0 6.3 3.5 3.6 6.1
EV/Sales (x) 1.5 1.6 1.7 1.5 1.2
EV/EBITDA (x) 4.2 4.8 5.5 4.7 3.7
EV/EBIT (x) 5.2 6.4 8.4 7.1 5.4
Income Statement (CNYm)
Sales revenue 29,404 36,086 44,110 52,778 65,822
Gross profit 10,229 12,435 13,672 16,979 22,299
EBITDA 10,589 12,215 13,372 16,525 21,579
Depreciation 2,086 3,138 4,721 5,751 6,637
Amortisation 0 0 0 0 0
EBIT 8,503 9,076 8,652 10,774 14,941
Net interest income(expense) -1,287 -1,731 -3,182 -3,352 -2,469
Associates/affiliates 0 0 0 0 0
Exceptionals/extraordinaries 0 0 0 0 0
Other pre-tax income/(expense) 164 -17 -210 0 0
Profit before tax 7,379 7,328 5,259 7,422 12,472
Income tax expense 1,793 2,026 1,639 2,056 3,455
Minorities 6 12 29 0 0
Other post-tax income/(expense) 0 0 0 0 0
Net profit 5,580 5,289 3,592 5,366 9,017
DB adjustments (including dilution) 0 0 0 0 0
DB Net profit 5,580 5,289 3,592 5,366 9,017
Cash Flow (CNYm)
Cash flow from operations 252 9,522 7,770 15,635 16,976
Net Capex -13,982 -9,255 -17,112 -14,723 -11,370
Free cash flow -13,730 267 -9,343 913 5,606
Equity raised/(bought back) 0 1,353 0 0 0
Dividends paid -1,218 -1,261 -1,368 -907 -926
Net inc/(dec) in borrowings 13,951 9,726 13,857 2,000 -2,461
Other investing/financing cash flows -1,816 -8,771 -2,334 -3,789 -2,966
Net cash flow -2,813 1,314 812 -1,784 -747
Change in working capital -8,479 -579 -3,526 1,167 -1,147
Balance Sheet (CNYm)
Cash and other liquid assets 6,362 7,676 8,489 6,705 5,958
Tangible fixed assets 39,997 54,853 69,828 78,839 83,616
Goodwill/intangible assets 0 80 80 80 80
Associates/investments 0 0 0 0 0
Other assets 18,820 20,746 28,041 25,486 27,974
Total assets 65,179 83,356 106,438 111,111 117,628
Interest bearing debt 30,558 39,209 53,841 55,841 53,380
Other liabilities 7,738 11,713 16,361 14,574 15,462
Total liabilities 38,296 50,922 70,201 70,415 68,841
Shareholders' equity 26,674 32,090 35,509 39,968 48,059
Minorities 208 344 728 728 728
Total shareholders' equity 26,883 32,434 36,237 40,696 48,787
Net debt 24,196 31,532 45,352 49,136 47,422
Key Company Metrics
Sales growth (%) nm 22.7 22.2 19.7 24.7
DB EPS growth (%) na -6.8 -33.6 27.9 68.0
EBITDA Margin (%) 36.0 33.8 30.3 31.3 32.8
EBIT Margin (%) 28.9 25.2 19.6 20.4 22.7
Payout ratio (%) 28.6 31.2 26.2 21.6 21.6
ROE (%) 22.8 18.0 10.6 14.2 20.5
Capex/sales (%) 47.6 25.7 38.8 27.9 17.3
Capex/depreciation (x) 6.7 2.9 3.6 2.6 1.7
Net debt/equity (%) 90.0 97.2 125.2 120.7 97.2
Net interest cover (x) 6.6 5.2 2.7 3.2 6.1
Source: Company data, Deutsche Bank estimates
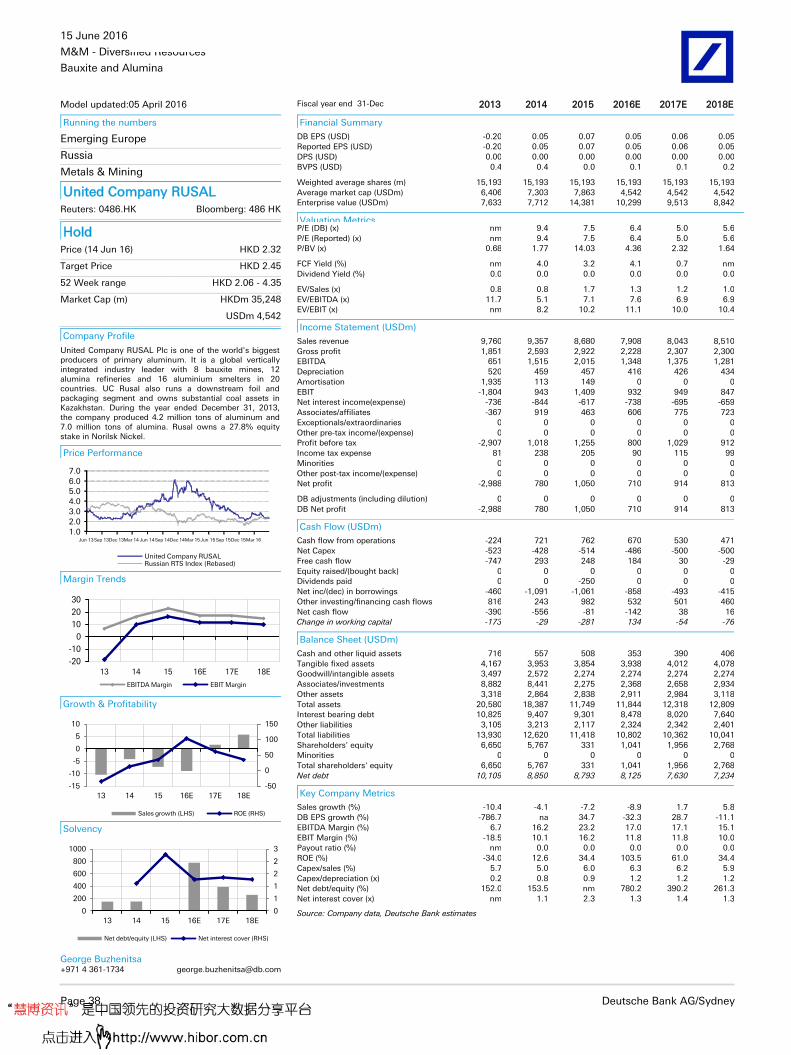
15 June 2016
M&M - Diversified Resources
Bauxite and Alumina
Page 38 Deutsche Bank AG/Sydney
Model updated:05 April 2016
Running the numbers
Emerging Europe
Russia
Metals & Mining
United Company RUSAL Reuters: 0486.HK Bloomberg: 486 HK
Hold Price (14 Jun 16) HKD 2.32
Target Price HKD 2.45
52 Week range HKD 2.06 - 4.35
Market Cap (m) HKDm 35,248
USDm 4,542
Company Profile
United Company RUSAL Plc is one of the world's biggest producers of primary aluminum. It is a global vertically integrated industry leader with 8 bauxite mines, 12 alumina refineries and 16 aluminium smelters in 20 countries. UC Rusal also runs a downstream foil and packaging segment and owns substantial coal assets in Kazakhstan. During the year ended December 31, 2013, the company produced 4.2 million tons of aluminum and 7.0 million tons of alumina. Rusal owns a 27.8% equity stake in Norilsk Nickel.
Price Performance
1.0
2.0
3.0
4.0
5.06.0
7.0
Jun 13Sep 13Dec 13Mar 14 Jun 14Sep 14Dec 14Mar 15 Jun 15 Sep 15Dec 15Mar 16
United Company RUSALRussian RTS Index (Rebased)
Margin Trends
-20
-10
0
10
20
30
13 14 15 16E 17E 18E
EBITDA Margin EBIT Margin
Growth & Profitability
-50
0
50
100
150
-15
-10
-5
0
5
10
13 14 15 16E 17E 18E
Sales growth (LHS) ROE (RHS)
Solvency
0
1
1
2
2
3
0
200
400
600
800
1000
13 14 15 16E 17E 18E
Net debt/equity (LHS) Net interest cover (RHS)
George Buzhenitsa +971 4 361-1734 [email protected]
Fiscal year end 31-Dec 2013 2014 2015 2016E 2017E 2018E
Financial Summary
DB EPS (USD) -0.20 0.05 0.07 0.05 0.06 0.05
Reported EPS (USD) -0.20 0.05 0.07 0.05 0.06 0.05
DPS (USD) 0.00 0.00 0.00 0.00 0.00 0.00
BVPS (USD) 0.4 0.4 0.0 0.1 0.1 0.2
Weighted average shares (m) 15,193 15,193 15,193 15,193 15,193 15,193
Average market cap (USDm) 6,406 7,303 7,863 4,542 4,542 4,542
Enterprise value (USDm) 7,633 7,712 14,381 10,299 9,513 8,842
Valuation Metrics P/E (DB) (x) nm 9.4 7.5 6.4 5.0 5.6
P/E (Reported) (x) nm 9.4 7.5 6.4 5.0 5.6
P/BV (x) 0.68 1.77 14.03 4.36 2.32 1.64
FCF Yield (%) nm 4.0 3.2 4.1 0.7 nm
Dividend Yield (%) 0.0 0.0 0.0 0.0 0.0 0.0
EV/Sales (x) 0.8 0.8 1.7 1.3 1.2 1.0
EV/EBITDA (x) 11.7 5.1 7.1 7.6 6.9 6.9
EV/EBIT (x) nm 8.2 10.2 11.1 10.0 10.4
Income Statement (USDm)
Sales revenue 9,760 9,357 8,680 7,908 8,043 8,510
Gross profit 1,851 2,593 2,922 2,228 2,307 2,300
EBITDA 651 1,515 2,015 1,348 1,375 1,281
Depreciation 520 459 457 416 426 434
Amortisation 1,935 113 149 0 0 0
EBIT -1,804 943 1,409 932 949 847
Net interest income(expense) -736 -844 -617 -738 -695 -659
Associates/affiliates -367 919 463 606 775 723
Exceptionals/extraordinaries 0 0 0 0 0 0
Other pre-tax income/(expense) 0 0 0 0 0 0
Profit before tax -2,907 1,018 1,255 800 1,029 912
Income tax expense 81 238 205 90 115 99
Minorities 0 0 0 0 0 0
Other post-tax income/(expense) 0 0 0 0 0 0
Net profit -2,988 780 1,050 710 914 813
DB adjustments (including dilution) 0 0 0 0 0 0
DB Net profit -2,988 780 1,050 710 914 813
Cash Flow (USDm)
Cash flow from operations -224 721 762 670 530 471
Net Capex -523 -428 -514 -486 -500 -500
Free cash flow -747 293 248 184 30 -29
Equity raised/(bought back) 0 0 0 0 0 0
Dividends paid 0 0 -250 0 0 0
Net inc/(dec) in borrowings -460 -1,091 -1,061 -858 -493 -415
Other investing/financing cash flows 816 243 982 532 501 460
Net cash flow -390 -556 -81 -142 38 16
Change in working capital -173 -29 -281 134 -54 -76
Balance Sheet (USDm)
Cash and other liquid assets 716 557 508 353 390 406
Tangible fixed assets 4,167 3,953 3,854 3,938 4,012 4,078
Goodwill/intangible assets 3,497 2,572 2,274 2,274 2,274 2,274
Associates/investments 8,882 8,441 2,275 2,368 2,658 2,934
Other assets 3,318 2,864 2,838 2,911 2,984 3,118
Total assets 20,580 18,387 11,749 11,844 12,318 12,809
Interest bearing debt 10,825 9,407 9,301 8,478 8,020 7,640
Other liabilities 3,105 3,213 2,117 2,324 2,342 2,401
Total liabilities 13,930 12,620 11,418 10,802 10,362 10,041
Shareholders' equity 6,650 5,767 331 1,041 1,956 2,768
Minorities 0 0 0 0 0 0
Total shareholders' equity 6,650 5,767 331 1,041 1,956 2,768
Net debt 10,109 8,850 8,793 8,125 7,630 7,234
Key Company Metrics
Sales growth (%) -10.4 -4.1 -7.2 -8.9 1.7 5.8
DB EPS growth (%) -786.7 na 34.7 -32.3 28.7 -11.1
EBITDA Margin (%) 6.7 16.2 23.2 17.0 17.1 15.1
EBIT Margin (%) -18.5 10.1 16.2 11.8 11.8 10.0
Payout ratio (%) nm 0.0 0.0 0.0 0.0 0.0
ROE (%) -34.0 12.6 34.4 103.5 61.0 34.4
Capex/sales (%) 5.7 5.0 6.0 6.3 6.2 5.9
Capex/depreciation (x) 0.2 0.8 0.9 1.2 1.2 1.2
Net debt/equity (%) 152.0 153.5 nm 780.2 390.2 261.3
Net interest cover (x) nm 1.1 2.3 1.3 1.4 1.3
Source: Company data, Deutsche Bank estimates

15 June 2016
M&M - Diversified Resources
Bauxite and Alumina
Deutsche Bank AG/Sydney Page 39
Model updated:13 May 2016
Running the numbers
Europe
United Kingdom
Metals & Mining
Vedanta Resources Reuters: VED.L Bloomberg: VED LN
Hold Price (14 Jun 16) GBP 373.00
Target Price GBP 375.00
52 Week range GBP 205.80 - 603.50
Market Cap (m) GBPm 1,029
USDm 1,453
Company Profile
Vedanta Resources Ltd. mines and processes a variety of metals (copper, zinc and aluminium), with its core operations being domiciled in India. Since its listing in London in late 2003, the company has diversified its exposure by both metal and geography mostly via acquisition; Iron ore, power and oil in India, copper in Zambia and zinc in Southern Africa and Ireland.
Price Performance
0
400
800
1200
1600
Jun 13Sep 13Dec 13Mar 14Jun 14Sep 14Dec 14Mar 15Jun 15Sep 15Dec 15Mar 16
Vedanta ResourcesFTSE 100 INDEX (Rebased)
Margin Trends
0
10
20
30
40
13 14 15 16 17E 18E
EBITDA Margin EBIT Margin
Growth & Profitability
-500
-400
-300
-200
-100
0
100
-20
-10
0
10
20
13 14 15 16 17E 18E
Sales growth (LHS) ROE (RHS)
Solvency
0
1
2
3
4
5
0
20
40
60
80
100
120
13 14 15 16 17E 18E
Net debt/equity (LHS) Net interest cover (RHS)
Anna Mulholland, CFA +44 20 754-18172 [email protected]
Fiscal year end 31-Mar 2013 2014 2015 2016 2017E 2018E
Financial Summary
DB EPS (USD) 1.37 0.14 -0.14 -1.32 -1.01 -1.03
Reported EPS (USD) 0.62 -0.70 -6.55 -6.66 -1.01 -1.03
DPS (USD) 0.58 0.61 0.63 0.30 0.00 0.00
BVPS (USD) 16.1 14.7 5.8 -2.6 3.9 2.8
Weighted average shares (m) 273 274 275 276 276 276
Average market cap (USDm) 4,635 4,538 3,707 1,815 1,453 1,453
Enterprise value (USDm) 26,195 25,402 25,112 22,089 21,676 20,695
Valuation Metrics P/E (DB) (x) 12.4 117.6 nm nm nm nm
P/E (Reported) (x) 27.5 nm nm nm nm nm
P/BV (x) 0.95 1.03 1.27 nm 1.36 1.85
FCF Yield (%) 15.4 18.2 nm 66.3 3.3 67.5
Dividend Yield (%) 3.4 3.7 4.7 4.6 0.0 0.0
EV/Sales (x) 1.7 2.0 1.9 2.1 2.0 1.6
EV/EBITDA (x) 5.4 5.7 6.7 9.5 9.2 6.9
EV/EBIT (x) 10.2 11.1 14.5 25.1 26.8 18.2
Income Statement (USDm)
Sales revenue 14,990 12,945 12,879 10,738 10,922 12,689
Gross profit 4,888 4,491 3,741 2,336 2,348 2,982
EBITDA 4,888 4,491 3,741 2,336 2,348 2,982
Depreciation 2,323 2,203 2,006 1,455 1,540 1,843
Amortisation 0 0 0 0 0 0
EBIT 2,565 2,288 1,736 882 808 1,139
Net interest income(expense) -806 -752 -555 -583 -293 -291
Associates/affiliates 0 0 0 0 0 0
Exceptionals/extraordinaries -42 -418 -6,821 -5,283 0 0
Other pre-tax income/(expense) 0 0 0 0 0 0
Profit before tax 1,717 1,118 -5,640 -4,984 515 848
Income tax expense 40 129 -1,853 -1,482 158 341
Minorities 1,508 1,185 -1,989 -1,665 634 791
Other post-tax income/(expense) 0 0 0 0 0 0
Net profit 169 -197 -1,799 -1,837 -278 -285
DB adjustments (including dilution) 206 236 1,760 1,473 0 0
DB Net profit 375 40 -39 -364 -278 -285
Cash Flow (USDm)
Cash flow from operations 2,946 3,015 2,165 2,075 1,134 2,143
Net Capex -2,233 -2,187 -2,289 -872 -1,085 -1,163
Free cash flow 713 828 -124 1,203 49 981
Equity raised/(bought back) -784 -2,839 -819 -1,000 0 0
Dividends paid -411 -508 -512 -437 -336 -316
Net inc/(dec) in borrowings 115 298 231 -121 0 0
Other investing/financing cash flows 210 -120 -795 -8 0 0
Net cash flow -156 -2,341 -2,018 -362 -288 664
Change in working capital 10 630 131 1,164 -431 105
Balance Sheet (USDm)
Cash and other liquid assets 7,982 8,938 8,210 8,937 8,985 9,966
Tangible fixed assets 33,121 31,044 23,352 16,647 16,192 15,512
Goodwill/intangible assets 17 125 119 109 103 98
Associates/investments 1,046 1,653 1,314 1,317 1,194 1,194
Other assets 3,786 3,615 3,995 3,310 3,256 3,712
Total assets 45,950 45,374 36,989 30,319 29,731 30,483
Interest bearing debt 16,593 16,871 16,668 16,263 16,263 16,263
Other liabilities 10,496 10,528 8,064 7,204 4,454 5,015
Total liabilities 27,089 27,400 24,732 23,467 20,717 21,279
Shareholders' equity 4,398 4,010 1,603 -714 1,069 784
Minorities 14,463 13,964 10,654 7,565 7,945 8,420
Total shareholders' equity 18,861 17,975 12,257 6,852 9,014 9,204
Net debt 8,611 7,933 8,458 7,327 7,278 6,297
Key Company Metrics
Sales growth (%) 7.0 -13.6 -0.5 -16.6 1.7 16.2
DB EPS growth (%) -1.8 -89.7 na -830.6 23.6 -2.5
EBITDA Margin (%) 32.6 34.7 29.0 21.8 21.5 23.5
EBIT Margin (%) 17.1 17.7 13.5 8.2 7.4 9.0
Payout ratio (%) 93.9 nm nm nm nm nm
ROE (%) 3.7 -4.7 -64.1 -413.0 -156.5 -30.7
Capex/sales (%) 14.9 16.9 17.8 8.1 9.9 9.2
Capex/depreciation (x) 1.0 1.0 1.1 0.6 0.7 0.6
Net debt/equity (%) 45.7 44.1 69.0 106.9 80.7 68.4
Net interest cover (x) 3.2 3.0 3.1 1.5 2.8 3.9
Source: Company data, Deutsche Bank estimates
15 June 2016
M&M - Diversified Resources
Bauxite and Alumina
Page 40 Deutsche Bank AG/Sydney
Appendix 1
Important Disclosures
Additional information available upon request
Disclosure checklist
Company Ticker Recent price* Disclosure
United Company RUSAL 0486.HK 2.33 (HKD) 14 Jun 16 14 *Prices are current as of the end of the previous trading session unless otherwise indicated and are sourced from local exchanges via Reuters, Bloomberg and other vendors . Other information is sourced from Deutsche Bank, subject companies, and other sources. For disclosures pertaining to recommendations or estimates made on securities other than the primary subject of this research, please see the most recently published company report or visit our global disclosure look-up page on our website at http://gm.db.com/ger/disclosure/DisclosureDirectory.eqsr.
Important Disclosures Required by U.S. Regulators
Disclosures marked with an asterisk may also be required by at least one jurisdiction in addition to the United States. See Important Disclosures Required by Non-US Regulators and Explanatory Notes.
14. Deutsche Bank and/or its affiliate(s) has received non-investment banking related compensation from this company within the past year.
For disclosures pertaining to recommendations or estimates made on securities other than the primary subject of this research, please see the most recently published company report or visit our global disclosure look-up page on our website at http://gm.db.com/ger/disclosure/DisclosureDirectory.eqsr
Analyst Certification
The views expressed in this report accurately reflect the personal views of the undersigned lead analyst about the subject issuers and the securities of those issuers. In addition, the undersigned lead analyst has not and will not receive any compensation for providing a specific recommendation or view in this report. Paul Young/Anna Mulholland/Jorge Beristain/Sharon Ding/Grant Sporre/George Buzhenitsa/Rene Kleyweg

15 June 2016
M&M - Diversified Resources
Bauxite and Alumina
Deutsche Bank AG/Sydney Page 41
Historical recommendations and target price: United Company RUSAL (0486.HK) (as of 6/14/2016)
1
23 4
5
67
8
9
10
11
12
13
0.00
1.00
2.00
3.00
4.00
5.00
6.00
7.00
Jun 13 Sep 13 Dec 13 Mar 14 Jun 14 Sep 14 Dec 14 Mar 15 Jun 15 Sep 15 Dec 15 Mar 16
Secu
rity
Pri
ce
Date
Previous Recommendations
Strong Buy Buy Market Perform Underperform Not Rated Suspended Rating
Current Recommendations
Buy Hold Sell Not Rated Suspended Rating
*New Recommendation Structure as of September 9,2002
**Analyst is no longer at Deutsche Bank
1. 25/06/2013: Hold, Target Price Change HKD3.40 George Buzhenitsa 8. 02/12/2014: Downgrade to Hold, Target Price Change HKD6.34 George Buzhenitsa
2. 04/10/2013: Hold, Target Price Change HKD2.77 George Buzhenitsa 9. 16/12/2014: Hold, Target Price Change HKD6.51 George Buzhenitsa
3. 21/01/2014: Hold, Target Price Change HKD2.35 George Buzhenitsa 10. 04/03/2015: Hold, Target Price Change HKD5.73 Grant Sporre
4. 04/04/2014: Hold, Target Price Change HKD3.18 George Buzhenitsa 11. 31/03/2015: Hold, Target Price Change HKD5.18 George Buzhenitsa
5. 11/07/2014: Hold, Target Price Change HKD3.79 George Buzhenitsa 12. 30/06/2015: Hold, Target Price Change HKD3.91 George Buzhenitsa
6. 17/09/2014: Hold, Target Price Change HKD4.82 George Buzhenitsa 13. 15/12/2015: Hold, Target Price Change HKD2.55 George Buzhenitsa
7. 30/09/2014: Upgrade to Buy, Target Price Change HKD5.50 George Buzhenitsa
Equity rating key Equity rating dispersion and banking relationships
Buy: Based on a current 12- month view of total share-holder return (TSR = percentage change in share price from current price to projected target price plus pro-jected dividend yield ) , we recommend that investors buy the stock.
Sell: Based on a current 12-month view of total share-holder return, we recommend that investors sell the stock
Hold: We take a neutral view on the stock 12-months out and, based on this time horizon, do not recommend either a Buy or Sell.
Newly issued research recommendations and target prices supersede previously published research.
37 %
57 %
7 %21 % 13 %14 %
0
20
40
60
80
100
120
140
Buy Hold Sell
Australia Universe
Companies Covered Cos. w/ Banking Relationship

15 June 2016
M&M - Diversified Resources
Bauxite and Alumina
Page 42 Deutsche Bank AG/Sydney
Regulatory Disclosures
1.Important Additional Conflict Disclosures
Aside from within this report, important conflict disclosures can also be found at https://gm.db.com/equities under the
"Disclosures Lookup" and "Legal" tabs. Investors are strongly encouraged to review this information before investing.
2.Short-Term Trade Ideas
Deutsche Bank equity research analysts sometimes have shorter-term trade ideas (known as SOLAR ideas) that are
consistent or inconsistent with Deutsche Bank's existing longer term ratings. These trade ideas can be found at the
SOLAR link at http://gm.db.com.

15 June 2016
M&M - Diversified Resources
Bauxite and Alumina
Deutsche Bank AG/Sydney Page 43
Additional Information
The information and opinions in this report were prepared by Deutsche Bank AG or one of its affiliates (collectively
"Deutsche Bank"). Though the information herein is believed to be reliable and has been obtained from public sources
believed to be reliable, Deutsche Bank makes no representation as to its accuracy or completeness.
If you use the services of Deutsche Bank in connection with a purchase or sale of a security that is discussed in this
report, or is included or discussed in another communication (oral or written) from a Deutsche Bank analyst, Deutsche
Bank may act as principal for its own account or as agent for another person.
Deutsche Bank may consider this report in deciding to trade as principal. It may also engage in transactions, for its own
account or with customers, in a manner inconsistent with the views taken in this research report. Others within
Deutsche Bank, including strategists, sales staff and other analysts, may take views that are inconsistent with those
taken in this research report. Deutsche Bank issues a variety of research products, including fundamental analysis,
equity-linked analysis, quantitative analysis and trade ideas. Recommendations contained in one type of communication
may differ from recommendations contained in others, whether as a result of differing time horizons, methodologies or
otherwise. Deutsche Bank and/or its affiliates may also be holding debt securities of the issuers it writes on.
Analysts are paid in part based on the profitability of Deutsche Bank AG and its affiliates, which includes investment
banking revenues.
Opinions, estimates and projections constitute the current judgment of the author as of the date of this report. They do
not necessarily reflect the opinions of Deutsche Bank and are subject to change without notice. Deutsche Bank has no
obligation to update, modify or amend this report or to otherwise notify a recipient thereof if any opinion, forecast or
estimate contained herein changes or subsequently becomes inaccurate. This report is provided for informational
purposes only. It is not an offer or a solicitation of an offer to buy or sell any financial instruments or to participate in any
particular trading strategy. Target prices are inherently imprecise and a product of the analyst’s judgment. The financial
instruments discussed in this report may not be suitable for all investors and investors must make their own informed
investment decisions. Prices and availability of financial instruments are subject to change without notice and
investment transactions can lead to losses as a result of price fluctuations and other factors. If a financial instrument is
denominated in a currency other than an investor's currency, a change in exchange rates may adversely affect the
investment. Past performance is not necessarily indicative of future results. Unless otherwise indicated, prices are
current as of the end of the previous trading session, and are sourced from local exchanges via Reuters, Bloomberg and
other vendors. Data is sourced from Deutsche Bank, subject companies, and in some cases, other parties.
Macroeconomic fluctuations often account for most of the risks associated with exposures to instruments that promise
to pay fixed or variable interest rates. For an investor who is long fixed rate instruments (thus receiving these cash
flows), increases in interest rates naturally lift the discount factors applied to the expected cash flows and thus cause a
loss. The longer the maturity of a certain cash flow and the higher the move in the discount factor, the higher will be the
loss. Upside surprises in inflation, fiscal funding needs, and FX depreciation rates are among the most common adverse
macroeconomic shocks to receivers. But counterparty exposure, issuer creditworthiness, client segmentation, regulation
(including changes in assets holding limits for different types of investors), changes in tax policies, currency
convertibility (which may constrain currency conversion, repatriation of profits and/or the liquidation of positions), and
settlement issues related to local clearing houses are also important risk factors to be considered. The sensitivity of fixed
income instruments to macroeconomic shocks may be mitigated by indexing the contracted cash flows to inflation, to
FX depreciation, or to specified interest rates – these are common in emerging markets. It is important to note that the
index fixings may -- by construction -- lag or mis-measure the actual move in the underlying variables they are intended
to track. The choice of the proper fixing (or metric) is particularly important in swaps markets, where floating coupon
rates (i.e., coupons indexed to a typically short-dated interest rate reference index) are exchanged for fixed coupons. It is
also important to acknowledge that funding in a currency that differs from the currency in which coupons are
denominated carries FX risk. Naturally, options on swaps (swaptions) also bear the risks typical to options in addition to
the risks related to rates movements.
15 June 2016
M&M - Diversified Resources
Bauxite and Alumina
Page 44 Deutsche Bank AG/Sydney
Derivative transactions involve numerous risks including, among others, market, counterparty default and illiquidity risk.
The appropriateness or otherwise of these products for use by investors is dependent on the investors' own
circumstances including their tax position, their regulatory environment and the nature of their other assets and
liabilities, and as such, investors should take expert legal and financial advice before entering into any transaction similar
to or inspired by the contents of this publication. The risk of loss in futures trading and options, foreign or domestic, can
be substantial. As a result of the high degree of leverage obtainable in futures and options trading, losses may be
incurred that are greater than the amount of funds initially deposited. Trading in options involves risk and is not suitable
for all investors. Prior to buying or selling an option investors must review the "Characteristics and Risks of Standardized
Options”, at http://www.optionsclearing.com/about/publications/character-risks.jsp. If you are unable to access the
website please contact your Deutsche Bank representative for a copy of this important document.
Participants in foreign exchange transactions may incur risks arising from several factors, including the following: ( i)
exchange rates can be volatile and are subject to large fluctuations; ( ii) the value of currencies may be affected by
numerous market factors, including world and national economic, political and regulatory events, events in equity and
debt markets and changes in interest rates; and (iii) currencies may be subject to devaluation or government imposed
exchange controls which could affect the value of the currency. Investors in securities such as ADRs, whose values are
affected by the currency of an underlying security, effectively assume currency risk.
Unless governing law provides otherwise, all transactions should be executed through the Deutsche Bank entity in the
investor's home jurisdiction.
United States: Approved and/or distributed by Deutsche Bank Securities Incorporated, a member of FINRA, NFA and
SIPC. Analysts employed by non-US affiliates may not be associated persons of Deutsche Bank Securities Incorporated
and therefore not subject to FINRA regulations concerning communications with subject companies, public appearances
and securities held by analysts.
Germany: Approved and/or distributed by Deutsche Bank AG, a joint stock corporation with limited liability incorporated
in the Federal Republic of Germany with its principal office in Frankfurt am Main. Deutsche Bank AG is authorized under
German Banking Law and is subject to supervision by the European Central Bank and by BaFin, Germany’s Federal
Financial Supervisory Authority.
United Kingdom: Approved and/or distributed by Deutsche Bank AG acting through its London Branch at Winchester
House, 1 Great Winchester Street, London EC2N 2DB. Deutsche Bank AG in the United Kingdom is authorised by the
Prudential Regulation Authority and is subject to limited regulation by the Prudential Regulation Authority and Financial
Conduct Authority. Details about the extent of our authorisation and regulation are available on request.
Hong Kong: Distributed by Deutsche Bank AG, Hong Kong Branch.
India: Prepared by Deutsche Equities India Pvt Ltd, which is registered by the Securities and Exchange Board of India
(SEBI) as a stock broker. Research Analyst SEBI Registration Number is INH000001741. DEIPL may have received
administrative warnings from the SEBI for breaches of Indian regulations.
Japan: Approved and/or distributed by Deutsche Securities Inc.(DSI). Registration number - Registered as a financial
instruments dealer by the Head of the Kanto Local Finance Bureau (Kinsho) No. 117. Member of associations: JSDA,
Type II Financial Instruments Firms Association and The Financial Futures Association of Japan. Commissions and risks
involved in stock transactions - for stock transactions, we charge stock commissions and consumption tax by
multiplying the transaction amount by the commission rate agreed with each customer. Stock transactions can lead to
losses as a result of share price fluctuations and other factors. Transactions in foreign stocks can lead to additional
losses stemming from foreign exchange fluctuations. We may also charge commissions and fees for certain categories
of investment advice, products and services. Recommended investment strategies, products and services carry the risk
of losses to principal and other losses as a result of changes in market and/or economic trends, and/or fluctuations in
market value. Before deciding on the purchase of financial products and/or services, customers should carefully read the
relevant disclosures, prospectuses and other documentation. "Moody's", "Standard & Poor's", and "Fitch" mentioned in
this report are not registered credit rating agencies in Japan unless Japan or "Nippon" is specifically designated in the
name of the entity. Reports on Japanese listed companies not written by analysts of DSI are written by Deutsche Bank

15 June 2016
M&M - Diversified Resources
Bauxite and Alumina
Deutsche Bank AG/Sydney Page 45
Group's analysts with the coverage companies specified by DSI. Some of the foreign securities stated on this report are
not disclosed according to the Financial Instruments and Exchange Law of Japan.
Korea: Distributed by Deutsche Securities Korea Co.
South Africa: Deutsche Bank AG Johannesburg is incorporated in the Federal Republic of Germany (Branch Register
Number in South Africa: 1998/003298/10).
Singapore: by Deutsche Bank AG, Singapore Branch or Deutsche Securities Asia Limited, Singapore Branch (One Raffles
Quay #18-00 South Tower Singapore 048583, +65 6423 8001), which may be contacted in respect of any matters
arising from, or in connection with, this report. Where this report is issued or promulgated in Singapore to a person who
is not an accredited investor, expert investor or institutional investor (as defined in the applicable Singapore laws and
regulations), they accept legal responsibility to such person for its contents.
Taiwan: Information on securities/investments that trade in Taiwan is for your reference only. Readers should
independently evaluate investment risks and are solely responsible for their investment decisions. Deutsche Bank
research may not be distributed to the Taiwan public media or quoted or used by the Taiwan public media without
written consent. Information on securities/instruments that do not trade in Taiwan is for informational purposes only and
is not to be construed as a recommendation to trade in such securities/instruments. Deutsche Securities Asia Limited,
Taipei Branch may not execute transactions for clients in these securities/instruments.
Qatar: Deutsche Bank AG in the Qatar Financial Centre (registered no. 00032) is regulated by the Qatar Financial Centre
Regulatory Authority. Deutsche Bank AG - QFC Branch may only undertake the financial services activities that fall
within the scope of its existing QFCRA license. Principal place of business in the QFC: Qatar Financial Centre, Tower,
West Bay, Level 5, PO Box 14928, Doha, Qatar. This information has been distributed by Deutsche Bank AG. Related
financial products or services are only available to Business Customers, as defined by the Qatar Financial Centre
Regulatory Authority.
Russia: This information, interpretation and opinions submitted herein are not in the context of, and do not constitute,
any appraisal or evaluation activity requiring a license in the Russian Federation.
Kingdom of Saudi Arabia: Deutsche Securities Saudi Arabia LLC Company, (registered no. 07073-37) is regulated by the
Capital Market Authority. Deutsche Securities Saudi Arabia may only undertake the financial services activities that fall
within the scope of its existing CMA license. Principal place of business in Saudi Arabia: King Fahad Road, Al Olaya
District, P.O. Box 301809, Faisaliah Tower - 17th Floor, 11372 Riyadh, Saudi Arabia.
United Arab Emirates: Deutsche Bank AG in the Dubai International Financial Centre (registered no. 00045) is regulated
by the Dubai Financial Services Authority. Deutsche Bank AG - DIFC Branch may only undertake the financial services
activities that fall within the scope of its existing DFSA license. Principal place of business in the DIFC: Dubai
International Financial Centre, The Gate Village, Building 5, PO Box 504902, Dubai, U.A.E. This information has been
distributed by Deutsche Bank AG. Related financial products or services are only available to Professional Clients, as
defined by the Dubai Financial Services Authority.
Australia: Retail clients should obtain a copy of a Product Disclosure Statement (PDS) relating to any financial product
referred to in this report and consider the PDS before making any decision about whether to acquire the product. Please
refer to Australian specific research disclosures and related information at
https://australia.db.com/australia/content/research-information.html
Australia and New Zealand: This research, and any access to it, is intended only for "wholesale clients" within the
meaning of the Australian Corporations Act and New Zealand Financial Advisors Act respectively.
Additional information relative to securities, other financial products or issuers discussed in this report is available upon
request. This report may not be reproduced, distributed or published without Deutsche Bank's prior written consent.
Copyright © 2016 Deutsche Bank AG

GRCM2016PROD035639
David Folkerts-Landau Chief Economist and Global Head of Research
Raj Hindocha Global Chief Operating Officer
Research
Michael Spencer Head of APAC Research
Global Head of Economics
Steve Pollard Head of Americas Research
Global Head of Equity Research
Anthony Klarman Global Head of Debt Research
Paul Reynolds Head of EMEA
Equity Research
Dave Clark Head of APAC
Equity Research
Pam Finelli Global Head of
Equity Derivatives Research
Anthony Klarman
Global Head of Debt Research
Paul Reynolds Head of EMEA
Equity Research
Dave Clark Head of APAC
Equity Research
Pam Finelli Global Head of
Equity Derivatives Research
Andreas Neubauer Head of Research - Germany
Stuart Kirk Head of Thematic Research
International locations
Deutsche Bank AG
Deutsche Bank Place
Level 16
Corner of Hunter & Phillip Streets
Sydney, NSW 2000
Australia
Tel: (61) 2 8258 1234
Deutsche Bank AG
Große Gallusstraße 10-14
60272 Frankfurt am Main
Germany
Tel: (49) 69 910 00
Deutsche Bank AG
Filiale Hongkong
International Commerce Centre,
1 Austin Road West,Kowloon,
Hong Kong
Tel: (852) 2203 8888
Deutsche Securities Inc.
2-11-1 Nagatacho
Sanno Park Tower
Chiyoda-ku, Tokyo 100-6171
Japan
Tel: (81) 3 5156 6770
Deutsche Bank AG London
1 Great Winchester Street
London EC2N 2EQ
United Kingdom
Tel: (44) 20 7545 8000
Deutsche Bank Securities Inc.
60 Wall Street
New York, NY 10005
United States of America
Tel: (1) 212 250 2500