bavaria industries group ag munich half-year report as of ... · suggestions and proposals for...
TRANSCRIPT

1
BAVARIA Industries Group AG Munich Half-Year Report as of 30 June 2016
2
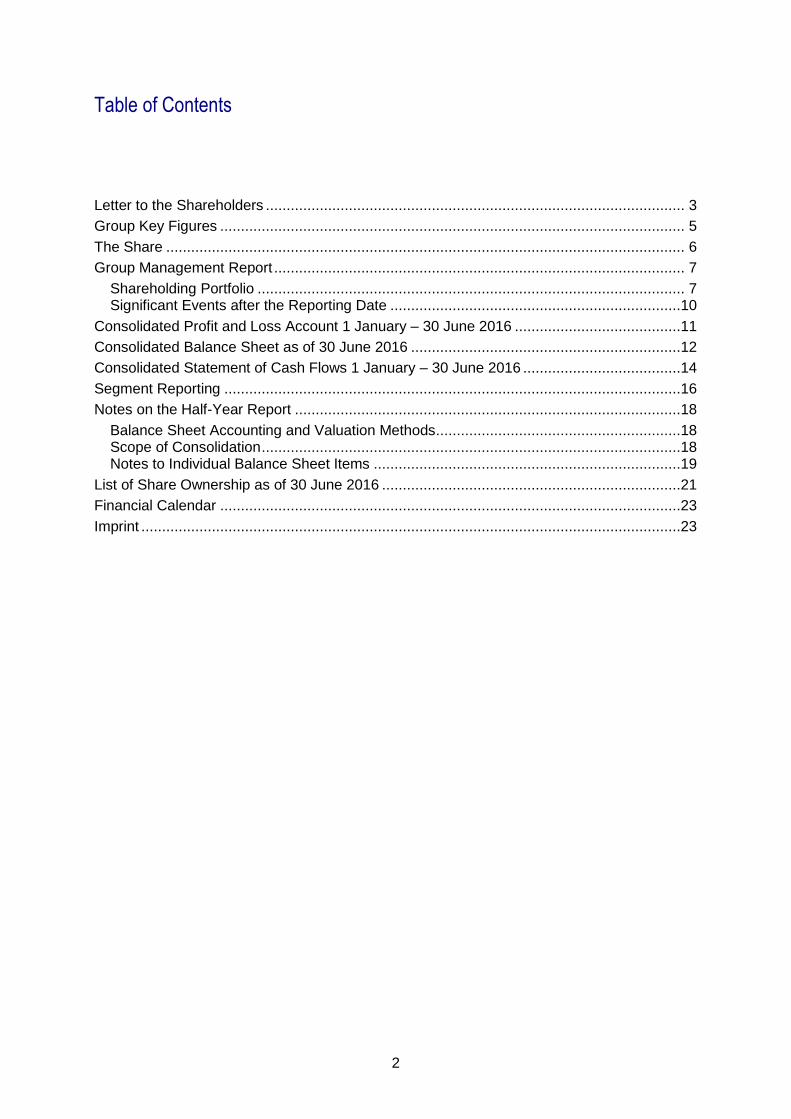
Table of Contents
Letter to the Shareholders ..................................................................................................... 3
Group Key Figures ................................................................................................................ 5
The Share ............................................................................................................................. 6
Group Management Report ................................................................................................... 7
Shareholding Portfolio ....................................................................................................... 7 Significant Events after the Reporting Date ......................................................................10
Consolidated Profit and Loss Account 1 January – 30 June 2016 ........................................11
Consolidated Balance Sheet as of 30 June 2016 .................................................................12
Consolidated Statement of Cash Flows 1 January – 30 June 2016 ......................................14
Segment Reporting ..............................................................................................................16
Notes on the Half-Year Report .............................................................................................18
Balance Sheet Accounting and Valuation Methods ...........................................................18 Scope of Consolidation .....................................................................................................18 Notes to Individual Balance Sheet Items ..........................................................................19
List of Share Ownership as of 30 June 2016 ........................................................................21
Financial Calendar ...............................................................................................................23
Imprint ..................................................................................................................................23

3
Letter to the Shareholders
August 2016 Dear shareholder, dear business associate,
The money currently losing value and many are trying to get rid of liquidity resulting in a strong bubble in the financial markets. At the moment much is paid in auctions for companies and many managers of assets are trying for the first time on corporate takeovers. What are we doing? Nothing at all! We are waiting for the next crisis, as in 2009, when we were able to announce five acquisitions in one year, while in the past 1½ years we have made no contribution. Even on the stock market prevail in our view high ratings that force us to exercise restraint. In the meantime, we look at our portfolio companies that develop with two exceptions to our great satisfaction. The net earnings of our portfolio companies developed in the first half year as follows:
1 HY 2016 1 HY 2015
Serial Production / Automotive 9.4 6.2
Plant Engineering & Construction -3.6 -3.3
Business Services -9.4 -11.7
Others 2.1 16.9
Consolidation -1.1 -6,1
Group -2.6 2.0
Our investments have evolved in the first half year as follows:
(in EUR million) 30.06.2016 31.12.2015 %
Securities (Sale Value) 58.9 63.1 -6.6
Cash 65.2 64.0 1.9
Total 124.1 127.1 -2.3
Our five largest positions have thereby developed in the first half year as follows:
(in EUR million) Value
30.06.2016 Performance
Berkshire Hathaway 9.9 0.6
Inv. AG TGV 6.0 -0.2
Brederode 5.9 -0.8
Euler Hermes Group 7.0 -0.6
EL.EN 3.8 1.1
Total 32.6 0.1

4
Overall, our book value and the value of our total portfolio compared to year end of 2015 developed as follows:
(in EUR million) 30.06.2016 31.12.2015 %
Investee companies 237.5 216.3 9.8
Financial Assets 124.2 126.0 -1.5
Total 361.7 342.3 5.7
We are very confident about the further development of BAVARIA Industries Group AG in the
current year. Here we depend on good working relationships and trust. We remain open to
suggestions and proposals for improvement or pointers towards new transactions.
Yours sincerely
Reimar Scholz Harald Ender Spokesman for the Board Director Operations
5
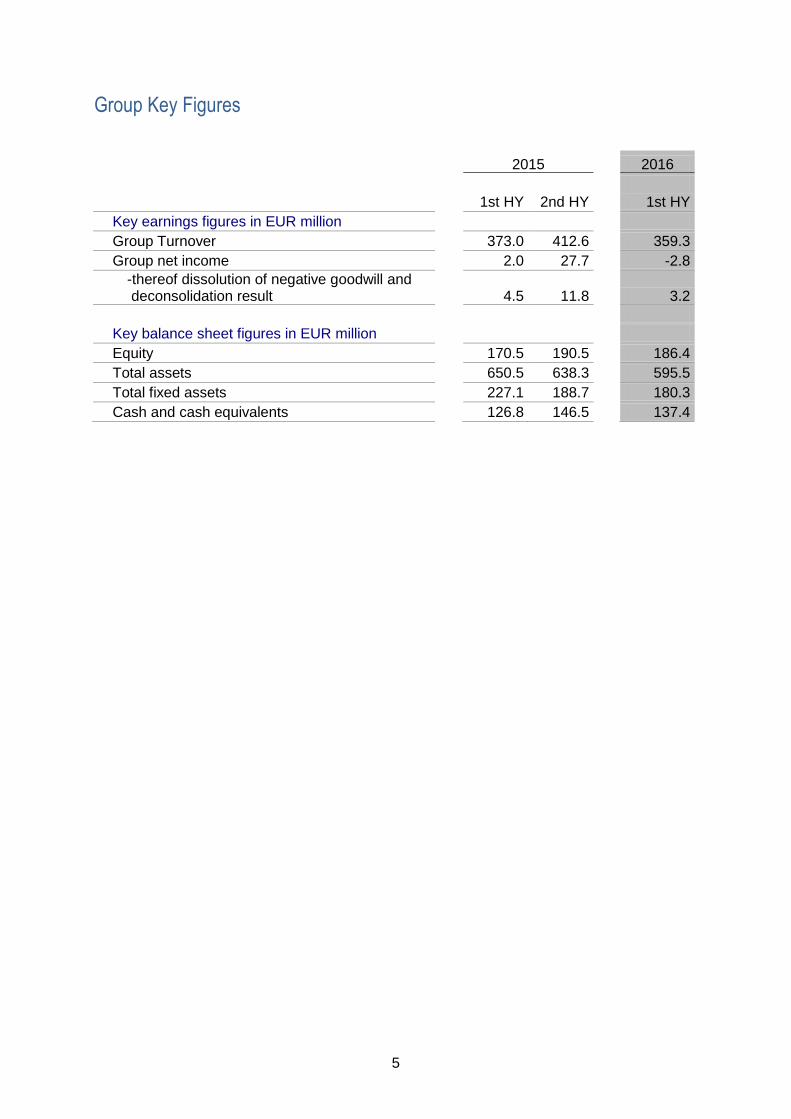
Group Key Figures
2015 2016
1st HY 2nd HY 1st HY
Key earnings figures in EUR million
Group Turnover 373.0 412.6 359.3
Group net income 2.0 27.7 -2.8
-thereof dissolution of negative goodwill and deconsolidation result
4.5 11.8 3.2
Key balance sheet figures in EUR million
Equity 170.5 190.5 186.4
Total assets 650.5 638.3 595.5
Total fixed assets 227.1 188.7 180.3
Cash and cash equivalents 126.8 146.5 137.4

6
The Share
On 30 June 2016 BAVARIA Industries Group AG held a total of 271,220 of its own shares.
Since the beginning of the year, shares were repurchased for a total of TEUR 712 as
authorised by the Annual General Meeting of 28 May 2014.
Number of shares 5,612,514 shares
Type of shares Individual bearer shares
Authorised capital EUR 5,612,514.00
Voting rights Each share confers one voting right
WKN 260 555
ISIN DE0002605557
Stock exchange code B8A
Stock excjange segment Entry Standard
Fiscal year Equivalent to the calender year
Accounting peresentation As per German Commercial Code (HGB)
Designated Sponsor Oddo Seydler Bank AG
Announcements Elektronischer Bundesanzeiger
(Electronic Federal Gazette)
Top share price in 2016 (06.06.2016) EUR 54.81
Lowest share price in 2016 (18.01.2016) EUR 41.25
Closing price (30.06.2016) EUR 49.66
Market capitalisation (30.06.2016) EUR 266.04 million
Earnings Holding per share EUR 1.67 (for fiscal year 2015)
Dividend per share EUR 0.00 (for fiscal year 2015)

7
Group Management Report
Shareholding Portfolio
A. Serial Production / Automotive
Name
Products Customers 1st
HY
Turnover
in EUR million
Sites Employees
TriStone Solutions for engine cooling,
turbo charging and air intake
Automotive 126.1 12 2,667
CARBODY Sealing and safety solutions Automotive 28.2 6 457
vosla Light sources Automotive,
Transport
22.7 1 348
Total 177.0 19 3,472
A.1 Segment turnover and earnings Net income in the Serial Production / Automotive segment amounted to EUR 9.4 million in
the first half of 2016, a year-on-year increase of EUR 3.3 million.
A.2 Investments, depreciation and personnel changes Investments in the Serial Production / Automotive segment amounted to EUR 6.0 million in
the first half of 2016 (previous year EUR 7.7 million), while depreciation totalled EUR 4.6
million (previous year EUR 5.5 million). The number of employees decreased due to the sale
of Austria Druckguss from 3,744 to 3,472.
A.3 Outlook We expect earnings development to remain solid in the seasonally weaker second half of the
year.

8
B. Plant Engineering & Construction
Name
Products Customers 1st
HY
Turnover
in EUR million
Sites Employees
Hering Tube bundle heat exchangers Industry 6.5 1 72
SIDES Fire engines and equipment Public
Sector,
Industry
22.1 1 216
BB
Government
Services
Construction Services NGO,
States and
Contracting
Authority
22.0 2 125
Total 50.7 4 413
B.1 Segment turnover and earnings Segment earnings were EUR -3.6 million (previous year EUR -3.3 million) in the first half of
2016.
B.2 Investments, depreciation and personnel changes
Investments in the Plant Engineering & Construction segment amounted to EUR 0.5 million
in the first half of 2016 (previous year EUR 0.8 million). Depreciation totalled also EUR 0.5
million (previous year EUR 0.5 million). The number of employees increased to 413 (previous
year 389).
B.3 Outlook The Plant Engineering segment generates its earnings towards the end of the year. We
expect to see this development this year as well.

9
C. Business Services
Name
Products Customers 1st
HY Turnover
in EUR million
Sites Employees
ASTERION Document Services Industry, Financial
Services
44.2 9 826
Cobelplast NV Packaging Food
Manufacturers
19.0 1 103
Arti Group Printed Products
and Promotional
Materials
Publishers and B2B
Customers
58.5 10 1,031
Total 121.7 20 1,960
C.1 Segment turnover and earnings Segment earnings were EUR -9.4 million (previous year EUR -11.7 million) in the first half of
2016.
C.2 Investments, depreciation and personnel changes Investments in the Business Services segment amounted to EUR 4.5 million in the first half
of 2016 (previous year EUR 1.9 million), while depreciation totalled EUR 3.8 million (previous
year EUR 4.2 million). The number of employees decreased from 2,275 to 1,960.
C.3 Outlook The heterogeneity of investments in this segment makes a view impossible.

10
Significant Events after the Reporting Date
There were no significant events affecting business after the balance sheet date.

11
Consolidated Profit and Loss Account 1 January – 30 June 2016
30 June 2016 30 June 2015
TEUR TEUR TEUR TEUR
1. Sales 359,312 372,965
2. Increase or reduction of inventories in finished -4,014 18,440
and non-finished products
3. Own work capitalized 195 5
355,493 391,409
4. Other operating income 8,489 20,226
5. Cost of materials
a) Raw materials, supplies and merchandise for resale -141,747 -160,775
b) Purchased services -36,252 -41,091
-177,999 -201,866
6. Personnel costs
a) Wages and salaries -84,153 -94,402
b) Social insurance and other charges
and benefits pensions -24,835 -28,028
-108,988 -122,429
7. Depreciation
a) Depreciation on intangible assets of the fixed assets and property, plant and equipment b) Depreciation on concern level
-9,001 -1,209
-9,945 -1,540
-10,210 -11,486
8. Other operating expenses -63,320 -66,627
9. Income from other investmensts 1,060 1,144
10. Other interest and similar income 33 184
11. Interest and similar expenses -2,012 -2,845
12. Depreciation on financial assets -36 0
13. Profit and loss on ordinary operations 2,510
7,711
14. Extraordinary income 86 65
15. Extraordinary expenses -112 -299
16. Extraordinary result -26 -234
17. Taxes on income and earnings -3,856 -3,758
18. Other taxes -1,284 -1,761
19. Total taxes -5,140 -5,519
20. Net profit / loss for the period -2,656 1,957
21. Net profit carried forward from previous year 178,234 156,013
22. Acquisition of own shares -712 -418
23. Profit relating to other shareholders -161 -44
24. Consolidated profit 174,705 157,508

12
Consolidated Balance Sheet as of 30 June 2016
Assets 30 June 2016 30 June 2015
TEUR TEUR TEUR TEUR
A. Fixed assets
I. Intangible assets
1. Patents, trademarks, licenses and similar rights 2,923 3,779
2. Goodwill 8,321 11,177
3. Advance payments 151 38
11,395 14,994
II. Property, plant & equipment
1. Land, leasehold rights and
buildings incl. buildings on leased land 66,498 82,428
2. Machinery and equipment 45,944 47,785
3. Other equipment, plant and office equipment 5,436 5,736
4. Advanced payments and construction-in-progress 6,960 9,325
124,838 145,274
III. Financial assets
1. Investments 56 32
2. Investment securities 42,068 66,735
3. Other loans 1,907 49
44,031 66,816
180,264 227,084
B. Current assets
I. Inventories
1. Raw materials and supplies 28,428 34,346
2. Work-in-progress 51,160 55,263
3. Finished products and merchandise 12,305 14,897
4. Advance payments 1,911 1,735
93,804 106,241
II. Accounts receivable and other assets
1. Receivables from trade 132,093 139,303
2. Receivables from affiliated companies 89 0
3. Other assets 35,736 44,572
167,918 183,875
III. Marketable securities
1. Other marketable securities 10,786 0
10,786 0
IV. Cash and cash equivalents and checks 137,392 126,819
409,900 416,935
C. Prepaid expenses 5,366 6,438
D. Active difference resulting from asset allocation 0 80
595,531 650,537

13
Equity and liabilities 30. Juni 2016 30. Juni 2015
TEUR TEUR TEUR TEUR
A. Equity
I. Issued capital 5,357 5,514
1. Subscribed capital 5,612 5,613
2. Nominal value of treasury stock -255 -99
II. Capital reserve 9,387 9,387
III. Revenue reserves 261 104
1. Legal reserve 6 6
2. Reserve restricted in relation to treasury stock 255 99
IV. Consolidated profit 174,704 157,508
V. Offsetting item for holdings of other shareholders 1,007 732
VI. Difference from currency translation -4,342 -2,748
186,374 170,497
B. Special reserve 1,532 1,627
C. Difference from consolidation of capital 101,572 134,113
D. Accruals
1. Accruals for pensions and similar commitments 24,116 33,328
2. Tax reserves 5,163 6,127
3. Other accruals 50,112 59,829
79,391 99,284
E. Liabilities
1. Debt due to banks 34,865 43,227
2. Advanced payments received on orders 26,389 14,030
3. Trade payables 111,263 131,683
4. Other liabilities 51,165 52,354
223,682 241,294
F. Deferred income 2,687 2,429
G. Deferred Taxes 293 1,293
595,531 650,537

14
Consolidated Statement of Cash Flows 1 January – 30 June 2016
The financial resources fund includes all cash balances and cash equivalents, provided they
are not subject to third-party claims. Effects from changes to the scope of consolidation have
been eliminated.
01.01.2016-
30.06.2016
01.01.2015-
30.06.2015
TEUR TEUR
Consolidated net income ahead of extraordinary items -2,630 2,191
Earnings proportions of minority shareholders
without-payment effective holdings 161 32
Depreciation on fixed asset items 10,210 11,486
Gains an losses of sales on fixed asset items -226 -549
Changes in accruals 1,098 3,921
Dissolution of differences from the capital consolidation -345 -213
Gains and losses from the final consolidation of group companies -3,220 -4,453
Other payment-ineffective changes 120 843
Gross cash flow 5,168 13,258
Change in inventories -962 -21,189
Change in receivables,
other assets and the rest of the assets 17,496 23,296
Changes in liabilities and the rest of total equities and liabilities -12,695 4,094
Cash flow from current operations 9,007 19,459
Payments from disposals of items of tangible fixed assets 1,042 7,730
Payments for investments in fixed assets -8,119 -9,460
Payments from disposals of items of intangible
fixed assets 12 42
Payments for investments of items of intangible
fixed assets -543 -1,280
Payments from disposals of financial assets 772 20,880
Payments for investments in fixed assets -1,841 -44,651
Currency differences in fixed assets -616 243
Payments for capital expenditure into the consolidated companies 0 0
Payments from disposals of consolidated companies 2,293 5,000
Cash flow from investment activities -7,000 -21,496
Payments for the purchaise of own shares -712 -418
Proceeds from borrowing of financial liabilities 0 11,735
Pay-outs for the financial liabilities -8,170 0
Cash flow from financing activities -8,882 11,317

15
01.01.2016-
30.06.2016
01.01.2015-
30.06.2015
TEUR TEUR
Payment-effective change of cash and cash equivalents -6,875 9,280
Net funds addition/reduction from change in scope of consolidation -1,466 -1,048
Currency differences -734 451
Cash and cash equivalents at start of the period 146,467 118,136
Cash and cash equivalents as of 30 June 137,392 126,819
Composition of cash and cash equivalents 30.06.2016 30.06.2015
TEUR TEUR
Cash-in-hand, balances with banks 137,392 126,819
Short-term marketable securities 0 0
137,392 126,819
16
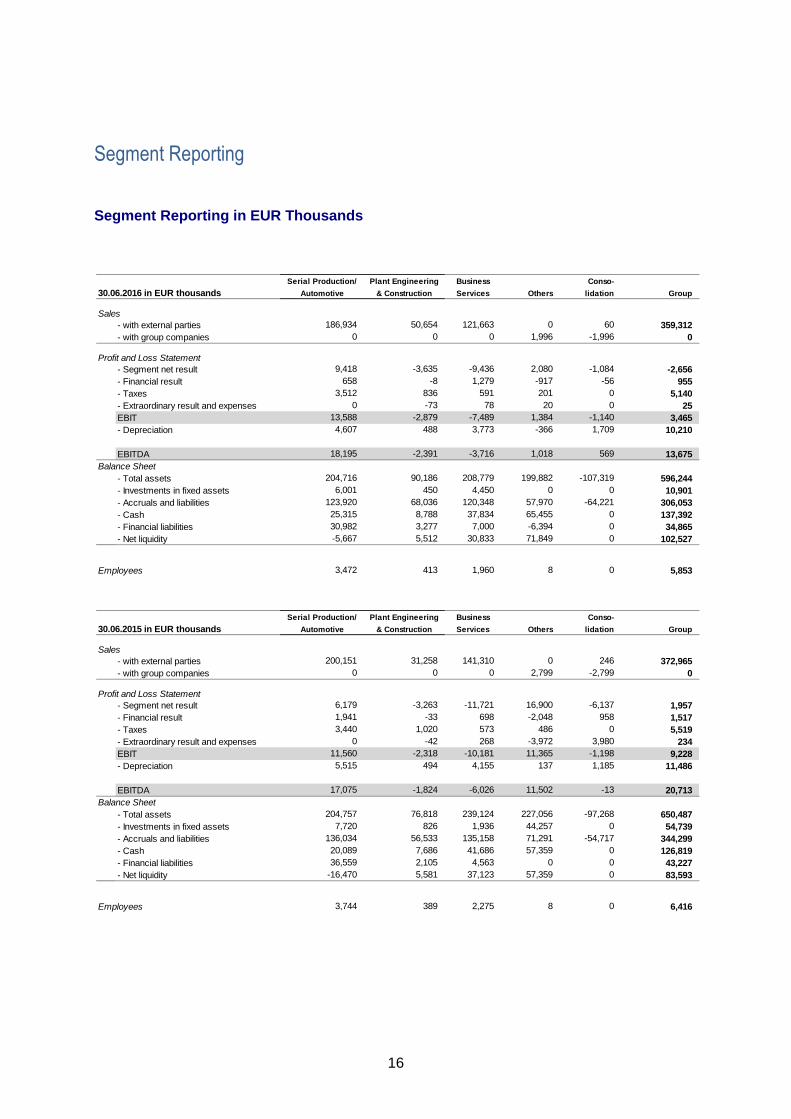
Segment Reporting Segment Reporting in EUR Thousands
Serial Production/ Plant Engineering Business Conso-
30.06.2016 in EUR thousands Automotive & Construction Services Others lidation Group
Sales
- with external parties 186,934 50,654 121,663 0 60 359,312
- with group companies 0 0 0 1,996 -1,996 0
Profit and Loss Statement
- Segment net result 9,418 -3,635 -9,436 2,080 -1,084 -2,656
- Financial result 658 -8 1,279 -917 -56 955
- Taxes 3,512 836 591 201 0 5,140
- Extraordinary result and expenses 0 -73 78 20 0 25
EBIT 13,588 -2,879 -7,489 1,384 -1,140 3,465
- Depreciation 4,607 488 3,773 -366 1,709 10,210
EBITDA 18,195 -2,391 -3,716 1,018 569 13,675
Balance Sheet
- Total assets 204,716 90,186 208,779 199,882 -107,319 596,244
- Investments in fixed assets 6,001 450 4,450 0 0 10,901
- Accruals and liabilities 123,920 68,036 120,348 57,970 -64,221 306,053
- Cash 25,315 8,788 37,834 65,455 0 137,392
- Financial liabilities 30,982 3,277 7,000 -6,394 0 34,865
- Net liquidity -5,667 5,512 30,833 71,849 0 102,527
Employees 3,472 413 1,960 8 0 5,853
Serial Production/ Plant Engineering Business Conso-
30.06.2015 in EUR thousands Automotive & Construction Services Others lidation Group
Sales
- with external parties 200,151 31,258 141,310 0 246 372,965
- with group companies 0 0 0 2,799 -2,799 0
Profit and Loss Statement
- Segment net result 6,179 -3,263 -11,721 16,900 -6,137 1,957
- Financial result 1,941 -33 698 -2,048 958 1,517
- Taxes 3,440 1,020 573 486 0 5,519
- Extraordinary result and expenses 0 -42 268 -3,972 3,980 234
EBIT 11,560 -2,318 -10,181 11,365 -1,198 9,228
- Depreciation 5,515 494 4,155 137 1,185 11,486
EBITDA 17,075 -1,824 -6,026 11,502 -13 20,713
Balance Sheet
- Total assets 204,757 76,818 239,124 227,056 -97,268 650,487
- Investments in fixed assets 7,720 826 1,936 44,257 0 54,739
- Accruals and liabilities 136,034 56,533 135,158 71,291 -54,717 344,299
- Cash 20,089 7,686 41,686 57,359 0 126,819
- Financial liabilities 36,559 2,105 4,563 0 0 43,227
- Net liquidity -16,470 5,581 37,123 57,359 0 83,593
Employees 3,744 389 2,275 8 0 6,416
17
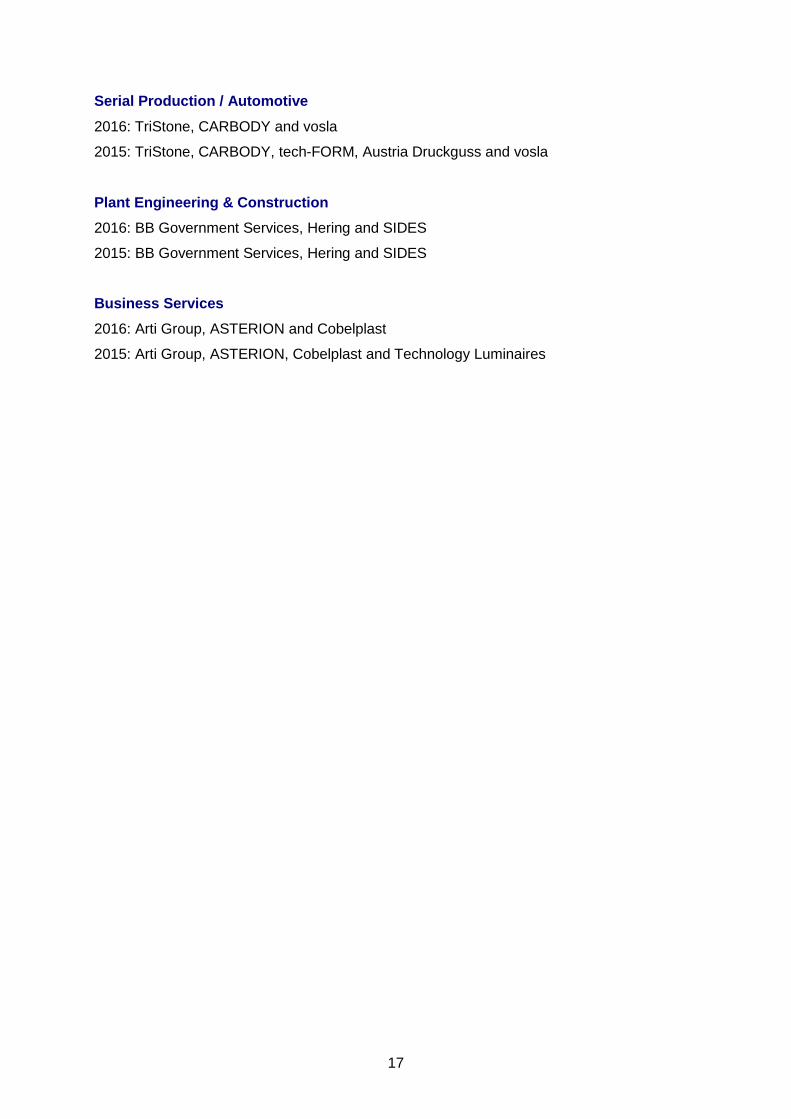
Serial Production / Automotive
2016: TriStone, CARBODY and vosla
2015: TriStone, CARBODY, tech-FORM, Austria Druckguss and vosla
Plant Engineering & Construction
2016: BB Government Services, Hering and SIDES
2015: BB Government Services, Hering and SIDES
Business Services
2016: Arti Group, ASTERION and Cobelplast
2015: Arti Group, ASTERION, Cobelplast and Technology Luminaires

18
Notes on the Half-Year Report
Balance Sheet Accounting and Valuation Methods
This half-year report was prepared in accordance with the applicable provisions of the
Handelsgesetzbuch (HGB, German Commercial Code) and has not been audited. An interim
report, its accounting principles or methods are the same as those used in the Consolidated
Group Annual Report for the fiscal year 2015.
Scope of Consolidation
This half-year report reflects all significant subsidiaries under the control of BAVARIA
Industries Group AG. Eight companies were not included in the scope of consolidation as
their inclusion was not mandatory according to the Handelsgesetzbuch (HGB German
Commercial Code).

19
Notes to Individual Balance Sheet Items
Goodwill from consolidation of capital
Development as of 30 June 2016 in EUR thousands:
Book value 31.12.2015 Addition Amortization
Final consolidation
Book value 30.06.2016
9,541 10 1,230 0 8,321 Development as of 30 June 2015 in EUR thousands:
Book value 31.12.2014 Addition Amortization
Final consolidation
Book value 30.06.2015
12,739 0 1,562 0 11,177
Subscribed capital
On 30 June 2016 subscribed capital amounted to TEUR 5,613. The calculated nominal value
of shares in circulation amounted to EUR 1.00 per share. In line with the provisions of the
Bilanzrechtsmodernisierungsgesetz (BilMoG, German Accounting Law Modernization Act),
the calculated nominal value of own shares acquired up to the key reporting date was
deducted from subscribed capital and the reserve formed in previous years for own shares
was offset against retained earnings.
Net profit carried forward from previous year
By the resolution of the Annual General Meeting on 3 June 2016 the entire balance sheet
profit from 2015 will be carried forward.
Difference from consolidation of capital (acquisition profits)
Development as of 30 June 2016 in EUR thousands:
Book value 31.12.2015 Addition Dissolution
Deconsolidation
Non-effective adaption
Book value 30.06.2016
103,522 0 0 -1,603 -347 101,572
Development as of 30 June 2015 in EUR thousands:
Book value 31.12.2014 Addition Dissolution
Deconsolidation
Non-effective adaption
Book value 30.06.2015
143,048 0 -8,722 0 -213 134,113

20
By the other operating expenses consist primarily of the income related to the investments into shares.
The other operating expenses are temporary employment, legal and travel expenses.
Other operating income 30.06.2016 30.06.2015
TEUR TEUR
Deconsolidation revenues 3,220 4,453
Dissolution of accruals and allowances 1,836 2,309
Income from the disposal of financial assets 699 4,170
Exchange rate gains on company level 138 735
Income from the disposal of assets 231 542
Rental income 97 250
Income from investment grants 67 119
Other operating income 2,201 7,648
8,489 20,226
Other operating expense 30.06.2016 30.06.2015
TEUR TEUR
Repair and maintenance 11,169 12,034
Packaging and freight 7,422 8,976
Rental expenses (buildings) 3,406 3,490
External services, insurance and contributions 3,397 4,058
Administrative expenses 3,158 3,373
Leasing and other rent 2,719 3,028
Travel expenses 2,041 2,271
Commissions 1,100 1,022
Exchange rate losses 1,064 366
Advertisement 570 733
Others 27,274 27,276
63,320 66,627
21
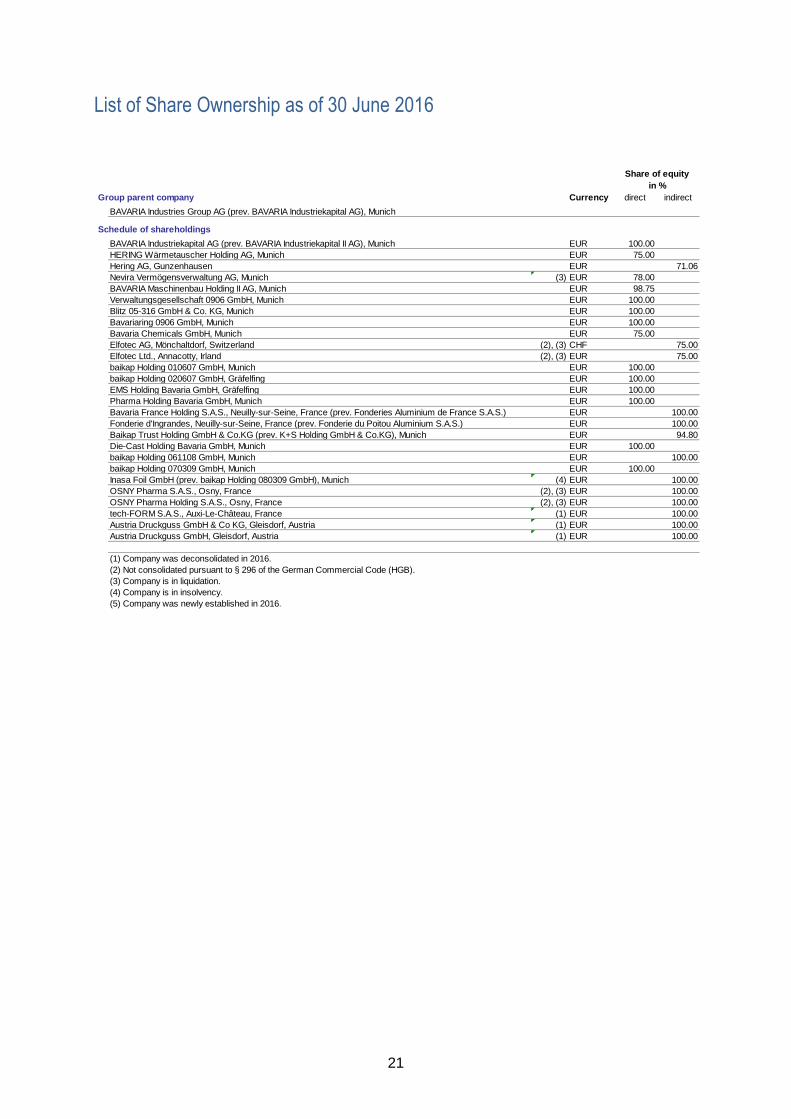
List of Share Ownership as of 30 June 2016
Group parent company Currency direct indirect
BAVARIA Industries Group AG (prev. BAVARIA Industriekapital AG), Munich
Schedule of shareholdings
BAVARIA Industriekapital AG (prev. BAVARIA Industriekapital II AG), Munich EUR 100.00
HERING Wärmetauscher Holding AG, Munich EUR 75.00
Hering AG, Gunzenhausen EUR 71.06
Nevira Vermögensverwaltung AG, Munich (3) EUR 78.00
BAVARIA Maschinenbau Holding II AG, Munich EUR 98.75
Verwaltungsgesellschaft 0906 GmbH, Munich EUR 100.00
Blitz 05-316 GmbH & Co. KG, Munich EUR 100.00
Bavariaring 0906 GmbH, Munich EUR 100.00
Bavaria Chemicals GmbH, Munich EUR 75.00
Elfotec AG, Mönchaltdorf, Switzerland (2), (3) CHF 75.00
Elfotec Ltd., Annacotty, Irland (2), (3) EUR 75.00
baikap Holding 010607 GmbH, Munich EUR 100.00
baikap Holding 020607 GmbH, Gräfelfing EUR 100.00
EMS Holding Bavaria GmbH, Gräfelfing EUR 100.00
Pharma Holding Bavaria GmbH, Munich EUR 100.00
Bavaria France Holding S.A.S., Neuilly-sur-Seine, France (prev. Fonderies Aluminium de France S.A.S.) EUR 100.00
Fonderie d'Ingrandes, Neuilly-sur-Seine, France (prev. Fonderie du Poitou Aluminium S.A.S.) EUR 100.00
Baikap Trust Holding GmbH & Co.KG (prev. K+S Holding GmbH & Co.KG), Munich EUR 94.80
Die-Cast Holding Bavaria GmbH, Munich EUR 100.00
baikap Holding 061108 GmbH, Munich EUR 100.00
baikap Holding 070309 GmbH, Munich EUR 100.00
Inasa Foil GmbH (prev. baikap Holding 080309 GmbH), Munich (4) EUR 100.00
OSNY Pharma S.A.S., Osny, France (2), (3) EUR 100.00
OSNY Pharma Holding S.A.S., Osny, France (2), (3) EUR 100.00
tech-FORM S.A.S., Auxi-Le-Château, France (1) EUR 100.00
Austria Druckguss GmbH & Co KG, Gleisdorf, Austria (1) EUR 100.00
Austria Druckguss GmbH, Gleisdorf, Austria (1) EUR 100.00
(1) Company was deconsolidated in 2016.
(2) Not consolidated pursuant to § 296 of the German Commercial Code (HGB).
(3) Company is in liquidation.
(4) Company is in insolvency.
(5) Company was newly established in 2016.
in %
Share of equity

22
Currency direct indirect
baikap Holding 090709 GmbH, Munich EUR 100.00
BAVARIA Purchasing Group GmbH (prev. baikap Holding 100709 GmbH), Munich EUR 100.00
Inasa Foil Sabiñánigo S.L. (prev. Laminados Sabiñánigo S.L.), Sabiñánigo, Huesca, Spain (2), (3) EUR 100.00
INASA Foil S.A., Irurtzun near Pamplona, Spain (2), (3) EUR 100.00
baikap Holding 110510 GmbH, Munich EUR 100.00
baikap Holding 120510 GmbH, Munich EUR 100.00
TriStone Flowtech Holding S.A.S., Carquefou, France EUR 100.00
TriStone Flowtech Slovakia spol Sro, Nová Bana, Slovakia EUR 100.00
TriStone Flowtech Poland Sp zoo, Walbrzych, Poland PLN 100.00
TriStone Flowtech France S.A.S.,Carquefou, France EUR 100.00
TriStone Flowtech Czech Republic s.r.o, Hrádek nad Nisou, Czech Republic CZK 100.00
TriStone Flowtech Istanbul Otomotive SVTLS, Çerkezköy, Turkey TRY 100.00
TriStone Flowtech Italy S.p.A., Cirié, Italy EUR 100.00
TriStone Flowtech Germany GmbH, Frankfurt on the Main EUR 100.00
TriStone Flowtech Spain S.A.U., Tarazona, Spain EUR 100.00
TriStone Flowtech Solutions SNC, Carquefou, France EUR 100.00
TriStone Flowtech Mexico S. de R.L. de C.V., Delicias, Mexico MXN 100.00
TriStone Flowtech China Ltd., Suzhou, China CNY 100.00
TriStone Flowtech USA Inc., Detroit, U.S.A. USD 100.00
baikap Holding 130810 GmbH, Munich EUR 100.00
baikap Holding 140810 GmbH, Munich EUR 100.00
baikap Holding 150911 GmbH, Munich EUR 100.00
baikap Holding 160911 GmbH, Munich EUR 100.00
Bavaria Luminaires Holding S.A.S., Nanterre, France EUR 100.00
CARBODY S.A.S., Witry-les-Reims, France EUR 100.00
CARBODY Czech Republic s.r.o., Mlada Boleslav, Czech Republic CZK 100.00
CARBODY Otomotiv Izolasyon Sistemleri Ticaret Limited Sirketi, Istanbul, Turkey TRY 100.00
Carbody Deutschland GmbH, Munich (2) EUR 100.00
vosla GmbH, Plauen EUR 100.00
vosLED GmbH, Plauen (2) EUR 100.00
ASTERION International GmbH (prev. baikap Holding 170812 GmbH), Viernheim EUR 100.00
ASTERION France S.A.S., Saint Denis, France EUR 100.00
ASTERION Direct S.A.S., Orvault, France (1) EUR 100.00
ASTERION Germany GmbH, Viernheim EUR 100.00
ASTERION Netherlands BV, Rotterdam, Netherlands EUR 100.00
ASTERION Belgium NV, Mechelen, Belgium EUR 100.00
ASTERION DM Finland Ab, Mariehamn, Finland EUR 100.00
ASTERION Sweden AB, Sollentuna, Sweden SEK 100.00
ASTERION Denmark A/S, Brøndby, Denmark DKK 100.00
ASTERION Norway AS, Oslo, Norway (1) NOK 100.00
ASTERION Italy S.r.l., Liscate, Italy EUR 100.00
baikap Holding 180812 GmbH, Munich EUR 100.00
Société Industrielle pour le Développement de la Sécurité (SIDES) S.A.S., Saint-Nazaire, France EUR 100.00
baikap Holding 190913 GmbH, Munich EUR 100.00
baikap Holding 200913 GmbH, Munich EUR 100.00
BB Government Services GmbH, Kaiserslautern EUR 100.00
BB Government Services S.r.l., Vicenza, Italy EUR 100.00
baikap Holding 210814 GmbH, Munich EUR 100.00
baikap Holding 220814 GmbH, Munich EUR 100.00
Cobelplast N.V., Lokeren, Belgium EUR 100.00
Bavaria Arti Grafiche Italiane Holding S.p.A., Bergamo, Italy EUR 100.00
Nuovo Istituto Italiano d'Arti Grafiche S.p.A., Bergamo, Italy EUR 100.00
Eurogravure S.p.A., Treviglio (Bg), Italy EUR 100.00
Arti Grafiche Johnson S.p.A., Bergamo, Italy EUR 100.00
Arti Kalendar & Promotion Service GmbH, Gütersloh EUR 100.00
Proactis Quartel S.A.S., Bussy Saint-Georges, France EUR 100.00
TAVECCHI S.r.l., Seriate (Bg), Italy EUR 100.00
Johnson Diaries Ltd., Bury St. Edmonds, Suffolk, U.K. GBP 100.00
Italoagendas S.A., Quart de Poblet (Valencia), Spain EUR 100.00
Calendars & Diaries International B.V., Breda, Netherlands EUR 100.00
Bavaria Real Estate Cirié Holding S.r.l., Cirié, Italy (5) EUR 100.00
(1) Company was deconsolidated in 2016.
(2) Not consolidated pursuant to § 296 of the German Commercial Code (HGB).
(3) Company is in liquidation.
(4) Company is in insolvency.
(5) Company was newly established in 2016.
Share of equity
in %
23
Financial Calendar
7 April 2017
Publication of Group Accounts and Individuals Accounts as of 31 December 2016.
Imprint Issuer BAVARIA Industries Group AG Bavariaring 24 80336 Munich Tel: +49 (0)89 – 72 98 967 - 0 Fax: +49 (0)89 – 72 98 967 - 10 [email protected] www.baikap.de Editor Alla Borodaenko