bayer annual report 2010
TRANSCRIPT
» Key Data
» Mission Statement
» Chairman’s Letter . . . . . . . . . . . . . . . . . . . . . . . . . . . . . . . . . . . . . . . . . . . . . . . . . . . . . . . . . . . . . . . . . . . . . . . . . . . 4
» Board of Management . . . . . . . . . . . . . . . . . . . . . . . . . . . . . . . . . . . . . . . . . . . . . . . . . . . . . . . . . . . . . . . . . . . . . . 8
» Report of the Supervisory Board . . . . . . . . . . . . . . . . . . . . . . . . . . . . . . . . . . . . . . . . . . . . . . . . . . . . . . 10
investor information » Bayer Stock and Bonds . . . . . . . . . . . . . . . . . . . . . . . . . . . . . . . . . . . . . . . . . . . . . . . . . . . . . . . . . . . . . . . . . . . 14
BaYer maGaZine» For Better Health . . . . . . . . . . . . . . . . . . . . . . . . . . . . . . . . . . . . . . . . . . . . . . . . . . . . . . . . . . . . . . . . . . . . . . . . . . 20
» For Healthier Nutrition . . . . . . . . . . . . . . . . . . . . . . . . . . . . . . . . . . . . . . . . . . . . . . . . . . . . . . . . . . . . . . . . . . . 26
» For Sustainable Products . . . . . . . . . . . . . . . . . . . . . . . . . . . . . . . . . . . . . . . . . . . . . . . . . . . . . . . . . . . . . . . . 32
» Highlights 2010 . . . . . . . . . . . . . . . . . . . . . . . . . . . . . . . . . . . . . . . . . . . . . . . . . . . . . . . . . . . . . . . . . . . . . . . . . . . . 38
» comBined manaGement reportof the BaYer Group and BaYer aG . . . . . . . . . . . . . . . . . . . . . . . . . . . . . . 44
» consolidated financial statements of the BaYer Group . . . . . . . . . . . . . . . . . . . . . . . . . . . . . . . . . . . . . . . . . . . . . . . . . . . . . . 141
further information» Governance Bodies . . . . . . . . . . . . . . . . . . . . . . . . . . . . . . . . . . . . . . . . . . . . . . . . . . . . . . . . . . . . . . . . . . . . . 256
» Organization Chart . . . . . . . . . . . . . . . . . . . . . . . . . . . . . . . . . . . . . . . . . . . . . . . . . . . . . . . . . . . . . . . . . . . . . . . 259
» Glossary . . . . . . . . . . . . . . . . . . . . . . . . . . . . . . . . . . . . . . . . . . . . . . . . . . . . . . . . . . . . . . . . . . . . . . . . . . . . . . . . . . . 260
» Index . . . . . . . . . . . . . . . . . . . . . . . . . . . . . . . . . . . . . . . . . . . . . . . . . . . . . . . . . . . . . . . . . . . . . . . . . . . . . . . . . . . . . . . 264
» Global Commitment to Sustainability . . . . . . . . . . . . . . . . . . . . . . . . . . . . . . . . . . . . . . . . . . . . . . 266
» The Bayer Group
» At Home Throughout The World
» Five-Year Financial Summary
» Financial Calendar, Masthead, Disclaimer
a n n u a l r e p o r t
2010
For direct access to a chapter, simply click on its name.
cover picture
dialoGue with partners
Bayer’s researchers maintain a constant dialogue with scientists at leading univer -sities, as well as with customers and co-operation partners. The focus of this communication is on jointly addressing questions related to tomorrow’s challenges – fully in line with our mission “Bayer: Science For A Better Life.”
In the cover picture of our Annual Report, chemist Dr. Christoph Gürtler – project manager at Bayer MaterialScience – and scientist Daniela d’Elia from RWTH Aachen University discuss how to use climate- damaging carbon dioxide as a valuable raw material for sustainable industrial produc-tion. This is the objective of the “Dream Production” project launched by Bayer and its partners in science and industry. The idea is to chemically bind CO2 and use it to partially replace conventional fossil raw materials in the manufacture of polymers. The picture shows the two researchers viewing a scanning electron micrograph of a polyurethane foam.
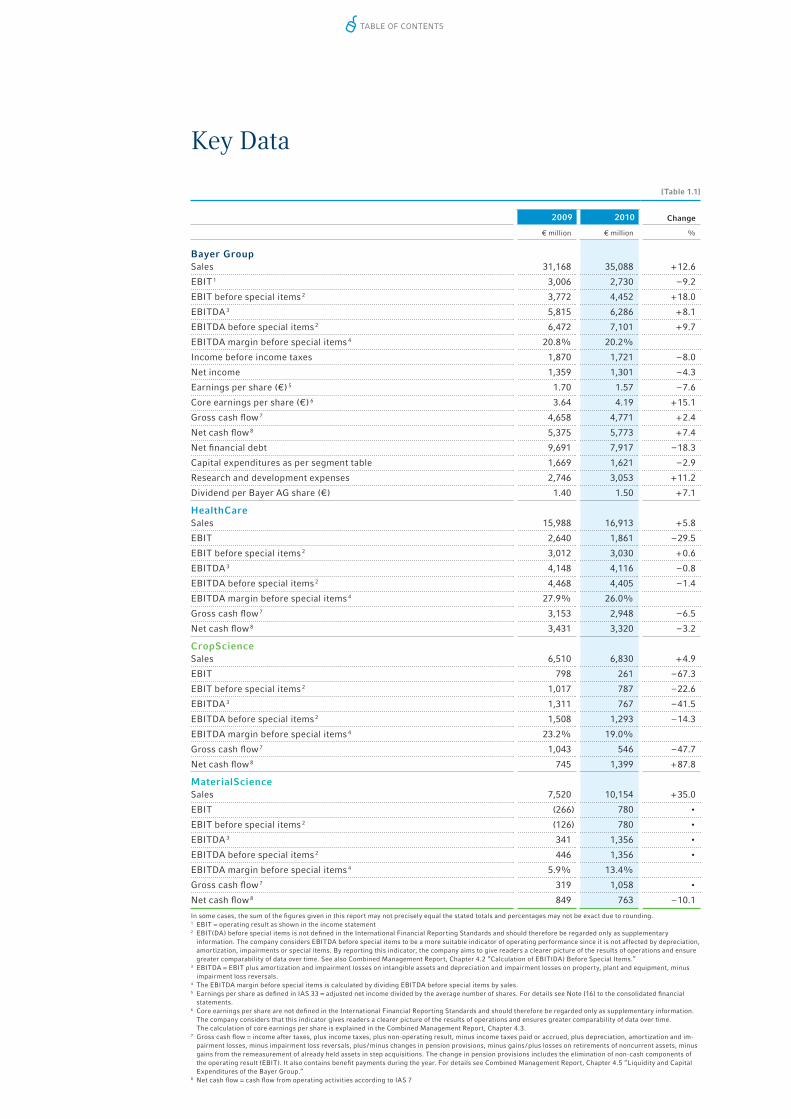
Key Data
[Table 1.1]
2009 2010 Change
€ million € million %
Bayer GroupSales 31,168 35,088 + 12.6
EBIT 1 3,006 2,730 – 9.2
EBIT before special items 2 3,772 4,452 + 18.0
EBITDA 3 5,815 6,286 + 8.1
EBITDA before special items 2 6,472 7,101 + 9.7
EBITDA margin before special items 4 20.8% 20.2%
Income before income taxes 1,870 1,721 – 8.0
Net income 1,359 1,301 – 4.3
Earnings per share (€) 5 1.70 1.57 – 7.6
Core earnings per share (€) 6 3.64 4.19 + 15.1
Gross cash ow 7 4,658 4,771 + 2.4
Net cash ow 8 5,375 5,773 + 7.4
Net nancial debt 9,691 7,917 – 18.3
Capital expenditures as per segment table 1,669 1,621 – 2.9
Research and development expenses 2,746 3,053 + 11.2
Dividend per Bayer AG share (€) 1.40 1.50 + 7.1
HealthCare Sales 15,988 16,913 + 5.8
EBIT 2,640 1,861 – 29.5
EBIT before special items 2 3,012 3,030 + 0.6
EBITDA 3 4,148 4,116 – 0.8
EBITDA before special items 2 4,468 4,405 – 1.4
EBITDA margin before special items 4 27.9% 26.0%
Gross cash ow 7 3,153 2,948 – 6.5
Net cash ow 8 3,431 3,320 – 3.2
CropScienceSales 6,510 6,830 + 4.9
EBIT 798 261 – 67.3
EBIT before special items 2 1,017 787 – 22.6
EBITDA 3 1,311 767 – 41.5
EBITDA before special items 2 1,508 1,293 – 14.3
EBITDA margin before special items 4 23.2% 19.0%
Gross cash ow 7 1,043 546 – 47.7
Net cash ow 8 745 1,399 + 87.8
MaterialScienceSales 7,520 10,154 + 35.0
EBIT (266) 780 •
EBIT before special items 2 (126) 780 •
EBITDA 3 341 1,356 •
EBITDA before special items 2 446 1,356 •
EBITDA margin before special items 4 5.9% 13.4%
Gross cash ow 7 319 1,058 •
Net cash ow 8 849 763 – 10.1
In some cases, the sum of the gures given in this report may not precisely equal the stated totals and percentages may not be exact due to rounding. 1 EBIT = operating result as shown in the income statement2 EBIT(DA) before special items is not de ned in the International Financial Reporting Standards and should therefore be regarded only as supplementary
information. The company considers EBITDA before special items to be a more suitable indicator of operating performance since it is not affected by depreciation, amortization, impairments or special items. By reporting this indicator, the company aims to give readers a clearer picture of the results of operations and ensure greater comparability of data over time. See also Combined Management Report, Chapter 4.2 “Calculation of EBIT(DA) Before Special Items.”
3 EBITDA = EBIT plus amortization and impairment losses on intangible assets and depreciation and impairment losses on property, plant and equipment, minus impairment loss reversals.
4 The EBITDA margin before special items is calculated by dividing EBITDA before special items by sales. 5 Earnings per share as de ned in IAS 33 = adjusted net income divided by the average number of shares. For details see Note [16] to the consolidated nancial
statements.6 Core earnings per share are not de ned in the International Financial Reporting Standards and should therefore be regarded only as supplementary information.
The company considers that this indicator gives readers a clearer picture of the results of operations and ensures greater comparability of data over time. The calculation of core earnings per share is explained in the Combined Management Report, Chapter 4.3.
7 Gross cash ow = income after taxes, plus income taxes, plus non-operating result, minus income taxes paid or accrued, plus depreciation, amortization and im-pairment losses, minus impairment loss reversals, plus / minus changes in pension provisions, minus gains / plus losses on retirements of noncurrent assets, minus gains from the remeasurement of already held assets in step acquisitions. The change in pension provisions includes the elimination of non-cash components of the operating result (EBIT). It also contains bene t payments during the year. For details see Combined Management Report, Chapter 4.5 “Liquidity and Capital Expenditures of the Bayer Group.“
8 Net cash ow = cash ow from operating activities according to IAS 7
000_E_17_Umschlag_innen.indd 1 26.02.11 18:46
Table of ConTenTs
Bayer: Science For A Better Life
Bayer is a global enterprise with core competencies in the fi elds of health care, nutrition and high-tech materials.
As an inventor company, we set trends in research-intensive areas. Our products and services are designed to benefi t people and improve their quality of life. At the same time we aim to create value through innovation, growth and high earning power.
We are committed to the principles of sustainable development and to our social and ethical responsibilities as a corporate citizen.
Table of ConTenTs
Bayer’s corporate culture is an important factor in the company’s success. Central to this culture are our values: Leadership, Integrity, Flexibility and Effi ciency – or life for short. They provide us with guidance for our daily work as we seek solutions to the major challenges of our time, in line with our mission “Bayer: Science For A Better Life.”
Our Values.
Table of ConTenTs

l e a d e r s h ip
f l e x ib i l i t y
in t e g r i t y
e f f i c ie n c y
• Be passionate for people and performance• Show personal drive, inspire and motivate others• Be accountable for actions and results, successes
and failures• Treat others fairly and with respect• Give clear, candid and timely feedback• Manage confl icts constructively• Create value for all our stakeholders
• Be a role model • Comply with laws, regulations and good business practices• Trust others and build trustful relationships• Be honest and reliable • Listen attentively and communicate appropriately • Ensure sustainability: balance short-term results with
long-term requirements • Care about people, safety and the environment
• Drive change actively• Be ready to adapt to future trends and needs• Challenge the status quo• Think and act with customers in mind• Seek out opportunities and take calculated risks• Be open-minded• Embrace lifelong learning
• Manage resources smartly• Focus on activities that create value• Do things simply and effectively• Deliver with appropriate costs, speed and quality• Speed up good decision-making• Be accountable for consistent execution• Collaborate for better solutions
L
I
F
E
LIFE
ou
r v
al
ue
s
Table of ConTenTs
The Bayer brand has a special charisma and is among the most famous worldwide. Around the globe, the name “Bayer” stands for innovative, high-quality products. At the same time, our brand symbolizes trust and reliability and therefore makes the company more competitive. That is why we are further raising our brand profi le by using our umbrella brand even more systematically and effectively.
Our Brand.
Table of ConTenTs
The Bayer Cross enjoys a very good reputation internationally. We fi rmly believe that our brand architecture can also help to increase the brand’s value over the long term. Following a detailed analysis, we have therefore optimized our brand portfolio. We plan to steadily reduce the number of brands used by Bayer Group companies in the future. This will strengthen our umbrella brand and improve people’s per-ception of it. Bayer products will also be more quickly and more clearly recognized as a result.
Individual units of the subgroups and service companies will no longer have independent brand presences. For example, the pharma-ceuticals business will in future be conducted
under the “Bayer HealthCare Pharma ceuticals” brand instead of “Bayer Schering Pharma.”
We will also make greater use of the Bayer brand in the future in our search for highly qualifi ed people, making our company even more attractive to potential new employees. And our approximately 111,000 em ployees worldwide will be even more convincing brand messengers.
In this way the value-creating potential of the Bayer Cross will increasingly benefi t stockhold-ers, customers and employees and enhance brand strength, brand value and Bayer’s com-petitiveness.
ou
r b
ra
nd
Table of ConTenTs

BAYER ANNUAL REPORT 20104 CHAIRMAN’S LETTER
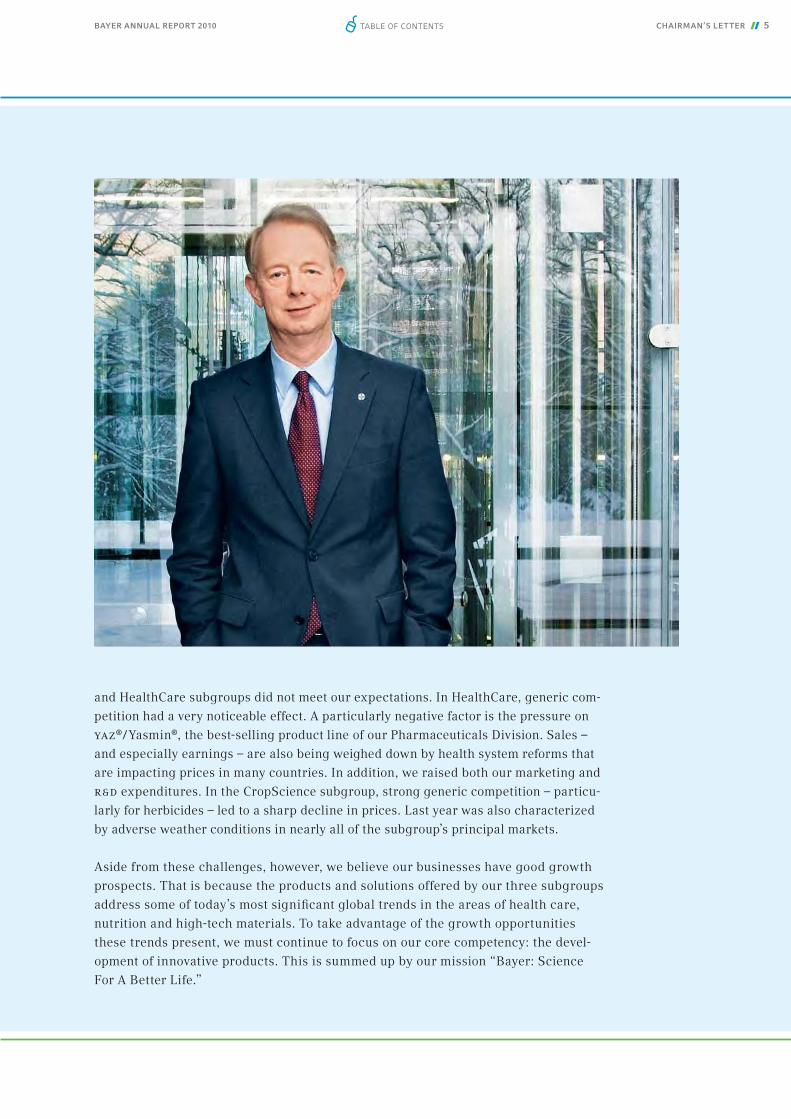
As the new Chairman of the Board of Management, I am pleased to present Bayer’s
Annual Report for 2010. First, I would like to take the opportunity to make a personal
statement: Bayer is a strong, world-class enterprise, and I am very proud to be a part of it.
We all know that my predecessor Werner Wenning rendered outstanding service to
Bayer. Until the change of leadership on October 1, 2010, I had the opportunity to work
closely with him – and I am very grateful to him for his support.
The other new members of our management team have also started their tasks with
great dedication: Sandra Peterson at the helm of Bayer CropScience, Jörg Reinhardt
at Bayer HealthCare, and of course Werner Baumann, the new Chief Financial Offi cer
of Bayer AG. We are confi dent that together with Wolfgang Plischke and Richard Pott –
our existing colleagues on the Bayer AG Board of Management – and Bayer Material-
Science Chairman Patrick Thomas, we will prove to be a strong team.
Now let’s look at fi scal 2010. Although the effects of the crisis could still be felt, the
global economy recovered surprisingly quickly from the deep recession. Total economic
output continued to grow in the second half of 2010, albeit at a slower pace.
In this environment, we raised Group sales by 12.6 percent to an all-time high of
€35.1 billion. Adjusted for currency and portfolio effects, sales advanced by 8.0 percent.
ebitda before special items came in at €7.1 billion, which means we improved our
operating performance by 9.7 percent. And with core earnings per share up by 15.1 per-
cent, we achieved the targets we communicated for 2010. We also reduced net fi nancial
debt by €1.8 billion to €7.9 billion by further increasing our operating cash fl ow.
This performance was largely due to the tremendous expertise and the hard work of
our employees, for which I would like to thank them on behalf of the entire Board of
Management.
We are facing new challenges in 2011 and beyond, however. Earnings in 2010 were
partly supported by unexpected developments. For example, the MaterialScience
subgroup returned to the pre-crisis level more quickly than anticipated, and currency
effects were also clearly in our favor. However, the performance of the CropScience
Good growth prospects for our businesses
Table of ConTenTs
BAYER ANNUAL REPORT 2010 CHAIRMAN’S LETTER 5
and HealthCare subgroups did not meet our expectations. In HealthCare, generic com-
petition had a very noticeable effect. A particularly negative factor is the pressure on
yaz® / Yasmin®, the best-selling product line of our Pharmaceuticals Division. Sales –
and especially earnings – are also being weighed down by health system reforms that
are impacting prices in many countries. In addition, we raised both our marketing and
r&d expenditures. In the CropScience subgroup, strong generic competition – particu-
larly for herbicides – led to a sharp decline in prices. Last year was also characterized
by adverse weather conditions in nearly all of the subgroup’s principal markets.
Aside from these challenges, however, we believe our businesses have good growth
prospects. That is because the products and solutions offered by our three subgroups
address some of today’s most signifi cant global trends in the areas of health care,
nutrition and high-tech materials. To take advantage of the growth opportunities
these trends present, we must continue to focus on our core competency: the devel-
opment of innovative products. This is summed up by our mission “Bayer: Science
For A Better Life.”
Table of ConTenTs
BAYER ANNUAL REPORT 20106 CHAIRMAN’S LETTER
Specifi cally, that means that in HealthCare we must continue to invest in our active-
substance pipeline and market our new products more effectively in the future. A prod-
uct that holds great promise is the anticoagulant Xarelto®. In early 2011, applications
were submitted both in Europe and the United States for marketing authorization
for stroke prevention in non-valvular atrial fi brillation. We stand by our forecast that
Xarelto® has a peak sales potential of more than €2 billion. Other examples from our
well-stocked pipeline are vegf Trap-Eye (ophthalmology), Qlaira® and yaz® Plus (gyne-
cology), AlpharadinTM and new indications for Nexavar® (both oncology), and fi nally
riociguat (cardiology).
In CropScience, too, we intend to commercialize our innovations as fast as possible.
Our r&d pipeline in the conventional crop protection segment is among the best in the
world, and we will continue investing in this area. We plan to bring six new products
to market by 2012. In addition, we aim to progress more quickly in the area of seeds
and plant traits, which also will require further funding. This is because our custom-
ers, the farmers, will increasingly be looking to purchase conventional crop protection
products and the new technologies – seeds and plant traits – as a complete package.
Bayer MaterialScience is developing many new products and applications that make
major contributions to resource effi ciency and climate protection. The fact that
Material Science generates more than 20 percent of sales with products introduced to
the market since 2005 illustrates this subgroup’s success. However, with commoditiza-
tion increasing in some parts of the portfolio, MaterialScience has a clear focus: it
must achieve cost and technology leadership. This, however, it can only do by main-
taining a high level of capital investment.
All three subgroups must continue to expand their presence in the emerging
markets, because that is where our customer industries are expanding fastest. This
demands signifi cant investment in local production and research facilities – and in
human resources development.
Thus confl icting demands are being made by the challenges facing our business and
by the need to invest in our innovative capability and in the emerging markets that
hold the key to our future growth and competitiveness. It is crucial that we set the
right course today so that we can exploit tomorrow’s opportunities.
In 2010 we already raised our research and development expenditures by 11.2 percent
to a new high of €3.1 billion – about €300 million more than in the previous year. We
expect to invest the same amount in r&d again in 2011, and will also continue to
increase our capital spending in the emerging markets.
At the same time, we must enhance our fi nancial fl exibility to make this investment
possible despite the challenges I have mentioned. As announced in November last
year, we will raise the necessary funds through a targeted transfer of resources, sup-
Table of ConTenTs
BAYER ANNUAL REPORT 2010 CHAIRMAN’S LETTER 7
ported by effi ciency and cost-containment measures. The goal here is more innovation
and less administration.
This ambitious course requires that we exercise even greater care in developing our
human resources worldwide, and that our employees understand exactly what our
company does and why. Bayer has always stood for good values – the right values.
However, we have simplifi ed these to make them a practical framework for our actions.
The result is the word life, which is directly based on our mission “Science For A
Better Life.” For us, “science” represents our status as an inventor company and our
clear commitment to research and innovation. “Life” describes our conduct toward our
stakeholders.
The “L” in life stands for “Leadership.” By this we mean the willingness to perform,
inspire and be accountable. “I” as in “Integrity” means that we balance the expecta-
tions of all stakeholders and comply with all laws and regulations without exception.
That is the only way to give our business a stable and credible foundation. The “F” in
life stands for the “Flexibility” to accept change, view it as an opportunity and adapt
accordingly. The fi nal letter is an “E” for “Effi ciency.” We aim to manage resources
smartly and do things as simply and effectively as possible.
In short, we are pursuing an evolutionary goal. We will improve our people develop-
ment and, through the effi ciency measures we have announced, create the fi nancial
headroom we need to systematically invest in our future.
With a solid post-crisis year behind us, we have created the conditions for capitalizing
on our future opportunities in the global arena. On behalf of the Board of Manage-
ment and the entire company, I would like to thank you for your trust. I hope you will
continue to support our endeavors on behalf of Bayer.
Sincerely,
DR. MARIJN DEKKERSChairman of the Board of Management of Bayer AG
Sincerely,
Table of ConTenTs
8 BOARD OF MANAGEMENT BAYER ANNUAL REPORT 2010
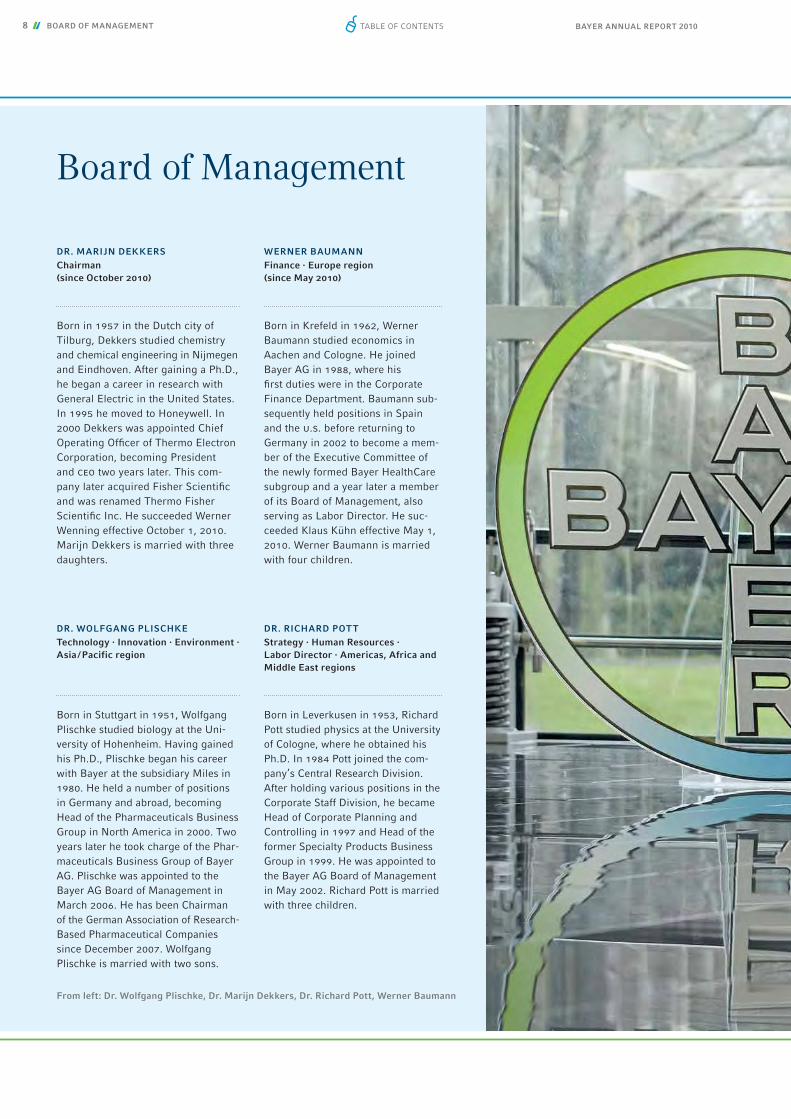
Board of Management
DR. MARIJN DEKKERSChairman(since October 2010)
Born in 1957 in the Dutch city of Tilburg, Dekkers studied chemistry and chemical engineering in Nijmegen and Eindhoven. After gaining a Ph.D., he began a career in research with General Electric in the United States. In 1995 he moved to Honeywell. In 2000 Dekkers was appointed Chief Operating Offi cer of Thermo Electron Corporation, becoming President and ceo two years later. This com-pany later acquired Fisher Scientifi c and was renamed Thermo Fisher Scientifi c Inc. He succeeded Werner Wenning effective October 1, 2010. Marijn Dekkers is married with three daughters.
WERNER BAUMANNFinance · Europe region (since May 2010)
Born in Stuttgart in 1951, Wolfgang Plischke studied biology at the Uni-versity of Hohenheim. Having gained his Ph.D., Plischke began his career with Bayer at the subsidiary Miles in 1980. He held a number of positions in Germany and abroad, becoming Head of the Pharmaceuticals Business Group in North America in 2000. Two years later he took charge of the Phar-maceuticals Business Group of Bayer AG. Plischke was appointed to the Bayer AG Board of Management in March 2006. He has been Chairman of the German Association of Research-Based Pharmaceutical Companies since December 2007. Wolfgang Plischke is married with two sons.
DR. WOLFGANG PLISCHKETechnology · Innovation · Environment · Asia / Pacific region
Born in Krefeld in 1962, Werner Baumann studied economics in Aachen and Cologne. He joined Bayer AG in 1988, where his fi rst duties were in the Corporate Finance Department. Baumann sub-sequently held positions in Spain and the u.s. before returning to Germany in 2002 to become a mem-ber of the Executive Committee of the newly formed Bayer HealthCare subgroup and a year later a member of its Board of Management, also serving as Labor Director. He suc-ceeded Klaus Kühn effective May 1, 2010. Werner Baumann is married with four children.
DR. RICHARD POTTStrategy · Human Resources · Labor Director · Americas, Africa and Middle East regions
Born in Leverkusen in 1953, Richard Pott studied physics at the University of Cologne, where he obtained his Ph.D. In 1984 Pott joined the com-pany’s Central Research Division. After holding various positions in the Corporate Staff Division, he became Head of Corporate Planning and Controlling in 1997 and Head of the former Specialty Products Business Group in 1999. He was appointed to the Bayer AG Board of Management in May 2002. Richard Pott is married with three children.
From left: Dr. Wolfgang Plischke, Dr. Marijn Dekkers, Dr. Richard Pott, Werner Baumann
Table of ConTenTs

BAYER ANNUAL REPORT 2010 BOARD OF MANAGEMENT 9Table of ConTenTs
BAYER ANNUAL REPORT 201010 REPORT OF THE SUPERVISORY BOARD
During 2010 the Supervisory Board monitored the conduct of the company’s business
by the Board of Management on a regular basis with the aid of detailed written and oral
reports received from the Board of Management, and also acted in an advisory capacity.
In addition, the Chairman of the Supervisory Board maintained a constant exchange of
information with both the Chairman of the Board of Management serving until Septem-
ber 30, 2010, and with his successor. In this way the Supervisory Board was kept contin-
uously informed about the company’s intended business strategy, corporate planning
(including fi nancial, investment and human resources planning), earnings performance,
the state of the business and the situation in the company and the Group as a whole.
The documents relating to Board of Management decisions or actions which – by law or
under the Articles of Incorporation or the rules of procedure – required the approval of
the Supervisory Board were inspected by the Supervisory Board at its plenary meetings,
sometimes after preparatory work by the committees. In certain cases the Supervisory
Board gave its approval on the basis of documents circulated to its members. The Super-
visory Board was involved in decisions of material importance to the company. We dis-
cussed at length the business trends described in the reports from the Board of Manage-
ment and the prospects for the development of the Bayer Group as a whole, the individual
organizational units and the principal affi liated companies in Germany and abroad.
Four plenary meetings of the Supervisory Board took place during 2010. No member
of the Supervisory Board attended fewer than half of its meetings. The members of the
Board of Management attended all the meetings of the Supervisory Board.
Principal topics discussed by the Supervisory BoardThe deliberations of the Supervisory Board focused on questions relating to the strate-
gies and business activities of the Group as a whole and of the subgroups. The discus-
sions at the respective meetings in 2010 centered on various topics. At the February
meeting, the Supervisory Board discussed the 2009 Annual Report and the agenda for
the 2010 Annual Stockholders’ Meeting. It also dealt at length with the Bayer Group’s
risk management system and matters related to the Board of Management’s compensa-
tion. At its September meeting, the Supervisory Board dealt mainly with the company’s
situation and strategic issues and discussed the new recommendations of the German
Corporate Governance Code. At the meeting in December 2010, the Board of Manage-
ment presented its planning for the business operations, the fi nances and the asset and
liability structure of the Bayer Group in the years 2011 through 2013. In accordance
Report of the Supervisory Board
Table of ConTenTs
BAYER ANNUAL REPORT 2010 REPORT OF THE SUPERVISORY BOARD 11
* The description of the responsibilities and membership of the committees, which forms part of the Report of the Supervisory Board, can be found in the Corporate Governance Report on page 88ff. of this Annual Report and therefore is not reproduced here.
with the new recommendation of the Corporate Governance Code with regard to the
appropriate consideration of women for membership of supervisory and management
boards, the Supervisory Board resolved at this meeting on measures to increase the
proportion of women on both boards and also resolved on the target described in the
Corporate Governance Report regarding the composition of the Supervisory Board. In
addition, the results of the audit of the Supervisory Board’s effi ciency were discussed
and amendments made to its rules of procedure. Following the December meeting, an
information and discussion forum took place on the subject of the legal basis for the
Supervisory Board’s activities.
Committees of the Supervisory BoardThe Supervisory Board has a Presidial Committee, an Audit Committee, a Human
Resources Committee and a Nominations Committee*.
Table of ConTenTs

BAYER ANNUAL REPORT 201012 REPORT OF THE SUPERVISORY BOARD
Work of the committeesIn 2010 the Presidial Committee was not required to convene in its capacity as the Media-
tion Committee under Section 27 Paragraph 3 of the German Codetermination Act, or to
make any other decisions.
The Audit Committee met four times during the year, addressing in particular the compa-
ny’s and the Group’s accounting and fi nancial reporting, the Group’s risk management sys-
tem, the internal control system and corporate compliance issues. The Audit Committee
also set the budget for the services of the external auditor and discussed with the auditor
the main areas of the audit for the 2010 fi scal year. The Chairman of the Board of Manage-
ment and the Chief Financial Offi cer regularly attended the meetings of the Audit Commit-
tee. The auditor was present at all the meetings of the Audit Committee, reporting in detail
on the audit work and the audit reviews of the interim fi nancial statements.
The meetings of the Audit Committee also dealt with a number of other topics. At the Feb-
ruary meeting, it discussed the risk report, which covered the risk management system,
planning and market risks, legal risks, corporate compliance, the report on process and
organizational risks and the internal control system, and the report by Corporate Auditing.
At this meeting it also submitted a recommendation to the full Supervisory Board con-
cerning the resolution to be put before the Annual Stockholders’ Meeting on the appoint-
ment of the auditor of the fi nancial statements. The April meeting focused on the Bayer
Group’s fi nancial management system and the Compliance Offi cer’s yearly report.
The Human Resources Committee convened on two occasions and also passed one resolu-
tion after the relevant documents had been circulated to its members. The subjects of the
meetings and of this resolution passed outside of the meetings were matters concerning the
compensation of the members of the Board of Management and their service contracts.
On one occasion in 2010, in accordance with its responsibilities, the Nominations Commit-
tee discussed possible candidates for future election to the Bayer AG Supervisory Board as
representatives of the stockholders and developed the target set by the Supervisory Board
for its composition.
The meetings and decisions of the committees, and especially the meetings of the Audit
Committee, were prepared on the basis of reports and other information provided by the
Board of Management. Reports on the committee meetings were presented at the plenary
meetings of the Supervisory Board.
Corporate GovernanceThe Supervisory Board dealt with the ongoing development of corporate governance at
Bayer, taking into account the amendments made to the German Corporate Governance
Code in May 2010. At its meeting in December, the Supervisory Board amended its own
rules of procedure in line with the new recommendations of the Code and the new statu-
tory requirements. In December 2010 the Board of Management and the Supervisory
Board issued a new declaration of compliance, which is also reproduced in the Corporate
Governance Report on page 88 of this Annual Report.
Table of ConTenTs

BAYER ANNUAL REPORT 2010 REPORT OF THE SUPERVISORY BOARD 13
Membership of the Supervisory BoardKarl-Josef Ellrich left the Supervisory Board on June 30, 2010. Roswitha Süsselbeck, an elect-
ed substitute, joined the Supervisory Board on July 1, 2010. The Supervisory Board elected
Willy Beumann to succeed Mr. Ellrich as a member of the Human Resources Committee.
Financial statements and auditsThe fi nancial statements of Bayer AG were prepared according to the requirements of the
German Commercial Code and Stock Corporations Act. The consolidated fi nancial state-
ments of the Bayer Group were prepared according to the German Commercial Code and
the International Financial Reporting Standards (ifrs). The combined management report
was prepared according to the German Commercial Code. The auditor, Pricewaterhouse-
Coopers Aktiengesellschaft, Wirtschaftsprüfungsgesellschaft, Essen, has audited the
fi nancial statements of Bayer AG, the consolidated fi nancial statements of the Bayer Group
and the combined management report. The conduct of the audit is explained in the audi-
tor’s reports. The auditor fi nds that Bayer has complied, as appropriate, with the German
Commercial Code, the German Stock Corporations Act and / or the International Financial
Reporting Standards endorsed by the European Union, and issues an unqualifi ed opinion
on the fi nancial statements of Bayer AG and the consolidated fi nancial statements of the
Bayer Group. The fi nancial statements of Bayer AG, the consolidated fi nancial statements
of the Bayer Group, the combined management report and the audit reports were submit-
ted to all members of the Supervisory Board. They were discussed in detail by the Audit
Committee and at a plenary meeting of the Supervisory Board. The auditor submitted a
report on both occasions and was present during the discussions.
We examined the fi nancial statements of Bayer AG, the proposal for distribution of the
profi t, the consolidated fi nancial statements of the Bayer Group and the combined man-
agement report. We found no objections, thus we concur with the result of the audit. We
have approved the fi nancial statements of Bayer AG and the consolidated fi nancial state-
ments of the Bayer Group prepared by the Board of Management. The fi nancial statements
of Bayer AG are thus confi rmed. We are in agreement with the combined management
report and, in particular, with the assessment of the future development of the enterprise.
We also concur with the dividend policy and the decisions concerning earnings retention
by the company. We assent to the proposal for distribution of the profi t, which provides for
payment of a dividend of €1.50 per share.
The Supervisory Board would like to thank the Board of Management and all employees
for their dedication and hard work in 2010.
Leverkusen, February 24, 2011
For the Supervisory Board:
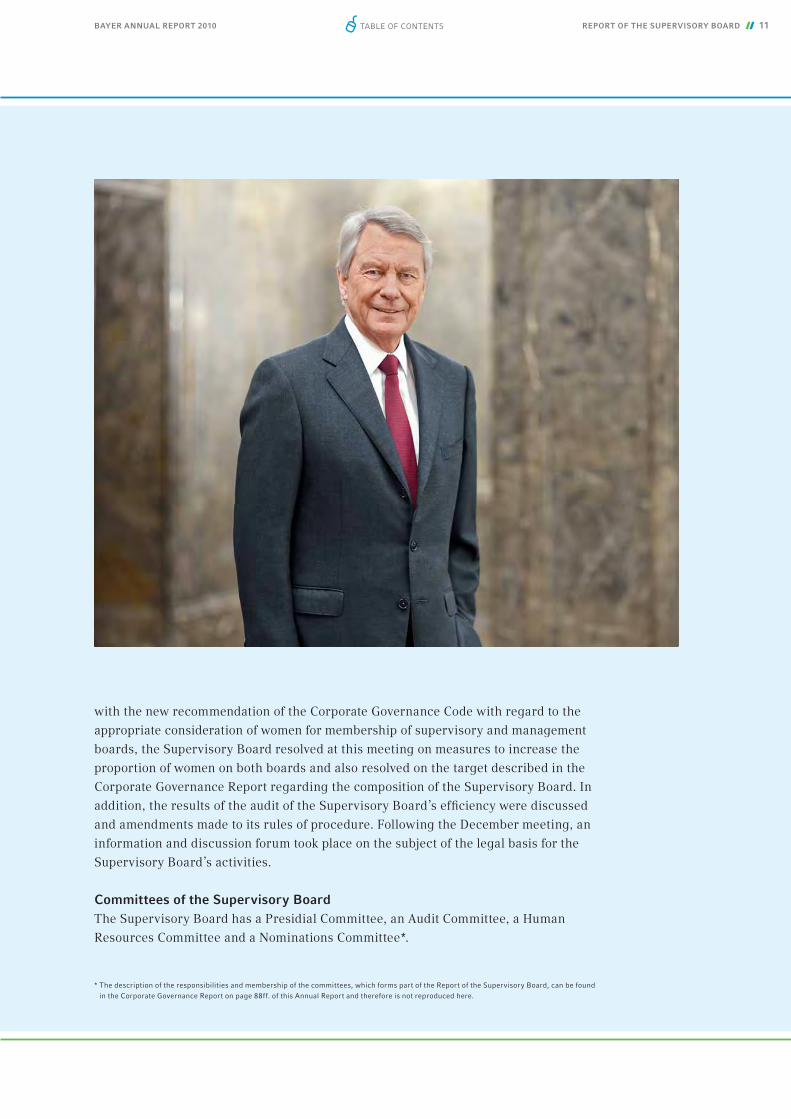
DR. MANFRED SCHNEIDER
Chairman
DR MANFRED SCHNEIDER
Table of ConTenTs
14 INVESTOR INFORMATION BAYER ANNUAL REPORT 2010
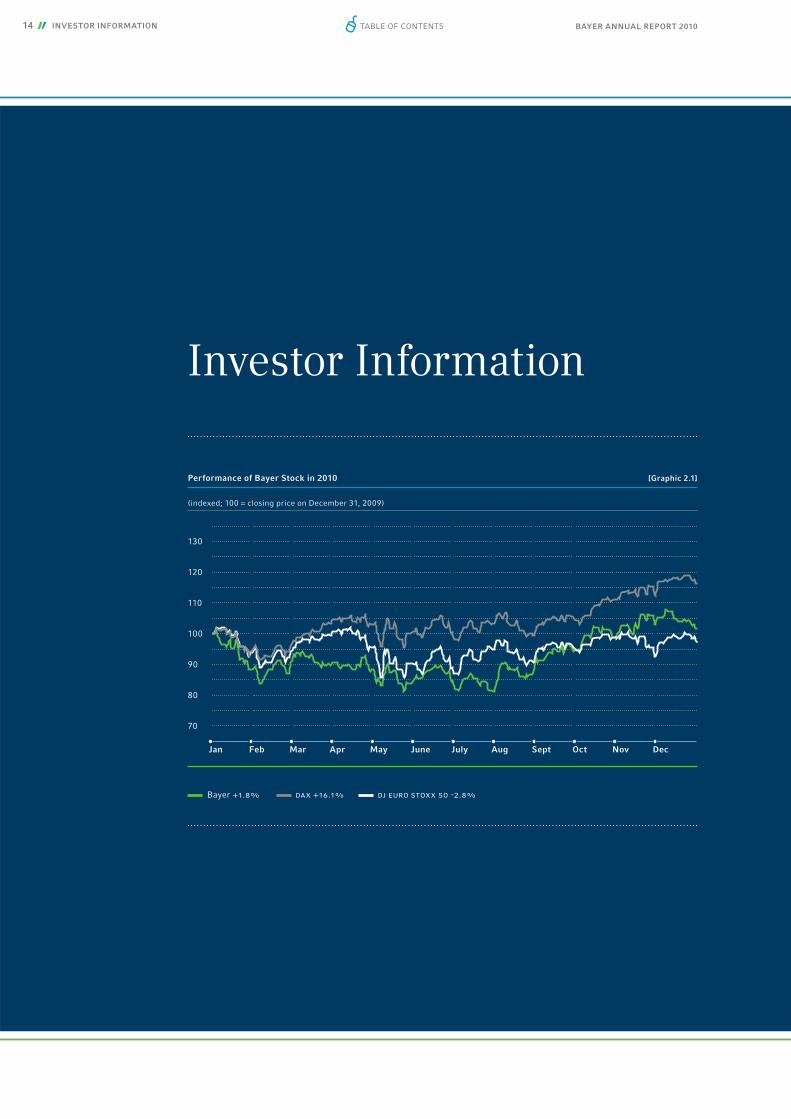
Performance of Bayer Stock in 2010 [Graphic 2.1]
130
120
110
100
90
80
70
(indexed; 100 = closing price on December 31, 2009)
Bayer +1.8% dax +16.1% dj euro stoxx 50 -2.8%
Investor Information
Jan Feb Mar Apr May June July Aug Sept Oct Nov Dec
Table of ConTenTs
BAYER ANNUAL REPORT 2010 INVESTOR INFORMATION 15
• Bayer stock performance in 2010: approx. 2 percent
• Five-year annual return: approx. 12 percent
• Board of Management and Supervisory Board propose dividend increase to €1.50 per share for 2010
Table of ConTenTs
16 INVESTOR INFORMATION BAYER ANNUAL REPORT 2010
The stock market in 2010
SIGNIFICANT MARKET RECOVERY Starting in the spring, the markets were dominated by the debate over the debt crisis in certain eurozone countries. However, thanks to the robust economic recovery in Germany the dax main-tained the upward trend that began in 2009, closing 2010 up 16 percent on the year. Following a highly volatile sideways trend in the fi rst three quarters of the year, the dax made signifi cant gains in the fourth quarter and topped 7,000 points at the beginning of December before closing the year at 6,914 points.
The European equities index euro stoxx 50 (performance index) slipped by roughly 3 percent, partly because of the problems in some countries of the European Union. Share price trends in the United States and Japan diverged, with the s&p 500 gaining some 13 percent but the Nikkei 225 losing about 3 percent.
SLIGHT IMPROVEMENT IN BAYER STOCK Including the dividend of €1.40 per share paid in May 2010, the performance of Bayer stock came to nearly 2 percent for the year. It closed 2010 at €55.30, having reached a year high of €58.62 a short time earlier. Bayer stock thus outperformed the euro stoxx 50 (performance index) for the fourth year in a row.
The trading volume in our shares receded by about 16 percent from the previous year to an average 3.6 million per day.
GOOD, STABLE CREDIT STANDING ON THE BOND MARKET The risk premium required by investors for corporate bonds with a good credit rating rose slightly in 2010. Since long-term interest rates declined during the year, Bayer’s refi nancing terms on the capital market remained favorable.
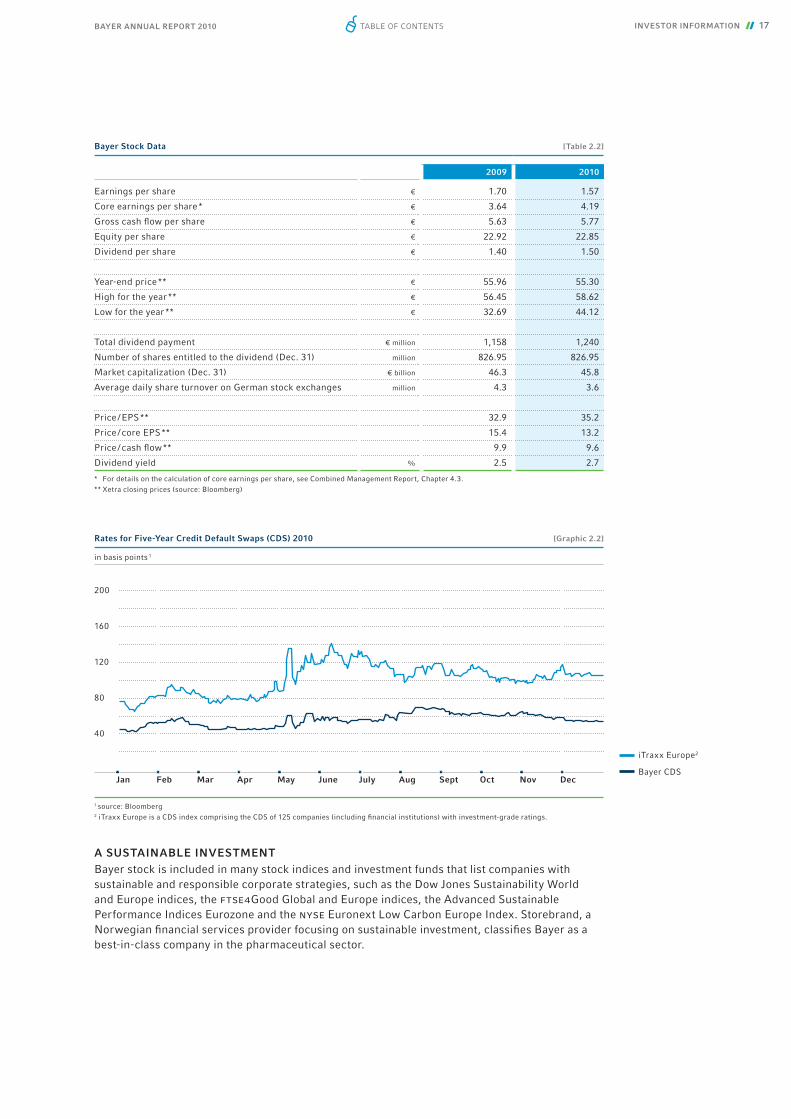
The increase in risk premiums during the year can be seen from the trend in credit default swaps (cds) shown in Graphic 2.2. The market price of these tradable insurance contracts, which are used to hedge against default of a borrower, depends on the underlying credit risk and thus helps to determine the credit margin when raising debt.
The rise in Bayer’s cds during the year was relatively moderate. Bayer utilized the favorable con-ditions on the corporate bond market to make a jpy 10 billion private placement in Japan. The company had no further refi nancing requirements in 2010. On the contrary, Bayer’s good liquidity position allowed early repayment of the remaining €885 million of the syndicated loan raised to partly fi nance the acquisition of Schering, Berlin, Germany.
A list of the bonds issued by Bayer can be found in Note [27] to the consolidated fi nancial state-ments.
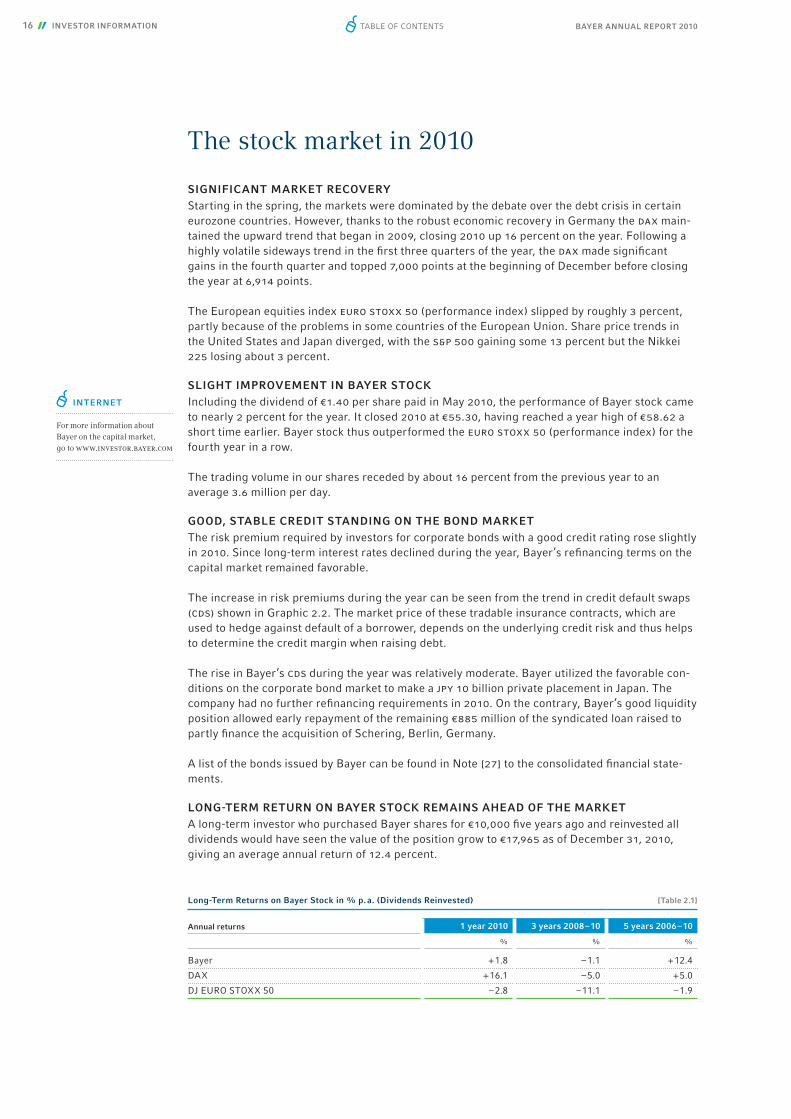
LONG-TERM RETURN ON BAYER STOCK REMAINS AHEAD OF THE MARKET A long-term investor who purchased Bayer shares for €10,000 fi ve years ago and reinvested all dividends would have seen the value of the position grow to €17,965 as of December 31, 2010, giving an average annual return of 12.4 percent.
INTERNET
For more information about Bayer on the capital market, go to www.investor.bayer.com
Long-Term Returns on Bayer Stock in % p. a. (Dividends Reinvested) [Table 2.1]
Annual returns 1 year 2010 3 years 2008 – 10 5 years 2006 – 10
% % %
Bayer + 1.8 – 1.1 + 12.4
DAX + 16.1 – 5.0 + 5.0
DJ EURO STOXX 50 – 2.8 – 11.1 – 1.9
Table of ConTenTs
BAYER ANNUAL REPORT 2010 INVESTOR INFORMATION 17
A SUSTAINABLE INVESTMENTBayer stock is included in many stock indices and investment funds that list companies with sustainable and responsible corporate strategies, such as the Dow Jones Sustainability World and Europe indices, the ftse4Good Global and Europe indices, the Advanced Sustainable Performance Indices Eurozone and the nyse Euronext Low Carbon Europe Index. Storebrand, a Norwegian fi nancial services provider focusing on sustainable investment, classifi es Bayer as a best-in-class company in the pharmaceutical sector.
Bayer Stock Data [Table 2.2]
2009 2010
Earnings per share € 1.70 1.57
Core earnings per share * € 3.64 4.19
Gross cash fl ow per share € 5.63 5.77
Equity per share € 22.92 22.85
Dividend per share € 1.40 1.50
Year-end price ** € 55.96 55.30
High for the year ** € 56.45 58.62
Low for the year ** € 32.69 44.12
Total dividend payment € million 1,158 1,240
Number of shares entitled to the dividend (Dec. 31) million 826.95 826.95
Market capitalization (Dec. 31) € billion 46.3 45.8
Average daily share turnover on German stock exchanges million 4.3 3.6
Price / EPS ** 32.9 35.2
Price / core EPS ** 15.4 13.2
Price / cash fl ow ** 9.9 9.6
Dividend yield % 2.5 2.7
* For details on the calculation of core earnings per share, see Combined Management Report, Chapter 4.3.** Xetra closing prices (source: Bloomberg)
Bayer CDS
iTraxx Europe2
Rates for Five-Year Credit Default Swaps (CDS) 2010 [Graphic 2.2]
200
160
120
80
40
1 source: Bloomberg2 iTraxx Europe is a CDS index comprising the CDS of 125 companies (including fi nancial institutions) with investment-grade ratings.
in basis points 1
Jan Feb Mar Apr May June July Aug Sept Oct Nov Dec
Table of ConTenTs
18 INVESTOR INFORMATION BAYER ANNUAL REPORT 2010
In 2010 the Carbon Disclosure Project (cdp) included Bayer in its Carbon Disclosure Leadership Index (cdli) for the sixth consecutive year. Bayer was also represented in 2010 in the newly established Carbon Performance Leadership Index (cpli), which honors detailed reporting of climate goals and strategy along with specifi c actions and achievements in emissions reduction.
Our sustainability reporting is based on the guidelines of the Global Reporting Initiative. During the year we also explained Bayer’s commitment to sustainability at numerous one-on-one meet-ings with investors and analysts.
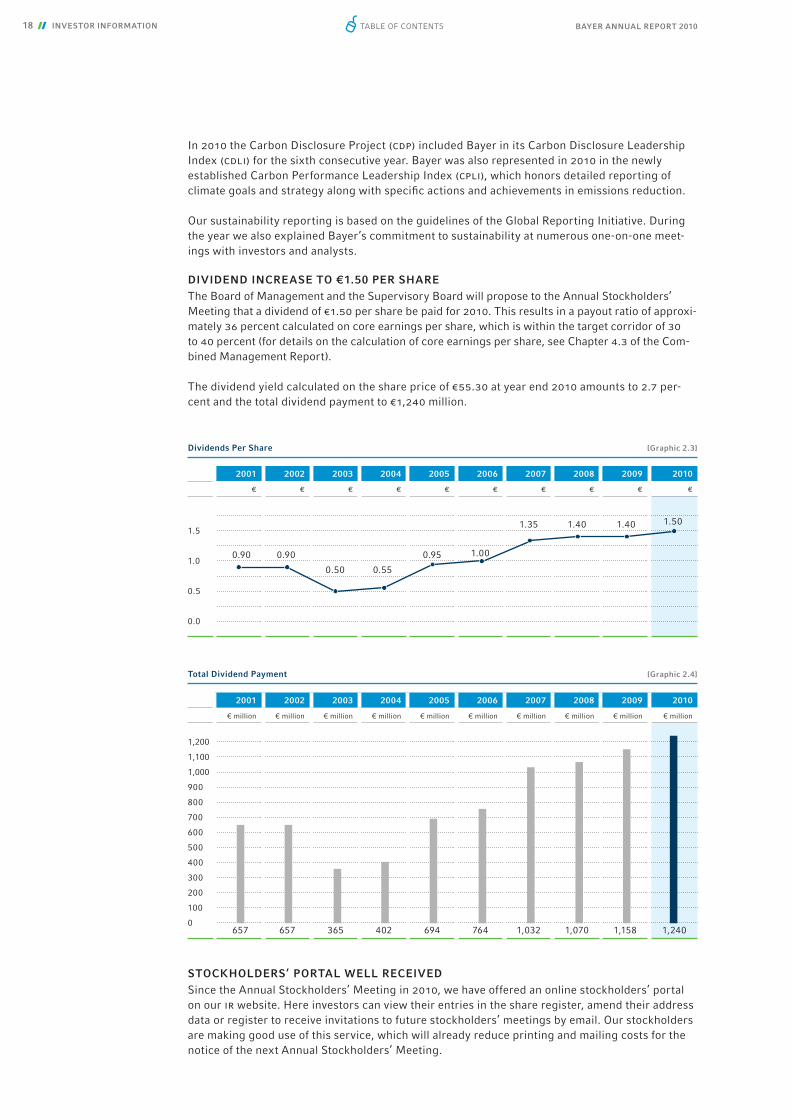
DIVIDEND INCREASE TO €1.50 PER SHAREThe Board of Management and the Supervisory Board will propose to the Annual Stockholders’ Meeting that a dividend of €1.50 per share be paid for 2010. This results in a payout ratio of approxi-mately 36 percent calculated on core earnings per share, which is within the target corridor of 30 to 40 percent (for details on the calculation of core earnings per share, see Chapter 4.3 of the Com-bined Management Report).
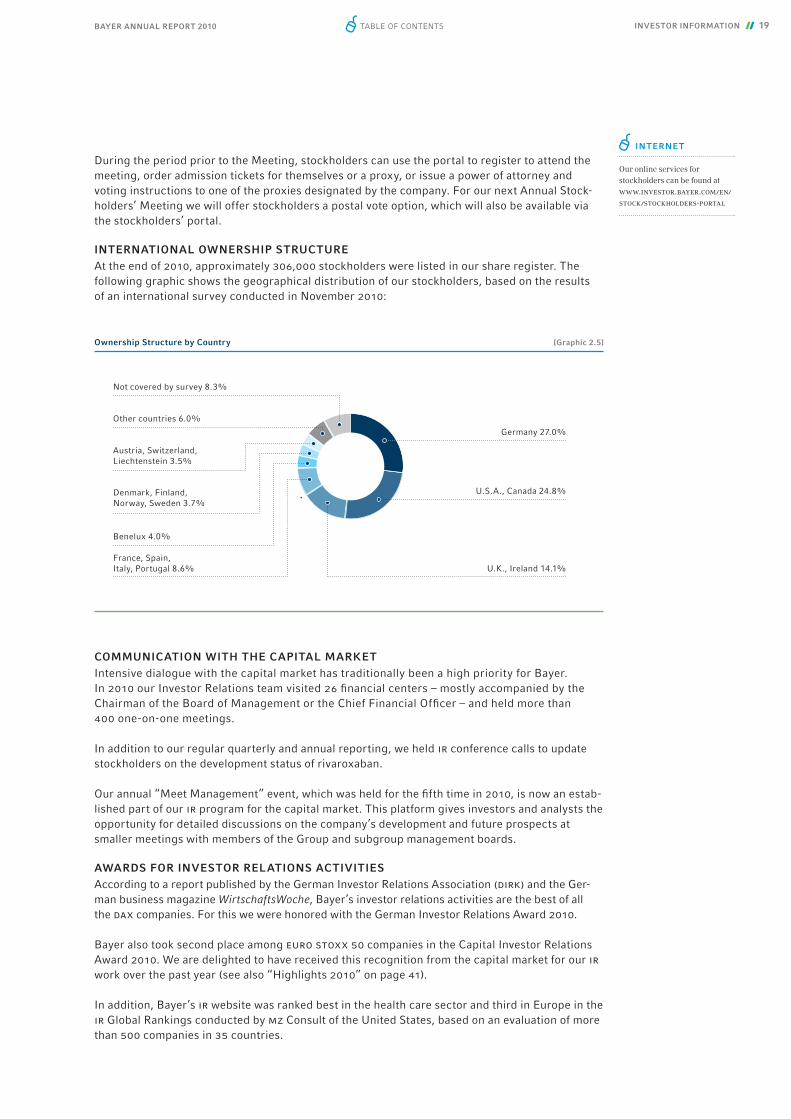
The dividend yield calculated on the share price of €55.30 at year end 2010 amounts to 2.7 per-cent and the total dividend payment to €1,240 million.
STOCKHOLDERS’ PORTAL WELL RECEIVEDSince the Annual Stockholders’ Meeting in 2010, we have offered an online stockholders’ portal on our ir website. Here investors can view their entries in the share register, amend their address data or register to receive invitations to future stockholders’ meetings by email. Our stockholders are making good use of this service, which will already reduce printing and mailing costs for the notice of the next Annual Stockholders’ Meeting.
2001 2002 2003 2004 2005 2006 2007 2008 2009 2010
€ million € million € million € million € million € million € million € million € million € million
1,200
1,100
1,000
900
800
700
600
500
400
300
200
100
0
657 657 365 402 694 764 1,032 1,070 1,158 1,240
Total Dividend Payment [Graphic 2.4]
2001 2002 2003 2004 2005 2006 2007 2008 2009 2010
€ € € € € € € € € €
1.5
1.0
0.5
0.0
1.40 1.50
Dividends Per Share [Graphic 2.3]
0.90 0.90
0.50 0.55
0.95 1.00
1.35 1.40
Table of ConTenTs
BAYER ANNUAL REPORT 2010 INVESTOR INFORMATION 19
During the period prior to the Meeting, stockholders can use the portal to register to attend the meeting, order admission tickets for themselves or a proxy, or issue a power of attorney and voting instructions to one of the proxies designated by the company. For our next Annual Stock-holders’ Meeting we will offer stockholders a postal vote option, which will also be available via the stockholders’ portal.
INTERNATIONAL OWNERSHIP STRUCTUREAt the end of 2010, approximately 306,000 stockholders were listed in our share register. The following graphic shows the geographical distribution of our stockholders, based on the resultsof an international survey conducted in November 2010:
COMMUNICATION WITH THE CAPITAL MARKETIntensive dialogue with the capital market has traditionally been a high priority for Bayer. In 2010 our Investor Relations team visited 26 fi nancial centers – mostly accompanied by the Chairman of the Board of Management or the Chief Financial Offi cer – and held more than 400 one-on-one meetings.
In addition to our regular quarterly and annual reporting, we held ir conference calls to update stockholders on the development status of rivaroxaban.
Our annual “Meet Management” event, which was held for the fi fth time in 2010, is now an estab-lished part of our ir program for the capital market. This platform gives investors and analysts the opportunity for detailed discussions on the company’s development and future prospects at smaller meetings with members of the Group and subgroup management boards.
AWARDS FOR INVESTOR RELATIONS ACTIVITIESAccording to a report published by the German Investor Relations Association (dirk) and the Ger-man business magazine WirtschaftsWoche, Bayer’s investor relations activities are the best of all the dax companies. For this we were honored with the German Investor Relations Award 2010.
Bayer also took second place among euro stoxx 50 companies in the Capital Investor Relations Award 2010. We are delighted to have received this recognition from the capital market for our ir work over the past year (see also “Highlights 2010” on page 41).
In addition, Bayer’s ir website was ranked best in the health care sector and third in Europe in the ir Global Rankings conducted by mz Consult of the United States, based on an evaluation of more than 500 companies in 35 countries.
INTERNET
Our online services for stockholders can be found at www.investor.bayer.com/en/stock/stockholders-portal
Ownership Structure by Country [Graphic 2.5]
Germany 27.0%
U.S.A., Canada 24.8%
U.K., Ireland 14.1%France, Spain, Italy, Portugal 8.6%
Benelux 4.0%
Austria, Switzerland, Liechtenstein 3.5%
Denmark, Finland, Norway, Sweden 3.7%
Other countries 6.0%
Not covered by survey 8.3%
Table of ConTenTs

“ How can we better help patients with atrial fi brillation?”
PROFESSOR ROBERT M. CALIFF (left),
Director, Translational Research Institute at Duke University, Durham, North Carolina, United States
FOR BETTER HEALTH
BAYER ANNUAL REPORT 2010
Bayer HealthCare
20 MAGAZINE Table of ConTenTs

Professor Robert M. Califf, Vice Chancellor for Clinical Research at Duke University in Durham in the u.s. state of North Carolina, and Dr. Scott D. Berkowitz, Head of the Thrombosis Group at Bayer HealthCare in the United States
MAGAZINE 21BAYER ANNUAL REPORT 2010 Table of ConTenTs

Günter Wiewinner keeps detailed records. He writes down the days on which he has to take half a tablet to prevent his blood from coagu-lating and the days when he needs to take a whole tablet. He enters the dates of his regu-lar appointments for blood tests and notes whether his coagulation level is within the target range. This punctilious record-keeping is based on pure necessity. Wiewinner has atrial fi brillation, and the tablets protect him from having a stroke. But he has to adhere to a complex schedule if they are to have the de-sired effect. The 84-year-old retiree from Münster, Germany, explains: “I take a whole tablet each day for four days in a row, then half a tablet, then a whole tablet again for three days. Then on the ninth day it’s half a tablet, and after that the cycle starts over.”
Wiewinner isn’t alone. Atrial fi brillation is one of the most common heart rhythm disorders worldwide, affecting over 2.3 million people in the United States and up to six million Europeans. Around 10 percent of the over-80 age group have this condition. Atrial fi brilla-tion is not life-threatening in itself, but pa-tients with the disorder are fi ve times more likely to suffer a stroke than the population at large. This is because in atrial fi brillation, the
two upper chambers of the heart – the atria – contract in an uncontrolled fashion instead of regularly. This allows blood to accumulate in the chambers, which in turn creates a risk of blood clots forming. If one of these thrombi fi nds its way into an artery in the brain, the person may suffer a stroke.
“Every year strokes caused by atrial fi brilla-tion take a terrible toll on the lives of millions of people and their families all over the world,” explains Professor Werner Hacke, Medical Director of the Neurology Center at Heidelberg University Hospital. Preventive administration of anticoagulant drugs can reduce the risk of a stroke, yet studies con-clude that only about 25 percent of patients with atrial fi brillation are currently receiving appropriate therapy.
The main reason for this is the limitations of the long-established coagulation-inhibiting drugs, the vitamin K antagonists. These limi-tations are what makes Wiewinner’s medica-tion schedule so complex. Like every patient who has to take vitamin K antagonists perma-nently to guard against thrombosis, he has been prescribed a personalized dosage deter-mined by his weight, age and other factors.
Thrombosis can occur without warning – and can be life-threatening. If a blood clot blocks a vessel in the brain, heart or lung, the result can be a stroke, myo-cardial infarction or pulmonary embolism. That is the background to the search by Bayer scientists for new substances to prevent and treat thrombosis.
Protecting against thrombosis
europeu.s.
More than 2.3 million Americans and nearly six million Europeans suffer from atrial fi brillation.
6million
2.3 million
BAYER ANNUAL REPORT 201022 MAGAZINE Table of ConTenTs

This is the only way to keep the medication level within the therapeutic target range, be-cause the effect of vitamin K antagonists is diffi cult to predict. If the level is too low, the drug will not be suffi ciently effective. If it is too high, the risk of bleeding increases, and that means the patient has frequent gum bleeds and bruises at the slightest impact. In rare cases internal bleeding may occur.
The patient’s blood has to be sampled daily at the start to fi nd the optimal dosage. In Wiewinner’s case it took several weeks to ad-just his medication correctly. But even when that has been done, the patient’s coagulation status still has to be determined regularly. This monitoring is important because other medications can enhance or impair the
action of vitamin K antagonists. The same applies to certain foods: spinach, broccoli or other green vegetables, for example, can only be eaten in small amounts, and strict limits apply for alcoholic beverages.
Wiewinner has all this under control. The retired vocational college instructor has drawn up a list on his computer that enables him to log his medication, coagulation levels and physician appointments. He has used his computer to help some other patients with atrial fi brillation by producing lists for them because, as he says, “It’s all very com-plicated for some people.” Wiewinner knows about this from discussions among the members of the cardiac arrhythmias self-help group in Münster.
Günter Wiewinner from Münster, Germany, suffers from atrial fi brillation. The tablets protect him from having a stroke. But he has to adhere to a complex dosage schedule if they are to have the desired effect.
“ We’re searching for an alternative to the
standard therapy – for the benefi t of patients.”
DR. SCOTT D. BERKOWITZ,
Head of the Thrombosis Group, responsible for clinical development of rivaroxaban at Bayer HealthCare in the United States
BAYER ANNUAL REPORT 2010 MAGAZINE 23Table of ConTenTs

Rivaroxaban research in Wuppertal, Germany: Bayer employee Astrid Hübner examines new test compounds.
A new class of anticoagulant drugsPhysicians are well aware of the disadvan-tages of the established drugs to protect against thrombosis and would welcome the introduction of a new class of anticoagulants. “The current standard therapy is effective but by no means ideal for either doctors or patients to use,” says Hacke. Novel medicines with a different mechanism of action could change this. One of these is rivaroxaban, a drug developed by Bayer’s researchers. The active ingredient is designed to inhibit coag-ulation factor Xa, which plays a central role in the complex blood coagulation cascade.
“With rivaroxaban there is no need for regular blood tests,” says Dr. Scott D. Berkowitz, Head of the Thrombosis Group and responsible for clinical development of
rivaroxaban at Bayer HealthCare in the Unit-ed States. “Effective prevention of thrombo-sis without the need for regular monitoring is in everyone’s interest. The latest results from the rocket af study offer hope that rivaroxaban will be a therapeutic alternative
to prevent strokes in people with non-valvu-lar atrial fi brillation.” Professor Robert M. Califf, Co-Chairman of the rocket af study Executive Committee and Vice Chancellor for Clinical Research at Duke University in Dur-ham, North Carolina, United States, agrees: “It’s exciting to have rivaroxaban as a poten-tial new therapy option.” More than 14,000 patients at around 1,100 study centers in 45 countries took part in the study.
Comprehensive development programThe rocket af study is part of the extensive clinical development program for rivaroxa-ban in which Bayer and Johnson & Johnson are investigating the substance’s potential in the prevention and therapy of a broad spectrum of acute and chronic thrombo-embolic diseases. With over 65,000 patients participating in the program, rivaroxaban is currently the most intensively researched oral, direct Factor Xa inhibitor worldwide. The active substance is approved in more than 100 countries under the brand name Xarelto® for the prevention of thrombosis following elective knee and hip replacement surgery. Xarelto® is the only new-generation anticoagulant to show consistently superior effi cacy compared with the current standard therapy enoxaparin in studies in this indica-tion. Bayer has submitted an application to the European Medicines Agency (ema) for marketing authorization for stroke preven-tion in patients with non-valvular atrial fi -brillation, and Johnson & Johnson has sub-
65,000people are taking part in the study program for
rivaroxaban, making it the most intensively researched oral, direct Factor Xa inhibitor worldwide.
BAYER ANNUAL REPORT 201024 MAGAZINE Table of ConTenTs

A blood clot in the brain can cause a stroke.
Oxygen-rich bloodfl ows through the arteries to the head
Leftatrium
Blood clot
Oxygen-rich blood from the heart
Oxygen-depleted blood to the heart
Rightatrium
Rivaroxaban is able to block a central factor in the human coagulation cascade and is thus believed to prevent unwanted thrombi that could otherwise migrate into the bloodstream and constrict blood vessels. Bayer has won various awards for the development of its anti-coagulant Xarelto® (rivaroxaban), including the 2010 Prix Galien International for the best pharmacological innovation – an honor that is equivalent in pharmaceutical research to the Nobel Prize.
In December 2009, Bayer scientists Dr. Elisa-beth Perzborn, Dr. Dagmar Kubitza and Dr. Frank Misselwitz were awarded the German Future Prize 2009, an award conferred by theFederal President for achievements in tech-nology and innovation. They donated the €250,000 prize money to a fund for a new re-search award, which Bayer then doubled to €500,000. The new prize will be endowedwith €30,000 and will be awarded every two years starting in 2011.
Prestigious awardmitted a corresponding application to the u.s. Food and Drug Administration (fda).
Rivaroxaban may also offer an option for the long-term treatment of deep vein thrombo-sis (dvt). The results from the large-scale einstein-dvt Phase iii clinical study were pre-sented last August at the annual congress of the European Society of Cardiology in Stock-holm, Sweden. The study results indicated that rivaroxaban is as effective as the current stan-dard therapy – involving enoxaparin injection followed by a vitamin K antagonist – which requires the aforementioned regular blood monitoring. Based on these results, Bayer has also submitted an application to the ema for marketing authorization for the treatment of dvt.
In the future, rivaroxaban could become avail able as a therapy option for the prevention of stroke in patients with non-valvular atrial fi brilla tion. Günter Wiewinner would be pleased to see an alternative to the current therapy. Says the retiree: “No more blood samples and just one tablet each day – that would certainly make life easier.”
BAYER ANNUAL REPORT 2010 MAGAZINE 25
ATRIAL FIBRILLATION CAN TRIGGER A STROKEA healthy heart beats 60 to 100 times per minute. In atrial fi brillation, the heart’s rhythm is impaired. Its two upper chambers – the atria – beat uncontrollably in-stead of regularly. This has an impact on the heart’s capacity to pump. As a conse-quence, blood accumulates in the atria, increasing the risk of small blood clots forming that may be squeezed out into the body with the heartbeat. If one of these blood clots travels via the main artery to the brain and blocks an artery there, the tissue can no longer be supplied with suffi cient oxygen. The result is a stroke. Tak-ing anticoagulant drugs can prevent the formation of blood clots and thereby greatly reduce the risk of stroke.
Table of ConTenTs

“ How can we improve the quality of fruit and vegetables?”
NIKOLA RICHTER (left), Product developer for salad manufacturer Bauer Funken, Kempen, Germany
FOR HEALTHIER NUTRITION
26 MAGAZINE BAYER ANNUAL REPORT 2010
Bayer CropScience
Table of ConTenTs

MAGAZINE 27BAYER ANNUAL REPORT 2010
Bayer tomato breeder Coert Engels and product developer Nikola Richter from salad manu-facturer Bauer Funken inspectan Intense® tomato in a Nunhems greenhouse in the Netherlands.
Table of ConTenTs
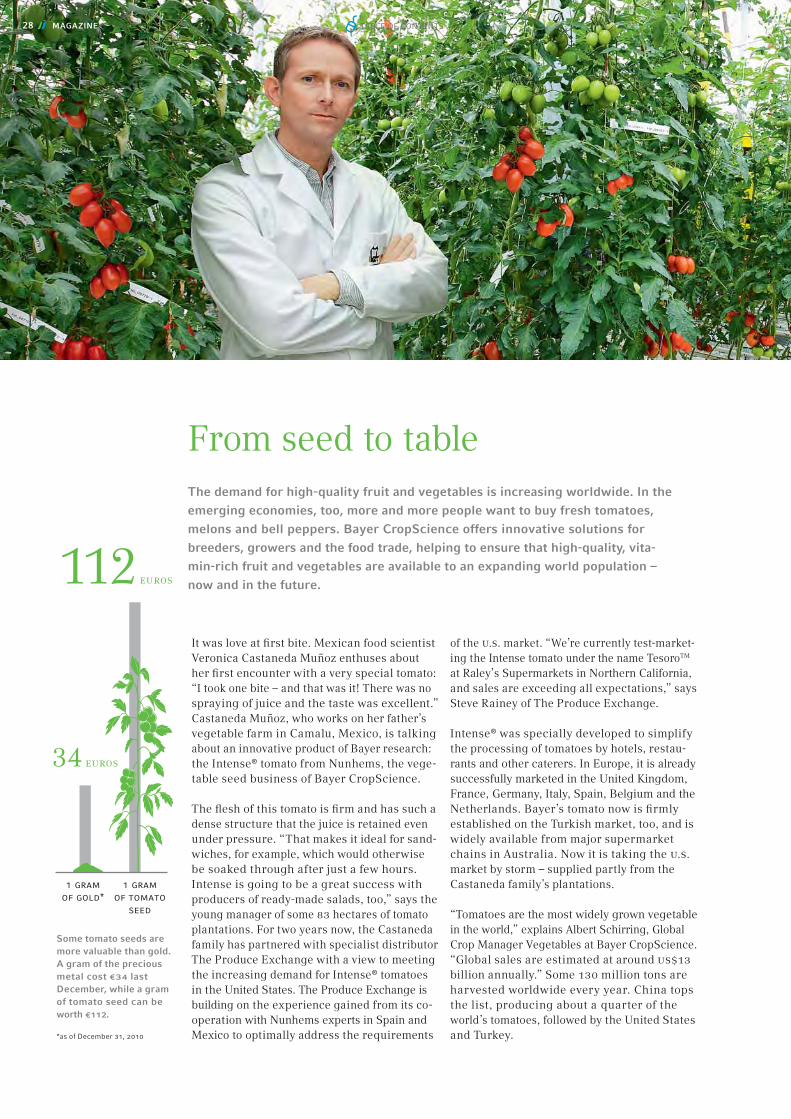
The demand for high-quality fruit and vegetables is increasing worldwide. In the emerging economies, too, more and more people want to buy fresh tomatoes, melons and bell peppers. Bayer CropScience offers innovative solutions for breeders, growers and the food trade, helping to ensure that high-quality, vita-min-rich fruit and vegetables are available to an expanding world population – now and in the future.
From seed to table
28 MAGAZINE
It was love at fi rst bite. Mexican food scientist Veronica Castaneda Muñoz enthuses about her fi rst encounter with a very special tomato: “I took one bite – and that was it! There was no spraying of juice and the taste was excellent.” Castaneda Muñoz, who works on her father’s vegetable farm in Camalu, Mexico, is talking about an innovative product of Bayer research: the Intense® tomato from Nunhems, the vege-table seed business of Bayer CropScience.
The fl esh of this tomato is fi rm and has such a dense structure that the juice is retained even under pressure. “That makes it ideal for sand-wiches, for example, which would otherwise be soaked through after just a few hours. Intense is going to be a great success with producers of ready-made salads, too,” says the young manager of some 83 hectares of tomato plantations. For two years now, the Castaneda family has partnered with specialist distributor The Produce Exchange with a view to meeting the increasing demand for Intense® tomatoes in the United States. The Produce Exchange is building on the experience gained from its co-operation with Nunhems experts in Spain and Mexico to optimally address the requirements
of the u.s. market. “We’re currently test-market-ing the Intense tomato under the name TesoroTM
at Raley’s Supermarkets in Northern California, and sales are exceeding all expectations,” says Steve Rainey of The Produce Exchange.
Intense® was specially developed to simplify the processing of tomatoes by hotels, restau-rants and other caterers. In Europe, it is already successfully marketed in the United Kingdom, France, Germany, Italy, Spain, Belgium and the Netherlands. Bayer’s tomato now is fi rmly established on the Turkish market, too, and is widely available from major supermarket chains in Australia. Now it is taking the u.s. market by storm – supplied partly from the Castaneda family’s plantations.
“Tomatoes are the most widely grown vege table in the world,” explains Albert Schirring, Global Crop Manager Vegetables at Bayer CropScience. “Global sales are estimated at around us$13 billion annually.” Some 130 million tons are harvested worldwide every year. China tops the list, producing about a quarter of the world’s tomatoes, followed by the United States and Turkey.
112 euros
1 gram of gold*
1 gram of tomato
seed
34 euros
Some tomato seeds are more valuable than gold. A gram of the precious metal cost €34 last December, while a gram of tomato seed can be worth €112.
*as of December 31, 2010
Table of ConTenTs

“ We’re looking for the best ways
to achieve optimal nutrition.”
COERT ENGELS,
tomato breeder in the Netherlands for Nunhems, Bayer CropScience’s vegetable seed business
MAGAZINE 29
Intensive research and developmentThe seed is more valuable than gold – and not just because of the high yield. It took elabo-rate research and development work to bring the Intense® tomato to market. “We use conventional breeding methods – but greatly accelerate the process,” explains Coert Engels, a tomato breeder at Nunhems. This approach, known as “integrated breeding,” draws on the results obtained by his colleagues in the research lab. The scientists take sam-ples from the leaves of new seedlings and ex-tract the genetic information from them for dna analysis. They mainly look for the genes responsible for quality, disease resistance, sweetness, shape or color.
From thousands of seedlings, they can then select those with the required properties with-out having to wait for the plants to grow and produce fruit. “We can use the results to breed tomatoes with specifi c characteristics, which saves us years of development work,” Engels
says. “We do this without introducing any foreign genes.” As well as their Intense® toma-toes, the breeders at Nunhems have also de-veloped seedless watermelons, particularly high-yielding cucumber varieties, and lettuces with a longer shelf life.
Enhanced plant traitsBoth conventional crop protection and bio-technology play a major strategic role at Bayer CropScience. Bayer’s global BioScience net-work includes some 1,000 scientists and breed ers. Activities include the Nunhems seed business, with some 2,500 traditionally bred varieties of 28 vegetable crops, and projects focusing on large-scale crops such as soybeans, canola (oilseed rape), wheat, cot-ton, rice, corn and sugarcane.
The company plans to expand its biotechnology program in the future. The aim is for sales in the BioScience business unit to double from €687 mil-lion in 2010 to around €1.4 billion by 2018.
It was love at fi rst bite: food scientist Veronica Castaneda Muñoz grows the Intense® tomato at her agricultural enter-prise Berry Veg de Baja in Mexico to supply the u.s. market.
Table of ConTenTs
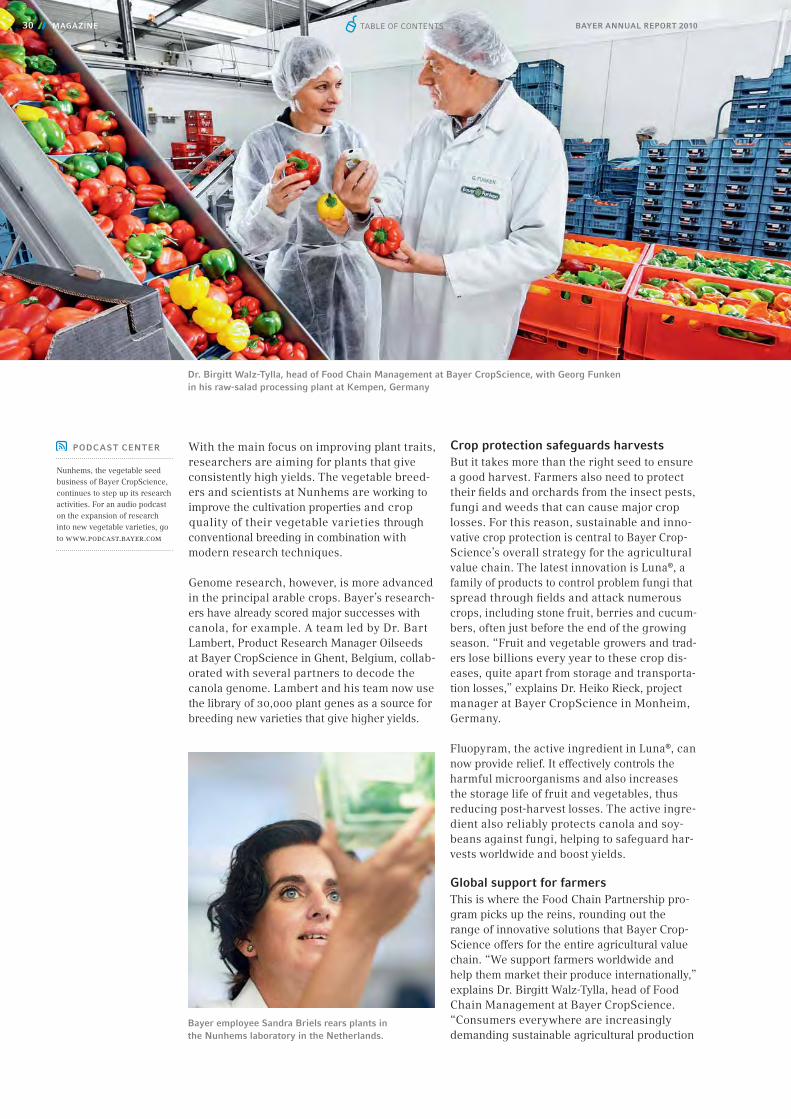
Bayer employee Sandra Briels rears plants in the Nunhems laboratory in the Netherlands.
Dr. Birgitt Walz-Tylla, head of Food Chain Management at Bayer CropScience, with Georg Funken in his raw-salad processing plant at Kempen, Germany
BAYER ANNUAL REPORT 201030 MAGAZINE
With the main focus on improving plant traits, researchers are aiming for plants that give consistently high yields. The vege table breed-ers and scientists at Nunhems are working to improve the cultivation properties and crop quality of their vegetable varieties through conventional breeding in combination with modern research techniques.
Genome research, however, is more advanced in the principal arable crops. Bayer’s research-ers have already scored major successes with canola, for example. A team led by Dr. Bart Lambert, Product Research Manager Oilseeds at Bayer CropScience in Ghent, Belgium, collab-orated with several partners to decode the canola genome. Lambert and his team now use the library of 30,000 plant genes as a source for breeding new varieties that give higher yields.
Crop protection safeguards harvestsBut it takes more than the right seed to ensure a good harvest. Farmers also need to protect their fi elds and orchards from the insect pests, fungi and weeds that can cause major crop losses. For this reason, sustainable and inno-vative crop protection is central to Bayer Crop-Science’s overall strategy for the agricultural value chain. The latest innovation is Luna®, a family of products to control problem fungi that spread through fi elds and attack numerous crops, including stone fruit, berries and cucum-bers, often just before the end of the growing season. “Fruit and vegetable growers and trad-ers lose billions every year to these crop dis-eases, quite apart from storage and transporta-tion losses,” explains Dr. Heiko Rieck, project manager at Bayer CropScience in Monheim, Germany.
Fluopyram, the active ingredient in Luna®, can now provide relief. It effectively controls the harmful microorganisms and also increases the storage life of fruit and vegetables, thus reducing post-harvest losses. The active ingre-dient also reliably protects canola and soy-beans against fungi, helping to safeguard har-vests worldwide and boost yields.
Global support for farmersThis is where the Food Chain Partnership pro-gram picks up the reins, rounding out the range of innovative solutions that Bayer Crop-Science offers for the entire agricultural value chain. “We support farmers worldwide and help them market their produce internationally,” explains Dr. Birgitt Walz-Tylla, head of Food Chain Management at Bayer CropScience. “Consumers everywhere are increasingly demanding sustainable agricultural production
PODCAST CENTER
Nunhems, the vegetable seed business of Bayer CropScience, continues to step up its research activities. For an audio podcast on the expansion of research into new vegetable varieties, go to www.podcast.bayer.com
Table of ConTenTs

BAYER ANNUAL REPORT 2010
and better-quality fruit and vegetables. They want to know where and how their food was grown.” The program was launched to pro-mote partnership right along the food chain – from producer to retailer – for the benefi t of all concerned.
Seeds, soil, water, biodiversity, climate and crop protection are all important issues for farm-ers, but a correct and sustainable post-harvest strategy – how to market carrots, leeks, cucum-bers, melons and so on – is equally vital. Bayer CropScience is so far supporting the sustain-able production of high-quality food with more than 200 projects ongoing around the globe.
In a project in the Indian state of Punjab, for example, the food chain managers have opti-mized the entire chain, from crop production to retail sale. They cooperated with the Bharti-Walmart joint venture to review all the steps in the process, from the selection of the right seeds and fertilizers to sustainable crop pro-tection, transportation and sale. “A completely new kind of trade has sprung up in India. Major domestic food retailers seeking to offer high-quality products are looking for farmers
capable of supplying this quality,” Walz-Tylla comments. By the time the project in Punjab was completed, the farmers had boosted their incomes by 35 percent and customers could buy fresher, healthier vegetables at the Bharti-Walmart food markets.
With Central American countries placing increas-ing importance on food quality and safety, the Food Chain Partnership program is also popular with vegetable experts in Mexico. For example, Mauricio Castaneda Castro – Veronica Castaneda Muñoz’s father – has devoted himself almost entirely to his work as President of the Committee for Food Quality and Food Safety in the Mexican state of Baja California for more than two years now. His daughter looks after the agricultural enterprise Berry Veg de Baja, which farms a total of 150 hectares. And Nun-hems’ most recent seed-breeding successes are also arousing the food scientist’s curiosity: one of these is “Multileaf,” a lettuce that falls into many leaves of the same size with a single cut of the knife. This and some new, crisp cucumber varieties are meeting with great in-terest from catering and hobby cooks and wholesalers in the United States.
re er aja, un-ssity: sngle
in-
Tomato A is a full-fl avor, high-yielding variety.
Tomato B has deep red color and virus resistance.
dna with the relevant gene
Combination with the best traits
1 Crossing two tomato plants to obtain the best traits
2 Cultivation of the new seedlings
3 A specimen is taken from the seedling and tested for the desired genes.
5 The new tomatois high-yielding, virus-resistant and fl avorful, and has a deep red color.
THE PERFECT TOMATOTraits in a tomato variety – such as color, yield, shape and fl avor – are determined by various genes. Using special markers, biotechnologists can identify the relevant sections of dna and create the plant’s genetic fi ngerprint. In this way they can tell at the seedling stage whether the new variety contains the desired gene for deep red color or virus resistance, for example. This saves time and money.
MAGAZINE 31
+
4 Computerizedfi ngerprintCertain sequences in the seedlings’ dna – known as snps – are associated with the genes for deep red color or virus resist-ance, for example. Com-puter analysis shows their precise location.
Table of ConTenTs

“ How can we put the climate killer CO2 to good use?”
PROFESSOR WALTER LEITNER (right),
Scientific Director of rwth Aachen University Catalytic Center
FOR SUSTAINABLE PRODUCTS
32 MAGAZINE BAYER ANNUAL REPORT 2010
Bayer MaterialScience
Table of ConTenTs
MAGAZINE 33BAYER ANNUAL REPORT 2010
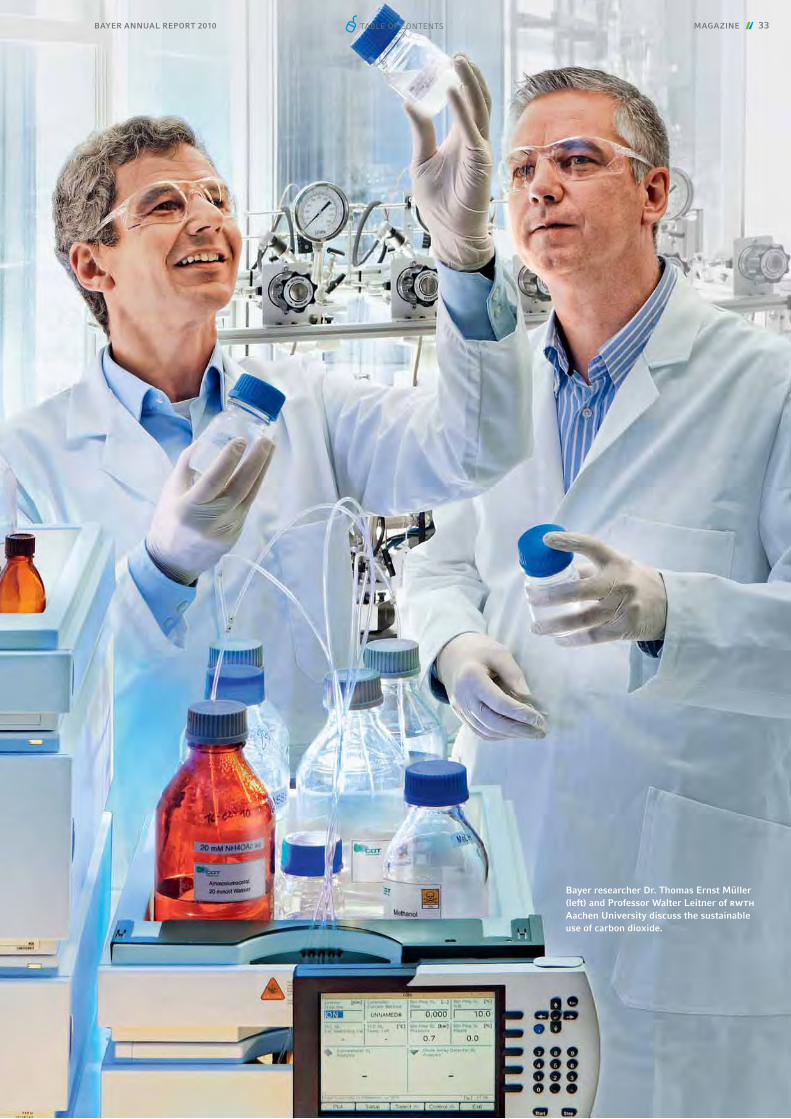
Bayer researcher Dr. Thomas Ernst Müller (left) and Professor Walter Leitner of rwth Aachen University discuss the sustainable use of carbon dioxide.
Table of ConTenTs

Ecosystems and animal species are disap-pearing, glaciers are melting and sea levels are rising. Last summer brought torrential fl ooding and extreme heatwaves. For the experts at Bayer Material Science, this under-lines the need to place climate protection at the top of the agenda.
Oil is increasingly scarce, and carbon dioxide is heating up the climate. “That’s why we’re searching for alternatives to fossil fuels and are also looking to put harmful greenhouse gases to good use,” says chemist Dr. Chris-toph Gürtler, who heads up the catalysis pro-gram at Bayer Material Science. The idea is to use climate-damaging co2 as a valuable raw material for sustainable industrial produc-tion. That’s the aim of the “Dream Produc-tion” project. Working together, researchers from Bayer Material Science, Bayer Technolo-gy Services, rwth Aachen University and rwe Power AG have developed an innovative catalytic process to harness carbon dioxide for manufacturing eco-friendly plastics.
This is particularly useful in the case of polyurethane, over twelve million tons of which are processed every year. Energy- saving polyurethane slabs insulate buildings
and refrigerators and help to reduce weight in cars. Polyurethane production using carbon dioxide is particularly sustainable. “This way we conserve valuable raw materi-als. As an organic insulating material, this plastic also saves around 70 times more en-ergy during its service life than is needed to manufacture it,” explains Gürtler.
Positive environmental balanceThe environmental balance would be even better if the energy for producing polyure-thane came from renewable sources. The amount of energy generated by wind natural-ly varies, occasionally yielding excess quan-tities of energy that could be harnessed for the production of materials such as polyure-thanes. This is the main aim of the co2rrect (co2 Reaction using Regenerative Energies and Catalytic Technologies) project, jointly launched by Bayer Technology Services,
In global terms, last year was the warmest year since weather records have been kept. The world needs climate protection. With innovative technologies and high-tech materials, Bayer is making a sustainable contribution to overcoming global challenges such as increasing energy effi ciency, protecting the climate and conserving resources.
High-tech for climate protection
85%Catalytic technology is currently employed
in the manufacture of more than 85 percent of all chemical products.
BAYER ANNUAL REPORT 201034 MAGAZINE
Total heating costs of a single-family home over 20 years: €107,000 for an unrenovated house, €21,000 for an optimally renovated house
Source: German Energy Agency
optimally renovated
unreno-vated
€21,000
€107,000
Table of ConTenTs

Bayer Material Science, rwe, Siemens and ten partners from universities and the scien-tifi c community.
“Chemical processes demand a constant energy supply,” says Dr. Alexandra Große Böwing, project manager at Bayer Technology Services. Surplus electricity could be used to produce hydrogen – itself an energy source – from water by electrolysis. “In the envisaged production process, the hydrogen produced with renewable energy would be converted using co2 into basic chemicals for manufac-turing polymers,” says Große Böwing.
A tankful of sunshinePolyurethane and other high-tech materials from Bayer also help protect the climate in other ways. “Solar Impulse,” the solar air-craft of adventurer Bertrand Piccard, is due to fl y around the world in a few years’ time, powered solely by the sun. The prototype of this solar aircraft contained more than 11,500 solar cells for generating electricity that is stored in lithium-ion batteries and used to power the aircraft at night.
On board the high-tech aircraft was a wide range of products from Bayer Material Science, including lightweight polyurethane foams in the cockpit cladding, engine cowling and wings. It also featured fi lms and upholstery elements containing Bayer raw materials. “In this way we want to show how our innovative materials can promote the use of renewable energy – and at the same time test new tech-nologies as drivers of eco-friendly mobility,” says Johannes Seesing, project manager at Bayer Material Science. The proportion of Bayer materials in the second solar aircraft could be signifi cantly higher.
“We expect to reduce the weight of the air-craft, thanks to high-tech materials and ener-gy-saving lightweight products from Bayer Material Science,” says aviation pioneer Piccard. If the fi rst circumnavigation of the globe in a solar aircraft succeeds, it would be a huge success for Solar Impulse and Bayer Material Science and would boost confi dence in the future of renewable energy sources and climate protection.
Climate-friendly construction Bayer experts aim to contribute to this with solutions for sustainable construction, as the erection and operation of buildings accounts for some 40 percent of global energy con-sumption. The essence of Bayer Material-Science’s EcoCommercial Building (ecb) pro-gram is therefore to adapt buildings to the climate and use the company’s expertise to unlock economic and ecological benefi ts.
“ We’re using waste CO2 to manufacture
high-tech plastics.”
DR. THOMAS ERNST MÜLLER,
Chemist at Bayer Material Science and Director of the Catalytic Center
BAYER ANNUAL REPORT 2010 MAGAZINE 35
Johannes Seesing and Dr. Stephanie Vogel from Bayer MaterialScience in front of a model of the solar aircraft, holding a thin Makrofol® fi lm used for the cockpit windshield
Table of ConTenTs

SOLAR POWER ON THE STADIUM ROOFThe transparent inner ring of the roof on the new Weser Stadium in Bremen, Germany, doesn’t only protect soccer fans from wind and rain: it also lets sunlight through and produces energy at the same time using lightweight solar modules from Sunovation GmbH. These are based on a sandwich construction with top and base plates made of Makrolon® from Bayer.
Special gel
Makrolon® top plate
Solar cells
Connectors
Makrolon® base plate
STRUC TURE OF THE
SOL AR MODULE
Spacers
There is great potential for energy-saving, eco-friendly building design. “Offi ces, facto-ries, hospitals and supermarkets need build-ing solutions and services that deliver last-ing improvements in energy effi ciency and eco-friendliness – improvements that boost corporate profi tability at the same time,” says Dr. Thomas Braig, Head of the ecb program for the Europe, Middle East and Africa region.
“Green buildings” are attracting growing inter-est from construction companies and investors throughout the world. But environmental pro-tection also needs to satisfy investors, which is why the ecb combines environmental with eco-nomic aspects and offers cost-effective imple-mentation that makes sustainable construction the new standard. “Although the initiative is just one year old, it has already gained a foot-hold worldwide,” says Peter Vanacker, mem-ber of the Executive Committee of Bayer Material Science and global patron of the ecb program. So far, the program has been launched in Europe, North and Central Ameri-ca, the Middle East, India, China, Southeast Asia and Japan. The Bayer network is based on the local expertise and innovative capabilities
of its member companies. “The extra invest-ment required for a building to meet sustain-ability criteria normally pays off within six to ten years,” Vanacker points out.
One member of the network is Ed. Züblin AG, which is collaborating with Bayer on the turnkey construction of energy-effi cient commercial buildings. A collaboration was agreed with the Green Hospital program of Asklepios – Europe’s largest privately-owned hospital operator – in September 2010. Bayer Material Science also intends its ecb program to contribute signifi cantly to the construction of the Masdar City clean-tech-nology cluster in the United Arab Emirates.
Soccer stadium as a power plantIntegrating photovoltaics into the architec-ture is also very important for climate-friend-ly construction. And this is where Makrolon® plastic comes in. With panels made from this Bayer polycarbonate, solar modules can be perfectly integrated into roof designs. “This can transform a soccer stadium, for example, into a power plant,” says Dr. Volker Benz, project manager for polycarbonate sheeting at Bayer Material Science. A photovoltaic
BAYER ANNUAL REPORT 201036 MAGAZINE Table of ConTenTs
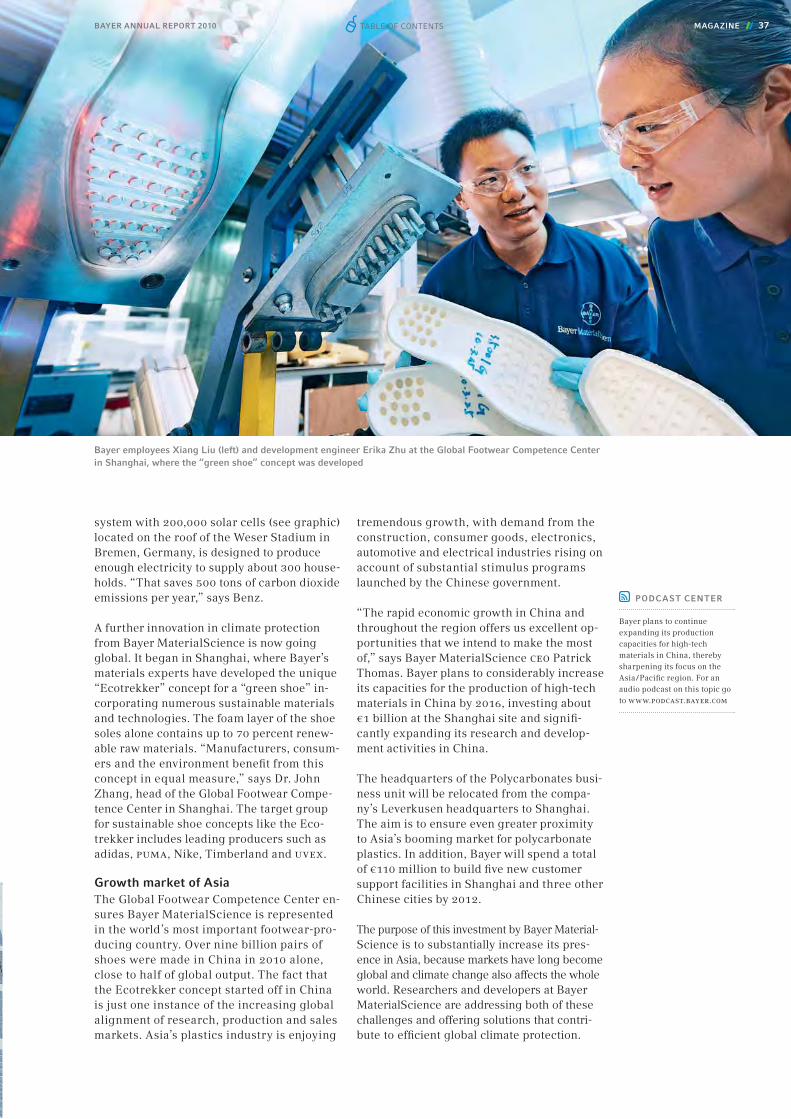
BAYER ANNUAL REPORT 2010
Bayer employees Xiang Liu (left) and development engineer Erika Zhu at the Global Footwear Competence Center in Shanghai, where the “green shoe” concept was developed
system with 200,000 solar cells (see graphic) located on the roof of the Weser Stadium in Bremen, Germany, is designed to produce enough electricity to supply about 300 house-holds. “That saves 500 tons of carbon dioxide emissions per year,” says Benz.
A further innovation in climate protection from Bayer Material Science is now going global. It began in Shanghai, where Bayer’s materials experts have developed the unique “Ecotrekker” concept for a “green shoe” in-corporating numerous sustainable materials and technologies. The foam layer of the shoe soles alone contains up to 70 percent renew-able raw materials. “Manufacturers, consum-ers and the environment benefi t from this concept in equal measure,” says Dr. John Zhang, head of the Global Footwear Compe-tence Center in Shanghai. The target group for sustainable shoe concepts like the Eco-trekker includes leading producers such as adidas, puma, Nike, Timberland and uvex.
Growth market of AsiaThe Global Footwear Competence Center en-sures Bayer Material Science is represented in the world’s most important footwear-pro-ducing country. Over nine billion pairs of shoes were made in China in 2010 alone, close to half of global output. The fact that the Ecotrekker concept started off in China is just one instance of the increasing global alignment of research, production and sales markets. Asia’s plastics industry is enjoying
tremendous growth, with demand from the construction, consumer goods, electronics, automotive and electrical industries rising on account of substantial stimulus programs launched by the Chinese government.
“The rapid economic growth in China and throughout the region offers us excellent op-portunities that we intend to make the most of,” says Bayer Material Science ceo Patrick Thomas. Bayer plans to considerably increase its capacities for the production of high-tech materials in China by 2016, investing about €1 billion at the Shanghai site and signifi -cantly expanding its research and develop-ment activities in China.
The headquarters of the Polycarbonates busi-ness unit will be relocated from the compa-ny’s Leverkusen headquarters to Shanghai. The aim is to ensure even greater proximity to Asia’s booming market for polycarbonate plastics. In addition, Bayer will spend a total of €110 million to build fi ve new customer support facilities in Shanghai and three other Chinese cities by 2012.
The purpose of this investment by Bayer Material-Science is to substantially increase its pres-ence in Asia, because markets have long become global and climate change also affects the whole world. Researchers and d evelopers at Bayer Material Science are addressing both of these challenges and offering solutions that contri-bute to effi cient global climate protection.
PODCAST CENTER
Bayer plans to continue expanding its production capacities for high-tech materials in China, thereby sharpening its focus on the Asia / Pacifi c region. For an audio podcast on this topic go to www.podcast.bayer.com
MAGAZINE 37Table of ConTenTs
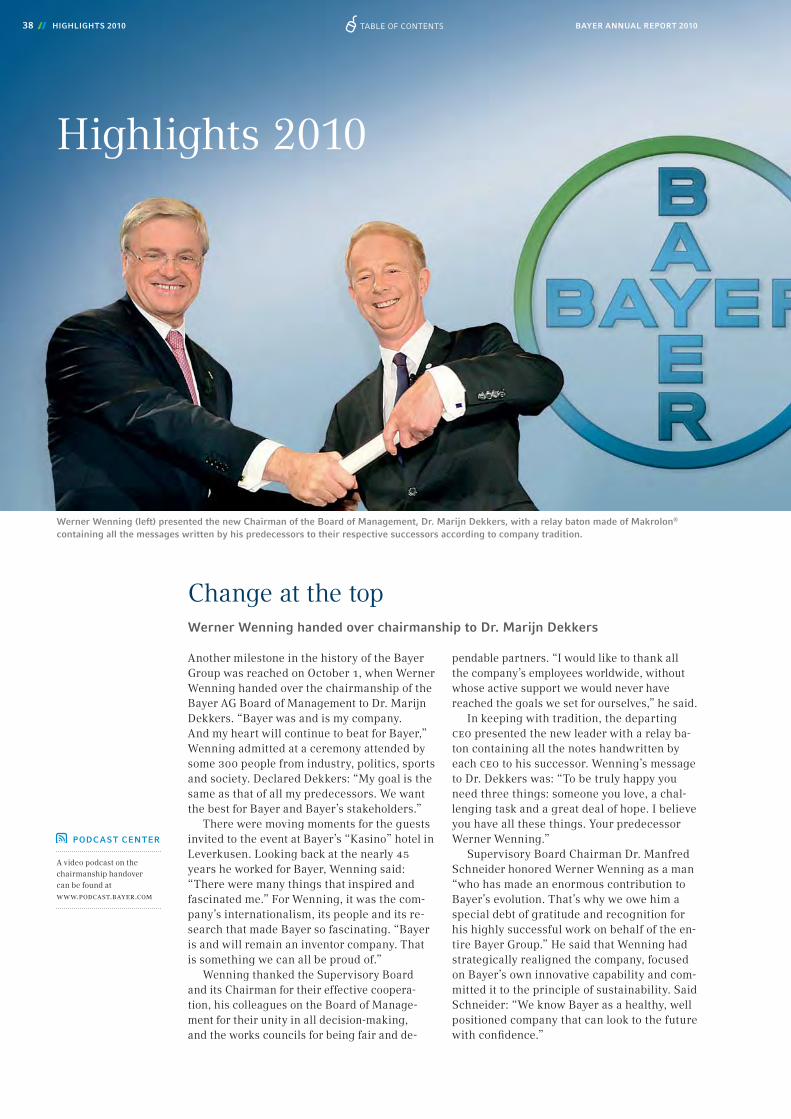
Another milestone in the history of the Bayer Group was reached on October 1, when Werner Wenning handed over the chairmanship of the Bayer AG Board of Management to Dr. Marijn Dekkers. “Bayer was and is my company. And my heart will continue to beat for Bayer,” Wenning admitted at a ceremony attended by some 300 people from industry, politics, sports and society. Declared Dekkers: “My goal is the same as that of all my predecessors. We want the best for Bayer and Bayer’s stakeholders.”
There were moving moments for the guests invited to the event at Bayer’s “Kasino” hotel in Leverkusen. Looking back at the nearly 45 years he worked for Bayer, Wenning said: “There were many things that inspired and fascinated me.” For Wenning, it was the com-pany’s internationalism, its people and its re-search that made Bayer so fascinating. “Bayer is and will remain an inventor company. That is something we can all be proud of.”
Wenning thanked the Supervisory Board and its Chairman for their effective coopera-tion, his colleagues on the Board of Manage-ment for their unity in all decision-making, and the works councils for being fair and de-
pendable partners. “I would like to thank all the company’s employees worldwide, without whose active support we would never have reached the goals we set for ourselves,” he said.
In keeping with tradition, the departing ceo presented the new leader with a relay ba-ton containing all the notes handwritten by each ceo to his successor. Wenning’s message to Dr. Dekkers was: “To be truly happy you need three things: someone you love, a chal-lenging task and a great deal of hope. I believe you have all these things. Your predecessor Werner Wenning.”
Supervisory Board Chairman Dr. Manfred Schneider honored Werner Wenning as a man “who has made an enormous contribution to Bayer’s evolution. That’s why we owe him a special debt of gratitude and recognition for his highly successful work on behalf of the en-tire Bayer Group.” He said that Wenning had strategically realigned the company, focused on Bayer’s own innovative capability and com-mitted it to the principle of sustainability. Said Schneider: “We know Bayer as a healthy, well positioned company that can look to the future with confi dence.”
Change at the topWerner Wenning handed over chairmanship to Dr. Marijn Dekkers
PODCAST CENTER
A video podcast on the chairmanship handover can be found at www.podcast.bayer.com
Werner Wenning (left) presented the new Chairman of the Board of Management, Dr. Marijn Dekkers, with a relay baton made of Makrolon® containing all the messages written by his predecessors to their respective successors according to company tradition.
Highlights 2010
BAYER ANNUAL REPORT 201038 HIGHLIGHTS 2010 Table of ConTenTs

BAYER ANNUAL REPORT 2010 HIGHLIGHTS 2010 39
“The big 5” in Dubai. Successfully introduced in key markets of Europe, the United States and China, this network for sustainable construction supports decision-makers in imple-menting environmentally friendly, energy-saving projects – from the passive house to zero-emissions buildings with increased user com-fort and lower life-cycle costs. The initiative complements the efforts of regional governments to promote sustainable development by focusing on energy-effi cient buildings (see page 35f.).
“Energy effi ciency in buildings is one of the most effective levers in tackling greenhouse gas emissions and ensuring that scarce resources – from fossil fuels to water – are usedmore sparingly,” said Stephan Rosen-thal, Managing Director of Bayer Middle East, at the launch event.
Support for sustainable development in the Middle East
methods – Bayer HealthCare is concen-trating mainly on antibodies, coagula -tion factors and other therapeutic pro-teins. “This enhances our ability to offer new drugs to treat serious diseases such as cancer,” said Professor Andreas Busch, member of the Bayer HealthCare Executive Committee. In the past few
years, the company has steadily added to its expertise in biologicals research. “The new facility center enlarges our production capacities so that we can manufacture a larger number of poten-tial active ingredients in suffi cient quan-tities even for the late stages of clinical development,” said Busch.
In another major step toward fi ghting serious diseases such as cancer, Bayer HealthCare is building a new facility center in Wuppertal, occupying an area of more than 1,000 square meters, for the biotechnological production of pharmaceutical substances used in clinical trials. The €35 million invest-ment in this center will enable Bayer to expand its competencies in the area of biological products.
“For a research-based pharma-ceutical and chemical company like Bayer, innovation is the key to future growth. The new cell biology facility center represents an investment in our long-term success. Wuppertal pro-vides the right conditions for these ac-tivities,” said Dr. Wolfgang Plischke, the member of the Bayer AG Board of Management responsible for Technol-ogy, Innovation and Environment, at the groundbreaking ceremony in the city’s pharmaceutical and chemical park. The center is due to start operat-ing in late 2012.
In the area of Biologicals – medicines manufactured by biotechnological
A development laboratory for biological active substances at Bayer HealthCare in Wuppertal, Germany
Bayer HealthCare expands competencies in biologicals
Bayer CropScience has received the fi rst registration for its new herbicidal active ingredient indazifl am. The product will be launched in the United States in 2011 under the brand name SpecticleTM for professional users in the turf segment. It is planned to introduce it later in the ornamentals and indus-trial vegetation management segments as well.
Bayer CropScience also plans to offer do-it-yourself gardeners a range of indazifl am-based products under the Bayer AdvancedTM brand. “Registration in the u.s. paves the way for the global use of indazifl am as the new base herbicide Alion in crops such as fruits, vines, nuts, citrus, olives and sugar-cane,” said Dr. Rüdiger Scheitza, mem-ber of the Board of Management of Bayer CropScience. The company anticipates global annual peak sales potential of more than €150 million for products based on indazifl am.
Pioneering active ingredient for weed control
Masdar City in the United Arab Emirates is intended to be the fi rst climate-neutral city.
Bayer’s “EcoCommercial Building Program” has now been launched in the Middle East as well. This was announced by Bayer MaterialScience at the construction industry fair
Table of ConTenTs
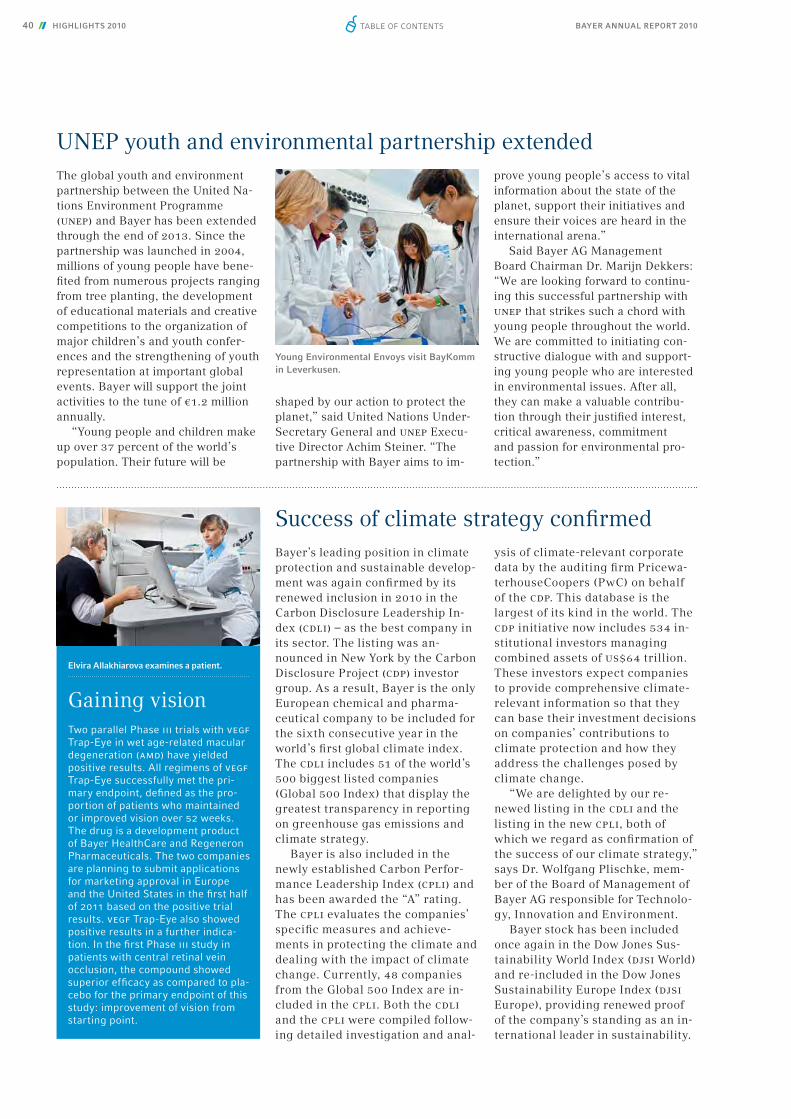
BAYER ANNUAL REPORT 201040 HIGHLIGHTS 2010
Two parallel Phase iii trials with vegf Trap-Eye in wet age-related macular degeneration (amd) have yielded positive results. All regimens of vegf Trap-Eye successfully met the pri-mary endpoint, defi ned as the pro-portion of patients who maintained or improved vision over 52 weeks. The drug is a development product of Bayer HealthCare and Regeneron Pharmaceuticals. The two companies are planning to submit applications for marketing approval in Europe and the United States in the fi rst half of 2011 based on the positive trial results. vegf Trap-Eye also showed positive results in a further indica-tion. In the fi rst Phase iii study in patients with central retinal vein occlusion, the compound showed superior effi cacy as compared to pla-cebo for the primary endpoint of this study: improvement of vision from starting point.
Gaining vision
Young Environmental Envoys visit BayKomm in Leverkusen.
Bayer’s leading position in climate protection and sustainable develop-ment was again confi rmed by its renewed inclusion in 2010 in the Carbon Disclosure Leadership In-dex (cdli) – as the best company in its sector. The listing was an-nounced in New York by the Carbon Disclosure Project (cdp) investor group. As a result, Bayer is the only European chemical and pharma-ceutical company to be included for the sixth consecutive year in the world’s fi rst global climate index. The cdli includes 51 of the world’s 500 biggest listed companies (Global 500 Index) that display the greatest transparency in reporting on greenhouse gas emissions and climate strategy.
Bayer is also included in the new ly established Carbon Perfor-mance Leadership Index (cpli) and has been awarded the “A” rating. The cpli evaluates the companies’ specifi c measures and achieve-ments in protecting the climate and dealing with the impact of climate change. Currently, 48 companies from the Global 500 Index are in-cluded in the cpli. Both the cdli and the cpli were compiled follow-ing detailed investigation and anal-
ysis of climate-relevant corporate data by the auditing fi rm Pricewa-terhouseCoopers (PwC) on behalf of the cdp. This database is the largest of its kind in the world. The cdp initiative now includes 534 in-stitutional investors managing combined assets of us$64 trillion. These investors expect companies to provide comprehensive climate-relevant information so that they can base their investment decisions on companies’ contributions to climate protection and how they address the challenges posed by climate change.
“We are delighted by our re-newed listing in the cdli and the listing in the new cpli, both of which we regard as confi rmation of the success of our climate strategy,” says Dr. Wolfgang Plischke, mem-ber of the Board of Management of Bayer AG responsible for Technolo-gy, Innovation and Environment.
Bayer stock has been included once again in the Dow Jones Sus-tainability World Index (djsi World) and re-included in the Dow Jones Sustainability Europe Index (djsi Europe), providing renewed proof of the company’s standing as an in-ternational leader in sustainability.
Success of climate strategy confi rmed
shaped by our action to protect the planet,” said United Nations Under-Secretary General and unep Execu-tive Director Achim Steiner. “The partnership with Bayer aims to im-
prove young people’s access to vital information about the state of the planet, support their initiatives and ensure their voices are heard in the international arena.”
Said Bayer AG Management Board Chairman Dr. Marijn Dekkers: “We are looking forward to continu-ing this successful partnership with unep that strikes such a chord with young people throughout the world. We are committed to initiating con-structive dialogue with and support-ing young people who are interested in environmental issues. After all, they can make a valuable contribu-tion through their justifi ed interest, critical awareness, commitment and passion for environmental pro-tection.”
The global youth and environment partnership between the United Na-tions Environment Programme (unep) and Bayer has been extended through the end of 2013. Since the partnership was launched in 2004, millions of young people have bene-fi ted from numerous projects ranging from tree planting, the development of educational materials and creative competitions to the organization of major children’s and youth confer-ences and the strengthening of youth representation at important global events. Bayer will support the joint activities to the tune of €1.2 million annually.
“Young people and children make up over 37 percent of the world’s population. Their future will be
UNEP youth and environmental partnership extended
Elvira Allakhiarova examines a patient.
Table of ConTenTs

3d fi lms took the visitors on a journey into the world of research – this animation shows the macula, part of the eye’s retina.
At the press forum entitled “Bayer’s Perspective on Innovation 2010,” the company showed 3d movies for the fi rst time to more graphically illustrate its innovative capability. Management Board Chairman Dr. Marijn Dekkers and Board research spokesman Dr. Wolfgang Plischke used the event, held at BayKomm in Lever kusen, to outline the company’s research potential to an audience of some 140 journalists.
“We have an excellent track record of innovation,” said Dekkers, explain-ing that the company’s products help patients, farmers and other customers all over the world. “And we as a com-
pany need these innovations. They are our lifeblood. We must innovate – and commercialize the results – if we are to compete successfully.”
However, Dekkers also expressed concern at certain trends. First, he said, there is the question of whether society remains willing to pay a rea-sonable price for innovations, particu-larly in the fi eld of health care. Dekkers also said the lack of acceptance for new technologies poses problems, appeal-ing to politicians and authorities to en-sure objectivity and transparency in appraising new developments.
Dr. Plischke, the member of the Board of Management responsible
for research, presented successful projects from the three subgroups’ pipelines. Among the outstanding developments he mentioned for Bayer HealthCare is the anticoagulant Xarelto®. Bayer CropScience plans to introduce six more crop protection active ingredients to the market by 2012, representing an added sales potential of more than €1 billion. And Bayer MaterialScience is devel-oping new products and applications along with leading-edge technologies and production processes – while at the same time reducing its energy consumption and using alternative raw materials.
Bayer: well-stocked product pipeline
Top marks for investor relationsDual accolade for Bayer: according to a survey by the German Investor Relations Association dirk and the fi nancial maga-zine WirtschaftsWoche, Bayer does the best investor relations work of all dax companies. For this the company won the German Investor Relations Award 2010. In addition, Bayer garnered second place among euro stoxx 50 companies in the Capital Investor Relations Award 2010.
dirk joined with the researchers at London-based Thomson-Reuters-Extel to survey more than 800 fund managers and analysts from 17 European coun-tries. The fi nancial market professionals awarded points to investor relations de-
partments and managers in categories such as the transparency and accuracy of annual and quarterly reports, the reliability of forecasts, and specialist and industry knowledge. They singled out Bayer’s “consistently well informed team and high quality of reporting.”
Capital magazine and the German As-sociation for Financial Analysis and Asset Management bestow the Capital Investor Relations Award to rate the quality of cap-ital market communications by the most important German and European compa-nies. To this end, they polled around 400 analysts and fund managers from interna-tional fi nancial institutions.
New facilities for faster and more effi cient development of vegetable varieties: Bayer CropScience’s vegetable seed business Nunhems is investing €12 million in the expansion and modernization of its research center at Leudal in the Netherlands. The new facilities should be operational by the end of 2011. In addition, Nunhems has invested some us$30 million in a new vegetable seed processing facility and the modernization of existing seed processing and stor-age capacities at its site in Parma, Idaho, United States.
Expansion of research on vegetable varieties
BAYER ANNUAL REPORT 2010 HIGHLIGHTS 2010 41Table of ConTenTs
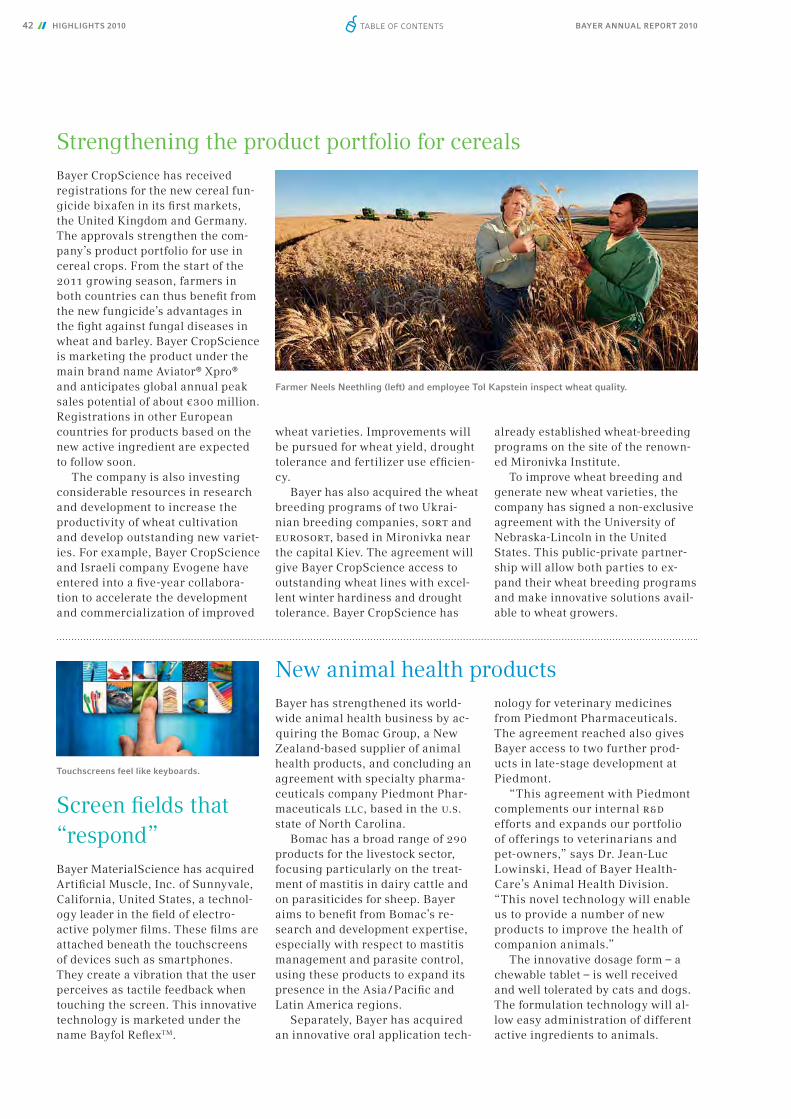
BAYER ANNUAL REPORT 201042 HIGHLIGHTS 2010
Bayer has strengthened its world-wide animal health business by ac-quiring the Bomac Group, a New Zealand-based supplier of animal health products, and concluding an agreement with specialty pharma-ceuticals company Piedmont Phar-maceuticals llc, based in the u.s. state of North Carolina.
Bomac has a broad range of 290 products for the livestock sector, focusing particularly on the treat-ment of mastitis in dairy cattle and on parasiticides for sheep. Bayer aims to benefi t from Bomac’s re-search and development expertise, especially with respect to mastitis management and parasite control, using these products to expand its presence in the Asia / Pacifi c and Latin America regions.
Separately, Bayer has acquired an innovative oral application tech-
nology for veterinary medicines from Piedmont Pharmaceuticals. The agreement reached also gives Bayer access to two further prod-ucts in late-stage development at Piedmont.
“This agreement with Piedmont complements our internal r&d efforts and expands our portfolio of offerings to veterinarians and pet-owners,” says Dr. Jean-Luc Lowinski, Head of Bayer Health-Care’s Animal Health Division. “This novel technology will enable us to provide a number of new products to improve the health of companion animals.”
The innovative dosage form – a chewable tablet – is well received and well tolerated by cats and dogs. The formulation technology will al-low easy administration of different active ingredients to animals.
New animal health products
Screen fi elds that “respond”Bayer MaterialScience has acquired Artifi cial Muscle, Inc. of Sunnyvale, California, United States, a technol-ogy leader in the fi eld of electro- active polymer fi lms. These fi lms are attached beneath the touchscreens of devices such as smartphones. They create a vibration that the user perceives as tactile feedback when touching the screen. This innovative technology is marketed under the name Bayfol Refl exTM.
Touchscreens feel like keyboards.
Bayer CropScience has received registrations for the new cereal fun-gicide bixafen in its fi rst markets, the United Kingdom and Germany. The approvals strengthen the com-pany’s product portfolio for use in cereal crops. From the start of the 2011 growing season, farmers in both countries can thus benefi t from the new fungicide’s advantages in the fi ght against fungal diseases in wheat and barley. Bayer CropScience is marketing the product under the main brand name Aviator® Xpro® and anticipates global annual peak sales potential of about €300 million. Registrations in other European countries for products based on the new active ingredient are expected to follow soon.
The company is also investing considerable resources in research and development to increase the productivity of wheat cultivation and develop outstanding new variet-ies. For example, Bayer CropScience and Israeli company Evogene have entered into a fi ve-year collabora-tion to accelerate the development and commercialization of improved
wheat varieties. Improvements will be pursued for wheat yield, drought tolerance and fertilizer use effi cien-cy.
Bayer has also acquired the wheat breeding programs of two Ukrai-nian breeding companies, sort and eurosort, based in Mironivka near the capital Kiev. The agreement will give Bayer CropScience access to outstanding wheat lines with excel-lent winter hardiness and drought tolerance. Bayer CropScience has
already established wheat-breeding programs on the site of the renown-ed Mironivka Institute.
To improve wheat breeding and generate new wheat varieties, the company has signed a non-exclusive agreement with the University of Nebraska-Lincoln in the United States. This public-private partner-ship will allow both parties to ex-pand their wheat breeding programs and make innovative solutions avail-able to wheat growers.
Strengthening the product portfolio for cereals
Farmer Neels Neethling (left) and employee Tol Kapstein inspect wheat quality.
Table of ConTenTs

BAYER ANNUAL REPORT 2010 HIGHLIGHTS 2010 43
New approaches to fi ghting malaria: Bayer CropScience and SentiSearch Inc. plan to work together with lead-ing u.s.-based scientists to “grab insects by the nose.” The two com-panies have entered into a two-year research collaboration aimed at identifying new molecules to target odorant receptors in insects. Such substances could prevent disease- transmitting insects from being able to “smell” people.
Millions of olfactory receptor neurons help the insects not only to locate food, but also to home in on a host where they can lay their eggs. These insects are more than just bothersome to people: they can also be very dangerous. One example is the malaria-transmitting Anopheles
mosquito, which identifi es its hosts partly by the co2 content of their breath. The aim is for the new mol-ecules to block the relevant receptors so that the insects can no longer per-ceive human odors.
“Bayer CropScience is the mar-ket leader in vector control in the public health and agricultural set-tings, including animal health. Our activities include playing a signifi cant role in the prevention of malaria,” said Dr. Alexander Klausener, Head of Research at Bayer CropScience. According to Klausener, this new cooperation with leading scientists from Columbia and The Rockefeller University in New York will give the company access to a new and innova-tive approach to insect control.
Grabbing malaria mosquitoes “by the nose”
Contraceptive pills registered in the United States
by 2015, with MaterialScience ac-counting for more than half of this amount.” In fi scal 2009, the Bayer Group in Greater China had sales of €2.1 billion, including Material-Science sales of €1.2 billion. “The strong economic growth in China and the entire Asia / Pacifi c region
presents us with outstanding oppor-tunities that we intend to maximize,” added Patrick Thomas, Chairman of the Board of Management of Bayer Material Science. “It’s strategically important for us to have the neces-sary capacities in the region to meet rising demand.”
Bayer intends to signifi cantly ex-pand its capacities for the produc-tion of high-performance materials in China by 2016. Investment total-ing some €1 billion is planned at the Shanghai site. Bayer is thus sharp-ening its focus on the Asia / Pacifi c region, where it predicts steady growth in its customer industries.
Capacities for the polyurethane raw material mdi are to be more than doubled to one million tons a year and for polycarbonate engineering plastics to 500,000 tons per year. The company also plans to consider-ably expand its research and devel-opment activities there. The head-quarters of the Polycarbonates business unit will be relocated from company headquarters in Leverku-sen to Shanghai to achieve even greater proximity to the booming polycarbonates market of Asia (see page 37).
“The expansion of our capaci-ties in China is a major step toward greatly strengthening our pres-ence in the emerging economies,” explained Bayer AG Management Board Chairman Dr. Marijn Dekkers. “We aim to increase Group sales in Greater China to around €5 billion
Maximizing opportunities in Asia / Pacifi c
Bayer employee Gary Xi at the polycarbonate production plant in Shanghai
The u.s. Food and Drug Adminis-tration (fda) has approved Bayer HealthCare’s new oral contra ceptives SafyralTM, Beyaz® and NataziaTM.
SafyralTM combines the hormone ingredients of the birth control pill Yasmin® – and Beyaz® those of the pill yaz® – with metafolin, a stable form of folate, which is a vitamin B also found in food. Folate levels are raised in wo-men who take SafyralTM or Beyaz®. The product is designed to reduce the risk of a neural tube defect should preg-nancy occur shortly after a woman stops taking the pill.
NataziaTM is available in many countries outside the United States as Qlaira®. It is the fi rst product in a new class of oral contraceptives whose estrogen component is based on estradiol.
Table of ConTenTs

Combined Management Report of the Bayer Group and Bayer AG as of December 31, 2010
1. Overview of Sales, Earnings and Financial Position............................................... 45
2. Business and Operating Environment .................. 492.1 Corporate Structure ............................................ 492.2 Economic Environment .........................................512.3 Procurement and Production ................................ 532.4 Products, Distribution and Markets ....................... 55
3. Performance by Subgroup, Segment and Region ........................................................ 58
3.1 HealthCare ......................................................... 583.2 CropScience ....................................................... 643.3 MaterialScience ...................................................693.4 Performance by Region .........................................72
4. Earnings; Asset and Financial Position of the Bayer Group ............................................. 72
4.1 Earnings Performance of the Bayer Group ...............724.2 Calculation of EBIT(DA) Before Special Items ............744.3 Core Earnings Per Share ...................................... 754.4 Value Management ..............................................764.5 Liquidity and Capital Expenditures
of the Bayer Group .............................................. 784.6 Asset and Capital Structure of the Bayer Group ....... 81
5. Earnings; Asset and Financial Position of Bayer AG ....................................................... 83
5.1 Earnings Performance of Bayer AG ........................ 835.2 Asset and Financial Position of Bayer AG ................ 84
6. Takeover-Relevant Information ........................... 85
7. Corporate Governance Report ............................. 887.1 Declaration on Corporate Governance.................... 887.2 Compensation Report .......................................... 95
8. Research and Development ................................101
9. Sustainability ................................................... 1119.1 Sustainability Strategy ........................................ 1119.2 Employees ........................................................ 1129.3 Environment, Climate Protection and Safety .......... 1169.4 Social Commitment ............................................ 118
10. Events After the Reporting Period ......................121
11. Future Perspectives ..........................................12211.1 Opportunity and Risk Report ...............................12211.1.1 Opportunity and Risk Management ......................12211.1.2 Internal Control and Risk Management
System for (Group) Accounting and Financial
Reporting .........................................................12311.1.3 Opportunities ....................................................12411.1.4 Risks ................................................................12511.2 Strategy ............................................................13111.3 Economic Outlook ..............................................13611.4 Sales and Earnings Forecast ................................138
For direct access to a chapter, simply click on its name.
BAyER AnnuAl REPORT 201044 COmBInED mAnAGEmEnT REPORT Table of ConTenTs
BAYER ANNUAL REPORT 2010 COMBINED MANAGEMENT REPORT 45
Fiscal 2010:
Bayer: operating performance on track
Progress in research and development spurs optimism
• Group targets achieved
• Strong year at MaterialScience – HealthCare and CropScience
below expectations
• Over €3 billion for research and development
• Net income diminished by high special charges
• Strong operating cash fl ow – net fi nancial debt below €8 billion
• Confi dence for 2011: core earnings per share expected to grow
by about 10%
Table of ConTenTs
Combined managemenT RepoRT
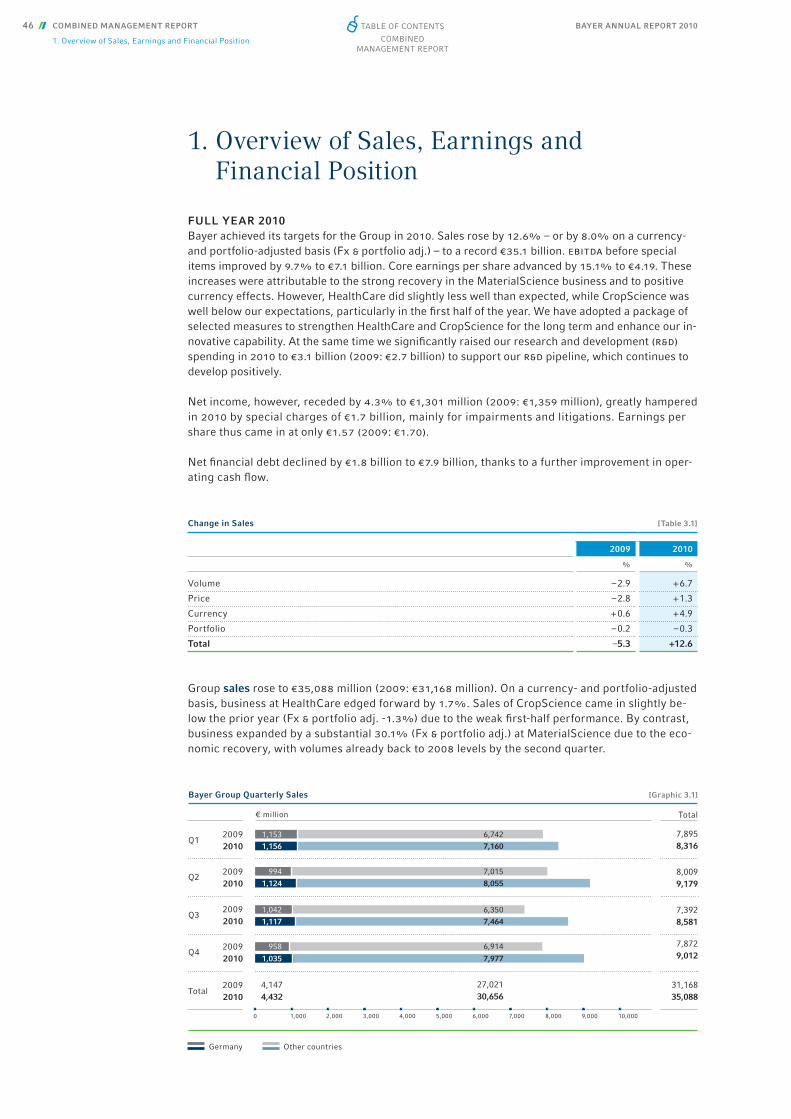
BAYER ANNUAL REPORT 201046 COMBINED MANAGEMENT REPORT
1. Overview of Sales, Earnings and Financial Position
1. Overview of Sales, Earnings and Financial Position
FULL YEAR 2010 Bayer achieved its targets for the Group in 2010. Sales rose by 12.6% – or by 8.0% on a currency- and portfolio-adjusted basis (Fx & portfolio adj.) – to a record €35.1 billion. ebitda before special items improved by 9.7% to €7.1 billion. Core earnings per share advanced by 15.1% to €4.19. These increases were attributable to the strong recovery in the Material Science business and to positive currency effects. However, Health Care did slightly less well than expected, while CropScience was well below our expectations, particularly in the fi rst half of the year. We have adopted a package of selected measures to strengthen Health Care and CropScience for the long term and enhance our in-novative capability. At the same time we signifi cantly raised our research and development (r&d) spending in 2010 to €3.1 billion (2009: €2.7 billion) to support our r&d pipeline, which continues to develop positively.
Net income, however, receded by 4.3% to €1,301 million (2009: €1,359 million), greatly hampered in 2010 by special charges of €1.7 billion, mainly for impairments and litigations. Earnings per share thus came in at only €1.57 (2009: €1.70).
Net fi nancial debt declined by €1.8 billion to €7.9 billion, thanks to a further improvement in oper-ating cash fl ow.
Group sales rose to €35,088 million (2009: €31,168 million). On a currency- and portfolio-adjusted basis, business at Health Care edged forward by 1.7%. Sales of CropScience came in slightly be-low the prior year (Fx & portfolio adj. -1.3%) due to the weak fi rst-half performance. By contrast, business expanded by a substantial 30.1% (Fx & portfolio adj.) at Material Science due to the eco-nomic recovery, with volumes already back to 2008 levels by the second quarter.
Change in Sales [Table 3.1]
2009 2010
% %
Volume – 2.9 + 6.7
Price – 2.8 + 1.3
Currency + 0.6 + 4.9
Portfolio – 0.2 – 0.3
Total –5.3 +12.6
20092010
7,8729,012
31,16835,088
20092010
Bayer Group Quarterly Sales [Graphic 3.1]
Total
Q120092010
7,8958,316
Q220092010
8,0099,179
Q320092010
7,3928,581
Q4
Total
€ million
27,02130,656
Germany Other countries
0 1,000 2,000 3,000 4,000 5,000 6,000 7,000 8,000 9,000 10,000
7,160
8,055
6,742
7,015
7,464
7,977
6,350
6,914
4,1474,432
1,156
1,124
1,153
994
958
1,117
1,035
1,042
Table of ConTenTs
Combined managemenT RepoRT
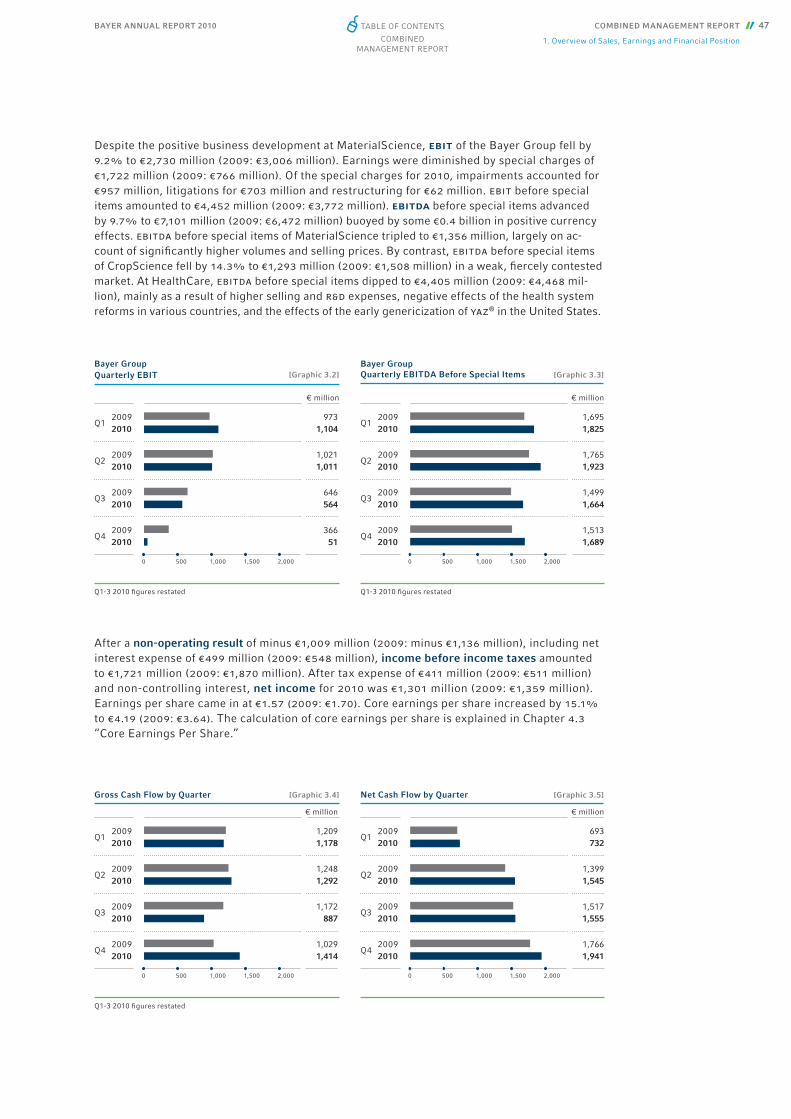
BAYER ANNUAL REPORT 2010 COMBINED MANAGEMENT REPORT 47
1. Overview of Sales, Earnings and Financial Position
Despite the positive business development at Material Science, ebit of the Bayer Group fell by 9.2% to €2,730 million (2009: €3,006 million). Earnings were diminished by special charges of €1,722 million (2009: €766 million). Of the special charges for 2010, impairments accounted for €957 million, litigations for €703 million and restructuring for €62 million. ebit before special items amounted to €4,452 million (2009: €3,772 million). ebitda before special items advanced by 9.7% to €7,101 million (2009: €6,472 million) buoyed by some €0.4 billion in positive currency effects. ebitda before special items of Material Science tripled to €1,356 million, largely on ac-count of signifi cantly higher volumes and selling prices. By contrast, ebitda before special items of CropScience fell by 14.3% to €1,293 million (2009: €1,508 million) in a weak, fi ercely contested market. At Health Care, ebitda before special items dipped to €4,405 million (2009: €4,468 mil-lion), mainly as a result of higher selling and r&d expenses, negative effects of the health system reforms in various countries, and the effects of the early genericization of yaz® in the United States.
After a non-operating result of minus €1,009 million (2009: minus €1,136 million), including net interest expense of €499 million (2009: €548 million), income before income taxes amounted to €1,721 million (2009: €1,870 million). After tax expense of €411 million (2009: €511 million) and non-controlling interest, net income for 2010 was €1,301 million (2009: €1,359 million). Earnings per share came in at €1.57 (2009: €1.70). Core earnings per share increased by 15.1% to €4.19 (2009: €3.64). The calculation of core earnings per share is explained in Chapter 4.3 “Core Earnings Per Share.”
Bayer Group Quarterly EBITDA Before Special Items [Graphic 3.3]
Bayer Group Quarterly EBIT [Graphic 3.2]
20092010
Q2
Q3
Q4
20092010
20092010
20092010
9731,104
1,0211,011
646564
36651
€ million
Q1
5000 1,000 1,500 2,000
20092010
Q2
Q3
Q4
20092010
20092010
20092010
1,6951,825
1,7651,923
1,4991,664
1,5131,689
€ million
Q1
5000 1,000 1,500 2,000
Q1-3 2010 fi gures restated Q1-3 2010 fi gures restated
20092010
Q2
Q3
Q4
20092010
20092010
20092010
Gross Cash Flow by Quarter
1,2091,178
1,2481,292
1,172887
1,0291,414
€ million
Q1
5000 1,000 1,500 2,000
Net Cash Flow by Quarter] [Graphic 3.5] [Graphic 3.4]
20092010
Q2
Q3
Q4
20092010
20092010
20092010
693732
1,3991,545
1,5171,555
1,7661,941
€ million
Q1
5000 1,000 1,500 2,000
Q1-3 2010 fi gures restated
Table of ConTenTs
Combined managemenT RepoRT

BAYER ANNUAL REPORT 201048 COMBINED MANAGEMENT REPORT
1. Overview of Sales, Earnings and Financial Position
Gross cash fl ow in 2010 improved by 2.4% to €4,771 million (2009: €4,658 million). After a signifi -cant reduction in tied-up funds thanks to a further improvement in our working capital manage-ment, net cash fl ow advanced by 7.4% to €5,773 million (2009: €5,375 million). Net fi nancial debt fell by €1.8 billion compared to December 31, 2009, amounting to €7.9 billion at the end of 2010. The net pension liability – the aggregate of pension obligations and plan assets – rose by €0.8 billion compared with December 31, 2009, to €7.2 billion, mainly because of lower long-term interest rates on the capital market.
FOURTH QUARTER OF 2010The Bayer Group achieved substantial increases in sales and underlying earnings in the fourth quarter of 2010, while ebit was held back mainly by impairments. The improvement in our operating performance was mainly due to the continued recovery in the Material Science busi-ness. CropScience raised sales and ebitda before special items. At Health Care, sales edged ahead while ebitda before special items posted a slight year-on-year decline.
Group sales grew by 14.5% to €9,012 million (q4 2009: €7,872 million). Adjusted for currency and portfolio effects (Fx & portfolio adj.), business expanded by 8.1%. Health Care sales in-creased by 7.3% (Fx & portfolio adj. +1.4%), with business in the Pharmaceuticals segment ad-vancing slightly overall on a currency- and portfolio-adjusted basis despite a decrease in North America. Consumer Health sales were level with the previous year after adjusting for currency effects. The drop in sales of blood glucose monitoring systems in the United States, caused by the diffi cult market situation, was offset by the positive development in the other divisions. CropScience had a strong fourth quarter, with sales advancing by 18.2% (Fx & portfolio adj. +9.7%) in a positive market environment. Sales of Material Science climbed by 28.2% (Fx & portfolio adj. +21.6%) from the low prior-year fi gure, which was due to the economic crisis.
ebit of the Bayer Group dropped by 86.1% to €51 million (q4 2009: €366 million). Fourth- quarter earnings in 2010 were diminished by substantial special charges totaling €954 million (q4 2009: €451 million), which in 2010 principally included impairment losses of €825 million. Of the remaining amount, €67 million was incurred for litigations in the United States, including €41 million at Health Care relating to yaz® / Yasmin® and €26 million at CropScience relating mainly to an intended settlement program in connection with litigations concerning genetically modifi ed rice (ll rice). We also took special charges of €62 million for restructuring in Health-Care. ebit before special items improved by 23.0% to €1,005 million (q4 2009: €817 million).
ebitda before special items of the Bayer Group improved by 11.6% to €1,689 million (q4 2009: €1,513 million), driven mainly by strong earnings growth at Material Science and posi-tive currency effects. Health Care recorded ebitda before special items of €1,138 million (q4 2009: €1,154 million), including a €68 million gain from the settlement of a patent dispute concerning yaz® that partially offset the margin loss during the year. ebitda before special items of CropScience advanced to €270 million (q4 2009: €166 million), including one-time in-come of €44 million from the divestment of some older active ingredients and the execution of a license agreement. At Material Science, ebitda before special items came in at €297 million (q4 2009: €203 million).
After a non-operating result of minus €237 million (q4 2009: minus €248 million), we recorded a pre-tax loss of €186 million for the fourth quarter of 2010 (q4 2009: income of €118 million), leading to tax income of €45 million (q4 2009: €38 million). After non-controlling interest, this gave a net loss of €145 million (q4 2009: net income of €153 million). Earnings per share were minus €0.18 (q4 2009: €0.18). Core earnings per share rose to €0.95 (q4 2009: €0.90). The calcu-lation of core earnings per share is explained in Chapter 4.3 “Core Earnings Per Share.”
Gross cash fl ow of the Bayer Group advanced by 37.4% year on year to €1,414 million (q4 2009: €1,029 million) in light of the improved operating performance. Net cash fl ow moved ahead by 9.9% to €1,941 million (q4 2009: €1,766 million). We signifi cantly reduced net fi nancial debt in the fourth quarter of 2010 to €7.9 billion (September 30, 2010: €9.1 billion).
Table of ConTenTs
Combined managemenT RepoRT
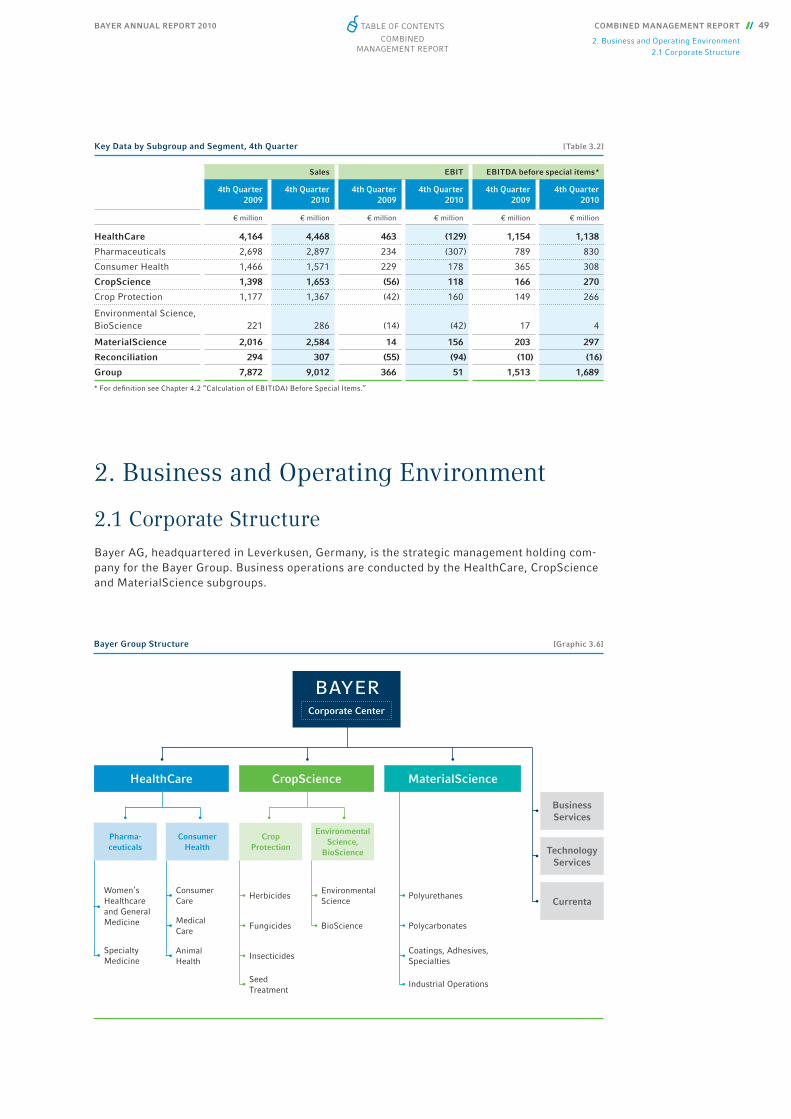
BAYER ANNUAL REPORT 2010 COMBINED MANAGEMENT REPORT 49
2. Business and Operating Environment2.1 Corporate Structure
2. Business and Operating Environment
2.1 Corporate Structure Bayer AG, headquartered in Leverkusen, Germany, is the strategic management holding com-pany for the Bayer Group. Business operations are conducted by the Health Care, CropScience and Material Science subgroups.
Polyurethanes
Polycarbonates
Coatings, Adhesives,Specialties
Industrial Operations
ConsumerHealth
Pharma-ceuticals
Women’sHealthcareand GeneralMedicine
SpecialtyMedicine
ConsumerCare
MedicalCare
AnimalHealth
Environmental Science,
BioScience
CropProtection
Herbicides
Fungicides
Insecticides
Seed Treatment
Environmental Science
BioScience
bayerCorporate Center
BusinessServices
TechnologyServices
Currenta
MaterialScienceHealthCare CropScience
Bayer Group Structure [Graphic 3.6]
Key Data by Subgroup and Segment, 4th Quarter [Table 3.2]
Sales EBIT EBITDA before special items *
4th Quarter2009
4th Quarter2010
4th Quarter2009
4th Quarter2010
4th Quarter2009
4th Quarter2010
€ million € million € million € million € million € million
HealthCare 4,164 4,468 463 (129) 1,154 1,138
Pharmaceuticals 2,698 2,897 234 (307) 789 830
Consumer Health 1,466 1,571 229 178 365 308
CropScience 1,398 1,653 (56) 118 166 270
Crop Protection 1,177 1,367 (42) 160 149 266
Environmental Science, BioScience 221 286 (14) (42) 17 4
MaterialScience 2,016 2,584 14 156 203 297
Reconciliation 294 307 (55) (94) (10) (16)
Group 7,872 9,012 366 51 1,513 1,689
* For defi nition see Chapter 4.2 “Calculation of EBIT(DA) Before Special Items.”
Table of ConTenTs
Combined managemenT RepoRT
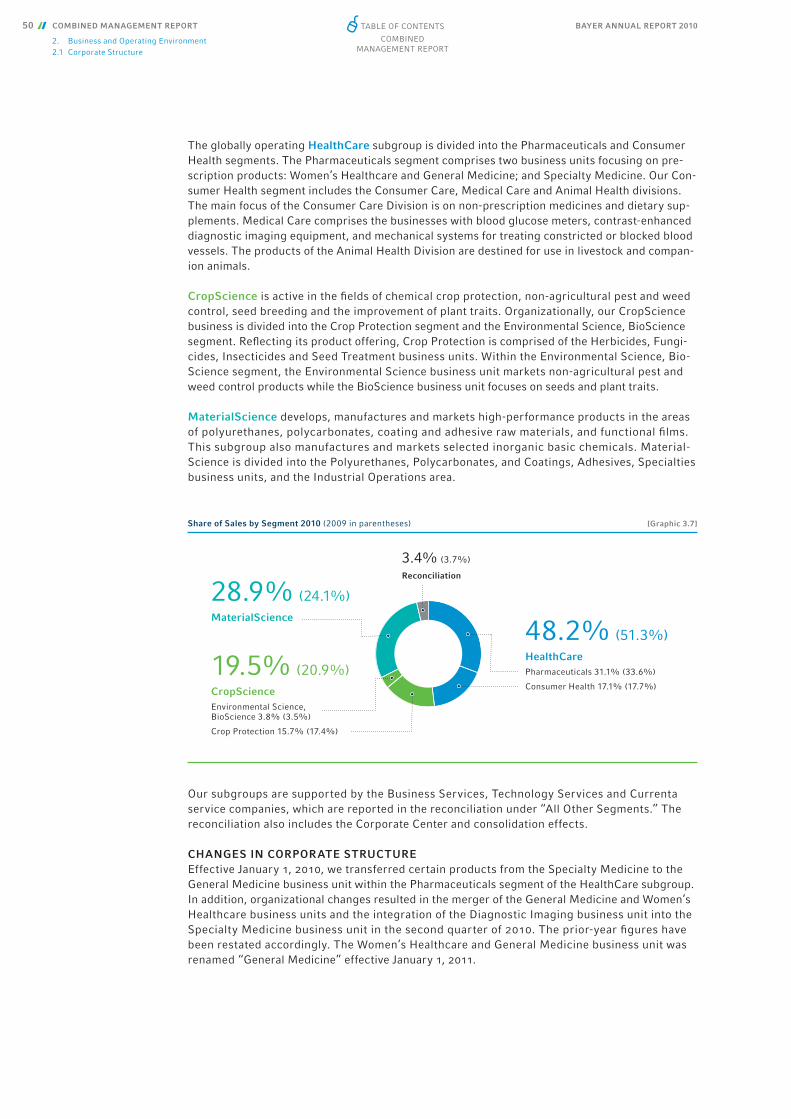
BAYER ANNUAL REPORT 201050 COMBINED MANAGEMENT REPORT
2. Business and Operating Environment2.1 Corporate Structure
The globally operating Health Care subgroup is divided into the Pharmaceuticals and Consumer Health segments. The Pharmaceuticals segment comprises two business units focusing on pre-scription products: Women’s Healthcare and General Medicine; and Specialty Medicine. Our Con-sumer Health segment includes the Consumer Care, Medical Care and Animal Health divisions. The main focus of the Consumer Care Division is on non-prescription medicines and dietary sup-plements. Medical Care comprises the businesses with blood glucose meters, contrast-enhanced diagnostic imaging equipment, and mechanical systems for treating constricted or blocked blood vessels. The products of the Animal Health Division are destined for use in livestock and compan-ion animals.
CropScience is active in the fi elds of chemical crop protection, non-agricultural pest and weed control, seed breeding and the improvement of plant traits. Organizationally, our CropScience business is divided into the Crop Protection segment and the Environmental Science, BioScience segment. Refl ecting its product offering, Crop Protection is comprised of the Herbicides, Fungi-cides, Insecticides and Seed Treatment business units. Within the Environmental Science, Bio-Science segment, the Environmental Science business unit markets non-agricultural pest and weed control products while the BioScience business unit focuses on seeds and plant traits.
Material Science develops, manufactures and markets high-performance products in the areas of polyurethanes, polycarbonates, coating and adhesive raw materials, and functional fi lms. This subgroup also manufactures and markets selected inorganic basic chemicals. Material-Science is divided into the Polyurethanes, Polycarbonates, and Coatings, Adhesives, Specialties business units, and the Industrial Operations area.
Our subgroups are supported by the Business Services, Technology Services and Currenta service companies, which are reported in the reconciliation under “All Other Segments.” The reconciliation also includes the Corporate Center and consolidation effects. CHANGES IN CORPORATE STRUCTUREEffective January 1, 2010, we transferred certain products from the Specialty Medicine to the General Medicine business unit within the Pharmaceuticals segment of the Health Care subgroup. In addition, organizational changes resulted in the merger of the General Medicine and Women’s Healthcare business units and the integration of the Diagnostic Imaging business unit into the Specialty Medicine business unit in the second quarter of 2010. The prior-year fi gures have been restated accordingly. The Women’s Healthcare and General Medicine business unit was renamed “General Medicine” effective January 1, 2011.
Share of Sales by Segment 2010 (2009 in parentheses) [Graphic 3.7]
48.2% (51.3%)HealthCarePharmaceuticals 31.1% (33.6%)
Consumer Health 17.1% (17.7%)
19.5% (20.9%)CropScienceEnvironmental Science,BioScience 3.8% (3.5%)
Crop Protection 15.7% (17.4%)
3.4% (3.7%)
Reconciliation
28.9% (24.1%)MaterialScience
Table of ConTenTs
Combined managemenT RepoRT
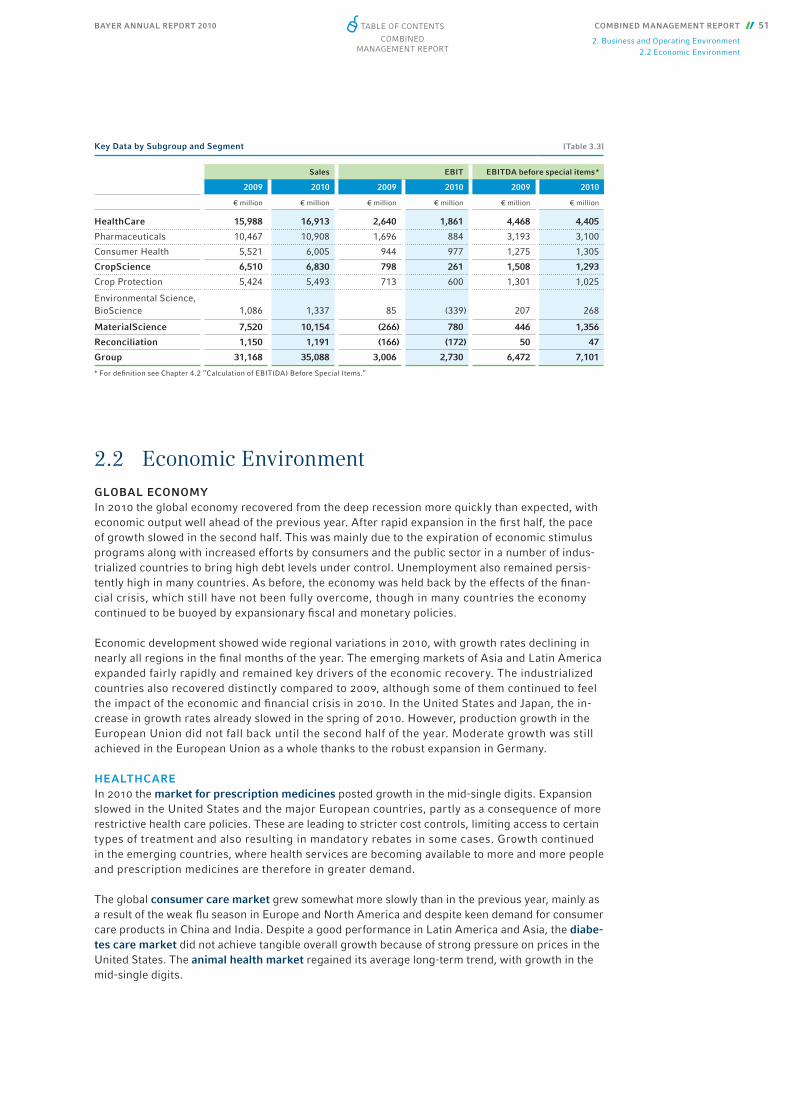
BAYER ANNUAL REPORT 2010 COMBINED MANAGEMENT REPORT 51
2. Business and Operating Environment2.2 Economic Environment
2.2 Economic Environment GLOBAL ECONOMYIn 2010 the global economy recovered from the deep recession more quickly than expected, with economic output well ahead of the previous year. After rapid expansion in the fi rst half, the pace of growth slowed in the second half. This was mainly due to the expiration of economic stimulus programs along with increased efforts by consumers and the public sector in a number of indus-trialized countries to bring high debt levels under control. Unemployment also remained persis-tently high in many countries. As before, the economy was held back by the effects of the fi nan-cial crisis, which still have not been fully overcome, though in many countries the economy continued to be buoyed by expansionary fi scal and monetary policies.
Economic development showed wide regional variations in 2010, with growth rates declining in nearly all regions in the fi nal months of the year. The emerging markets of Asia and Latin America expanded fairly rapidly and remained key drivers of the economic recovery. The industrialized countries also recovered distinctly compared to 2009, although some of them continued to feel the impact of the economic and fi nancial crisis in 2010. In the United States and Japan, the in-crease in growth rates already slowed in the spring of 2010. However, production growth in the European Union did not fall back until the second half of the year. Moderate growth was still achieved in the European Union as a whole thanks to the robust expansion in Germany.
HEALTH CAREIn 2010 the market for prescription medicines posted growth in the mid-single digits. Expansion slowed in the United States and the major European countries, partly as a consequence of more restrictive health care policies. These are leading to stricter cost controls, limiting access to certain types of treatment and also resulting in mandatory rebates in some cases. Growth continued in the emerging countries, where health services are becoming available to more and more people and prescription medicines are therefore in greater demand.
The global consumer care market grew somewhat more slowly than in the previous year, mainly as a result of the weak fl u season in Europe and North America and despite keen demand for consumer care products in China and India. Despite a good performance in Latin America and Asia, the diabe-tes care market did not achieve tangible overall growth because of strong pressure on prices in the United States. The animal health market regained its average long-term trend, with growth in the mid-single digits.
Key Data by Subgroup and Segment [Table 3.3]
Sales EBIT EBITDA before special items *
2009 2010 2009 2010 2009 2010
€ million € million € million € million € million € million
HealthCare 15,988 16,913 2,640 1,861 4,468 4,405
Pharmaceuticals 10,467 10,908 1,696 884 3,193 3,100
Consumer Health 5,521 6,005 944 977 1,275 1,305
CropScience 6,510 6,830 798 261 1,508 1,293
Crop Protection 5,424 5,493 713 600 1,301 1,025
Environmental Science, BioScience 1,086 1,337 85 (339) 207 268
MaterialScience 7,520 10,154 (266) 780 446 1,356
Reconciliation 1,150 1,191 (166) (172) 50 47
Group 31,168 35,088 3,006 2,730 6,472 7,101
* For defi nition see Chapter 4.2 “Calculation of EBIT(DA) Before Special Items.”
Table of ConTenTs
Combined managemenT RepoRT

BAYER ANNUAL REPORT 201052 COMBINED MANAGEMENT REPORT
2. Business and Operating Environment2.2 Economic Environment
CROPSCIENCEDevelopments in the global seed and crop protection market varied widely in 2010. While farm-ers’ overall demand for high-quality seed continued to rise signifi cantly, the global crop protection market registered only very modest growth.
The relatively long winter combined with a wet spring in many regions reduced demand for crop protection products in North America and Europe, especially in the fi rst half of the year. As the economy recovered, business conditions for farmers also improved from mid-year onward. Higher demand, coupled with weather-related harvest shortfalls in Russia and central Asia, for example, led to an increase in producer prices for the major agricultural crops. These effects came too late to compensate for the declining market trend in the northern hemisphere, but in time to spur the use of crop protection products at the start of the main growing season in Latin America. The liquidity bottlenecks at many farms in that region caused by the fi nancial crisis also eased mark-edly. The market in Asia / Pacifi c as a whole stagnated in 2010, with trends varying in different parts of the region. While the market contracted in Japan and held steady in China, mainly due to adverse weather, the crop protection market benefi ted from favorable monsoon conditions in India and from the recovery in the agriculture industry in Australia after years of drought.
MATERIALSCIENCEThe customer industries relevant to Material Science recovered in 2010 from the sharp drop in sales in the previous year. Despite a slight cooling of the economy in the second half of 2010, global demand remained stable.
In 2010 the automotive industry overcame the previous year’s slump in sales faster than expect-ed. Business with new cars trended particularly well in the Asian markets and in Russia. In the United States, too, volumes again rose signifi cantly. In western Europe, demand for cars was down as expected compared to the incentive-driven prior-year fi gures, although even here the rate of decline appeared to be slowing.
Following the shrinkage in the electrical / electronics market in the prior crisis year, rapid growth was again registered in 2010. While the industrialized countries benefi ted from regional stimulus programs in areas such as infrastructure and e-mobility, the strong growth in the emerging markets continued due to rising demand for electronic consumer goods.
The global construction industry stagnated in 2010, with varying regional trends. While the sec-tor continued to shrink in western Europe, the United States and Japan, it posted robust growth in the emerging markets, particularly China, India and Brazil.
The business situation in the furniture industry brightened increasingly over the course of 2010, though the pace of recovery varied substantially from one region to another. While production showed only a modest increase in North America and some western European countries on ac-count of weak demand, the Asian furniture industry benefi ted from robust demand in China and a gradual recovery in global demand for affordable furniture.
Table of ConTenTs
Combined managemenT RepoRT

BAYER ANNUAL REPORT 2010 COMBINED MANAGEMENT REPORT 53
2. Business and Operating Environment2.3 Procurement and Production
2.3 Procurement and Production Uniform Group directives on procurement are in place. Our production-specifi c procurement ac-tivities, like production itself, are organized on a decentralized basis in light of the diverse nature of our business activities. By contrast, the procurement of indirect goods and services that are not relevant to production – such as consultancy services, business travel and fl eet management, computer hardware and software, laboratory and workshop equipment, safety devices and offi ce supplies – is centrally organized within our service companies.
HEALTHCARE The Product Supply unit of Health Care steers the subgroup’s entire supply chain, from raw mate-rial procurement to manufacturing to product shipment, utilizing a global production network consisting of its own sites and those of subcontractors. In this way we aim to steadily reduce costs, increase our fl exibility and delivery reliability, and maintain high standards of quality, safe-ty and environmental protection on a global basis. The manufacture of pharmaceuticals is subject to exceptionally stringent quality requirements defi ned by the term “Good Manufacturing Practic-es” (gmp). Compliance with these requirements is regularly audited by internal experts, regulato-ry authorities and external consultants.
The Pharmaceuticals segment generally procures the starting materials for the active ingredients of its prescription pharmaceuticals from external suppliers. To prevent supply bottlenecks and mitigate major price fl uctuations, these starting materials and the intermediates we do not pro-duce ourselves are generally purchased under global contracts and / or from a number of suppliers we have audited and approved.
Our active ingredients for prescription medicines are manufactured primarily at the sites in Wup-pertal and Bergkamen, Germany, and Berkeley and Emeryville, California, United States. These substances are processed into fi nished products and packaged worldwide. Our medicines come in a wide range of delivery forms, including solids (coated or uncoated tablets, powders), semi- solids (ointments, creams) and liquid pharmaceuticals used in injections or infusions, for example. Our hormonal contraceptives are supplied as sugar- or fi lm-coated tablets or used in intrauterine sys-tems (coils), for example. These formulating and packaging activities take place in Berlin, Lever-kusen and Weimar, Germany; Garbagnate, Italy; Beijing, China; São Paulo, Brazil; Turku, Finland; and various other sites in Europe, Asia and Latin America. The hemophilia drug Kogenate® is manufactured by a biotechnological process at Berkeley, California, United States. Betaferon® / Betaseron® for the treatment of multiple sclerosis is produced in Emeryville, California, United States.
For the Consumer Care Division of the Consumer Health segment we produce certain active substances, such as acetylsalicylic acid and clotrimazole, within the Bayer Group in La Felguera, Spain. The principal raw materials we purchase from third parties are naproxen, citric acid, ascor-bic acid and other vitamins, and paracetamol. To minimize business risks, we diversify our raw material procurement sources worldwide and conclude long-term supply agreements. Among the division’s largest production sites are the facilities in Myerstown, Pennsylvania, United States; Cimanggis, Indonesia; Gaillard, France; Bitterfeld-Wolfen and Grenzach-Wyhlen, Germany; and Madrid, Spain.
Some four fi fths of the Diabetes Care products (such as blood glucose meters) of our Medical Care division are procured from original equipment manufacturers (oems). Material prices and availability are covered in most cases by long-term contracts and therefore are not subject to major fl uctuations. We hold strategic reserves of certain materials and fi nished products so that we can supply our customers consistently and reliably. Our production site for Diabetes Care products is located in Mishawaka, Indiana, United States. Most of the materials needed for our medical equipment business, too, are procured from external suppliers, their availability, quality and price stability being ensured by way of long-term agreements, careful choice of suppliers and active supplier management. The majority of our medical devices are manufactured at the u.s. sites near Pittsburgh, Pennsylvania, and at Coon Rapids, Minnesota.
Production network creates advantages
Table of ConTenTs
Combined managemenT RepoRT

BAYER ANNUAL REPORT 201054 COMBINED MANAGEMENT REPORT
2. Business and Operating Environment2.3 Procurement and Production
The Animal Health Division procures the pharmaceutical active ingredients for its veterinary medicines both from within the Bayer Group and from external suppliers throughout the world. Our animal health products are manufactured mainly at the sites in Kiel, Germany, and Shawnee, Kansas, United States, and marketed worldwide.
CROPSCIENCECropScience procures most of its raw materials for the manufacture of crop protection products externally. These raw materials are mainly basic chemicals such as chlorine, sodium hydroxide solu-tion and sulfuric acid, or synthesis components. Important raw materials are usually procured on the basis of long-term supply agreements. We reduce the risk of supply failure by diversifying our raw material sources and holding strategic reserves of important raw materials. The preferred use of certifi ed suppliers with defi ned quality standards for both manufactured and procured raw mate-rials is another important selection criterion.
CropScience has 36 production sites and formulating facilities of its own around the world where its Crop Protection and Environmental Science products are manufactured. Among the largest are the facilities in Dormagen and Frankfurt am Main, Germany; Kansas City, Missouri, United States; and Vapi, India. In addition to a number of central locations for the manufacture of our active ingredi-ents, a network of decentralized formulation and fi lling sites enables us to respond rapidly to local market needs. At these sites the active ingredients are processed into herbicides, fungicides, insec-ticides, seed treatments and Environmental Science products according to local requirements and application areas. Packaging of the products also takes place in these facilities. We continued to invest in our global production network in 2010, selectively expanding our capacities for important products.
In the BioScience business unit, we produce our seeds at locations close to our customers in Eu-rope, Asia, and North and South America. Our canola, cotton, rice and vegetable seed is produced in our own centers or grown under contract on a total area of more than 100,000 hectares.
MATERIALSCIENCEKey raw materials for our Material Science products are petrochemical feedstocks such as ben-zene, toluene and phenol. We generally purchase these materials on the procurement markets under long-term contracts. The operation of our production facilities also requires large amounts of energy, mostly in the form of electricity or steam. For steam generation, we aim for a balanced diversifi cation of fuels and – as with electricity – a mix of external procurement and captive production to minimize the price fl uctuation risk.
The principal production facilities of Material Science for the European market are located in Dormagen, Germany; Antwerp, Belgium; Krefeld, Germany; Brunsbüttel, Germany; and Tarra-gona, Spain. The major production site for the North American market is at Baytown, Texas, United States. In the Asia / Pacifi c region, the main sites are at Shanghai, China; and Map Ta Phut, Thailand. In the fi eld of commodities we endeavor to reduce costs by operating high-capacity production facilities that enable us to supply our markets on an international basis. We also have a large number of production facilities close to local markets in 20 countries to serve our differentiated businesses. Of these facilities, our systems houses formulate and supply custom-ized polyurethane systems, while others carry out compounding of polycarbonate granules close to the customer or manufacture our semi-fi nished products (polycarbonate sheet). We also operate regional production facilities for functional fi lms made of polycarbonate or thermo-plastic polyurethane.
Global production network for
agrochemical and seed products at CropScience
Mix of procurement and captive production of energies to minimize price fluctuation risk
Table of ConTenTs
Combined managemenT RepoRT

BAYER ANNUAL REPORT 2010 COMBINED MANAGEMENT REPORT 55
2. Business and Operating Environment2.4 Products, Distribution and Markets
2.4 Products, Distribution and Markets
Marketing activities within the Bayer Group are decentralized due to the diversifi ed business portfolio.
HEALTHCARE Health Care supplies more than 20,000 articles to meet the needs of patients and consumers in the various markets. The high number is due to the breadth of the product range and the various deliv-ery forms, dosages, pack sizes, and language versions of individual products and their packaging.
The Pharmaceuticals segment supplies prescription products in the areas of women’s health care, general medicine and specialty medicine. In the fi eld of medicines usually prescribed by general practitioners (General Medicine), we supply products such as Adalat® to treat high blood pressure and coronary heart disease, and Avalox® / Avelox® to treat certain infectious diseases. Our product portfolio in Women’s Healthcare encompasses contraceptive products such as yaz® / Yasmin® / Yasminelle® and Mirena®, and hormone replacement therapies such as Angeliq®. Our range of Specialty Medicine products, which are mainly prescribed by specialist physicians, includes the multiple sclerosis drug Betaferon® / Betaseron®, the hemophilia A therapy Kogenate®, and Nexavar® to treat certain types of cancer. Our contrast agents for diagnostic imaging include Ultravist®, Magnevist® and Gadovist®. In the pharmaceuticals market we are among the world’s top 15 compa-nies in terms of sales.
Our pharmaceutical products are primarily distributed through wholesalers, pharmacies and hos-pitals. Co-promotion and co-marketing agreements serve to optimize our distribution network. For example, the agreement with Johnson & Johnson subsidiary Ortho-McNeil concerning the joint further development and marketing of the anticoagulant Xarelto® ensures optimum progress in this area, conferring regional marketing rights that enable both partners to share in the prod-uct’s expected success. Another example is the strategic alliance with Merck & Co., Inc. (formerly Schering-Plough), United States, under which that company markets selected general medicine products in the United States. On the other hand we co-market Zetia®, a product of Merck & Co., Inc., in Japan.
Our Consumer Health segment chiefl y markets non-prescription products. The Consumer Care Division specializes in medicines available without a prescription, also known as over-the-counter (otc) products. We offer products in most otc categories, such as the pain relievers Aspirin® and Aleve® and the dermatology products Canesten® and Bepanthen® / Bepanthol®. The product range also includes nutritionals such as Supradyn®, One A Day®, Berocca® and Redoxon®, antacids and cough-and-cold products. Consumer Care is a leading player in the otc market. The division also includes prescription dermatology products. While the division’s sales and distribution channels outside Europe are typically supermarket chains, drugstores and other large retailers, pharmacies are the usual distribution channel in Europe.
In the Medical Care Division we offer user-friendly blood glucose monitoring devices such as the single-strip Contour® system and the multi-strip Breeze® system. We also market the Contour® usb meter, which features integrated diabetes management software and direct plug-in to com-puters, and the A1CNowTM system for determining long-term blood glucose control (A1c). Outside Europe, these products are generally sold to consumers through pharmacies, drugstores, mass merchants, hospitals or wholesalers. In Europe, they are sold mainly through pharmacies. As well as being among the top companies in the market for blood glucose monitoring devices, we are the world’s leading supplier of contrast agent injection systems for diagnostic and therapeutic medi-cal procedures in computed tomography, magnetic resonance imaging and molecular imaging, and of mechanical systems for removing thrombi from blood vessels. We also offer service prod-ucts for these systems. Our products are marketed to cardiologists, radiologists and vascular sur-geons in hospitals and out-patient clinical sites through a global direct sales organization, supple-mented in some cases by local distributors.
More than 20,000 articles worldwide
Consumer Health segment: focus on non-prescription products
Table of ConTenTs
Combined managemenT RepoRT
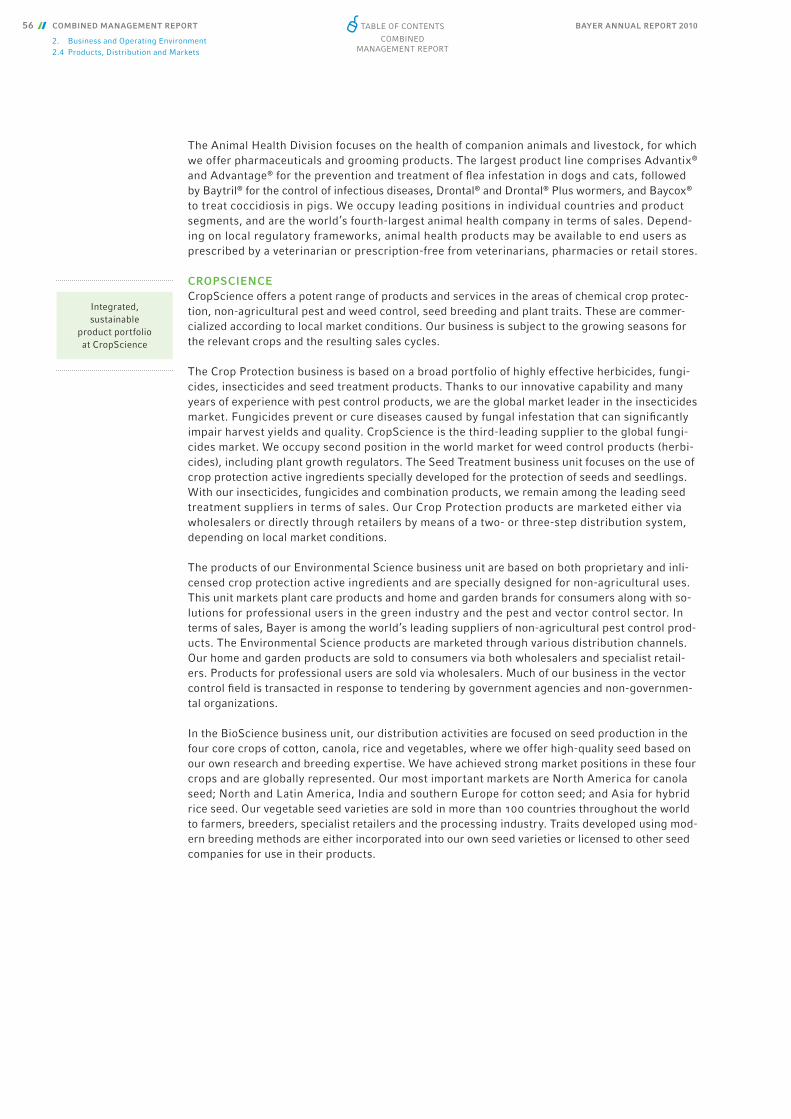
BAYER ANNUAL REPORT 201056 COMBINED MANAGEMENT REPORT
2. Business and Operating Environment2.4 Products, Distribution and Markets
The Animal Health Division focuses on the health of companion animals and livestock, for which we offer pharmaceuticals and grooming products. The largest product line comprises Advantix® and Advantage® for the prevention and treatment of fl ea infestation in dogs and cats, followed by Baytril® for the control of infectious diseases, Drontal® and Drontal® Plus wormers, and Baycox® to treat coccidiosis in pigs. We occupy leading positions in individual countries and product segments, and are the world’s fourth-largest animal health company in terms of sales. Depend-ing on local regulatory frameworks, animal health products may be available to end users as prescribed by a veterinarian or prescription-free from veterinarians, pharmacies or retail stores.
CROPSCIENCECropScience offers a potent range of products and services in the areas of chemical crop protec-tion, non-agricultural pest and weed control, seed breeding and plant traits. These are commer-cialized according to local market conditions. Our business is subject to the growing seasons for the relevant crops and the resulting sales cycles.
The Crop Protection business is based on a broad portfolio of highly effective herbicides, fungi-cides, insecticides and seed treatment products. Thanks to our innovative capability and many years of experience with pest control products, we are the global market leader in the insecticides market. Fungicides prevent or cure diseases caused by fungal infestation that can signifi cantly impair harvest yields and quality. CropScience is the third-leading supplier to the global fungi-cides market. We occupy second position in the world market for weed control products (herbi-cides), including plant growth regulators. The Seed Treatment business unit focuses on the use of crop protection active ingredients specially developed for the protection of seeds and seedlings. With our insecticides, fungicides and combination products, we remain among the leading seed treatment suppliers in terms of sales. Our Crop Protection products are marketed either via wholesalers or directly through retailers by means of a two- or three-step distribution system, depending on local market conditions.
The products of our Environmental Science business unit are based on both proprietary and inli-censed crop protection active ingredients and are specially designed for non-agricultural uses. This unit markets plant care products and home and garden brands for consumers along with so-lutions for professional users in the green industry and the pest and vector control sector. In terms of sales, Bayer is among the world’s leading suppliers of non-agricultural pest control prod-ucts. The Environmental Science products are marketed through various distribution channels. Our home and garden products are sold to consumers via both wholesalers and specialist retail-ers. Products for professional users are sold via wholesalers. Much of our business in the vector control fi eld is transacted in response to tendering by government agencies and non-governmen-tal organizations.
In the BioScience business unit, our distribution activities are focused on seed production in the four core crops of cotton, canola, rice and vegetables, where we offer high-quality seed based on our own research and breeding expertise. We have achieved strong market positions in these four crops and are globally represented. Our most important markets are North America for canola seed; North and Latin America, India and southern Europe for cotton seed; and Asia for hybrid rice seed. Our vegetable seed varieties are sold in more than 100 countries throughout the world to farmers, breeders, specialist retailers and the processing industry. Traits developed using mod-ern breeding methods are either incorporated into our own seed varieties or licensed to other seed companies for use in their products.
Integrated, sustainable
product portfolio at CropScience
Table of ConTenTs
Combined managemenT RepoRT
BAYER ANNUAL REPORT 2010 COMBINED MANAGEMENT REPORT 57
2. Business and Operating Environment2.4 Products, Distribution and Markets
MATERIALSCIENCEOne of the largest companies in the global chemical industry, Material Science is a leading manu-facturer and supplier of precursors for rigid and fl exible foams, plastic granules, and raw materi-als for coatings and adhesives. The subgroup holds leading competitive positions in these product groups in all regional markets. We also manufacture and market plastics sheet and functional fi lms as well as selected inorganic basic chemicals such as chlorine, sodium hydroxide solution, hydro-gen, hydrochloric acid and nitric acid. These chemicals serve either as raw materials (such as chlorine) for the manufacture of our products or are generated as byproducts (such as sodium hydroxide solution) and sold to external customers.
Our products are used mainly in the furniture, wood, construction, automotive, electrical / elec-tronics, information technology and communications, chemicals, textile, sports equipment, lei-sure goods and medical equipment industries. Our polyurethane raw materials, such as diphenyl-methane diisocyanate (mdi), toluene diisocyanate (tdi) and polyether, and the polyurethane systems based on them that are offered in the market are used, for example, in the production of mattresses, refrigerator insulations, automotive bumpers and shoe soles. Examples of applica-tions for our polycarbonates, which we market under the Makrolon®, Bayblend®, Makroblend® and other trademarks, include housings for electrical appliances, CDs / DVDs and car headlam-ps. The Coatings, Adhesives, Specialties business unit manufactures raw materials for coatings used in the automobile and commercial vehicle industries and for adhesives used in footwear, for example. This business unit also produces fi lms for applications including vehicle speedometers and computer housings.
We market our products mostly through regional and local distribution channels, making increasing use of e-commerce platforms for order processing. We also work with trading houses and local distributors who are responsible for business with small customers. Major customers with global operations are serviced directly by our key account managers.
MaterialScience has leading
competitive positions in all regions
Table of ConTenTs
Combined managemenT RepoRT

BAYER ANNUAL REPORT 201058 COMBINED MANAGEMENT REPORT
3. Performance by Subgroup, Segment and Region3.1 HealthCare
3. Performance by Subgroup, Segment and Region
3.1 HealthCare
Above: illustrationof blood cells
Key Data – HealthCare [Table 3.4]
2009 2010 Change
€ million € million %Fx & p adj.
%
Sales 15,988 16,913 + 5.8 + 1.7
Change in sales
Volume + 1.9% + 1.9%
Price + 1.9% – 0.2%
Currency + 0.6% + 4.7%
Portfolio – 0.6% – 0.6%
Sales by segment
Pharmaceuticals 10,467 10,908 + 4.2 + 0.9
Consumer Health 5,521 6,005 + 8.8 + 3.4
Sales by region
Europe 6,344 6,375 + 0.5
North America 4,634 4,666 + 0.7
Asia / Pacifi c 2,677 3,269 + 22.1
Latin America / Africa / Middle East 2,333 2,603 + 11.6
EBIT 2,640 1,861 – 29.5
Special items (372) (1,169)
EBIT before special items * 3,012 3,030 + 0.6
EBITDA* 4,148 4,116 – 0.8
Special items (320) (289)
EBITDA before special items * 4,468 4,405 – 1.4
EBITDA margin before special items * 27.9% 26.0%
Gross cash fl ow ** 3,153 2,948 – 6.5
Net cash fl ow ** 3,431 3,320 – 3.2
Fx & p adj. = currency- and portfolio-adjusted* For defi nition see Chapter 4.2 “Calculation of EBIT(DA) Before Special Items.”** For defi nition see Chapter 4.5 “Liquidity and Capital Expenditures of the Bayer Group.”
Table of ConTenTs
Combined managemenT RepoRT

BAYER ANNUAL REPORT 2010 COMBINED MANAGEMENT REPORT 59
3. Performance by Subgroup, Segment and Region3.1 HealthCare
Sales of the Health Care subgroup rose by 5.8% in 2010 to €16,913 million (2009: €15,988 mil-lion). Adjusted for currency and portfolio effects, the increase was 1.7%. The improvement was driven by the positive development of the Consumer Health segment.
ebit of the Health Care subgroup fell by 29.5% in 2010 to €1,861 million (2009: €2,640 million). Spe-cial items totaled minus €1,169 million (2009: minus €372 million); for details see below. ebit before special items, at €3,030 million (2009: €3,012 million), was in line with the previous year (+0.6%), while ebitda before special items declined by 1.4% to €4,405 million (2009: €4,468 million). This was largely attributable to the effects of health system reforms in various countries, the early generi-cization of yaz® in the United States and higher selling expenses in both segments. We also raised our spending on research and development. However, earnings were supported by posi-tive currency effects.
€ million
HealthCare Quarterly Sales [Graphic 3.8]
3,8433,869
Q120092010
4,1644,468
Q420092010
0 500 1,000 1,500 2,000 2,500 3,000 3,500 4,000
Q220092010
4,0454,305
Q320092010
3,9364,271
HealthCare Quarterly EBITDA Before Special Items
HealthCare Quarterly EBIT [Graphic 3.10] [Graphic 3.9]
€ million € million
20092010
Q2
Q3
Q4
20092010
20092010
20092010
Q1
0(400) 400 800 1,200
20092010
Q2
Q3
Q4
20092010
20092010
20092010
Q1
4000 800 1,200 1,600
675660
821595
681735
463(129)
1,0611,023
1,1121,122
1,1411,122
1,1541,138
Q1-3 2010 fi gures restated Q1-3 2010 fi gures restated
Table of ConTenTs
Combined managemenT RepoRT
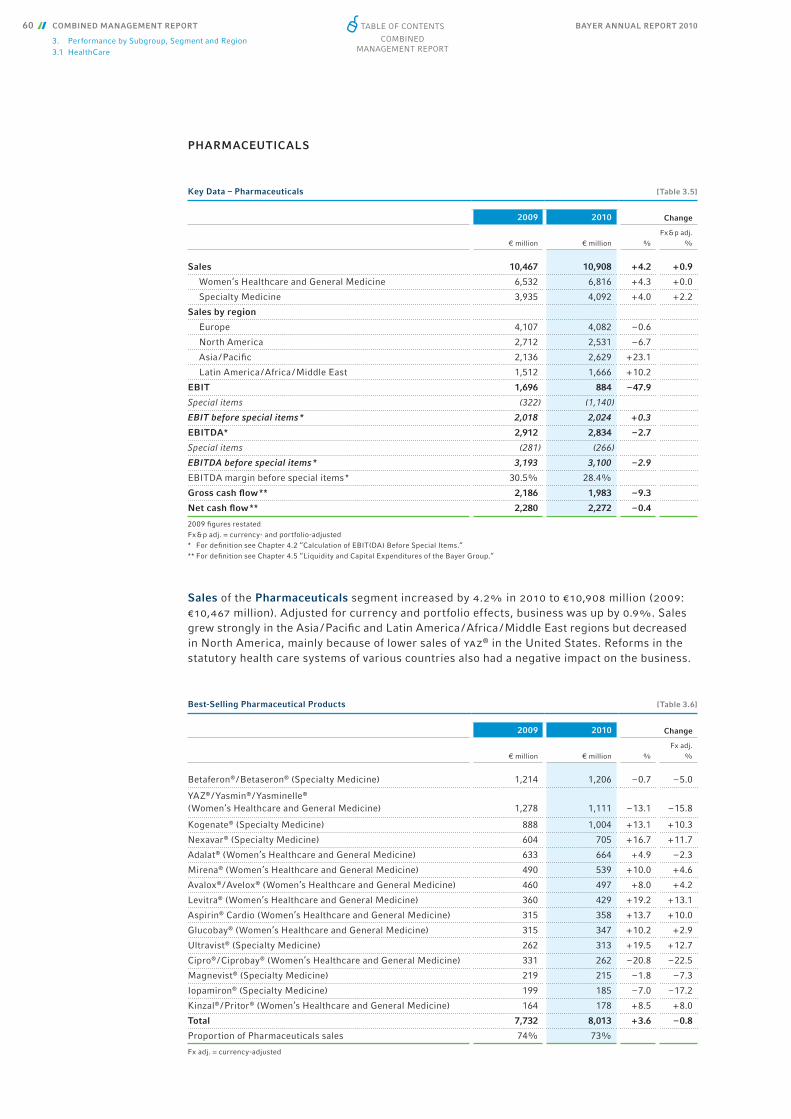
BAYER ANNUAL REPORT 201060 COMBINED MANAGEMENT REPORT
3. Performance by Subgroup, Segment and Region3.1 HealthCare
PHARMACEUTICALS
Sales of the Pharmaceuticals segment increased by 4.2% in 2010 to €10,908 million (2009: €10,467 million). Adjusted for currency and portfolio effects, business was up by 0.9%. Sales grew strongly in the Asia / Pacifi c and Latin America / Africa / Middle East regions but decreased in North America, mainly because of lower sales of yaz® in the United States. Reforms in the statutory health care systems of various countries also had a negative impact on the business.
Key Data – Pharmaceuticals [Table 3.5]
2009 2010 Change
€ million € million %
Fx & p adj.%
Sales 10,467 10,908 + 4.2 + 0.9
Women’s Healthcare and General Medicine 6,532 6,816 + 4.3 + 0.0
Specialty Medicine 3,935 4,092 + 4.0 + 2.2
Sales by region
Europe 4,107 4,082 – 0.6
North America 2,712 2,531 – 6.7
Asia / Pacifi c 2,136 2,629 + 23.1
Latin America / Africa / Middle East 1,512 1,666 + 10.2
EBIT 1,696 884 – 47.9
Special items (322) (1,140)
EBIT before special items * 2,018 2,024 + 0.3
EBITDA* 2,912 2,834 – 2.7
Special items (281) (266)
EBITDA before special items * 3,193 3,100 – 2.9
EBITDA margin before special items * 30.5% 28.4%
Gross cash fl ow ** 2,186 1,983 – 9.3
Net cash fl ow ** 2,280 2,272 – 0.4
2009 fi gures restatedFx & p adj. = currency- and portfolio-adjusted* For defi nition see Chapter 4.2 “Calculation of EBIT(DA) Before Special Items.“** For defi nition see Chapter 4.5 “Liquidity and Capital Expenditures of the Bayer Group.“
Best-Selling Pharmaceutical Products [Table 3.6]
Change 2009 2010
€ million € million %
Fx adj.%
Betaferon® / Betaseron® (Specialty Medicine) 1,214 1,206 – 0.7 – 5.0
YAZ® / Yasmin® / Yasminelle® (Women’s Healthcare and General Medicine) 1,278 1,111 – 13.1 – 15.8
Kogenate® (Specialty Medicine) 888 1,004 + 13.1 + 10.3
Nexavar® (Specialty Medicine) 604 705 + 16.7 + 11.7
Adalat® (Women’s Healthcare and General Medicine) 633 664 + 4.9 – 2.3
Mirena® (Women’s Healthcare and General Medicine) 490 539 + 10.0 + 4.6
Avalox® / Avelox® (Women’s Healthcare and General Medicine) 460 497 + 8.0 + 4.2
Levitra® (Women’s Healthcare and General Medicine) 360 429 + 19.2 + 13.1
Aspirin® Cardio (Women’s Healthcare and General Medicine) 315 358 + 13.7 + 10.0
Glucobay® (Women’s Healthcare and General Medicine) 315 347 + 10.2 + 2.9
Ultravist® (Specialty Medicine) 262 313 + 19.5 + 12.7
Cipro® / Ciprobay® (Women’s Healthcare and General Medicine) 331 262 – 20.8 – 22.5
Magnevist® (Specialty Medicine) 219 215 – 1.8 – 7.3
Iopamiron® (Specialty Medicine) 199 185 – 7.0 – 17.2
Kinzal® / Pritor® (Women’s Healthcare and General Medicine) 164 178 + 8.5 + 8.0
Total 7,732 8,013 + 3.6 – 0.8
Proportion of Pharmaceuticals sales 74% 73%
Fx adj. = currency-adjusted
Table of ConTenTs
Combined managemenT RepoRT

BAYER ANNUAL REPORT 2010 COMBINED MANAGEMENT REPORT 61
3. Performance by Subgroup, Segment and Region3.1 HealthCare
Sales of the Women’s Health Care and General Medicine business unit advanced by 4.3% to €6,816 million (2009: €6,532 million). After adjusting for exchange rates, sales were level with the prior year (+0.0%). There was a distinct drop in sales of the yaz® / Yasmin® / Yasminelle® line of oral contraceptives (Fx adj. -15.8%), mainly because a generic competitor entered the u.s. market in June 2010. We saw a positive sales trend for yaz® / Yasmin® / Yasminelle® outside the United States, chiefl y in light of higher volumes for yaz®. Sales of the hormone-releasing intra-uterine device Mirena® (Fx adj. +4.6%) moved ahead in all regions.
Business with our erectile dysfunction treatment Levitra® (Fx adj. +13.1%) increased signifi -cantly in the United States, where we benefi ted from our distribution partner’s new contract with a bulk customer. Sales of Aspirin® Cardio (Fx adj. +10.0%) for prevention of myocardial in-farction rose appreciably thanks to higher volumes, particularly in the Asia / Pacifi c and Latin America / Africa / Middle East regions. The growth in sales of our antihypertensive Kinzal® / Pritor® (Fx adj. +8.0%) was primarily due to its approval in October 2009 for the prevention of cardiovascular disease, a new indication for this product. Our antibiotic Avalox® / Avelox® ad-vanced by 4.2% (Fx adj.), thanks mainly to good business in the Asia / Pacifi c region. Sales of our oral antidiabetic Glucobay® (Fx adj. +2.9%) rose due to steady growth in China, while busi-ness receded elsewhere, particularly in Europe, on account of generic competition. Sales of Adalat® to treat high blood pressure (Fx adj. -2.3%) declined due to generic competition, espe-cially in Europe, and government-imposed price reductions in Japan. By contrast, sales rose in China. Sales of our antibiotic Cipro® / Ciprobay® fell substantially (Fx adj. -22.5%), mainly be-cause a u.s. government contract terminated in the fi rst quarter of 2010.
Sales of the Specialty Medicine business unit were up by 4.0% to €4,092 million (2009: €3,935 million). Adjusted for currency and portfolio effects, the increase came to 2.2%. Busi-ness with our cancer drug Nexavar® (Fx adj. +11.7%) again moved ahead in all regions, with especially strong growth in Asia / Pacifi c. This was largely due to higher sales in Japan. Our blood-clotting medication Kogenate® advanced by 10.3% (Fx adj.) thanks to volume growth in all regions. Business with the multiple sclerosis drug Betaferon® / Betaseron® was down by 5.0% (Fx adj.) overall. Pleasing sales growth for this product in the Asia / Pacifi c and Latin America / Africa / Middle East regions was offset by a drop in business in other countries, partic-ularly Germany, the United States and Russia, due to heightened competition. Business with the X-ray contrast agent Ultravist® (Fx adj. +12.7%) developed positively, especially in Latin America, where it replaced the older X-ray contrast agent Iopamiron®. Sales of Iopamiron® (Fx adj. -17.2%) decreased due to the resulting lower volume for the year and especially be-cause of price reductions in Japan. Among our contrast agents for magnetic resonance imaging (mri), Magnevist® (Fx adj. -7.3%) saw a continuing decline in sales. This was partly attributable to the change to Gadovist® (Fx adj. +14.7%), which posted strong growth, particularly in Europe.
ebit of the Pharmaceuticals segment fell by a substantial 47.9% in 2010 to €884 million (2009: €1,696 million) after special charges of €1,140 million (2009: €322 million). Of these charges, impairment losses on intangible assets accounted for €874 million, litigations for €177 million, the write-down of a receivable relating to expected future purchase price pay-ments for €56 million, and restructuring measures for €33 million. Of the impairment losses, an amount of €405 million was recognized on the “Schering” name in light of our new brand strat-egy. Following the regular review of our research and development pipeline, we also recognized impairment losses of €202 million on the sagopilone and Bonefos® research projects, and €267 million on our cancer drug Zevalin® and various Women’s Healthcare products. ebit be-fore special items came in level with the previous year at €2,024 million (+0.3%). ebitda before special items declined by 2.9% to €3,100 million (2009: €3,193 million). This contains positive cur-rency effects and a €68 million gain from the settlement of a patent dispute concerning yaz® that partially offset the margin loss during the year. On the other hand, we incurred higher research and development costs, mainly to support our Phase iii projects. Earnings were also diminished by lower sales of yaz® in the United States and the margin pressure exerted by health system reforms. In addition, we experienced an increase in selling expenses, mainly in connection with new product introductions and the reinforcement of our marketing activities as we expand the business in China.
Table of ConTenTs
Combined managemenT RepoRT
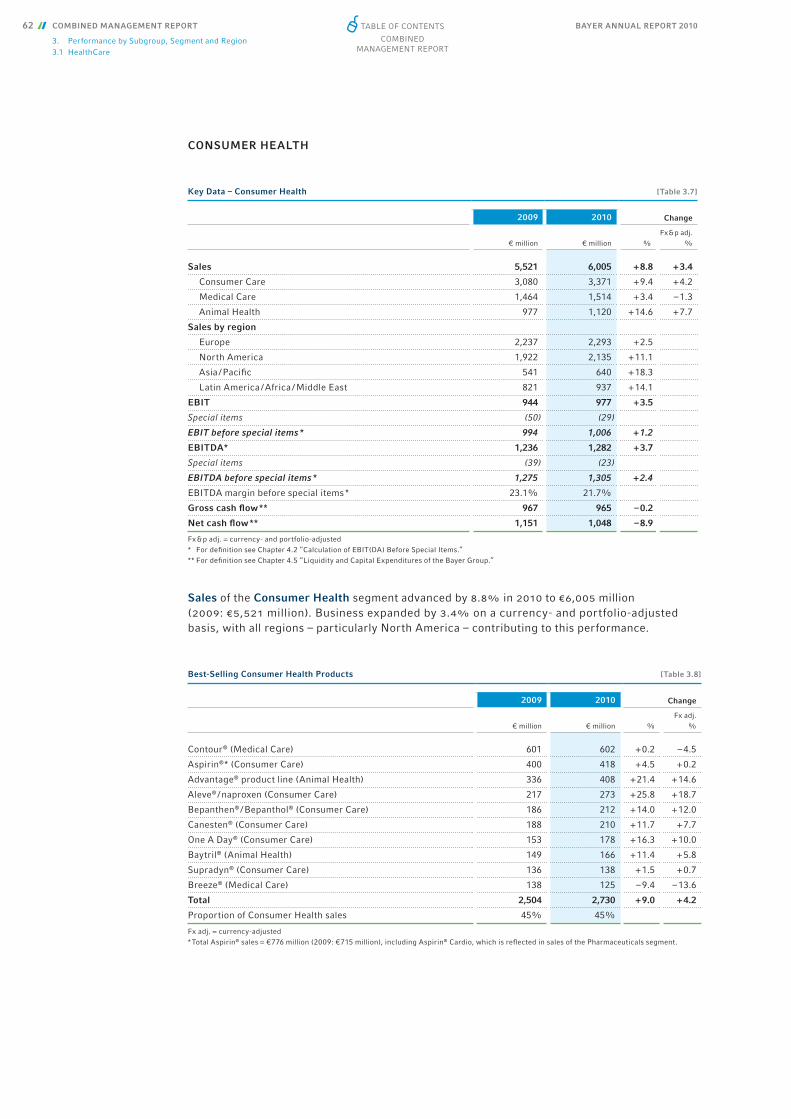
BAYER ANNUAL REPORT 201062 COMBINED MANAGEMENT REPORT
3. Performance by Subgroup, Segment and Region3.1 HealthCare
CONSUMER HEALTH
Sales of the Consumer Health segment advanced by 8.8% in 2010 to €6,005 million (2009: €5,521 million). Business expanded by 3.4% on a currency- and portfolio-adjusted basis, with all regions – particularly North America – contributing to this performance.
Key Data – Consumer Health [Table 3.7]
2009 2010 Change
€ million € million %
Fx & p adj.%
Sales 5,521 6,005 + 8.8 + 3.4
Consumer Care 3,080 3,371 + 9.4 + 4.2
Medical Care 1,464 1,514 + 3.4 – 1.3
Animal Health 977 1,120 + 14.6 + 7.7
Sales by region
Europe 2,237 2,293 + 2.5
North America 1,922 2,135 + 11.1
Asia / Pacifi c 541 640 + 18.3
Latin America / Africa / Middle East 821 937 + 14.1
EBIT 944 977 + 3.5
Special items (50) (29)
EBIT before special items * 994 1,006 + 1.2
EBITDA* 1,236 1,282 + 3.7
Special items (39) (23)
EBITDA before special items * 1,275 1,305 + 2.4
EBITDA margin before special items * 23.1% 21.7%
Gross cash fl ow ** 967 965 – 0.2
Net cash fl ow ** 1,151 1,048 – 8.9
Fx & p adj. = currency- and portfolio-adjusted* For defi nition see Chapter 4.2 “Calculation of EBIT(DA) Before Special Items.”** For defi nition see Chapter 4.5 “Liquidity and Capital Expenditures of the Bayer Group.”
Best-Selling Consumer Health Products [Table 3.8]
Change 2009 2010
€ million € million %
Fx adj.%
Contour® (Medical Care) 601 602 + 0.2 – 4.5
Aspirin®* (Consumer Care) 400 418 + 4.5 + 0.2
Advantage® product line (Animal Health) 336 408 + 21.4 + 14.6
Aleve® / naproxen (Consumer Care) 217 273 + 25.8 + 18.7
Bepanthen® / Bepanthol® (Consumer Care) 186 212 + 14.0 + 12.0
Canesten® (Consumer Care) 188 210 + 11.7 + 7.7
One A Day® (Consumer Care) 153 178 + 16.3 + 10.0
Baytril® (Animal Health) 149 166 + 11.4 + 5.8
Supradyn® (Consumer Care) 136 138 + 1.5 + 0.7
Breeze® (Medical Care) 138 125 – 9.4 – 13.6
Total 2,504 2,730 + 9.0 + 4.2
Proportion of Consumer Health sales 45% 45%
Fx adj. = currency-adjusted* Total Aspirin® sales = €776 million (2009: €715 million), including Aspirin® Cardio, which is refl ected in sales of the Pharmaceuticals segment.
Table of ConTenTs
Combined managemenT RepoRT

BAYER ANNUAL REPORT 2010 COMBINED MANAGEMENT REPORT 63
3. Performance by Subgroup, Segment and Region3.1 HealthCare
In the Consumer Care Division, sales climbed by 9.4% to €3,371 million (2009: €3,080 million). Adjusted for currency and portfolio effects, the increase came to 4.2%. A notable increase in demand for our products in the United States particularly benefi ted sales of the analgesic Aleve® (Fx adj. +18.7%) and the One A Day® line of dietary supplements (Fx adj. +10.0%). Sales of Aspirin® (Fx adj. +0.2%) were fl at with the previous year. Business with the Bepanthen® / Bepanthol® line of skincare products (Fx adj. +12.0%) developed well, especially in Europe and Latin America, thanks to higher volumes and selling prices. Our antifungal Canesten® (Fx adj. +7.7%) advanced, mainly as a result of new product launches in Canada. Sales of Supradyn® multivitamins were level with the prior year (Fx adj. +0.7%).
In the Medical Care Division, sales gained 3.4% to €1,514 million (2009: €1,464 million). On a currency-adjusted basis, business was down by 1.3%. This was chiefl y attributable to the negative development of the diabetes care market in the United States, where both prices and volumes declined. Sales of our Breeze® (Fx adj. -13.6%) and Contour® (Fx adj. -4.5%) lines of blood glucose meters were particularly affected. In Europe, however, the Contour® business performed well, due in part to new product launches. Sales of our medical equipment business (Fx adj. +7.2%) showed an overall improvement, particularly in the United States.
Sales of the Animal Health Division climbed by a very satisfactory 14.6% to €1,120 million (2009: €977 million), thanks to the positive development in all regions. After adjusting for cur-rency effects, the increase came to 7.7%. The strongest growth was achieved in North Ameri-ca. Business with the Advantage® line of fl ea, tick and worm control products (Fx adj. +14.6%) expanded signifi cantly, especially in the United States, where we benefi ted from the initial stocking and further expansion of a new distribution channel through pet-product retailers. Sales of our Baytril® antibiotic (Fx adj. +5.8%) rose in the United States, while business in Eu-rope was down because of the increasing generic competition.
ebit of the Consumer Health segment improved by 3.5% in 2010 to €977 million (2009: €944 mil-lion) after special charges of €29 million (2009: €50 million), which in 2010 were incurred in connection with restructuring. ebit before special items rose by 1.2% to €1,006 million (2009: €994 million). ebitda before special items grew by 2.4% to €1,305 million (2009: €1,275 mil-lion). This was mainly attributable to the positive business performance at Consumer Care and Animal Health and to favorable currency effects. However, earnings were held back by an increase in selling expenses that was mainly caused by Consumer Care’s marketing and distribution costs returning to normal levels following a reduction in the crisis year 2009.
Table of ConTenTs
Combined managemenT RepoRT
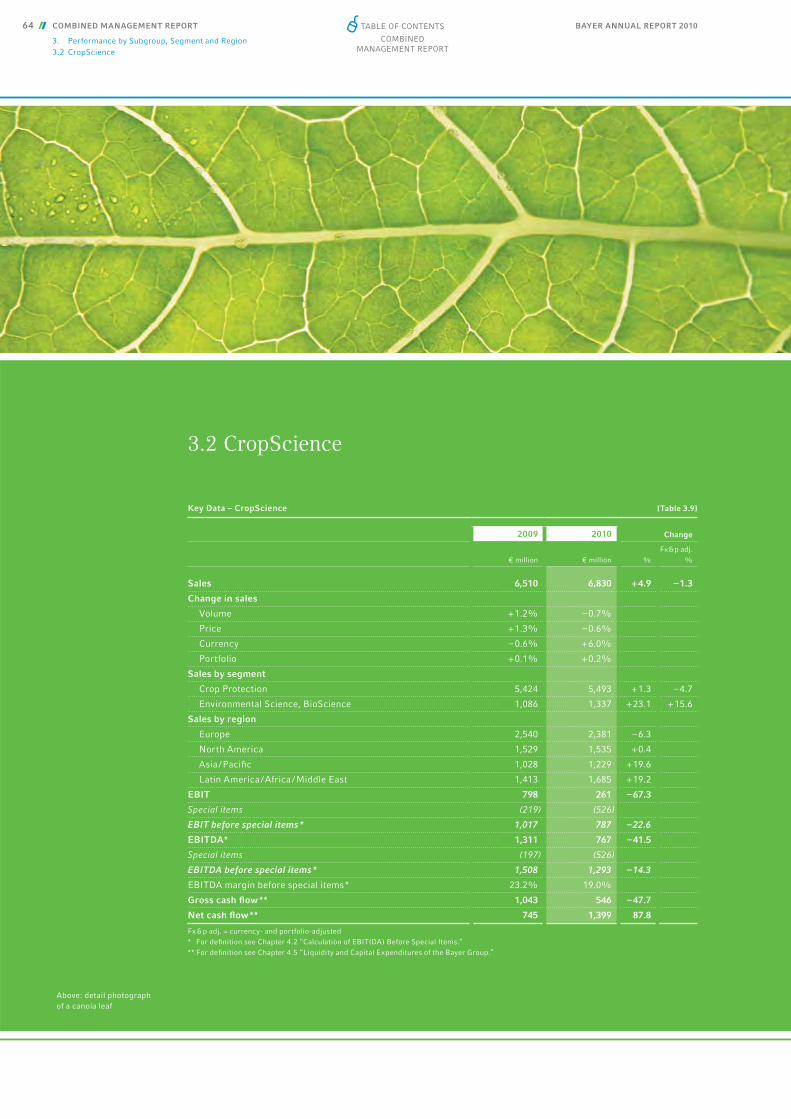
BAYER ANNUAL REPORT 201064 COMBINED MANAGEMENT REPORT
3. Performance by Subgroup, Segment and Region3.2 CropScience
3.2 CropScience
Above: detail photographof a canola leaf
Key Data – CropScience [Table 3.9]
2009 2010 Change
€ million € million %Fx & p adj.
%
Sales 6,510 6,830 + 4.9 – 1.3
Change in sales
Volume + 1.2% – 0.7%
Price + 1.3% – 0.6%
Currency – 0.6% + 6.0%
Portfolio + 0.1% + 0.2%
Sales by segment
Crop Protection 5,424 5,493 + 1.3 – 4.7
Environmental Science, BioScience 1,086 1,337 + 23.1 + 15.6
Sales by region
Europe 2,540 2,381 – 6.3
North America 1,529 1,535 + 0.4
Asia / Pacifi c 1,028 1,229 + 19.6
Latin America / Africa / Middle East 1,413 1,685 + 19.2
EBIT 798 261 – 67.3
Special items (219) (526)
EBIT before special items * 1,017 787 – 22.6
EBITDA* 1,311 767 – 41.5
Special items (197) (526)
EBITDA before special items * 1,508 1,293 – 14.3
EBITDA margin before special items * 23.2% 19.0%
Gross cash fl ow ** 1,043 546 – 47.7
Net cash fl ow ** 745 1,399 87.8
Fx & p adj. = currency- and portfolio-adjusted* For defi nition see Chapter 4.2 “Calculation of EBIT(DA) Before Special Items.”** For defi nition see Chapter 4.5 “Liquidity and Capital Expenditures of the Bayer Group.”
Table of ConTenTs
Combined managemenT RepoRT
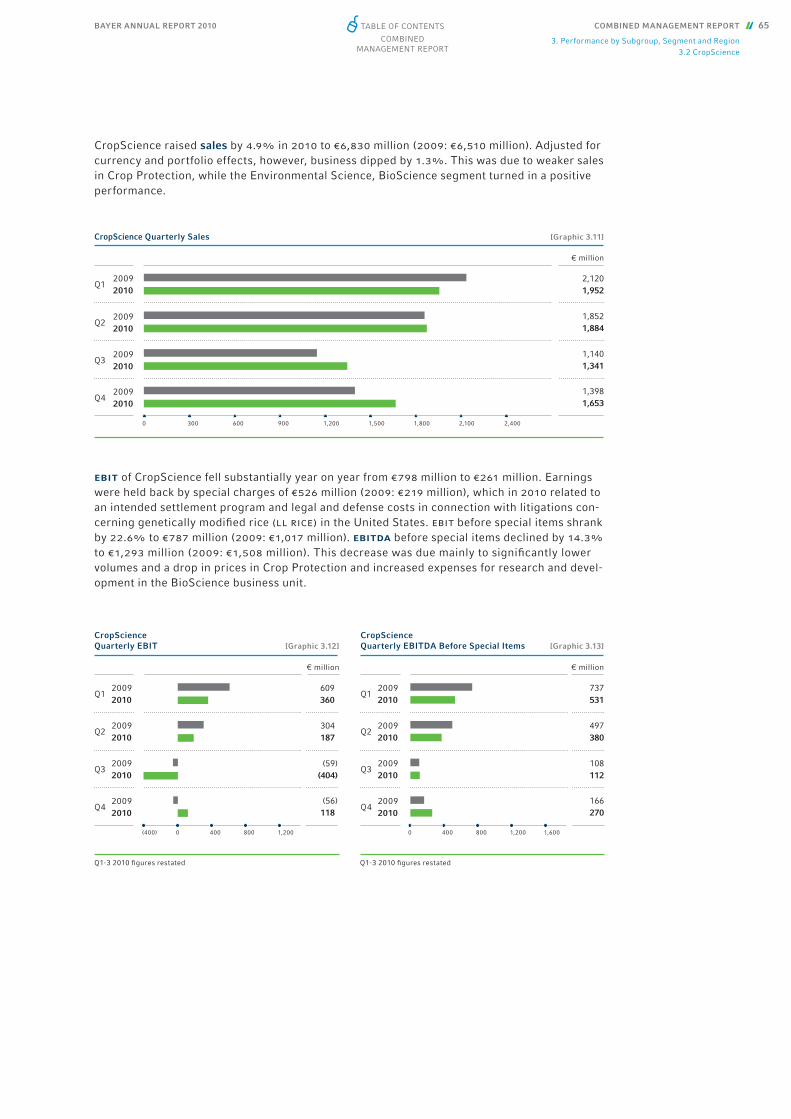
BAYER ANNUAL REPORT 2010 COMBINED MANAGEMENT REPORT 65
3. Performance by Subgroup, Segment and Region3.2 CropScience
CropScience raised sales by 4.9% in 2010 to €6,830 million (2009: €6,510 million). Adjusted for currency and portfolio effects, however, business dipped by 1.3%. This was due to weaker sales in Crop Protection, while the Environmental Science, BioScience segment turned in a positive performance.
ebit of CropScience fell substantially year on year from €798 million to €261 million. Earnings were held back by special charges of €526 million (2009: €219 million), which in 2010 related to an intended settlement program and legal and defense costs in connection with litigations con-cerning genetically modifi ed rice (ll rice) in the United States. ebit before special items shrank by 22.6% to €787 million (2009: €1,017 million). ebitda before special items declined by 14.3% to €1,293 million (2009: €1,508 million). This decrease was due mainly to signifi cantly lower volumes and a drop in prices in Crop Protection and increased expenses for research and devel-opment in the BioScience business unit.
€ million
CropScience Quarterly Sales [Graphic 3.11]
Q120092010
Q420092010
0 300 600 900 1,200 1,500 1,800 2,100 2,400
Q220092010
Q320092010
2,1201,952
1,8521,884
1,1401,341
1,3981,653
20092010
Q2
Q3
Q4
20092010
20092010
20092010
Q1
0(400) 400 800 1,200
20092010
Q2
Q3
Q4
20092010
20092010
20092010
Q1
4000 800 1,200 1,600
737531
497380
108112
166270
609360
304187
(59)(404)
(56)118
CropScience Quarterly EBITDA Before Special Items
CropScience Quarterly EBIT
€ million € million
[Graphic 3.13] [Graphic 3.12]
Q1-3 2010 fi gures restated Q1-3 2010 fi gures restated
Table of ConTenTs
Combined managemenT RepoRT

BAYER ANNUAL REPORT 201066 COMBINED MANAGEMENT REPORT
3. Performance by Subgroup, Segment and Region3.2 CropScience
CROP PROTECTION
Sales in the Crop Protection segment rose by 1.3% in 2010 to €5,493 million (2009: €5,424 mil-lion). Adjusted for shifts in currency parities, sales were down by 4.7%. Business with our seed treatments, herbicides and fungicides trended downward in a shrinking market. By contrast, busi-ness with our insecticides expanded.
Best-Selling CropScience Products * [Table 3.10]
Change 2009 2010
€ million € million %
Fx adj.%
Confi dor® / Gaucho® / Admire® / Merit®
(Insecticides / Seed Treatment / Environmental Science) 606 597 – 1.5 – 7.0
Flint® / Stratego® / Sphere® / Nativo® (Fungicides) 400 453 + 13.3 + 6.6
Basta® / Liberty® / Rely® / Ignite® (Herbicides) 323 270 – 16.4 – 24.6
Proline® / Input® / Prosaro® (Fungicides) 267 259 – 3.0 – 7.0
Atlantis® (Herbicides) 231 210 – 9.1 – 10.7
Folicur® / Raxil® (Fungicides / Seed Treatment) 210 206 – 1.9 – 8.3
Poncho® (Seed Treatment) 183 192 + 4.9 – 2.1
Decis® / K-Othrine® (Insecticides / Environmental Science) 170 184 + 8.2 + 1.2
Fandango® (Fungicides) 146 140 – 4.1 – 4.9
Puma® (Herbicides) 167 139 – 16.8 – 24.0
Total 2,703 2,650 – 2.0 – 7.6
Proportion of CropScience sales 42% 39%
Fx adj. = currency-adjusted* Figures are based on active ingredient class. For the sake of clarity, only the principal brands of the Crop Protection and Environmental Science business units are listed.
Key Data – Crop Protection [Table 3.11]
2009 2010 Change
€ million € million %
Fx & p adj.%
Sales 5,424 5,493 + 1.3 – 4.7
Herbicides 1,986 1,944 – 2.1 – 8.3
Fungicides 1,564 1,570 + 0.4 – 5.0
Insecticides 1,234 1,370 + 11.0 + 4.2
Seed Treatment 640 609 – 4.8 – 10.2
Sales by region
Europe 2,206 2,030 – 8.0
North America 1,081 956 – 11.6
Asia / Pacifi c 862 1,021 + 18.4
Latin America / Africa / Middle East 1,275 1,486 + 16.5
EBIT 713 600 – 15.8
Special items (162) 0
EBIT before special items * 875 600 – 31.4
EBITDA* 1,161 1,025 – 11.7
Special items (140) 0
EBITDA before special items * 1,301 1,025 – 21.2
EBITDA margin before special items * 24.0% 18.7%
Gross cash fl ow ** 924 743 – 19.6
Net cash fl ow ** 591 1,079 + 82.6
Fx & p adj. = currency- and portfolio-adjusted* For defi nition see Chapter 4.2 “Calculation of EBIT(DA) Before Special Items.”** For defi nition see Chapter 4.5 “Liquidity and Capital Expenditures of the Bayer Group.”
Table of ConTenTs
Combined managemenT RepoRT
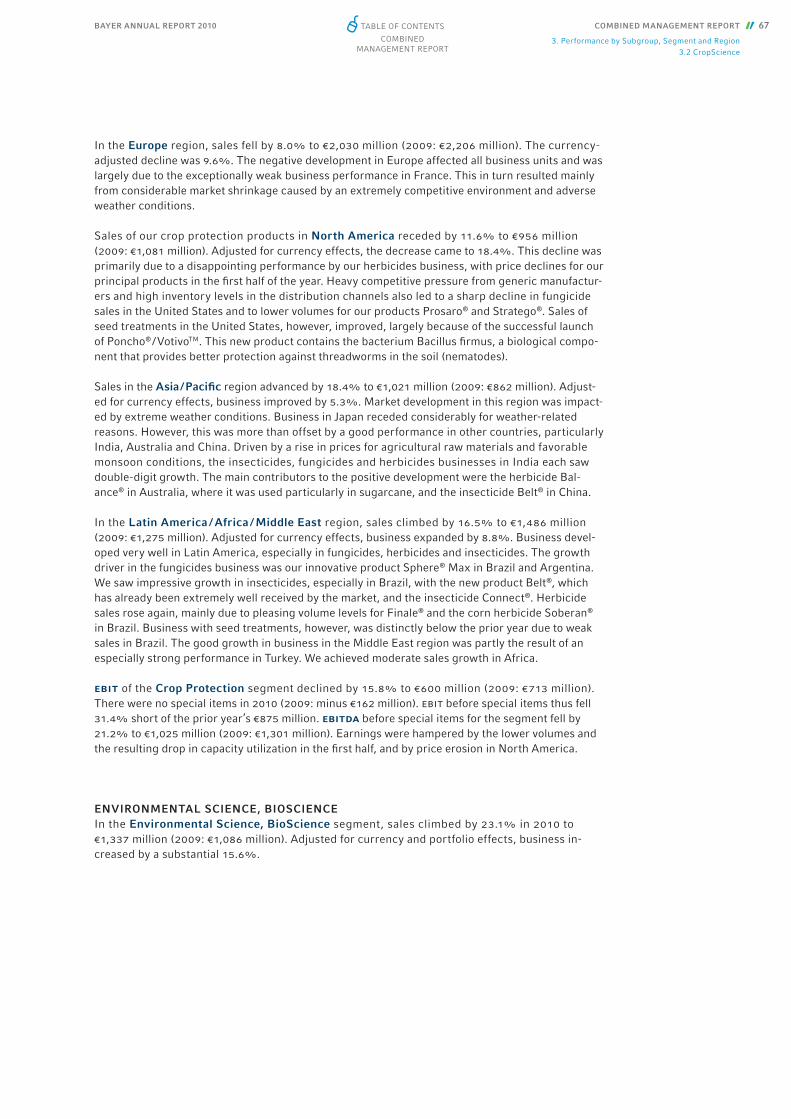
BAYER ANNUAL REPORT 2010 COMBINED MANAGEMENT REPORT 67
3. Performance by Subgroup, Segment and Region3.2 CropScience
In the Europe region, sales fell by 8.0% to €2,030 million (2009: €2,206 million). The currency- adjusted decline was 9.6%. The negative development in Europe affected all business units and was largely due to the exceptionally weak business performance in France. This in turn resulted mainly from considerable market shrinkage caused by an extremely competitive environment and adverse weather conditions.
Sales of our crop protection products in North America receded by 11.6% to €956 million (2009: €1,081 million). Adjusted for currency effects, the decrease came to 18.4%. This decline was primarily due to a disappointing performance by our herbicides business, with price declines for our principal products in the fi rst half of the year. Heavy competitive pressure from generic manufactur-ers and high inventory levels in the distribution channels also led to a sharp decline in fungicide sales in the United States and to lower volumes for our products Prosaro® and Stratego®. Sales of seed treatments in the United States, however, improved, largely because of the successful launch of Poncho® / VotivoTM. This new product contains the bacterium Bacillus fi rmus, a biological compo-nent that provides better protection against threadworms in the soil (nematodes).
Sales in the Asia / Pacifi c region advanced by 18.4% to €1,021 million (2009: €862 million). Adjust-ed for currency effects, business improved by 5.3%. Market development in this region was impact-ed by extreme weather conditions. Business in Japan receded considerably for weather-related reasons. However, this was more than offset by a good performance in other countries, particularly India, Australia and China. Driven by a rise in prices for agricultural raw materials and favorable monsoon conditions, the insecticides, fungicides and herbicides businesses in India each saw double-digit growth. The main contributors to the positive development were the herbicide Bal-ance® in Australia, where it was used particularly in sugarcane, and the insecticide Belt® in China.
In the Latin America / Africa / Middle East region, sales climbed by 16.5% to €1,486 million (2009: €1,275 million). Adjusted for currency effects, business expanded by 8.8%. Business devel-oped very well in Latin America, especially in fungicides, herbicides and insecticides. The growth driver in the fungicides business was our innovative product Sphere® Max in Brazil and Argentina. We saw impressive growth in insecticides, especially in Brazil, with the new product Belt®, which has already been extremely well received by the market, and the insecticide Connect®. Herbicide sales rose again, mainly due to pleasing volume levels for Finale® and the corn herbicide Soberan® in Brazil. Business with seed treatments, however, was distinctly below the prior year due to weak sales in Brazil. The good growth in business in the Middle East region was partly the result of an especially strong performance in Turkey. We achieved moderate sales growth in Africa.
ebit of the Crop Protection segment declined by 15.8% to €600 million (2009: €713 million). There were no special items in 2010 (2009: minus €162 million). ebit before special items thus fell 31.4% short of the prior year’s €875 million. ebitda before special items for the segment fell by 21.2% to €1,025 million (2009: €1,301 million). Earnings were hampered by the lower volumes and the resulting drop in capacity utilization in the fi rst half, and by price erosion in North America.
ENVIRONMENTAL SCIENCE, BIOSCIENCEIn the Environmental Science, BioScience segment, sales climbed by 23.1% in 2010 to €1,337 million (2009: €1,086 million). Adjusted for currency and portfolio effects, business in-creased by a substantial 15.6%.
Table of ConTenTs
Combined managemenT RepoRT
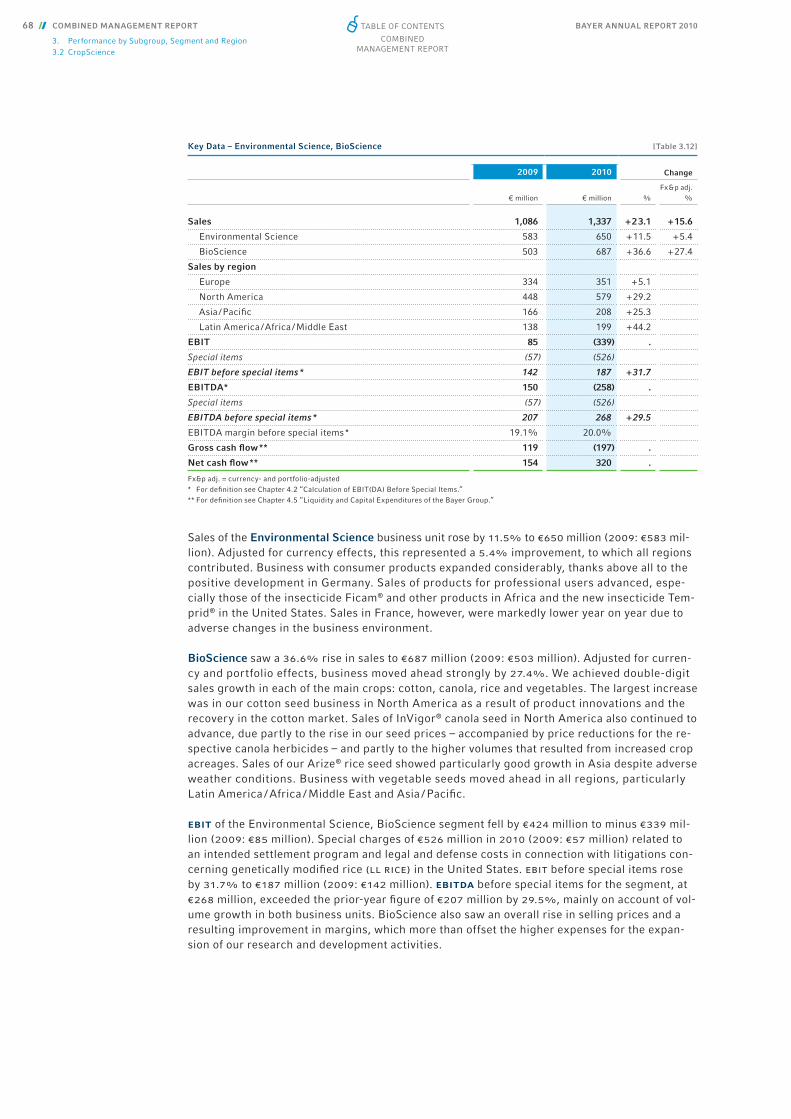
BAYER ANNUAL REPORT 201068 COMBINED MANAGEMENT REPORT
3. Performance by Subgroup, Segment and Region3.2 CropScience
Sales of the Environmental Science business unit rose by 11.5% to €650 million (2009: €583 mil-lion). Adjusted for currency effects, this represented a 5.4% improvement, to which all regions contributed. Business with consumer products expanded considerably, thanks above all to the positive development in Germany. Sales of products for professional users advanced, espe-cially those of the insecticide Ficam® and other products in Africa and the new insecticide Tem-prid® in the United States. Sales in France, however, were markedly lower year on year due to adverse changes in the business environment.
BioScience saw a 36.6% rise in sales to €687 million (2009: €503 million). Adjusted for curren-cy and portfolio effects, business moved ahead strongly by 27.4%. We achieved double-digit sales growth in each of the main crops: cotton, canola, rice and vegetables. The largest increase was in our cotton seed business in North America as a result of product innovations and the recovery in the cotton market. Sales of InVigor® canola seed in North America also continued to advance, due partly to the rise in our seed prices – accompanied by price reductions for the re-spective canola herbicides – and partly to the higher volumes that resulted from increased crop acreages. Sales of our Arize® rice seed showed particularly good growth in Asia despite adverse weather conditions. Business with vegetable seeds moved ahead in all regions, particularly Latin America / Africa / Middle East and Asia / Pacifi c.
ebit of the Environmental Science, BioScience segment fell by €424 million to minus €339 mil-lion (2009: €85 million). Special charges of €526 million in 2010 (2009: €57 million) related to an intended settlement program and legal and defense costs in connection with litigations con-cerning genetically modifi ed rice (ll rice) in the United States. ebit before special items rose by 31.7% to €187 million (2009: €142 million). ebitda before special items for the segment, at €268 million, exceeded the prior-year fi gure of €207 million by 29.5%, mainly on account of vol-ume growth in both business units. BioScience also saw an overall rise in selling prices and a resulting improvement in margins, which more than offset the higher expenses for the expan-sion of our research and development activities.
Key Data – Environmental Science, BioScience [Table 3.12]
2009 2010 Change
€ million € million %
Fx & p adj.%
Sales 1,086 1,337 + 2 3.1 + 15.6
Environmental Science 583 650 + 11.5 + 5.4
BioScience 503 687 + 36.6 + 27.4
Sales by region
Europe 334 351 + 5.1
North America 448 579 + 29.2
Asia / Pacifi c 166 208 + 25.3
Latin America / Africa / Middle East 138 199 + 44.2
EBIT 85 (339) .
Special items (57) (526)
EBIT before special items * 142 187 + 31.7
EBITDA* 150 (258) .
Special items (57) (526)
EBITDA before special items * 207 268 + 29.5
EBITDA margin before special items * 19.1% 20.0%
Gross cash fl ow ** 119 (197) .
Net cash fl ow ** 154 320 .
Fx&p adj. = currency- and portfolio-adjusted* For defi nition see Chapter 4.2 “Calculation of EBIT(DA) Before Special Items.”** For defi nition see Chapter 4.5 “Liquidity and Capital Expenditures of the Bayer Group.”
Table of ConTenTs
Combined managemenT RepoRT

BAYER ANNUAL REPORT 2010 COMBINED MANAGEMENT REPORT 69
3. Performance by Subgroup, Segment and Region3.3 MaterialScience
Above: granules of Makrolon® high-performance polycarbonate
3.3 MaterialScience
Key Data – MaterialScience [Table 3.13]
2009 2010 Change
€ million € million %Fx&p adj.
%
Sales 7,520 10,154 + 35.0 + 30.1
Change in sales
Volume – 12.4% + 23.8%
Price – 12.3% + 6.3%
Currency + 1.6% + 4.9%
Portfolio + 0.3% 0.0%
Sales by business unit
Polyurethanes 3,783 5,024 + 32.8 + 27.8
Polycarbonates 1,873 2,791 + 49.0 + 42.9
Coatings, Adhesives, Specialties 1,364 1,791 + 31.3 + 27.2
Industrial Operations 500 548 + 9.6 + 7.7
Sales by region
Europe 3,054 3,950 + 29.3
North America 1,536 2,022 + 31.6
Asia / Pacifi c 1,951 2,907 + 49.0
Latin America / Africa / Middle East 979 1,275 + 30.2
EBIT (266) 780 .
Special items (140) 0
EBIT before special items * (126) 780 .
EBITDA* 341 1,356 .
Special items (105) 0
EBITDA before special items * 446 1,356 .
EBITDA margin before special items * 5.9% 13.4%
Gross cash fl ow ** 319 1,058 .
Net cash fl ow ** 849 763 – 10.1
Fx&p adj. = currency- and portfolio-adjusted* For defi nition see Chapter 4.2 “Calculation of EBIT(DA) Before Special Items.”** For defi nition see Chapter 4.5 “Liquidity and Capital Expenditures of the Bayer Group.”
Table of ConTenTs
Combined managemenT RepoRT

BAYER ANNUAL REPORT 201070 COMBINED MANAGEMENT REPORT
3. Performance by Subgroup, Segment and Region3.3 MaterialScience
The positive business performance of Material Science in 2010 was driven by the marked recovery in the economy following the global fi nancial and economic crisis. While business continued to be held back at the beginning of the year, sales in the fi nal three quarters returned to pre-crisis levels. Sales in 2010 came in at €10,154 million, up 35.0% (Fx & portfolio adj. +30.1%) against the prior-year fi gure of €7,520 million. This substantial growth resulted from double-digit volume increases in all business units and regions due to considerably higher demand from all of our main customer industries. Volumes, too, thus regained pre-crisis levels. We also achieved higher selling prices overall compared with the previous year, implementing signifi cant increases in the Asia / Pacifi c, Europe and Latin America / Africa / Middle East regions. Prices in North America were level with the previous year.
Sales of the Polyurethanes business unit advanced by 32.8% to €5,024 million (2009: €3,783 mil-lion). On a currency- and portfolio-adjusted basis, business improved by 27.8%. Growth was mainly attributable to signifi cantly higher volumes in all product groups – diphenylmethane diiso-cyanate (mdi), toluene diisocyanate (tdi) and polyether – and in all regions. The largest increases in absolute terms were registered in Europe and Asia / Pacifi c, where we also signifi cantly raised selling prices. As a result, we recorded a positive price effect overall despite price stagnation in Latin America / Africa / Middle East and North America.
€ million
MaterialScience Quarterly Sales [Graphic 3.14]
Q120092010
Q420092010
0 400 800 1,200 1,600 2,000 2,400 2,800 3,200
Q220092010
Q320092010
1,6362,216
1,8302,689
2,0382,665
2,0162,584
Table of ConTenTs
Combined managemenT RepoRT

BAYER ANNUAL REPORT 2010 COMBINED MANAGEMENT REPORT 71
3. Performance by Subgroup, Segment and Region3.3 MaterialScience
Sales of the Polycarbonates business unit climbed by 49.0% (Fx adj. +42.9%) to €2,791 million (2009: €1,873 million). This was largely the result of the gratifying business trend in our granules product group, which saw substantial growth in volumes and selling prices in all regions. Sales of polycarbonate sheet / semi-fi nished products also increased. Here we benefi ted from higher vol-umes in all regions, which more than offset the overall drop in selling prices.
The Coatings, Adhesives, Specialties business unit posted sales of €1,791 million, up 31.3% (Fx adj. +27.2%) from the prior-year fi gure of €1,364 million. Growth was driven by signifi cantly higher volumes in all product groups and regions, with rising demand in Asia / Pacifi c and Europe having a particularly positive effect. While selling prices were low in the fi rst quarter, we were able to raise them as the year progressed, restoring prices for the year as a whole to 2009 levels.
Sales of Industrial Operations gained 9.6% (Fx adj. +7.7%) to €548 million (2009: €500 million). In the two primary regional markets – Europe and North America – we achieved signifi cant vol-ume increases that more than offset the drop in prices.
The markedly improved business situation was also refl ected in earnings. ebit rose to €780 mil-lion (2009: minus €266 million). There were no special items (2009: minus €140 million). ebitda before special items came in well ahead of the prior year at €1,356 million (2009: €446 million), thanks mainly to substantial volume growth. We also benefi ted from increased selling prices for our products, which more than offset the price increases on the raw material markets. Effi ciency improvements had a further positive impact.
20092010
Q2
Q3
Q4
20092010
20092010
20092010
Q1
0(300) 300 600 900
20092010
Q2
Q3
Q4
20092010
20092010
20092010
Q1
0(300) 300 600 900
(116)278
121373
238408
203297
(281)137
(84)228
85259
14156
MaterialScienceQuarterly EBITDA Before Special Items
MaterialScienceQuarterly EBIT
€ million € million
[Graphic 3.16] [Graphic 3.15]
Q1-3 2010 fi gures restated Q1-3 2010 fi gures restated
Table of ConTenTs
Combined managemenT RepoRT

BAYER ANNUAL REPORT 201072 COMBINED MANAGEMENT REPORT
3 Performance by Subgroup, Segment and Region3.4 Performance by Region
3.4 Performance by Region
4. Earnings; Asset and Financial Position of the Bayer Group
4.1 Earnings Performance of the Bayer Group
Sales of the Bayer Group rose by 12.6% from the previous year to €35,088 million (2009: €31,168 million), thanks largely to the recovery in the Material Science business. Adjusted for currency and portfolio effects, sales grew by 8.0%.
Sales by Region and Segment (by Market)
Europe North America
2009 2010 2009 2010
€ million € million % yoyFx adj.% yoy € million € million % yoy
Fx adj.% yoy
HealthCare 6,344 6,375 + 0.5 – 1.1 4,634 4,666 + 0.7 – 4.9
Pharmaceuticals 4,107 4,082 – 0.6 – 2.0 2,712 2,531 – 6.7 – 11.5
Consumer Health 2,237 2,293 + 2.5 + 0.8 1,922 2,135 + 11.1 + 4.4
CropScience 2,540 2,381 – 6.3 – 7.7 1,529 1,535 + 0.4 – 6.4
Crop Protection 2,206 2,030 – 8.0 – 9.6 1,081 956 – 11.6 – 18.4
Environmental Science, BioScience 334 351 + 5.1 + 4.5 448 579 + 29.2 + 22.7
MaterialScience 3,054 3,950 + 29.3 + 29.2 1,536 2,022 + 31.6 + 24.5
Group (incl. reconciliation) 12,968 13,751 + 6.0 + 5.0 7,705 8,228 + 6.8 + 0.7
yoy = year on year; Fx adj. = currency-adjusted
Bayer Group Summary Income Statements [Table 3.15]
2009 2010 Change
€ million € million %
Sales 31,168 35,088 + 12.6
Cost of goods sold 15,135 17,103 + 13.0
Selling expenses 7,923 8,803 + 11.1
Research and development expenses 2,746 3,053 + 11.2
General administration expenses 1,623 1,647 + 1.5
Other operating income and expenses – net (735) (1,752) .
EBIT [operating result] 3,006 2,730 – 9.2
Non-operating result (1,136) (1,009) + 11.2
Income before income taxes 1,870 1,721 – 8.0
Income taxes (511) (411) – 19.6
Income after taxes 1,359 1,310 – 3.6
of which attributable to non-controlling interest 0 9 .
of which attributable to Bayer AG stockholders (net income) 1,359 1,301 – 4.3
Table of ConTenTs
Combined managemenT RepoRT
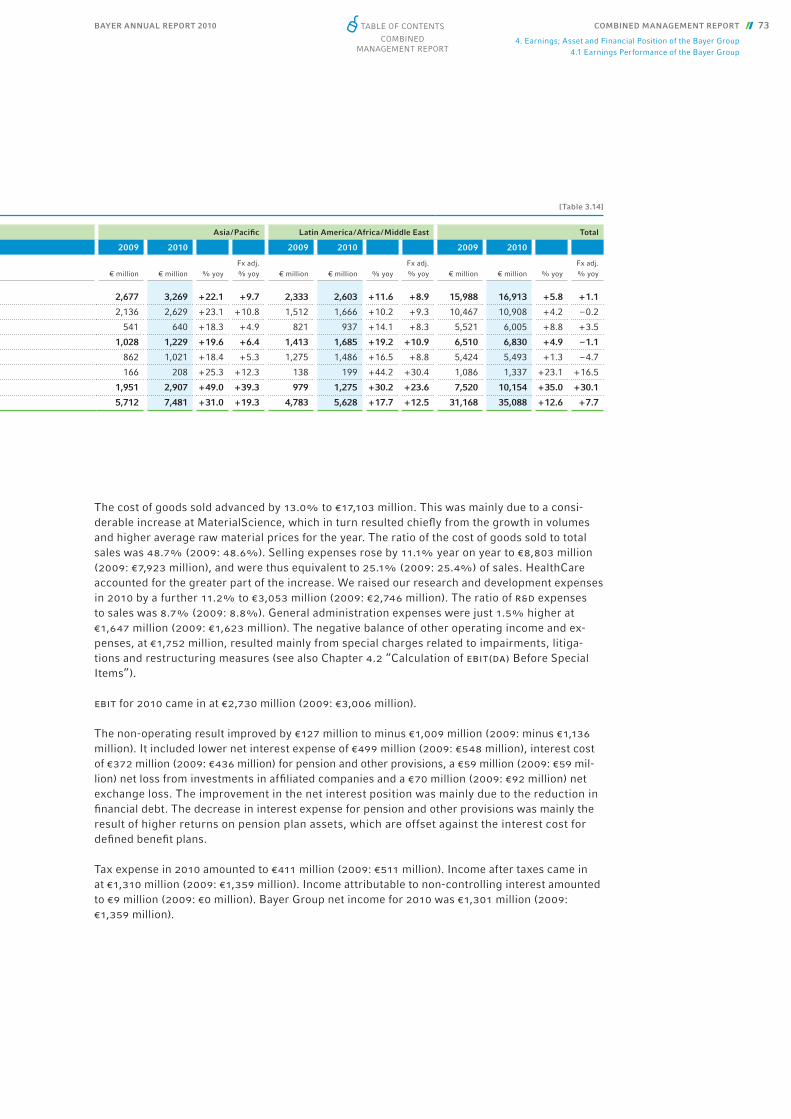
BAYER ANNUAL REPORT 2010 COMBINED MANAGEMENT REPORT 73
4. Earnings; Asset and Financial Position of the Bayer Group4.1 Earnings Performance of the Bayer Group
The cost of goods sold advanced by 13.0% to €17,103 million. This was mainly due to a consi-derable increase at MaterialScience, which in turn resulted chiefl y from the growth in volumes and higher average raw material prices for the year. The ratio of the cost of goods sold to total sales was 48.7% (2009: 48.6%). Selling expenses rose by 11.1% year on year to €8,803 million (2009: €7,923 million), and were thus equivalent to 25.1% (2009: 25.4%) of sales. Health Care accounted for the greater part of the increase. We raised our research and development expenses in 2010 by a further 11.2% to €3,053 million (2009: €2,746 million). The ratio of r&d expenses to sales was 8.7% (2009: 8.8%). General administration expenses were just 1.5% higher at €1,647 million (2009: €1,623 million). The negative balance of other operating income and ex-penses, at €1,752 million, resulted mainly from special charges related to impairments, litiga-tions and restructuring measures (see also Chapter 4.2 “Calculation of ebit(da) Before Special Items”).
ebit for 2010 came in at €2,730 million (2009: €3,006 million).
The non-operating result improved by €127 million to minus €1,009 million (2009: minus €1,136million). It included lower net interest expense of €499 million (2009: €548 million), interest cost of €372 million (2009: €436 million) for pension and other provisions, a €59 million (2009: €59 mil-lion) net loss from investments in affi liated companies and a €70 million (2009: €92 million) net exchange loss. The improvement in the net interest position was mainly due to the reduction in fi nancial debt. The decrease in interest expense for pension and other provisions was main ly the result of higher returns on pension plan assets, which are offset against the interest cost for defi ned benefi t plans.
Tax expense in 2010 amounted to €411 million (2009: €511 million). Income after taxes came in at €1,310 million (2009: €1,359 million). Income attributable to non-controlling interest amounted to €9 million (2009: €0 million). Bayer Group net income for 2010 was €1,301 million (2009: €1,359 million).
[Table 3.14]
Asia / Pacifi c Latin America / Africa / Middle East Total
2009 2010 2009 2010 2009 2010
€ million € million % yoyFx adj.% yoy € million € million % yoy
Fx adj.% yoy € million € million % yoy
Fx adj.% yoy
2,677 3,269 + 22.1 + 9.7 2,333 2,603 + 11.6 + 8.9 15,988 16,913 + 5.8 + 1.1
2,136 2,629 + 23.1 + 10.8 1,512 1,666 + 10.2 + 9.3 10,467 10,908 + 4.2 – 0.2
541 640 + 18.3 + 4.9 821 937 + 14.1 + 8.3 5,521 6,005 + 8.8 + 3.5
1,028 1,229 + 19.6 + 6.4 1,413 1,685 + 19.2 + 10.9 6,510 6,830 + 4.9 – 1.1
862 1,021 + 18.4 + 5.3 1,275 1,486 + 16.5 + 8.8 5,424 5,493 + 1.3 – 4.7
166 208 + 25.3 + 12.3 138 199 + 44.2 + 30.4 1,086 1,337 + 23.1 + 16.5
1,951 2,907 + 49.0 + 39.3 979 1,275 + 30.2 + 23.6 7,520 10,154 + 35.0 + 30.1
5,712 7,481 + 31.0 + 19.3 4,783 5,628 + 17.7 + 12.5 31,168 35,088 + 12.6 + 7.7
Table of ConTenTs
Combined managemenT RepoRT

BAYER ANNUAL REPORT 201074 COMBINED MANAGEMENT REPORT
4. Earnings; Asset and Financial Position of the Bayer Group4.2 Calculation of EBIT(DA) Before Special Items
4.2 Calculation of EBIT(DA) Before Special ItemsKey performance indicators for the Bayer Group are ebit before special items and ebitda before special items. These indicators are reported in order to allow a more accurate assessment of busi-ness operations. The special items – comprising effects that are non-recurring or do not regularly recur or attain similar magnitudes – are detailed in the following table. “ebitda,” “ebitda before special items” and “ebit before special items” are not defi ned in the International Financial Report-ing Standards and should therefore be regarded only as supplementary information. The company considers ebitda before special items to be a more suitable indicator of operating performance since it is not affected by depreciation, amortization, impairments or special items. By reporting this indicator, the company aims to give readers a clearer picture of the results of operations and ensure greater comparability of data over time. The ebitda margin before special items, which is the ratio of ebitda before special items to sales, serves as a relative indicator for the internal and external comparison of operational earning power.
Depreciation, amortization and impairments rose by 26.6% in 2010 to €3,556 million (2009: €2,809mil lion), comprising €2,308 million (2009: €1,537 million) in amortization and impairments of intangi-ble assets and €1,248 million (2009: €1,272 million) in depreciation and impairments of property, plant and equipment. Included here were impairments of €985 million, of which €78 million did not constitute special items. Impairments and write-downs also included a €56 million write-down of other receivables.
Special Items Reconciliation [Table 3.16]
EBIT *2009
EBIT *2010
EBITDA **2009
EBITDA **2010
€ million € million € million € million
After special items 3,006 2,730 5,815 6,286
HealthCare 372 1,169 320 289
Schering integration 87 0 79 0
of which gain from divestitures (114) 0 (114) 0
Impairments and write-downs 32 930 0 56
Restructuring 47 62 35 56
Litigations 180 177 180 177
Additional funding for the pension assurance association 26 0 26 0
CropScience 219 526 197 526
Restructuring 177 0 155 0
Litigations 35 526 35 526
Additional funding for the pension assurance association 7 0 7 0
MaterialScience 140 0 105 0
Restructuring 130 0 95 0
Additional funding for the pension assurance association 10 0 10 0
Reconciliation 35 27 35 0
Litigations 10 0 10 0
Additional funding for the pension assurance association 25 0 25 0
Impairments and write-downs 0 27 0 0
Total special items 766 1,722 657 815
Before special items 3,772 4,452 6,472 7,101
* EBIT = operating result as per income statements** EBITDA = EBIT plus amortization and impairment losses on intangible assets and depreciation and impairment losses on property, plant and
equipment, minus impairment loss reversals
Table of ConTenTs
Combined managemenT RepoRT

BAYER ANNUAL REPORT 2010 COMBINED MANAGEMENT REPORT 75
4. Earnings; Asset and Financial Position of the Bayer Group4.3 Core Earnings Per Share
4.3 Core Earnings Per Share Earnings per share according to ifrs are affected by the purchase price allocation for acquisitions and other special factors. To enhance comparability, we also determine core net income after elimi-nating amortization and impairments of intangible assets, impairments of property, plant and equipment, and special items in ebitda including the related tax effects.
From this core net income we calculate core earnings per share in the same way as earnings per share. Core earnings per share form the basis for our dividend policy. Core earnings per share in 2010 amounted to €4.19 (2009: €3.64).
The calculation of earnings per share according to ifrs is explained in Note [16] to the consolidated fi nancial statements. The (adjusted) core net income, core earnings per share and core ebit are not defi ned in ifrs.
Core Earnings Per Share [Table 3.17]
2009 2010
€ million € million
EBIT as per income statements 3,006 2,730
Amortization and impairment losses on intangible assets 1,537 2,308
Impairment losses on property, plant and equipment 88 53
Special items (other than impairment losses) 657 815
Core EBIT 5,288 5,906
Non-operating result (as per income statements) (1,136) (1,009)
Income taxes (as per income statements) (511) (411)
Tax effects related to impairments and special items (685) (1,012)
Income after taxes attributable to non-controlling interest (as per income statements) 0 (9)
Core net income 2,956 3,465
Financing expenses for the mandatory convertible bond, net of tax effects 47 0
Adjusted core net income 3,003 3,465
Shares Shares
Weighted average number of issued ordinary shares 801,050,237 826,947,808
(Potential) shares (to be) issued upon conversion of the mandatory convertible bond 24,955,936 0
Adjusted weighted average total number of issued and potential ordinary shares 826,006,173 826,947,808
Core earnings per share (€) 3.64 4.19
Table of ConTenTs
Combined managemenT RepoRT

BAYER ANNUAL REPORT 201076 COMBINED MANAGEMENT REPORT
4. Earnings; Asset and Financial Position of the Bayer Group4.4 Value Management
4.4 Value ManagementCASH VALUE ADDED-BASED SYSTEMOne of the prime objectives of the Bayer Group is to sustainably increase enterprise value. We use a Group-wide value management system to plan, control and monitor our businesses. An impor-tant value-based indicator is the cash value added (cva), which shows the degree to which the cash fl ows needed to cover the costs of equity and debt and of reproducing depletable assets have been generated. If the cva is positive, the respective company or business entity has exceeded the minimum requirements. If it is negative, the anticipated capital and asset reproduction costs have not been earned. The cva is an indicator for a single reporting period. For a year-on-year comparison we therefore use our second central steering parameter for value management, the delta cva, which is the difference between the cvas of two consecutive periods. A positive delta cva denotes an increase in the company’s value.
The value-based indicators aid management’s decision-making, especially regarding strategic portfolio optimization and the allocation of resources for acquisitions and capital expenditures. The focus at the operational level is on the key drivers of enterprise value: growth (sales), cost effi ciency (ebitda) and capital effi ciency (working capital, capital expenditures), since these directly affect value creation.
CALCULATING THE COST OF CAPITAL Bayer calculates the cost of capital according to the debt / equity ratio at the beginning of the year using the weighted average cost of capital (wacc) formula. The cost of equity capital is the return expected by stockholders, computed from capital market information. The cost of debt used in calculating wacc is based on the terms for ten-year Eurobonds issued by industrial companies with an “A-”rating.
To take into account the different risk and return profi les of our principal businesses, we calculate individual capital cost factors after income taxes for each of our subgroups. In 2010 these were 8.1% (2009: 8.0%) for Health Care, 7.5% (2009: 7.5%) for CropScience and 7.1% (2009: 7.0%) for Material Science. The minimum return required for the Group in 2010 was 7.8% (2009: 7.7%).
GROSS CASH FLOW, CASH VALUE ADDED AND CASH FLOW RETURN ON INVESTMENT AS PERFORMANCE YARDSTICKSThe gross cash fl ow as published in our statement of cash fl ows is the measure of our internal fi nancing capability. Bayer has chosen this parameter because it is relatively free of accounting infl uences and is therefore a more meaningful performance indicator.
Taking into account the costs of capital and of reproducing depletable assets, we determine the gross cash fl ow hurdle. If the gross cash fl ow hurdle is equaled or exceeded, the cva is positive and thus the required return on equity and debt plus the cost of asset reproduction has been earned.
In calculating the hurdle we made methodical changes compared to the previous year, mainly re-lating to the reproduction requirements for intangible assets. In addition, material participating interests of direct relevance to business operations are included in the capital invested starting in 2010. The fi gures for 2009 have been restated accordingly.
The profi tability of the Group and of its individual business entities is measured by the cash fl ow return on investment (cfroi). This is the ratio of the gross cash fl ow to the capital invested, which is derived from the statement of fi nancial position and basically comprises the property, plant and equipment and intangible assets required for operations – stated at cost of acquisition or construction – plus working capital, less interest-free liabilities (such as current provisions). To reduce fl uctuations in the capital invested, the cfroi is computed on the basis of the average fi gure for the respective year.
Weighted average cost of capital for the
Bayer Group
7.8%
Table of ConTenTs
Combined managemenT RepoRT

BAYER ANNUAL REPORT 2010 COMBINED MANAGEMENT REPORT 77
4. Earnings; Asset and Financial Position of the Bayer Group4.4 Value Management
The cfroi hurdle for 2010 was 10.0% (2009: 9.9%), while the corresponding gross cash fl ow hurdle was €4,384 million (2009: €4,280 million).
Actual gross cash fl ow came in at €4,771 million, exceeding the hurdle by 8.8%. Thus in 2010 we earned our entire capital and asset reproduction costs, and the positive cva of €387 million shows that Bayer not only exceeded the minimum return and reproduction requirements but earned a premium on the capital invested. Given the previous year’s cva of €378 million, the Bayer Group therefore recorded a positive delta cva of €9 million, showing that it created slightly more value than in the previous year. The cfroi for 2010 amounted to 10.9% (2009: 10.7%).
Health Care and Material Science exceeded their target returns including asset reproduction, while CropScience was €335 million below the gross cash fl ow hurdle. The cfroi for Health Care was 12.8% (2009: 13.6%). CropScience was below the previous year with a cfroi of 5.9% (2009: 11.6%). Material Science recorded a cfroi of 11.0% (2009: 3.4%).
Positive delta CVA=
value created
Value Management Indicators by Subgroup [Table 3.18]
HealthCare CropScience MaterialScience Bayer Group
2009 2010 2009 2010 2009 2010 2009 2010
€ million € million € million € million € million € million € million € million
Gross cash fl ow hurdle (GCF hurdle) 2,258 2,291 822 881 960 973 4,280 4,384
Gross cash fl ow * (GCF) 3,153 2,948 1,043 546 319 1,058 4,658 4,771
Cash value added (CVA) 895 657 221 (335) (641) 85 378 387
Delta cash value added (delta CVA) (13) (238) (150) (556) (582) 726 (836) 9
CFROI hurdle 9.7% 9.9% 9.6% 9.4% 9.9% 10.6% 9.9% 10.0%
Cash fl ow return on investment (CFROI) 13.6% 12.8% 11.6% 5.9% 3.4% 11.0% 10.7% 10.9%
Average capital invested 23,261 23,022 8,967 9,189 9,442 9,589 43,566 43,622
2009 fi gures restated* For defi nition see Chapter 4.5 “Liquidity and Capital Expenditures of the Bayer Group.”
Table of ConTenTs
Combined managemenT RepoRT
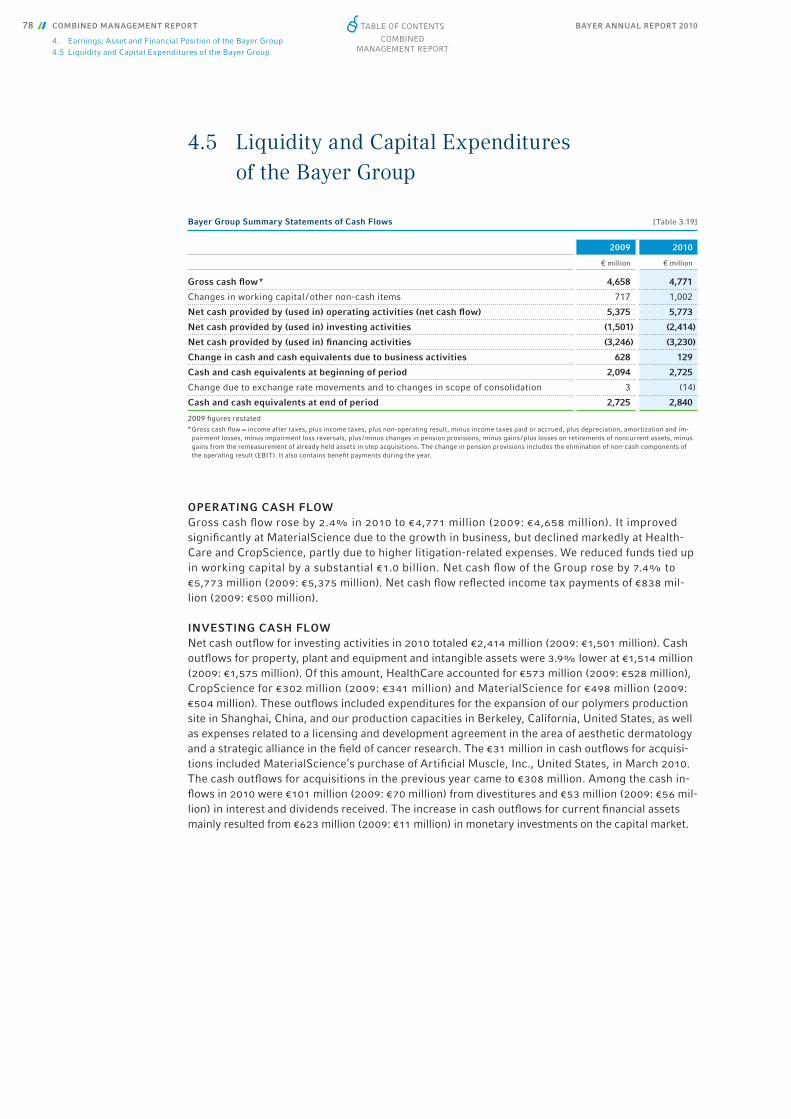
BAYER ANNUAL REPORT 201078 COMBINED MANAGEMENT REPORT
4. Earnings; Asset and Financial Position of the Bayer Group4.5 Liquidity and Capital Expenditures of the Bayer Group
4.5 Liquidity and Capital Expendituresof the Bayer Group
OPERATING CASH FLOWGross cash fl ow rose by 2.4% in 2010 to €4,771 million (2009: €4,658 million). It improved signifi cantly at Material Science due to the growth in business, but declined markedly at Health-Care and CropScience, partly due to higher litigation-related expenses. We reduced funds tied up in working capital by a substantial €1.0 billion. Net cash fl ow of the Group rose by 7.4% to €5,773 million (2009: €5,375 million). Net cash fl ow refl ected income tax payments of €838 mil-lion (2009: €500 million).
INVESTING CASH FLOWNet cash outfl ow for investing activities in 2010 totaled €2,414 million (2009: €1,501 million). Cash outfl ows for property, plant and equipment and intangible assets were 3.9% lower at €1,514 million (2009: €1,575 million). Of this amount, Health Care accounted for €573 million (2009: €528 million), CropScience for €302 million (2009: €341 million) and Material Science for €498 million (2009: €504 million). These outfl ows included expenditures for the expansion of our polymers production site in Shanghai, China, and our production capacities in Berkeley, California, United States, as well as expenses related to a licensing and development agreement in the area of aesthetic dermatology and a strategic alliance in the fi eld of cancer research. The €31 million in cash outfl ows for acquisi-tions included Material Science’s purchase of Artifi cial Muscle, Inc., United States, in March 2010. The cash outfl ows for acquisitions in the previous year came to €308 million. Among the cash in-fl ows in 2010 were €101 million (2009: €70 million) from divestitures and €53 million (2009: €56 mil-lion) in interest and dividends received. The increase in cash outfl ows for current fi nancial assets mainly resulted from €623 million (2009: €11 million) in monetary investments on the capital market.
Bayer Group Summary Statements of Cash Flows [Table 3.19]
2009 2010
€ million € million
Gross cash fl ow * 4,658 4,771
Changes in working capital / other non-cash items 717 1,002
Net cash provided by (used in) operating activities (net cash fl ow) 5,375 5,773
Net cash provided by (used in) investing activities (1,501) (2,414)
Net cash provided by (used in) fi nancing activities (3,246) (3,230)
Change in cash and cash equivalents due to business activities 628 129
Cash and cash equivalents at beginning of period 2,094 2,725
Change due to exchange rate movements and to changes in scope of consolidation 3 (14)
Cash and cash equivalents at end of period 2,725 2,840
2009 fi gures restated* Gross cash fl ow = income after taxes, plus income taxes, plus non-operating result, minus income taxes paid or accrued, plus depreciation, amortization and im-
pairment losses, minus impairment loss reversals, plus / minus changes in pension provisions, minus gains / plus losses on retirements of noncurrent assets, minus gains from the remeasurement of already held assets in step acquisitions. The change in pension provisions includes the elimination of non-cash components of the operating result (EBIT). It also contains benefi t payments during the year.
Table of ConTenTs
Combined managemenT RepoRT

BAYER ANNUAL REPORT 2010 COMBINED MANAGEMENT REPORT 79
4. Earnings; Asset and Financial Position of the Bayer Group4.5 Liquidity and Capital Expenditures of the Bayer Group
The principal strategically relevant capital expenditures for property, plant and equipment in the operating segments of the Bayer Group in 2010 and 2009 are listed in the following table:
Capital Expenditures for Property, Plant and Equipment [Table 3.20]
Segment Description
Capital expenditures 2010
Pharmaceuticals Expansion of production capacities for new Kogenate® formulations in Berkeley, California, U.S.A.
Installation of packaging capacities for the YAZ® product family, Berlin, Germany
Capacity expansion for contrast media, Bergkamen, Germany
Consumer Health Expansion of production and packaging capacities for vitamin tablets, Myerstown,Pennsylvania, U.S.A.
Crop Protection Expansion of production capacity for fungicides in Kansas City, Missouri, U.S.A.and Dormagen, Germany
Capacity expansions for insecticidal active ingredients in Dormagen, Germany
Environmental Science,
BioScience
Expansion of research facilities in Nunhem, Netherlands
Extension to a research laboratory in Ghent, Belgium
Capacity expansion for the production of vegetable seeds in Parma, Idaho, U.S.A.
MaterialScience Construction of a “world-scale” TDI production complex in Shanghai, China
MakroColor production plant in Noida, India
Construction of a polyurethanes systems house in Moscow, Russia
Installation of an NaCl electrolyzer with an oxygen depolarized cathode for demonstration purposes in Uerdingen, Germany
Capital expenditures 2009
Pharmaceuticals Expansion of the production facility for contrast agents in Bergkamen, Germany
Expansion and modernization of the Kogenate® facility in Berkeley, California, U.S.A.
Expansion of production capacities for the YAZ® product family in Berlin, Germany
Expansion of production capacity in Jakarta, Indonesia
Consumer Health Expansion of the production facility for vitamins in Myerstown, Pennsylvania, U.S.A.
Construction of a new distribution center in Lerma, Mexico, to consolidate storage capacities existing in different parts of Mexico
Crop Protection Capacity expansions for herbicidal active ingredients in Frankfurt am Main and Knapsack, Germany, and Muskegon, Michigan, U.S.A.
Expansion of production capacity for fungicides in Dormagen, Germany and Kansas City, Missouri, U.S.A.
Expansion of production capacity for high-activity herbicides in Dormagen, Germany and Kansas City, Missouri, U.S.A.
Expansion of formulating capacity for non-herbicides in Belford Roxo, Brazil
Expansion of production capacity for fungicides in Muttenz, Switzerland
Environmental Science,
BioScience
Capacity expansion for the production of vegetable seeds in Parma, Idaho, U.S.A.
Extension to a BioScience research laboratory in Ghent, Belgium
MaterialScience Construction of a “world-scale” TDI production complex in Shanghai, China
Production facility for polyisocyanates in Ankleshwar, India
Roll-to-roll coating line in Leverkusen, Germany
Construction of a systems house in Guangzhou, China
Nitrous oxide reduction unit at the nitric acid production facility in Dormagen, Germany
Construction of a pilot plant for carbon nanotubes in Leverkusen, Germany
EcoCommercial Building in Noida, India
Table of ConTenTs
Combined managemenT RepoRT
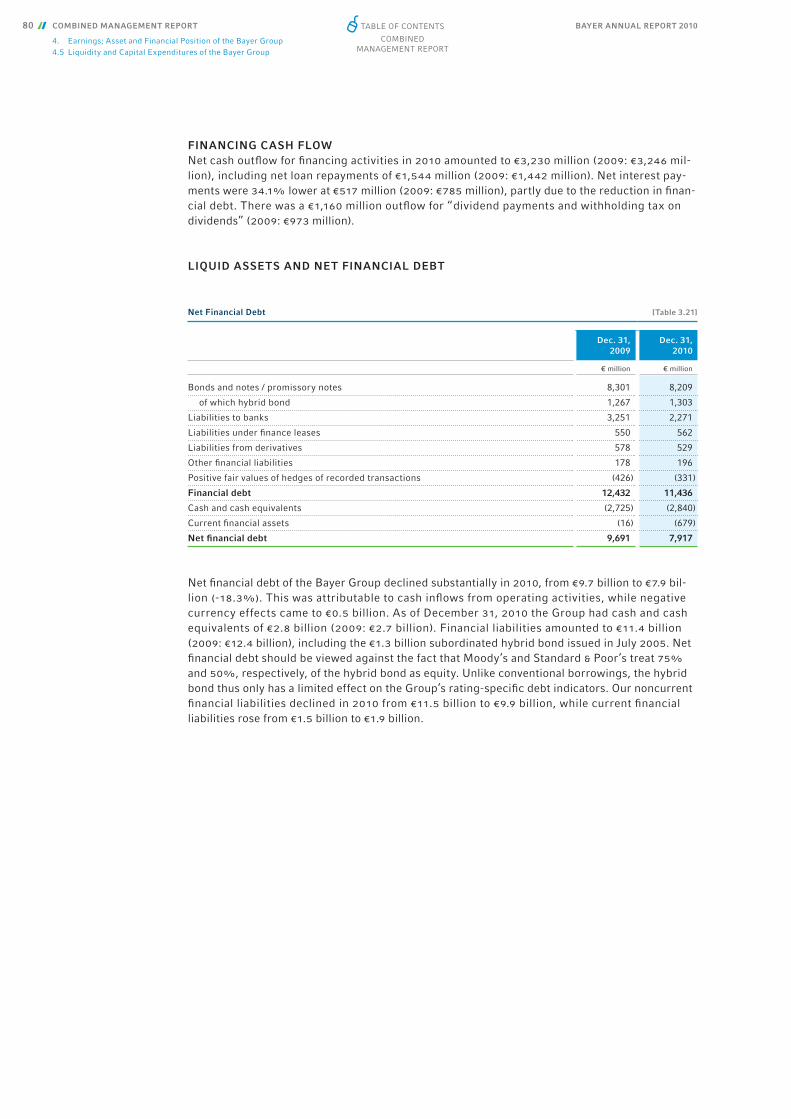
BAYER ANNUAL REPORT 201080 COMBINED MANAGEMENT REPORT
4. Earnings; Asset and Financial Position of the Bayer Group4.5 Liquidity and Capital Expenditures of the Bayer Group
FINANCING CASH FLOWNet cash outfl ow for fi nancing activities in 2010 amounted to €3,230 million (2009: €3,246 mil-lion), including net loan repayments of €1,544 million (2009: €1,442 million). Net interest pay-ments were 34.1% lower at €517 million (2009: €785 million), partly due to the reduction in fi nan-cial debt. There was a €1,160 million outfl ow for “dividend payments and withholding tax on dividends” (2009: €973 million).
LIQUID ASSETS AND NET FINANCIAL DEBT
Net fi nancial debt of the Bayer Group declined substantially in 2010, from €9.7 billion to €7.9 bil-lion (-18.3%). This was attributable to cash infl ows from operating activities, while negative currency effects came to €0.5 billion. As of December 31, 2010 the Group had cash and cash equivalents of €2.8 billion (2009: €2.7 billion). Financial liabilities amounted to €11.4 billion (2009: €12.4 billion), including the €1.3 billion subordinated hybrid bond issued in July 2005. Net fi nancial debt should be viewed against the fact that Moody’s and Standard & Poor’s treat 75% and 50%, respectively, of the hybrid bond as equity. Unlike conventional borrowings, the hybrid bond thus only has a limited effect on the Group’s rating-specifi c debt indicators. Our noncurrent fi nancial liabilities declined in 2010 from €11.5 billion to €9.9 billion, while current fi nancial liabilities rose from €1.5 billion to €1.9 billion.
Net Financial Debt [Table 3.21]
Dec. 31, 2009
Dec. 31, 2010
€ million € million
Bonds and notes / promissory notes 8,301 8,209
of which hybrid bond 1,267 1,303
Liabilities to banks 3,251 2,271
Liabilities under fi nance leases 550 562
Liabilities from derivatives 578 529
Other fi nancial liabilities 178 196
Positive fair values of hedges of recorded transactions (426) (331)
Financial debt 12,432 11,436
Cash and cash equivalents (2,725) (2,840)
Current fi nancial assets (16) (679)
Net fi nancial debt 9,691 7,917
Table of ConTenTs
Combined managemenT RepoRT
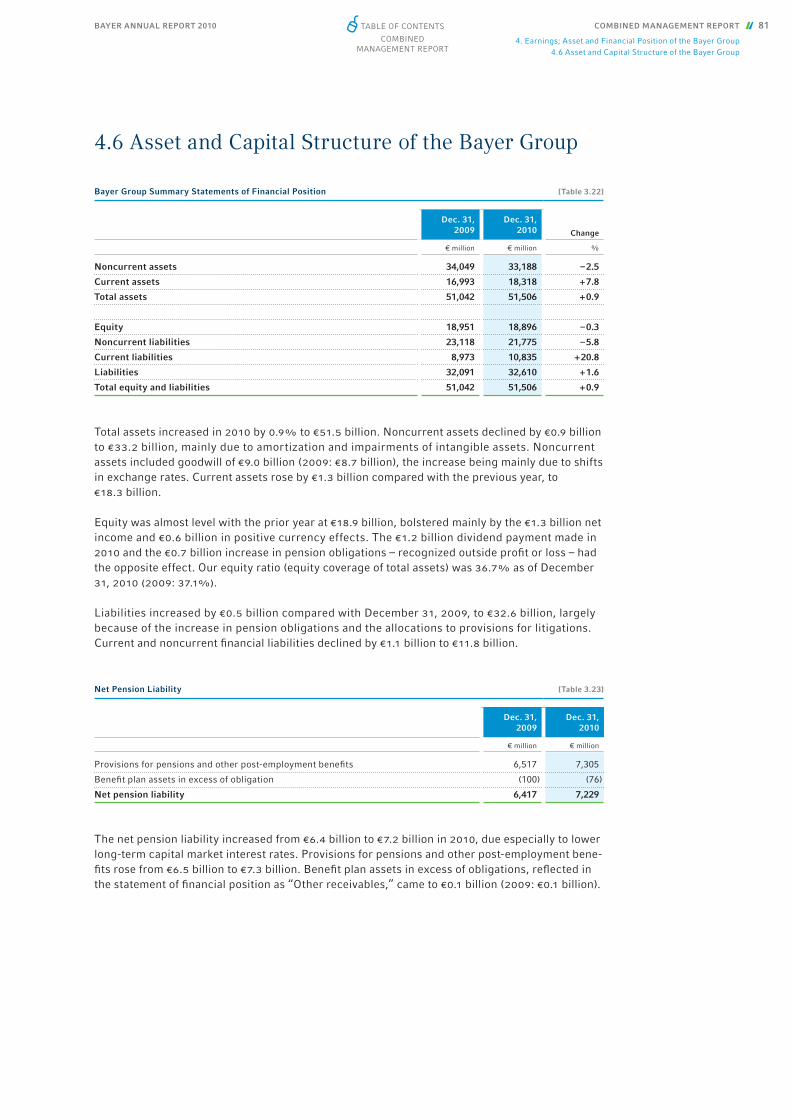
BAYER ANNUAL REPORT 2010 COMBINED MANAGEMENT REPORT 81
4. Earnings; Asset and Financial Position of the Bayer Group4.6 Asset and Capital Structure of the Bayer Group
4.6 Asset and Capital Structure of the Bayer Group
Total assets increased in 2010 by 0.9% to €51.5 billion. Noncurrent assets declined by €0.9 billion to €33.2 billion, mainly due to amortization and impairments of intangible assets. Noncurrent assets included goodwill of €9.0 billion (2009: €8.7 billion), the increase being mainly due to shifts in exchange rates. Current assets rose by €1.3 billion compared with the previous year, to €18.3 billion.
Equity was almost level with the prior year at €18.9 billion, bolstered mainly by the €1.3 billion net income and €0.6 billion in positive currency effects. The €1.2 billion dividend payment made in 2010 and the €0.7 billion increase in pension obligations – recognized outside profi t or loss – had the opposite effect. Our equity ratio (equity coverage of total assets) was 36.7% as of December 31, 2010 (2009: 37.1%).
Liabilities increased by €0.5 billion compared with December 31, 2009, to €32.6 billion, largely because of the increase in pension obligations and the allocations to provisions for litigations. Current and noncurrent fi nancial liabilities declined by €1.1 billion to €11.8 billion.
The net pension liability increased from €6.4 billion to €7.2 billion in 2010, due especially to lower long-term capital market interest rates. Provisions for pensions and other post-employment bene-fi ts rose from €6.5 billion to €7.3 billion. Benefi t plan assets in excess of obligations, refl ected in the statement of fi nancial position as “Other receivables,” came to €0.1 billion (2009: €0.1 billion).
Net Pension Liability [Table 3.23]
Dec. 31, 2009
Dec. 31, 2010
€ million € million
Provisions for pensions and other post-employment benefi ts 6,517 7,305
Benefi t plan assets in excess of obligation (100) (76)
Net pension liability 6,417 7,229
Bayer Group Summary Statements of Financial Position [Table 3.22]
Dec. 31, 2009
Dec. 31, 2010 Change
€ million € million %
Noncurrent assets 34,049 33,188 – 2.5
Current assets 16,993 18,318 + 7.8
Total assets 51,042 51,506 + 0.9
Equity 18,951 18,896 – 0.3
Noncurrent liabilities 23,118 21,775 – 5.8
Current liabilities 8,973 10,835 + 20.8
Liabilities 32,091 32,610 + 1.6
Total equity and liabilities 51,042 51,506 + 0.9
Table of ConTenTs
Combined managemenT RepoRT

BAYER ANNUAL REPORT 201082 COMBINED MANAGEMENT REPORT
4. Earnings; Asset and Financial Position of the Bayer Group4.6 Asset and Capital Structure of the Bayer Group
Ratios [Table 3.24]
2009 2010
Cost of sales ratio (%)Cost of goods sold
48.6 48.7
Sales
R&D expense ratio (%)Research and development expenses
8.8 8.7 Sales
Return on sales (%)Income after taxes
4.4 3.7Sales
EBIT margin (%)EBIT
9.6 7.8Sales
EBITDA margin before special items (%)
EBITDA before special items 20.8 20.2
Sales
Asset intensity (%)
Property, plant and equipment + intangible assets 60.6 58.2
Total assets
D & A / capex ratio (%)Depreciation and amortization*
159.4 156.8Capital expenditures *
Liability structure (%) Current liabilities
28.0 33.2Liabilities
GearingNet debt + pension provisions
0.9 0.8Equity
Free operating cash fl ow (€ million)Net operating cash fl ow
less cash outfl ows for property, plant and equip-ment and intangible assets
3,800
4,259
Inventory turnoverCost of goods sold
2.5 2.8Inventories
Receivables turnoverSales
5.1 5.3Trade accounts receivable
Payables turnoverCost of goods sold
5.5 4.9Trade accounts payable
Equity ratio (%) Equity
37.1 36.7Total assets
Return on equity (%)Income after taxes
7.7 6.9Average equity
Return on assets (%)Income before taxes and interest expense
6.1 5.1Average total assets for the year
* property, plant and equipment + intangible assets
Table of ConTenTs
Combined managemenT RepoRT
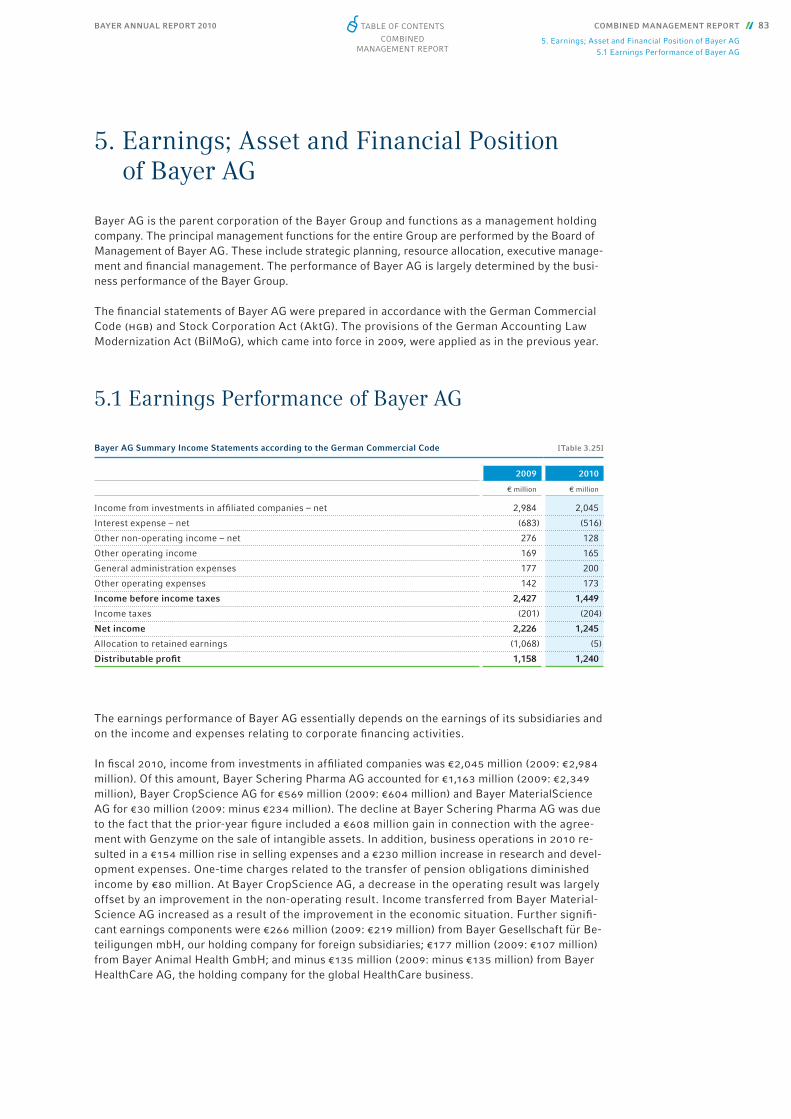
BAYER ANNUAL REPORT 2010 COMBINED MANAGEMENT REPORT 83
5. Earnings; Asset and Financial Position of Bayer AG 5.1 Earnings Performance of Bayer AG
5. Earnings; Asset and Financial Position of Bayer AG
Bayer AG is the parent corporation of the Bayer Group and functions as a management holding company. The principal management functions for the entire Group are performed by the Board of Management of Bayer AG. These include strategic planning, resource allocation, executive manage-ment and fi nancial management. The performance of Bayer AG is largely determined by the busi-ness performance of the Bayer Group.
The fi nancial statements of Bayer AG were prepared in accordance with the German Commercial Code (hgb) and Stock Corporation Act (AktG). The provisions of the German Accounting Law Modernization Act (BilMoG), which came into force in 2009, were applied as in the previous year.
5.1 Earnings Performance of Bayer AG
The earnings performance of Bayer AG essentially depends on the earnings of its subsidiaries and on the income and expenses relating to corporate fi nancing activities.
In fi scal 2010, income from investments in affi liated companies was €2,045 million (2009: €2,984 million). Of this amount, Bayer Schering Pharma AG accounted for €1,163 million (2009: €2,349 million), Bayer CropScience AG for €569 million (2009: €604 million) and Bayer MaterialScience AG for €30 million (2009: minus €234 million). The decline at Bayer Schering Pharma AG was due to the fact that the prior-year fi gure included a €608 million gain in connection with the agree-ment with Genzyme on the sale of intangible assets. In addition, business operations in 2010 re-sulted in a €154 million rise in selling expenses and a €230 million increase in research and devel-opment expenses. One-time charges related to the transfer of pension obligations diminished income by €80 million. At Bayer CropScience AG, a decrease in the operating result was largely offset by an improvement in the non-operating result. Income transferred from Bayer Material-Science AG increased as a result of the improvement in the economic situation. Further signifi -cant earnings components were €266 million (2009: €219 million) from Bayer Gesellschaft für Be-teiligungen mbH, our holding company for foreign subsidiaries; €177 million (2009: €107 million) from Bayer Animal Health GmbH; and minus €135 million (2009: minus €135 million) from Bayer HealthCare AG, the holding company for the global HealthCare business.
Bayer AG Summary Income Statements according to the German Commercial Code [Table 3.25]
2009 2010
€ million € million
Income from investments in affi liated companies – net 2,984 2,045
Interest expense – net (683) (516)
Other non-operating income – net 276 128
Other operating income 169 165
General administration expenses 177 200
Other operating expenses 142 173
Income before income taxes 2,427 1,449
Income taxes (201) (204)
Net income 2,226 1,245
Allocation to retained earnings (1,068) (5)
Distributable profi t 1,158 1,240
Table of ConTenTs
Combined managemenT RepoRT
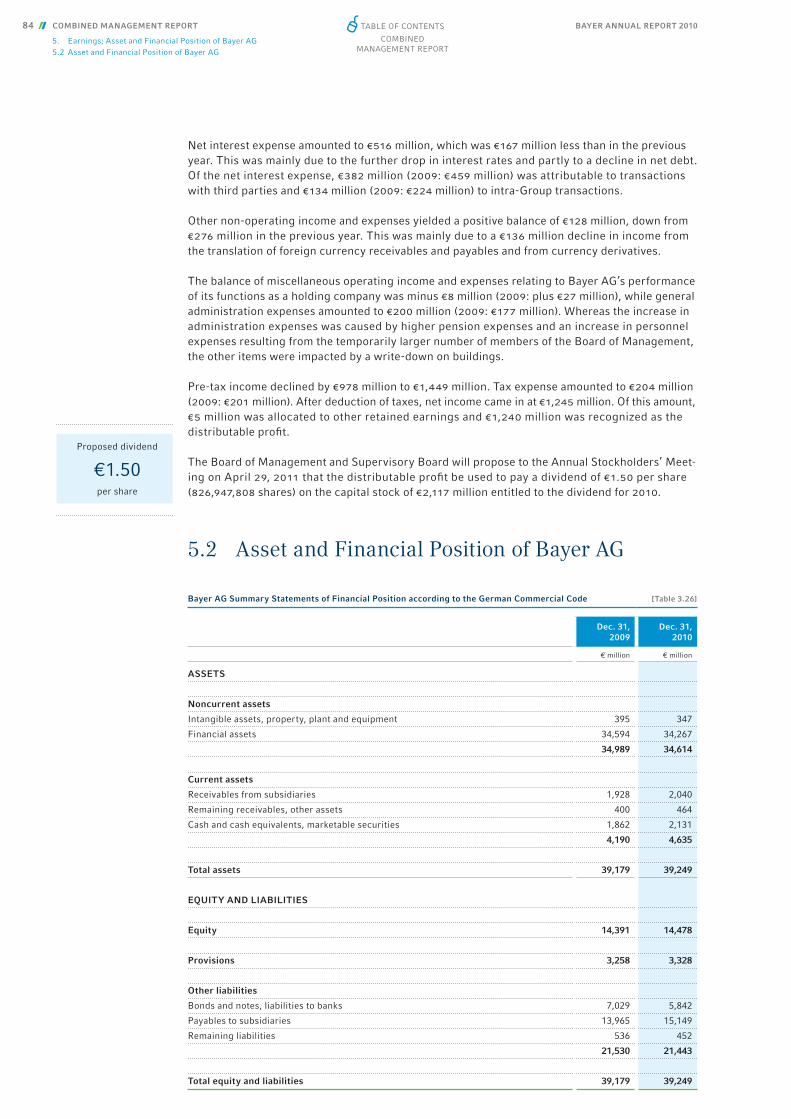
BAYER ANNUAL REPORT 201084 COMBINED MANAGEMENT REPORT
5. Earnings; Asset and Financial Position of Bayer AG5.2 Asset and Financial Position of Bayer AG
Net interest expense amounted to €516 million, which was €167 million less than in the previous year. This was mainly due to the further drop in interest rates and partly to a decline in net debt. Of the net interest expense, €382 million (2009: €459 million) was attributable to transactions with third parties and €134 million (2009: €224 million) to intra-Group transactions.
Other non-operating income and expenses yielded a positive balance of €128 million, down from €276 million in the previous year. This was mainly due to a €136 million decline in income from the translation of foreign currency receivables and payables and from currency derivatives.
The balance of miscellaneous operating income and expenses relating to Bayer AG’s performance of its functions as a holding company was minus €8 million (2009: plus €27 million), while general administration expenses amounted to €200 million (2009: €177 million). Whereas the increase in administration expenses was caused by higher pension expenses and an increase in personnel expenses resulting from the temporarily larger number of members of the Board of Management, the other items were impacted by a write-down on buildings.
Pre-tax income declined by €978 million to €1,449 million. Tax expense amounted to €204 million (2009: €201 million). After deduction of taxes, net income came in at €1,245 million. Of this amount, €5 million was allocated to other retained earnings and €1,240 million was recognized as the distributable profi t.
The Board of Management and Supervisory Board will propose to the Annual Stockholders’ Meet-ing on April 29, 2011 that the distributable profi t be used to pay a dividend of €1.50 per share (826,947,808 shares) on the capital stock of €2,117 million entitled to the dividend for 2010.
5.2 Asset and Financial Position of Bayer AG
Proposed dividend
€1.50 per share
Bayer AG Summary Statements of Financial Position according to the German Commercial Code [Table 3.26]
Dec. 31, 2009
Dec. 31, 2010
€ million € million
ASSETS
Noncurrent assets
Intangible assets, property, plant and equipment 395 347
Financial assets 34,594 34,267
34,989 34,614
Current assets
Receivables from subsidiaries 1,928 2,040
Remaining receivables, other assets 400 464
Cash and cash equivalents, marketable securities 1,862 2,131
4,190 4,635
Total assets 39,179 39,249
EQUITY AND LIABILITIES
Equity 14,391 14,478
Provisions 3,258 3,328
Other liabilities
Bonds and notes, liabilities to banks 7,029 5,842
Payables to subsidiaries 13,965 15,149
Remaining liabilities 536 452
21,530 21,443
Total equity and liabilities 39,179 39,249
Table of ConTenTs
Combined managemenT RepoRT

BAYER ANNUAL REPORT 2010 COMBINED MANAGEMENT REPORT 85
6. Takeover-Relevant Information
The asset and liability structure of Bayer AG is dominated by its role as a holding company in managing the subsidiaries and fi nancing corporate activities. This is primarily refl ected in the high level of investments in affi liated companies and of receivables from, and payables to, Group companies.
Total assets of Bayer AG were at the previous year’s level of €39.2 billion. A €0.4 billion decline in noncurrent assets was offset by an increase of the same amount in current assets.
Property, plant and equipment and intangible assets remained virtually unchanged, while fi nan-cial assets declined by just €0.3 billion to €34.3 billion. Financial assets included investments in subsidiaries amounting to €33.7 billion (2009: €34.1 billion), or 85.9% (2009: 87.1%) of total as-sets.
Receivables from subsidiaries amounted to €2.0 billion (2009: €1.9 billion), while payables to subsidiaries totaled €15.1 billion (2009: €14.0 billion). These amounts accounted for 5.2% of to-tal assets and 38.6% of total equity and liabilities, respectively.
Of the unchanged amount of €39.2 billion in total assets, €14.5 billion (2009: €14.4 billion) was equity-fi nanced. The equity ratio rose from 36.7% to 36.9%. Equity was increased by the €1,245 mil-lion net income, but diminished by the €1,158 million dividend payment for 2009.
Provisions increased by €0.1 billion compared with the start of the year to €3.3 billion because of higher provisions for taxes.
Other liabilities were almost unchanged at €21.4 billion (net of deductible receivables; 2009: €21.5 billion). However, the fi nancial debt included here declined by €1.3 billion to €23.0 billion. The decrease included a €1.2 billion drop in external fi nancial debt, comprising a €0.9 billion re-duction in liabilities to banks and the repayment of a €0.3 billion bond issued in 2007.
6. Takeover-Relevant InformationREPORT PURSUANT TO SECTIONS 289 PARAGRAPH 4 AND 315 PARAGRAPH 4 OF THE GERMAN COMMERCIAL CODE (HGB)
The capital stock of Bayer AG amounted as of December 31, 2010 to €2,117 million, divided into 826,947,808 no-par bearer shares. The capital stock and the number of shares were thus unchanged from the end of the previous year. Each share confers one voting right.
A small number of shares may be subject to temporary trading restrictions, such as retention periods, in connection with employee stock participation programs.
We received no notifi cations in 2010 of direct or indirect holdings of shares in Bayer AG that exceed 10% of the capital stock. The company thus is not in possession of any notifi cations of holdings that exceed 10% of the capital stock.
Pursuant to Section 84, Paragraph 1 of the German Stock Corporation Act (AktG), the members of the Board of Management are appointed and dismissed by the Supervisory Board. Since Bayer AG falls within the scope of the German Codetermination Act, the appointment or dismissal of members of the Board of Management requires a majority of two thirds of the votes of the mem-bers of the Supervisory Board on the fi rst ballot. If no such majority is achieved, the appointment may be approved pursuant to Section 31, Paragraph 3 of the Codetermination Act on a second ballot by a simple majority of the votes of the members of the Supervisory Board. If the required majority still is not achieved, a third ballot is held. Here again, a simple majority of the votes suf-fi ces, but in this ballot the Chairman of the Supervisory Board has two votes pursuant to Section 31, Paragraph 4 of the Codetermination Act. Under Section 6, Paragraph 1 of the Articles of In-corporation of Bayer AG, the Board of Management must comprise at least two members. The
INTERNET
We publish voting rights announcements atwww.investor.bayer.com/stock/ownership-structure/voting-rights
Table of ConTenTs
Combined managemenT RepoRT

BAYER ANNUAL REPORT 201086 COMBINED MANAGEMENT REPORT
6. Takeover-Relevant Information
Supervisory Board may appoint one member to be Chairman of the Board of Management pursu-ant to Section 84, Paragraph 2 of the German Stock Corporation Act or Section 6, Paragraph 1 of the Articles of Incorporation.
Under Section 179, Paragraph 1 of the German Stock Corporation Act, amendments to the Arti-cles of Incorporation require a resolution of the Stockholders’ Meeting. Pursuant to Section 179, Paragraph 2 of the German Stock Corporation Act, this resolution must be passed by a majority of three quarters of the voting capital represented at the meeting, unless the Articles of Incorpora-tion provide for a different majority. However, where an amendment relates to a change in the ob-ject of the company, the Articles of Incorporation may only specify a larger majority. Section 17, Paragraph 2 of the Articles of Incorporation of Bayer AG utilizes the scope for deviation pursuant to Section 179, Paragraph 2 of the German Stock Corporation Act and provides that resolutions may be passed by a simple majority of the votes or, where a capital majority is required, by a sim-ple majority of the capital.
Provisions of the Articles of Incorporation concerning Authorized Capital i and Authorized Capital ii are entered in the commercial register of Bayer AG. With the approval of the Supervisory Board and until April 29, 2015, the Board of Management may use the Authorized Capital i to increase the capital stock by up to a total of €530 million. New shares may be issued against cash contribu-tions and / or contributions in kind, but capital increases against contributions in kind may not exceed a total of €423 million. If the Authorized Capital i is used to issue shares in return for cash contributions, stockholders must normally be granted subscription rights. The Board of Manage-ment may only exclude stockholders’ subscription rights to shares issued out of the Authorized Capital i that do not represent more than 20% of the existing capital stock. Absent a further reso-lution on the exclusion of stockholders’ subscription rights, the Board of Management also may only exclude stockholders’ subscription rights to shares issued under other authorizations regard-ing capital measures (Authorized Capital ii, bonds with warrants or convertible bonds, purchase and sale of own shares) provided that such shares do not in total represent more than 20% of the existing capital stock.
With the approval of the Supervisory Board and until April 29, 2015, the Board of Management is also authorized to increase the capital by up to €212 million in one or more installments by issuing shares out of the Authorized Capital ii in exchange for cash contributions. The stockholders must normally be granted subscription rights. However, the Board of Management is authorized, with the approval of the Supervisory Board, to exclude subscription rights for stockholders provided the capital increase out of the Authorized Capital ii does not exceed 10% of the capital stock ex-isting at the time this authorization becomes effective or the time this authorization is exercised and the issue price of the new shares is not signifi cantly below the market price of the already listed shares.
The 2010 Annual Stockholders’ Meeting adopted a resolution creating conditional capital of €212 million in connection with an authorization for the issuance of bonds with warrants or con-vertible bonds, profi t-sharing rights or profi t participation bonds (collectively referred to as “bonds”) with a total face value of €6 billion. The Board of Management may, with the consent of the Supervisory Board and under certain conditions, exclude the bond subscription rights that would otherwise be granted to stockholders. One of the conditions is that the total amount of the shares required to service the bonds does not exceed 10% of the capital stock. Any other shares issued without granting subscription rights to the stockholders in direct or analogous application of Section 186, Paragraph 3, Sentence 4 of the German Stock Corporation Act shall be credited against this 10% limit. Further, the 2010 Annual Stockholders’ Meeting authorized the Board of Management to purchase and sell company shares representing up to 10% of the capital stock. This authorization expires on April 29, 2015.
Table of ConTenTs
Combined managemenT RepoRT
BAYER ANNUAL REPORT 2010 COMBINED MANAGEMENT REPORT 87
6. Takeover-Relevant Information
A material agreement that is subject to the condition precedent of a change of control pertains to the undrawn €3.5 billion syndicated credit facility arranged by Bayer AG and its u.s. subsidiary Bayer Corporation on March 31, 2005, which is available until 2012. The participating banks are entitled to terminate the credit facility in the event of a change of control at Bayer and demand re-payment of any loans that may have been granted under this facility up to that time.
In addition, the terms of the €3.8 billion (as of December 31, 2010) in notes issued by Bayer in the years 2006 to 2010 under its multi-currency Euro Medium Term Notes program also contain a change-of-control clause. Holders of these notes have the right to demand the redemption of their notes by Bayer AG in the event of a change of control if Bayer AG’s credit rating is downgraded within 120 days after such change of control becomes effective.
Agreements exist for members of the Board of Management in compliance with Section 4.2.3 of the German Corporate Governance Code to cover the eventuality of a takeover offer being made for Bayer AG. Under these agreements, payments promised in the event of early termination of the service contract of a Board of Management member due to a change of control are limited to the value of three years’ compensation and may not compensate more than the remaining term of the contract.
The above arrangement does not apply to the service contract of a Board of Management member that was concluded prior to the entry into force of the relevant amendments to the German Corporate Governance Code in 2008. In this case, payments would be made in line with the provi-sions of the severance indemnity clause referred to in Chapter 7.2 (“Compensation Report”) if a change of control were to lead to the termination of this member’s service contract and his leav-ing the Bayer Group prior to his 60th birthday.
Table of ConTenTs
Combined managemenT RepoRT

BAYER ANNUAL REPORT 201088 COMBINED MANAGEMENT REPORT
7. Corporate Governance Report7.1 Declaration on Corporate Governance
7. Corporate Governance ReportTHIS CORPORATE GOVERNANCE REPORT ALSO CONSTITUTES THE REPORT PURSUANT TO SECTION 3.10 OF THE GERMAN CORPORATE GOVERNANCE CODE.
7.1 Declaration on Corporate Governance* * not part of the audited management report
DECLARATION BY THE BOARD OF MANAGEMENT AND SUPERVISORY BOARD
concerning the German Corporate Governance Code (May 26, 2010 version) pursuant to Section 161 of the German Stock Corporation Act**
Under Section 161 of the German Stock Corporation Act, the Board of Management and the Supervisory Board of Bayer AG are required to issue an annual declaration that the company has been, and is, in compliance with the recommendations of the “Government Commission on the German Corporate Governance Code” as published by the Federal Ministry of Justice in the offi cial section of the electronic Federal Gazette (Bundesanzeiger), or to advise of any recommendations that have not been, or are not being, applied and the reasons for this. An annual declaration was last issued in December 2009.
With respect to the past, the following declaration refers to the June 18, 2009 version of the Code. With respect to present and future corporate governance practices at Bayer AG, the following declaration refers to the recommendations in the May 26, 2010 version of the Code.
Pursuant to Section 161 of the German Stock Corporation Act, the Board of Management and Super-visory Board of Bayer AG hereby declare as follows:1. The company has been in compliance with the recommendations of the Code since issuance of the
last annual compliance declaration in December 2009 with the temporary exception stated in the compliance declaration of December 2009: Until March 31, 2010, the amount of the deductible for the d&o insurance for the members of the Supervisory Board was not in compliance with the rec-ommendation given in Section 3.8 Paragraph 2 of the Code because the d&o insurance is a group policy for which a deductible in the recommended amount was only agreed when the policy came up for renewal on April 1, 2010.
2. The company is in compliance with the recommendations of the Code with the exception of the recommendation given in Section 5.4.5, which temporarily is not being complied with in full.
The deviation from the recommendation given in Section 5.4.5 of the Code results from the fact that the Supervisory Board member Dr.-Ing. Ekkehard D. Schulz, Chairman of the Executive Board of ThyssenKrupp AG, is a member of the supervisory boards of more than three listed companies or companies with similar requirements (Bayer AG, MAN SE, RWE AG and AXA Konzern AG). Dr. Schulz will retire from the Executive Board of ThyssenKrupp AG at the end of the General Stockholders’ Meeting of ThyssenKrupp AG on January 21, 2011. All the members of the Board of Management and the Supervisory Board will be in compliance with the recommendation given in Section 5.4.5 of the Code from that date. Since Dr. Schulz has been a member of the three other supervisory boards mentioned above for many years and will now remain a member of the Executive Board of the above listed company for only a brief period, the temporary deviation from the recommendation given in Section 5.4.5 of the Code is considered acceptable.
Leverkusen, December 2010
For the Board of Management: For the Supervisory Board:
DR. DEKKERS BAUMANN DR. SCHNEIDER
** This is an English translation of a German document. The German document is the offi cial and controlling version, and this English translation in no event modifi es, interprets or limits the offi cial German version.
BAUMANN DR. R. SCHSC NEIDER
Table of ConTenTs
Combined managemenT RepoRT
BAYER ANNUAL REPORT 2010 COMBINED MANAGEMENT REPORT 89
7. Corporate Governance Report7.1 Declaration on Corporate Governance
BAYER IN COMPLIANCE WITH RECOMMENDATIONS OF THE CORPORATE GOVERNANCE CODEBayer has always placed great importance on responsible corporate governance and will continue to do so. In 2010 the company was able to issue a declaration that it has been compliant with the recommendations of the German Corporate Governance Code in the past with one temporary ex-ception and intends to be fully compliant again in the future with one temporary exception.
The Board of Management and Supervisory Board last year again addressed the question of com-pliance with the Corporate Governance Code, particularly in light of the new recommendations in-cluded in the amended version of the Code published on May 26, 2010. The resulting declaration of compliance, reproduced above, was issued in December 2010 and posted on Bayer’s website along with previous declarations.
DUTIES AND ACTIVITIES OF THE BOARD OF MANAGEMENTBayer AG is a strategic management holding company, run by its Board of Management on the Board’s own responsibility with the goal of sustainably increasing the company’s enterprise value and achieving defi ned corporate objectives. The Board of Management performs its tasks accord-ing to the law, the Articles of Incorporation and the Board’s rules of procedure, and works with the company’s other governance bodies in a spirit of trust.
The Board of Management defi nes the long-term goals and the strategies for the Group, its sub-groups and its service companies, and sets forth the principles and directives for the resulting corporate policies. It coordinates and monitors the most important activities, defi nes the portfo-lio, develops and deploys managerial staff, allocates resources and decides on the Group’s fi nan-cial steering and reporting.
The members of the Board of Management bear joint responsibility for running the business as a whole. However, the individual members manage the areas assigned to them on their own respon-sibility within the framework of the decisions made by the entire Board. The allocation of duties among the members of the Board of Management is defi ned in a written schedule.
The entire Board of Management makes decisions on all matters of fundamental importance and in cases where a decision of the entire Board is prescribed by law or otherwise mandatory. The rules of procedure of the Board of Management contain a list of topics that must be dealt with and resolved by the entire Board.
Meetings of the Board of Management are held regularly. They are convened by the Chairman of the Board of Management. Any member of the Board of Management may also demand that a meeting be held. The Board of Management makes decisions by a simple majority of the votes cast, except where unanimity is required by law. In the event of a tie, the Chairman has the cast-ing vote.
According to the Board of Management’s rules of procedure and schedule of duties, the Chairman bears particular responsibility for leading and coordinating the Board’s work. He represents the company and the Group in dealings with third parties and the workforce on matters relating to more than one part of the company or the Group. He also bears special responsibility for certain departments of the Corporate Center and their fi elds of activity.
The schedule of duties also assigns particular areas of specialist responsibility to the other mem-bers who served on the Board of Management in 2010. Each of these members also represents certain geographical regions. The previous Chairman of the Board of Management and the former Chief Financial Offi cer retired in 2010. The new Chairman of the Board of Management and the new Chief Financial Offi cer both had transition periods of several months in which to prepare for their new duties with the support of their respective predecessors.
No committees of the Board of Management have been set up in view of the small number of members and the role of Bayer AG as a strategic management holding company.
INTERNET
www.bayer.com/en/corporate-governance.aspx
Board of Management directs the Group’s
operations
Table of ConTenTs
Combined managemenT RepoRT

BAYER ANNUAL REPORT 201090 COMBINED MANAGEMENT REPORT
7. Corporate Governance Report7.1 Declaration on Corporate Governance
SUPERVISORY BOARD: OVERSIGHT AND CONTROL FUNCTIONSThe role of the 20-member Supervisory Board is to oversee and advise the Board of Management. Under the German Codetermination Act, half the members of the Supervisory Board are elected by the stockholders, and half by the company’s employees. The Supervisory Board is directly involved in decisions on matters of fundamental importance to the company, regularly conferring with the Board of Management on the company’s strategic alignment and the implementation status of the business strategy.
The Chairman of the Supervisory Board coordinates its work and presides over the meetings. Through regular discussions with the Board of Management, the Supervisory Board is kept con-stantly informed of business policy, corporate planning and strategy. The Supervisory Board approves the annual budget and fi nancial framework. It also approves the fi nancial statements of Bayer AG and the consolidated fi nancial statements of the Bayer Group, along with the com-bined management report, taking into account the reports by the auditor.
COMMITTEES OF THE SUPERVISORY BOARDThe Supervisory Board currently has the following committees:
Presidial Committee: This comprises the Chairman and Vice Chairman of the Supervisory Board along with a further stockholder representative and a further employee representative. The Pre-sidial Committee serves primarily as the mediation committee pursuant to the German Codeter-mination Act. It has the task of submitting proposals to the Supervisory Board on the appointment of members of the Board of Management if the necessary two-thirds majority is not achieved in the fi rst vote at a plenary meeting. Certain decision-making powers in connection with capital measures, including the power to amend the Articles of Incorporation accordingly, have also been delegated to this committee.
Audit Committee: The Audit Committee comprises three stockholder representatives and three employee representatives. The Chairman of the Audit Committee in 2010, Dr. Klaus Sturany, satis-fi es the statutory requirements concerning the independence and expertise in the fi eld of account-ing or auditing that a member of the Supervisory Board and the Audit Committee is required to possess. The Audit Committee meets regularly four times a year. Its tasks include examining the company’s fi nancial reporting along with the fi nancial statements of Bayer AG, the consolidated fi -nancial statements of the Bayer Group, the combined management report, the proposal for the use of the distributable profi t of Bayer AG, and the interim fi nancial statements and management re-ports of the Bayer Group, all of which are prepared by the Board of Management. On the basis of the auditor’s report on the audit of the fi nancial statements of Bayer AG, the consolidated fi nancial statements of the Bayer Group and the combined management report, the Audit Committee devel-ops proposals concerning the approval of the statements by the full Supervisory Board. The Audit Committee is also responsible for the company’s relationship with the external auditor. The Audit Committee submits a proposal to the full Supervisory Board concerning the auditor’s appointment, prepares the awarding of the audit contract to the audit fi rm appointed by the Annual Stockhold-ers’ Meeting, suggests areas of focus for the audit and determines the auditor’s remuneration. It also monitors the independence, qualifi cations, rotation and effi ciency of the auditor.
In addition, the Audit Committee oversees the company’s internal control system – along with the procedures used to identify, track and manage risk – and the internal audit system. It also deals with corporate compliance issues and discusses developments in this area at each of its meetings.
Human Resources Committee: On this committee, too, there is parity of representation between stockholders and employees. It consists of the Chairman of the Supervisory Board and three other members. The Human Resources Committee prepares the personnel decisions of the full Supervisory Board, which resolves on appointments or dismissals of members of the Board of Management. The Human Resources Committee resolves on behalf of the Supervisory Board on the service contracts of the members of the Board of Management. However, it is the task of the full Supervisory Board to resolve on the total compensation of the individual members of the Board of Management and the respective compensation components, as well as to regularly review the compensation system on the basis of recommendations submitted by the Human Resources Committee. The Human Resources Committee also discusses the long-term succession planning for the Board of Management.
Supervisory Board oversees corporate
management
Table of ConTenTs
Combined managemenT RepoRT

BAYER ANNUAL REPORT 2010 COMBINED MANAGEMENT REPORT 91
7. Corporate Governance Report7.1 Declaration on Corporate Governance
Nominations Committee: This committee carries out preparatory work when an election of stockholder representatives to the Supervisory Board is to be held. It suggests suitable candi-dates for the Supervisory Board to propose to the Annual Stockholders’ Meeting for election. The Nominations Committee comprises the Chairman of the Supervisory Board and the other stock-holder representative on the Presidial Committee.
Detailed information on the work of the Supervisory Board and its committees is provided in the Report of the Supervisory Board on page 10ff. of this Annual Report.
OBJECTIVES FOR THE COMPOSITION OF THE SUPERVISORY BOARDThe Supervisory Board should be composed in such a way that its members together possess the necessary expertise, skills and professional experience to properly perform their duties. In view of Bayer AG’s global operations, the Supervisory Board endeavors at all times to have several mem-bers who have international business experience or an international background. A further objec-tive concerning the composition of the Supervisory Board is that, absent special circumstances, its members should not hold offi ce beyond the end of the next Annual Stockholders’ Meeting following their 72nd birthday, and that at least 75% of the Supervisory Board members must be independent. The Supervisory Board assesses the independence of its members according to the recommenda-tion contained in Section 5.4.2 of the German Corporate Governance Code. In assessing indepen-dence, the Supervisory Board also considers the criteria given in the recommendation of the Euro-pean Commission of February 15, 2005.1
Another goal for the composition of the Supervisory Board is to gradually increase the proportion of women on the Supervisory Board to at least 20% in the medium term. The aim is to have at least 15% female members following the elections to the Supervisory Board in 2012. It is intended to achieve the medium-term goal at the subsequent Supervisory Board election due to take place in 2017. These targets refer to the Supervisory Board as a whole, and are designed to be achieved evenly among the stockholder and employee representatives. However, since the Supervisory Board can only nominate candidates for election as stockholder representatives, it can only take the tar-gets into account in these nominations. This assumes that suitable female candidates can be found for election as stockholder representatives.
IMPLEMENTATION STATUS OF THE OBJECTIVESThe Supervisory Board has several members with international business experience and other international connections. No member of the Supervisory Board is older than the target maxi-mum age. One member, Hubertus Schmoldt, has been a member of the Supervisory Board since 1995, and thus has served more than three terms of offi ce. However, Mr. Schmoldt has no busi-ness ties to the company or its Board of Management that in the opinion of the Supervisory Board could result in a confl ict of interest. Currently, 10% of the Supervisory Board members are women. An increase in the proportion of women on the Supervisory Board is targeted for the next regular elections to be held at the Annual Stockholders’ Meeting in 2012.
PERSONAL LIABILITY IN PLACE OF A DEDUCTIBLEUntil March 31, 2010 the company met the recommendation in the German Corporate Governance Code regarding deductibles for any Directors’ & Offi cers’ (d&o) liability insurance by obtaining personal declarations from each member of the Board of Management and Supervisory Board. According to these declarations, the members of the Board of Management undertook, should they cause damage to the company or third parties through gross negligence (as defi ned by German law) in the performance of their duties, to pay for such damage up to the equivalent of half their total annual compensation for the year in which any such damage occurred; the mem-bers of the Supervisory Board undertook until March 31, 2010, to pay for such damage, if caused by them, up to the equivalent of the variable portion of their respective annual compensation as Supervisory Board members for the relevant year.
The company agreed the statutory deductible for members of the Board of Management when the d&o insurance was renewed effective April 1, 2010. It also agreed a deductible for the members of the Supervisory Board in the amount recommended by the German Corporate Governance Code, effective on the same date. The personal declarations referred to above thus became obsolete as of April 1, 2010.
1 Annex 2 to the recommendation of the European Commission of February 15, 2005, on the role of non-executive or supervisory directors of listed companies and on the committees of the (supervisory) board (2005/162/ec).
Table of ConTenTs
Combined managemenT RepoRT
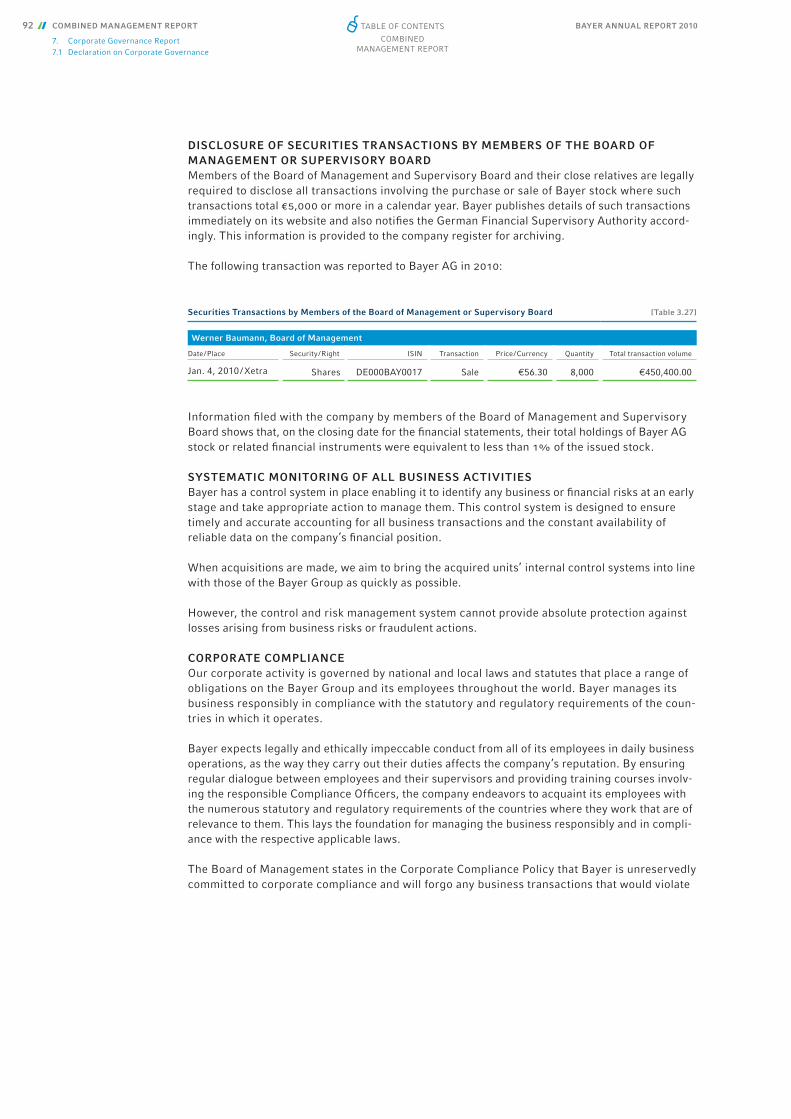
BAYER ANNUAL REPORT 201092 COMBINED MANAGEMENT REPORT
7. Corporate Governance Report7.1 Declaration on Corporate Governance
DISCLOSURE OF SECURITIES TRANSACTIONS BY MEMBERS OF THE BOARD OF MANAGEMENT OR SUPERVISORY BOARDMembers of the Board of Management and Supervisory Board and their close relatives are legally required to disclose all transactions involving the purchase or sale of Bayer stock where such transactions total €5,000 or more in a calendar year. Bayer publishes details of such transactions immediately on its website and also notifi es the German Financial Supervisory Authority accord-ingly. This information is provided to the company register for archiving.
The following transaction was reported to Bayer AG in 2010:
Information fi led with the company by members of the Board of Management and Supervisory Board shows that, on the closing date for the fi nancial statements, their total holdings of Bayer AG stock or related fi nancial instruments were equivalent to less than 1% of the issued stock.
SYSTEMATIC MONITORING OF ALL BUSINESS ACTIVITIESBayer has a control system in place enabling it to identify any business or fi nancial risks at an early stage and take appropriate action to manage them. This control system is designed to ensure timely and accurate accounting for all business transactions and the constant availability of reliable data on the company’s fi nancial position.
When acquisitions are made, we aim to bring the acquired units’ internal control systems into line with those of the Bayer Group as quickly as possible.
However, the control and risk management system cannot provide absolute protection against losses arising from business risks or fraudulent actions.
CORPORATE COMPLIANCEOur corporate activity is governed by national and local laws and statutes that place a range of obligations on the Bayer Group and its employees throughout the world. Bayer manages its business responsibly in compliance with the statutory and regulatory requirements of the coun-tries in which it operates.
Bayer expects legally and ethically impeccable conduct from all of its employees in daily business operations, as the way they carry out their duties affects the company’s reputation. By ensuring regular dialogue between employees and their supervisors and providing training courses involv-ing the responsible Compliance Offi cers, the company endeavors to acquaint its employees with the numerous statutory and regulatory requirements of the countries where they work that are of relevance to them. This lays the foundation for managing the business responsibly and in compli-ance with the respective applicable laws.
The Board of Management states in the Corporate Compliance Policy that Bayer is unreservedly committed to corporate compliance and will forgo any business transactions that would violate
Securities Transactions by Members of the Board of Management or Supervisory Board [Table 3.27]
Werner Baumann, Board of Management
Date / Place Security / Right ISIN Transaction Price / Currency Quantity Total transaction volume
Jan. 4, 2010 / Xetra Shares DE000BAY0017 Sale €56.30 8,000 €450,400.00
Table of ConTenTs
Combined managemenT RepoRT

BAYER ANNUAL REPORT 2010 COMBINED MANAGEMENT REPORT 93
7. Corporate Governance Report7.1 Declaration on Corporate Governance
compliance principles. The Policy also details the organizational framework for corporate com-pliance and specifi es areas in which violations of applicable law can have particularly serious adverse consequences, both for the entire enterprise and for individual employees. The princi-ples set forth in the Corporate Compliance Policy are designed to guide employees in their busi-ness-related actions and protect them from potential misconduct. Its core requirements are:
• adherence to antitrust regulations, • integrity in business transactions and the ban on exerting any kind of improper infl uence, • the observance of product stewardship and the commitment to the principle of sustainability, • the strict separation of business and personal interests, and • the commitment to ensure fair and respectful working conditions across the enterprise.
Employees may contact either their respective supervisors or the local Compliance Offi cers for support and advice on ensuring legally compliant conduct in specifi c business situations.
Each Group company with business operations has at least one Compliance Offi cer. Some for-eign companies have several local Compliance Offi cers with clearly defi ned responsibilities for the different business units within the respective companies. The main responsibilities of each local Compliance Offi cer include:
• providing advice to the operational business units, • assessing risks, • running or arranging compliance training programs, • investigating any reports of possible compliance violations and initiating appropriate correc-
tive action, and • meeting Group-level reporting obligations toward the Chief Subgroup Compliance Offi cers at
the Group management companies.
The Chief Subgroup Compliance Offi cers in turn report to the Group Compliance Offi cer, who is appointed by the Group Management Board. At least once a year, the Group Compliance Offi cer and the Head of Corporate Auditing report to the Audit Committee of the Supervisory Board on any compliance violations that have been identifi ed.
The issue of corporate compliance is a permanent part of the performance targets agreed with the members of the Group Leadership Circle (glc). By virtue of their positions, these executives have a special obligation to set an example for their employees, spread the compliance message increasingly within their companies and take organizational measures to implement it. As of 2010, a glc member may be required to repay the sti awards granted for up to fi ve of the preceding years if a systematic violation of applicable law that caused fi nancial loss to Bayer was committed in one or more years by a direct report and appropriate action by the glc member could have pre-vented the violation.
COMMON VALUES AND LEADERSHIP PRINCIPLESTo complement the Corporate Compliance Policy, Bayer has committed itself to specifi c values. These values – Leadership, Integrity, Flexibility and Effi ciency, or “life” for short – provide guid-ance to all Bayer employees, both in business dealings and in working together within the compa-ny. All employees are obligated to align their work to the life values. This is taken into account in human resources development and the regular performance evaluations.
Table of ConTenTs
Combined managemenT RepoRT

BAYER ANNUAL REPORT 201094 COMBINED MANAGEMENT REPORT
7. Corporate Governance Report7.1 Declaration on Corporate Governance
DETAILED REPORTINGTo maximize transparency, we provide regular and timely information on the Group’s position and signifi cant changes in business activities to stockholders, fi nancial analysts, stockholders’ associations, the media and the general public. Bayer complies with the recommendations of the Corporate Governance Code by publishing reports on business trends, fi nancial position, re-sults of operations and related risks four times a year.
In line with statutory requirements, the members of the Group Management Board provide an assurance that, to the best of their knowledge, the fi nancial statements of Bayer AG, the consol-idated fi nancial statements of the Bayer Group and the combined management report provide a true and fair view.
The fi nancial statements of Bayer AG, the consolidated fi nancial statements of the Bayer Group and the combined management report are published within 90 days following the end of each fi scal year. During the fi scal year, stockholders and other interested parties are kept informed of developments by means of the half-year fi nancial report and additional interim reports as of the end of the fi rst and third quarters. The half-year fi nancial report is voluntarily subjected to an audit review by the auditor, whose appointment by the Annual Stockholders’ Meeting also re-lates specifi cally to this audit review.
Bayer also provides information at news conferences and analysts’ meetings. In addition, the company uses the Internet as a platform for timely disclosure of information, including details of the dates of major publications and events, such as the annual and interim reports or the An-nual Stockholders’ Meeting.
In line with the principle of fair disclosure, all stockholders and other principal target groups are treated equally as regards the communication of valuation-relevant information. All signifi -cant new facts are disclosed immediately to the general public. Stockholders also have immedi-ate access to the information that Bayer publishes locally in compliance with the stock market regulations of various countries.
In addition to our regular reporting, we issue ad-hoc statements on developments that other-wise might not become publicly known but have the potential to materially affect the price of Bayer stock.
For comprehensive information on Bayer, go to www.bayer.com
Table of ConTenTs
Combined managemenT RepoRT

BAYER ANNUAL REPORT 2010 COMBINED MANAGEMENT REPORT 95
7. Corporate Governance Report7.2 Compensation Report
7.2 Compensation ReportCOMPENSATION OF THE BOARD OF MANAGEMENTIn 2010 the compensation of the Board of Management basically comprised fi ve components: a fi xed annual salary, a short-term incentive award on a yearly basis in relation to a target amount, a long-term incentive award for a four-year period in relation to a target amount, a fur-ther long-term compensation component introduced in 2010 involving a grant of virtual Bayer shares subject to a three-year retention period, and a company pension plan conferring pension entitlements that increase with years of service. Compensation in kind and other benefi ts are also provided, such as the use of a company car for private purposes or reimbursement of the cost of health screening examinations.
The short-term incentive (sti) award for 2010 is calculated according to the Group’s ebitda margin before special items and the weighted average target attainment of the HealthCare, CropScience and MaterialScience subgroups. The Supervisory Board can adjust this award ac-cording to individual performance. The target attainment of the subgroups is measured chiefl y in terms of their ebitda before special items. A qualitative appraisal in relation to the market and competitors is also taken into account. Serving members of the Board of Management as of the closing date receive 50% of the sti as direct compensation and 50% in the form of the new long-term compensation component.
The amount of Werner Wenning’s sti award for 2010 was set at the Supervisory Board’s discretion. In consideration of Mr. Wenning’s duties as Chairman of the Board of Management in 2010, and especially their successful transfer to Marijn Dekkers, the Supervisory Board spec-ifi ed a sum of €1,863 thousand, which was paid out in January 2011 as agreed. The sti award for Klaus Kühn was fi nalized upon his retirement from the Board of Management and paid out in May 2010.
The directly effected compensation for the service of the members of the Board of Management in 2010 totaled €10,019 thousand (2009: €8,830 thousand). Of this amount, fi xed salaries ac-counted for €3,936 thousand (2009: €3,223 thousand), the part of the sti awards to be paid out in 2011 to the members of the Board of Management holding offi ce on December 31, 2010 for €4,928 thousand (2009: €5,442 thousand), and compensation in kind and other benefi ts for €1,155 thousand (2009: €165 thousand), the latter item consisting mainly of amounts assigned to compensation in kind and other benefi ts in accordance with German taxation guidelines.
Since 2010 the long-term compensation of the members of the Board of Management holding offi ce on December 31, 2010 has consisted of two components: a grant of virtual Bayer shares for which parts of the sti award – which was previously paid out in full – are used, and the long-term stock-based compensation program Aspire.
The 2010 Annual Stockholders’ Meeting approved the compensation system for the members of the Board of Management by way of a consultative resolution. This system remains in effect.
According to the changes resolved by the Supervisory Board in December 2009 and confi rmed by the Annual Stockholders’ Meeting, 50% of the sti was granted in the form of virtual Bayer shares subject to a three-year retention period, thereby creating a new long-term compensation component. The value of these shares depends on the trend in the price of Bayer stock during the retention period. The basis for the conversion of this former part of the sti payment into vir-tual shares was the average offi cial closing price of Bayer shares over the last 30 trading days of 2010 (November 18 – December 30, 2010) in the Xetra system of the Frankfurt Stock Exchange; this average price was €56.95. Wolfgang Plischke and Richard Pott receive one additional virtu-al Bayer share for every 20 virtual shares granted under the new system to compensate them for the conversion of part of the former sti into a long-term compensation component. The ad-ditional virtual shares are subject to the same retention period and value development.
Table of ConTenTs
Combined managemenT RepoRT
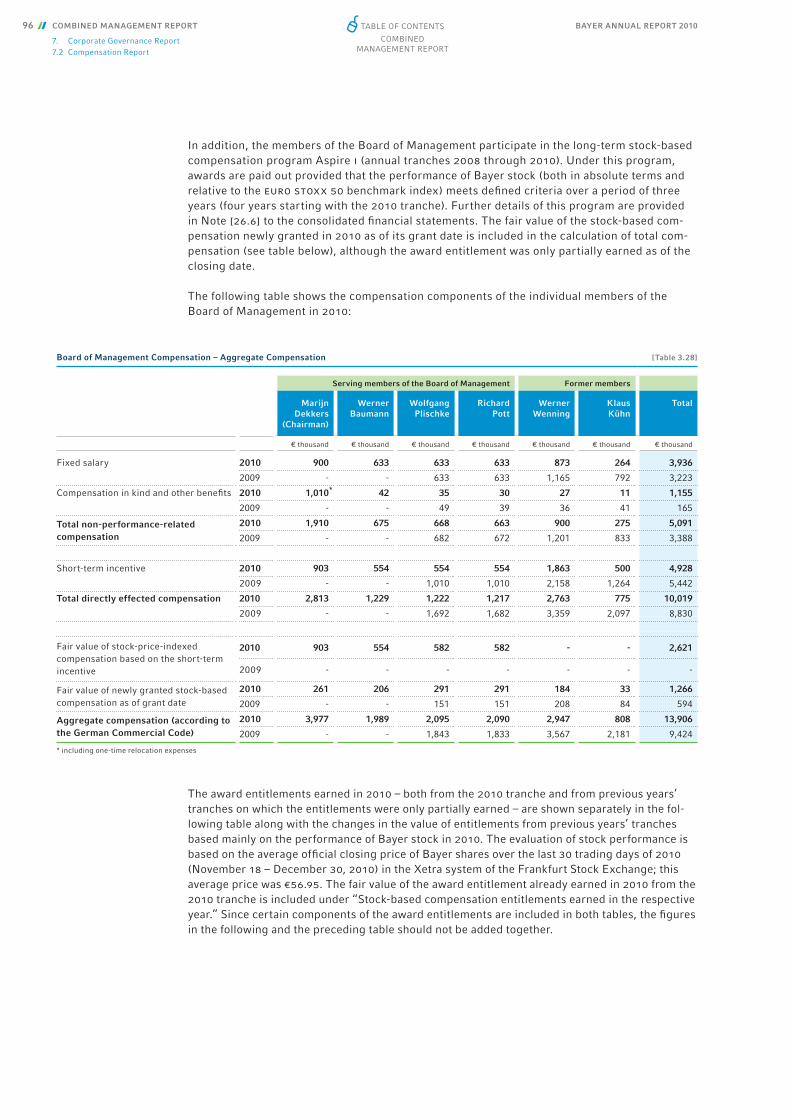
BAYER ANNUAL REPORT 201096 COMBINED MANAGEMENT REPORT
7. Corporate Governance Report7.2 Compensation Report
In addition, the members of the Board of Management participate in the long-term stock-based compensation program Aspire i (annual tranches 2008 through 2010). Under this program, awards are paid out provided that the performance of Bayer stock (both in absolute terms and relative to the euro stoxx 50 benchmark index) meets defi ned criteria over a period of three years (four years starting with the 2010 tranche). Further details of this program are provided in Note [26.6] to the consolidated fi nancial statements. The fair value of the stock-based com-pensation newly granted in 2010 as of its grant date is included in the calculation of total com-pensation (see table below), although the award entitlement was only partially earned as of the closing date.
The following table shows the compensation components of the individual members of the Board of Management in 2010:
The award entitlements earned in 2010 – both from the 2010 tranche and from previous years’ tranches on which the entitlements were only partially earned – are shown separately in the fol-lowing table along with the changes in the value of entitlements from previous years’ tranches based mainly on the performance of Bayer stock in 2010. The evaluation of stock performance is based on the average offi cial closing price of Bayer shares over the last 30 trading days of 2010 (November 18 – December 30, 2010) in the Xetra system of the Frankfurt Stock Exchange; this average price was €56.95. The fair value of the award entitlement already earned in 2010 from the 2010 tranche is included under “Stock-based compensation entitlements earned in the respective year.” Since certain components of the award entitlements are included in both tables, the fi gures in the following and the preceding table should not be added together.
Board of Management Compensation – Aggregate Compensation [Table 3.28]
Serving members of the Board of Management Former members
Marijn Dekkers
(Chairman)
Werner Baumann
Wolfgang Plischke
Richard Pott
Werner Wenning
Klaus Kühn
Total
€ thousand € thousand € thousand € thousand € thousand € thousand € thousand
Fixed salary 2010 900 633 633 633 873 264 3,936
2009 - - 633 633 1,165 792 3,223
Compensation in kind and other benefi ts
2010 1,010* 42 35 30 27 11 1,155
2009 - - 49 39 36 41 165
Total non-performance-related compensation
2010 1,910 675 668 663 900 275 5,091
2009 - - 682 672 1,201 833 3,388
Short-term incentive 2010 903 554 554 554 1,863 500 4,928
2009 - - 1,010 1,010 2,158 1,264 5,442
Total directly effected compensation 2010 2,813 1,229 1,222 1,217 2,763 775 10,019
2009 - - 1,692 1,682 3,359 2,097 8,830
Fair value of stock-price-indexed compensation based on the short-term incentive
2010 903 554 582 582 - - 2,621
2009 - - - - - - -
Fair value of newly granted stock-based compensation as of grant date
2010 261 206 291 291 184 33 1,266
2009 - - 151 151 208 84 594
Aggregate compensation (according to the German Commercial Code)
2010 3,977 1,989 2,095 2,090 2,947 808 13,906
2009 - - 1,843 1,833 3,567 2,181 9,424
* including one-time relocation expenses
Table of ConTenTs
Combined managemenT RepoRT

BAYER ANNUAL REPORT 2010 COMBINED MANAGEMENT REPORT 97
7. Corporate Governance Report7.2 Compensation Report
The current members of the Board of Management are generally entitled to receive a pension upon leaving the Bayer Group, though not before the age of 60, in an annual amount equal to at least 30% of the last yearly fi xed salary. This percentage increases depending on years of service as a member of the Board of Management and is capped at 60% except in the case of the member ap-pointed prior to 2006, whose pension entitlement can rise to a maximum of 80% of his last yearly fi xed salary. The respective surviving dependents’ benefi t is set at 60% of this pension level.
The current service cost for the pension entitlements of the members of the Board of Manage-ment is shown in the following table. The current service cost for pension entitlements according to the German Commercial Code (hgb) also includes any past service cost resulting from new en-titlements or variations in existing entitlements. The change in the present value of pension enti-tlements also refl ects the interest cost for entitlements earned in prior years, along with actuarial gains and losses. Expenses for the pension entitlements of the members of the Board of Manage-ment who retired during the year are included up to the respective retirement dates. Since hgb and ifrs prescribe different methods for calculating pension provisions, the table contains both the amounts disclosed in the fi nancial statements of Bayer AG prepared according to hgb and those published in the consolidated fi nancial statements of the Bayer Group prepared according to ifrs. The fi gures in each case represent divergent disclosures of one and the same pension entitlement.
Board of Management Compensation – Stock-Based Compensation [Table 3.29]
Serving members of the Board of Management Former members
Marijn Dekkers
(Chairman)
Werner Baumann
Wolfgang Plischke
Richard Pott
Werner Wenning
Klaus Kühn
Total
€ thousand € thousand € thousand € thousand € thousand € thousand € thousand
Long-term incentive (stock-based compensation entitlements earned in the respective year)
2010 67 124 234 234 322 98 1,079
2009 - - 319 319 587 398 1,623
Change in value of existing entitlements
2010 - (21) (44) (44) (61) (56) (226)
2009 - - 212 212 390 265 1,079
Pension Entitlements [Table 3.30]
Serving members of the Board of Management Former members
Marijn Dekkers
(Chairman)
Werner Baumann
Wolfgang Plischke
Richard Pott
Werner Wenning
Klaus Kühn
Total
€ thousand € thousand € thousand € thousand € thousand € thousand € thousand
Change in the present value of pension entitlements (IFRS)
2010 2,612 621 1,017 1,074 823 426 6,573
2009 - - 834 707 405 1,433 3,379
Current service cost for pension entitlements earned in the respective year (IFRS)
2010 2,175 111 203 217 - 141 2,847
2009 - - 181 198 - 985 1,364
Present value of pension entitlements at the closing date (IFRS)*
2010 2,612 2,868 6,594 6,552 - - 18,626
2009 - - 5,577 5,478 14,675 6,335 32,065
Change in the present value of pension entitlements (German Commercial Code)
2010 2,481 298 602 577 187 255 4,400
2009 - - 482 279 (452) 1,048 1,357
Current service cost for pension entitlements earned in the respective year (German Commercial Code)
2010 2,292 117 209 225 3 148 2,994
2009 - - 200 223 4 1,090 1,517
Present value of pension entitlements at the closing date (German Commercial Code)
2010 2,481 2,690 6,392 6,301 - - 17,864
2009 - - 5,794 5,728 15,128 6,597 33,247
* after deducting plan assets
Table of ConTenTs
Combined managemenT RepoRT

BAYER ANNUAL REPORT 201098 COMBINED MANAGEMENT REPORT
7. Corporate Governance Report7.2 Compensation Report
Unlike the aggregate compensation according to the German Commercial Code, the aggregate compensation according to ifrs does not include the fair value of newly granted stock-based com-pensation, but rather the stock-based compensation entitlements earned in the respective year plus the change in the value of stock-based compensation entitlements from previous years that have not yet been paid out. It also contains the current service cost for pension entitlements.
The components of the Board of Management’s compensation are summarized in the following table:
For the only Board of Management member whose service contract was concluded prior to the entry into force of the amendments to the German Corporate Governance Code in June 2008, a general severance indemnity clause applies if the service contract is terminated at the company’s instigation prior to his 60th birthday. The basic principles according to this clause are as follows:
If a member of the Board of Management is not offered a new service contract upon expiration of his existing service contract because he is not reappointed to the Board of Management, or if the member is removed from the Board of Management prematurely during the term of his contract in the absence of grounds for termination without notice, he will receive a monthly bridging allow-ance amounting to 80% of his last monthly fi xed salary for a maximum period of 60 months from the date of expiration of his service contract less the period for which he was released from his duties on full pay or otherwise compensated. (If he were removed during the term of his contract, he would also receive the payment due for the rest of the term, though this would be reduced to the amount of his annual fi xed salary plus the target amount for the sti payment for at least twelve months.) His earnings from any new employment elsewhere would be offset against the bridging allowance. In the case of premature termination at the instigation of the company, further years of service might be credited under certain circumstances for the purpose of computing his Board of Management pension entitlement, though not beyond his 60th birthday.
The Supervisory Board has decided to follow the recommendation of the German Corporate Gov-ernance Code, as amended in June 2008, and limit severance payments under new service con-tracts. Under only one existing member’s contract could the clause still be invoked. In the case of the remaining contracts, it has been agreed that payment claims can only arise in the event of pre-mature contract termination by the company without cause. Such claims, including ancillary ben-efi ts, are then limited to the value of two years’ compensation and may not compensate more than the remaining term of the contract. The severance payment cap is to be calculated on the basis of the total compensation (fi xed salary plus the target value of the sti) for the previous year and, if appropriate, also the expected total compensation for the current year.
Board of Management Compensation according to IFRS [Table 3.31]
2009 2010
€ thousand € thousand
Directly effected compensation 8,830 10,019
Fair value of stock-price-indexed compensation based on the short-term incentive - 2,621
Long-term incentive (stock-based compensation entitlements earned in the respective year) 1,623 1,079
Change in value of existing entitlements 1,079 (226)
Current service cost for pension entitlements earned in the respective year 1,364 2,847
Aggregate compensation (IFRS) 12,896 16,340
Table of ConTenTs
Combined managemenT RepoRT

BAYER ANNUAL REPORT 2010 COMBINED MANAGEMENT REPORT 99
7. Corporate Governance Report7.2 Compensation Report
Post-contractual non-compete agreements have been concluded with the members of the Board of Management, providing for compensatory payments to be made by the company for the two-year duration of the post-contractual non-compete clause. For members appointed prior to 2010, this payment amounts to 50% of the average contractually agreed salary for the preceding three years. For the members newly appointed to the Board of Management as of January 1, 2010, the compensatory payment is 100% of the average fi xed salary for the twelve months preceding their departure. It is offset against any severance payments.
Since his retirement from the Board of Management, Klaus Kühn has received regular payments as compensation for such a non-compete clause. The payments made to him in 2010 totaled €764,780.
Special supplementary arrangements apply in the event of a change of control, see Chapter 6 “Takeover-Relevant Information.”
Members of the Board of Management – in common with all employees – who joined the company prior to January 1, 1979, are entitled to six months’ pre-retirement leave. A payment may be made in lieu of this leave in certain circumstances. In 2010 this arrangement applied only to Werner Wenning, to whom a payment of €1,850 thousand was made in settlement of his claim to pre-re-tirement leave. This amount is included in the total of pensions paid to retired members of the Board of Management given below.
There were no loans to members of the Board of Management outstanding as of December 31, 2010, nor any repayments of such loans during the year.
We currently pay retired members of the Board of Management a monthly pension equal to 80% of the last monthly base salary received while in service. The pensions paid to former members of the Board of Management or their surviving dependents have been reassessed annually since January 1, 2009 and adjusted taking into account the development of consumer prices. These benefi ts are in addition to any amounts they receive under previous employee pension arrange-ments. The pensions paid to former members of the Board of Management and their surviving de-pendents amounted to €13,351 thousand (2009: €11,273 thousand). Pension provisions for former members of the Board of Management and their surviving dependents at the closing date amount-ed to €131,599 thousand (2009: €107,223 thousand) according to ifrs and €129,121 thousand (2009: €110,069 thousand) according to hgb.
COMPENSATION OF THE SUPERVISORY BOARDThe Supervisory Board is compensated according to the relevant provisions of the Articles of In-corporation, which provisions have not been altered since the resolution of the Annual Stockhold-ers’ Meeting on April 29, 2005. This provides that, in addition to reimbursement of their expens-es, each member of the Supervisory Board receives fi xed annual compensation of €60,000 and a variable annual compensation component. The variable compensation component is based on corporate performance in terms of the gross cash fl ow reported in the consolidated fi nancial statements of the Bayer Group for the respective fi scal year. The members of the Supervisory Board receive €2,000 for every €50 million or part thereof by which the gross cash fl ow exceeds €3.1 billion, but the variable component for each member may not exceed €30,000.
In accordance with the recommendations of the German Corporate Governance Code, additional compensation is paid to the Chairman and Vice Chairman of the Supervisory Board and for chair-ing and membership of committees. The Chairman of the Supervisory Board receives three times the basic compensation, while the Vice Chairman receives one-and-a-half times the basic com-pensation. Members of the Supervisory Board who are also members of a committee receive an additional one quarter of the amount, with those chairing a committee receiving a further quarter. However, no member of the Supervisory Board may receive total compensation exceeding three times the basic compensation. It has been agreed that no additional compensation shall be paid for membership of the Nominations Committee. If changes are made to the Supervisory Board and its committees during the fi scal year, members receive compensation on a pro-rated basis.
Table of ConTenTs
Combined managemenT RepoRT
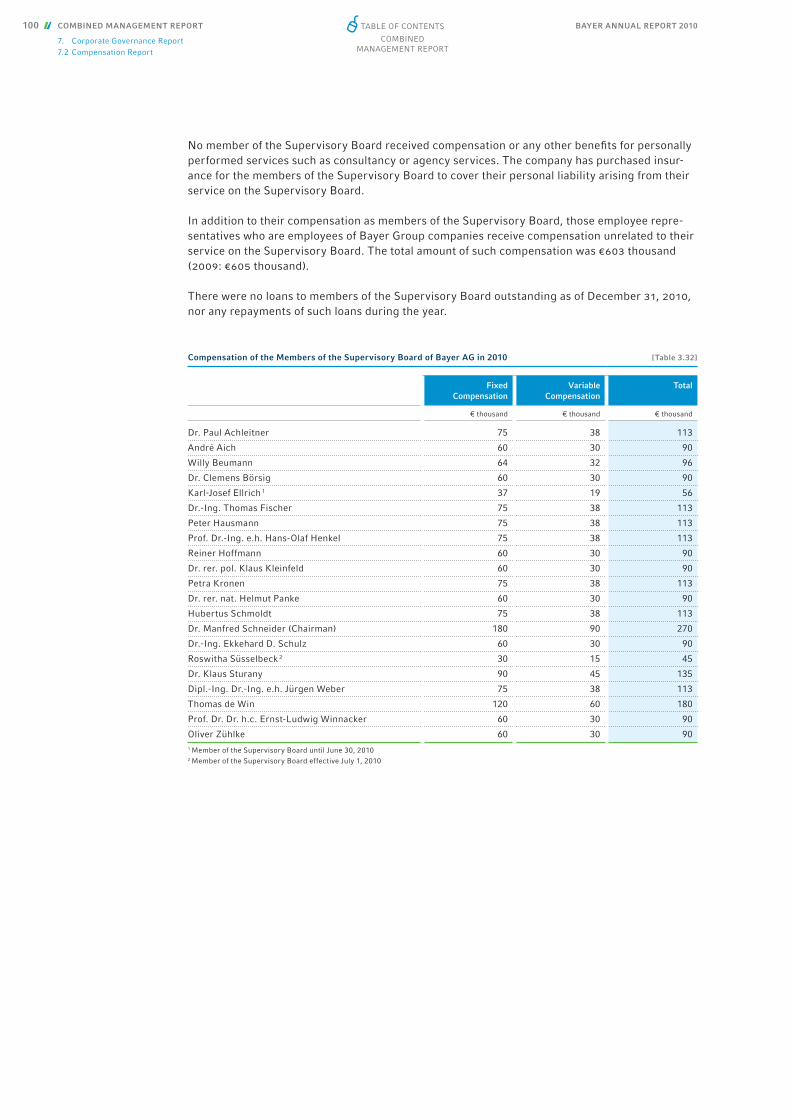
BAYER ANNUAL REPORT 2010100 COMBINED MANAGEMENT REPORT
7. Corporate Governance Report7.2 Compensation Report
No member of the Supervisory Board received compensation or any other benefi ts for personally performed services such as consultancy or agency services. The company has purchased insur-ance for the members of the Supervisory Board to cover their personal liability arising from their service on the Supervisory Board.
In addition to their compensation as members of the Supervisory Board, those employee repre-sentatives who are employees of Bayer Group companies receive compensation unrelated to their service on the Supervisory Board. The total amount of such compensation was €603 thousand (2009: €605 thousand).
There were no loans to members of the Supervisory Board outstanding as of December 31, 2010, nor any repayments of such loans during the year.
Compensation of the Members of the Supervisory Board of Bayer AG in 2010 [Table 3.32]
Fixed Compensation
Variable Compensation
Total
€ thousand € thousand € thousand
Dr. Paul Achleitner 75 38 113
André Aich 60 30 90
Willy Beumann 64 32 96
Dr. Clemens Börsig 60 30 90
Karl-Josef Ellrich 1 37 19 56
Dr.-Ing. Thomas Fischer 75 38 113
Peter Hausmann 75 38 113
Prof. Dr.-Ing. e.h. Hans-Olaf Henkel 75 38 113
Reiner Hoffmann 60 30 90
Dr. rer. pol. Klaus Kleinfeld 60 30 90
Petra Kronen 75 38 113
Dr. rer. nat. Helmut Panke 60 30 90
Hubertus Schmoldt 75 38 113
Dr. Manfred Schneider (Chairman) 180 90 270
Dr.-Ing. Ekkehard D. Schulz 60 30 90
Roswitha Süsselbeck 2 30 15 45
Dr. Klaus Sturany 90 45 135
Dipl.-Ing. Dr.-Ing. e.h. Jürgen Weber 75 38 113
Thomas de Win 120 60 180
Prof. Dr. Dr. h.c. Ernst-Ludwig Winnacker 60 30 90
Oliver Zühlke 60 30 901 Member of the Supervisory Board until June 30, 20102 Member of the Supervisory Board effective July 1, 2010
Table of ConTenTs
Combined managemenT RepoRT

BAYER ANNUAL REPORT 2010 COMBINED MANAGEMENT REPORT 101
8. Research and Development
8. Research and Development
Our mission “Bayer: Science For A Better Life” underscores Bayer’s belief that innovation has a major role to play in addressing the global challenges of providing health care and nutrition for the world’s growing population and conserving dwindling resources. Innovation will therefore remain a key driver of the company’s growth in the future. Bayer has the resources at its disposal to continuously renew and expand its portfolio and optimize production processes through research and development. In 2010 we invested the record sum of €3,053 million – equivalent to 8.7% of sales – in research and development, compared with €2,746 million in the previous year. Our research and development activities are closely aligned to market needs and geared toward continuous improvement. Our own activities are supplemented by an international network of collaborations with leading universities, public-sector research institutes and partner companies that we continue to expand in alignment with our main areas of research and development. This network allows the pooling of expertise, helping us to rapidly translate new ideas into successful products. Another core element of our activities is the continuous development of the 13,200 indi-viduals working in research and development throughout the Bayer Group.
HEALTHCAREIn 2010 we invested €2,066 million (2009: €1,847 million) in research and development (r&d) in the Pharmaceuticals and Consumer Health segments. This represented 67.7% of the Bayer Group’s en-tire research and development expenditures and was equivalent to 12.2% of HealthCare sales. The number of HealthCare subgroup employees working in research and development at the time this report was fi nalized was 7,700.
In the Pharmaceuticals segment we increased our r&d expenditures to €1,751 million (2009: €1,572 million), or 16.1% (2009: 15.0%) of sales. Drug discovery in the Pharmaceuticals segment fo-cuses on the areas of cardiology, diagnostic imaging, oncology and women’s healthcare. The respec-tive research activities and capacities are concentrated at three main sites in Berlin and Wuppertal, Germany, and Berkeley, California, United States. Work in Berlin and Wuppertal centers largely on identifying molecular targets and developing and optimizing lead compounds. Research is also car-ried out at these sites in the fi elds of drug metabolism, pharmacokinetics, toxicology and clinical pharmacology. Berkeley is a major research and development center in which protein-based biologi-cal research on the active ingredient Kogenate® takes place. In 2010 the global research network was strengthened by the opening of an innovation center near San Francisco, California, United States, for hematology research and the development of novel biological active substances. At this center, university research institutes and young biotechnology companies will work closely with our scien-tists. In addition, we established a new international r&d center in Beijing, China, to contribute to the research and development of medicines for China and other Asian countries. At both centers we are seeking strategic alliances with selected research and development partners.
€3.1 billion for research and
development
€2,066 million
for research and development at
HealthCare
Share of Research and Development Expenses by Segment (2009 in parentheses) [Graphic 3.17]
67.7% (67.3%)HealthCarePharmaceuticals 57.4% (57.3%)
Consumer Health 10.3% (10.0%)
23.6% (23.8%)CropScienceEnvironmental Science,BioScience 8.1% (6.2%)
Crop Protection 15.5% (17.6%)
1.1% (1.4%)
Reconciliation 7.6% (7.5%)MaterialScience
Table of ConTenTs
Combined managemenT RepoRT

BAYER ANNUAL REPORT 2010102 COMBINED MANAGEMENT REPORT
8. Research and Development
To drive the development of new substances for treating diseases with a high unmet medical need, we conducted clinical studies with several drug candidates from our research and develop-ment pipeline during 2010. Following the completion of all necessary studies, we submitted appli-cations to one or more authorities for registration or registration extensions for some of these drug candidates. The most important drug candidates currently in the registration process are:
The following table shows our most important drug candidates currently in Phase iii or ii of clinical testing:
Products in Registration [Table 3.33]
Indication
Gadovist® U.S.A., magnetic resonance imaging, central nervous system
Qlaira® / NataziaTM (E2V / DNG) U.S.A., treatment of heavy and / or prolonged menstrual bleeding
Valette® Plus E.U., oral contraception, combination product with folate
Xarelto® Stroke prevention in atrial fi brillation
Xarelto® E.U., treatment and secondary prevention of deep vein thrombosis
Xarelto® U.S.A., prevention of venous thromboembolism following elective hip or knee replacement surgery
YAZ® Flex E.U., oral contraception, fl exible dosage regimen
Research and Development Projects (Phases III and II) * [Table 3.34]
Indication Status
Alemtuzumab Multiple sclerosis Phase III
AlpharadinTM Treatment of bone metastases in hormone-refractory prostate cancer Phase III
ATX-101 Reduction of submental fat Phase III
FC Patch low Contraception Phase III
Florbetaben PET imaging in diagnosis of Alzheimer’s disease Phase III
Gadovist® Magnetic resonance imaging Phase III
LCS (ULD LNG contraceptive system) Contraception Phase III
Nexavar® Breast cancer Phase III
Nexavar® Thyroid cancer Phase III
Nexavar® Non-small-cell lung cancer Phase III
Regorafenib (DAST inhibitor) Treatment of metastatic or inoperable gastrointestinal stromal tumors Phase III
Regorafenib (DAST inhibitor) Colon cancer Phase III
Riociguat (sGC stimulator) Pulmonary hypertension (CTEPH) Phase III
Riociguat (sGC stimulator) Pulmonary hypertension (PAH) Phase III
Xarelto® Prevention of venous thromboembolism in medically ill, immobilized patients Phase III
Xarelto® Treatment and secondary prevention of venous thromboembolism Phase III
Xarelto® Secondary prevention of acute coronary syndrome / myocardial infarction Phase III
Vaginorm® Vulvovaginal atrophy and female sexual dysfunction (FSD) Phase III
VEGF Trap-Eye Wet age-related macular degeneration Phase III
VEGF Trap-Eye Abnormal retinal angiogenesis following pathological myopia Phase III
VEGF Trap-Eye Central retinal vein occlusion Phase III
Table of ConTenTs
Combined managemenT RepoRT
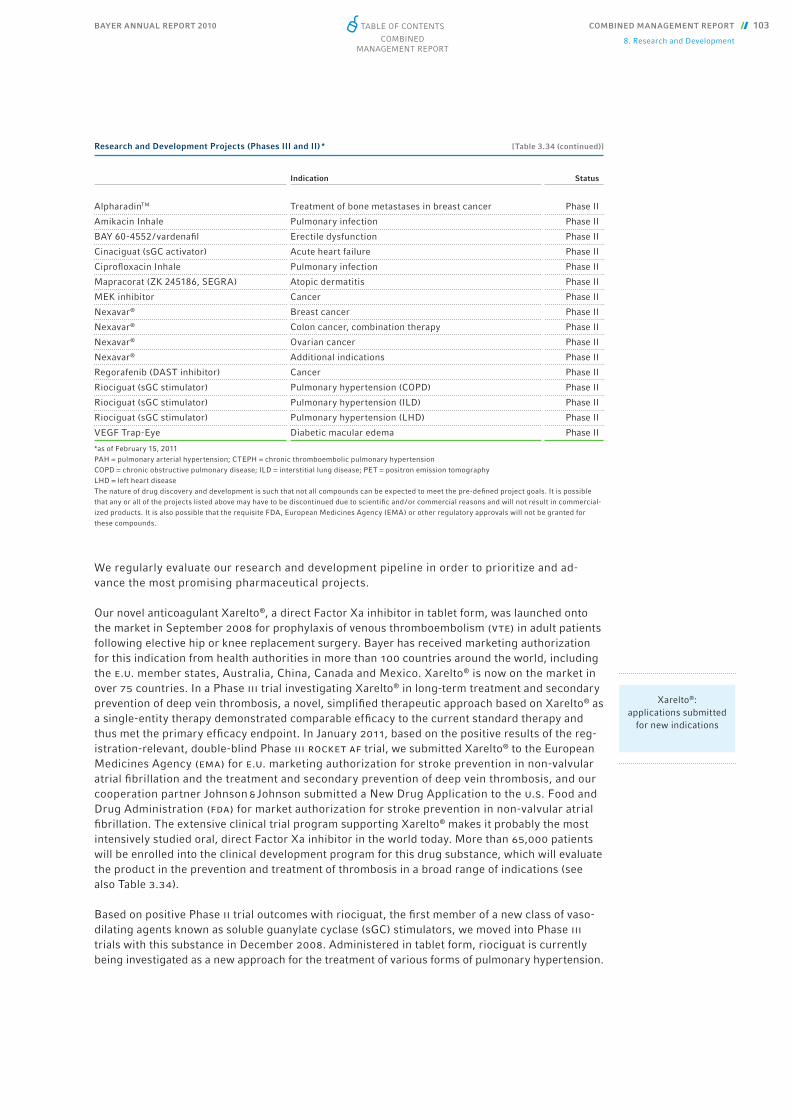
BAYER ANNUAL REPORT 2010 COMBINED MANAGEMENT REPORT 103
8. Research and Development
We regularly evaluate our research and development pipeline in order to prioritize and ad-vance the most promising pharmaceutical projects.
Our novel anticoagulant Xarelto®, a direct Factor Xa inhibitor in tablet form, was launched onto the market in September 2008 for prophylaxis of venous thromboembolism (vte) in adult patients following elective hip or knee replacement surgery. Bayer has received marketing authorization for this indication from health authorities in more than 100 countries around the world, including the e.u. member states, Australia, China, Canada and Mexico. Xarelto® is now on the market in over 75 countries. In a Phase iii trial investigating Xarelto® in long-term treatment and secondary prevention of deep vein thrombosis, a novel, simplifi ed therapeutic approach based on Xarelto® as a single-entity therapy demonstrated comparable effi cacy to the current standard therapy and thus met the primary effi cacy endpoint. In January 2011, based on the positive results of the reg-istration-relevant, double-blind Phase iii rocket af trial, we submitted Xarelto® to the European Medicines Agency (ema) for e.u. marketing authorization for stroke prevention in non-valvular atrial fi brillation and the treatment and secondary prevention of deep vein thrombosis, and our cooperation partner Johnson & Johnson submitted a New Drug Application to the u.s. Food and Drug Administration (fda) for market authorization for stroke prevention in non-valvular atrial fi brillation. The extensive clinical trial program supporting Xarelto® makes it probably the most intensively studied oral, direct Factor Xa inhibitor in the world today. More than 65,000 patients will be enrolled into the clinical development program for this drug substance, which will evaluate the product in the prevention and treatment of thrombosis in a broad range of indications (see also Table 3.34).
Based on positive Phase ii trial outcomes with riociguat, the fi rst member of a new class of vaso-dilating agents known as soluble guanylate cyclase (sGC) stimulators, we moved into Phase iii trials with this substance in December 2008. Administered in tablet form, riociguat is currently being investigated as a new approach for the treatment of various forms of pulmonary hypertension.
Xarelto®:applications submitted
for new indications
Research and Development Projects (Phases III and II) * [Table 3.34 (continued)]
Indication Status
AlpharadinTM Treatment of bone metastases in breast cancer Phase II
Amikacin Inhale Pulmonary infection Phase II
BAY 60-4552 / vardenafi l Erectile dysfunction Phase II
Cinaciguat (sGC activator) Acute heart failure Phase II
Ciprofl oxacin Inhale Pulmonary infection Phase II
Mapracorat (ZK 245186, SEGRA) Atopic dermatitis Phase II
MEK inhibitor Cancer Phase II
Nexavar® Breast cancer Phase II
Nexavar® Colon cancer, combination therapy Phase II
Nexavar® Ovarian cancer Phase II
Nexavar® Additional indications Phase II
Regorafenib (DAST inhibitor) Cancer Phase II
Riociguat (sGC stimulator) Pulmonary hypertension (COPD) Phase II
Riociguat (sGC stimulator) Pulmonary hypertension (ILD) Phase II
Riociguat (sGC stimulator) Pulmonary hypertension (LHD) Phase II
VEGF Trap-Eye Diabetic macular edema Phase II
*as of February 15, 2011PAH = pulmonary arterial hypertension; CTEPH = chronic thromboembolic pulmonary hypertensionCOPD = chronic obstructive pulmonary disease; ILD = interstitial lung disease; PET = positron emission tomographyLHD = left heart diseaseThe nature of drug discovery and development is such that not all compounds can be expected to meet the pre-defi ned project goals. It is possible that any or all of the projects listed above may have to be discontinued due to scientifi c and / or commercial reasons and will not result in commercial-ized products. It is also possible that the requisite FDA, European Medicines Agency (EMA) or other regulatory approvals will not be granted for these compounds.
Table of ConTenTs
Combined managemenT RepoRT
BAYER ANNUAL REPORT 2010104 COMBINED MANAGEMENT REPORT
8. Research and Development
Our development projects also include the innovative cancer drug Nexavar®, which we are joint-ly further developing with Onyx Pharmaceuticals, Inc., United States. The promising active sub-stance sorafenib, which attacks both cancer cells and the vascular system of the tumor, is al-ready being marketed worldwide to treat advanced renal cell carcinoma and hepato cellular carcinoma. Nexavar® is currently in various stages of clinical testing for the treatment of further tumor types. A Phase iii study involving Nexavar® in combination with two chemo therapeutics commonly used in Europe compared to chemotherapy alone did not reach its primary endpoint – extension of overall survival – in patients with advanced non-small-cell lung carcinoma. Nexa-var® continues to be investigated by Bayer and Onyx as well as independent scientists in the treat-ment of lung cancer in a variety of settings (see also Table 3.34).
With regorafenib we launched a Phase iii program in April 2010 for treatment of advanced colorectal cancer. Regorafenib is a novel, oral multi-kinase inhibitor that inhibits various signaling pathways responsible for tumor growth. We are enrolling patients with metastatic colorectal car-cinoma whose disease is progressing despite previous standard treatments.
In the fi eld of women’s healthcare we are conducting research in the fi eld of gynecological thera-pies to expand the range of contraceptive options. Phase iii clinical trials began in April 2009 with a contraceptive patch, intended to become the only transparent product of its kind and the small-est, lowest-dosed contraceptive patch on the market. Vaginorm®, a development product of our new collaboration with EndoCeutics, is being developed for the treatment of vaginal atrophy and female sexual dysfunction. Vaginorm® is currently being investigated in a Phase iii trial program in Canada and the United States. It contains dehydroepiandrosterone (dhea), a precursor of fe-male and male sex hormones. Also undergoing Phase iii development is the new hormone-releas-ing intrauterine device lcs, which is smaller than Mirena®, contains a lower hormone dose and is effective for up to three years.
The contraceptives yaz® Plus and Yasmin® Plus, which each contain folate in addition to the hormonal components, were registered in the United States under the trade names Beyaz® and SafyralTM, respectively. Our new oral contraceptive, marketed in Europe since May 2009 under the name Qlaira®, was registered in the United States as NataziaTM in the second quarter of 2010. The additional indication for treatment of heavy and /or prolonged menstrual bleeding was registered in Europe in October and has also been submitted for registration in the United States. Qlaira® / NataziaTM is the fi rst product in a new class of oral contraceptives whose estrogen component is based on estradiol.
Our research activities in the area of diagnostic imaging are focused on the development of posi-tron emission tomography (pet) tracers that could enable earlier and more accurate diagnosis of diseases in the future. Here, we are concentrating on three indications: central nervous system disorders, oncology and cardiovascular disease. With the development of the pet tracer fl orbeta-ben, we aim to contribute to earlier and more accurate diagnosis of Alzheimer’s disease. Bayer launched the global Phase iii program for fl orbetaben in November 2009.
We supplement our development product portfolio from our own r&d activities through targeted inlicensing.
In June 2010 we formed a strategic alliance with OncoMed Pharmaceuticals, Inc., United States, to research, develop and market novel therapeutics to control cancer stem cells, which are be-lieved to play a signifi cant role in the emergence, metastasis and recurrence of cancer.
The collaboration formed in March 2010 with the u.s. specialty pharmaceutical and diagnostics company Prometheus Laboratories Inc. is aimed at the development of a diagnostic platform in cancer therapy. The purpose of the platform is to match patients with suitable drug candidates, thereby opening up new options for personalized cancer therapy in the future.
In collaboration with Genzyme Corp., United States, we are developing the humanized monoclo-nal antibody alemtuzumab, which is currently being tested in two global Phase iii studies for the treatment of multiple sclerosis (ms).
Inlicensing complements our development
portfolio
Table of ConTenTs
Combined managemenT RepoRT

BAYER ANNUAL REPORT 2010 COMBINED MANAGEMENT REPORT 105
8. Research and Development
The vegf Trap-Eye joint developmental project with Regeneron Pharmaceuticals, Inc., United States, has achieved positive results in two parallel Phase iii studies in wet age-related macular degeneration (amd). Based on these data, we plan to fi le for marketing authorization in Europe and the United States together with Regeneron in the fi rst half of 2011. vegf Trap-Eye is also cur-rently undergoing Phase iii clinical development for the treatment of central retinal vein occlusion (crvo), another frequent cause of blindness. In addition, a Phase ii study in the treatment of dia-betic macular edema (dme) is being conducted. vegf (vascular endothelial growth factor) is a nat-ural growth factor that stimulates the formation of new blood vessels (angiogenesis). vegf Trap-Eye blocks this growth factor specifi cally and very effectively, thus preventing the abnormal formation of new blood vessels that tend to leak blood. The medication is administered directly into the eye. Once the product has been granted regulatory approval, Bayer will market it outside the United States. Regeneron Pharmaceuticals, Inc., United States, retains exclusive commercial-ization rights to vegf Trap-Eye in the u.s.
In September 2009 Bayer inlicensed AlpharadinTM, an alpha-emitting radiopharmaceutical, from Algeta asa, Norway, for joint development and marketing as a potential cancer therapy. The sub-stance is currently being evaluated in a global Phase iii trial for the treatment of bone metastases in prostate cancer patients who no longer respond to hormone therapy. In 2010 the development program for AlpharadinTM was expanded to include a Phase ii study in breast cancer patients with bone metastases.
We also invest in continuous life-cycle management to identify possible additional indications and improved delivery forms for products already on the market. For example, the u.s. Food and Drug Administration (fda) has approved staxyntm, a new formulation of our drug Levitra®. This is an orodispersible tablet that can therefore be taken without liquid. We have also received marketing authorization for the new formulation in Europe under the trade name Levitra®.
In the Consumer Health segment we increased our r&d expenditures to €315 million (2009: €275 million), or 5.2% (2009: 5.0%) of sales. In our Consumer Care Division, research and devel-opment activities at our product development centers in Morristown, New Jersey, United States, and Gaillard, France, concentrate on identifying, developing and commercializing non-prescrip-tion (over-the-counter = otc) products. These efforts center on supporting both existing and new brands by implementing product-specifi c, clinical and regulatory development strategies that en-able the successful exploitation of new technologies, the expansion of indications for existing products or the reclassifi cation of current prescription medicines as otc products. We introduced a variety of new product line extensions to several markets in 2010, such as the combination prod-uct Bayer® am (active ingredients: acetylsalicylic acid and caffeine), new nutritionals (especially for menopausal women and performance-oriented men) sold under the One A Day® brand in the United States, and the antacid Mopralpro® in France. In the area of prescription dermatology products, we entered into a licensing and development agreement with u.s.-based kythera Bio-pharmaceuticals, Inc., concerning the joint development of a substance for use in aesthetic der-matology.
The research and development activities of our Medical Care Division focus on blood glucose monitoring and the continuing development of medical equipment used in the diagnosis or treat-ment of various diseases. At the four u.s. research and development centers for our diabetes care business, the largest of which is in Tarrytown, New York, we are working to strengthen our prod-uct lines and continue our expansion into attractive segments of the diabetes market. In 2010 we progressed with the launch of several innovative products in key markets to meet specifi c needs of individuals with diabetes, including Contour® usb with integrated diabetes management soft-ware and the option of direct computer connection (plug & play), the diabetes management soft-ware Glucofacts® Deluxe, and A1CNowtm SelfCheck, which is used to determine long-term blood glucose values (A1c). The research and development activities for our medical equipment busi-ness focus on continuous enhancement of our contrast injection, thrombus removal and other vascular intervention systems. We also aim to enter additional attractive segments such as medi-cal data management tools for contrast injection systems, and drug-eluting balloon catheters to treat vascular disease. The respective research and development centers are located near Pitts-burgh, Pennsylvania, and Minneapolis, Minnesota, in the United States and in Sydney, Australia.
Life-cycle management for products already on
the market
Table of ConTenTs
Combined managemenT RepoRT
BAYER ANNUAL REPORT 2010106 COMBINED MANAGEMENT REPORT
8. Research and Development
The Animal Health Division focuses its research and development activities in Monheim, Germa-ny, on anti-infectives and parasiticides along with active substances for the treatment of non-in-fectious disorders in animals. Besides the development of new products to control parasites in companion animals and livestock, we continue to expand the product portfolio to treat chronic kidney diseases, cardiovascular disease and cancer in dogs and cats. A number of product line ex-tensions also received approval in various markets. In the United States, for example, Advantage® was registered additionally for the prevention and treatment of fl ea and tick infestation in dogs.
CROPSCIENCEIn 2010, €722 million (2009: €653 million) in research and development expenditures, or 23.6% of the Bayer Group total, were made in the CropScience subgroup. This was equivalent to 10.6% of subgroup sales.
CropScience maintains a global network of research and development facilities employing some 4,300 people. Our largest r&d sites for crop protection products are located in Monheim and Frankfurt am Main, Germany, and in Lyon, France. The major research centers of the BioScience unit, which focuses on seed technology and breeding, are located in Ghent, Belgium; Haelen, Netherlands; and Morrisville, North Carolina, United States.
While research is carried out centrally at a small number of sites, our development and seed breeding activities take place both at these sites and at fi eld testing stations across the globe so that future active substances and crop varieties can be tested according to specifi c regional re-quirements.
As part of our integrated research approach, scientists in the fi elds of agricultural chemistry and seed technology are increasingly collaborating to pool the knowledge acquired through chemical, biological and genetic research and fi eld development, aligning this expertise to our long-term re-search objectives and business strategies for the various crops.
In the Crop Protection segment we spent €476 million (2009: €482 million) for research and development in 2010. In this segment we identify and develop innovative, safe and sustainable products for use in agriculture as insecticides, fungicides, herbicides or seed treatments, and car-ry out research projects across all indications in new areas of future importance, such as plant health or stress tolerance. In addition to conventional chemistry, biology and biochemistry, mod-ern technologies such as genomics, high-throughput screening and bioinformatics play an impor-tant role in identifying new chemical lead structures. Collaborations with external partners com-plement our own activities.
We broaden the range of uses for our products by developing new mixtures or innovative formula-tions of products already on the market so that they can be applied in additional crops or be made easier to handle.
The active ingredient pipeline of Crop Protection currently contains 13 development projects, of which nine are at an advanced stage and four at an early stage of development. A further 38 proj-ects are in earlier research stages.
€722 millionfor research and
development at CropScience
Table of ConTenTs
Combined managemenT RepoRT
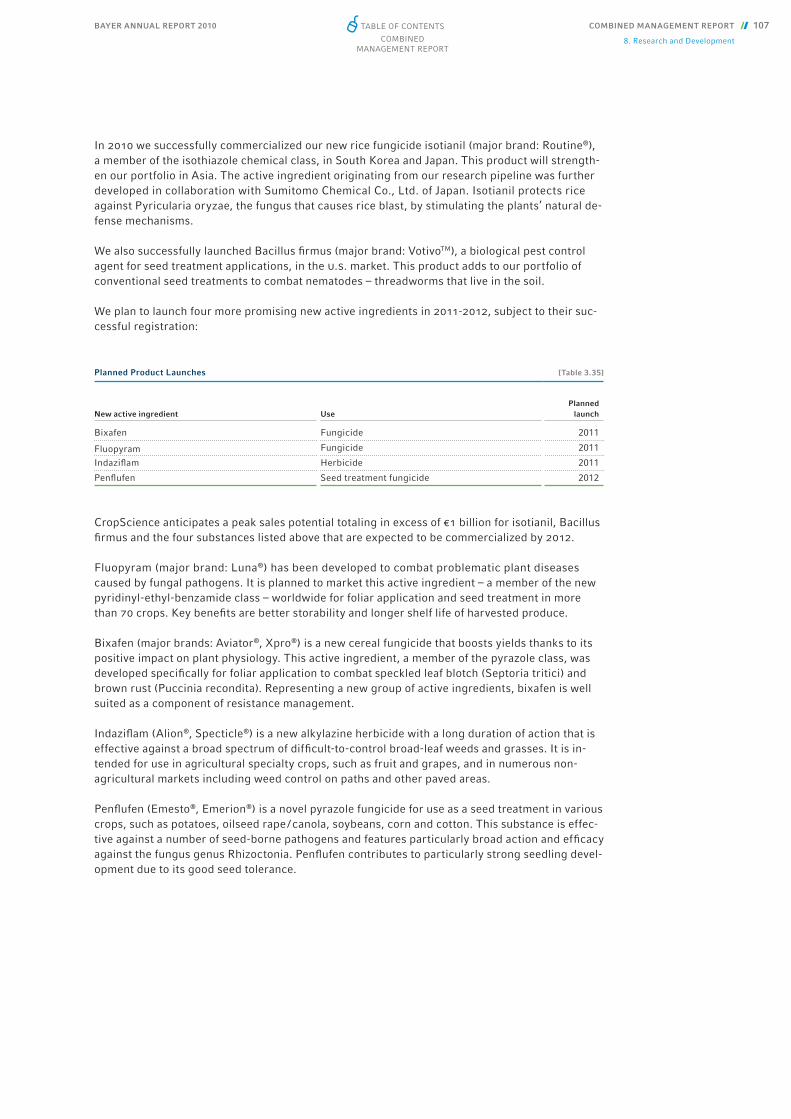
BAYER ANNUAL REPORT 2010 COMBINED MANAGEMENT REPORT 107
8. Research and Development
In 2010 we successfully commercialized our new rice fungicide isotianil (major brand: Routine®), a member of the isothiazole chemical class, in South Korea and Japan. This product will strength-en our portfolio in Asia. The active ingredient originating from our research pipeline was further developed in collaboration with Sumitomo Chemical Co., Ltd. of Japan. Isotianil protects rice against Pyricularia oryzae, the fungus that causes rice blast, by stimulating the plants’ natural de-fense mechanisms.
We also successfully launched Bacillus fi rmus (major brand: VotivoTM), a biological pest control agent for seed treatment applications, in the u.s. market. This product adds to our portfolio of conventional seed treatments to combat nematodes – threadworms that live in the soil.
We plan to launch four more promising new active ingredients in 2011-2012, subject to their suc-cessful registration:
CropScience anticipates a peak sales potential totaling in excess of €1 billion for isotianil, Bacillus fi rmus and the four substances listed above that are expected to be commercialized by 2012.
Fluopyram (major brand: Luna®) has been developed to combat problematic plant diseases caused by fungal pathogens. It is planned to market this active ingredient – a member of the new pyridinyl-ethyl-benzamide class – worldwide for foliar application and seed treatment in more than 70 crops. Key benefi ts are better storability and longer shelf life of harvested produce.
Bixafen (major brands: Aviator®, Xpro®) is a new cereal fungicide that boosts yields thanks to its positive impact on plant physiology. This active ingredient, a member of the pyrazole class, was developed specifi cally for foliar application to combat speckled leaf blotch (Septoria tritici) and brown rust (Puccinia recondita). Representing a new group of active ingredients, bixafen is well suited as a component of resistance management.
Indazifl am (Alion®, Specticle®) is a new alkylazine herbicide with a long duration of action that is effective against a broad spectrum of diffi cult-to-control broad-leaf weeds and grasses. It is in-tended for use in agricultural specialty crops, such as fruit and grapes, and in numerous non-agricultural markets including weed control on paths and other paved areas.
Penfl ufen (Emesto®, Emerion®) is a novel pyrazole fungicide for use as a seed treatment in various crops, such as potatoes, oilseed rape / canola, soybeans, corn and cotton. This substance is effec-tive against a number of seed-borne pathogens and features particularly broad action and effi cacy against the fungus genus Rhizoctonia. Penfl ufen contributes to particularly strong seedling devel-opment due to its good seed tolerance.
Planned Product Launches [Table 3.35]
New active ingredient UsePlanned
launch
Bixafen Fungicide 2011
Fluopyram Fungicide 2011
Indazifl am Herbicide 2011
Penfl ufen Seed treatment fungicide 2012
Table of ConTenTs
Combined managemenT RepoRT
BAYER ANNUAL REPORT 2010108 COMBINED MANAGEMENT REPORT
8. Research and Development
In the Environmental Science, BioScience segment, we considerably raised our spending for research and development to €246 million (2009: €171 million). This increased expenditure was directed mainly toward expanding our research and development capabilities in BioScience.
The Environmental Science unit tests the compounds developed by Crop Protection and evaluates them for possible non-agricultural uses. In addition, we carry out tests with active ingredients from other companies and may purchase such ingredients if results are positive. Current develop-ment projects include gels and baits to combat insect pests, new herbicide and fungicide mix-tures, biological solutions and products for insect vector control.
In 2010 the NatriaTM product line was successfully launched in the United States and Germany. This new line of products based on natural or nature-derived ingredients complements the Bayer Advanced range in the United States and our ‘Bayer Garten’ portfolio in Germany. We plan to ex-pand the product line and introduce it in France and other European markets during 2011. Follow-ing the submission of our Lifenet® mosquito net to the Pesticide Evaluation Scheme of the World Health Organization (whopes) in 2010, we plan to start with the launch of this product in selected countries in 2011. A new insecticide formulation with residual action to control mosquitoes was also submitted to the who in 2010. As part of a further research collaboration between Crop-Science and the Innovative Vector Control Consortium (ivcc) in Liverpool, United Kingdom, a new insecticides research platform was successfully established and yielded fi rst results.
Research in our BioScience unit is dedicated to optimizing plant traits. We are developing new seed varieties of our established core crops – cotton, canola, rice and vegetables. We have ex-panded our research activities to include cereals and soybeans as additional core crops, and are conducting research to develop sugarcane varieties with an increased sugar content. Our re-search and development work focuses on improving the agronomic traits of these crops. For ex-ample, our scientists are working to develop crop plants with high tolerance against stress factors such as extreme temperatures and drought. We also aim to increase the plants’ yield potential and quality of harvested materials. Examples here include improving the profi le of canola oil or enhancing the properties of cotton fi bers. Further areas of focus include developing new herbi-cide tolerance technologies based on alternative mechanisms of action, and improving the resis-tance of plants to damage from insects and disease. To do this we employ all modern breeding methods, including plant biotechnology techniques. Our BioScience research and development pipeline presently contains more than 60 promising lead projects and is complemented by around 80 current research agreements with public- and private-sector partners.
Business growth in BioScience is supported by new product introductions. An example is our LibertyLink® herbicide tolerance technology, marketed in the United States for soybean seeds in partnership with leading seed producers. In 2011 we plan to introduce several innovative seed varieties, including cotton with our proprietary glyphosate herbicide tolerance trait.
MATERIALSCIENCEIn 2010, MaterialScience spent €231 million (2009: €207 million) on research and development (not including joint development activities with customers). MaterialScience thus accounted for 7.6% of the Bayer Group’s total research and development expenses. The subgroup’s expenses in this fi eld amounted to 2.3% of sales. 1,000 employees were entrusted with research and develop-ment tasks.
Our focus in the fi eld of Polyurethanes is on broadening the application areas for our products and improving their properties. A key area of application is in the construction industry, where rigid polyurethane foam serves as a highly effi cient insulating material, making an active contri-bution to reducing energy consumption and protecting the climate. With many countries tighten-ing their laws to reduce energy consumption in buildings, we anticipate growing demand for the relevant polyurethane foams in all climate zones, especially as they can provide signifi cantly bet-ter thermal insulation than conventional insulating materials.
€231 millionfor research and
development at MaterialScience
Table of ConTenTs
Combined managemenT RepoRT

BAYER ANNUAL REPORT 2010 COMBINED MANAGEMENT REPORT 109
8. Research and Development
Polyurethane frames for photovoltaic units are another example of a groundbreaking application. Furthermore, in close cooperation with Puren GmbH of Überlingen, Germany, we have developed a system combining energy generation from solar radiation with highly effi cient thermal insula-tion – thus satisfying two of today’s key requirements for home construction.
The use of renewable raw materials also plays an important part in research and development activities. For example, a concept has been developed for a “green shoe,” up to 90% of which consists of components manufactured by particularly environmentally friendly processes or using renewable raw materials. For example, the shoe sole is made of polyurethane produced mainly from soybean oil, and the toecap of a polycarbonate blend based partly on vegetable starch.
The focus of innovation in process development is on the production of new and improved raw materials and formulations. Specifi cally, MaterialScience is working with internal and external partners on ways to put climate-damaging carbon dioxide to good use in the manufacture of poly-ether polycarbonate polyol (ppp) feedstock for polyurethanes. Such intelligent use of co2 reduces our consumption of fossil raw materials and thus helps to protect the environment. This is made possible by a breakthrough in catalysis research based on the results of intensive cooperation be-tween rwth Aachen University and the cat Catalytic Center in Aachen, Germany, operated jointly by MaterialScience and Bayer Technology Services.
Research and innovation in the area of polycarbonates focuses on the development of new poly-carbonate products such as those for weight-saving applications, which set new effi ciency and safety standards and allow greater design freedom.
We use the term “focused innovation” for activities in which we focus our resources on satisfying unmet customer needs in clearly defi ned growth areas. We refer to our activities in developing new solutions jointly with external partners as “open innovation.” One example is the collabora-tive project to develop new, led-based automotive lighting technologies that could signifi cantly improve the energy effi ciency of headlamp systems. Here we are working closely with a major automotive parts supplier, a producer of injection molding tools and the Fraunhofer Society, Europe’s largest applied research organization. The “global innovation” concept denotes the inten sive support provided by our polycarbonate product and applications development center in Leverkusen, Germany, for our development activities around the world.
Our strategy focuses on selected development areas such as polycarbonate glazing and other lightweight solutions for the transportation sector, led illumination management (for use in street lighting, for example), safety applications (such as safety glazing), and improvements in the cost effi ciency of manufacturing processes. We also place importance on the continued development of highly eco-friendly materials, such as polycarbonate blends containing recycled plastics or bio-based substances. In this way we aim to help our customers achieve their sustainability goals.
The research and development departments of the Coatings, Adhesives, Specialties business unit drive forward the development of polyurethane raw materials for high-performance coatings, ad-hesives and sealants. A further objective of this business unit is to open up new technology-driven markets for our businesses with cosmetic and medical applications, functional fi lms and nano-technology. To this end we also maintain strategic alliances with partners from industry and aca-demia.
The research and development activities serving our core businesses in conventional coating, adhesive and sealant raw materials are focused on the continued development of eco-friendly sys-tems that are based on water rather than solvents or that can be effi ciently radiation-cured. One example of a new market segment we have opened up for our products is our high-performance coating raw materials for wind turbines that can signifi cantly improve the weather resistance of rotor blades.
Growth areas the focus of innovation
Table of ConTenTs
Combined managemenT RepoRT

BAYER ANNUAL REPORT 2010110 COMBINED MANAGEMENT REPORT
8. Research and Development
Customized applications are also to be found in medical technology. In 2010 we combined our coating and adhesive materials portfolio for this sector under the brand name Baymedix®. Our offer includes highly functional coatings, special adhesive raw materials for wound care and closures, and thermoplastic polymers for surgical and diagnostic apparatus. In the fi eld of cos-metics – where we develop precursors for facial and body care, hair styling and sun protection products – the new Baycusan® C product line satisfi es important requirements for “green” raw materials, such as the absence of preservatives.
We have streamlined our research portfolio for functional fi lms. Future activities will center partly around fi lms based on polycarbonates or thermoplastic polyurethanes. Combining these with ad-ditional technologies or specifi c property profi les leads to new products such as multifunctional or holographic fi lms, which open up new fi elds of application in a variety of industries. A modern coating line has been started up in Leverkusen for this purpose. Another area of focus is on elec-troactive polymers, where we have further strengthened our activities through the acquisition of the u.s. company Artifi cial Muscle, Inc. In 2010 we opened a new research center for functional fi lms in Singapore, particularly to meet growing demand from the electronics market in Asia / Pa-cifi c for innovative fi lm-based products.
BAYER TECHNOLOGY SERVICESAll Bayer subgroups work closely with our service company Bayer Technology Services world-wide on technology solutions, particularly in the fi elds of process technology, plant engineering, automation and product development. For example, this service company cooperates with Material Science in the development of new production processes that make effi cient use of ener-gy and raw materials, thereby helping the subgroup to safeguard its technological and cost lead-ership. Examples include the new tdi production process being used for the fi rst time at the MaterialScience site in Shanghai and the catalytic conversion of carbon dioxide to polymers. Cen-tralized development work on technologies relevant to more than one subgroup, such as nano-technology and biotechnology, along with expertise in mathematical simulation and statistical data analysis, helps HealthCare and CropScience to shorten development times for new products. This also includes the future development of entirely new production concepts, for example at the invite research center, a collaborative venture between Bayer Technology Services and Dort-mund Technical University, which is currently under construction. Another key strategic factor here is international knowledge sourcing in areas ranging from country-specifi c expertise in the handling of capital expenditure projects to the global exploitation of innovations.
BAYER INNOVATIONBayer Innovation investigates and evaluates innovative areas adjacent to the subgroups’ current core activities and develops them into viable new businesses for the Group. An example is the manufacture of plant-made pharmaceuticals. In 2010 a Phase i clinical study was launched with a personalized cancer vaccine to treat non-Hodgkin’s lymphoma. In the agriculture sector, novel hybrid concepts based on the combination of polymer technologies and crop protection prod-ucts are under development. The full potential of these technologies is being evaluated in close cooperation with the subgroups and external partners.
TRIPLE-I: INSPIRATION, IDEAS, INNOVATIONThe innovation campaign entitled “Triple i: Inspiration, Ideas, Innovation” motivates Bayer em-ployees worldwide to submit ideas for new products and thereby add to the company’s innovative capability. More than 11,000 ideas have been submitted since the initiative was launched. Several products resulting from employees’ ideas have already been successfully commercialized. In 2010, Triple-i focused on two main areas: the “Your Heart” campaign, designed to identify new opportunities in cardiovascular medicine, and the Triple-i-Vietnam campaign, aimed at the devel-opment of new applications for MaterialScience products in Vietnam.
Technology Services supports all
Bayer subgroups with technology
platforms
Bayer Innovation develops
new businesses adjacent to
core activities
Table of ConTenTs
Combined managemenT RepoRT
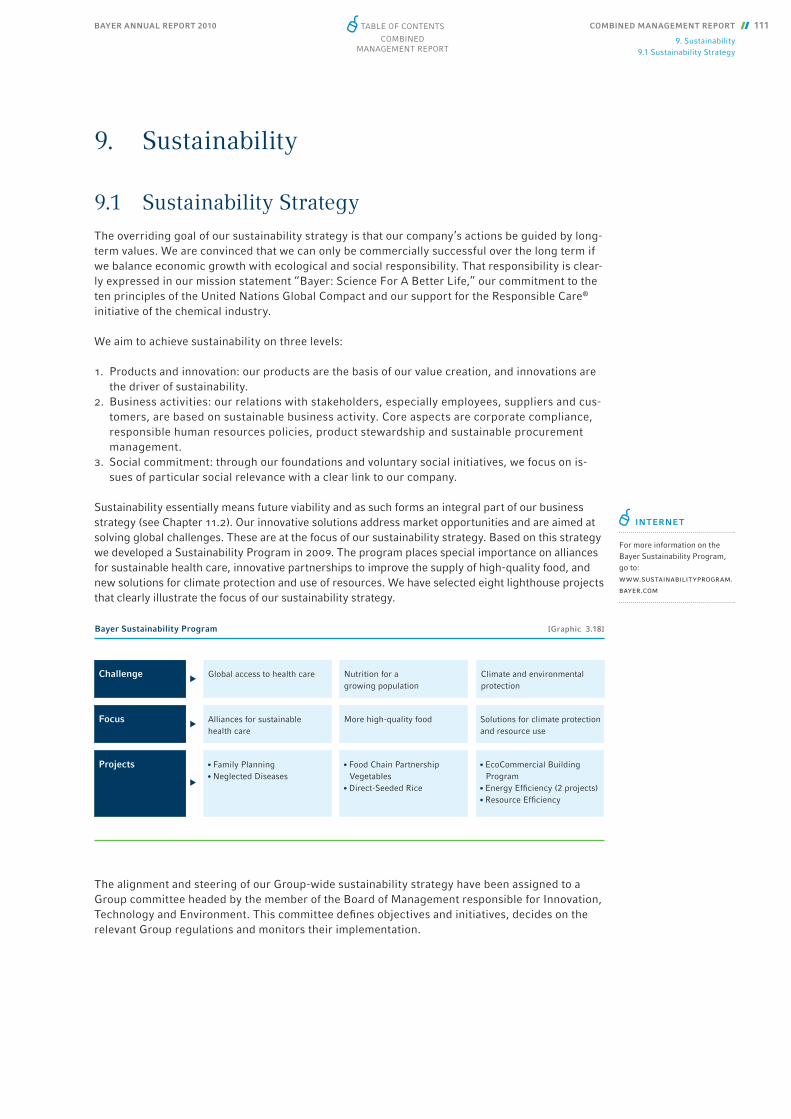
BAYER ANNUAL REPORT 2010 COMBINED MANAGEMENT REPORT 111
9. Sustainability9.1 Sustainability Strategy
9. Sustainability
9.1 Sustainability StrategyThe overriding goal of our sustainability strategy is that our company’s actions be guided by long-term values. We are convinced that we can only be commercially successful over the long term if we balance economic growth with ecological and social responsibility. That responsibility is clear-ly expressed in our mission statement “Bayer: Science For A Better Life,” our commitment to the ten principles of the United Nations Global Compact and our support for the Responsible Care® initiative of the chemical industry.
We aim to achieve sustainability on three levels:
1. Products and innovation: our products are the basis of our value creation, and innovations are the driver of sustainability.
2. Business activities: our relations with stakeholders, especially employees, suppliers and cus-tomers, are based on sustainable business activity. Core aspects are corporate compliance, responsible human resources policies, product stewardship and sustainable procurement management.
3. Social commitment: through our foundations and voluntary social initiatives, we focus on is-sues of particular social relevance with a clear link to our company.
Sustainability essentially means future viability and as such forms an integral part of our business strategy (see Chapter 11.2). Our innovative solutions address market opportunities and are aimed at solving global challenges. These are at the focus of our sustainability strategy. Based on this strategy we developed a Sustainability Program in 2009. The program places special importance on alliances for sustainable health care, innovative partnerships to improve the supply of high-quality food, and new solutions for climate protection and use of resources. We have selected eight lighthouse projects that clearly illustrate the focus of our sustainability strategy.
The alignment and steering of our Group-wide sustainability strategy have been assigned to a Group committee headed by the member of the Board of Management responsible for Innovation, Technology and Environment. This committee defi nes objectives and initiatives, decides on the relevant Group regulations and monitors their implementation.
Global access to health care
Alliances for sustainablehealth care
Nutrition for a growing population
Climate and environmentalprotection
More high-quality food Solutions for climate protection and resource use
Bayer Sustainability Program [Graphic 3.18]
Challenge
Focus
Family Planning Neglected Diseases
Food Chain Partnership Vegetables Direct-Seeded Rice
EcoCommercial Building Program Energy Effi ciency (2 projects) Resource Effi ciency
Projects
INTERNET
For more information on the Bayer Sustainability Program, go to: www.sustainabilityprogram.bayer.com
Table of ConTenTs
Combined managemenT RepoRT
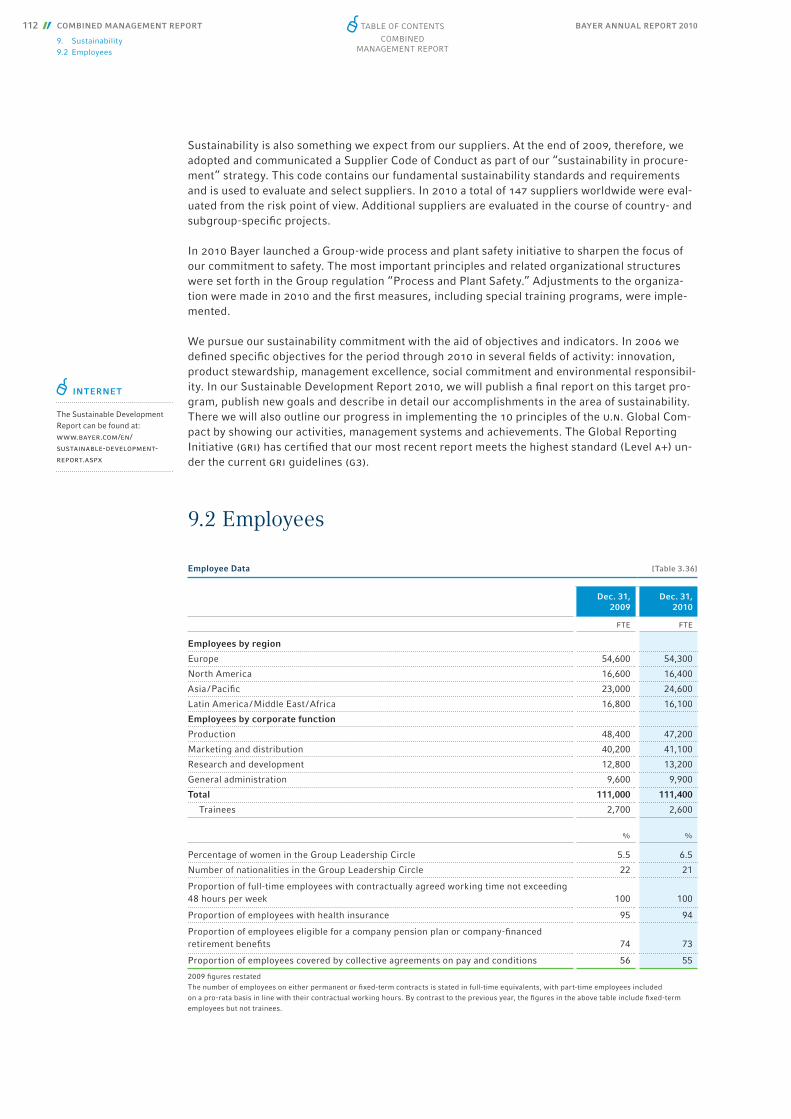
BAYER ANNUAL REPORT 2010112 COMBINED MANAGEMENT REPORT
9. Sustainability9.2 Employees
Sustainability is also something we expect from our suppliers. At the end of 2009, therefore, we adopted and communicated a Supplier Code of Conduct as part of our “sustainability in procure-ment” strategy. This code contains our fundamental sustainability standards and requirements and is used to evaluate and select suppliers. In 2010 a total of 147 suppliers worldwide were eval-uated from the risk point of view. Additional suppliers are evaluated in the course of country- and subgroup-specifi c projects.
In 2010 Bayer launched a Group-wide process and plant safety initiative to sharpen the focus of our commitment to safety. The most important principles and related organizational structures were set forth in the Group regulation “Process and Plant Safety.” Adjustments to the organiza-tion were made in 2010 and the fi rst measures, including special training programs, were imple-mented.
We pursue our sustainability commitment with the aid of objectives and indicators. In 2006 we defi ned specifi c objectives for the period through 2010 in several fi elds of activity: innovation, product stewardship, management excellence, social commitment and environmental responsibil-ity. In our Sustainable Development Report 2010, we will publish a fi nal report on this target pro-gram, publish new goals and describe in detail our accomplishments in the area of sustainability. There we will also outline our progress in implementing the 10 principles of the u.n. Global Com-pact by showing our activities, management systems and achievements. The Global Reporting Initiative (gri) has certifi ed that our most recent report meets the highest standard (Level a+) un-der the current gri guidelines (g3).
9.2 Employees
INTERNET
The Sustainable Development Report can be found at: www.bayer.com/en/sustainable-development-report.aspx
Employee Data [Table 3.36]
Dec. 31, 2009
Dec. 31, 2010
FTE FTE
Employees by region
Europe 54,600 54,300
North America 16,600 16,400
Asia / Pacifi c 23,000 24,600
Latin America / Middle East / Africa 16,800 16,100
Employees by corporate function
Production 48,400 47,200
Marketing and distribution 40,200 41,100
Research and development 12,800 13,200
General administration 9,600 9,900
Total 111,000 111,400
Trainees 2,700 2,600
% %
Percentage of women in the Group Leadership Circle 5.5 6.5
Number of nationalities in the Group Leadership Circle 22 21
Proportion of full-time employees with contractually agreed working time not exceeding 48 hours per week 100 100
Proportion of employees with health insurance 95 94
Proportion of employees eligible for a company pension plan or company-fi nanced retirement benefi ts 74 73
Proportion of employees covered by collective agreements on pay and conditions 56 55
2009 fi gures restatedThe number of employees on either permanent or fi xed-term contracts is stated in full-time equivalents, with part-time employees included on a pro-rata basis in line with their contractual working hours. By contrast to the previous year, the fi gures in the above table include fi xed-term employees but not trainees.
Table of ConTenTs
Combined managemenT RepoRT
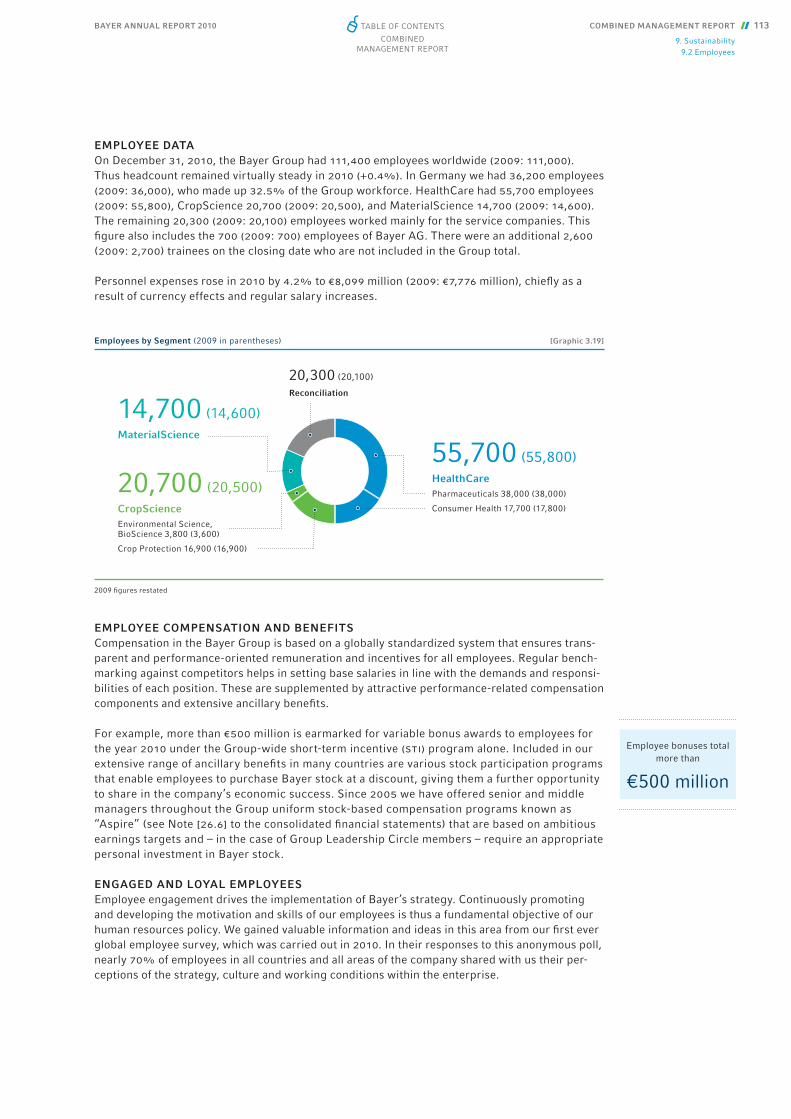
BAYER ANNUAL REPORT 2010 COMBINED MANAGEMENT REPORT 113
9. Sustainability9.2 Employees
EMPLOYEE DATAOn December 31, 2010, the Bayer Group had 111,400 employees worldwide (2009: 111,000). Thus headcount remained virtually steady in 2010 (+0.4%). In Germany we had 36,200 employees (2009: 36,000), who made up 32.5% of the Group workforce. HealthCare had 55,700 employees (2009: 55,800), CropScience 20,700 (2009: 20,500), and MaterialScience 14,700 (2009: 14,600). The remaining 20,300 (2009: 20,100) employees worked mainly for the service companies. This fi gure also includes the 700 (2009: 700) employees of Bayer AG. There were an additional 2,600 (2009: 2,700) trainees on the closing date who are not included in the Group total.
Personnel expenses rose in 2010 by 4.2% to €8,099 million (2009: €7,776 million), chiefl y as a result of currency effects and regular salary increases.
EMPLOYEE COMPENSATION AND BENEFITSCompensation in the Bayer Group is based on a globally standardized system that ensures trans-parent and performance-oriented remuneration and incentives for all employees. Regular bench-marking against competitors helps in setting base salaries in line with the demands and responsi-bilities of each position. These are supplemented by attractive performance-related compensation components and extensive ancillary benefi ts.
For example, more than €500 million is earmarked for variable bonus awards to employees for the year 2010 under the Group-wide short-term incentive (sti) program alone. Included in our extensive range of ancillary benefi ts in many countries are various stock participation programs that enable employees to purchase Bayer stock at a discount, giving them a further opportunity to share in the company’s economic success. Since 2005 we have offered senior and middle managers throughout the Group uniform stock-based compensation programs known as “Aspire” (see Note [26.6] to the consolidated fi nancial statements) that are based on ambitious earnings targets and – in the case of Group Leadership Circle members – require an appropriate personal investment in Bayer stock.
ENGAGED AND LOYAL EMPLOYEESEmployee engagement drives the implementation of Bayer’s strategy. Continuously promoting and developing the motivation and skills of our employees is thus a fundamental objective of our human resources policy. We gained valuable information and ideas in this area from our fi rst ever global employee survey, which was carried out in 2010. In their responses to this anonymous poll, nearly 70% of employees in all countries and all areas of the company shared with us their per-ceptions of the strategy, culture and working conditions within the enterprise.
Employee bonuses total more than
€500 million
Employees by Segment (2009 in parentheses) [Graphic 3.19]
55,700 (55,800)HealthCarePharmaceuticals 38,000 (38,000)
Consumer Health 17,700 (17,800)
20,700 (20,500)CropScienceEnvironmental Science, BioScience 3,800 (3,600)
Crop Protection 16,900 (16,900)
20,300 (20,100)
Reconciliation
14,700 (14,600)MaterialScience
2009 fi gures restated
Table of ConTenTs
Combined managemenT RepoRT
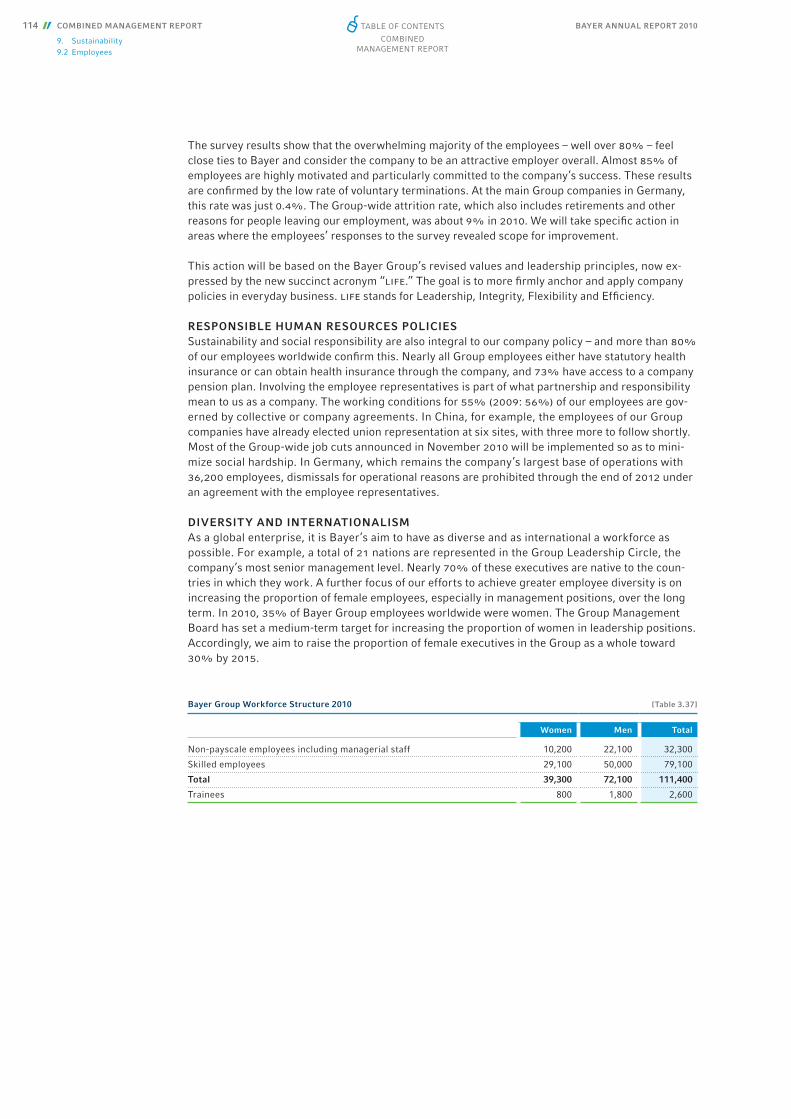
BAYER ANNUAL REPORT 2010114 COMBINED MANAGEMENT REPORT
9. Sustainability9.2 Employees
The survey results show that the overwhelming majority of the employees – well over 80% – feel close ties to Bayer and consider the company to be an attractive employer overall. Almost 85% of employees are highly motivated and particularly committed to the company’s success. These results are confi rmed by the low rate of voluntary terminations. At the main Group companies in Germany, this rate was just 0.4%. The Group-wide attrition rate, which also includes retirements and other reasons for people leaving our employment, was about 9% in 2010. We will take specifi c action in areas where the employees’ responses to the survey revealed scope for improvement.
This action will be based on the Bayer Group’s revised values and leadership principles, now ex-pressed by the new succinct acronym “life.” The goal is to more fi rmly anchor and apply company policies in everyday business. life stands for Leadership, Integrity, Flexibility and Effi ciency.
RESPONSIBLE HUMAN RESOURCES POLICIESSustainability and social responsibility are also integral to our company policy – and more than 80% of our employees worldwide confi rm this. Nearly all Group employees either have statutory health insurance or can obtain health insurance through the company, and 73% have access to a company pension plan. Involving the employee representatives is part of what partnership and responsibility mean to us as a company. The working conditions for 55% (2009: 56%) of our employees are gov-erned by collective or company agreements. In China, for example, the employees of our Group companies have already elected union representation at six sites, with three more to follow shortly. Most of the Group-wide job cuts announced in November 2010 will be implemented so as to mini-mize social hardship. In Germany, which remains the company’s largest base of operations with 36,200 employees, dismissals for operational reasons are prohibited through the end of 2012 under an agreement with the employee representatives.
DIVERSITY AND INTERNATIONALISMAs a global enterprise, it is Bayer’s aim to have as diverse and as international a workforce as possible. For example, a total of 21 nations are represented in the Group Leadership Circle, the company’s most senior management level. Nearly 70% of these executives are native to the coun-tries in which they work. A further focus of our efforts to achieve greater employee diversity is on increasing the proportion of female employees, especially in management positions, over the long term. In 2010, 35% of Bayer Group employees worldwide were women. The Group Management Board has set a medium-term target for increasing the proportion of women in leadership positions. Accordingly, we aim to raise the proportion of female executives in the Group as a whole toward 30% by 2015.
Bayer Group Workforce Structure 2010 [Table 3.37]
Women Men Total
Non-payscale employees including managerial staff 10,200 22,100 32,300
Skilled employees 29,100 50,000 79,100
Total 39,300 72,100 111,400
Trainees 800 1,800 2,600
Table of ConTenTs
Combined managemenT RepoRT
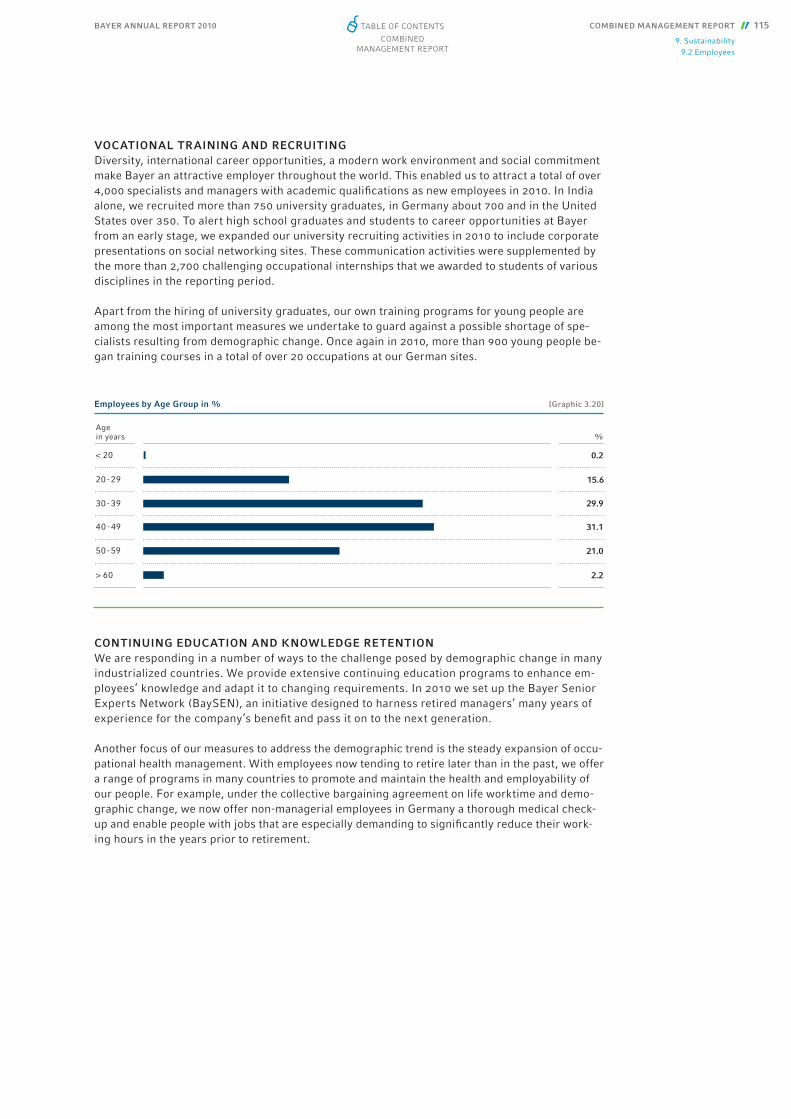
BAYER ANNUAL REPORT 2010 COMBINED MANAGEMENT REPORT 115
9. Sustainability9.2 Employees
VOCATIONAL TRAINING AND RECRUITINGDiversity, international career opportunities, a modern work environment and social commitment make Bayer an attractive employer throughout the world. This enabled us to attract a total of over 4,000 specialists and managers with academic qualifi cations as new employees in 2010. In India alone, we recruited more than 750 university graduates, in Germany about 700 and in the United States over 350. To alert high school graduates and students to career opportunities at Bayer from an early stage, we expanded our university recruiting activities in 2010 to include corporate presentations on social networking sites. These communication activities were supplemented by the more than 2,700 challenging occupational internships that we awarded to students of various disciplines in the reporting period.
Apart from the hiring of university graduates, our own training programs for young people are among the most important measures we undertake to guard against a possible shortage of spe-cialists resulting from demographic change. Once again in 2010, more than 900 young people be-gan training courses in a total of over 20 occupations at our German sites.
CONTINUING EDUCATION AND KNOWLEDGE RETENTIONWe are responding in a number of ways to the challenge posed by demographic change in many industrialized countries. We provide extensive continuing education programs to enhance em-ployees’ knowledge and adapt it to changing requirements. In 2010 we set up the Bayer Senior Experts Network (BaySEN), an initiative designed to harness retired managers’ many years of experience for the company’s benefi t and pass it on to the next generation.
Another focus of our measures to address the demographic trend is the steady expansion of occu-pational health management. With employees now tending to retire later than in the past, we offer a range of programs in many countries to promote and maintain the health and employability of our people. For example, under the collective bargaining agreement on life worktime and demo-graphic change, we now offer non-managerial employees in Germany a thorough medical check-up and enable people with jobs that are especially demanding to signifi cantly reduce their work-ing hours in the years prior to retirement.
2.2> 60
%Agein years
Employees by Age Group in % [Graphic 3.20]
0.2< 20
50 - 59 21.0
15.620 - 29
40 - 49 31.1
30 - 39 29.9
Table of ConTenTs
Combined managemenT RepoRT

BAYER ANNUAL REPORT 2010116 COMBINED MANAGMENT REPORT
9. Sustainability9.3 Environment, Climate Protection and Safety
9.3 Environment, Climate Protection and Safety Bayer traditionally places great importance on protecting the environment and using natural resources responsibly. We use our expertise and experience both to optimize technologies and processes and to develop innovative products that help protect the environment, nature and the climate. We develop new solutions to optimize the use of resources, reduce emissions and avoid waste. Bayer has designed a method – the resource effi ciency check – to analyze the total use of resources such as energy, water and raw materials and determine ways to minimize consumption. This check is currently being piloted in the MaterialScience and CropScience subgroups.
We regularly review our performance in the areas of health, safety and environment on the basis of key performance indicators – nearly all of which we improved in 2010, despite an approximate-ly 20% increase in manufactured sales volume. Water and energy use increased as a result, along with total organic carbon (toc) emissions. The industrial injury rate again declined and was well below our target of <2.0.
In 2010 there was also a decline in the number of environmental and transportation incidents. According to our internal voluntary commitment, we report even minor product releases. For sub-stances with a high hazard potential, we report quantities greater than 100 kg. Unfortunately, even our extensive safety precautions and training procedures cannot entirely prevent environ-mental incidents or traffi c accidents from occurring. Any such events are carefully analyzed and evaluated so that adequate steps can be taken to prevent a recurrence.
Bayer’s aim is to achieve an appropriate and uniform standard of hseq (health, safety, environ-mental protection and quality) throughout the Bayer Group and steadily improve it. To meet this goal, the company has established hseq management systems in all subgroups and service com-panies that are based on recognized international standards and are regularly reviewed and up-dated. In 2010 about 90% of all Bayer production sites had an hse management system audited by Bayer. More than 60% of our business activity (in relation to production volume and energy input, respectively) takes place at sites that are certifi ed or validated externally according to rec-ognized international standards such as iso 14001, emas or ohsas 18001. All subgroups and ser-vice companies have industry-specifi c quality management systems in place, such as iso 9001 or gmp (Good Manufacturing Practice). The subgroups have additional systems and standards that address product-specifi c requirements.
Further reduction in
industrial injury rate
Key Performance Indicators [Table 3.38]
Category Key Performance Indicators for Health, Safety and Environment 2009 2010
Health and Safety
Industrial injuries to Bayer employees resulting in at least one day’s absence (number of injuries per million hours worked) 2.0 1.7
Reportable industrial injuries to Bayer employees (number of injuries per million hours worked) 3.1 3.1
Environmental incidents 13 7
Transportation incidents 10 8
Emissions Direct greenhouse gas emissions (CO2 equivalents in million metric tons)* 4.57 4.80
Indirect greenhouse gas emissions (CO2 equivalents in million metric tons)* 3.53 3.70
Volatile organic compounds (VOC) (thousand metric tons / year) 2.59 2.54
Total phosphorus in waste water (thousand metric tons / year) 0.74 0.09
Total nitrogen in waste water (thousand metric tons / year) 0.64 0.49
Total organic carbon (TOC) (thousand metric tons / year) 1.35 1.42
Waste Hazardous waste generated (million metric tons / year) 0.38 0.35
Hazardous waste landfi lled (million metric tons / year) 0.09 0.06
Use of resources
Water use (million m3 / year) 407 474
Energy use (petajoules [1015 joules] / year) 77.33 85.71
2009 fi gures restated* as per Greenhouse Gas Protocol
Table of ConTenTs
Combined managemenT RepoRT
BAYER ANNUAL REPORT 2010 COMBINED MANAGEMENT REPORT 117
9. Sustainability9.3 Environment, Climate Protection and Safety
Our highest priorities are the health and safety of everyone who handles our products and the protection of the environment. For us, product stewardship entails a thorough evaluation of health and environmental risks – from product research and development to production – and includes responsible product marketing, use and disposal. Nearly all products manufactured by Bayer are subject to wide-ranging statutory obligations concerning the publication of information, such as those imposed by the European Union chemicals policy “reach.” We completed the man-datory pre-registration with the chemicals agency echa in 2009. In 2010 we submitted within the deadline registration dossiers for 125 of the substances that Bayer manufactures or imports in very large quantities (> 1,000 tons per year) or that are particularly hazardous. For many of these substances, Bayer has formed registration consortia with competitors in order to share data and avert the need for additional animal studies.
CLIMATE PROTECTION The Bayer Climate Program, announced in 2007, which forms a cornerstone of the Bayer Sustain-ability Program, addresses one of the major global challenges: climate change. We examine the en-ergy effi ciency of our processes and offer solutions for protecting the climate and coping with the effects of climate change. In 2010 Bayer was again named the best company in our sector in the global Carbon Disclosure Leadership Index, honoring our transparent reporting of the company’s climate strategy and greenhouse gas emissions. The company is also represented in the newly cre-ated Carbon Performance Leadership Index (cpli) with an “A” ranking. The cpli evaluates compa-nies’ specifi c actions and achievements in protecting the climate and addressing the consequences of climate change.
Improving energy effi ciency is a major factor in reducing our own greenhouse gas emissions. More than 140 production facilities and buildings – accounting for about 85% of production-relat-ed co2 emissions – throughout the Bayer Group were examined using the “Bayer Climate Check” analysis tool to determine the potential for reducing energy consumption and therefore co2 emis-sion. We expect to have a realizable energy reduction potential of up to 10% by 2013. The results of the Climate Check completed in 2010 will be integrated into the STRUCTese® (Structured Effi -ciency System for Energy) management system to ensure that this potential is sustainably realized and the effi ciency of our production processes steadily increased. It is planned to establish STRUCTese® at 60 of our most energy-intensive production facilities by the end of 2012 to sup-port the realization of the reduction targets.
Process innovations are a further focus of our efforts to reduce greenhouse gas emissions. One example is an innovative, climate-friendly chlorine production process developed by Bayer to-gether with its partners: in the future the oxygen depolarized cathode technology using common salt as a resource will make it possible to reduce energy consumption in chlorine production by 30%. In 2011 Bayer plans to bring a plant on stream in Germany that will use this process and have an initial capacity of 20,000 tons per year. In 2010 we also continued with process engineer-ing modifi cations to further reduce nitrous oxide emissions.
The Bayer Climate Program also adopts other approaches, including measures such as the “Eco-Fleet” program to reduce co2 emissions caused by company cars, the use of new telecom-munications technology to reduce business travel, and the improvement of energy effi ciency in the it environment. The steps taken as part of the Eco-Fleet program already cut co2 emissions by 15% between 2007 and the end of 2010.
Bayer bases its reporting of greenhouse gas emissions on the international standard of the Green-house Gas (ghg) Protocol. The company aims to hold total emissions to 2007 levels through 2020 despite growth in production. Despite the roughly 20% increase in manufactured sales volume in 2010, mainly at MaterialScience, we were able to limit the increase in direct greenhouse gas emis-sions to 5%. This was mainly driven by process improvements and energy-saving measures. En-ergy-related indirect greenhouse gas emissions also rose by 4.8%. The total of direct and indirect greenhouse gas emissions increased by 4.9%.
Bayer Climate Check completed
Table of ConTenTs
Combined managemenT RepoRT
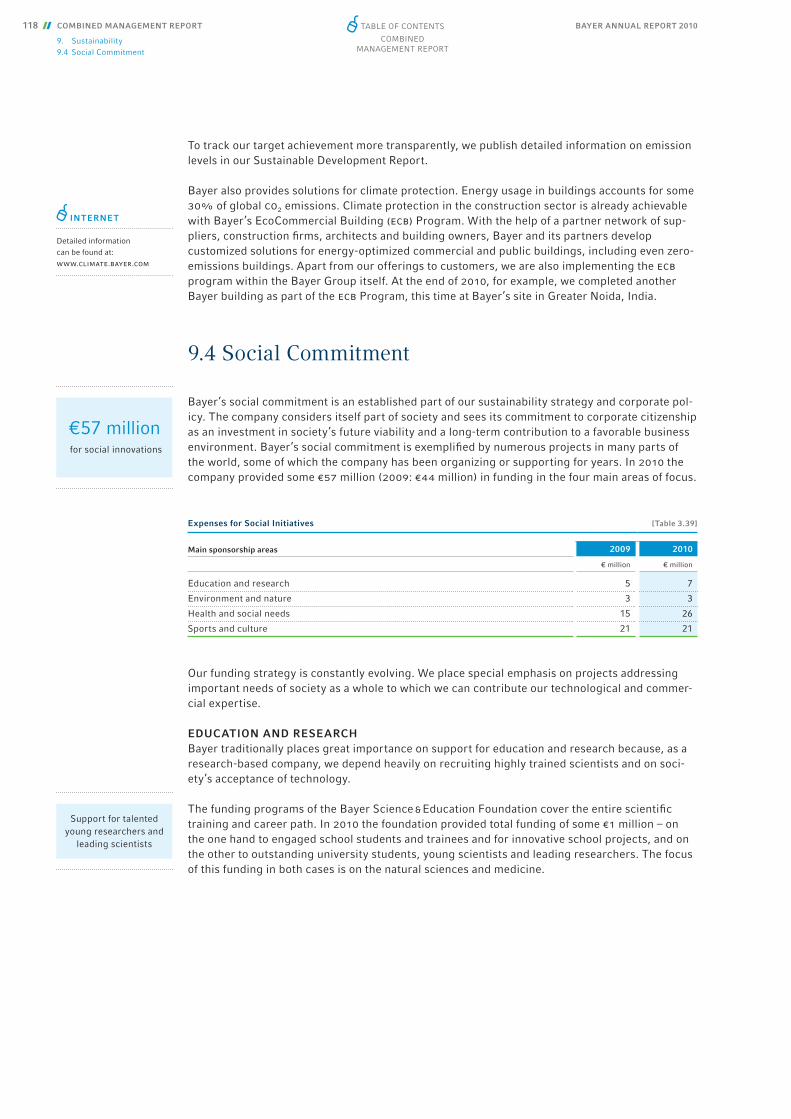
BAYER ANNUAL REPORT 2010118 COMBINED MANAGEMENT REPORT
9. Sustainability9.4 Social Commitment
To track our target achievement more transparently, we publish detailed information on emission levels in our Sustainable Development Report.
Bayer also provides solutions for climate protection. Energy usage in buildings accounts for some 30% of global co2 emissions. Climate protection in the construction sector is already achievable with Bayer’s EcoCommercial Building (ecb) Program. With the help of a partner network of sup-pliers, construction fi rms, architects and building owners, Bayer and its partners develop customized solutions for energy-optimized commercial and public buildings, including even zero-emissions buildings. Apart from our offerings to customers, we are also implementing the ecb program within the Bayer Group itself. At the end of 2010, for example, we completed another Bayer building as part of the ecb Program, this time at Bayer’s site in Greater Noida, India.
9.4 Social Commitment
Bayer’s social commitment is an established part of our sustainability strategy and corporate pol-icy. The company considers itself part of society and sees its commitment to corporate citizenship as an investment in society’s future viability and a long-term contribution to a favorable business environment. Bayer’s social commitment is exemplifi ed by numerous projects in many parts of the world, some of which the company has been organizing or supporting for years. In 2010 the company provided some €57 million (2009: €44 million) in funding in the four main areas of focus.
Our funding strategy is constantly evolving. We place special emphasis on projects addressing important needs of society as a whole to which we can contribute our technological and commer-cial expertise.
EDUCATION AND RESEARCHBayer traditionally places great importance on support for education and research because, as a research-based company, we depend heavily on recruiting highly trained scientists and on soci-ety’s acceptance of technology.
The funding programs of the Bayer Science & Education Foundation cover the entire scientifi c training and career path. In 2010 the foundation provided total funding of some €1 million – on the one hand to engaged school students and trainees and for innovative school projects, and on the other to outstanding university students, young scientists and leading researchers. The focus of this funding in both cases is on the natural sciences and medicine.
INTERNET
Detailed information can be found at: www.climate.bayer.com
€57 million for social innovations
Support for talented young researchers and
leading scientists
Expenses for Social Initiatives [Table 3.39]
Main sponsorship areas 2009 2010
€ million € million
Education and research 5 7
Environment and nature 3 3
Health and social needs 15 26
Sports and culture 21 21
Table of ConTenTs
Combined managemenT RepoRT

BAYER ANNUAL REPORT 2010 COMBINED MANAGEMENT REPORT 119
9. Sustainability9.4 Social Commitment
In 2010 the fourth “Baylab“ student laboratory opened at the company’s Leverkusen headquar-ters. Some 3,400 school students took advantage of the instruction offered in the areas of health care, nutrition and plastics during the fi rst year. In all, some 11,500 schoolchildren and teachers benefi ted from the “Baylabs” program, which, apart from the new student laboratory with its more general focus, includes the subject-specifi c “Baylab health,” “Baylab plants” and “Baylab plastics.” Bayer won the 2010 Enterprise Award of the German state of North Rhine-Westphalia for this educational project.
The “Humboldt Bayermobile,” a research laboratory on wheels, began visiting schools in 2010. The Bayer foundation is supporting this joint science education project of Bayer and Humboldt University in Berlin with funding of €300,000 for an initial period of three years. The international Bayer education initiative “Making Science Make Sense” was again implemented in 12 countries in 2010. This project targets elementary school students, to whom Bayer employees convey the fascination of science through hands-on experiments.
As part of our campaign to prevent child labor in our supply chain in India, we are implementing an integrated package of measures – entitled “Learning for Life” – that enables children and young people to attend school or vocational training courses and is designed to prevent cotton seed suppliers from employing them as laborers. The focus of the program is currently on voca-tional training. In the state of Karnataka, for example, more than 1,900 young people regularly attended the vocational training we introduced in conjunction with local non-governmental orga-nizations, initially at fi ve government schools, in the 2009 / 2010 and 2010 / 2011 academic years.
ENVIRONMENT AND NATUREAnother focus of our social commitment is on educating young people about environmental issues.
In 2010 Bayer and the United Nations Environment Programme (unep) again organized about a dozen environmental projects for children and young people as part of their global partnership. These activities centered on the International Children’s Conference on the Environment in Nagoya, Japan, attended by some 250 participants from 40 countries, which focused on biodiver-sity. Thanks once again to particularly strong interest from China, the annual children’s painting competition run jointly by Bayer and unep received a record 3.2 million entries from 95 countries. In 2010, a total of about 50 young people from 18 countries took part in a week-long study trip to Germany to learn more about environmental protection – the annual highlight of Bayer’s “Young Environmental Envoys” program. In 2010 Bayer and unep extended their partnership by a further three years until the end of 2013. Bayer will continue to support the joint projects with annual funding of €1.2 million.
Among the activities of the research group of Professor Jianfu Zhao at the Bayer-Tongji Chair for Sustainable Development at Tongji University in Shanghai, China, in 2010 were four research proj-ects dealing with topics such as the correlation between effi cient energy and water use. The Bayer Science & Education Foundation supported the research and teaching activities of this endowed pro-fessorship with total funding of €150,000 in 2010.
Involvingyoung people
in environmental protection
Table of ConTenTs
Combined managemenT RepoRT

BAYER ANNUAL REPORT 2010120 COMBINED MANAGEMENT REPORT
9. Sustainability9.4 Social Commitment
HEALTH AND SOCIAL NEEDSBayer is globally committed to improving social conditions and health care with the dual aim of promoting social stability in the communities near its sites and helping to solve global health chal-lenges.
As part of our ongoing aid programs, we again supported the World Health Organization (who) in 2010 in the fi ght against neglected tropical diseases. The company donated free supplies of medicines included on the who Essential Drug List, such as drugs to combat Chagas disease, an infection widespread in Latin America that is transmitted via the bite of the assassin bug.
The Bayer Cares Foundation, dedicated to promoting our social commitment, spent a total of more than €140,000 in 2010 to support 54 charitable volunteering programs in the communities near the company’s sites in Germany and Latin America. In this way the Foundation rewarded volunteerism by employees and other citizens who actively participate in projects aimed at addressing social needs.
In 2010 the Foundation also presented for the fi rst time the “Aspirin Social Award” – worth a total of €35,000 – for innovative aid and consultancy programs in the area of health care.
The Bayer Cares Foundation joined with Caritas International in funding a health center that will provide medical care to 30,000 victims of the earthquake in Haiti. This was made possible by Bayer employees in 34 countries, who donated a total of €250,000 in response to the company’s global appeal. Bayer AG added a further €100,000 to this amount for a total of €350,000. In the immediate aftermath of the earthquake, the company donated emergency relief in the form of an-tibiotics and painkillers worth over €650,000, bring the total value of Bayer’s aid to Haiti to more than €1 million.
Bayer: Science For A Better Life
Foundations [Graphic 3.21]
Bayer Science & Education Foundation Bayer Cares Foundation
Bayer foundation for the promotion of science and education
Strengthening education and research:
Improving school education
Supporting talented young scientists
Honoring outstanding research achievements
Bayer foundation for social initiatives
Improving living conditions:
Supporting voluntary involvement
Supporting long-term reconstruction following disasters
Promoting social innovation
Table of ConTenTs
Combined managemenT RepoRT
BAYER ANNUAL REPORT 2010 COMBINED MANAGEMENT REPORT 121
10. Events After the Reporting Period
SPORTS AND CULTUREBayer has been sponsoring sports and culture for over a century.
We support a wide variety of clubs for recreational, youth and disabled sports. Bayer has joined with the German Soccer Federation (dfb) in a new initiative to help schoolchildren with mental and learning disabilities play soccer. Dubbed “Simply Soccer,” the initiative establishes and sup-ports partnerships between special-needs schools and soccer clubs with the aim of giving more children and young people with disabilities access to club-level soccer and promote mutual learn-ing among people with and without disabilities.
The Bayer Arts & Culture program and our clubs and societies traditionally contribute to the cul-tural life of the communities near our sites, enhancing their attractiveness to employees and other citizens alike.
10. Events After the Reporting PeriodSince January 1, 2011, no events of special signifi cance have occurred that we expect to have a material impact on the fi nancial position or results of operations of the Bayer Group.
Table of ConTenTs
Combined managemenT RepoRT
BAYER ANNUAL REPORT 2010122 COMBINED MANAGEMENT REPORT
11. Future Perspectives11.1 Opportunity and Risk Report
11. Future Perspectives
11.1 Opportunity and Risk Report11.1.1 Opportunity and Risk Management
Business operations necessarily involve opportunities and risks. Effective management of oppor-tunities and risks is therefore a key factor in sustainably safeguarding a company’s value.
Managing opportunities and risks is an integral part of the corporate governance system in place throughout the Bayer Group, not the task of one particular organizational unit. Thus the organiza-tional units are closely interlinked in this respect. Key elements of the opportunity and risk man-agement system are the planning and controlling process, Group regulations and the reporting system.
At regular conferences held to discuss business performance, the opportunities and risks that are evaluated both qualitatively and quantitatively in determining the strategies of the strategic busi-ness entities and the regions are updated, and targets and necessary actions are agreed upon.
Opportunity management in the Bayer Group is based on the detailed observation and analysis of individual markets and the early recognition and evaluation of trends from which opportunities can be identifi ed. Macroeconomic, industry-specifi c, regional and local trends are taken into account. It is the task of the subgroups and strategic business entities to make use of strategic opportunities arising in their respective markets. The strategic framework necessary for them to do this is set, and the necessary fi nancing and liquidity ensured, at the Group level. Opportunity-based projects involving more than one subgroup are centrally coordinated and accounted for.
The principles of the Bayer Group’s risk management system are set forth in a directive published on the Group-wide intranet. The directive explains the fundamentals of risk management in com-pliance with the German Law on Corporate Supervision and Transparency and includes the prin-ciples for the early identifi cation, communication and addressing of risks. These principles relate to the areas of statutory requirements, risk management policies at Bayer and risk management activities.
In the Bayer Group, risks are systematically and continuously identifi ed, analyzed and document-ed in a database. Risks are defi ned as events and possible developments within or outside of the company that could jeopardize a sustained increase in enterprise value. Risk-relevant information is compiled at least quarterly and also on an ad hoc basis where necessary.
The documentation contains a description of the risk, an assessment of the extent of possible dam-age and the probability of occurrence, along with measures to monitor and counteract the risk.
Materiality limits for the subgroups and service companies are defi ned by the Bayer Group in consultation with the respective units. To transparently present risk issues at an early stage and allow potential risks to be countered in a timely manner, the risk documentation prescribes action thresholds that are well below the materiality limits.
The members of the Group Leadership Circle have unrestricted access to the risk database, which is mapped to the management information system.
Risk management at the Group level is assigned to the Chief Financial Offi cer. The subgroups, service companies and the units of the holding company have nominated persons responsible for risk management at the upper managerial level as well as risk management coordinators to ensure that an effective system for the early identifi cation of risks is implemented and maintained. The risk management coordinators and specialists in the organizational units are responsible for the risk inventory, including the identifi cation, evaluation and documentation of risks, and for explain-
Management of opportunities and risks is essential for steering
the company
Risk assessment based on the extent of possible damage and probability
of occurrence
Table of ConTenTs
Combined managemenT RepoRT

BAYER ANNUAL REPORT 2010 COMBINED MANAGEMENT REPORT 123
11. Future Perspectives11.1 Opportunity and Risk Report
ing the risk strategy. The annual risk report to the Supervisory Board covers the risk management system, legal risks, compliance issues, the reports by Corporate Auditing and the report on the internal control system.
Corporate Auditing is responsible for coordinating the identifi cation and documentation of risk areas throughout the Group and for enhancing the risk management system.
The effectiveness of the risk management system is monitored by Corporate Auditing at regular intervals. Corporate Auditing adopts a risk-based approach to audit planning. In addition, the ex-ternal auditor assesses the early warning system as part of the annual fi nancial statements audit and informs the Group Management Board and the Supervisory Board of the fi ndings. These fi nd-ings are taken into account as part of the continuous enhancement of our risk management sys-tem. The risk management system is monitored by the Supervisory Board, especially its Audit Committee.
11.1.2 Internal Control and Risk Management System for (Group) Accounting and Financial Reporting
(report pursuant to Sections 289 Paragraph 5 and 315 Paragraph 2 No. 5 of the
German Commercial Code (HGB))
Bayer has an internal control and risk management system in place under which appropriate structures and processes for (Group) accounting and fi nancial reporting are defi ned and imple-mented throughout the organization. This system is designed to guarantee timely, uniform and accurate accounting for all business processes and transactions. It ensures compliance with stat-utory regulations, accounting and fi nancial reporting standards and the internal accounting direc-tive, which is binding upon all the companies included in the consolidated fi nancial statements. The relevance and consequences for the consolidated fi nancial statements of any amendments to laws, accounting or fi nancial reporting standards or other pronouncements are continually ana-lyzed, and the Group directives and systems are updated accordingly.
Apart from defi ned control mechanisms such as system-based and manual reconciliation process-es, the fundamental principles of the internal control system include the separation of functions and compliance with directives and operating procedures. The accounting and fi nancial reporting process for the Bayer Group is managed by the Group Accounting and Controlling department of Bayer AG.
The Group companies prepare their fi nancial statements either locally or using the Group’s shared service centers and transmit them with the aid of a data model that is standardized throughout the Group and based on the Group accounting directive. The Group companies are responsible for their compliance with the directives and procedures applicable throughout the Group and for the proper and timely operation of their accounting-related processes and systems. The employees involved in the accounting and fi nancial reporting process for the consolidated fi nancial statements of the Bayer Group and the fi nancial statements of Bayer AG receive regular training, and the Group companies are supported by headquarters personnel throughout the pro-cess. As part of the process, measures are implemented that are designed to ensure the regulato-ry compliance of the consolidated fi nancial statements. These measures serve to identify and evaluate risks, and to limit and monitor any risks that may be identifi ed. For example, material new contractual relationships are systematically tracked and analyzed.
The consolidated fi nancial statements are prepared centrally on the basis of the data supplied by the included subsidiaries. The consolidation, certain reconciliation operations and monitoring of the related time schedules and procedures are performed by a dedicated Group Financial State-ments department. System-based controls are monitored by personnel and supplemented by manual inspection. At least one additional check by a second person is carried out at every level. Defi ned approval procedures must be observed at all stages in the accounting process. There is also a dedicated unit, separate from the fi nancial statements preparation process, for clarifi cation of specifi c accounting-related questions or particularly complex issues.
Clear organizational structure for risk
management
Table of ConTenTs
Combined managemenT RepoRT
BAYER ANNUAL REPORT 2010124 COMBINED MANAGEMENT REPORT
11. Future Perspectives11.1 Opportunity and Risk Report
Bayer’s internal control system for fi nancial reporting is based on the framework issued by coso (Committee of the Sponsoring Organizations of the Treadway Commission). For it processes, the cobit (Control Objectives for Information and Related Technology) framework is used according-ly. The standards for the mandatory Group-wide internal control system (ics) were derived from these frameworks, defi ned centrally and implemented by the Group companies. The management of each company is responsible for the implementation and oversight of the local ics. All ics-rele-vant business processes, together with the related risks and controls, are documented in a uni-form and audit-proof manner in a Group-wide system and clearly mapped in a central it system at the Group level.
The role of Corporate Auditing includes verifying the accuracy of the accounting at German and foreign companies, especially with regard to the following aspects:
• compliance with statutory regulations, directives of the Board of Management, and other inter-nal regulations and procedures
• formal and substantial correctness of accounting and the corresponding reporting• functioning and effectiveness of the internal control system to protect the company against
fi nancial loss• correctness of working procedures and adherence to economic principles.
Bayer AG has a standardized, Group-wide procedure to monitor the effi cacy of the accounting-related internal control system. This procedure is systematically aligned to the potential risks of misreporting in the consolidated fi nancial statements and is based on the strict require-ments of the u.s. capital market set forth in Section 404 of the Sarbanes-Oxley Act.
The appraisal of the effectiveness of the accounting-related ics is based on a cascaded self- assessment system that starts with the persons directly involved in the process, then involves the principal responsible managers and ends with the Group Management Board. Corporate Auditing performs an independent review of random samples of these self-assessments.
The Group Management Board has examined the effectiveness of the internal control system for accounting and fi nancial reporting on the basis of the coso framework and its criteria. The examination confi rmed the functionality of this internal control system for fi scal 2010. The ef-fectiveness of the internal control system is monitored by the Audit Committee of the Bayer AG Supervisory Board in compliance with the German Accounting Law Modernization Act, which came into effect in May 2009. However, it should be noted that an internal control system, irre-spective of its design, cannot provide absolute assurance that material misstatements in the accounting will be avoided or identifi ed.
11.1.3 Opportunities
As an international enterprise, Bayer is exposed to a wide variety of developments in the various national and international markets in which it operates in its three business areas. Different potential risks and opportunities arise within the existing operational framework according to the business performance described in this report and the company’s overall situation.
We aim to take maximum advantage of the opportunities that present themselves in our various fi elds of activity. We continuously evaluate potential additional opportunities in all areas as an in-tegral part of our strategy, which is described in detail in Chapter 11.2 “Strategy.”
Internal control system for accounting and
financial reporting based on coso framework
Table of ConTenTs
Combined managemenT RepoRT

BAYER ANNUAL REPORT 2010 COMBINED MANAGEMENT REPORT 125
11. Future Perspectives11.1 Opportunity and Risk Report
Research and development present major opportunities, and we are working continuously to fi nd new products and improve existing ones. These activities are presented in detail in Chapter 8 “Research and Development.”
Various risks described in the following – particularly fi nancial risks – are counterbalanced by the opportunities that could result from positive trends.
11.1.4 Risks
RISK EXPOSUREAs a global company with a diverse business portfolio, the Bayer Group is exposed to numerous risks. We have purchased insurance coverage – where it is available on economically acceptable terms – in order to minimize related fi nancial impacts. The level of this coverage is continuously re-examined.
Signifi cant risks for the Bayer Group are outlined in the following sections. The order in which the risks are listed is not intended to imply any assessment as to the likelihood of their material-ization or the extent of any resulting damages.
LEGAL RISKSWe are exposed to numerous legal risks from legal disputes or proceedings to which we are cur-rently a party or which could arise in the future, particularly in the areas of product liability, com-petition and antitrust law, patent disputes, tax assessments and environmental matters. The out-come of any current or future proceedings cannot be predicted. It is therefore possible that legal or regulatory judgments could give rise to expenses that are not covered, or not fully covered, by insurers’ compensation payments and could signifi cantly affect our revenues and earnings.
Legal proceedings currently considered to involve material risks are described in Note [32] to the consolidated fi nancial statements.
INDUSTRY-SPECIFIC RISKSPharmaceutical product prices are subject to regulatory controls in many markets. Some govern-ments intervene directly in setting prices. In addition, in some markets major purchasers of pharmaceutical products have the economic power to exert substantial pressure on prices. Price controls, as well as price pressure from generic manufacturers as a result of government reim-burse ment systems favoring less expensive generic pharmaceuticals over brand-name products, diminish earnings from our pharmaceutical products and could potentially render the market introduction of a new product unprofi table. We expect the current extent of regulatory controls and market pressures on pricing to persist or increase.
Regulatory changes are continuously monitored, especially in our key markets. If necessary, we adjust our business plans according to the signifi cance of governmental intervention.
Sales of the Bayer Group are subject to seasonal fl uctuations. This applies particularly in the CropScience business, which is also affected by factors such as weather conditions. The perfor-mance of our MaterialScience subgroup is affected by cyclicality in customer industries. A down-turn in the business cycle, characterized by weak demand and overcapacities, may lead to price pressure and more intense competition.
Table of ConTenTs
Combined managemenT RepoRT

BAYER ANNUAL REPORT 2010126 COMBINED MANAGEMENT REPORT
11. Future Perspectives11.1 Opportunity and Risk Report
The early identifi cation of trends in the economic or regulatory environment and active portfolio management are important elements of our business management. Our analyses of the global economy and forecasts of medium-term economic development are documented in detail on a quarterly basis and used to support operational business planning. However, even our detailed analyses may not ensure that a massive economic downturn of the kind that occurred in 2008 and 2009 can be predicted.
For a summary forecast, see Chapter 11.3 “Economic Outlook.”
Where it appears strategically advantageous, we may acquire a company or part of a company and combine it with our existing business. The amount of goodwill and other intangible assets re-fl ected in the Bayer Group’s consolidated statement of fi nancial position has increased signifi -cantly in recent years as a result of acquisitions. Failure to successfully integrate a newly acquired business or unexpectedly high integration costs could jeopardize the achievement of quantitative or qualitative targets, such as synergies, and adversely impact earnings.
The integration processes associated with our acquisitions are steered by integration teams. Ap-propriate resources are provided to support the integration processes.
PRODUCT DEVELOPMENT RISKSThe Bayer Group’s competitive position, sales and earnings depend signifi cantly on the develop-ment of commercially viable new products and production technologies. We therefore devote sub-stantial resources to research and development. Because of the lengthy development processes, technological challenges, regulatory requirements and intense competition, we cannot assure that all of the products we will develop in the future or are currently developing will actually reach the market and achieve commercial success as scheduled or at all.
Furthermore, adverse effects of our products that may be discovered after regulatory approval or registration despite thorough prior testing may lead to a partial or complete withdrawal from the market, due either to regulatory actions or our voluntary decision to stop marketing a product. Also litigations and associated claims for damages due to negative effects of our products may materially diminish our earnings.
To ensure an effective and effi cient use of resources in research and development, the Bayer Group has implemented an organizational structure and process organization comprising func-tional departments, working groups and reporting systems that monitor development projects.
REGULATORY RISKSOur life science businesses, in particular, are subject to strict regulatory regimes relating to the test-ing, manufacturing and marketing of many of our products. In some countries regulatory controls have become increasingly demanding. We expect this trend to continue, particularly in the United States and the European Union. Increasing regulatory requirements, such as those governing clini-cal or (eco-)toxicological studies, may increase product development costs and / or delay product (re-)registration.
To counter risks arising from legal or other requirements, we make our decisions and engineer our business processes on the basis of comprehensive legal advice provided both by our own experts and by acknowledged external specialists. Projects have been initiated to coordinate the implemen-tation of new regulatory controls and mitigate any negative implications for the business.
PATENT RISKSA large proportion of our products, mainly in our life science businesses, is protected by patents. We are currently involved in lawsuits to enforce patent rights in our products. Generic manufactur-ers and others attempt to contest patents prior to their expiration. Sometimes a generic version of a product may even be launched “at-risk” prior to the issuance of a fi nal patent decision.
Increased competitive pressure following patent expiration
Holistic portfolio management
Table of ConTenTs
Combined managemenT RepoRT
BAYER ANNUAL REPORT 2010 COMBINED MANAGEMENT REPORT 127
11. Future Perspectives11.1 Opportunity and Risk Report
When a patent defense is unsuccessful, or if one of our patents expires, our prices are likely to come under pressure because of increased competition from generic products entering the market. De-tails of related litigation are provided as part of the description of legal risks in Note [32] to the con-solidated fi nancial statements.
In some areas of activity we may also be required to defend ourselves against charges that products infringe patent or proprietary rights of third parties. This could impede or even halt the develop-ment or manufacturing of certain products or require us to pay monetary damages or royalties to third parties.
Our life science businesses, in particular, have a comprehensive product life-cycle management sys-tem in place. In addition, our legal department, in conjunction with the relevant functional depart-ments, regularly reviews the patent situation. Potential infringements of our patents by other com-panies are carefully monitored so that legal action can be taken if necessary.
PRODUCTION, PROCUREMENT MARKET AND ENVIRONMENTAL RISKSProduction capacities at some of our manufacturing facilities could be adversely affected by, for instance, technical failures, natural disasters, regulatory rulings or disruptions to supplies of key raw materials or intermediates, as in the case of dependence on a single source for critical materi-als. This applies particularly to our biotech products because of the highly complex manufactur-ing processes. If in such cases we are unable to meet demand by shifting suffi cient production to other plants or drawing on our inventories, we may suffer declines in sales revenues.
The supply of strategically important raw materials is ensured wherever possible through long-term contracts and / or by purchasing from multiple suppliers. Furthermore, all stages of our pro-duction processes and our material inputs are continuously monitored by the respective expert function within the company.
Moreover, the manufacturing of chemical products is subject to risks associated with the produc-tion, fi lling, storage and transportation of raw materials, products and wastes. These risks may result in personal injury, property damage, environmental contamination or business interrup-tions and liability for compensation payments.
Furthermore, the possibility of accidental cross-contamination among our crop protection prod-ucts or the presence of unintended trace amounts of genetically modifi ed organisms in agricultur-al products and / or foodstuffs cannot be completely excluded.
We address product and environmental risks by way of suitable quality assurance measures. An integrated quality, health, environmental and safety management system ensures process stabili-ty. In addition, we are committed to the international Responsible Care initiative of the chemical industry, are driving forward our sustainable development and climate program and report regu-larly on our sustainability management, which also covers the areas of environmental protection and safety.
IT RISKSBusiness and production processes and the internal and external communications of the Bayer Group are increasingly dependent on information technology systems. Major disruptions or failure of global or regional business systems may result in loss of data and / or impairment of business and production processes.
The foundations for a continuous and sustainable it risk management system have been laid by es-tablishing a comprehensive organization, issuing regulations that defi ne the relevant roles and re-sponsibilities, and implementing a periodic reporting system. For this purpose a committee has been established at the Group level to resolve upon the basic strategy, architecture and it security features, which are implemented accordingly by the subgroups and service companies in consulta-tion with this central organization. Technical precautions such as data recovery and continuity plans have been established together with our internal it service provider to address this risk.
Long-term supply contracts to hedge
against raw material price risks
Table of ConTenTs
Combined managemenT RepoRT
BAYER ANNUAL REPORT 2010128 COMBINED MANAGEMENT REPORT
11. Future Perspectives11.1 Opportunity and Risk Report
RISK TO PENSION OBLIGATIONS FROM CAPITAL MARKET DEVELOPMENTSThe Bayer Group has obligations to current and former employees related to pensions and other post-employment benefi ts. Changes in relevant valuation parameters such as interest rates, mor-tality and rates of increases in compensation may raise the present value of our pension obliga-tions. This may lead to increased pension costs or diminish stockholders’ equity due to actuarial losses being recognized directly in equity. A large proportion of our pension and other post-em-ployment benefi t obligations is covered by plan assets including fi xed-income securities, shares, real estate and other investments. Declining or even negative returns on these investments may adversely affect the future fair value of plan assets. This in turn may diminish equity, and / or it may necessitate additional contributions by the company. Further details are given in Note [25] to the consolidated fi nancial statements.
We address the risk of market-related fl uctuations in the fair value of our plan assets through prudent strategic investment, and we constantly monitor investment risks in regard to our global pension obligations.
FINANCIAL RISKSManagement of fi nancial and commodity price risksAs a global enterprise, Bayer is exposed in the normal course of business to credit risks, liquidity risks and various market price risks that could materially affect its net assets, fi nancial position and results of operations.
It is company policy to use derivatives to minimize or eliminate the market price risks associated with operating activities and the resulting fi nancing requirements. Derivatives are used almost exclusively to hedge realized or forecasted transactions. The use of derivatives is subject to strict internal controls based on centrally defi ned mechanisms and uniform guidelines. The derivatives used are mainly over-the-counter instruments, particularly forward exchange contracts, foreign currency options, interest rate swaps, cross-currency interest rate swaps, commodity swaps and commodity option contracts concluded with banks. We set counterparty limits for such banks depending on their creditworthiness.
The various risks associated with fi nancial instruments are outlined below together with the rele-vant risk management systems.
Credit risksCredit risks arise from the possibility of the value of receivables or other fi nancial assets being impaired because counterparties cannot meet their payment or other performance obligations. Since the Bayer Group does not conclude master netting arrangements with its customers, the total of fi nancial assets represents the maximum credit risk exposure.
To effectively manage the credit risks from trade receivables, Bayer has put in place a standard-ized risk management system, which is the subject of a Group directive. Customers’ creditworthi-ness is regularly analyzed; these receivables are partly secured. Credit limits are set for all cus-tomers. All credit limits for debtors where total exposure is €10 million or more are evaluated by our operational credit management and submitted to the Group’s Central Financial Risk Commit-tee.
To minimize credit risks, fi nancial transactions are only conducted with banks and other partners of fi rst-class credit standing in line with predefi ned exposure limits. All risk limits are based on methodical models. Adherence to the risk limits is continuously monitored.
Country risks relating to trade receivables and intra-Group loans are continuously monitored, systematically evaluated and centrally managed.
Table of ConTenTs
Combined managemenT RepoRT

BAYER ANNUAL REPORT 2010 COMBINED MANAGEMENT REPORT 129
11. Future Perspectives11.1 Opportunity and Risk Report
Liquidity risksLiquidity risks – those arising from the possibility of not being able to meet current or future pay-ment obligations because insuffi cient cash is available – are centrally managed in the Bayer Group. Suffi cient liquid assets are held to meet all of the Group’s payment obligations when they fall due, thereby ensuring solvency at all times. Payment obligations result both from operating cash fl ows and from changes in current fi nancial liabilities. In addition, a reserve is maintained for unbudgeted shortfalls in cash receipts or unexpected disbursements. For this purpose, budget deviation analyses are performed on the basis of historical time series, adjusted for variations in business structure. The liquidity reserve is then determined which, with a defi ned probability, will cover a negative deviation from budgeted cash fl ows. The size of this reserve is regularly reviewed and adjusted as necessary to current conditions. Liquid assets are kept mainly in the form of overnight and term deposits. Credit facilities also exist with banks. These include, in particular, a €3.5 billion syndicated credit facility, which is undrawn.
We intend to service the bonds maturing in 2011 out of liquidity and free operating cash fl ow.
Market risksMarket risks relate to the possibility that the fair value or future cash fl ows of fi nancial instru-ments may fl uctuate due to variations in market prices. Market risks include currency, interest rate and other price risks, especially commodity price risks.
Sensitivity analysis is a widely used risk measurement tool that allows our management to make judgments regarding the potential loss in future earnings, fair values or cash fl ows of market-risk-sensitive instruments resulting from one or more selected hypothetical changes in interest rates, foreign currency exchange rates, commodity prices or other relevant market rates or prices over a selected period of time. We use sensitivity analysis because it provides reasonable risk estimates using straightforward assumptions (for example, an increase in interest rates). The risk estimates we provide below assume:
• a simultaneous, parallel shift in foreign exchange rates in which the euro depreciates against all currencies by 10%,
• a parallel shift of 100 basis points in the interest rate yield curves of all currencies, and• a simultaneous 20% decline in the prices of all the commodities underlying the derivatives we
hold.
We use market information and additional analytics to manage our risk exposure and mitigate the limitations of our sensitivity analysis. We have found sensitivity analysis to be a useful tool in achieving some of our specifi c risk management objectives. Sensitivity analysis offers an easy-to-understand risk exposure estimate that allows an approximation of the effect that changing mar-ket conditions could have on our business. It also allows our management to take the necessary steps to address such risks.
We continually refi ne our risk measurement and reporting procedures. This includes periodically re-examining the underlying assumptions and parameters utilized.
The sensitivity analyses included in the following sections of this Risk Report present the hypo-thetical loss in cash fl ows of fi nancial instruments and derivatives that we held as of December 31, 2010 and December 31, 2009. The range of sensitivities that we chose for these analyses refl ects our view of the changes in foreign exchange rates, commodity prices and interest rates that are reasonably possible over a one-year period.
Table of ConTenTs
Combined managemenT RepoRT
BAYER ANNUAL REPORT 2010130 COMBINED MANAGEMENT REPORT
11. Future Perspectives11.1 Opportunity and Risk Report
Currency risksSince the Bayer Group conducts a signifi cant portion of its operations outside the eurozone, fl uctuations in currency exchange rates can materially affect earnings. Currency risks from fi nancial instruments exist with respect to receivables, payables, cash and cash equivalents that are not denominated in a company’s functional currency. In the Bayer Group these risks are particularly signifi cant for the u.s. dollar, the Japanese yen, the Canadian dollar and the Chinese renminbi.
Currency risks are identifi ed, analyzed and managed centrally and systematically. The scope of hedging is evaluated regularly and defi ned in a corporate directive. Recorded foreign currency op-erating items, receivables and payables are normally fully hedged.
The anticipated foreign currency exposure from forecasted transactions in the next twelve months is hedged on a basis agreed between the Group Management Board, the central fi nance department and the operating units. A signifi cant proportion of contractual and foreseeable currency risks is hedged, mainly through forward exchange contracts and currency options.
The Group Management Board has provided clear guidance on how to limit and monitor cash fl ow risks that result from this approach.
We applied a hypothetical adverse scenario in which the euro simultaneously depreciates by 10% against all other currencies compared with the year-end exchange rates. Under this scenario the estimated hypothetical loss of cash fl ows from derivatives and non-derivatives as of December 31, 2010 would be €279 million (2009: €188 million). Of this €279 million, €120 million is related to the u.s. dollar, €41 million to the Japanese yen, €30 million to the Canadian dollar, €34 million to the Chinese renminbi and €54 million to other currencies. Of the €279 million estimated hypothetical loss of cash fl ow, €296 million results from derivatives used to hedge anticipated exposure from planned sales denominated in foreign currencies. Such transactions qualify for hedge accounting, and the respective changes in value are recognized in equity under other comprehensive income (oci). The offsetting position of €17 million is primarily attributable to account balances in foreign currencies and unhedged currency derivatives embedded in supply contracts. The impact of ex-change-rate fl uctuations on our anticipated sales in foreign currencies is not included in this calcu-lation.
Interest rate risksThe Bayer Group’s interest rate risks arise primarily from fi nancial assets and liabilities with ma-turities exceeding one year. In the case of fi xed-rate fi nancial instruments, such as fi xed-rate bonds, the risk of fl uctuations in capital-market interest rates results in a fair value risk because the fair values fl uctuate as a function of interest rates. In the case of fl oating-rate instruments, a cash fl ow risk exists because interest payments could increase in the future.
Interest rate risks in the Bayer Group are analyzed centrally and managed by the central fi nance department. This is done in line with the duration set by the Board of Management, which implic-itly also includes the ratio of fi xed-rate to fl oating-rate debt. The duration is subject to regular review. Derivatives – mainly interest rate swaps, cross-currency interest rate swaps and interest options – are employed to preserve the target structure of the portfolio.
Financial debt including derivatives amounted to €11,767 million as of December 31, 2010 (De-cember 31, 2009: €12,858 million). The sensitivity analysis was performed on the basis of our fl oating-rate debt position at year end 2010, taking into account the interest rates relevant to our liabilities in all principal currencies. A hypothetical increase of 100 basis points, or 1 percentage point per annum, in these interest rates (assuming constant currency exchange rates) as of Janu-ary 1, 2010 would have raised our interest expense for the year ended December 31, 2010 by €45 million (2009 based on liabilities at year end 2009: €58 million).
Table of ConTenTs
Combined managemenT RepoRT

BAYER ANNUAL REPORT 2010 COMBINED MANAGEMENT REPORT 131
11. Future Perspectives11.2 Strategy
Other price risks (especially commodity price risks)The Bayer Group requires signifi cant quantities of petrochemical feedstocks and energy for its various production processes. The prices of these inputs may fl uctuate considerably depending on market conditions. As in the past, there may be times when it is not possible for us to pass on increased raw material costs to customers through price adjustments. This applies particularly to our MaterialScience business.
We have addressed this risk by concluding long-term contracts with multiple suppliers. The pro-curement departments of the subgroups are responsible for managing these price risks on the basis of internal directives and centrally determined limits, which are subject to constant review. The operation of our production facilities requires large amounts of energy, mostly in the form of electricity and steam. To minimize our exposure to energy price fl uctuations, we aim for a bal-anced diversifi cation of fuels for steam production and a mix of external procurement and captive production for power generation.
We applied a hypothetical adverse scenario in which all commodity and energy prices simultane-ously decrease by 20%. Under this scenario the estimated hypothetical loss of cash fl ows from derivatives as of December 31, 2010 would be €8 million (2009: €31 million). Of this €8 million, €0 million would be directly disclosed in the income statement and €8 million would be recog-nized as a value adjustment in equity under other comprehensive income (oci) according to hedge accounting rules. In considering sensitivities for commodity futures and commodity option con-tracts, we have made a small allowance for the fact that forward rates are less volatile than spot rates. The stated long-term contract volumes are therefore based on somewhat smaller price changes. The derivatives used by the Bayer Group to mitigate the risk of changes in exchange rates, interest rates and commodity prices are described in Note [30.3] to the consolidated fi nan-cial statements.
Assessment of the overall risk situationCompared with the previous year, the overall risk situation did not change signifi cantly in the re-porting period. The overall risk assessment is based on a consolidated view of all signifi cant indi-vidual risks. At present, no potential risks have been identifi ed that either individually or in combi-nation could endanger the continued existence of the Bayer Group.
11.2 Strategy
BUSINESS STRATEGYThe Bayer Group focuses on the rapidly growing, innovation-driven health care, nutrition and high-tech materials businesses in line with its mission statement “Bayer: Science For A Better Life.” Our strategic alignment toward these attractive markets and our concentration on core competencies enable us to invest in growth areas and innovative technologies. We aim to contin-ue playing leadership roles and to steadily expand our already strong market positions. We will also continue our efforts to contain costs and improve effi ciency in order to further increase the company’s value. We are pursuing a long-term growth strategy, mindful of the need to manage the business sustainably.
To facilitate investment in further growth, annual cost savings of €800 million are planned by 2013. About half of this amount is to be reinvested. By the end of 2012 the company is likely to take one-time charges in the region of €1 billion, part of this amount having already been incurred in the fourth quarter of 2010. In connection with this program, it is planned to reduce the global headcount of 111,400 by an aggregate of about 2,000 by the end of 2012. Approximately 4,500 positions – including roughly 1,700 in Germany – are to be cut, while some 2,500 new jobs will be created over the same period, particularly in the emerging markets.
No risks that could endanger the company’s
existence
Table of ConTenTs
Combined managemenT RepoRT
BAYER ANNUAL REPORT 2010132 COMBINED MANAGEMENT REPORT
11. Future Perspectives11.2 Strategy
HEALTHCARE HealthCare continues to aim for a market or above-market rate of growth in all of its businesses. We aim to further strengthen this subgroup and grow it into a world-leading diversifi ed health care company. For example, we plan to continue strengthening our Consumer Health segment for the long term, sharpen our focus in the Pharmaceuticals segment on specialty pharmaceuticals, further increase the overall productivity of research and development and place even greater im-portance on the emerging markets. This will require a high level of investment in the coming years. Among the ways we will raise the funds needed for this expansion are by carefully redis-tributing resources and introducing effi ciency and cost saving measures. For this reason, we plan to cut the number of positions at HealthCare by around 1,800 by the end of 2012. Most of the reductions will be in our Pharmaceuticals Division, the Medical Care Division in the United States and in the platform functions within HealthCare. However, we will create 1,500 new positions in the emerging markets and in connection with product launches.
Activities in our strongest segment – Pharmaceuticals – are focused on medicines prescribed mainly by specialist physicians in the areas of women’s healthcare, cardiology, oncology, hematol-ogy, diagnostic imaging and multiple sclerosis. Our portfolio also includes drug products that are usually prescribed by general practitioners.
We will maintain our focus on diseases where there is a high unmet medical need and major potential exists for improving diagnosis and therapy. Research and development is thus an impor-tant growth engine for our Pharmaceuticals segment, which consequently accounts for the larg-est share of the r & d budget. Here we also aim to strengthen our portfolio and supplement our own research and development activities with inlicensing, alliances and collaborations. An exam-ple in 2010 was the discovery, development and commercialization agreement signed with Californian company OncoMed Pharmaceuticals, Inc. in the area of novel therapeutics to target cancer stem cells.
We already hold leading positions in the pharmaceuticals markets of many emerging countries, particularly China and Russia. A key element of our pharmaceuticals strategy is the selective expansion of business in the emerging markets. An example in 2010 was the market launch of Betaferon® in China to treat the relapsing-remitting form of multiple sclerosis (ms).
Our Consumer Health segment includes non-prescription medicines, dermatology products, blood glucose meters, medical devices and the animal health business.
The goal of the Consumer Care Division is to build on our position in the global over-the-counter (otc) medicines market. The division’s strategy is aimed at fully leveraging the growth potential of proven brands such as Aspirin®. We are pursuing a clear course of expansion in fast-growing regions such as central and eastern Europe and Asia / Pacifi c and aim to further strengthen our business in areas with potential for growth. We will continue to take advantage of external growth opportunities in the form of strategically relevant acquisitions or inlicensing. One such growth op-portunity is provided by the exclusive licensing agreement with AstraZeneca plc for the market-ing of omeprazole under the Losec® Pro, Antra® or Mopralpro® trademarks as an otc medication to treat heartburn. Currently this product has been introduced in seven markets, and launches are planned in additional countries.
The strategy of the Medical Care Division is to build on its competitive positions in the fi elds of blood glucose monitoring, diabetes management, injection systems for contrast agents, and vas-cular intervention systems such as thrombectomy systems for treating constricted or blocked blood vessels. We also plan to continue expanding our portfolio by investing in additional busi-ness areas and geographic regions and entering into strategic partnerships. It is our intention to steadily improve our products, reduce costs and deploy resources even more effi ciently. We are aiming to expand our product range by developing new blood glucose monitoring systems and innovative solutions that help people with diabetes to better manage the disease. In the medical equipment business, we are continuing to develop our core radiology portfolio of contrast agent
Expansion in fast-growing
regions
Table of ConTenTs
Combined managemenT RepoRT
BAYER ANNUAL REPORT 2010 COMBINED MANAGEMENT REPORT 133
11. Future Perspectives11.2 Strategy
injection and thrombectomy systems. We are also developing new software products and it-based service solutions to optimize both contrast media dosage and the clinical workfl ows in-volved in processing diagnostic data and images.
In the Animal Health Division, we aim to build on our strong positions in the companion animals and livestock markets. Our strategy is directed toward achieving organic growth by focusing on countries and markets with long-term sales potential and successfully managing the life cycles of existing core brands. In addition, we are pursuing external growth opportunities through acquisi-tions and inlicensing. For example, in 2010 we acquired an innovative, oral administration tech-nology for animal health products from the u.s. company Piedmont Pharmaceuticals, llc. Our ac-quisition of the New Zealand-based Bomac Group, an innovative manufacturer of animal health products used mainly in livestock, is aimed at strengthening our business, particularly in the Asia / Pacifi c region. We aim to step up the development of new proprietary products to safeguard our long-term success.
CROPSCIENCECropScience, one of the leading innovation-driven companies in its industry, aligns its corporate planning to long-term trends in agricultural markets. It aims to offer products and customer-ori-ented solutions for the production of affordable, high-quality food, feed, fi ber and energy crops. Against a background of limited arable land, advancing climate change and a steadily increasing global population, it is essential to safeguard and further increase crop yields. We manage our business responsibly, in keeping with our commitment to sustainable development and our goal of achieving long-term growth and attractive returns.
We are committed to offering our customers comprehensive, single-source solutions and there-fore evolve coordinated and sustainable concepts – from seed to harvest – for specifi c crops in dif-ferent regions. Our customer-oriented approach comprises seed, optimized plant traits and crop protection products as well as related services and partnerships along the food value chain.
Innovation is the basis for value creation at CropScience. The development of new active ingredi-ents and formulations and high-quality seed enables us to replace older products and technolo-gies with those that offer superior performance properties, environmental compatibility and user safety along with higher added value for the customer. Our new products are crucial to increasing sales and achieving attractive margins. In November 2010 we announced a package of measures, to be largely implemented by 2012, which will make necessary funds available for further invest-ment and optimize our cost structures. We will make a net cut of approximately 600 positions at CropScience by 2012, mainly in Germany and the United States. The measures are aimed at mak-ing CropScience more effi cient in all areas so that freed-up resources can be invested in our Bio-Science business, the commercialization of new products and the expansion of strategic growth markets while we continue to defend our positions in the well developed markets.
In the Crop Protection segment, CropScience aims to safeguard and expand the market-leading positions of its Herbicides, Fungicides, Insecticides and Seed Treatment business units by main-taining a broad regional presence and offering innovative, highly effective products. To achieve this strategic goal, we are steadily enhancing our product mix by launching new active ingredi-ents and products from our research and development pipeline as well as successfully managing product life cycles while also engaging in complementary research activities in breeding, plant traits and new growth areas. For example, we are currently working on new integrated methods and solutions in the areas of plant health and quality, stress tolerance, nutrient uptake, diagnos-tics and biological pest control.
Innovation forms the basis for
value creation
Table of ConTenTs
Combined managemenT RepoRT

BAYER ANNUAL REPORT 2010134 COMBINED MANAGEMENT REPORT
11. Future Perspectives11.2 Strategy
Our Environmental Science business unit primarily relies on the development and production ca-pacities of Crop Protection and its innovative active ingredient portfolio and pipelines. Our strate-gy is to build on our leading market positions by developing and commercializing innovative solu-tions that are tailored to the specifi c needs of consumers and professional users and are designed to be easy to use and safe to handle. The Environmental Science business unit has growth poten-tial, particularly in the emerging markets. Our strategic alignment also emphasizes systematic customer orientation, including the expansion of marketing activities, and the continued develop-ment of specifi c market segments such as forestry or industrial vegetation management.
The BioScience business unit researches, develops and commercializes seeds and technology based on modern breeding methods. We aim to continue expanding our activities in seeds and plant traits with the aim of raising BioScience sales to about €1.4 billion by 2018 while increasing the share of our research and development expenditures allocated to BioScience. Our seed busi-ness has traditionally focused on four rapidly expanding core crops: cotton, vegetables, canola and rice. We aim to build on our strong market positions in these crops by introducing new variet-ies and expanding into new regional markets. Since 2009 we have been conducting research into improved cereal varieties, with soybeans defi ned as an additional area of research focus. The goals of our Bioscience research include increasing yields and making plants more resistant to ad-verse weather conditions and certain insect pests. We are also conducting research into sugar-cane with a higher sugar content. We not only market our technologies in our own seed products, but also increasingly outlicense them for other crops.
CropScience markets its products in more than 120 countries worldwide. In the coming years we intend to continue expanding our business, particularly in fast-growing markets such as Brazil, India, China, Russia and eastern Europe. In these countries there is major potential for the agri-culture industry to react to the increasing global demand for high-quality food and feed by de-ploying innovative, leading-edge technologies. In this environment we aim to steadily expand our business and help farmers raise productivity by providing them with comprehensive solutions from seed to harvest.
MATERIALSCIENCEThe strategy of MaterialScience is directed primarily toward safeguarding existing competitive positions in its traditional markets, adding innovative new businesses to the portfolio and achiev-ing profi table and sustainable growth in the emerging markets. In this way we plan to ensure high profi tability and contribute to a long-term increase in enterprise value. Our products are in-tended to provide long-term solutions for conserving global energy resources and protecting the climate. They are also designed to help in improving the quality of life for as many people as possible. The above-average growth of the Asian markets represents a major challenge in this respect, at the same time offering a business potential that we plan to develop. Our capital ex-penditure policy, which is aligned to medium- and long-term market trends, remains in keeping with this. We also aim to continuously improve the effi ciency of our production processes.
In the Polyurethanes business unit (pur), we intend to expand our global market leadership in isocyanates, a key precursor particularly for rigid and fl exible foams. It remains our goal to achieve cost leadership in these areas in the long term. We also want to expand our distribution channels and global competence networks.
We expect our new large-scale plant for toluene diisocyanate (tdi) in Shanghai, China, with an annual capacity of 250,000 tons, to support sustained growth in Asia. Mechanical completion of the facility will take place in sections in the fi rst quarter of 2011, with commercial production due to start in the second half of 2011. In Europe, MaterialScience plans to erect a new “world-scale” tdi production facility in Dormagen, Germany, with a permitted capacity of 300,000 tons per year and bring it on stream in 2014. The company’s European production activities for tdi will then be concentrated in Dormagen. MaterialScience’s innovative, patented tdi process technolo-gy, which will be used in both facilities, sets new global standards for effi cient, climate-friendly production. A facility based on the new technology saves substantial amounts of energy and sol-vents, reduces co2 emissions by up to 60,000 tons per year compared with a conventional plant of the same size, and costs about 15% less to build.
Focus on increasing enterprise value at
MaterialScience
Table of ConTenTs
Combined managemenT RepoRT

BAYER ANNUAL REPORT 2010 COMBINED MANAGEMENT REPORT 135
11. Future Perspectives11.2 Strategy
In the diphenylmethane diisocyanate (mdi) product group, we aim to achieve sustained growth thanks to the increasing demand for insulating materials from key customer industries. The need for thermal insulation of buildings is expected to boost demand in the construction and other sectors. To meet this growing demand, Bayer plans to increase mdi capacity at the site in Shang-hai, China, to 1,000,000 tons per year.
Polyether polyols will mainly support growth in the isocyanates business, complementing our system solutions. Our systems houses facilitate growth in the isocyanates business by providing an important distribution channel to serve specifi c customer needs.
We are currently experiencing strong demand in the world market for the products of our Poly-carbonates (pcs) business unit. Demand for polycarbonates in Asia, especially China, is substan-tial, and the region currently accounts for more than 60% of the global market. We are respond-ing by enlarging our manufacturing capacities for polycarbonate. In Shanghai we plan to raise annual capacity to 500,000 tons as we continue to exploit the effi ciency of our world-scale pro-duction facilities. We also plan to relocate the headquarters of this business unit to Shanghai in order to steer the business in close proximity to the markets in light of the region’s growing im-portance. At the same time, as a leading development and technology partner, we offer custom-ers individual solutions for various polycarbonate applications. Among our objectives is to ex-pand our network of “Color Competence and Design Centers” for customized plastics compounding.
In the fi eld of semi-fi nished products, substantial market potential lies in the use of polycarbon-ate diffuser sheets in liquid-crystal displays for large-format fl at screens. Growth in demand for polycarbonates is also being driven by the trend in the automotive industry toward lightweight components such as for glazing.
The Coatings, Adhesives, Specialties (cas) business unit seeks to defend and selectively expand its current market position in basic and modifi ed isocyanates. We will therefore raise our produc-tion capacities in Europe and the Asia / Pacifi c growth region to meet rising demand. It is planned to expand production of hexamethylene diisocyanate (hdi) in Shanghai, including the construc-tion there of an additional facility with a capacity of 50,000 tons per year. We also intend to build a multi-purpose facility in Leverkusen for the production of hdi and isophorone diisocyanate (ipdi). In addition, we aim to improve profi tability by sharpening the focus of our portfolio on modern coating and adhesive raw material systems.
We are developing functional fi lms, carbon nanotubes, and products for medical applications with the aim of opening up new business opportunities and positioning ourselves as a focused technology leader in these areas.
We also generate innovative business ideas by looking at our materials more from an application-technology perspective. For example, high-quality components combining polyurethane with polycarbonate can be produced by a one-step injection molding process known as “DirectSkin-ning.”
MaterialScience also uses novel processes for its own production. The effi ciency of chlorine pro-duction, for example, can be greatly increased using oxygen depolarized cathode technology. This technology enables energy savings of some 30% compared to a membrane process, along with a corresponding indirect reduction in greenhouse gas emissions.
Relocation of PCS headquarters to Shanghai, China
Table of ConTenTs
Combined managemenT RepoRT
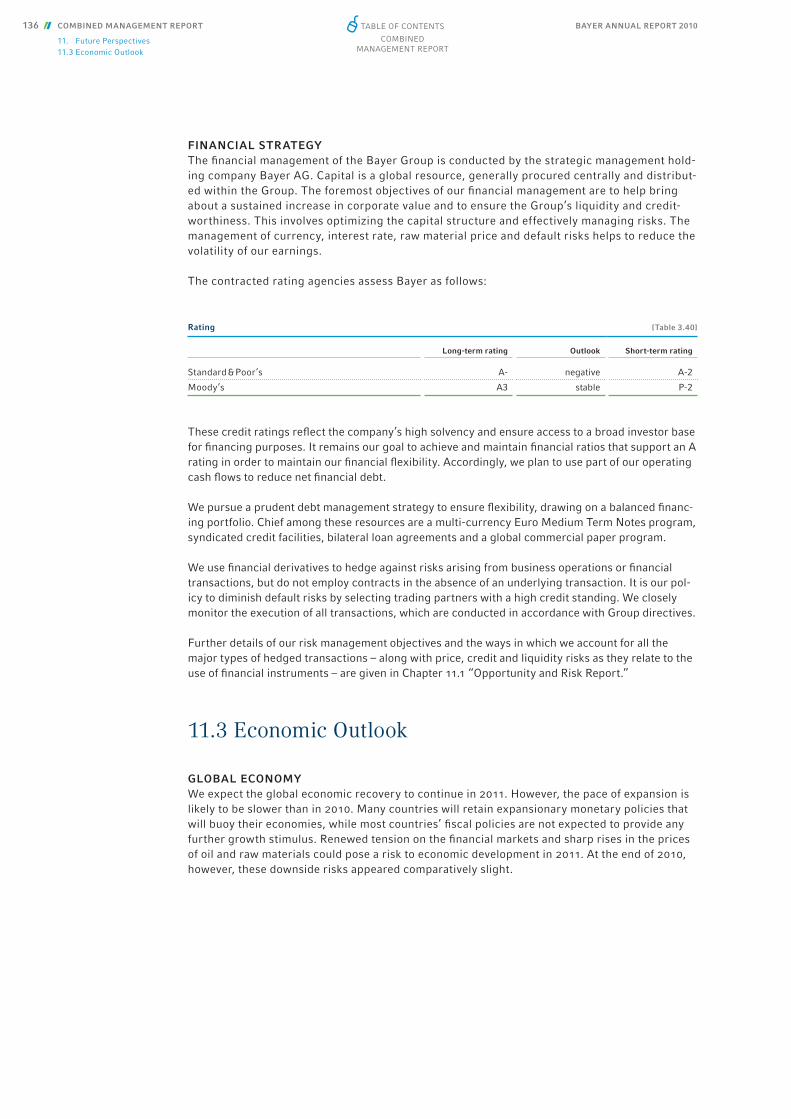
BAYER ANNUAL REPORT 2010136 COMBINED MANAGEMENT REPORT
11. Future Perspectives11.3 Economic Outlook
FINANCIAL STRATEGYThe fi nancial management of the Bayer Group is conducted by the strategic management hold-ing company Bayer AG. Capital is a global resource, generally procured centrally and distribut-ed within the Group. The foremost objectives of our fi nancial management are to help bring about a sustained increase in corporate value and to ensure the Group’s liquidity and credit-worthiness. This involves optimizing the capital structure and effectively managing risks. The management of currency, interest rate, raw material price and default risks helps to reduce the volatility of our earnings.
The contracted rating agencies assess Bayer as follows:
These credit ratings refl ect the company’s high solvency and ensure access to a broad investor base for fi nancing purposes. It remains our goal to achieve and maintain fi nancial ratios that support an A rating in order to maintain our fi nancial fl exibility. Accordingly, we plan to use part of our operating cash fl ows to reduce net fi nancial debt.
We pursue a prudent debt management strategy to ensure fl exibility, drawing on a balanced fi nanc-ing portfolio. Chief among these resources are a multi-currency Euro Medium Term Notes program, syndicated credit facilities, bilateral loan agreements and a global commercial paper program.
We use fi nancial derivatives to hedge against risks arising from business operations or fi nancial transactions, but do not employ contracts in the absence of an underlying transaction. It is our pol-icy to diminish default risks by selecting trading partners with a high credit standing. We closely monitor the execution of all transactions, which are conducted in accordance with Group directives.
Further details of our risk management objectives and the ways in which we account for all the major types of hedged transactions – along with price, credit and liquidity risks as they relate to the use of fi nancial instruments – are given in Chapter 11.1 “Opportunity and Risk Report.”
11.3 Economic Outlook
GLOBAL ECONOMYWe expect the global economic recovery to continue in 2011. However, the pace of expansion is likely to be slower than in 2010. Many countries will retain expansionary monetary policies that will buoy their economies, while most countries’ fi scal policies are not expected to provide any further growth stimulus. Renewed tension on the fi nancial markets and sharp rises in the prices of oil and raw materials could pose a risk to economic development in 2011. At the end of 2010, however, these downside risks appeared comparatively slight.
Rating [Table 3.40]
Long-term rating Outlook Short-term rating
Standard & Poor’s A- negative A-2
Moody’s A3 stable P-2
Table of ConTenTs
Combined managemenT RepoRT
BAYER ANNUAL REPORT 2010 COMBINED MANAGEMENT REPORT 137
11. Future Perspectives11.3 Economic Outlook
The emerging markets are again expected to greatly stimulate the economic recovery in 2011. We anticipate that growth rates in the emerging markets will decline in the coming months but generally remain at a high level. The major emerging economies, especially China, appear set to continue driving global economic growth in 2011. We expect that the economic recovery in the industrialized countries will continue at a slow pace overall, though with considerable differenc-es from one country to another. The prospects for the u.s. economy brightened considerably around the turn of the year 2010 / 2011, although the anticipated economic expansion is unlikely to signifi cantly improve the situation on the employment market for the time being. Growth per-spectives for Japan are more moderate. The eurozone economy in 2011 is likely to remain weighed down by the debt crisis in some countries. We therefore foresee only moderate growth overall. In the more dynamically performing E.U. countries – especially Germany – the economy should strengthen due to a recovery in domestic demand. In other eurozone countries, however, the consolidation measures triggered by public debt crises will continue to markedly dampen do-mestic demand.
HEALTHCAREWe expect the growth rate for the pharmaceutical market in 2011 to be in the mid-single digits. This expansion is likely to be driven increasingly by countries such as China, Brazil, Mexico, South Korea, India and Russia. However, we foresee only low-single-digit growth rates in the traditional markets such as the United States and the major European countries due to patent expirations for major products of various pharmaceutical companies, a decline in new product launches and the increasing cost pressure being exerted by health organizations.
In 2011 we expect the consumer care market to grow more rapidly than in 2010 as a result of greater market penetration in eastern Europe and North America. The diabetes care market will probably see only very slight growth in 2011 due to continuing pressure on prices in the United States. We expect the animal health market, on the other hand, to again grow at an above-aver-age rate in 2011.
CROPSCIENCEWe foresee a positive trend for the global seed and crop protection market in 2011. Assuming normal weather patterns, we anticipate robust market growth for agrochemicals as well as for seed and traits. This growth is likely to come mainly from higher volumes.
Despite the fl uctuations in global agricultural markets, the substantially higher prices for agricul-tural raw materials mean we are now operating in an increasingly conducive market environment. Given the limited availability of arable land, this is mainly due to steadily rising demand for food and feed products and plant-based energy raw materials.
The positive overall conditions are likely to stimulate demand for high-quality seed and thus for crop protection products, and spur farmers toward more intensive production.
In regional terms, we expect the largest growth stimulus to come from Latin America, where soybean cultivation in particular should further increase compared with 2010. Crop production is also expected to increase in the Asia / Pacifi c region. This applies particularly to rice, cereals and cotton, and also to specialty crops such as fruit and vegetables. By contrast, we again see only limited potential for market growth in the industrialized regions of the northern hemisphere in 2011.
Table of ConTenTs
Combined managemenT RepoRT

BAYER ANNUAL REPORT 2010138 COMBINED MANAGEMENT REPORT
11. Future Perspectives11.4 Sales and Earnings Forecast
MATERIALSCIENCEFor 2011 MaterialScience expects a further strengthening of its main customer industries worldwide. We will focus particularly on the rapidly expanding markets of Asia, such as China and India. At the same time, we are counting on an ongoing recovery in demand in North Amer-ica and Europe.
The automotive industry will remain on a path of recovery. New car sales in 2011 are likely to exceed 60 million – an all-time high. In nearly all markets except western Europe, demand and production are expected to increase considerably faster than experts predicted just a few months ago. China will remain the most important production base worldwide, with automakers planning to step up capacities again in 2012 to 17 million vehicles – more than are made in the entire European Union.
We anticipate robust expansion in the global electrical / electronics industry, where China and India will remain the principal growth drivers in 2011. The industrialized countries will also con-tinue to benefi t from the global economic recovery, however, carrying some of the many orders remaining from 2010 into 2011.
We predict a distinct recovery in the construction industry in 2011. Continuing strong growth in the emerging markets, coupled with a return to positive growth rates in mature markets such as Europe and North America, will likely lead to a gratifying global trend overall.
We believe that the market for the furniture industry will continue to brighten as it already did in 2010. The major growth regions in Asia will probably show a positive trend once again, bene-fi ting not only from rising domestic demand, but also from an increasing recovery in global con-sumption. In the emerging markets of eastern Europe, the Middle East and Latin America, too, an upward trend in incomes should open up added sales potential for the furniture industry.
11.4 Sales and Earnings Forecast
The following forecasts are based on the business performance described in this report, taking into account the potential risks and opportunities.
BAYER GROUPThe Bayer Group is confi dent for 2011. Provided that the economy continues to improve, we expect to see growth in sales and ebitda before special items in all subgroups. For the full year 2011, we are targeting a currency- and portfolio-adjusted sales increase of between 4% and 6%. Based on our currency assumptions – including a rate of us$1.40 (2010 average: us$1.32) to the euro – we therefore expect to report Group sales of between €35 billion and €36 billion.
We aim to increase ebitda before special items toward €7.5 billion. Core earnings per share (calculated as explained in Chapter 4.3) are expected to improve by about 10%. We anticipate taking special charges of about €0.5 billion for ongoing restructuring programs.
We are planning capital expenditures of €1.5 billion for property, plant and equipment and €0.3 billion for intangible assets. Depreciation and amortization are expected to total about €2.5 billion, including €1.3 billion in amortization of intangible assets. We expect our research and development expenditures to match the record level of 2010 (€3.1 billion).
Table of ConTenTs
Combined managemenT RepoRT
BAYER ANNUAL REPORT 2010 COMBINED MANAGEMENT REPORT 139
11. Future Perspectives11.4 Sales and Earnings Forecast
We can confi rm our targets for 2012. If the economic environment remains positive, we con-tinue to expect Bayer Group sales to grow by approximately 5% – after adjusting for currency and portfolio changes – in 2012. We plan to achieve ebitda before special items in 2012 of approximately €8 billion and core earnings per share of around €5.
HEALTHCAREIn 2011 HealthCare plans to increase sales by a low- to mid-single-digit percentage after adjusting for currency and portfolio effects and to achieve a small improvement in ebitda before special items.
In the Pharmaceuticals segment, we do not yet expect sales to resume growing with the market in 2011. We plan to increase sales by a low- to mid-single-digit percentage after adjusting for cur-rency and portfolio effects and to raise the ebitda margin before special items.
In the Consumer Health segment, we anticipate above-market growth in sales after adjusting for currency and portfolio effects. We expect sales and ebitda before special items to increase by mid-single-digit percentages.
In 2012 we aim to accelerate the pace of growth, especially in Pharmaceuticals, thanks to our new products and to improve ebitda before special items in both HealthCare segments.
CROPSCIENCEFollowing a diffi cult year in 2010, we now anticipate more favorable market conditions for Crop-Science and are therefore optimistic for 2011. We expect to improve sales in both CropScience segments on a currency- and portfolio-adjusted basis and to grow by at least a mid-single-digit percentage overall. We intend to further reinforce our market positions in Environmental Science, BioScience, and we expect to at least maintain our existing position in Crop Protection. We plan to expand ebitda before special items at a higher rate than sales.
In 2012 we again aim to grow sales at least with the market and further improve ebitda before special items.
MATERIALSCIENCEWe expect that the business environment for MaterialScience will continue to recover. Against this background we plan to raise sales in 2011 by a mid-single-digit percentage on a currency- and portfolio-adjusted basis, and to increase ebitda before special items at a higher rate than sales.
We expect sales in the fi rst quarter of 2011 to be roughly in line with the fourth quarter of 2010 on a currency- and portfolio-adjusted basis. Despite higher raw material prices, we expect ebitda before special items in the fi rst quarter of 2011 to exceed the level of the fourth quarter of 2010.
Provided that the market environment remains favorable, we plan to further increase sales and ebitda before special items in 2012.
BAYER AGAs the holding company for the Bayer Group, Bayer AG derives most of its income from its subsidiaries. Under profi t and loss transfer agreements with the major operating subsidiaries in Germany, their earnings are transferred directly to Bayer AG. The positive expectations for the Group’s business development outlined above are also likely to be refl ected in the earnings of Bayer AG. In addition, the net interest position should continue to improve in light of the reduc-tion in fi nancial debt. We therefore expect to maintain a level of after-tax income that allows the payment of an appropriate dividend.
Table of ConTenTs
Combined managemenT RepoRT
Consolidated Financial Statements of the Bayer Group
Bayer Group Consolidated Income Statements........... 142
Bayer Group Consolidated Statements of Comprehensive Income ....................................... 143
Bayer Group Consolidated Statements of Financial Position ............................................... 144
Bayer Group Consolidated Statements of Cash Flows......................................................... 145
Bayer Group Consolidated Statements of Changes in Equity................................................ 146
Notes to the Consolidated Financial Statements of the Bayer Group................................. 148
1. Key data by segment and region............................. 148
2. General information............................................ 150
3. Effects of new accounting pronouncements.............. 150
4. Basic principles, methods and critical accounting estimates................................. 153
5. Segment reporting.............................................. 169
6. Scope of consolidation; subsidiaries and affiliates...... 172
6.1. Changes.in.the.scope.of.consolidation ...................... 172
6.2. Business.combinations.and.other.acquisitions............. 183
6.3. Divestitures........................................................ 186
Notes to the Income Statements
7. Net sales .......................................................... 187
8. Selling expenses ................................................ 187
9. Research and development expenses...................... 187
10. Other operating income....................................... 188
11. Other operating expenses..................................... 188
12. Personnel expenses and employee numbers............. 189
13. Non-operating result........................................... 190
13.1...Income.(loss).from.investments..
in.affiliated.companies........................................... 190
13.2.Net.interest.expense............................................. 191
13.3.Other.non-operating.income.and.expenses................. 191
14. Income taxes..................................................... 192
15. Income / losses attributable to non-controlling interest ....................................... 195
16. Earnings per share.............................................. 195
For direct access to a chapter, simply click on its name.
Notes to the Statements of Financial Position
17. Goodwill and other intangible assets....................... 196
18. Property, plant and equipment............................... 203
19. Investments accounted for using the equity method.................................................... 206
20. Other financial assets.......................................... 207
21. Inventories........................................................ 208
22. Trade accounts receivable..................................... 208
23. Other receivables ............................................... 209
24. Equity.............................................................. 210
25. Provisions for pensions and other post-employment benefits............................. 213
26. Other provisions ................................................222
26.1..Taxes................................................................223
26.2.Environmental.protection......................................223
26.3.Restructuring.....................................................223
26.4..Trade-related.commitments.................................... 224
26.5.Litigations......................................................... 224
26.6..Personnel.commitments........................................ 224
26.7..Miscellaneous .................................................... 226
27. Financial liabilities.............................................. 227
28. Trade accounts payable........................................230
29. Other liabilities...................................................230
30. Financial instruments.......................................... 231
30.1..Information.on.financial.instruments..
. by.category........................................................ 231
30.2.Maturity.analysis.................................................235
30.3.Information.on.derivatives......................................238
31. Contingencies and other financial commitments ....................................................240
32. Legal risks........................................................ 241
Notes to the Statements of Cash Flows
33. Net cash provided by (used in) operating activities.....248
34. Net cash provided by (used in) investing activities.....248
35. Net cash provided by (used in) financing activities..... 249
36. Cash and cash equivalents.................................... 249
Other Information
37. Audit fees..........................................................250
38. Related parties...................................................250
39. Total compensation of the Board of Management and the Supervisory Board and loans...................... 251
BAyER ANNuAL REPORT 2010 CONSOLIdATEd FINANCIAL STATEMENTS 141TaBLE.Of.CONTENTs
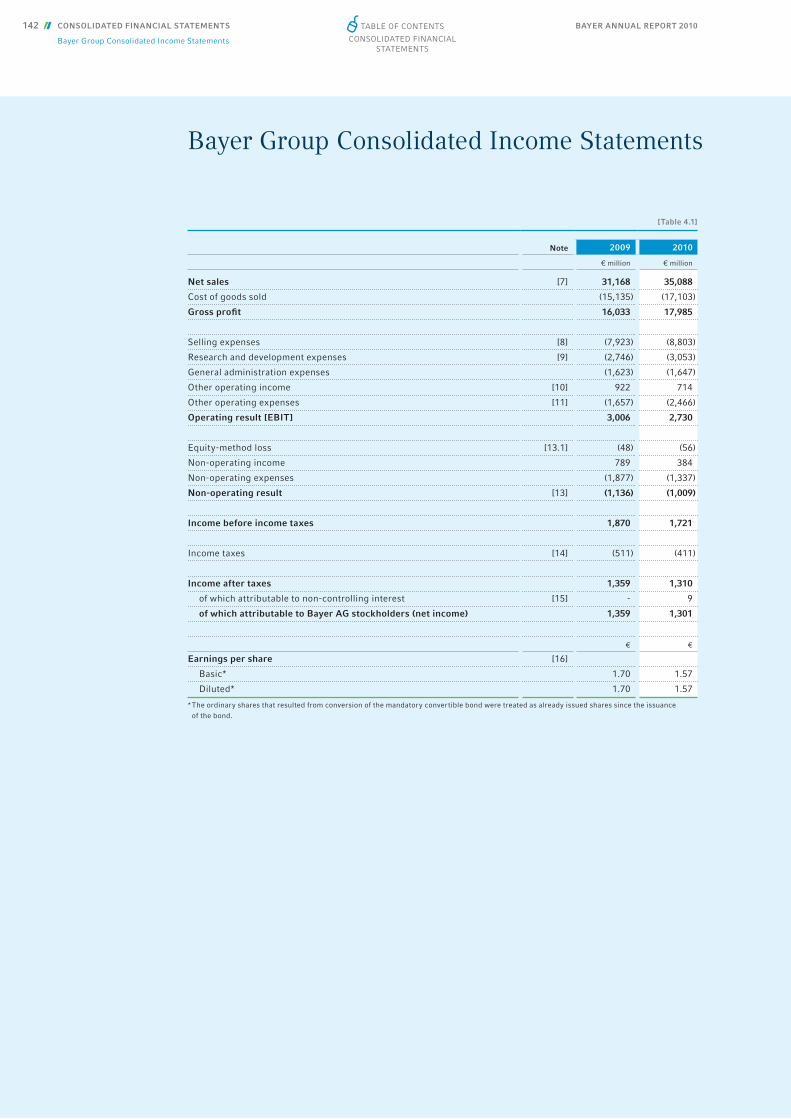
BAYER ANNUAL REPORT 2010142 CONSOLIDATED FINANCIAL STATEMENTS
Bayer Group Consolidated Income Statements
Bayer Group Consolidated Income Statements
[Table 4.1]
Note 2009 2010
€ million € million
Net sales [7] 31,168 35,088
Cost of goods sold (15,135) (17,103)
Gross profi t 16,033 17,985
Selling expenses [8] (7,923) (8,803)
Research and development expenses [9] (2,746) (3,053)
General administration expenses (1,623) (1,647)
Other operating income [10] 922 714
Other operating expenses [11] (1,657) (2,466)
Operating result [EBIT] 3,006 2,730
Equity-method loss [13.1] (48) (56)
Non-operating income 789 384
Non-operating expenses (1,877) (1,337)
Non-operating result [13] (1,136) (1,009)
Income before income taxes 1,870 1,721
Income taxes [14] (511) (411)
Income after taxes 1,359 1,310
of which attributable to non-controlling interest [15] - 9
of which attributable to Bayer AG stockholders (net income) 1,359 1,301
€ €
Earnings per share [16]
Basic* 1.70 1.57
Diluted* 1.70 1.57
* The ordinary shares that resulted from conversion of the mandatory convertible bond were treated as already issued shares since the issuance of the bond.
Table of ConTenTs
ConsolidaTed finanCial sTaTemenTs
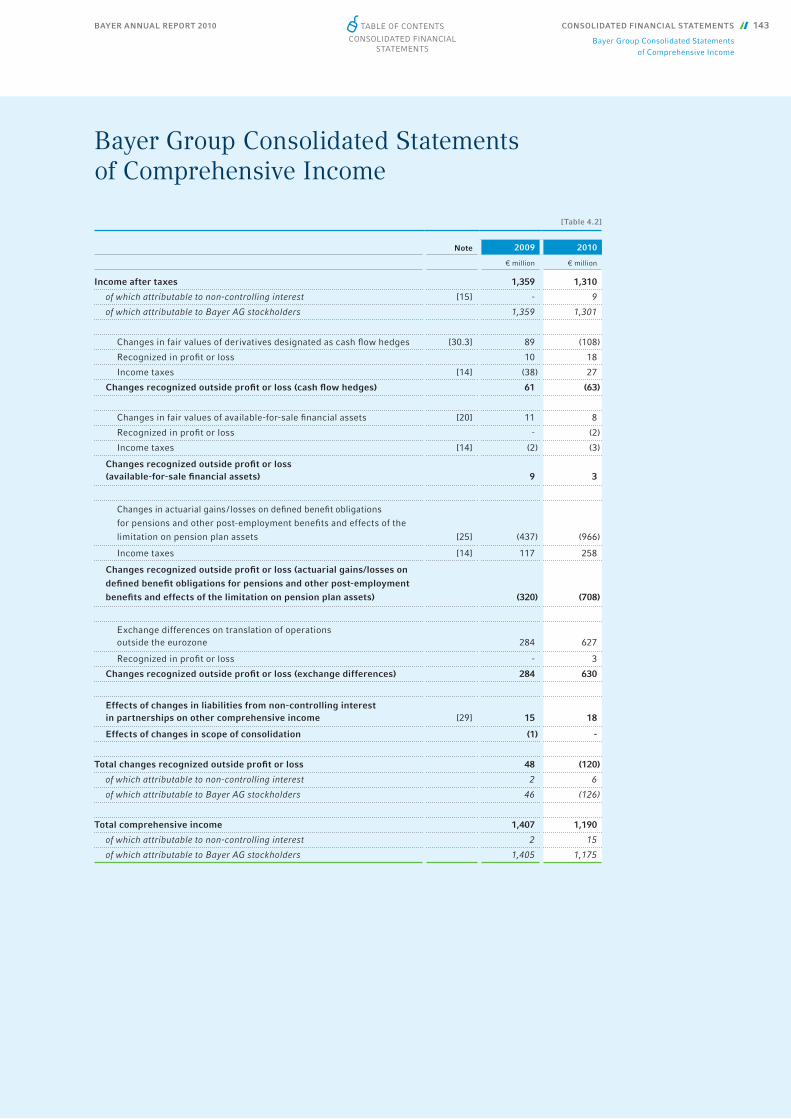
BAYER ANNUAL REPORT 2010 CONSOLIDATED FINANCIAL STATEMENTS 143
Bayer Group Consolidated Statementsof Comprehensive Income
Bayer Group Consolidated Statementsof Comprehensive Income
[Table 4.2]
Note 2009 2010
€ million € million
Income after taxes 1,359 1,310
of which attributable to non-controlling interest [15] - 9
of which attributable to Bayer AG stockholders 1,359 1,301
Changes in fair values of derivatives designated as cash fl ow hedges [30.3] 89 (108)
Recognized in profi t or loss 10 18
Income taxes [14] (38) 27
Changes recognized outside profi t or loss (cash fl ow hedges) 61 (63)
Changes in fair values of available-for-sale fi nancial assets [20] 11 8
Recognized in profi t or loss - (2)
Income taxes [14] (2) (3)
Changes recognized outside profi t or loss (available-for-sale fi nancial assets)
9 3
Changes in actuarial gains / losses on defi ned benefi t obligations
for pensions and other post-employment benefi ts and effects of the
limitation on pension plan assets [25] (437) (966)
Income taxes [14] 117 258
Changes recognized outside profi t or loss (actuarial gains/losses on defi ned benefi t obligations for pensions and other post-employment benefi ts and effects of the limitation on pension plan assets) (320) (708)
Exchange differences on translation of operations outside the eurozone
284 627
Recognized in profi t or loss - 3
Changes recognized outside profi t or loss (exchange differences) 284 630
Effects of changes in liabilities from non-controlling interest in partnerships on other comprehensive income [29] 15 18
Effects of changes in scope of consolidation (1) -
Total changes recognized outside profi t or loss 48 (120)
of which attributable to non-controlling interest 2 6
of which attributable to Bayer AG stockholders 46 (126)
Total comprehensive income 1,407 1,190
of which attributable to non-controlling interest 2 15
of which attributable to Bayer AG stockholders 1,405 1,175
Table of ConTenTs
ConsolidaTed finanCial sTaTemenTs

BAYER ANNUAL REPORT 2010144 CONSOLIDATED FINANCIAL STATEMENTS
Bayer Group Consolidated Statementsof Financial Position
Bayer Group Consolidated Statementsof Financial Position
[Table 4.3]
Note
Dec. 31, 2009
Dec. 31, 2010
€ million € million
Noncurrent assets
Goodwill [17] 8,704 9,002
Other intangible assets [17] 12,842 11,161
Property, plant and equipment [18] 9,409 9,835
Investments accounted for using the equity method [19] 395 354
Other fi nancial assets [20] 1,200 1,164
Other receivables [23] 549 498
Deferred taxes [14] 950 1,174
34,049 33,188
Current assets
Inventories [21] 6,091 6,104
Trade accounts receivable [22] 6,106 6,668
Other fi nancial assets [20] 367 1,008
Other receivables [23] 1,357 1,336
Claims for income tax refunds 347 362
Cash and cash equivalents [36] 2,725 2,840
16,993 18,318
Total assets 51,042 51,506
Equity [24]
Capital stock of Bayer AG 2,117 2,117
Capital reserves of Bayer AG 6,167 6,167
Other reserves 10,613 10,549
Equity attributable to Bayer AG stockholders 18,897 18,833
Equity attributable to non-controlling interest 54 63
18,951 18,896
Noncurrent liabilities
Provisions for pensions and other post-employment benefi ts [25] 6,517 7,305
Other provisions [26] 1,516 1,478
Financial liabilities [27] 11,460 9,944
Other liabilities [29] 415 471
Deferred taxes [14] 3,210 2,577
23,118 21,775
Current liabilities
Other provisions [26] 3,089 3,870
Financial liabilities [27] 1,489 1,889
Trade accounts payable [28] 2,735 3,497
Income tax liabilities [26.1] 93 62
Other liabilities [29] 1,567 1,517
8,973 10,835
Total equity and liabilities 51,042 51,506
Statement of Financial Position Jan. 1, 2010 restated, see Note [4]
Table of ConTenTs
ConsolidaTed finanCial sTaTemenTs

BAYER ANNUAL REPORT 2010 CONSOLIDATED FINANCIAL STATEMENTS 145
Bayer Group Consolidated Statementsof Cash Flows
Bayer Group Consolidated Statementsof Cash Flows
[Table 4.4]
Note 2009 2010
€ million € million
Income after taxes 1,359 1,310
Income taxes 511 411
Non-operating result 1,136 1,009
Income taxes paid or accrued (636) (897)
Depreciation and amortization 2,809 3,556
Change in pension provisions (366) (590)
(Gains) losses on retirements of noncurrent assets (155) (28)
Gross cash fl ow 4,658 4,771
Decrease (increase) in inventories 604 211
Decrease (increase) in trade accounts receivable (28) (153)
(Decrease) increase in trade accounts payable 235 566
Changes in other working capital, other non-cash items (94) 378
Net cash provided by (used in) operating activities (net cash fl ow) [33] 5,375 5,773
Cash outfl ows for additions to property, plant, equipment and intangible assets
(1,575) (1,514)
Cash infl ows from sales of property, plant, equipment and other assets 98 61
Cash infl ows from (outfl ows for) divestitures 70 101
Cash infl ows from (outfl ows for) noncurrent fi nancial assets 169 (461)
Cash outfl ows for acquisitions less acquired cash (308) (31)
Interest and dividends received 56 53
Cash infl ows from (outfl ows for) current fi nancial assets (11) (623)
Net cash provided by (used in) investing activities [34] (1,501) (2,414)
Dividend payments and withholding tax on dividends (973) (1,160)
Issuances of debt 2,798 965
Retirements of debt (4,240) (2,509)
Interest paid including interest rate swaps (1,206) (915)
Interest received from interest rate swaps 421 398
Cash outfl ows for the purchase of additional interests in subsidiaries (46) (9)
Net cash provided by (used in) fi nancing activities [35] (3,246) (3,230)
Change in cash and cash equivalents due to business activities 628 129
Cash and cash equivalents at beginning of year 2,094 2,725
Change in cash and cash equivalents due to changes in scope of consolidation 3 -
Change in cash and cash equivalents due to exchange rate movements - (14)
Cash and cash equivalents at end of year [36] 2,725 2,840
2009 fi gures restated
Table of ConTenTs
ConsolidaTed finanCial sTaTemenTs
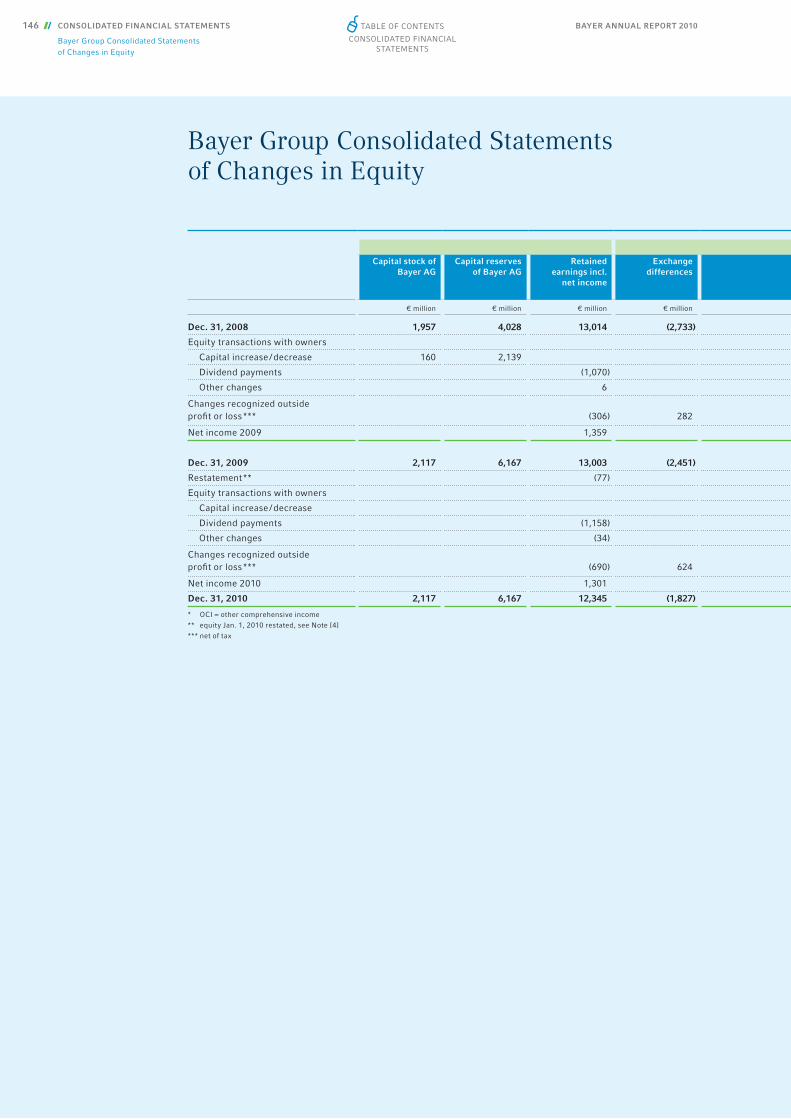
BAYER ANNUAL REPORT 2010146 CONSOLIDATED FINANCIAL STATEMENTS
Bayer Group Consolidated Statementsof Changes in Equity
Bayer Group Consolidated Statementsof Changes in Equity
Capital stock of Bayer AG
Capital reserves of Bayer AG
Retained earnings incl.
net income
Exchange differences
€ million € million € million € million
Dec. 31, 2008 1,957 4,028 13,014 (2,733)
Equity transactions with owners
Capital increase / decrease 160 2,139
Dividend payments (1,070)
Other changes 6
Changes recognized outside profi t or loss *** (306) 282
Net income 2009 1,359
Dec. 31, 2009 2,117 6,167 13,003 (2,451)
Restatement ** (77)
Equity transactions with owners
Capital increase / decrease
Dividend payments (1,158)
Other changes (34)
Changes recognized outside profi t or loss *** (690) 624
Net income 2010 1,301
Dec. 31, 2010 2,117 6,167 12,345 (1,827)
* OCI = other comprehensive income** equity Jan. 1, 2010 restated, see Note [4]*** net of tax
Table of ConTenTs
ConsolidaTed finanCial sTaTemenTs
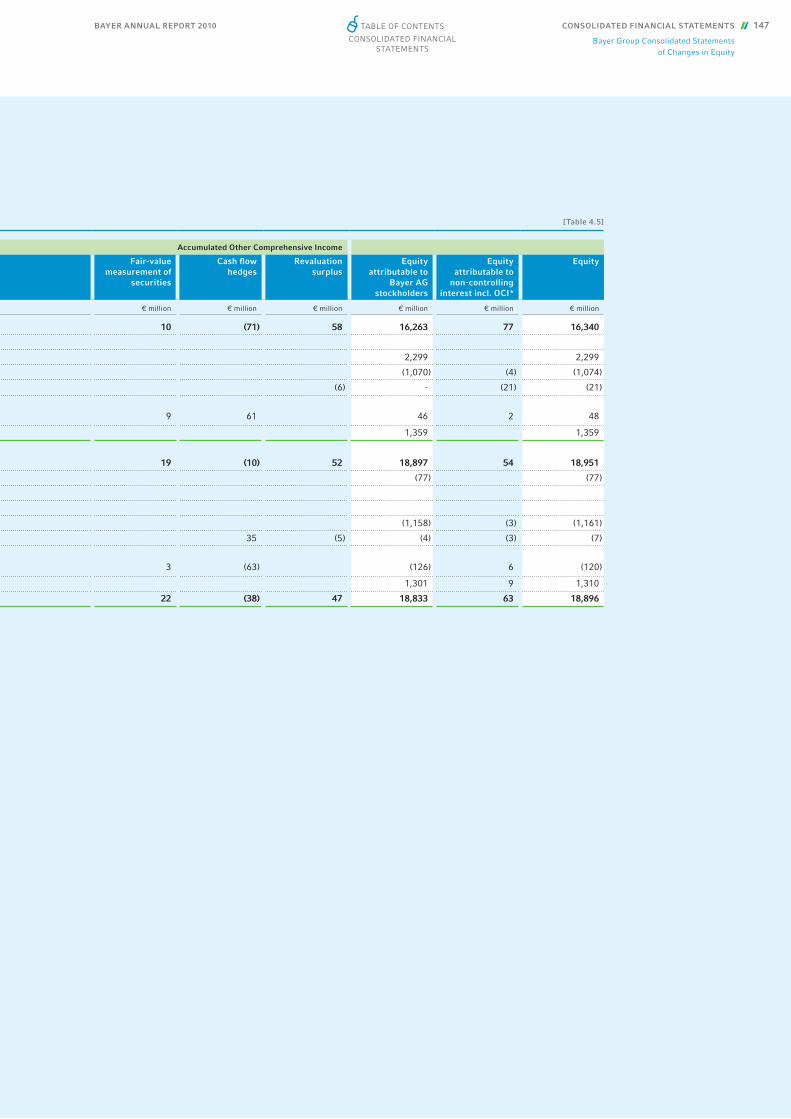
BAYER ANNUAL REPORT 2010 CONSOLIDATED FINANCIAL STATEMENTS 147
Bayer Group Consolidated Statementsof Changes in Equity
[Table 4.5]
Accumulated Other Comprehensive Income
Fair-value measurement of
securities
Cash fl ow hedges
Revaluation surplus
Equity attributable to
Bayer AG stockholders
Equity attributable to
non-controlling interest incl. OCI*
Equity
€ million € million € million € million € million € million
10 (71) 58 16,263 77 16,340
2,299 2,299
(1,070) (4) (1,074)
(6) - (21) (21)
9 61 46 2 48
1,359 1,359
19 (10) 52 18,897 54 18,951
(77) (77)
(1,158) (3) (1,161)
35 (5) (4) (3) (7)
3 (63) (126) 6 (120)
1,301 9 1,310
22 (38) 47 18,833 63 18,896
Table of ConTenTs
ConsolidaTed finanCial sTaTemenTs
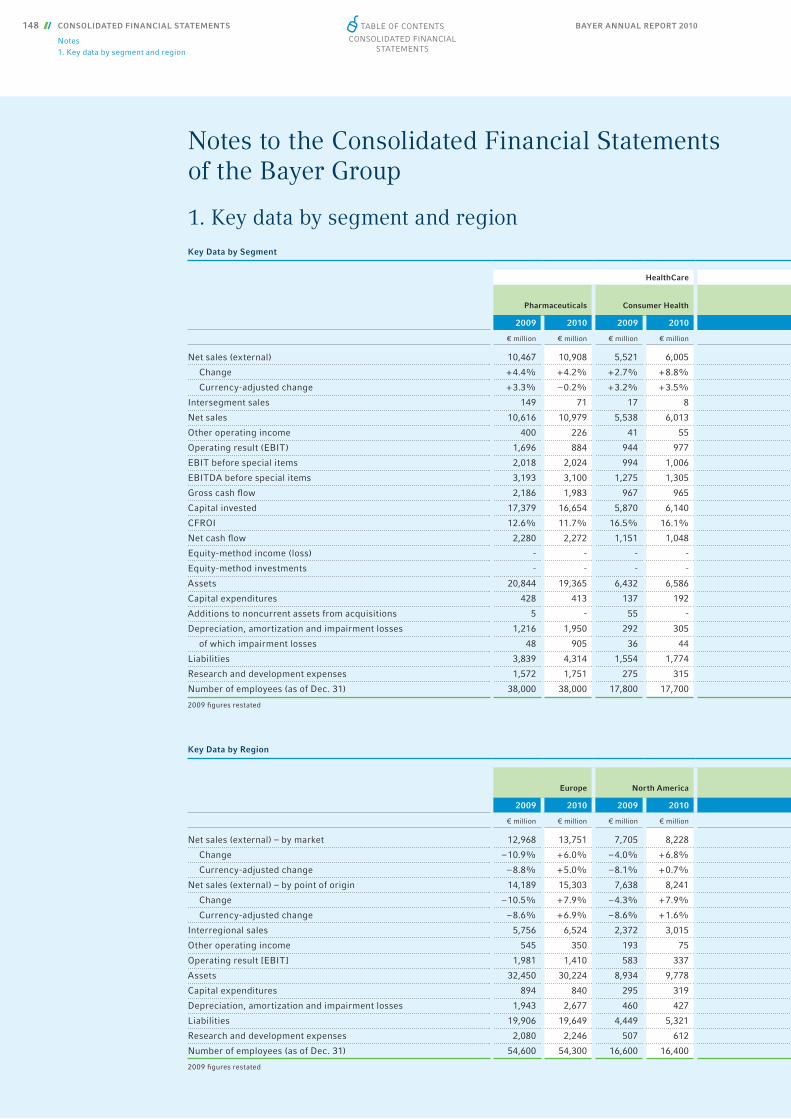
BAYER ANNUAL REPORT 2010148 CONSOLIDATED FINANCIAL STATEMENTS
Notes1. Key data by segment and region
Notes to the Consolidated Financial Statementsof the Bayer Group
1. Key data by segment and regionKey Data by Segment
HealthCare
Pharmaceuticals Consumer Health
2009 2010 2009 2010
€ million € million € million € million
Net sales (external) 10,467 10,908 5,521 6,005
Change + 4.4% + 4.2% + 2.7% + 8.8%
Currency-adjusted change + 3.3% – 0.2% + 3.2% + 3.5%
Intersegment sales 149 71 17 8
Net sales 10,616 10,979 5,538 6,013
Other operating income 400 226 41 55
Operating result (EBIT) 1,696 884 944 977
EBIT before special items 2,018 2,024 994 1,006
EBITDA before special items 3,193 3,100 1,275 1,305
Gross cash fl ow 2,186 1,983 967 965
Capital invested 17,379 16,654 5,870 6,140
CFROI 12.6% 11.7% 16.5% 16.1%
Net cash fl ow 2,280 2,272 1,151 1,048
Equity-method income (loss) - - - -
Equity-method investments - - - -
Assets 20,844 19,365 6,432 6,586
Capital expenditures 428 413 137 192
Additions to noncurrent assets from acquisitions 5 - 55 -
Depreciation, amortization and impairment losses 1,216 1,950 292 305
of which impairment losses 48 905 36 44
Liabilities 3,839 4,314 1,554 1,774
Research and development expenses 1,572 1,751 275 315
Number of employees (as of Dec. 31) 38,000 38,000 17,800 17,700
2009 fi gures restated
Key Data by Region
Europe North America
2009 2010 2009 2010
€ million € million € million € million
Net sales (external) – by market 12,968 13,751 7,705 8,228
Change – 10.9% + 6.0% – 4.0% + 6.8%
Currency-adjusted change – 8.8% + 5.0% – 8.1% + 0.7%
Net sales (external) – by point of origin 14,189 15,303 7,638 8,241
Change – 10.5% + 7.9% – 4.3% + 7.9%
Currency-adjusted change – 8.6% + 6.9% – 8.6% + 1.6%
Interregional sales 5,756 6,524 2,372 3,015
Other operating income 545 350 193 75
Operating result [EBIT] 1,981 1,410 583 337
Assets 32,450 30,224 8,934 9,778
Capital expenditures 894 840 295 319
Depreciation, amortization and impairment losses 1,943 2,677 460 427
Liabilities 19,906 19,649 4,449 5,321
Research and development expenses 2,080 2,246 507 612
Number of employees (as of Dec. 31) 54,600 54,300 16,600 16,400
2009 fi gures restated
Table of ConTenTs
ConsolidaTed finanCial sTaTemenTs

BAYER ANNUAL REPORT 2010 CONSOLIDATED FINANCIAL STATEMENTS 149
Notes1. Key data by segment and region
[Table 4.6]
CropScience MaterialScience Reconciliation
Crop ProtectionEnvironmental Science,
BioScience MaterialScience All Other SegmentsCorporate Center and
Consolidation Group
2009 2010 2009 2010 2009 2010 2009 2010 2009 2010 2009 2010
€ million € million € million € million € million € million € million € million € million € million € million € million
5,424 5,493 1,086 1,337 7,520 10,154 1,139 1,180 11 11 31,168 35,088
+ 1.6% + 1.3% + 4.1% + 23.1% – 22.8% + 35.0% – 17.5% + 3.6% - - – 5.3% + 12.6%
+ 2.3% – 4.7% + 4.1% + 16.5% – 24.4% + 30.1% – 17.4% + 2.5% - - – 5.9% + 7.7%
40 44 12 10 55 64 1,647 1,730 (1,920) (1,927) - -
5,464 5,537 1,098 1,347 7,575 10,218 2,786 2,910 (1,909) (1,916) 31,168 35,088
187 239 19 36 88 101 37 23 150 34 922 714
713 600 85 (339) (266) 780 32 47 (198) (219) 3,006 2,730
875 600 142 187 (126) 780 63 47 (194) (192) 3,772 4,452
1,301 1,025 207 268 446 1,356 189 188 (139) (141) 6,472 7,101
924 743 119 (197) 319 1,058 241 307 (98) (88) 4,658 4,771
7,633 7,395 1,754 1,595 9,202 9,976 587 623 1,269 1,167 43,694 43,550
12.6% 9.9% 7.2% (11.8)% 3.4% 11.0% - - - - 10.7% 10.9%
591 1,079 154 320 849 763 261 356 89 (65) 5,375 5,773
- - - - (48) (56) - - - - (48) (56)
- - - - 395 354 - - - - 395 354
7,383 7,220 1,978 2,183 7,291 8,005 1,170 1,156 5,944 6,991 51,042 51,506
282 274 64 92 512 505 206 140 40 5 1,669 1,621
12 - 351 2 28 31 4 1 - - 455 34
448 425 65 81 607 576 126 141 55 78 2,809 3,556
21 1 1 - 41 7 2 1 - 27 149 985
2,388 2,675 598 1,111 1,947 2,285 1,969 2,214 19,796 18,237 32,091 32,610
482 476 171 246 207 231 34 34 5 - 2,746 3,053
16,900 16,900 3,600 3,800 14,600 14,700 19,400 19,600 700 700 111,000 111,400
[Table 4.7]
Asia / Pacifi cLatin America /
Africa / Middle East Reconciliation Total
2009 2010 2009 2010 2009 2010 2009 2010
€ million € million € million € million € million € million € million € million
5,712 7,481 4,783 5,628 - - 31,168 35,088
+ 6.1% + 31.0% – 3.5% + 17.7% - - – 5.3% + 12.6%
+ 0.3% + 19.3% – 0.6% + 12.5% - - – 5.9% + 7.7%
5,486 7,118 3,855 4,426 - - 31,168 35,088
+ 5.8% + 29.7% – 1.3% + 14.8% - - – 5.3% + 12.6%
– 0.1% + 17.6% + 2.6% + 8.6% - - – 5.9% + 7.7%
334 462 360 414 (8,822) (10,415) - -
53 79 131 210 - - 922 714
367 807 273 395 (198) (219) 3,006 2,730
5,255 6,367 3,246 3,729 1,157 1,408 51,042 51,506
357 336 123 126 - - 1,669 1,621
268 294 83 80 55 78 2,809 3,556
3,288 3,655 1,239 1,390 3,209 2,595 32,091 32,610
131 160 28 35 - - 2,746 3,053
23,000 24,600 16,800 16,100 - - 111,000 111,400
Table of ConTenTs
ConsolidaTed finanCial sTaTemenTs

BAYER ANNUAL REPORT 2010150 CONSOLIDATED FINANCIAL STATEMENTS
Notes2. General information
2. General informationThe consolidated fi nancial statements of the Bayer Group as of December 31, 2010, were pre-pared by Bayer AG according to the International Financial Reporting Standards (ifrs) issued by the International Accounting Standards Board (iasb), London, as endorsed by the European Union and in effect at the closing date; the Interpretations of the ifrs Interpretations Committee; and the applicable further requirements of Section 315a of the German Commercial Code.
Bayer Aktiengesellschaft (Bayer AG) is a global enterprise based in Germany. Its registered offi ce is at Kaiser-Wilhelm-Allee 1, 51368 Leverkusen. Its material business activities in the fi elds of health care, nutrition and high-tech materials take place in the HealthCare, CropScience and MaterialScience subgroups, respectively. The activities of the various segments are outlined in Note [5].
A Declaration of Compliance with the German Corporate Governance Code has been issued pursuant to Section 161 of the German Stock Corporation Act and made available to stockholders.
The Board of Management of Bayer AG prepared the consolidated fi nancial statements of the Bayer Group on February 15, 2011. They were discussed by the Audit Committee of the Super-visory Board of Bayer AG at its meeting on February 24, 2011, and approved by the Supervisory Board at its plenary meeting the same day.
In the income statement and statement of comprehensive income, statement of fi nancial position, statement of cash fl ows and statement of changes in equity, certain items are combined for the sake of clarity. These are explained in the Notes. The income statement is prepared using the cost-of-sales method. Assets and liabilities are classifi ed by maturity. They are regarded as cur-rent if they mature within one year or within the normal business cycle of the company or the Group, or are held for sale. The normal business cycle is defi ned for this purpose as beginning with the procurement of the resources necessary for the production process and ending with the receipt of cash or cash equivalents as consideration for the sale of the goods or services produced in that process. Trade accounts receivable and payable and inventories are always presented as current items, deferred tax assets and liabilities and pension provisions as noncurrent items.
The consolidated fi nancial statements of the Bayer Group are drawn up in euros. Amounts are stated in millions of euros (€ million) except where otherwise indicated. In some cases, the sum of the fi gures given in this report may not precisely equal the stated totals and percentages may not be exact due to rounding.
The fi nancial statements of the individual consolidated companies are prepared as of the closing date of the Group fi nancial statements.
3. Effects of new accounting pronouncementsACCOUNTING STANDARDS APPLIED FOR THE FIRST TIME IN 2010In 2010, the following accounting standards and interpretations were applied for the fi rst time. These new standards had no impact, or no material impact, on the presentation of the Group’s fi nancial position or results of operations, or on earnings per share.
In January 2008, the iasb published the revised standards ifrs 3 (Business Combinations) and ias 27 (Consolidated and Separate Financial Statements). Signifi cant changes required by ifrs 3 (revised 2008) include:
Table of ConTenTs
ConsolidaTed finanCial sTaTemenTs
BAYER ANNUAL REPORT 2010 CONSOLIDATED FINANCIAL STATEMENTS 151
Notes3. Effects of new accounting pronouncements
• In future, a non-controlling interest may be measured either at fair value (i. e. including goodwill) or at the proportionate share of the identifi able net assets of the entity in which the non-controlling interest is held.
• In the case of a step acquisition, the acquirer must remeasure its previously held interest at fair value on the date on which it gains control of the acquiree and recognize the resulting gain or loss in income. The difference between the (remeasured) carrying amount of the interest in the subsidiary and the acquirer’s remeasured proportionate share of the net assets of the subsid-iary must be recognized as goodwill.
• Liabilities recognized as of the acquisition date for the purpose of future purchase price adjust-ments in light of future events can no longer be offset against goodwill in subsequent periods.
• Ancillary acquisition costs must be recognized in income.
The principal changes required by ias 27 (revised 2008) are:
• A reduction in the equity interest held in a subsidiary that does not result in a loss of control by the parent is to be accounted for in future as an equity transaction outside profi t or loss.
• If a reduction in the equity interest held in a subsidiary involves a loss of control, the assets and liabilities of the subsidiary must be derecognized in their entirety. The remaining interest in the company is to be recognized at fair value. The difference between the remaining carry-ing amounts and the fair values must be recognized in income.
• Non-controlling interests that become negative due to incurred losses must be recognized at their net negative amounts.
The amendments to ias 39 (Financial Instruments: Recognition and Measurement) issued in July 2008 deal with one-sided risk hedging using options and with infl ation hedging. They clarify the circumstances in which a hedged risk or portion of cash fl ows is eligible for hedge accounting.
In April 2009 the iasb issued amendments to a number of standards as part of its annual project “Improvements to ifrss.“ The amendments address details of the recognition, measurement and disclosure of business transactions and serve to standardize terminology. They consist mainly of editorial changes to existing standards. As part of the project, ias 17 (Leases) was amended to the effect that land leases (such as herit able building rights) must be assessed according to the gen-eral leasing criteria and may have to be capitalized by the lessee. The previous assumption that a land lease is normally to be classifi ed as an operating lease was abolished.
In June 2009 amendments were issued to ifrs 2 (Share-based Payment) that clarify the accounting for group cash-settled share-based payment transactions. The amendments specify how an individual subsidiary in a group should account for certain share-based payment arrangements in its own fi nancial statements, and also incorporate the rules previously included in ifric 8 (Scope of ifrs 2) and ifric 11 (ifrs 2 – Group and Treasury Share Transactions).
ifric 17 (Distributions of Non-cash Assets to Owners) was issued in November 2008. The interpre-tation addresses the recognition and measurement of liabilities related to non-cash dividends. It clarifi es when an obligation to distribute a non-cash dividend is to be recognized, that it must be measured at fair value, and that the difference between the obligation to distribute and the carrying amount of the net assets distributed must be recognized in profi t or loss at the distribution date.
Table of ConTenTs
ConsolidaTed finanCial sTaTemenTs

BAYER ANNUAL REPORT 2010152 CONSOLIDATED FINANCIAL STATEMENTS
Notes3. Effects of new accounting pronouncements
PUBLISHED ACCOUNTING STANDARDS THAT HAVE NOT YET BEEN APPLIEDThe iasb and the ifrs Interpretations Committee have issued the following standards, amend-ments to standards, and interpretations whose application was not yet mandatory for the 2010 fi s-cal year and is conditional upon their endorsement by the European Union.
An amendment to ias 32 (Financial Instruments: Presentation) was issued in October 2009. The amendment clarifi es that rights issues, options and warrants denominated in a currency other than the issuer’s functional currency and offered on a pro-rata basis to all owners of the same class of equity must be classifi ed as equity. Such rights issues have so far been accounted for as liabilities. The change relates only to issues of a fi xed number of shares at a fi xed foreign- currency exercise price. The amendment is to be applied for annual periods beginning on or after February 1, 2010. It will not have a material impact on the presentation of the Group’s fi nancial position or results of operations.
In November 2009 the iasb issued the revised standard ias 24 (Related Party Disclosures), which simplifi es the reporting requirements of companies in which a government owns an inter-est. Under the revised standard, certain kinds of related-party transactions resulting from gov-ernment ownership of private companies are exempt from some of the disclosure requirements. In addition, the defi nition of related parties was amended in several respects. The revised stan-dard applies for annual periods beginning on or after January 1, 2011. The changes will not have a material impact on the presentation of the Group’s fi nancial position or results of operations.
In November 2009 the iasb issued ifrs 9 (Financial Instruments), which addresses the classifi ca-tion and measurement of fi nancial assets. Publication of ifrs 9 marks the completion of the fi rst part of a three-part project to completely revise the accounting treatment of fi nancial instru-ments. The new standard defi nes two instead of four measurement categories for fi nancial assets, with classifi cation to be based partly on the company’s business model and partly on the charac-teristics of the contractual cash fl ows from the respective fi nancial asset. An embedded derivative in a structured product will no longer have to be assessed for possible separate accounting treat-ment unless the host is a non-fi nancial contract. A hybrid contract that includes a fi nancial host must be classifi ed and measured in its entirety. Application of ifrs 9 is mandatory for annual peri-ods beginning on or after January 1, 2013. It has not yet been endorsed by the European Union. The new standard will not have a material impact on the presentation of the Group’s fi nancial po-sition or results of operations.
In May 2010 the iasb issued a third collection of amendments as part of its annual project “Improvements to ifrss.“ The amendments address details of the recognition, measurement and disclosure of business transactions and serve to standardize terminology. They consist mainly of editorial changes to existing standards. Some of the amendments are to be applied for annual periods beginning on or after January 1, 2011, and the others for annual periods beginning on or after July 1, 2011. They have not yet been endorsed by the European Union. The changes probably will not have a material impact on the presentation of the Group’s fi nancial position or results of operations.
In October 2010 the iasb published amendments to ifrs 7 (Financial Instruments: Disclosures). These amendments require additional disclosures about transactions that transfer fi nancial as-sets, partly to provide insight into the possible effects of any risks remaining with the transferring entity. Additional disclosures are also required if a disproportionately large number of such trans-actions is undertaken around the end of a reporting period. The changes are to be applied for an-nual periods beginning on or after July 1, 2011. They have not yet been endorsed by the European Union. These changes will not have a material impact on the presentation of the Group’s fi nancial position or results of operations.
Table of ConTenTs
ConsolidaTed finanCial sTaTemenTs

BAYER ANNUAL REPORT 2010 CONSOLIDATED FINANCIAL STATEMENTS 153
Notes4. Basic principles, methods and critical accounting estimates
In December 2010, the iasb issued an amendment to ias 12 (Income Taxes). This amendment in-troduces a rebuttable presumption that the carrying amount of an asset will normally be recov-ered through sale rather than use. The change is particularly relevant in countries where the in-come tax rates on gains from divestments differ from those on regular rental income, for example. In this connection, sic 21 (Income Taxes – Recovery of Revalued Non-Depreciable Assets) was in-tegrated into ias 12 (Income Taxes), except where it related to real estate held as investment property. The revised standard is to be applied retrospectively for annual periods beginning on or after January 1, 2012. The amendments have not yet been endorsed by the European Union. The Bayer Group is currently evaluating the impact that the change will have on the presentation of its fi nancial position and results of operations.
ifric 19 (Extinguishing Financial Liabilities with Equity Instruments) was issued in November 2009. The interpretation addresses the accounting treatment in cases where a company settles all or part of a fi nancial liability by issuing equity instruments to the creditor. It is to be applied for annual periods beginning on or after July 1, 2010. Its impact on the presentation of the Group’s fi nancial position and results of operations will depend on the extent to which fi nancial liabilities are settled with equity instruments in the future.
In November 2009 an amendment was issued to ifric 14 (ias 19 – The Limit on a Defi ned Benefi t Asset, Minimum Funding Requirements and their Interaction), an interpretation of ias 19 (Em-ployee Benefi ts). The amendment applies when a company is subject to minimum pension plan funding requirements. It enables prepayment of the respective contributions to be recognized as an asset. The amendment is to be applied for annual periods beginning on or after January 1, 2011. It will not have a material impact on the presentation of the Group’s fi nancial position or re-sults of operations.
4. Basic principles, methods and critical accounting estimates
The fi nancial statements of the consolidated companies are prepared according to uniform accounting policies and valuation principles.
The consolidated fi nancial statements of the Group are based on the principle of the historical cost of acquisition, construction or production, with the exception of the items refl ected at fair value, such as available-for-sale fi nancial assets and derivatives.
In preparing the consolidated fi nancial statements, the management has to make certain assumptions and estimates that may substantially impact the presentation of the Group’s fi nancial position and / or results of operations.
Such estimates, assumptions or the exercise of discretion mainly relate to the useful life of non-current assets, the discounted cash fl ows used for impairment testing and purchase price alloca-tions, and the recognition of provisions, including those for litigation-related expenses, pensions and other benefi ts, taxes, environmental compliance and remediation costs, sales allowances, product liability and guarantees. Essential estimates and assumptions that may affect reporting in the various item categories of the fi nancial statements are described in the following sections of this note. Estimates are based on historical experience and other assumptions that are considered reasonable under given circumstances. They are continually reviewed but may vary from the actual values.
Table of ConTenTs
ConsolidaTed finanCial sTaTemenTs
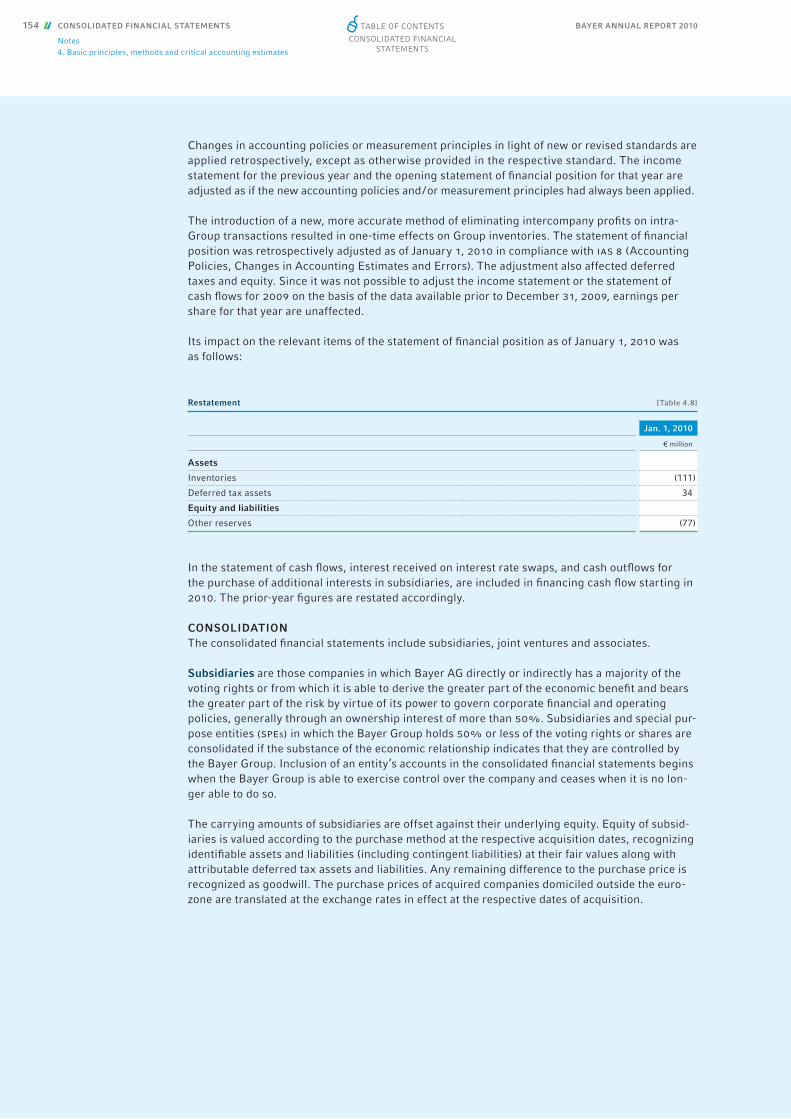
BAYER ANNUAL REPORT 2010154 CONSOLIDATED FINANCIAL STATEMENTS
Notes4. Basic principles, methods and critical accounting estimates
Changes in accounting policies or measurement principles in light of new or revised standards are applied retrospectively, except as otherwise provided in the respective standard. The income statement for the previous year and the opening statement of fi nancial position for that year are adjusted as if the new accounting policies and / or measurement principles had always been applied.
The introduction of a new, more accurate method of eliminating intercompany profi ts on intra-Group transactions resulted in one-time effects on Group inventories. The statement of fi nancial position was retrospectively adjusted as of January 1, 2010 in compliance with ias 8 (Accounting Policies, Changes in Accounting Estimates and Errors). The adjustment also affected deferred taxes and equity. Since it was not possible to adjust the income statement or the statement of cash fl ows for 2009 on the basis of the data available prior to December 31, 2009, earnings per share for that year are unaffected.
Its impact on the relevant items of the statement of fi nancial position as of January 1, 2010 was as follows:
In the statement of cash fl ows, interest received on interest rate swaps, and cash outfl ows for the purchase of additional interests in subsidiaries, are included in fi nancing cash fl ow starting in 2010. The prior-year fi gures are restated accordingly.
CONSOLIDATIONThe consolidated fi nancial statements include subsidiaries, joint ventures and associates.
Subsidiaries are those companies in which Bayer AG directly or indirectly has a majority of the voting rights or from which it is able to derive the greater part of the economic benefi t and bears the greater part of the risk by virtue of its power to govern corporate fi nancial and operating policies, generally through an ownership interest of more than 50%. Subsidiaries and special pur-pose entities (spes) in which the Bayer Group holds 50% or less of the voting rights or shares are consolidated if the substance of the economic relationship indicates that they are controlled by the Bayer Group. Inclusion of an entity’s accounts in the consolidated fi nancial statements begins when the Bayer Group is able to exercise control over the company and ceases when it is no lon-ger able to do so.
The carrying amounts of subsidiaries are offset against their underlying equity. Equity of subsid-iaries is valued according to the purchase method at the respective acquisition dates, recognizing identifi able assets and liabilities (including contingent liabilities) at their fair values along with attributable deferred tax assets and liabilities. Any remaining difference to the purchase price is recognized as goodwill. The purchase prices of acquired companies domiciled outside the euro-zone are translated at the exchange rates in effect at the respective dates of acquisition.
Restatement [Table 4.8]
Jan. 1, 2010
€ million
Assets
Inventories (111)
Deferred tax assets 34
Equity and liabilities
Other reserves (77)
Table of ConTenTs
ConsolidaTed finanCial sTaTemenTs

BAYER ANNUAL REPORT 2010 CONSOLIDATED FINANCIAL STATEMENTS 155
Notes4. Basic principles, methods and critical accounting estimates
The purchase of shares from non-controlling stockholders is presented as an equity transaction. Any amount by which the purchase price of additional interests exceeds the equity attributable to non-controlling stockholders is therefore accounted for as a reduction in equity.
Joint ventures are companies over which the Bayer Group exercises joint control with a third party. A company is generally deemed a joint venture if voting rights are divided equally between two stockholders or the company is established on the basis of a joint venture agree-ment. Joint ventures are included by proportionate consolidation according to the principles followed for subsidiaries.
Associates over which Bayer AG exerts signifi cant infl uence, generally through an ownership interest between 20% and 50%, are accounted for using the equity method. The cost of acquisi-tion of a company accounted for using the equity method is adjusted annually by a percentage of any change in its equity corresponding to Bayer’s percentage interest in the company. Differ-ences arising upon fi rst-time inclusion using the equity method are accounted for according to full-consolidation principles. Bayer’s share of changes in these companies’ equities that are recognized in their income statements – including impairment losses recognized on goodwill – are refl ected in the non-operating result. Intercompany profi ts and losses for these companies were not material in either 2010 or 2009.
Subsidiaries that do not have a material impact on the Group’s fi nancial position or results of operations, either individually or in aggregate, are recognized in the consolidated fi nancial statements at amortized cost.
Profi ts and losses, sales revenues, and income and expenses arising from transactions among the consolidated companies, along with receivables and payables existing between them, are eliminated. Deferred income tax effects are refl ected in consolidation.
FOREIGN CURRENCY TRANSLATIONThe fi nancial statements of the individual companies for inclusion in the consolidated fi nancial statements are prepared in their respective functional currencies. A company’s functional currency is that of the economic environment in which it primarily generates and expends cash. The majority of consolidated companies carry out their activities autonomously from a fi nancial, economic and organizational point of view, and their functional currencies are therefore the respective local currencies.
In the fi nancial statements of the individual consolidated companies, receivables and payables in currencies other than the respective functional currency are translated at closing rates, irrespec-tive of whether they are exchange-hedged. Exchange rate differences from valuation of balances in foreign currencies are recognized in income.
In the consolidated fi nancial statements, the assets and liabilities of companies outside the eurozone at the start and end of the year are translated into euros at closing rates. All changes occurring during the year and all income and expense items and cash fl ows are translated into euros at average monthly rates. Components of stockholders’ equity are translated at the historical exchange rates prevailing at the respective dates of their fi rst-time recognition in Group equity.
The exchange differences arising between the resulting amounts and those obtained by trans-lating at closing rates are reported separately as “Exchange differences on translation of opera-tions outside the eurozone” or as “Exchange differences.” When a company is deconsolidated, such exchange differences are removed from equity and recognized in the income statement.
Table of ConTenTs
ConsolidaTed finanCial sTaTemenTs
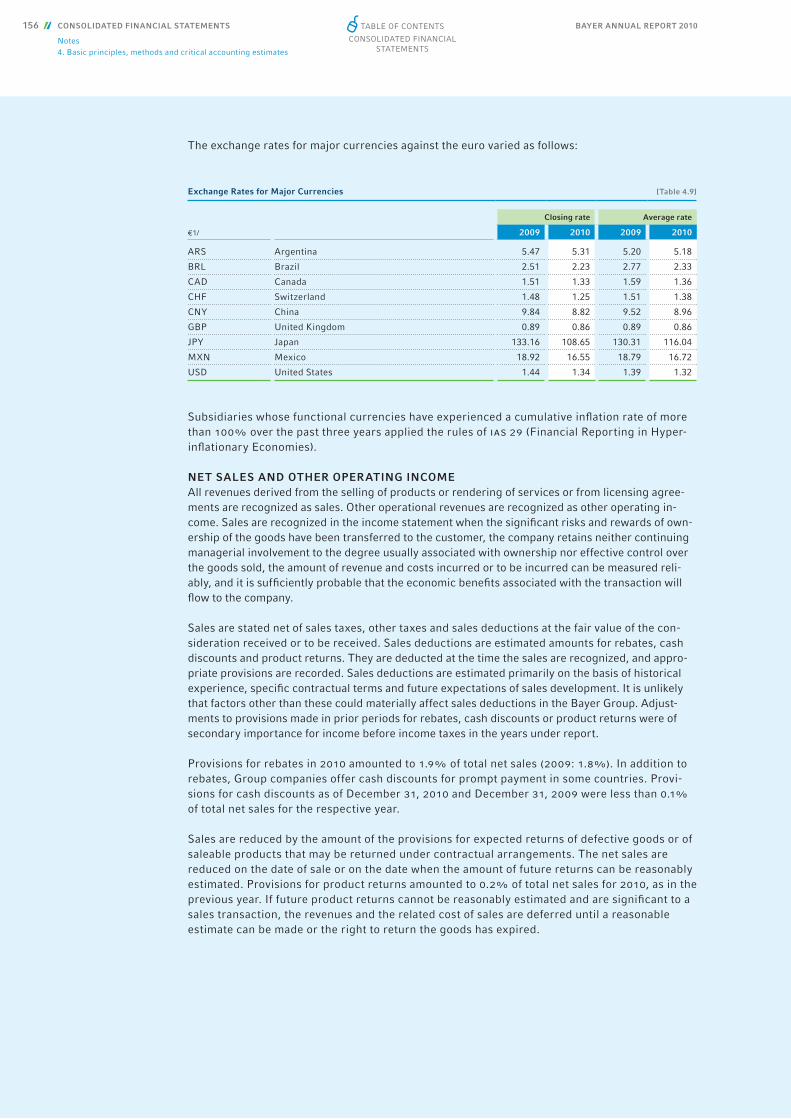
BAYER ANNUAL REPORT 2010156 CONSOLIDATED FINANCIAL STATEMENTS
Notes4. Basic principles, methods and critical accounting estimates
The exchange rates for major currencies against the euro varied as follows:
Subsidiaries whose functional currencies have experienced a cumulative infl ation rate of more than 100% over the past three years applied the rules of ias 29 (Financial Reporting in Hyper-infl ationary Economies).
NET SALES AND OTHER OPERATING INCOMEAll revenues derived from the selling of products or rendering of services or from licensing agree-ments are recognized as sales. Other operational revenues are recognized as other operating in-come. Sales are recognized in the income statement when the signifi cant risks and rewards of own-ership of the goods have been transferred to the customer, the company retains neither continuing managerial involvement to the degree usually associated with ownership nor effective control over the goods sold, the amount of revenue and costs incurred or to be incurred can be measured reli-ably, and it is suffi ciently probable that the economic benefi ts associated with the transaction will fl ow to the company.
Sales are stated net of sales taxes, other taxes and sales deductions at the fair value of the con -sideration received or to be received. Sales deductions are estimated amounts for rebates, cash discounts and product returns. They are deducted at the time the sales are recognized, and appro-priate provisions are recorded. Sales deductions are estimated primarily on the basis of historical experience, specifi c contractual terms and future expectations of sales development. It is unlikely that factors other than these could materially affect sales deductions in the Bayer Group. Adjust-ments to provisions made in prior periods for rebates, cash discounts or product returns were of secondary importance for income before income taxes in the years under report.
Provisions for rebates in 2010 amounted to 1.9% of total net sales (2009: 1.8%). In addition to rebates, Group companies offer cash discounts for prompt payment in some countries. Provi-sions for cash discounts as of December 31, 2010 and December 31, 2009 were less than 0.1% of total net sales for the respective year.
Sales are reduced by the amount of the provisions for expected returns of defective goods or of saleable products that may be returned under contractual arrangements. The net sales are reduced on the date of sale or on the date when the amount of future returns can be reasonably estimated. Provisions for product returns amounted to 0.2% of total net sales for 2010, as in the previous year. If future product returns cannot be reasonably estimated and are signifi cant to a sales transaction, the revenues and the related cost of sales are deferred until a reasonable estimate can be made or the right to return the goods has expired.
Exchange Rates for Major Currencies [Table 4.9]
Closing rate Average rate
€1/ 2009 2010 2009 2010
ARS Argentina 5.47 5.31 5.20 5.18
BRL Brazil 2.51 2.23 2.77 2.33
CAD Canada 1.51 1.33 1.59 1.36
CHF Switzerland 1.48 1.25 1.51 1.38
CNY China 9.84 8.82 9.52 8.96
GBP United Kingdom 0.89 0.86 0.89 0.86
JPY Japan 133.16 108.65 130.31 116.04
MXN Mexico 18.92 16.55 18.79 16.72
USD United States 1.44 1.34 1.39 1.32
Table of ConTenTs
ConsolidaTed finanCial sTaTemenTs

BAYER ANNUAL REPORT 2010 CONSOLIDATED FINANCIAL STATEMENTS 157
Notes4. Basic principles, methods and critical accounting estimates
Some of the Bayer Group’s revenues are generated on the basis of licensing agreements under which third parties are granted rights to products and technologies. Payments received, or expected to be received, that relate to the sale or outlicensing of technologies or technological expertise are recognized in income as of the effective date of the respective agreement if all rights relating to the technologies and all obligations resulting from them have been relinquished under the contract terms. However, if rights to the technologies continue to exist or obligations resulting from them have yet to be fulfi lled, the payments received are deferred accordingly. Upfront payments and similar non-refundable payments received under these agreements are recorded as other liabilities and recognized in income over the estimated performance period stipulated in the agreement.
License or research and development collaboration agreements may consist of multiple elements and provide for varying consideration terms, such as upfront payments and milestone or similar payments. They therefore have to be assessed to determine whether sales revenues should be recognized for individually delivered elements of such arrangements, i. e. for more than one unit of account. The delivered elements are separated if they have value to the customer on a stand-alone basis, there is objective and reliable evidence of the fair value of the undelivered element(s) and the arrangement includes a general right of return relative to the delivered element(s) and delivery or performance of the as yet undelivered element(s) is probable and substantially within the control of the company. If all three criteria are fulfi lled, the appropriate revenue recognition rule is then applied to each separate unit of account.
Other operating income may also arise from the exchange of intangible assets. The amount rec-ognized is generally based on the fair value of the assets given up, which is generally calculated using the discounted cash fl ow method. If the assets given up are internally generated, the gain from the exchange normally equals their fair value.
RESEARCH AND DEVELOPMENT EXPENSESA substantial proportion of the Bayer Group’s fi nancial resources is invested in research and de-velopment. In addition to in-house research and development activities, especially in HealthCare, various research and development collaborations and alliances are maintained with third parties.
For accounting purposes, research expenses are defi ned as costs incurred for current or planned investigations undertaken with the prospect of gaining new scientifi c or technical knowledge and understanding. Development expenses are defi ned as costs incurred for the application of research fi ndings or specialist knowledge to production, production methods, services or goods prior to the commencement of commercial production or use.
Research costs cannot be capitalized. The conditions for capitalization of development costs are closely defi ned: an intangible asset must be recognized if, and only if, there is a reasonable certainty of receiving future cash fl ows that will cover an asset’s carrying amount. Since our own development projects are often subject to regulatory approval procedures and other uncertain-ties, the conditions for the capitalization of costs incurred before receipt of approvals are not normally satisfi ed.
Research and development expenses mainly comprise the costs for active ingredient discovery, clinical studies, and research and development activities in the areas of application technology and engineering. They also include non-allocable costs for regulatory approvals, approval exten-sions and fi eld trials.
Table of ConTenTs
ConsolidaTed finanCial sTaTemenTs
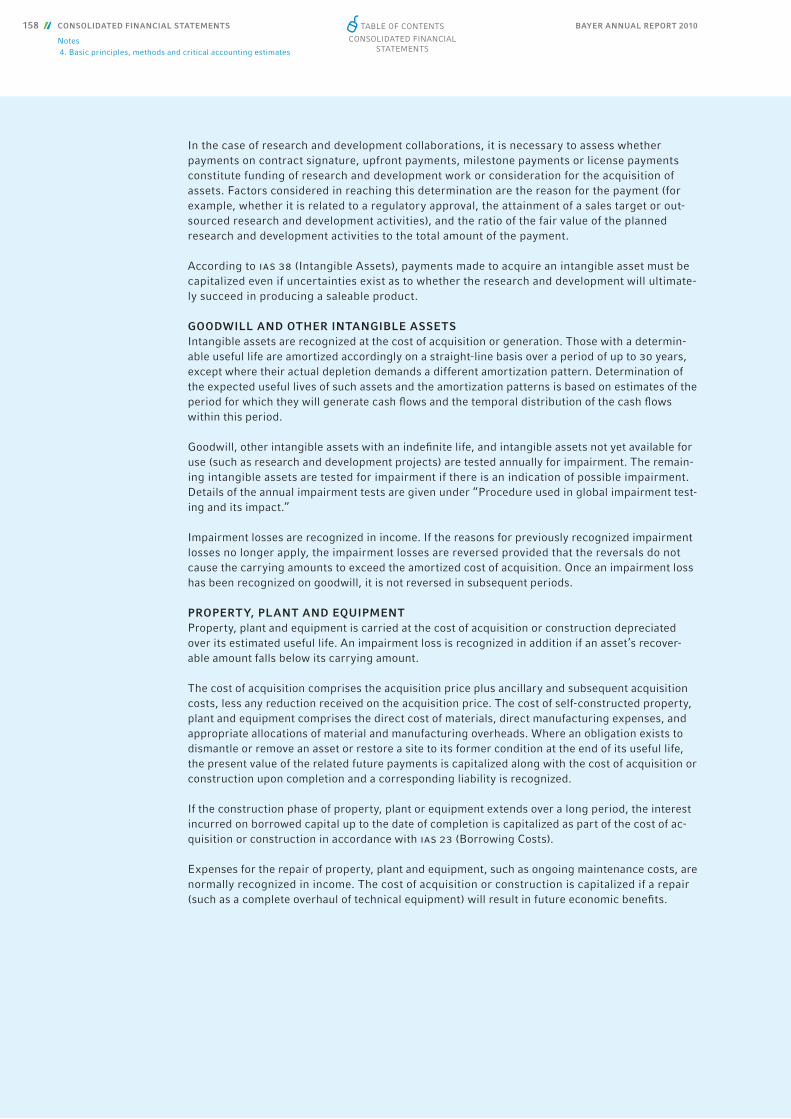
BAYER ANNUAL REPORT 2010158 CONSOLIDATED FINANCIAL STATEMENTS
Notes 4. Basic principles, methods and critical accounting estimates
In the case of research and development collaborations, it is necessary to assess whether payments on contract signature, upfront payments, milestone payments or license payments constitute funding of research and development work or consideration for the acquisition of assets. Factors considered in reaching this determination are the reason for the payment (for example, whether it is related to a regulatory approval, the attainment of a sales target or out-sourced research and development activities), and the ratio of the fair value of the planned research and development activities to the total amount of the payment.
According to ias 38 (Intangible Assets), payments made to acquire an intangible asset must be capitalized even if uncertainties exist as to whether the research and development will ultimate-ly succeed in producing a saleable product.
GOODWILL AND OTHER INTANGIBLE ASSETSIntangible assets are recognized at the cost of acquisition or generation. Those with a determin-able useful life are amortized accordingly on a straight-line basis over a period of up to 30 years, except where their actual depletion demands a different amortization pattern. Determination of the expected useful lives of such assets and the amortization patterns is based on estimates of the period for which they will generate cash fl ows and the temporal distribution of the cash fl ows within this period.
Goodwill, other intangible assets with an indefi nite life, and intangible assets not yet available for use (such as research and development projects) are tested annually for impairment. The remain-ing intangible assets are tested for impairment if there is an indication of possible impairment. Details of the annual impairment tests are given under “Procedure used in global impairment test-ing and its impact.”
Impairment losses are recognized in income. If the reasons for previously recognized impairment losses no longer apply, the impairment losses are reversed provided that the reversals do not cause the carrying amounts to exceed the amortized cost of acquisition. Once an impairment loss has been recognized on goodwill, it is not reversed in subsequent periods.
PROPERTY, PLANT AND EQUIPMENTProperty, plant and equipment is carried at the cost of acquisition or construction depreciated over its estimated useful life. An impairment loss is recognized in addition if an asset’s recover-able amount falls below its carrying amount.
The cost of acquisition comprises the acquisition price plus ancillary and subsequent acquisition costs, less any reduction received on the acquisition price. The cost of self-constructed property, plant and equipment comprises the direct cost of materials, direct manufacturing expenses, and appropriate allocations of material and manufacturing overheads. Where an obligation exists to dismantle or remove an asset or restore a site to its former condition at the end of its useful life, the present value of the related future payments is capitalized along with the cost of acquisition or construction upon completion and a corresponding liability is recognized.
If the construction phase of property, plant or equipment extends over a long period, the interest incurred on borrowed capital up to the date of completion is capitalized as part of the cost of ac-quisition or construction in accordance with ias 23 (Borrowing Costs).
Expenses for the repair of property, plant and equipment, such as ongoing maintenance costs, are normally recognized in income. The cost of acquisition or construction is capitalized if a repair (such as a complete overhaul of technical equipment) will result in future economic benefi ts.
Table of ConTenTs
ConsolidaTed finanCial sTaTemenTs
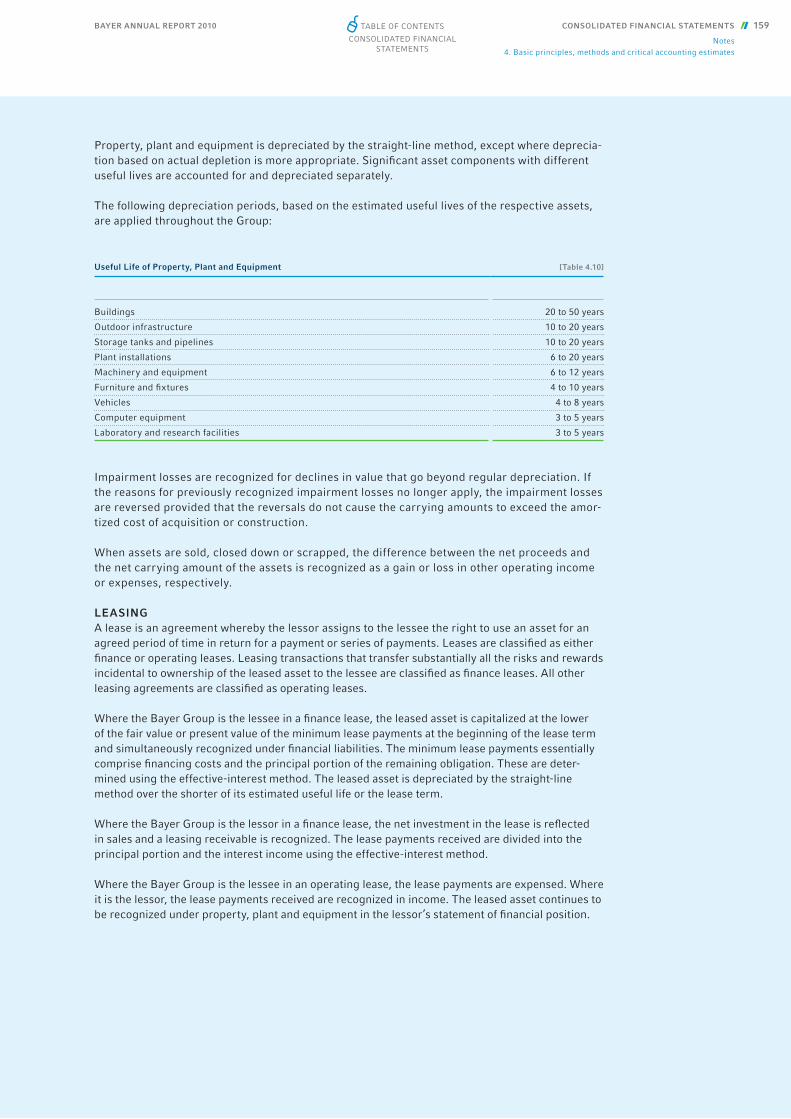
BAYER ANNUAL REPORT 2010 CONSOLIDATED FINANCIAL STATEMENTS 159
Notes4. Basic principles, methods and critical accounting estimates
Property, plant and equipment is depreciated by the straight-line method, except where deprecia-tion based on actual depletion is more appropriate. Signifi cant asset components with different useful lives are accounted for and depreciated separately.
The following depreciation periods, based on the estimated useful lives of the respective assets, are applied throughout the Group:
Impairment losses are recognized for declines in value that go beyond regular depreciation. If the reasons for previously recognized impairment losses no longer apply, the impairment losses are reversed provided that the reversals do not cause the carrying amounts to exceed the amor-tized cost of acquisition or construction.
When assets are sold, closed down or scrapped, the difference between the net proceeds and the net carrying amount of the assets is recognized as a gain or loss in other operating income or expenses, respectively.
LEASINGA lease is an agreement whereby the lessor assigns to the lessee the right to use an asset for an agreed period of time in return for a payment or series of payments. Leases are classifi ed as either fi nance or operating leases. Leasing transactions that transfer substantially all the risks and rewards incidental to ownership of the leased asset to the lessee are classifi ed as fi nance leases. All other leasing agreements are classifi ed as operating leases.
Where the Bayer Group is the lessee in a fi nance lease, the leased asset is capitalized at the lower of the fair value or present value of the minimum lease payments at the beginning of the lease term and simultaneously recognized under fi nancial liabilities. The minimum lease payments essentially comprise fi nancing costs and the principal portion of the remaining obligation. These are deter-mined using the effective-interest method. The leased asset is depreciated by the straight-line method over the shorter of its estimated useful life or the lease term.
Where the Bayer Group is the lessor in a fi nance lease, the net investment in the lease is refl ected in sales and a leasing receivable is recognized. The lease payments received are divided into the principal portion and the interest income using the effective-interest method.
Where the Bayer Group is the lessee in an operating lease, the lease payments are expensed. Where it is the lessor, the lease payments received are recognized in income. The leased asset continues to be recognized under property, plant and equipment in the lessor’s statement of fi nancial position.
Useful Life of Property, Plant and Equipment [Table 4.10]
Buildings 20 to 50 years
Outdoor infrastructure 10 to 20 years
Storage tanks and pipelines 10 to 20 years
Plant installations 6 to 20 years
Machinery and equipment 6 to 12 years
Furniture and fi xtures 4 to 10 years
Vehicles 4 to 8 years
Computer equipment 3 to 5 years
Laboratory and research facilities 3 to 5 years
Table of ConTenTs
ConsolidaTed finanCial sTaTemenTs
BAYER ANNUAL REPORT 2010160 CONSOLIDATED FINANCIAL STATEMENTS
Notes4. Basic principles, methods and critical accounting estimates
FINANCIAL ASSETSFinancial assets comprise loans and receivables, acquired equity and debt instruments, cash and cash equivalents, and derivatives with positive fair values.
They are recognized and measured in accordance with ias 39 (Financial Instruments: Recognition and Measurement). Accordingly, fi nancial assets are recognized in the consolidated fi nancial statements if the Bayer Group has a contractual right to receive cash or other fi nancial assets from another entity. Regular way purchases and sales of fi nancial assets are generally posted on the settlement date. Financial assets are initially recognized at fair value plus transaction costs. The transaction costs incurred for the purchase of fi nancial assets held at fair value through profi t or loss are expensed immediately. Interest-free or low-interest receivables are initially refl ected at the present value of the expected future cash fl ows. For purposes of subsequent measurement, fi nancial assets are allocated to the following categories according to ias 39, with different mea-surement rules applying to each category:
Financial assets held at fair value through profi t or loss comprise those fi nancial assets that are held for trading. These assets are included in other fi nancial assets and also comprised receiv-ables from forward commodity contracts and receivables from other derivatives, except where hedge accounting is used. Changes in the fair value of fi nancial assets in this category are recog-nized in the income statement when the increase or decrease in value occurs.
Loans and receivables are non-derivative fi nancial assets that are not quoted in an active mar-ket. They are accounted for at amortized cost using the effective-interest method. This category comprises trade accounts receivable, the fi nancial receivables and loans included in other fi nan-cial assets, the additional fi nancial receivables and loans refl ected in other receivables, and cash and cash equivalents. Interest income from items assigned to this category is determined using the effective-interest method, insofar as such items are not classifi ed as current receiv-ables and the effect of discounting interest is not material.
Held-to-maturity fi nancial assets are non-derivative fi nancial assets, with fi xed or determinable payments, that are to be held to maturity. They are accounted for at amortized cost using the effective-interest method. Held-to-maturity fi nancial investments are recognized in other fi nancial assets.
Available-for-sale fi nancial assets are those non-derivative fi nancial assets that are not assigned to any of the above categories. They mainly include equity instruments, such as shares, and debt instruments not to be held to maturity, which are included in other fi nancial assets. Changes in the fair value of available-for-sale fi nancial assets are recognized in equity and not amortized to income until the assets are sold. If the fair value is substantially below the amor-tized cost and / or remains below the amortized cost for a prolonged period, a write-down is recorded and amortized to income. Where possible, a fair value for equity and debt securities is derived from market data. Financial assets for which no market price is available and whose fair value cannot be reasonably estimated are carried at cost less any write-downs.
If there are substantial, objective indications of a decline in the value of loans and receivables, held-to-maturity fi nancial assets or available-for-sale fi nancial assets, their carrying amounts are compared to the present values of the expected future cash fl ows, discounted by the current market rate of return on comparable fi nancial assets. If a decline in value is confi rmed, the assets are written down by the difference between the two amounts. Indications that a write-down is necessary include the fact that a company has been making an operating loss for several years, a reduction in market value, a signifi cant deterioration in credit standing, a material breach of contract, a high probability of insolvency or other fi nancial restructuring of the debtor, or the disappearance of an active market for the asset.
Table of ConTenTs
ConsolidaTed finanCial sTaTemenTs

BAYER ANNUAL REPORT 2010 CONSOLIDATED FINANCIAL STATEMENTS 161
Notes4. Basic principles, methods and critical accounting estimates
If the reasons for previous write-downs no longer apply, the assets are written back provided that this does not cause the carrying amounts to exceed the amortized cost of acquisition. Available-for-sale equity instruments, however, are not written back.
Financial assets are derecognized when contractual rights to receive cash fl ows from the fi nancial assets expire or the fi nancial assets are transferred together with all material risks and benefi ts.
DERIVATIVESThe Bayer Group uses derivatives to mitigate the risk of changes in exchange rates, interest rates and commodity prices. Hedge accounting is applied for these derivatives where appropriate.
Contracts concluded in order to receive or deliver non-fi nancial goods for the company’s own pur-poses are not accounted for as derivatives but treated as pending transactions. Where embedded derivatives are identifi ed that are required to be separated from the pending transactions, they are accounted for separately. To take advantage of market opportunities or cover possible peak demand, a non-material volume of transactions may be entered into for which the possibility of immediate resale cannot be excluded. Such transactions are allocated to separate portfolios upon acquisition and accounted for as derivatives according to ias 39. Changes in the fair values of these derivatives are recognized directly in the income statement.
Changes in the values of forward exchange contracts and currency options serving as hedges of items in the statement of fi nancial position are refl ected in exchange gains and losses, while changes in the values of interest-rate swaps and interest-rate options are recognized in interest income and expense. Changes in the fair values of commodity futures and options, and of forward exchange contracts used to hedge forecasted transactions in foreign currencies, are recognized in other operating income and expenses.
The fair values of derivatives either correspond to market data or they are measured by the usual methods in light of the market data available at the measurement date. Currency and commodity contracts are measured individually at their forward rates or forward prices on the closing date. These depend on spot rates or prices including time spreads. The fair values of interest-rate hedg-ing instruments are determined by discounting future cash fl ows over the remaining terms of the instruments at market rates of interest. The present value of each interest-rate or cross-currency interest-rate swap transaction is measured individually as of the closing date. Interest income is recognized in the income statement at the date of payment or, in case of accrual, at the closing date.
Changes in the fair values of derivatives designated as fair value hedges and the adjustments in the carrying amounts of the underlying transactions are recognized in the income statement. Changes in the fair values of the effective portion of derivatives designated as cash fl ow hedges are initially recognized not in the income statement, but in equity (under accumulated other comprehensive income). They are released to the income statement when the underlying trans-action is realized. If such a derivative is sold or ceases to qualify for hedge accounting, the change in its value continues to be recognized in accumulated other comprehensive income until the forecasted transaction is realized. If the forecasted transaction is no longer probable, the amount previously recognized in accumulated other comprehensive income is released to the income statement.
The income and expense refl ected in the non-operating result pertaining to the derivatives and the underlying transactions are shown separately. Income and expense are not offset.
Table of ConTenTs
ConsolidaTed finanCial sTaTemenTs

BAYER ANNUAL REPORT 2010162 CONSOLIDATED FINANCIAL STATEMENTS
Notes4. Basic principles, methods and critical accounting estimates
INVENTORIESIn accordance with ias 2 (Inventories), inventories encompass assets held for sale in the ordinary course of business (fi nished goods and goods purchased for resale), in the process of production for such sale (work in process) or in the form of materials or supplies to be consumed in the production process or in the rendering of services (raw materials and supplies). Inventories are recognized at their cost of acquisition or production – calculated by the weighted-average method – or at their net realizable value, whichever is lower. The net realizable value is the achievable sale proceeds under normal business conditions less estimated cost to complete and selling expenses.
TAXESIncome taxes comprise the taxes levied on taxable income in the individual countries and the changes in deferred tax assets and liabilities. The income taxes recognized are refl ected at the amounts likely to be payable under the statutory regulations in force, or already enacted in relation to future periods, as of the closing date.
The remaining taxes, such as property, electricity and other energy taxes, are included in the functional cost items.
In compliance with ias 12 (Income Taxes), deferred taxes are recognized for temporary differ-ences between the carrying amounts of assets and liabilities in the statement of fi nancial position prepared according to ifrs and those in the statement of fi nancial position drawn up for tax purposes. Deferred taxes are also recognized for consolidation measures and for tax loss carry-forwards likely to be realizable.
Deferred tax assets relating to deductible temporary differences, tax credits and tax loss carry-forwards are recognized where it is suffi ciently probable that taxable income will be available in the future to enable the tax loss carryforwards to be utilized. Deferred tax liabilities are recog-nized on temporary differences taxable in the future. Deferred taxes are calculated at the rates which – on the basis of the statutory regulations in force, or already enacted in relation to future periods, as of the closing date – are expected to apply in the individual countries at the time of realization. Deferred tax assets and deferred tax liabilities are offset if they relate to income taxes levied by the same taxation authority. The effects of changes in tax rates or tax law on deferred tax assets and liabilities are generally accounted for in the period in which the changes are substantively enacted. Such effects are normally recognized in the income statement. Effects on deferred taxes previously recognized in other comprehensive income are refl ected in equity.
Where gains or losses are recognized directly in equity, this also applies to the related deferred tax assets or liabilities.
The probability that deferred tax assets resulting from temporary differences or loss carry-forwards can be utilized in the future is the subject of forecasts by the individual consolidated companies regarding their future earnings situation and other parameters.
Deferred tax liabilities are recognized on planned dividend payments by subsidiaries. Where a dividend payment is not planned for the long term, no deferred tax liability is recognized on the difference between the proportionate net assets according to ifrs and the tax base of the investment in the subsidiary.
Table of ConTenTs
ConsolidaTed finanCial sTaTemenTs

BAYER ANNUAL REPORT 2010 CONSOLIDATED FINANCIAL STATEMENTS 163
Notes4. Basic principles, methods and critical accounting estimates
PROVISIONS FOR PENSIONS AND OTHER POST-EMPLOYMENT BENEFITSGroup companies provide retirement benefi ts for most of their employees, either directly or by contributing to privately or publicly administered funds. The way these benefi ts are provided varies according to the legal, fi scal and economic conditions of each country, the benefi ts gener-ally being based on employee compensation and years of service. The obligations relate both to existing retirees’ pensions and to pension entitlements of future retirees.
Group companies provide retirement benefi ts under defi ned contribution and / or defi ned benefi t plans. In the case of defi ned contribution plans, the company pays contributions to publicly or privately administered pension schemes on a mandatory, contractual or voluntary basis. Once the contributions have been paid, the company has no further payment obligations. The regular con-tributions constitute expenses for the year in which they are due and as such are included in the functional cost items, and thus in the operating result (ebit). All other retirement benefi t systems are defi ned benefi t plans, which may be either unfunded, i. e. fi nanced by provisions, or funded, i. e. fi nanced through pension funds. All income and expenses relating to defi ned benefi t plans other than from interest cost and the expected return on plan assets are recognized in the operat-ing result (ebit). Interest cost and the expected return on plan assets are refl ected in the non- operating result under other non-operating income and expense. Actuarial gains and losses from defi ned benefi t plans and deductions in connection with asset limitation are reported net of taxes in the statement of comprehensive income without affecting the income statement and refl ected in the statement of changes in equity, as well as being recognized in full in the respective provi-sion. Early-retirement and certain other benefi ts to retirees are also included in the provisions for pensions, since these obligations are similar in character to pension obligations.
The present value of provisions for defi ned benefi t plans and the resulting expense are calculated in accordance with ias 19 (Employee Benefi ts) by the projected unit credit method. The future benefi t obligations are valued by actuarial methods on the basis of specifi c assumptions regarding benefi ciary structure and the economic environment. These relate mainly to the discount rate, the expected return on plan assets, the rate of future compensation increases, variations in health care costs, and attrition and mortality rates.
The discount rates used are calculated from the yields of high-quality corporate bond portfolios in specifi c currencies with cash fl ows approximately equivalent to the expected disbursements from the pension plans. The uniform discount rate derived from this interest-rate structure is thus based on the yields, at the closing date, of a portfolio of aa-rated corporate bonds whose weight-ed residual maturities approximately correspond to the duration necessary to cover the entire benefi t obligation. If there are no aa-rated corporate bonds of equal duration, the obligations are discounted at the interest rate for government bonds or interest-rate swaps in effect at the closing date. This is adjusted in line with the credit spread for corporate bonds.
The expected long-term return on plan assets, determined on the basis of published and internal capital market reports and forecasts for each asset class, is applied to the fair value of plan assets at each year end.
The effects of changes in important parameters are explained in Note [25].
According to the projected unit credit method, benefi t expense is spread over each employee’s entire period of employment, already allowing for future increases in compensation.
Table of ConTenTs
ConsolidaTed finanCial sTaTemenTs
BAYER ANNUAL REPORT 2010164 CONSOLIDATED FINANCIAL STATEMENTS
Notes 4. Basic principles, methods and critical accounting estimates
The fair value of plan assets is deducted from the present value of the defi ned benefi t obligation for pensions and other post-employment benefi ts. The obligations and plan assets are valued at regular intervals of not more than three years. Comprehensive actuarial valuations for all major plans are performed annually as of December 31. The difference between the defi ned benefi t obli-gation – after deducting the fair value of plan assets – and the net liability recognized in the state-ment of fi nancial position is attributable to unrecognized past service cost. Plan assets in excess of the benefi t obligation are refl ected in other receivables, subject to the asset limitation specifi ed in ias 19 (Employee Benefi ts).
Because of changing market and economic conditions, the expenses and the obligations actually arising under the plans in the future may differ materially from the estimates made on the basis of these actuarial assumptions. The plan assets are mainly comprised of equity and fi xed-income instruments. Therefore, declining returns on equity markets and markets for fi xed-income instru-ments could necessitate additional contributions to the plans in order to cover current and future pension obligations. Higher or lower rates of employee fl uctuation or longer or shorter lives of participants may also affect the amounts of pension income or expense recorded in the future.
OTHER PROVISIONS Other provisions are recognized for present legal and constructive obligations arising from past events that will probably give rise to a future outfl ow of resources, provided that a reliable estimate can be made of the amount of the obligations.
Other provisions are measured in accordance with ias 37 (Provisions, Contingent Liabilities and Contingent Assets) or, where applicable, ias 19 (Employee Benefi ts). Where the cash outfl ow to settle an obligation is expected to occur after one year, the provision is recognized at the present value of the expected cash outfl ow. Claims for reimbursements from third parties are capitalized separately if their realization is virtually certain.
If the projected obligation declines as a result of a change in the estimate, the provision is reversed by the corresponding amount and the resulting income recognized in the operating expense item(s) in which the original charge was recognized.
To enhance the information content of the estimates, certain provisions that could have a mate-rial effect on the fi nancial position or results of operations of the Group are selected and tested for their sensitivity to changes in the underlying parameters. To refl ect uncertainty about the likelihood of the assumed events actually occurring, the impact of a 5% change in the prob-ability of occurrence is examined in each case. This analysis has not shown other provisions to be materially sensitive.
Uncertainties exist with respect to the interpretation of complex tax regulations and the amount and timing of future taxable income. Given the wide range of international business relationships and the long-term nature and complexity of existing contractual agreements, differences arising between the actual results and the assumptions made, or future changes to such assumptions, could necessitate adjustments to tax income and expense in future periods. The Group estab-lishes provisions for taxes, based on reasonable estimates, for liabilities to the tax authorities of the respective countries that are uncertain as to their amount and the probability of their occurrence. The amount of such provisions is based on various factors, such as experience with previous tax audits and differing legal interpretations by the taxable entity and the responsible tax authority.
Table of ConTenTs
ConsolidaTed finanCial sTaTemenTs
BAYER ANNUAL REPORT 2010 CONSOLIDATED FINANCIAL STATEMENTS 165
Notes4. Basic principles, methods and critical accounting estimates
Provisions for environmental protection are recorded if future cash outfl ows are likely to be necessary to ensure compliance with environmental regulations or to carry out remediation work, such costs can be reliably estimated and no future benefi ts are expected from such measures.
Estimating the future costs of environmental protection and remediation involves many uncer-tainties, particularly with regard to the status of laws, regulations and the information available about conditions in the various countries and at the individual sites. Signifi cant factors in estimat-ing the costs include previous experiences in similar cases, the conclusions in expert opinions obtained regarding the Group’s environmental programs, current costs and new developments affecting costs, management’s interpretation of current environmental laws and regulations, the number and fi nancial position of third parties that may become obligated to participate in any remediation costs on the basis of joint liability, and the remediation methods likely to be deployed. Changes in these assumptions could impact future reported results.
Taking into consideration experience gained to date regarding environmental matters of a similar nature, provisions are believed to be adequate based upon currently available information. There were no signifi cant changes in assumptions or estimates that would have impacted the income statement in prior years. However, given the diffi culties inherent in estimating liabilities in the businesses in which the Group operates, especially those for which the risk of environmental damage is greater in relative terms (CropScience and MaterialScience), it remains possible that material additional costs will be incurred beyond the amounts accrued. It may transpire during remediation work that additional expenditures are necessary over an extended period and that these exceed existing provisions and cannot be reasonably estimated. Management nevertheless believes that such additional amounts, if any, would not have a material adverse effect on the Group’s fi nancial position or results of operations.
Provisions for restructuring only cover expenses that arise directly from restructuring mea sures, are necessary for restructuring and are not related to future business operations. Such expenses include severance payments to employees and rentals for property that is no longer utilized.
Restructuring measures may include the sale or termination of business units, site closures, relocations of business activities, changes in management structure or fundamental reorganizations of business units.
The respective provisions are established when a detailed restructuring plan has been drawn up, resolved upon by the responsible decision-making level of management and communicated to the employees and / or their representatives. Provisions for restructuring are established at the pres-ent value of future disbursements.
Trade-related provisions are recorded mainly for the granting of rebates or discounts, product returns, or obligations in respect of goods or services already received but not yet invoiced.
As a global company with a diverse business portfolio, the Bayer Group is exposed to numerous legal risks, particularly in the areas of product liability, competition and antitrust law, patent disputes, tax assessments and environmental matters. Provisions for litigations are recorded in the statement of fi nancial position in respect of pending or future litigations, subject to a case-by-case examination. Such legal proceedings are evaluated on the basis of the available informa-tion, including that from legal counsel acting for the Group, to assess potential outcomes. Where it is more likely than not that a present obligation arising out of legal proceedings will result in an outfl ow of resources, a provision is recorded in the amount of the present value of the expected cash outfl ows if these are considered to be reliably measurable. These provisions cover the estimated payments to plaintiffs, court fees, attorney costs and the cost of potential settlements. The evaluation is based on the current status of the litigations as of each closing date and in-cludes an assessment of whether the criteria for recording a provision are met and, if so, the amount of the provision to be recorded.
Table of ConTenTs
ConsolidaTed finanCial sTaTemenTs
BAYER ANNUAL REPORT 2010166 CONSOLIDATED FINANCIAL STATEMENTS
Notes4. Basic principles, methods and critical accounting estimates
Litigation and other judicial proceedings generally raise complex issues and are subject to many uncertainties and complexities including, but not limited to, the facts and circumstances of each particular case, the jurisdiction in which each suit is brought and differences in applicable law. The outcome of currently pending and future proceedings therefore cannot be predicted. As a result of a judgment in court proceedings or the conclusion of a settlement, the Bayer Group may incur charges in excess of presently established provisions and related insurance coverage.
Personnel-related provisions are mainly those recorded for annual bonus payments, variable one-time payments, individual performance awards, long-service awards, surpluses on long-term accounts and other personnel costs. Obligations under stock-based compensation programs that provide for awards payable in cash are also included here.
FINANCIAL LIABILITIESFinancial liabilities comprise primary fi nancial liabilities and negative fair values of derivatives.
Primary fi nancial liabilities are recognized in the statement of fi nancial position if the Bayer Group has a contractual obligation to transfer cash or other fi nancial assets to another party. Such liabili-ties are initially recognized at the fair value of the consideration received or the value of payments received less any transaction costs. In subsequent periods, primary fi nancial liabilities are measured at amortized cost using the effective-interest method.
Financial liabilities are derecognized when the contractual obligation is discharged or canceled, or has expired.
Under ias 32 (Financial Instruments: Presentation), puttable fi nancial instruments may only be classifi ed as equity under certain conditions. Where other stockholders of subsidiaries are contrac-tually entitled to terminate their participation and at the same time claim repayment of their capital contribution, such capital is recognized as a liability even if it is classifi ed as equity in the respective jurisdiction. The redeemable capital of a non-controlling stockholder is recognized at the amount of such stockholder’s pro-rated share of the subsidiary’s net assets.
OTHER RECEIVABLES AND LIABILITIESAccrued items and other non-fi nancial assets and liabilities are carried at amortized cost. They are amortized to income by the straight-line method or according to performance of the under-lying transaction.
In accordance with ias 20 (Accounting for Government Grants and Disclosure of Government Assistance), grants and subsidies from third parties that serve to promote investment are refl ected in the statement of fi nancial position under other liabilities and amortized to income over the useful lives of the respective assets.
ACQUISITION ACCOUNTINGAcquired businesses are accounted for using the acquisition method, which requires that the assets acquired and liabilities assumed be recorded at their respective fair values on the date Bayer gains control.
The application of the acquisition method requires certain estimates and assumptions to be made, especially concerning the fair values of the acquired intangible assets, property, plant and equipment and the liabilities assumed at the acquisition date, and the useful lives of the acquired intangible assets, property, plant and equipment.
Table of ConTenTs
ConsolidaTed finanCial sTaTemenTs

BAYER ANNUAL REPORT 2010 CONSOLIDATED FINANCIAL STATEMENTS 167
Notes4. Basic principles, methods and critical accounting estimates
Measurement is based to a large extent on anticipated cash fl ows. If actual cash fl ows vary from those used in calculating fair values, this may materially affect the Group’s future results of operations. In particular, the estimation of discounted cash fl ows from intangible assets under development, patented and non-patented technologies and brands is based on assumptions con-cerning, for example:
• the outcomes of research and development activities regarding compound effi cacy, results of clinical trials etc.,
• the probability of obtaining regulatory approvals in individual countries,• long-term sales trends, • possible selling price erosion due to generic competition in the market following patent
expirations,• the behavior of competitors (launch of competing products, marketing initiatives etc.).
For signifi cant acquisitions, the purchase price allocation is carried out with assistance from independent third-party valuation specialists. The valuations are based on the information avail-able at the acquisition date.
When an acquisition is made in several stages, the existing interest held is completely remea-sured at the date on which the acquirer obtains control of the acquiree and recognized at fair value in compliance with ifrs 3 (Business Combinations). If the new fair value of the existing in-terest already held by the acquirer is higher or lower than its carrying amount, this carrying amount must be adjusted accordingly. This adjustment is recognized in the income statement.
PROCEDURE USED IN GLOBAL IMPAIRMENT TESTING AND ITS IMPACTImpairment tests are performed not only on individual items of intangible assets, property, plant and equipment, but also at the level of cash-generating units. A cash-generating unit is the smallest identifi able group of assets that generates cash infl ows that are largely indepen-dent of the cash infl ows from other assets or groups of assets. The Bayer Group regards its strategic business entities and some individual product families as cash-generating units and subjects them to global impairment testing. The strategic business entities constitute the second fi nancial reporting level below the segments.
Cash-generating units are globally tested if there is an indication of possible impairment. Those to which goodwill is allocated are tested at least annually.
Impairment testing involves comparing the carrying amount of each cash-generating unit or item of intangible assets, property, plant or equipment to the recoverable amount, which is the higher of its fair value less costs to sell or value in use. If the carrying amount exceeds the re-coverable amount, the asset is impaired by the amount of the difference. If a strategic business entity is found to be impaired, an impairment loss is fi rst recognized on any goodwill allocated to it. Any remaining impairment amount is then allocated among the other assets of the strate-gic business entity, and pro-rata impairment losses are recognized on the carrying amounts of these assets. The impairments are recognized in the income statement, generally under other operating expenses.
Table of ConTenTs
ConsolidaTed finanCial sTaTemenTs

BAYER ANNUAL REPORT 2010168 CONSOLIDATED FINANCIAL STATEMENTS
Notes4. Basic principles, methods and critical accounting estimates
For the purpose of calculating the recoverable amount, both the fair value less costs to sell and the value in use are determined from the present value of the future net cash fl ows. These are forecast on the basis of the Bayer Group’s current planning, the planning horizon normally being three to fi ve years. Forecasting involves making assumptions, especially regarding future selling prices, sales volumes and costs. Where the recoverable amount is the fair value less costs to sell, the cash-generating unit is measured from the viewpoint of an independent market participant. Where the recoverable amount is the value in use, the cash-generating unit or individual asset is measured as currently used. In either case, net cash fl ows beyond the planning period are deter-mined on the basis of long-term business expectations using individual growth rates derived from the respective market information.
The net cash infl ows are discounted at a rate equivalent to the weighted average cost of equity and debt capital. To allow for the different risk and return profi les of the Bayer Group’s principal businesses, the after-tax cost of capital is calculated separately for each subgroup and a sub-group-specifi c capital structure is defi ned by benchmarking against comparable companies in the same industry sector. The cost of equity corresponds to the return expected by stockholders, while the cost of debt is based on the conditions on which comparable companies can obtain long-term fi nancing. Both components are derived from capital market information.
The growth rates applied for impairment testing in 2010 and 2009 and the capital cost factors used to discount the expected cash fl ows are shown in the following table:
As in the previous year, a risk premium of 3.5 percentage points was added to the discount rate for the strategic business entity Crop Improvement, which is part of the Environmental Science, BioScience reporting segment.
The sensitivity analysis for cash-generating units to which goodwill is allocated was based on a 10% decline in future cash fl ows and a 10% increase in the weighted average cost of capital because changes up to this magnitude are reasonably possible, especially in the long term. Although greater changes than this were observed due to the global economic and fi nancial crisis in the previous year, we do not believe these will be sustained, and such changes there-fore remain likely only in the short term. We therefore concluded that there is no indication of potential goodwill impairment in any of the cash-generating units. In 2010, as in 2009, no impairment losses were recorded on the basis of the global annual impairment testing of the cash-generating units. The impairment losses recognized on intangible assets, property, plant and equipment – amounting to €989 million (2009: €149 million) – are explained in Notes [17] and [18].
Impairment Testing Parameters [Table 4.11]
HealthCare CropScience MaterialScience
2009 2010 2009 2010 2009 2010
% % % % % %
Growth rate 0-1.8 -2.0-0.0 1.4-4.0 1.5-4.0 0.5 0.5
After-tax capital cost factor 6.9 5.7 7.0 6.5 6.7 6.3
Pre-tax capital cost factor 8.5-9.9 7.3-9.0 8.5-12.0 7.6-11.7 8.4-9.7 8.0-10.0
Table of ConTenTs
ConsolidaTed finanCial sTaTemenTs
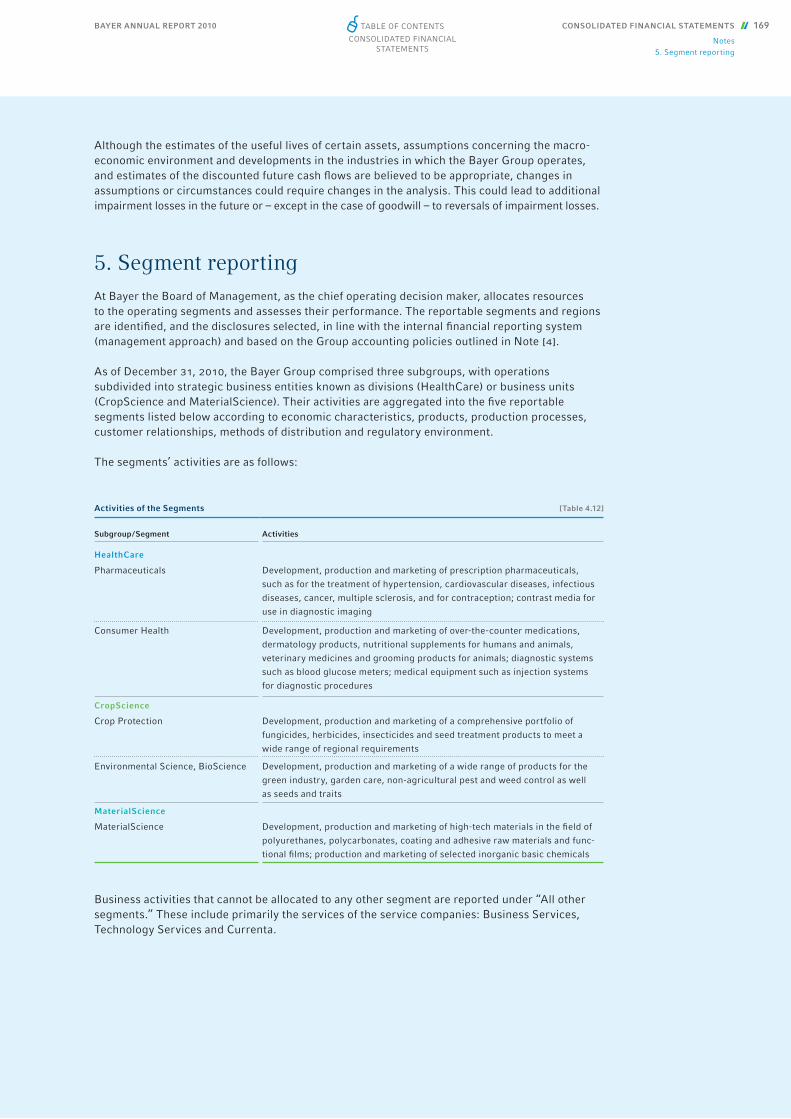
BAYER ANNUAL REPORT 2010 CONSOLIDATED FINANCIAL STATEMENTS 169
Notes5. Segment reporting
Although the estimates of the useful lives of certain assets, assumptions concerning the macro-economic environment and developments in the industries in which the Bayer Group operates, and estimates of the discounted future cash fl ows are believed to be appropriate, changes in assumptions or circumstances could require changes in the analysis. This could lead to additional impairment losses in the future or – except in the case of goodwill – to reversals of impairment losses.
5. Segment reportingAt Bayer the Board of Management, as the chief operating decision maker, allocates resources to the operating segments and assesses their performance. The reportable segments and regions are identifi ed, and the disclosures selected, in line with the internal fi nancial reporting system (management approach) and based on the Group accounting policies outlined in Note [4].
As of December 31, 2010, the Bayer Group comprised three subgroups, with operations subdivided into strategic business entities known as divisions (HealthCare) or business units (CropScience and MaterialScience). Their activities are aggregated into the fi ve reportable segments listed below according to economic characteristics, products, production processes, customer relationships, methods of distribution and regulatory environment.
The segments’ activities are as follows:
Business activities that cannot be allocated to any other segment are reported under “All other segments.” These include primarily the services of the service companies: Business Services, Technology Services and Currenta.
Activities of the Segments [Table 4.12]
Subgroup / Segment Activities
HealthCare
Pharmaceuticals Development, production and marketing of prescription pharmaceuticals,
such as for the treatment of hypertension, cardiovascular diseases, infectious
diseases, cancer, multiple sclerosis, and for contraception; contrast media for
use in diagnostic imaging
Consumer Health Development, production and marketing of over-the-counter medications,
dermatology products, nutritional supplements for humans and animals,
veterinary medicines and grooming products for animals; diagnostic systems
such as blood glucose meters; medical equipment such as injection systems
for diagnostic procedures
CropScience
Crop Protection Development, production and marketing of a comprehensive portfolio of
fungicides, herbicides, insecticides and seed treatment products to meet a
wide range of regional requirements
Environmental Science, BioScience Development, production and marketing of a wide range of products for the
green industry, garden care, non-agricultural pest and weed control as well
as seeds and traits
MaterialScience
MaterialScience Development, production and marketing of high-tech materials in the fi eld of
polyurethanes, polycarbonates, coating and adhesive raw materials and func-
tional fi lms; production and marketing of selected inorganic basic chemicals
Table of ConTenTs
ConsolidaTed finanCial sTaTemenTs
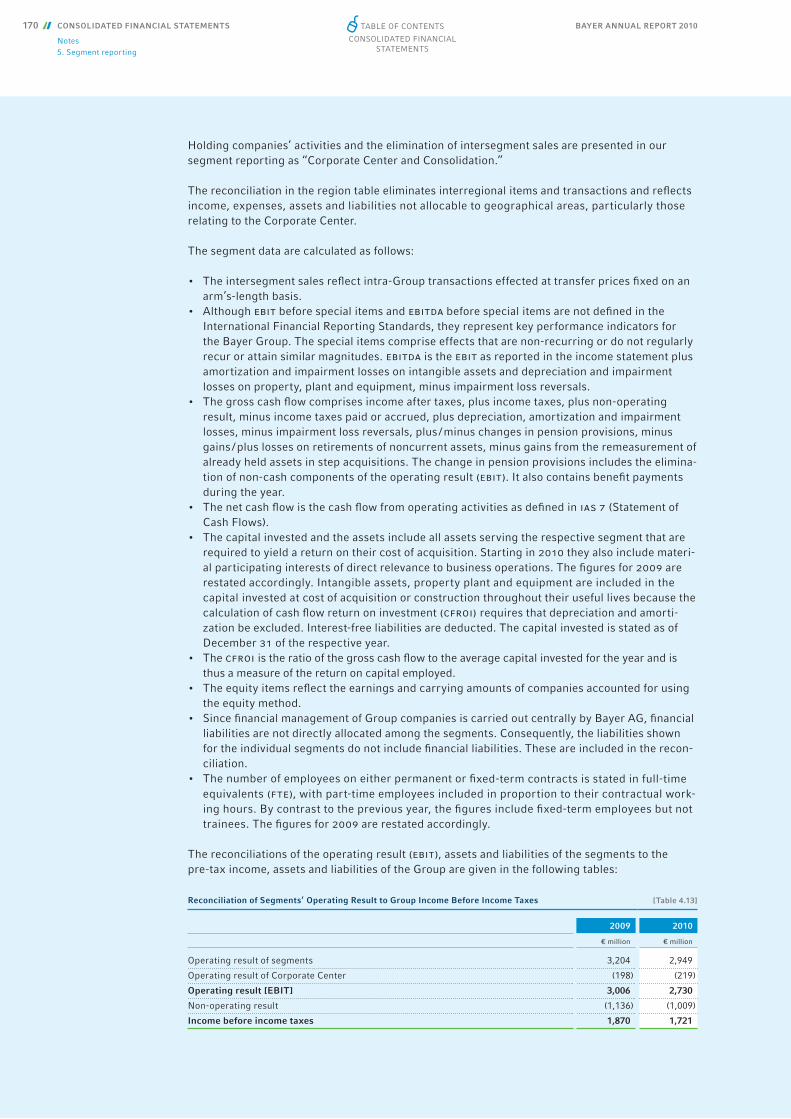
BAYER ANNUAL REPORT 2010170 CONSOLIDATED FINANCIAL STATEMENTS
Notes5. Segment reporting
Holding companies’ activities and the elimination of intersegment sales are presented in our segment reporting as “Corporate Center and Consolidation.”
The reconciliation in the region table eliminates interregional items and transactions and refl ects income, expenses, assets and liabilities not allocable to geographical areas, particularly those relating to the Corporate Center.
The segment data are calculated as follows:
• The intersegment sales refl ect intra-Group transactions effected at transfer prices fi xed on an arm’s-length basis.
• Although ebit before special items and ebitda before special items are not defi ned in the International Financial Reporting Standards, they represent key performance indicators for the Bayer Group. The special items comprise effects that are non-recurring or do not regularly recur or attain similar magnitudes. ebitda is the ebit as reported in the income statement plus amortization and impairment losses on intangible assets and depreciation and impairment losses on property, plant and equipment, minus impairment loss reversals.
• The gross cash fl ow comprises income after taxes, plus income taxes, plus non-operating result, minus income taxes paid or accrued, plus depreciation, amortization and impairment losses, minus impairment loss reversals, plus / minus changes in pension provisions, minus gains / plus losses on retirements of noncurrent assets, minus gains from the remeasurement of already held assets in step acquisitions. The change in pension provisions includes the elimina-tion of non-cash components of the operating result (ebit). It also contains benefi t payments during the year.
• The net cash fl ow is the cash fl ow from operating activities as defi ned in ias 7 (Statement of Cash Flows).
• The capital invested and the assets include all assets serving the respective segment that are required to yield a return on their cost of acquisition. Starting in 2010 they also include materi-al participating interests of direct relevance to business operations. The fi gures for 2009 are restated accordingly. Intangible assets, property plant and equipment are included in the capital invested at cost of acquisition or construction throughout their useful lives because the calculation of cash fl ow return on investment (cfroi) requires that depreciation and amorti-zation be excluded. Interest-free liabilities are deducted. The capital invested is stated as of December 31 of the respective year.
• The cfroi is the ratio of the gross cash fl ow to the average capital invested for the year and is thus a measure of the return on capital employed.
• The equity items refl ect the earnings and carrying amounts of companies accounted for using the equity method.
• Since fi nancial management of Group companies is carried out centrally by Bayer AG, fi nancial liabilities are not directly allocated among the segments. Consequently, the liabilities shown for the individual segments do not include fi nancial liabilities. These are included in the recon-ciliation.
• The number of employees on either permanent or fi xed-term contracts is stated in full-time equivalents (fte), with part-time employees included in proportion to their contractual work-ing hours. By contrast to the previous year, the fi gures include fi xed-term employees but not trainees. The fi gures for 2009 are restated accordingly.
The reconciliations of the operating result (ebit), assets and liabilities of the segments to the pre-tax income, assets and liabilities of the Group are given in the following tables:
Reconciliation of Segments’ Operating Result to Group Income Before Income Taxes [Table 4.13]
2009 2010
€ million € million
Operating result of segments 3,204 2,949
Operating result of Corporate Center (198) (219)
Operating result [EBIT] 3,006 2,730
Non-operating result (1,136) (1,009)
Income before income taxes 1,870 1,721
Table of ConTenTs
ConsolidaTed finanCial sTaTemenTs
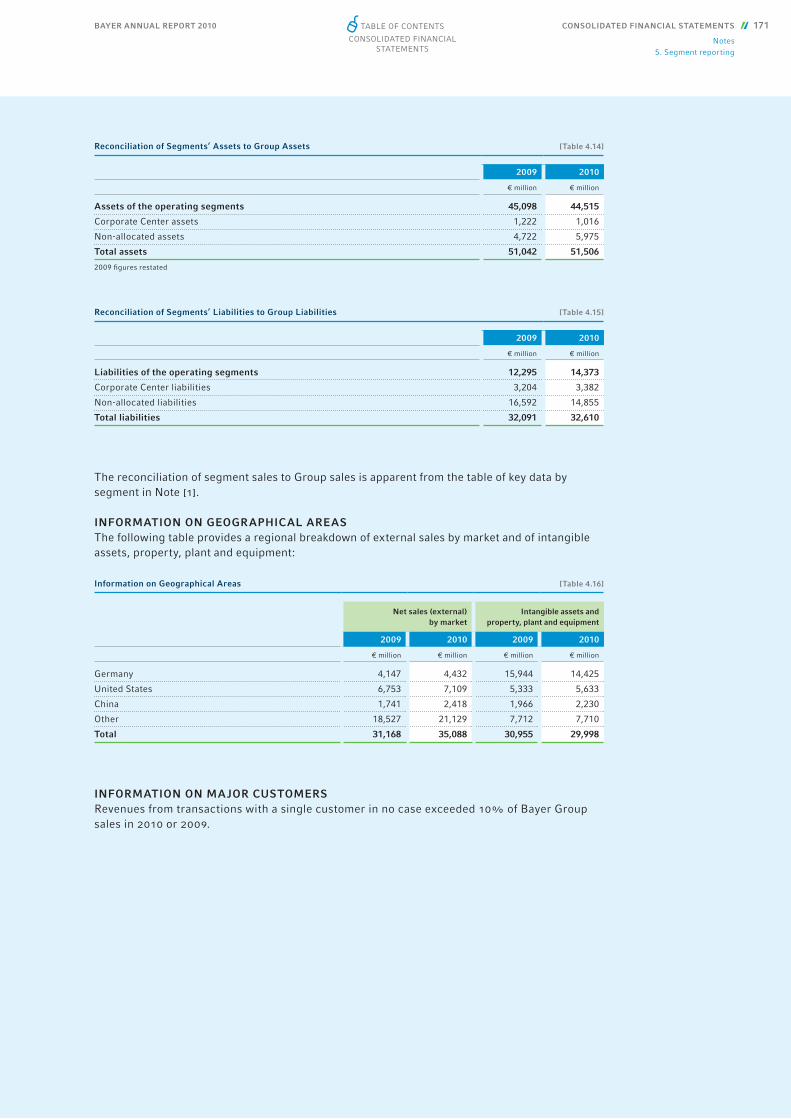
BAYER ANNUAL REPORT 2010 CONSOLIDATED FINANCIAL STATEMENTS 171
Notes5. Segment reporting
The reconciliation of segment sales to Group sales is apparent from the table of key data by segment in Note [1].
INFORMATION ON GEOGRAPHICAL AREASThe following table provides a regional breakdown of external sales by market and of intangible assets, property, plant and equipment:
INFORMATION ON MAJOR CUSTOMERSRevenues from transactions with a single customer in no case exceeded 10% of Bayer Group sales in 2010 or 2009.
Reconciliation of Segments’ Assets to Group Assets [Table 4.14]
2009 2010
€ million € million
Assets of the operating segments 45,098 44,515
Corporate Center assets 1,222 1,016
Non-allocated assets 4,722 5,975
Total assets 51,042 51,506
2009 fi gures restated
Reconciliation of Segments’ Liabilities to Group Liabilities [Table 4.15]
2009 2010
€ million € million
Liabilities of the operating segments 12,295 14,373
Corporate Center liabilities 3,204 3,382
Non-allocated liabilities 16,592 14,855
Total liabilities 32,091 32,610
Information on Geographical Areas [Table 4.16]
Net sales (external) by market
Intangible assets and property, plant and equipment
2009 2010 2009 2010
€ million € million € million € million
Germany 4,147 4,432 15,944 14,425
United States 6,753 7,109 5,333 5,633
China 1,741 2,418 1,966 2,230
Other 18,527 21,129 7,712 7,710
Total 31,168 35,088 30,955 29,998
Table of ConTenTs
ConsolidaTed finanCial sTaTemenTs
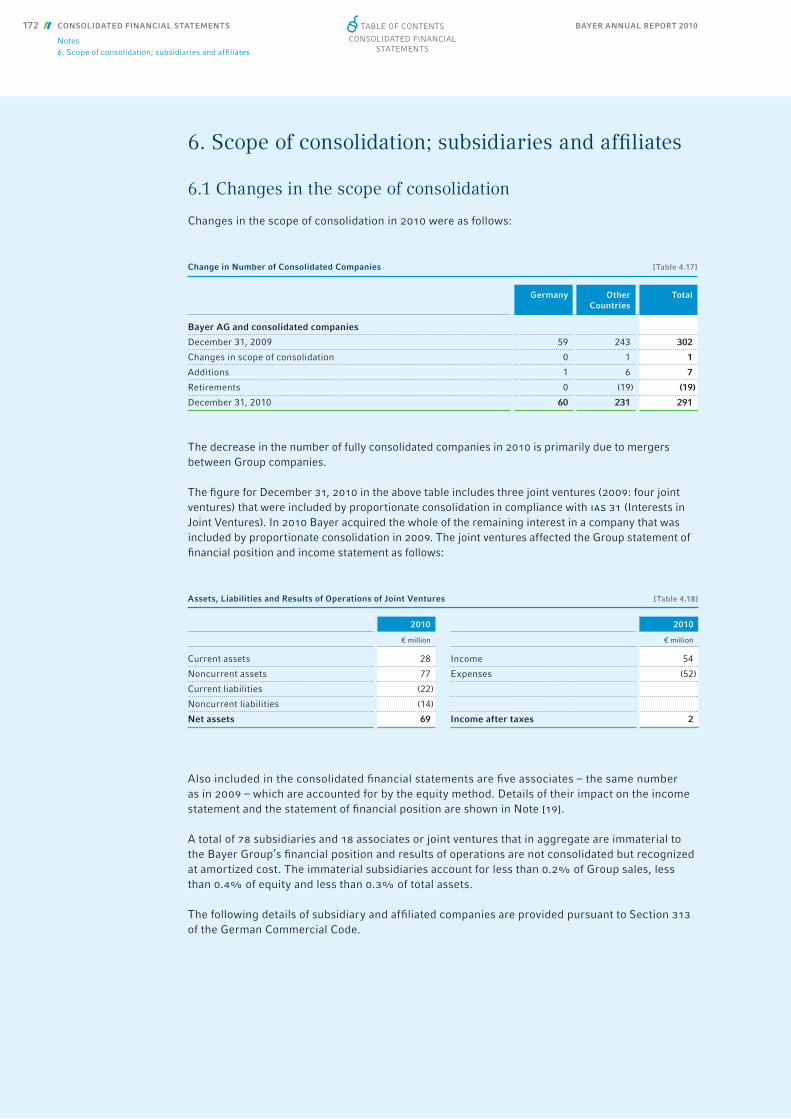
BAYER ANNUAL REPORT 2010172 CONSOLIDATED FINANCIAL STATEMENTS
Notes6. Scope of consolidation; subsidiaries and affi liates
6. Scope of consolidation; subsidiaries and affi liates
6.1 Changes in the scope of consolidation
Changes in the scope of consolidation in 2010 were as follows:
The decrease in the number of fully consolidated companies in 2010 is primarily due to mergers between Group companies.
The fi gure for December 31, 2010 in the above table includes three joint ventures (2009: four joint ventures) that were included by proportionate consolidation in compliance with ias 31 (Interests in Joint Ventures). In 2010 Bayer acquired the whole of the remaining interest in a company that was included by proportionate consolidation in 2009. The joint ventures affected the Group statement of fi nancial position and income statement as follows:
Also included in the consolidated fi nancial statements are fi ve associates – the same number as in 2009 – which are accounted for by the equity method. Details of their impact on the income statement and the statement of fi nancial position are shown in Note [19].
A total of 78 subsidiaries and 18 associates or joint ventures that in aggregate are immaterial to the Bayer Group’s fi nancial position and results of operations are not consolidated but recognized at amortized cost. The immaterial subsidiaries account for less than 0.2% of Group sales, less than 0.4% of equity and less than 0.3% of total assets.
The following details of subsidiary and affi liated companies are provided pursuant to Section 313 of the German Commercial Code.
Change in Number of Consolidated Companies [Table 4.17]
Germany Other Countries
Total
Bayer AG and consolidated companies
December 31, 2009 59 243 302
Changes in scope of consolidation 0 1 1
Additions 1 6 7
Retirements 0 (19) (19)
December 31, 2010 60 231 291
Assets, Liabilities and Results of Operations of Joint Ventures [Table 4.18]
2010 2010
€ million € million
Current assets 28 Income 54
Noncurrent assets 77 Expenses (52)
Current liabilities (22)
Noncurrent liabilities (14)
Net assets 69 Income after taxes 2
Table of ConTenTs
ConsolidaTed finanCial sTaTemenTs
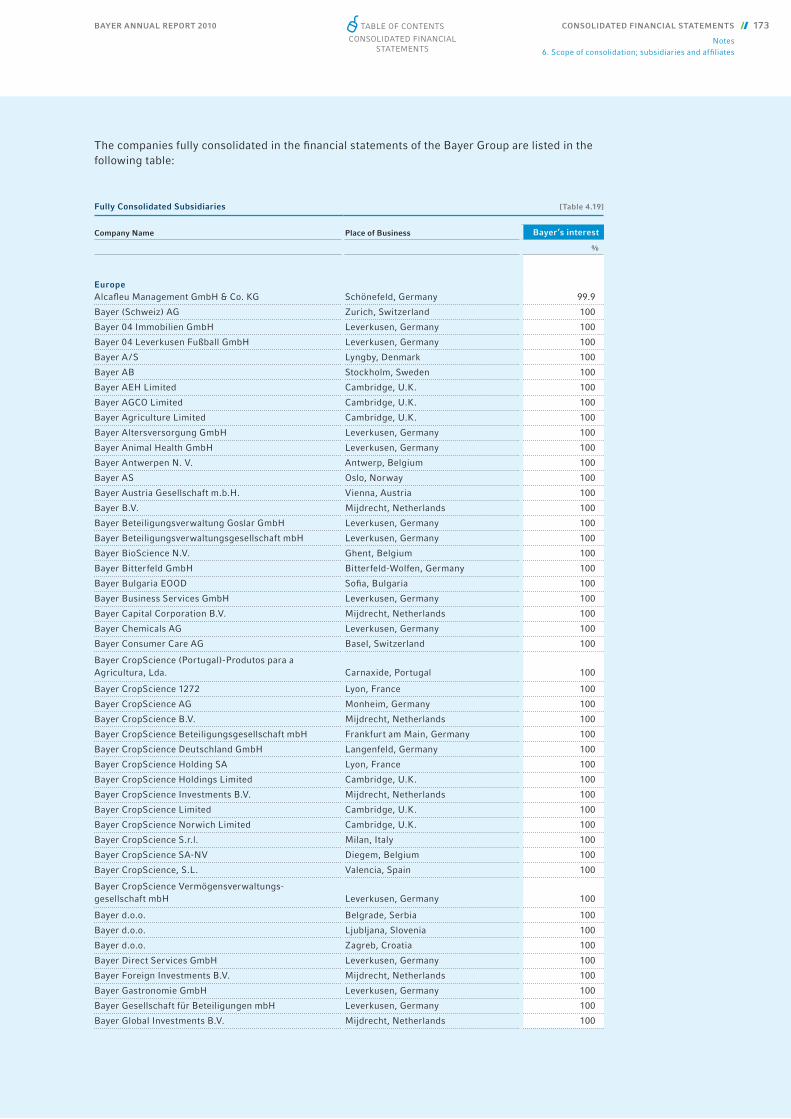
BAYER ANNUAL REPORT 2010 CONSOLIDATED FINANCIAL STATEMENTS 173
Notes6. Scope of consolidation; subsidiaries and affi liates
The companies fully consolidated in the fi nancial statements of the Bayer Group are listed in the following table:
Company Name Place of Business Bayer’s interest
%
EuropeAlcafl eu Management GmbH & Co. KG Schönefeld, Germany 99.9
Bayer (Schweiz) AG Zurich, Switzerland 100
Bayer 04 Immobilien GmbH Leverkusen, Germany 100
Bayer 04 Leverkusen Fußball GmbH Leverkusen, Germany 100
Bayer A / S Lyngby, Denmark 100
Bayer AB Stockholm, Sweden 100
Bayer AEH Limited Cambridge, U.K. 100
Bayer AGCO Limited Cambridge, U.K. 100
Bayer Agriculture Limited Cambridge, U.K. 100
Bayer Altersversorgung GmbH Leverkusen, Germany 100
Bayer Animal Health GmbH Leverkusen, Germany 100
Bayer Antwerpen N. V. Antwerp, Belgium 100
Bayer AS Oslo, Norway 100
Bayer Austria Gesellschaft m.b.H. Vienna, Austria 100
Bayer B.V. Mijdrecht, Netherlands 100
Bayer Beteiligungsverwaltung Goslar GmbH Leverkusen, Germany 100
Bayer Beteiligungsverwaltungsgesellschaft mbH Leverkusen, Germany 100
Bayer BioScience N.V. Ghent, Belgium 100
Bayer Bitterfeld GmbH Bitterfeld-Wolfen, Germany 100
Bayer Bulgaria EOOD Sofi a, Bulgaria 100
Bayer Business Services GmbH Leverkusen, Germany 100
Bayer Capital Corporation B.V. Mijdrecht, Netherlands 100
Bayer Chemicals AG Leverkusen, Germany 100
Bayer Consumer Care AG Basel, Switzerland 100
Bayer CropScience (Portugal)-Produtos para a Agricultura, Lda. Carnaxide, Portugal 100
Bayer CropScience 1272 Lyon, France 100
Bayer CropScience AG Monheim, Germany 100
Bayer CropScience B.V. Mijdrecht, Netherlands 100
Bayer CropScience Beteiligungsgesellschaft mbH Frankfurt am Main, Germany 100
Bayer CropScience Deutschland GmbH Langenfeld, Germany 100
Bayer CropScience Holding SA Lyon, France 100
Bayer CropScience Holdings Limited Cambridge, U.K. 100
Bayer CropScience Investments B.V. Mijdrecht, Netherlands 100
Bayer CropScience Limited Cambridge, U.K. 100
Bayer CropScience Norwich Limited Cambridge, U.K. 100
Bayer CropScience S.r.l. Milan, Italy 100
Bayer CropScience SA-NV Diegem, Belgium 100
Bayer CropScience, S.L. Valencia, Spain 100
Bayer CropScience Vermögensverwaltungs-gesellschaft mbH Leverkusen, Germany 100
Bayer d.o.o. Belgrade, Serbia 100
Bayer d.o.o. Ljubljana, Slovenia 100
Bayer d.o.o. Zagreb, Croatia 100
Bayer Direct Services GmbH Leverkusen, Germany 100
Bayer Foreign Investments B.V. Mijdrecht, Netherlands 100
Bayer Gastronomie GmbH Leverkusen, Germany 100
Bayer Gesellschaft für Beteiligungen mbH Leverkusen, Germany 100
Bayer Global Investments B.V. Mijdrecht, Netherlands 100
Fully Consolidated Subsidiaries [Table 4.19]
Table of ConTenTs
ConsolidaTed finanCial sTaTemenTs

BAYER ANNUAL REPORT 2010174 CONSOLIDATED FINANCIAL STATEMENTS
Notes6. Scope of consolidation; subsidiaries and affi liates
Company Name Place of Business Bayer’s interest
%
Bayer HealthCare AG Leverkusen, Germany 100
Bayer HealthCare Manufacturing S.r.l. Milan, Italy 100
Bayer Hellas AG Athens, Greece 100
Bayer Hispania, S.L. Sant Joan Despi, Spain 100
Bayer Hungaria Kft. Budapest, Hungary 100
Bayer Innovation GmbH Düsseldorf, Germany 100
Bayer International Investments B.V. Mijdrecht, Netherlands 100
Bayer International S.A. Fribourg, Switzerland 100
Bayer Limited Dublin, Ireland 100
Bayer Ltd. Kiev, Ukraine 100
Bayer MaterialScience AG Leverkusen, Germany 100
Bayer MaterialScience Customer Services GmbH Leverkusen, Germany 100
Bayer MaterialScience S.r.l. Milan, Italy 100
Bayer MaterialScience, S.L. Sant Joan Despi, Spain 100
Bayer Oy Turku, Finland 100
Bayer Pharma Investments B.V. Mijdrecht, Netherlands 100
Bayer Polyols S.N.C. Puteaux, France 100
Bayer Polyurethanes B.V. Mijdrecht, Netherlands 100
Bayer Portugal S.A. Lisbon, Portugal 100
Bayer Public Limited Company Newbury, U.K. 100
Bayer Real Estate GmbH Leverkusen, Germany 100
Bayer S.A.S. Puteaux, France 100
Bayer S.p.A. Milan, Italy 100
Bayer s.r.o. Prague, Czech Republic 100
Bayer Santé Familiale SAS Gaillard, France 100
Bayer Santé SAS Loos, France 100
Bayer SA-NV Diegem, Belgium 100
Bayer Schering Pharma AG Berlin, Germany 100
Bayer Sheet Europe GmbH Darmstadt, Germany 100
Bayer Sheet Europe N.V. Tielt, Belgium 100
Bayer Sheet Europe S.p.A. Milan, Italy 90
Bayer Sp. z o.o. Warsaw, Poland 100
Bayer, spol. s.r.o. Bratislava, Slovakia 100
Bayer Technology Services GmbH Leverkusen, Germany 100
Bayer Verwaltungsgesellschaft für Anlagevermögen m.b.H. Leverkusen, Germany 100
Bayer Vital GmbH Leverkusen, Germany 100
Bayer-Handelsgesellschaft mit beschränkter Haftung Leverkusen, Germany 100
Bayfi n GmbH Leverkusen, Germany 100
BaySystems B.V. Foxhol, Netherlands 100
BaySystems GmbH & Co. KG Oldenburg, Germany 100
Berlimed, S.A. Madrid, Spain 100
Berlis AG Zurich, Switzerland 100
Biogenetic Technologies B.V. Rotterdam, Netherlands 100
Chemie-Beteiligungsaktiengesellschaft Glarus, Switzerland 100
Chemion Logistik GmbH Leverkusen, Germany 100
Currenta GmbH & Co. OHG Leverkusen, Germany 60
Drugofa GmbH Cologne, Germany 100
Dynevo GmbH Leverkusen, Germany 100
Epurex Films GmbH & Co. KG Bomlitz, Germany 100
Erste K-W-A Beteiligungsgesellschaft mbH Leverkusen, Germany 100
Euroservices Bayer GmbH Leverkusen, Germany 100
Euroservices Bayer S.L. Sant Joan Despi, Spain 100
Fully Consolidated Subsidiaries [Table 4.19 (continued)]
Table of ConTenTs
ConsolidaTed finanCial sTaTemenTs

BAYER ANNUAL REPORT 2010 CONSOLIDATED FINANCIAL STATEMENTS 175
Notes6. Scope of consolidation; subsidiaries and affi liates
Company Name Place of Business Bayer’s interest
%
Generics Holding GmbH Leverkusen, Germany 100
GP Grenzach Produktions GmbH Grenzach-Wyhlen, Germany 100
Hild Samen GmbH Marbach am Neckar, Germany 100
Icon Genetics GmbH Munich, Germany 100
Intendis Austria Handels GesmbH Vienna, Austria 100
Intendis GmbH Berlin, Germany 100
Intendis Manufacturing S.p.A. Milan, Italy 100
Intendis S.p.A. Milan, Italy 100
Intraserv GmbH & Co. KG Schönefeld, Germany 100
Jenapharm GmbH & Co. KG Jena, Germany 100
KOSINUS Grundstücks-Verwaltungsgesellschaft mbH & Co. Gamma OHG Berlin, Germany 100
KVP Pharma+Veterinär Produkte GmbH Kiel, Germany 100
Marotrast GmbH Jena, Germany 100
Mediwest Norway AS Oslo, Norway 100
Medrad Belgium BVBA Antwerp, Belgium 100
Medrad Denmark ApS Glostrup, Denmark 100
Medrad Europe B.V. Maastricht, Netherlands 100
Medrad France S.A.R.L. Rungis Cedex, France 100
Medrad Italia S.r.l. Cava Manara, Italy 100
Medrad Medizinische Systeme GmbH Volkach, Germany 100
Medrad Sweden AB Mölndal, Sweden 100
Medrad UK Limited Ely, U.K. 100
MENADIER Heilmittel GmbH Berlin, Germany 100
Nunhems B.V. Nunhem, Netherlands 100
Nunhems France S.A.R.L. Soucelles, France 100
Nunhems Hungary Kft. Szolnok, Hungary 100
Nunhems Italy S.r.l. St. Agata Bolognes, Italy 100
Nunhems Netherlands B.V. Nunhem, Netherlands 100
Nunhems Poland Sp. z o.o. Poznan, Poland 100
Nunhems Spain, S.A. Valencia, Spain 100
Pallas Versicherung AG Leverkusen, Germany 100
pbi Home&Garden Limited Cambridge, U.K. 100
PGS International N.V. The Hague, Netherlands 100
Pharma-Verlagsbuchhandlung GmbH Berlin, Germany 100
SC Bayer SRL Bucharest, Romania 100
Schering AG Berlin, Germany 100
Schering Agrochemicals Holdings Burgess Hill, U.K. 100
Schering GmbH und Co. Produktions KG Weimar, Germany 100
Schering Health Care Limited Burgess Hill, U.K. 100
Schering Holdings Ltd. Burgess Hill, U.K. 100
Schering Industrial Products Burgess Hill, U.K. 100
Schering International Holding GmbH Berlin, Germany 100
Schering-Kahlbaum Gesellschaft mit beschränkter Haftung Berlin, Germany 100
TECTRION GmbH Leverkusen, Germany 100
TOO Bayer KAZ Astana, Kazakhstan 100
TravelBoard GmbH Leverkusen, Germany 100
UAB Bayer Vilnius, Lithuania 100
Viverso GmbH Bitterfeld-Wolfen, Germany 100
ZAO Bayer Moscow, Russia 100
Zweite K-W-A Beteiligungsgesellschaft mbH Leverkusen, Germany 100
Fully Consolidated Subsidiaries [Table 4.19 (continued)]
Table of ConTenTs
ConsolidaTed finanCial sTaTemenTs

BAYER ANNUAL REPORT 2010176 CONSOLIDATED FINANCIAL STATEMENTS
Notes6. Scope of consolidation; subsidiaries and affi liates
Company Name Place of Business Bayer’s interest
%
North AmericaAthenix Corp. Research Triangle Park, U.S.A. 100
Bayer Business and Technology Services LLC Pittsburgh, U.S.A. 100
Bayer Canadian Holdings Inc. Toronto, Canada 100
Bayer Corporation Pittsburgh, U.S.A. 100
Bayer Cotton Seed International Inc. Research Triangle Park, U.S.A. 51
Bayer CropScience Holding Inc. Research Triangle Park, U.S.A. 100
Bayer CropScience Holdings Inc. Calgary, Canada 100
Bayer CropScience Inc. Calgary, Canada 100
Bayer CropScience Inc. Research Triangle Park, U.S.A. 100
Bayer CropScience LLC Research Triangle Park, U.S.A. 100
Bayer CropScience LP Research Triangle Park, U.S.A. 100
Bayer HealthCare LLC Tarrytown, U.S.A. 100
Bayer HealthCare Pharmaceuticals Inc. Pine Brook, U.S.A. 100
Bayer HealthCare Pharmaceuticals LLC Seattle, U.S.A. 100
Bayer Inc. Toronto, Canada 100
Bayer MaterialScience LLC Pittsburgh, U.S.A. 100
Bayer Pharma Chemicals Inc. Pine Brook, U.S.A. 100
Bayer Puerto Rico Inc. San Juan, Puerto Rico 100
BayOne Urethane Systems LLC St. Louis, U.S.A. 100
Baypo I LLC New Martinsville, U.S.A. 100
Baypo II LLC New Martinsville, U.S.A. 100
BAYPO Limited Partnership New Martinsville, U.S.A. 100
BIPPO Corporation New Martinsville, U.S.A. 100
Collateral Therapeutics Inc. San Diego, U.S.A. 100
Cooper Land Company of New Jersey Inc. Tarrytown, U.S.A. 100
Guidance Interactive Healthcare Inc. Tarrytown, U.S.A. 100
Intendis Inc. Morristown, U.S.A. 100
iSense Corporation Wilsonville, U.S.A. 100
iSense Development Corporation Wilsonville, U.S.A. 100
Medrad, Inc. Indianola, U.S.A. 100
MTFP Inc. Wilmington, U.S.A. 100
NippoNex Inc. Springfi eld, U.S.A. 100
NOR-AM Agro LLC Pine Brook, U.S.A. 100
NOR-AM Land Company Pine Brook, U.S.A. 100
Nunhems USA, Inc. Morgan Hill, U.S.A. 100
Pallas North America Insurance Company, Inc. Burlington, U.S.A. 100
SB Capital Corporation Pine Brook, U.S.A. 100
Schering Berlin Inc. Pine Brook, U.S.A. 100
Schering Berlin Venture Corporation Pine Brook, U.S.A. 100
Stoneville Pedigreed Seed Company St. Louis, U.S.A. 100
STWB Inc. Pittsburgh, U.S.A. 100
Texas Brine Company LLC Houston, U.S.A. 0*
Asia / PacificBayer (Beijing) Sheet Company Limited Beijing, China 100
Bayer (China) Limited Beijing, China 100
Bayer (Malaysia) Sdn. Bhd. Petaling Jaya, Malaysia 100
Bayer (Sichuan) Animal Health Co., Ltd. Chengdu, China 100
Bayer (South East Asia) Pte Ltd. Singapore 100
Bayer Australia Limited Pymble, Australia 100
Bayer BioScience Pvt. Ltd. Hyderabad, India 100
Bayer Co. (Malaysia) Sdn Bhd. Petaling Jaya, Malaysia 100
Fully Consolidated Subsidiaries [Table 4.19 (continued)]
* fully consolidated special-purpose entity according to IAS 27 in conjunction with SIC 12
Table of ConTenTs
ConsolidaTed finanCial sTaTemenTs
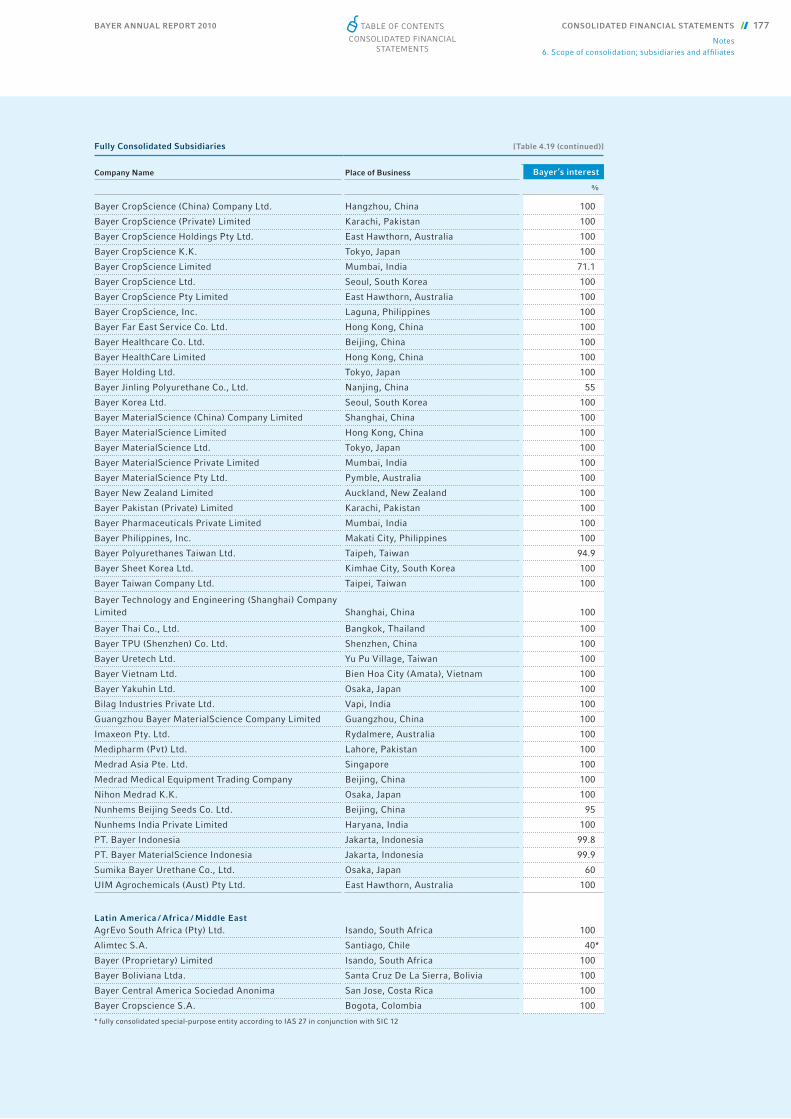
BAYER ANNUAL REPORT 2010 CONSOLIDATED FINANCIAL STATEMENTS 177
Notes6. Scope of consolidation; subsidiaries and affi liates
Company Name Place of Business Bayer’s interest
%
Bayer CropScience (China) Company Ltd. Hangzhou, China 100
Bayer CropScience (Private) Limited Karachi, Pakistan 100
Bayer CropScience Holdings Pty Ltd. East Hawthorn, Australia 100
Bayer CropScience K.K. Tokyo, Japan 100
Bayer CropScience Limited Mumbai, India 71.1
Bayer CropScience Ltd. Seoul, South Korea 100
Bayer CropScience Pty Limited East Hawthorn, Australia 100
Bayer CropScience, Inc. Laguna, Philippines 100
Bayer Far East Service Co. Ltd. Hong Kong, China 100
Bayer Healthcare Co. Ltd. Beijing, China 100
Bayer HealthCare Limited Hong Kong, China 100
Bayer Holding Ltd. Tokyo, Japan 100
Bayer Jinling Polyurethane Co., Ltd. Nanjing, China 55
Bayer Korea Ltd. Seoul, South Korea 100
Bayer MaterialScience (China) Company Limited Shanghai, China 100
Bayer MaterialScience Limited Hong Kong, China 100
Bayer MaterialScience Ltd. Tokyo, Japan 100
Bayer MaterialScience Private Limited Mumbai, India 100
Bayer MaterialScience Pty Ltd. Pymble, Australia 100
Bayer New Zealand Limited Auckland, New Zealand 100
Bayer Pakistan (Private) Limited Karachi, Pakistan 100
Bayer Pharmaceuticals Private Limited Mumbai, India 100
Bayer Philippines, Inc. Makati City, Philippines 100
Bayer Polyurethanes Taiwan Ltd. Taipeh, Taiwan 94.9
Bayer Sheet Korea Ltd. Kimhae City, South Korea 100
Bayer Taiwan Company Ltd. Taipei, Taiwan 100
Bayer Technology and Engineering (Shanghai) Company Limited Shanghai, China 100
Bayer Thai Co., Ltd. Bangkok, Thailand 100
Bayer TPU (Shenzhen) Co. Ltd. Shenzhen, China 100
Bayer Uretech Ltd. Yu Pu Village, Taiwan 100
Bayer Vietnam Ltd. Bien Hoa City (Amata), Vietnam 100
Bayer Yakuhin Ltd. Osaka, Japan 100
Bilag Industries Private Ltd. Vapi, India 100
Guangzhou Bayer MaterialScience Company Limited Guangzhou, China 100
Imaxeon Pty. Ltd. Rydalmere, Australia 100
Medipharm (Pvt) Ltd. Lahore, Pakistan 100
Medrad Asia Pte. Ltd. Singapore 100
Medrad Medical Equipment Trading Company Beijing, China 100
Nihon Medrad K.K. Osaka, Japan 100
Nunhems Beijing Seeds Co. Ltd. Beijing, China 95
Nunhems India Private Limited Haryana, India 100
PT. Bayer Indonesia Jakarta, Indonesia 99.8
PT. Bayer MaterialScience Indonesia Jakarta, Indonesia 99.9
Sumika Bayer Urethane Co., Ltd. Osaka, Japan 60
UIM Agrochemicals (Aust) Pty Ltd. East Hawthorn, Australia 100
Latin America / Africa / Middle EastAgrEvo South Africa (Pty) Ltd. Isando, South Africa 100
Alimtec S.A. Santiago, Chile 40*
Bayer (Proprietary) Limited Isando, South Africa 100
Bayer Boliviana Ltda. Santa Cruz De La Sierra, Bolivia 100
Bayer Central America Sociedad Anonima San Jose, Costa Rica 100
Bayer Cropscience S.A. Bogota, Colombia 100
Fully Consolidated Subsidiaries [Table 4.19 (continued)]
* fully consolidated special-purpose entity according to IAS 27 in conjunction with SIC 12
Table of ConTenTs
ConsolidaTed finanCial sTaTemenTs
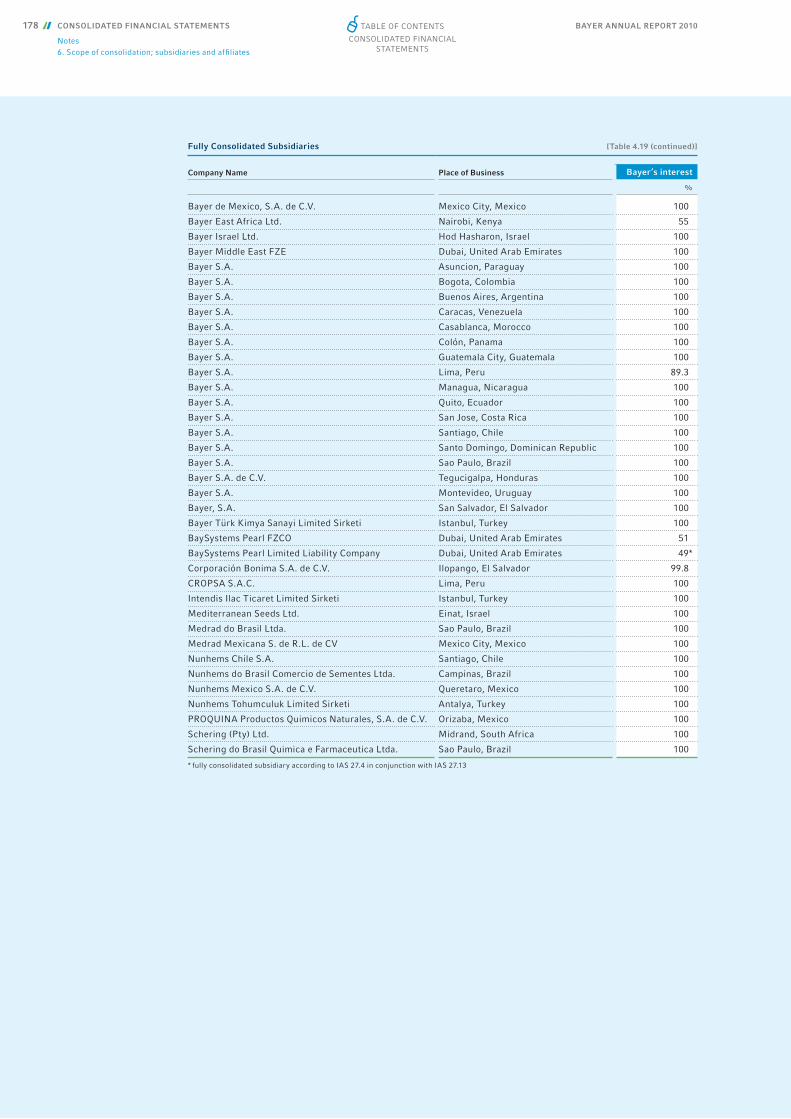
BAYER ANNUAL REPORT 2010178 CONSOLIDATED FINANCIAL STATEMENTS
Notes6. Scope of consolidation; subsidiaries and affi liates
Company Name Place of Business Bayer’s interest
%
Bayer de Mexico, S.A. de C.V. Mexico City, Mexico 100
Bayer East Africa Ltd. Nairobi, Kenya 55
Bayer Israel Ltd. Hod Hasharon, Israel 100
Bayer Middle East FZE Dubai, United Arab Emirates 100
Bayer S.A. Asuncion, Paraguay 100
Bayer S.A. Bogota, Colombia 100
Bayer S.A. Buenos Aires, Argentina 100
Bayer S.A. Caracas, Venezuela 100
Bayer S.A. Casablanca, Morocco 100
Bayer S.A. Colón, Panama 100
Bayer S.A. Guatemala City, Guatemala 100
Bayer S.A. Lima, Peru 89.3
Bayer S.A. Managua, Nicaragua 100
Bayer S.A. Quito, Ecuador 100
Bayer S.A. San Jose, Costa Rica 100
Bayer S.A. Santiago, Chile 100
Bayer S.A. Santo Domingo, Dominican Republic 100
Bayer S.A. Sao Paulo, Brazil 100
Bayer S.A. de C.V. Tegucigalpa, Honduras 100
Bayer S.A. Montevideo, Uruguay 100
Bayer, S.A. San Salvador, El Salvador 100
Bayer Türk Kimya Sanayi Limited Sirketi Istanbul, Turkey 100
BaySystems Pearl FZCO Dubai, United Arab Emirates 51
BaySystems Pearl Limited Liability Company Dubai, United Arab Emirates 49*
Corporación Bonima S.A. de C.V. Ilopango, El Salvador 99.8
CROPSA S.A.C. Lima, Peru 100
Intendis Ilac Ticaret Limited Sirketi Istanbul, Turkey 100
Mediterranean Seeds Ltd. Einat, Israel 100
Medrad do Brasil Ltda. Sao Paulo, Brazil 100
Medrad Mexicana S. de R.L. de CV Mexico City, Mexico 100
Nunhems Chile S.A. Santiago, Chile 100
Nunhems do Brasil Comercio de Sementes Ltda. Campinas, Brazil 100
Nunhems Mexico S.A. de C.V. Queretaro, Mexico 100
Nunhems Tohumculuk Limited Sirketi Antalya, Turkey 100
PROQUINA Productos Quimicos Naturales, S.A. de C.V. Orizaba, Mexico 100
Schering (Pty) Ltd. Midrand, South Africa 100
Schering do Brasil Quimica e Farmaceutica Ltda. Sao Paulo, Brazil 100
* fully consolidated subsidiary according to IAS 27.4 in conjunction with IAS 27.13
Fully Consolidated Subsidiaries [Table 4.19 (continued)]
Table of ConTenTs
ConsolidaTed finanCial sTaTemenTs
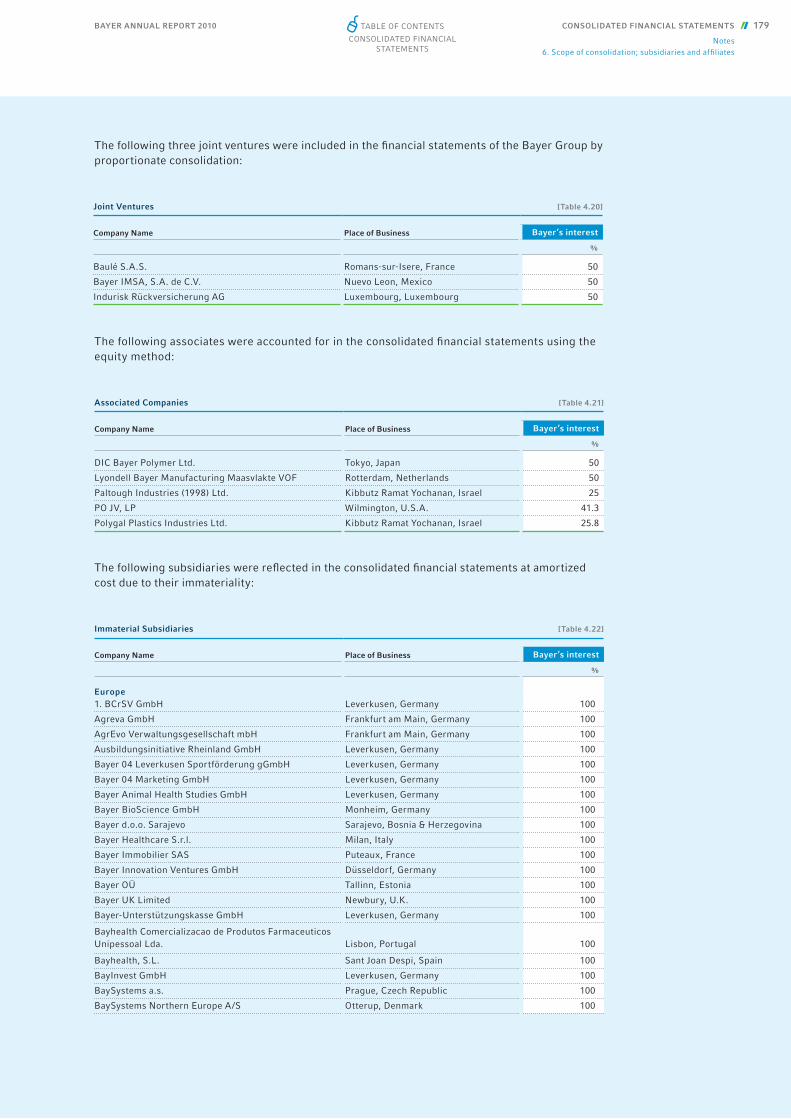
BAYER ANNUAL REPORT 2010 CONSOLIDATED FINANCIAL STATEMENTS 179
Notes6. Scope of consolidation; subsidiaries and affi liates
The following three joint ventures were included in the fi nancial statements of the Bayer Group by proportionate consolidation:
The following associates were accounted for in the consolidated fi nancial statements using the equity method:
The following subsidiaries were refl ected in the consolidated fi nancial statements at amortized cost due to their immateriality:
Company Name Place of Business Bayer’s interest
%
Europe1. BCrSV GmbH Leverkusen, Germany 100
Agreva GmbH Frankfurt am Main, Germany 100
AgrEvo Verwaltungsgesellschaft mbH Frankfurt am Main, Germany 100
Ausbildungsinitiative Rheinland GmbH Leverkusen, Germany 100
Bayer 04 Leverkusen Sportförderung gGmbH Leverkusen, Germany 100
Bayer 04 Marketing GmbH Leverkusen, Germany 100
Bayer Animal Health Studies GmbH Leverkusen, Germany 100
Bayer BioScience GmbH Monheim, Germany 100
Bayer d.o.o. Sarajevo Sarajevo, Bosnia & Herzegovina 100
Bayer Healthcare S.r.l. Milan, Italy 100
Bayer Immobilier SAS Puteaux, France 100
Bayer Innovation Ventures GmbH Düsseldorf, Germany 100
Bayer OÜ Tallinn, Estonia 100
Bayer UK Limited Newbury, U.K. 100
Bayer-Unterstützungskasse GmbH Leverkusen, Germany 100
Bayhealth Comercializacao de Produtos Farmaceuticos Unipessoal Lda. Lisbon, Portugal 100
Bayhealth, S.L. Sant Joan Despi, Spain 100
BayInvest GmbH Leverkusen, Germany 100
BaySystems a.s. Prague, Czech Republic 100
BaySystems Northern Europe A/S Otterup, Denmark 100
Joint Ventures [Table 4.20]
Company Name Place of Business Bayer’s interest
%
Baulé S.A.S. Romans-sur-Isere, France 50
Bayer IMSA, S.A. de C.V. Nuevo Leon, Mexico 50
Indurisk Rückversicherung AG Luxembourg, Luxembourg 50
Associated Companies [Table 4.21]
Company Name Place of Business Bayer’s interest
%
DIC Bayer Polymer Ltd. Tokyo, Japan 50
Lyondell Bayer Manufacturing Maasvlakte VOF Rotterdam, Netherlands 50
Paltough Industries (1998) Ltd. Kibbutz Ramat Yochanan, Israel 25
PO JV, LP Wilmington, U.S.A. 41.3
Polygal Plastics Industries Ltd. Kibbutz Ramat Yochanan, Israel 25.8
Immaterial Subsidiaries [Table 4.22]
Table of ConTenTs
ConsolidaTed finanCial sTaTemenTs
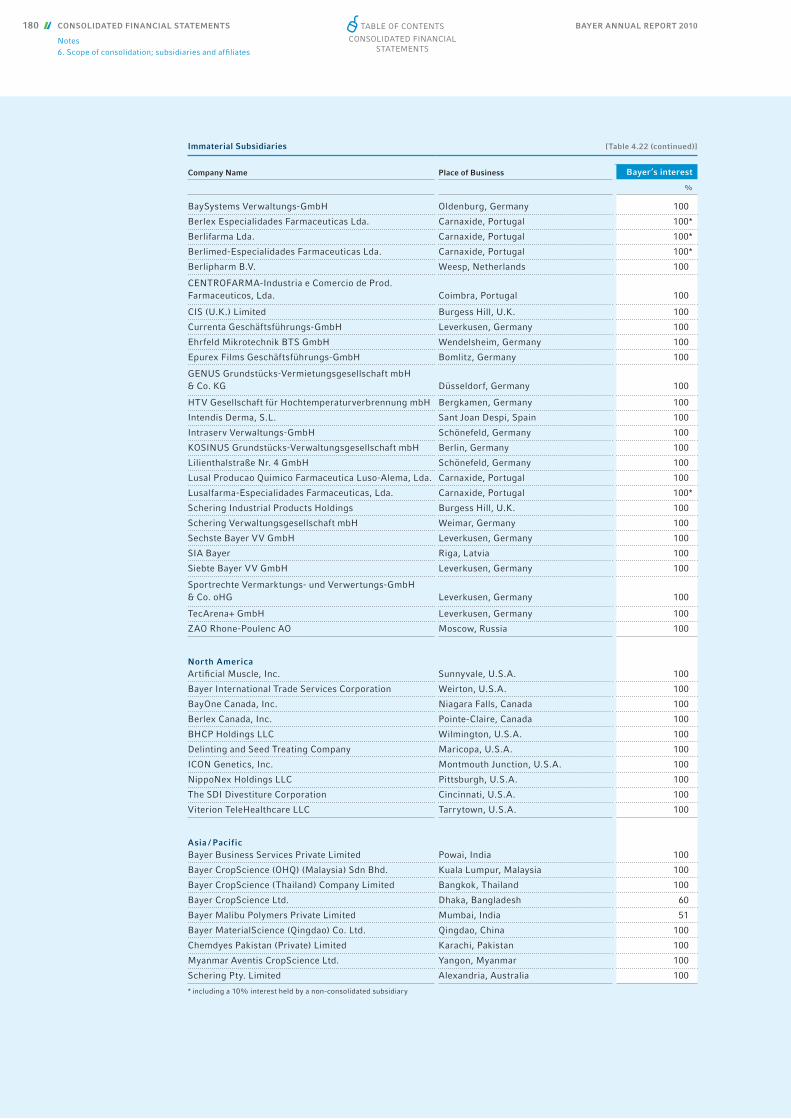
BAYER ANNUAL REPORT 2010180 CONSOLIDATED FINANCIAL STATEMENTS
Notes6. Scope of consolidation; subsidiaries and affi liates
* including a 10% interest held by a non-consolidated subsidiary
Company Name Place of Business Bayer’s interest
%
BaySystems Verwaltungs-GmbH Oldenburg, Germany 100
Berlex Especialidades Farmaceuticas Lda. Carnaxide, Portugal 100*
Berlifarma Lda. Carnaxide, Portugal 100*
Berlimed-Especialidades Farmaceuticas Lda. Carnaxide, Portugal 100*
Berlipharm B.V. Weesp, Netherlands 100
CENTROFARMA-Industria e Comercio de Prod. Farmaceuticos, Lda. Coimbra, Portugal 100
CIS (U.K.) Limited Burgess Hill, U.K. 100
Currenta Geschäftsführungs-GmbH Leverkusen, Germany 100
Ehrfeld Mikrotechnik BTS GmbH Wendelsheim, Germany 100
Epurex Films Geschäftsführungs-GmbH Bomlitz, Germany 100
GENUS Grundstücks-Vermietungsgesellschaft mbH & Co. KG Düsseldorf, Germany 100
HTV Gesellschaft für Hochtemperaturverbrennung mbH Bergkamen, Germany 100
Intendis Derma, S.L. Sant Joan Despi, Spain 100
Intraserv Verwaltungs-GmbH Schönefeld, Germany 100
KOSINUS Grundstücks-Verwaltungsgesellschaft mbH Berlin, Germany 100
Lilienthalstraße Nr. 4 GmbH Schönefeld, Germany 100
Lusal Producao Quimico Farmaceutica Luso-Alema, Lda. Carnaxide, Portugal 100
Lusalfarma-Especialidades Farmaceuticas, Lda. Carnaxide, Portugal 100*
Schering Industrial Products Holdings Burgess Hill, U.K. 100
Schering Verwaltungsgesellschaft mbH Weimar, Germany 100
Sechste Bayer VV GmbH Leverkusen, Germany 100
SIA Bayer Riga, Latvia 100
Siebte Bayer VV GmbH Leverkusen, Germany 100
Sportrechte Vermarktungs- und Verwertungs-GmbH & Co. oHG Leverkusen, Germany 100
TecArena+ GmbH Leverkusen, Germany 100
ZAO Rhone-Poulenc AO Moscow, Russia 100
North AmericaArtifi cial Muscle, Inc. Sunnyvale, U.S.A. 100
Bayer International Trade Services Corporation Weirton, U.S.A. 100
BayOne Canada, Inc. Niagara Falls, Canada 100
Berlex Canada, Inc. Pointe-Claire, Canada 100
BHCP Holdings LLC Wilmington, U.S.A. 100
Delinting and Seed Treating Company Maricopa, U.S.A. 100
ICON Genetics, Inc. Montmouth Junction, U.S.A. 100
NippoNex Holdings LLC Pittsburgh, U.S.A. 100
The SDI Divestiture Corporation Cincinnati, U.S.A. 100
Viterion TeleHealthcare LLC Tarrytown, U.S.A. 100
Asia / PacificBayer Business Services Private Limited Powai, India 100
Bayer CropScience (OHQ) (Malaysia) Sdn Bhd. Kuala Lumpur, Malaysia 100
Bayer CropScience (Thailand) Company Limited Bangkok, Thailand 100
Bayer CropScience Ltd. Dhaka, Bangladesh 60
Bayer Malibu Polymers Private Limited Mumbai, India 51
Bayer MaterialScience (Qingdao) Co. Ltd. Qingdao, China 100
Chemdyes Pakistan (Private) Limited Karachi, Pakistan 100
Myanmar Aventis CropScience Ltd. Yangon, Myanmar 100
Schering Pty. Limited Alexandria, Australia 100
Immaterial Subsidiaries [Table 4.22 (continued)]
Table of ConTenTs
ConsolidaTed finanCial sTaTemenTs

BAYER ANNUAL REPORT 2010 CONSOLIDATED FINANCIAL STATEMENTS 181
Notes6. Scope of consolidation; subsidiaries and affi liates
The following associates and joint ventures were accounted for at amortized cost due to their immateriality:
Company Name Place of Business Bayer’s interest
%
Latin America / Africa / Middle EastBayer Algerie S.P.A. Algiers, Algeria 100
Bayer Distribuidora de Produtos Quimicos e Farmaceuticos Ltda. Sao Paulo, Brazil 100
Bayer Parsian AG Tehran, Iran 100
Bayer Schering Pharma Mocambique, Lda. Maputo, Mozambique 100*
Bayer Zimbabwe (Private) Limited Harare, Zimbabwe 100
Centro Estrategico Canada Latinoamerica S.A. de C.V. Mexico City, Mexico 100
Comercial Interamericana, S.A. Guatemala City, Guatemala 100
Farmaco Ltda. Sao Paulo, Brazil 100
Industrias Gustafson, S.A. de C.V. Mexico City, Mexico 100
Laboratorio Berlimed S.A. Santiago, Chile 100
Miles, S.A. Guatemala Branch Guatemala City, Guatemala 100
Quimicas Unidas S.A. Havana, Cuba 100
Schering Peruana S.A. Lima, Peru 100
* including a 10% interest held by a non-consolidated subsidiary
Immaterial Associates and Joint Ventures [Table 4.23]
Company Name Place of Business Bayer’s interest
%
EuropeAxxam S.p.A. Milan, Italy 24.5
BaySecur GmbH Leverkusen, Germany 49
BaySports-Travel GmbH Leverkusen, Germany 50
BBB Management GmbH Campus Berlin-Buch Berlin, Germany 20
Disalfarm, S.A. Barcelona, Spain 33.3
EMP-Estrusione Materiali Plastici S.A. Stabio, Switzerland 42.1
Faserwerke Hüls GmbH Marl, Germany 50
INVITE GmbH Leverkusen, Germany 50
PYCO SA Mont de Marsan, France 47
Sauerstoff- und Stickstoffrohrleitungsgesellschaft mbH Krefeld, Germany 50
North AmericaSchein Pharmaceutical Canada, Inc. Toronto, Canada 50
Technology JV, L.P. Wilmington, U.S.A. 33.3
Asia / PacificCotton Growers Services Pty. Limited Wee Waa, Australia 50
Teijin-Bayer Polytec Ltd. Tokyo, Japan 50
Latin America / Africa / Middle EastBayer Middle East Limited Liability Company Dubai, United Arab Emirates 49
Coopers Environmental Health Pty Ltd. Pomona Gardens, South Africa 26
Polygal (Management) 1998 Ltd. Megiddo, Israel 25.7
Polygal (Marketing) Ltd. Limited Partnership Megiddo, Israel 25
Immaterial Subsidiaries [Table 4.22 (continued)]
Table of ConTenTs
ConsolidaTed finanCial sTaTemenTs

BAYER ANNUAL REPORT 2010182 CONSOLIDATED FINANCIAL STATEMENTS
Notes6. Scope of consolidation; subsidiaries and affi liates
The Bayer Group held between 5% and 20% of the voting rights of the following “large limited liability companies” as defi ned in Section 267 Paragraph 3 of the German Commercial Code:
The following domestic subsidiaries availed themselves in 2010 of certain exemptions granted under Section 264 Paragraph 3 and Section 264b of the German Commercial Code regarding the preparation, auditing and publication of fi nancial statements:
Company Name Place of Business Bayer’s interest
%
Bayer 04 Immobilien GmbH Leverkusen, Germany 100
Bayer 04 Leverkusen Fußball GmbH Leverkusen, Germany 100
Bayer Altersversorgung GmbH Leverkusen, Germany 100
Bayer Animal Health GmbH Leverkusen, Germany 100
Bayer Beteiligungsverwaltungsgesellschaft mbH Leverkusen, Germany 100
Bayer Bitterfeld GmbH Bitterfeld-Wolfen, Germany 100
Bayer Business Services GmbH Leverkusen, Germany 100
Bayer Chemicals AG Leverkusen, Germany 100
Bayer CropScience AG Monheim, Germany 100
Bayer Direct Services GmbH Leverkusen, Germany 100
Bayer Gastronomie GmbH Leverkusen, Germany 100
Bayer Gesellschaft für Beteiligungen mbH Leverkusen, Germany 100
Bayer HealthCare AG Leverkusen, Germany 100
Bayer Innovation GmbH Düsseldorf, Germany 100
Bayer MaterialScience AG Leverkusen, Germany 100
Bayer MaterialScience Customer Services GmbH Leverkusen, Germany 100
Bayer Real Estate GmbH Leverkusen, Germany 100
Bayer Schering Pharma AG Berlin, Germany 100
Bayer Technology Services GmbH Leverkusen, Germany 100
Bayer Verwaltungsgesellschaft für Anlagevermögen m.b.H. Leverkusen, Germany 100
Bayer Vital GmbH Leverkusen, Germany 100
Bayer-Handelsgesellschaft mit beschränkter Haftung Leverkusen, Germany 100
Bayfi n GmbH Leverkusen, Germany 100
BaySystems GmbH & Co. KG Oldenburg, Germany 100
Chemion Logistik GmbH Leverkusen, Germany 100
Currenta GmbH & Co. OHG Leverkusen, Germany 60
Drugofa GmbH Cologne, Germany 100
Dynevo GmbH Leverkusen, Germany 100
Epurex Films GmbH & Co. KG Bomlitz, Germany 100
Erste K-W-A Beteiligungsgesellschaft mbH Leverkusen, Germany 100
Euroservices Bayer GmbH Leverkusen, Germany 100
Generics Holding GmbH Leverkusen, Germany 100
GP Grenzach Produktions GmbH Grenzach-Wyhlen, Germany 100
Hild Samen GmbH Marbach am Neckar, Germany 100
Icon Genetics GmbH Munich, Germany 100
Intendis GmbH Berlin, Germany 100
Intraserv GmbH & Co. KG Schönefeld, Germany 100
German Exempt Subsidiaries [Table 4.25]
Other Interests in Large Limited Liability Companies [Table 4.24]
Company Name Place of Business Bayer’s interest
%
Hokusan Co. Ltd. Tokyo, Japan 19.8
Salzgewinnungsgesellschaft Westfalen mbH & Co. KG Ahaus, Germany 10
Table of ConTenTs
ConsolidaTed finanCial sTaTemenTs
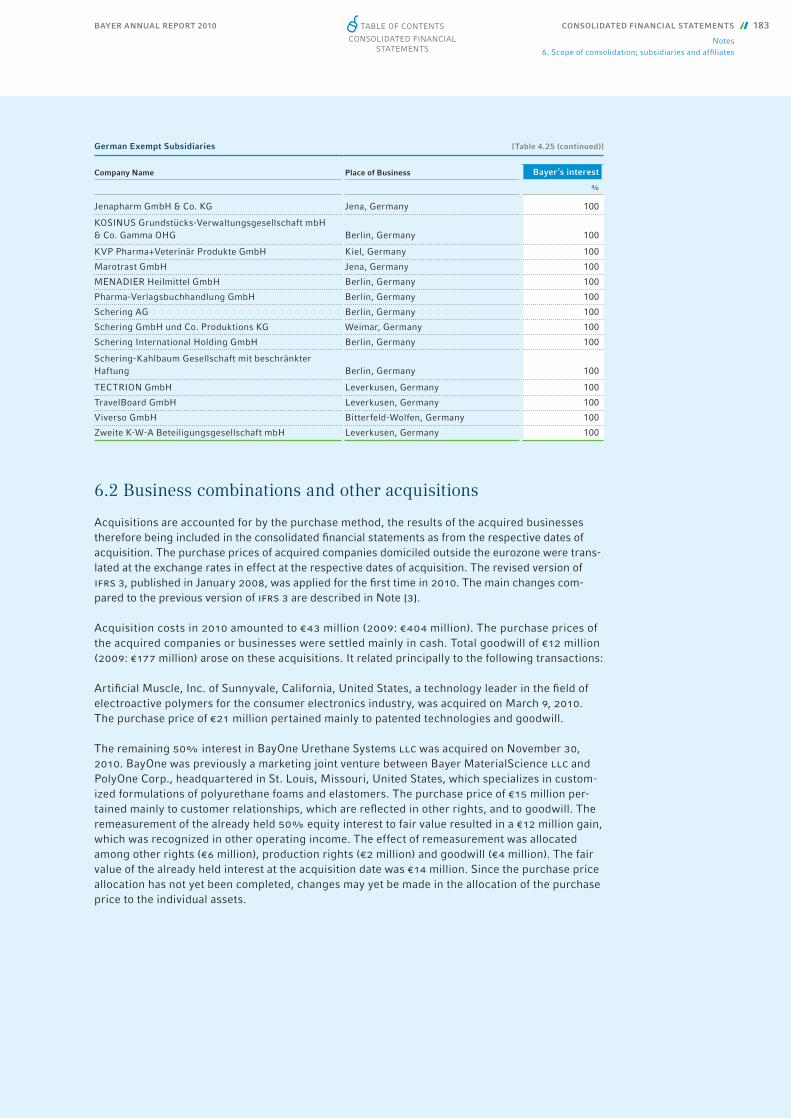
BAYER ANNUAL REPORT 2010 CONSOLIDATED FINANCIAL STATEMENTS 183
Notes6. Scope of consolidation; subsidiaries and affi liates
Company Name Place of Business Bayer’s interest
%
Jenapharm GmbH & Co. KG Jena, Germany 100
KOSINUS Grundstücks-Verwaltungsgesellschaft mbH & Co. Gamma OHG Berlin, Germany 100
KVP Pharma+Veterinär Produkte GmbH Kiel, Germany 100
Marotrast GmbH Jena, Germany 100
MENADIER Heilmittel GmbH Berlin, Germany 100
Pharma-Verlagsbuchhandlung GmbH Berlin, Germany 100
Schering AG Berlin, Germany 100
Schering GmbH und Co. Produktions KG Weimar, Germany 100
Schering International Holding GmbH Berlin, Germany 100
Schering-Kahlbaum Gesellschaft mit beschränkter Haftung Berlin, Germany 100
TECTRION GmbH Leverkusen, Germany 100
TravelBoard GmbH Leverkusen, Germany 100
Viverso GmbH Bitterfeld-Wolfen, Germany 100
Zweite K-W-A Beteiligungsgesellschaft mbH Leverkusen, Germany 100
6.2 Business combinations and other acquisitions
Acquisitions are accounted for by the purchase method, the results of the acquired businesses therefore being included in the consolidated fi nancial statements as from the respective dates of acquisition. The purchase prices of acquired companies domiciled outside the eurozone were trans-lated at the exchange rates in effect at the respective dates of acquisition. The revised version of ifrs 3, published in January 2008, was applied for the fi rst time in 2010. The main changes com-pared to the previous version of ifrs 3 are described in Note [3].
Acquisition costs in 2010 amounted to €43 million (2009: €404 million). The purchase prices of the acquired companies or businesses were settled mainly in cash. Total goodwill of €12 million (2009: €177 million) arose on these acquisitions. It related principally to the following trans actions:
Artifi cial Muscle, Inc. of Sunnyvale, California, United States, a technology leader in the fi eld of electroactive polymers for the consumer electronics industry, was acquired on March 9, 2010. The purchase price of €21 million pertained mainly to patented technologies and goodwill.
The remaining 50% interest in BayOne Urethane Systems llc was acquired on November 30, 2010. BayOne was previously a marketing joint venture between Bayer MaterialScience llc and PolyOne Corp., headquartered in St. Louis, Missouri, United States, which specializes in custom-ized formulations of polyurethane foams and elastomers. The purchase price of €15 million per-tained mainly to customer relationships, which are refl ected in other rights, and to goodwill. The remeasurement of the already held 50% equity interest to fair value resulted in a €12 million gain, which was recognized in other operating income. The effect of remeasurement was allocated among other rights (€6 million), production rights (€2 million) and goodwill (€4 million). The fair value of the already held interest at the acquisition date was €14 million. Since the purchase price allocation has not yet been completed, changes may yet be made in the allocation of the purchase price to the individual assets.
German Exempt Subsidiaries [Table 4.25 (continued)]
Table of ConTenTs
ConsolidaTed finanCial sTaTemenTs
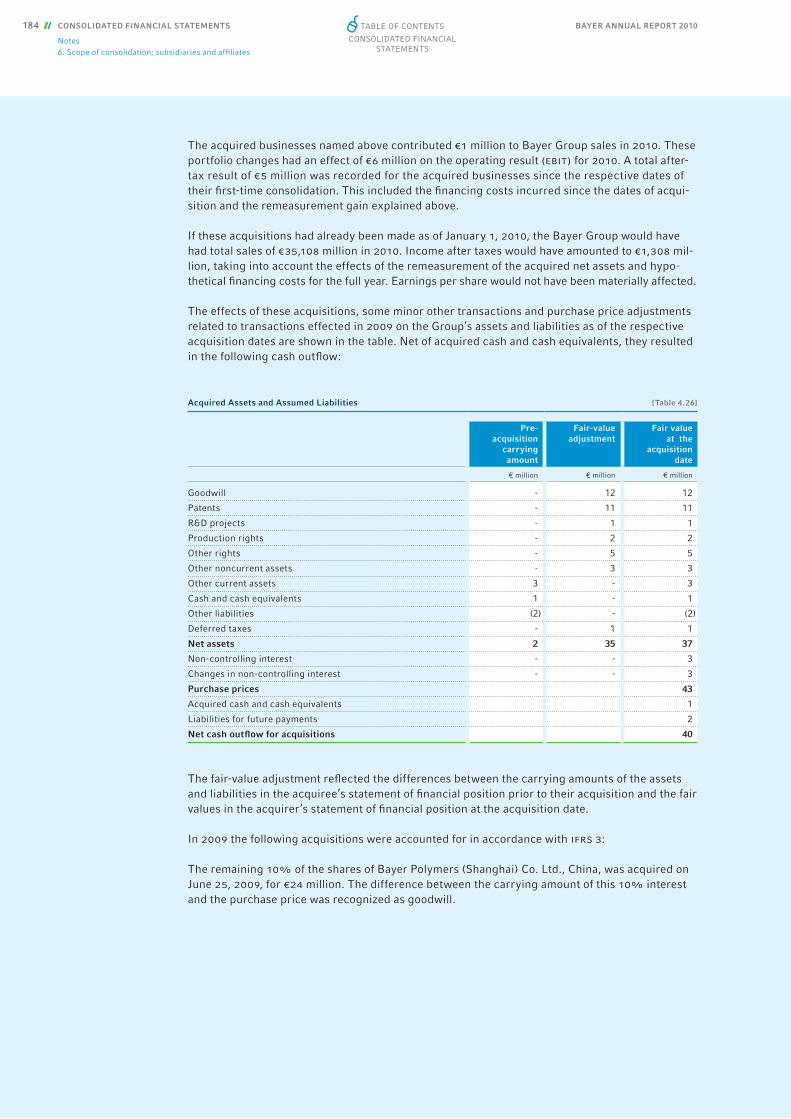
BAYER ANNUAL REPORT 2010184 CONSOLIDATED FINANCIAL STATEMENTS
Notes6. Scope of consolidation; subsidiaries and affi liates
The acquired businesses named above contributed €1 million to Bayer Group sales in 2010. These portfolio changes had an effect of €6 million on the operating result (ebit) for 2010. A total after-tax result of €5 million was recorded for the acquired businesses since the respective dates of their fi rst-time consolidation. This included the fi nancing costs incurred since the dates of acqui-sition and the remeasurement gain explained above.
If these acquisitions had already been made as of January 1, 2010, the Bayer Group would have had total sales of €35,108 million in 2010. Income after taxes would have amounted to €1,308 mil-lion, taking into account the effects of the remeasurement of the acquired net assets and hypo-thetical fi nancing costs for the full year. Earnings per share would not have been materially affected.
The effects of these acquisitions, some minor other transactions and purchase price adjustments related to trans actions effected in 2009 on the Group’s assets and liabilities as of the respective acquisition dates are shown in the table. Net of acquired cash and cash equivalents, they resulted in the following cash outfl ow:
The fair-value adjustment refl ected the differences between the carrying amounts of the assets and liabilities in the acquiree’s statement of fi nancial position prior to their acquisition and the fair values in the acquirer’s statement of fi nancial position at the acquisition date.
In 2009 the following acquisitions were accounted for in accordance with ifrs 3:
The remaining 10% of the shares of Bayer Polymers (Shanghai) Co. Ltd., China, was acquired on June 25, 2009, for €24 million. The difference between the carrying amount of this 10% interest and the purchase price was recognized as goodwill.
Acquired Assets and Assumed Liabilities [Table 4.26]
Pre-acquisition
carrying amount
Fair-value adjustment
Fair value at the
acquisition date
€ million € million € million
Goodwill - 12 12
Patents - 11 11
R&D projects - 1 1
Production rights - 2 2
Other rights - 5 5
Other noncurrent assets - 3 3
Other current assets 3 - 3
Cash and cash equivalents 1 - 1
Other liabilities (2) - (2)
Deferred taxes - 1 1
Net assets 2 35 37
Non-controlling interest - - 3
Changes in non-controlling interest - - 3
Purchase prices 43
Acquired cash and cash equivalents 1
Liabilities for future payments 2
Net cash outfl ow for acquisitions 40
Table of ConTenTs
ConsolidaTed finanCial sTaTemenTs

BAYER ANNUAL REPORT 2010 CONSOLIDATED FINANCIAL STATEMENTS 185
Notes6. Scope of consolidation; subsidiaries and affi liates
Two dermatology product lines were acquired from SkinMedica, Inc., Carlsbad, California, United States, on October 1, 2009, for €43 million. These prescription medications, Desonate® and Neo-Benz® Micro, are marketed in the United States. The main components of the difference between the carrying amount of the acquired net assets and the purchase price were €37 million pertaining to production rights and trademarks for the two product lines and €5 million of goodwill.
Athenix Corporation, a privately held biotechnology company headquartered in Research Triangle Park, North Carolina, United States, was acquired on November 2, 2009, for €286 million. The purchase price included future milestone payments of approximately €24 million that will fall due upon the achievement of certain development goals. Athenix has an extensive herbicide tolerance and insect control trait development platform, particularly for corn and soybeans. The main com-ponents of the difference between the carrying amount of the acquired net assets and the pur-chase price were €217 million that pertained to development technologies and were refl ected in other rights, €69 million in deferred taxes and €132 million of goodwill. The goodwill relates main-ly to the anticipated synergies from an increase in our ability to provide farmers worldwide with new technologies and complete agricultural solutions from seed to harvest.
The effects of these and other, smaller acquisitions made in 2009 on the Group’s assets and liabil-ities in that year as of the respective acquisition dates are shown in the table. Net of acquired cash and cash equivalents, they resulted in the following cash outfl ow:
Acquired Assets and Assumed Liabilities (Previous Year) [Table 4.27]
Pre-acquisition
carrying amount
Fair value adjustment
Fair value at the
acquisition date
€ million € million € million
Goodwill - 177 177
Patents - 1 1
Trademarks - 3 3
R&D projects - 4 4
Marketing rights - 2 2
Production rights - 34 34
Other rights 3 226 229
Property, plant and equipment 5 - 5
Inventories - 1 1
Cash and cash equivalents 12 - 12
Financial liabilities (1) - (1)
Other liabilities (7) - (7)
Deferred taxes - (71) (71)
Net assets 12 377 389
Non-controlling interest - - 15
Purchase prices 404
of which ancillary acquisition costs 2
Acquired cash and cash equivalents 12
Liabilities for future payments 38
Net cash outfl ow for acquisitions 354
Table of ConTenTs
ConsolidaTed finanCial sTaTemenTs
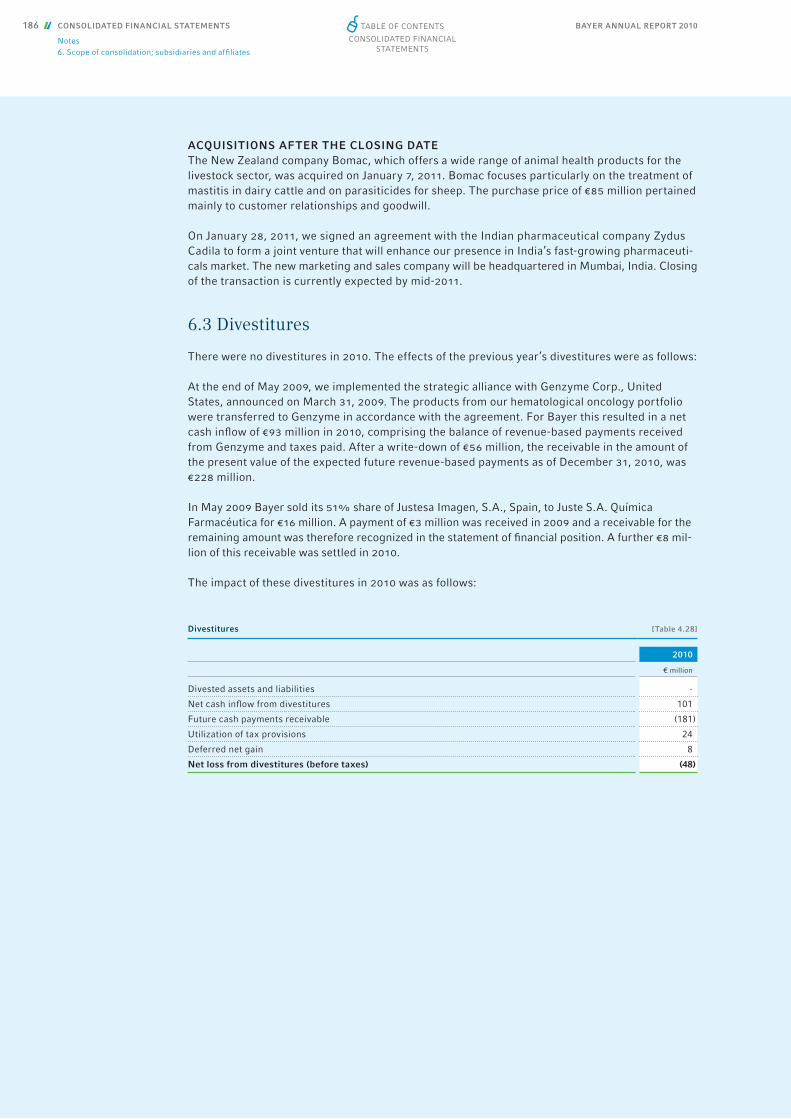
BAYER ANNUAL REPORT 2010186 CONSOLIDATED FINANCIAL STATEMENTS
Notes6. Scope of consolidation; subsidiaries and affi liates
ACQUISITIONS AFTER THE CLOSING DATEThe New Zealand company Bomac, which offers a wide range of animal health products for the livestock sector, was acquired on January 7, 2011. Bomac focuses particularly on the treatment of mastitis in dairy cattle and on parasiticides for sheep. The purchase price of €85 million pertained mainly to customer relationships and goodwill.
On January 28, 2011, we signed an agreement with the Indian pharmaceutical company Zydus Cadila to form a joint venture that will enhance our presence in India’s fast-growing pharmaceuti-cals market. The new marketing and sales company will be headquartered in Mumbai, India. Closing of the transaction is currently expected by mid-2011.
6.3 Divestitures
There were no divestitures in 2010. The effects of the previous year’s divestitures were as follows:
At the end of May 2009, we implemented the strategic alliance with Genzyme Corp., United States, announced on March 31, 2009. The products from our hematological oncology portfolio were transferred to Genzyme in accordance with the agreement. For Bayer this resulted in a net cash infl ow of €93 million in 2010, comprising the balance of revenue-based payments received from Genzyme and taxes paid. After a write-down of €56 million, the receivable in the amount of the present value of the expected future revenue-based payments as of December 31, 2010, was €228 million.
In May 2009 Bayer sold its 51% share of Justesa Imagen, S.A., Spain, to Juste S.A. Química Farmacéutica for €16 million. A payment of €3 million was received in 2009 and a receivable for the remaining amount was therefore recognized in the statement of fi nancial position. A further €8 mil-lion of this receivable was settled in 2010.
The impact of these divestitures in 2010 was as follows:
Divestitures [Table 4.28]
2010
€ million
Divested assets and liabilities -
Net cash infl ow from divestitures 101
Future cash payments receivable (181)
Utilization of tax provisions 24
Deferred net gain 8
Net loss from divestitures (before taxes) (48)
Table of ConTenTs
ConsolidaTed finanCial sTaTemenTs

BAYER ANNUAL REPORT 2010 CONSOLIDATED FINANCIAL STATEMENTS 187
Notes7. Net sales
Notes to the Income Statements
7. Net salesNet sales are derived primarily from product deliveries. Total reported net sales increased by €3,920 million, or 12.6%, from 2009 to €35,088 million in 2010. The increase resulted from the following factors:
Breakdowns of net sales by segment and by region are given in the table in Note [1].
8. Selling expensesSelling expenses comprise all expenses incurred in the reporting period for the sale, storage and transportation of saleable products, advertising, the provision of advice to customers, and market research. They mainly included €4,063 million (2009: €3,755 million) for the internal and external sales force, €2,032 million (2009: €1,860 million) for advertising and customer advice, €1,119 million (2009: €952 million) for the physical distribution and warehousing of fi nished products, €566 million (2009: €514 million) in commission and licensing expenses, and €1,023 million (2009: €842 million) in other selling expenses.
9. Research and development expensesResearch and development expenses and their accounting treatment are defi ned in Note [4]. Breakdowns of research and development expenses by segment and region are given in Note [1].
Factors in Sales Development [Table 4.29]
2010
€ million %
Volume 2,073 + 6.7
Price 413 + 1.3
Portfolio (92) -0.3
Currency 1,526 + 4.9
Total 3,920 + 12.6
Table of ConTenTs
ConsolidaTed finanCial sTaTemenTs
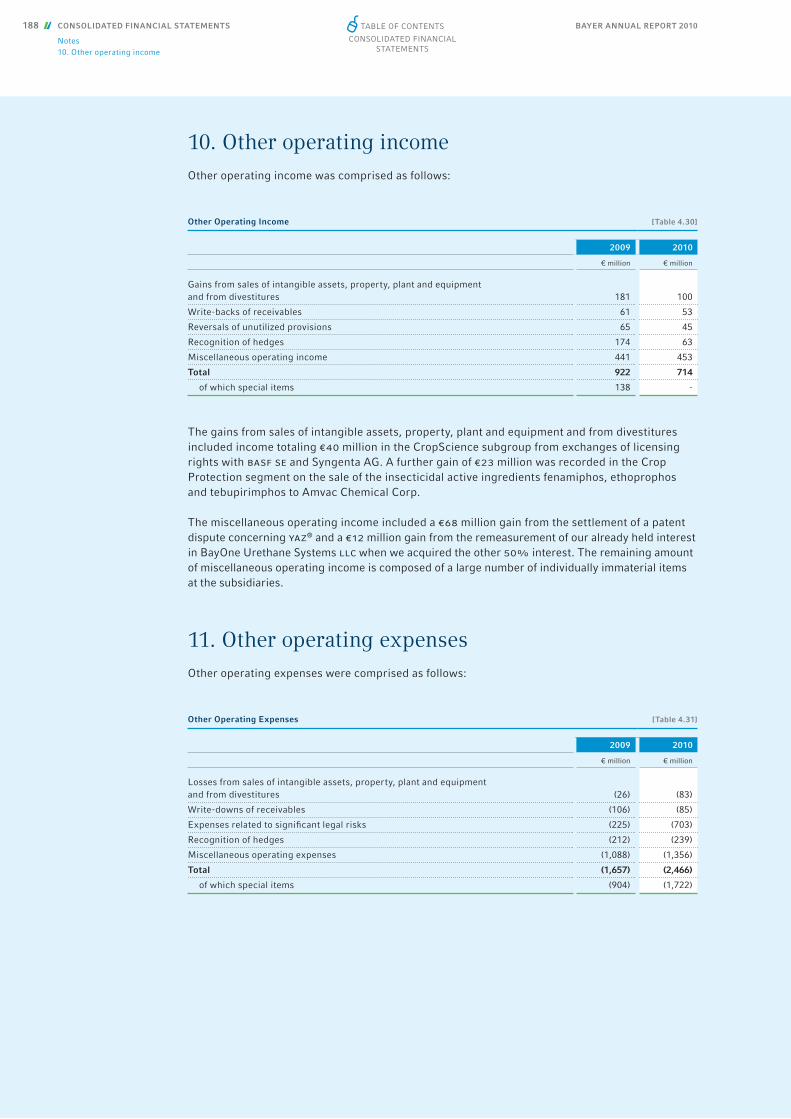
BAYER ANNUAL REPORT 2010188 CONSOLIDATED FINANCIAL STATEMENTS
Notes10. Other operating income
10. Other operating incomeOther operating income was comprised as follows:
The gains from sales of intangible assets, property, plant and equipment and from divestitures included income totaling €40 million in the CropScience subgroup from exchanges of licensing rights with basf se and Syngenta AG. A further gain of €23 million was recorded in the Crop Protection segment on the sale of the insecticidal active ingredients fenamiphos, ethoprophos and tebupirimphos to Amvac Chemical Corp.
The miscellaneous operating income included a €68 million gain from the settlement of a patent dispute concerning yaz® and a €12 million gain from the remeasurement of our already held interest in BayOne Urethane Systems llc when we acquired the other 50% interest. The remaining amount of miscellaneous operating income is composed of a large number of individually immaterial items at the subsidiaries.
11. Other operating expensesOther operating expenses were comprised as follows:
Other Operating Income [Table 4.30]
2009 2010
€ million € million
Gains from sales of intangible assets, property, plant and equipmentand from divestitures 181 100
Write-backs of receivables 61 53
Reversals of unutilized provisions 65 45
Recognition of hedges 174 63
Miscellaneous operating income 441 453
Total 922 714
of which special items 138 -
Other Operating Expenses [Table 4.31]
2009 2010
€ million € million
Losses from sales of intangible assets, property, plant and equipmentand from divestitures (26) (83)
Write-downs of receivables (106) (85)
Expenses related to signifi cant legal risks (225) (703)
Recognition of hedges (212) (239)
Miscellaneous operating expenses (1,088) (1,356)
Total (1,657) (2,466)
of which special items (904) (1,722)
Table of ConTenTs
ConsolidaTed finanCial sTaTemenTs
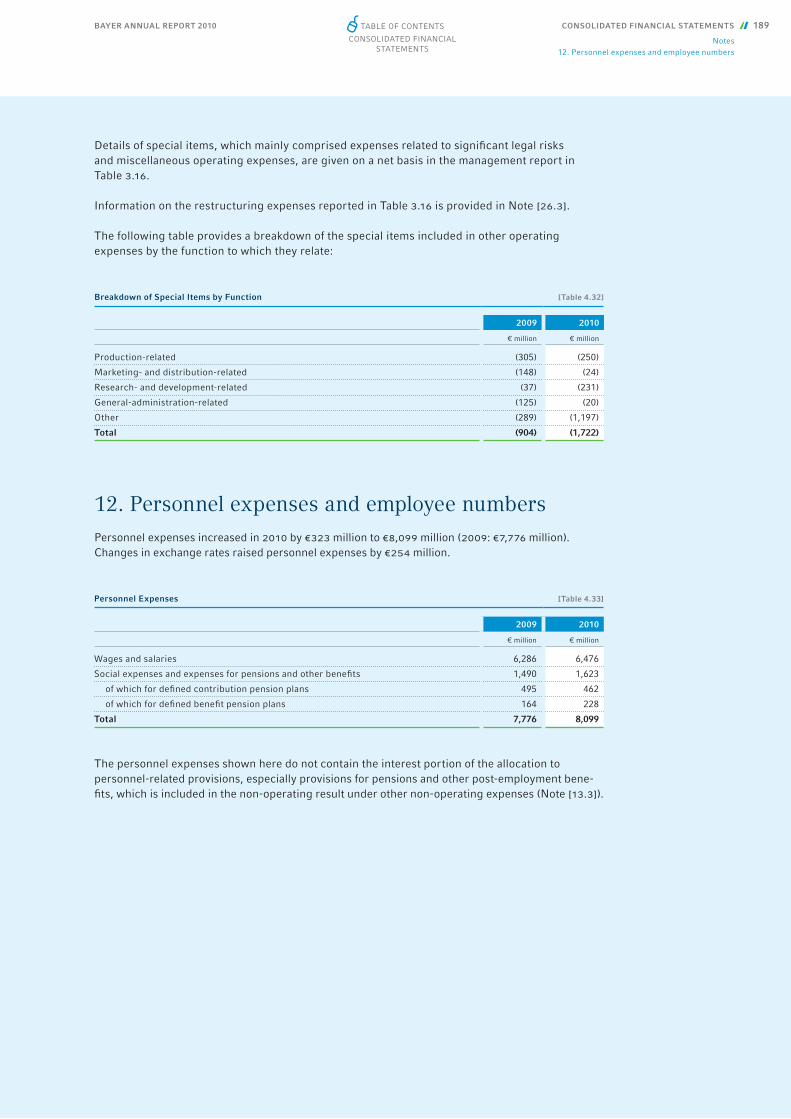
BAYER ANNUAL REPORT 2010 CONSOLIDATED FINANCIAL STATEMENTS 189
Notes12. Personnel expenses and employee numbers
Details of special items, which mainly comprised expenses related to signifi cant legal risks and miscellaneous operating expenses, are given on a net basis in the management report in Table 3.16.
Information on the restructuring expenses reported in Table 3.16 is provided in Note [26.3].
The following table provides a breakdown of the special items included in other operating expenses by the function to which they relate:
12. Personnel expenses and employee numbersPersonnel expenses increased in 2010 by €323 million to €8,099 million (2009: €7,776 million). Changes in exchange rates raised personnel expenses by €254 million.
The personnel expenses shown here do not contain the interest portion of the allocation to personnel-related provisions, especially provisions for pensions and other post-employment bene-fi ts, which is included in the non-operating result under other non-operating expenses (Note [13.3]).
Breakdown of Special Items by Function [Table 4.32]
2009 2010
€ million € million
Production-related (305) (250)
Marketing- and distribution-related (148) (24)
Research- and development-related (37) (231)
General-administration-related (125) (20)
Other (289) (1,197)
Total (904) (1,722)
Personnel Expenses [Table 4.33]
2009 2010
€ million € million
Wages and salaries 6,286 6,476
Social expenses and expenses for pensions and other benefi ts 1,490 1,623
of which for defi ned contribution pension plans 495 462
of which for defi ned benefi t pension plans 164 228
Total 7,776 8,099
Table of ConTenTs
ConsolidaTed finanCial sTaTemenTs
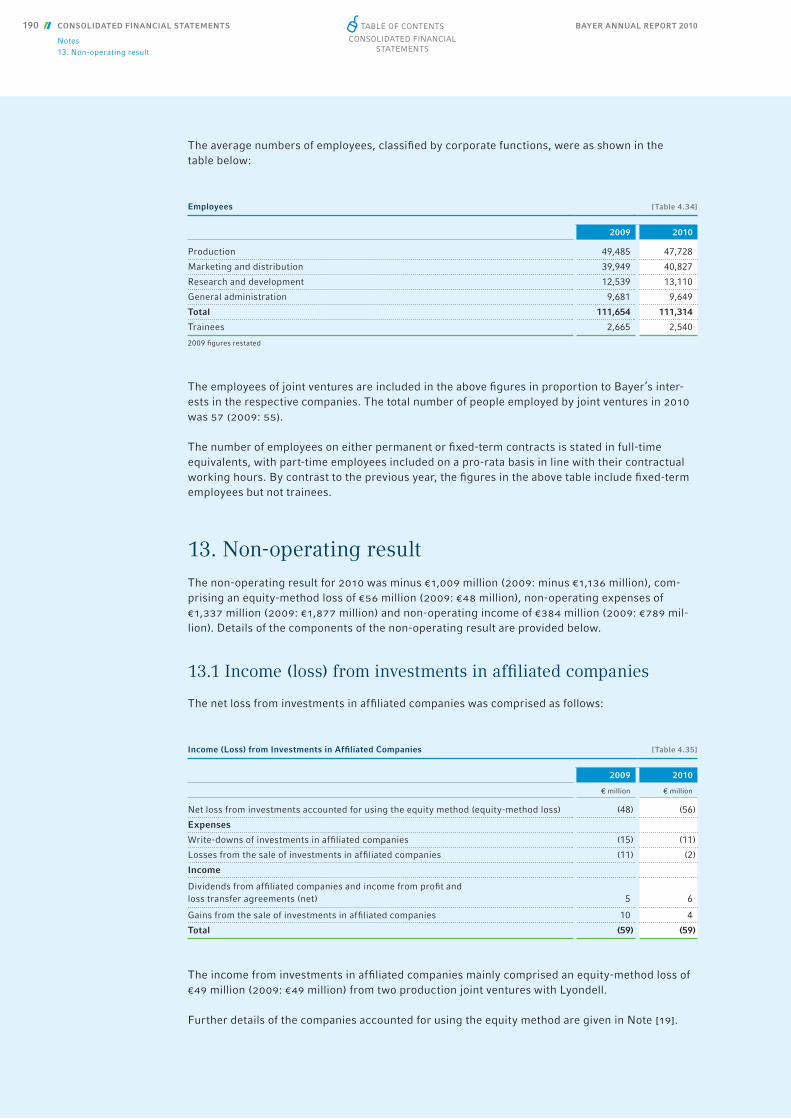
BAYER ANNUAL REPORT 2010190 CONSOLIDATED FINANCIAL STATEMENTS
Notes13. Non-operating result
The average numbers of employees, classifi ed by corporate functions, were as shown in the table below:
The employees of joint ventures are included in the above fi gures in proportion to Bayer’s inter-ests in the respective companies. The total number of people employed by joint ventures in 2010 was 57 (2009: 55).
The number of employees on either permanent or fi xed-term contracts is stated in full-time equivalents, with part-time employees included on a pro-rata basis in line with their contractual working hours. By contrast to the previous year, the fi gures in the above table include fi xed-term employees but not trainees.
13. Non-operating resultThe non-operating result for 2010 was minus €1,009 million (2009: minus €1,136 million), com-prising an equity-method loss of €56 million (2009: €48 million), non-operating expenses of €1,337 million (2009: €1,877 million) and non-operating income of €384 million (2009: €789 mil-lion). Details of the components of the non-operating result are provided below.
13.1 Income (loss) from investments in affi liated companies
The net loss from investments in affi liated companies was comprised as follows:
The income from investments in affi liated companies mainly comprised an equity-method loss of €49 million (2009: €49 million) from two production joint ventures with Lyondell.
Further details of the companies accounted for using the equity method are given in Note [19].
Employees [Table 4.34]
2009 2010
Production 49,485 47,728
Marketing and distribution 39,949 40,827
Research and development 12,539 13,110
General administration 9,681 9,649
Total 111,654 111,314
Trainees 2,665 2,540
2009 fi gures restated
Income (Loss) from Investments in Affi liated Companies [Table 4.35]
2009 2010
€ million € million
Net loss from investments accounted for using the equity method (equity-method loss) (48) (56)
Expenses
Write-downs of investments in affi liated companies (15) (11)
Losses from the sale of investments in affi liated companies (11) (2)
Income
Dividends from affi liated companies and income from profi t and loss transfer agreements (net) 5 6
Gains from the sale of investments in affi liated companies 10 4
Total (59) (59)
Table of ConTenTs
ConsolidaTed finanCial sTaTemenTs

BAYER ANNUAL REPORT 2010 CONSOLIDATED FINANCIAL STATEMENTS 191
Notes13. Non-operating result
13.2 Net interest expense
The net interest expense was comprised as follows:
The expenses included interest expense of €54 million (2009: €20 million) relating to non- fi nancial liabilities. Income included interest income of €40 million (2009: €77 million) from non-fi nancial assets. The portion of net income or loss attributable to non-controlling interest to which the company has a repayment obligation out of total assets is refl ected in net interest expense. Pro-rated income of €15 million (2009: €14 million) was recognized as interest expense in this context.
13.3 Other non-operating income and expenses
Other non-operating income and expenses were comprised as follows:
The interest portion of noncurrent interest-bearing provisions mainly related to pension provisions.
Net Interest Expense [Table 4.36]
2009 2010
€ million € million
Expenses
Interest and similar expenses (815) (690)
Interest expenses for derivatives (held for trading) (490) (180)
Income
Interest and similar income 267 219
Interest income from derivatives (held for trading) 490 152
Total (548) (499)
Other Non-Operating Income and Expenses [Table 4.37]
2009 2010
€ million € million
Expenses
Interest portion of interest-bearing provisions (436) (372)
Exchange loss (92) (70)
Miscellaneous non-operating expenses (16) (11)
Income
Miscellaneous non-operating income 15 2
Total (529) (451)
Table of ConTenTs
ConsolidaTed finanCial sTaTemenTs
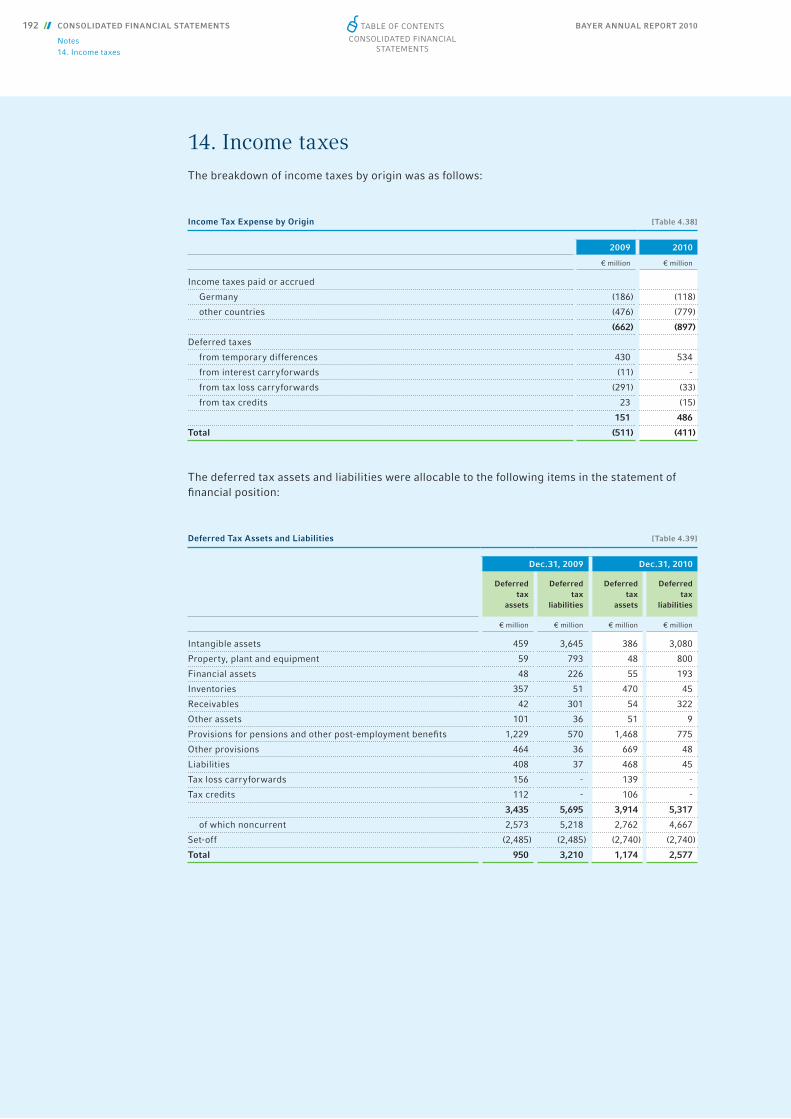
BAYER ANNUAL REPORT 2010192 CONSOLIDATED FINANCIAL STATEMENTS
Notes14. Income taxes
14. Income taxesThe breakdown of income taxes by origin was as follows:
The deferred tax assets and liabilities were allocable to the following items in the statement of fi nancial position:
Income Tax Expense by Origin [Table 4.38]
2009 2010
€ million € million
Income taxes paid or accrued
Germany (186) (118)
other countries (476) (779)
(662) (897)
Deferred taxes
from temporary differences 430 534
from interest carryforwards (11) -
from tax loss carryforwards (291) (33)
from tax credits 23 (15)
151 486
Total (511) (411)
Deferred Tax Assets and Liabilities [Table 4.39]
Dec.31, 2009 Dec.31, 2010
Deferred tax
assets
Deferred tax
liabilities
Deferred tax
assets
Deferred tax
liabilities
€ million € million € million € million
Intangible assets 459 3,645 386 3,080
Property, plant and equipment 59 793 48 800
Financial assets 48 226 55 193
Inventories 357 51 470 45
Receivables 42 301 54 322
Other assets 101 36 51 9
Provisions for pensions and other post-employment benefi ts 1,229 570 1,468 775
Other provisions 464 36 669 48
Liabilities 408 37 468 45
Tax loss carryforwards 156 - 139 -
Tax credits 112 - 106 -
3,435 5,695 3,914 5,317
of which noncurrent 2,573 5,218 2,762 4,667
Set-off (2,485) (2,485) (2,740) (2,740)
Total 950 3,210 1,174 2,577
Table of ConTenTs
ConsolidaTed finanCial sTaTemenTs

BAYER ANNUAL REPORT 2010 CONSOLIDATED FINANCIAL STATEMENTS 193
Notes14. Income taxes
Deferred tax assets from actuarial gains and losses, recognized outside profi t or loss, on defi ned benefi t obligations for pensions and other post-employment benefi ts increased equity by €258 million (2009: €117 million). Changes in fair values of available-for-sale fi nancial assets and derivatives designated as hedges, recognized outside profi t or loss, resulted in deferred tax assets that increased equity by €25 million (2009: deferred tax liabilities that diminished equity by €36 million). These effects on equity are refl ected in the statement of comprehensive income.
The utilization of tax loss carryforwards reduced the income taxes paid or accrued in 2010 by €102 million (2009: €260 million). The utilization of tax credits reduced income taxes paid or accrued by €12 million (2009: €6 million).
Of the total tax loss carryforwards of €929 million in 2010 (2009: €1,047 million), an amount of €670 million (2009: €579 million) can probably be utilized within a reasonable period. Deferred tax assets of €139 million (2009: €156 million) were recognized on this amount. The deferred tax assets included €6 million (2009: €13 million) that resulted from purchase price allocations and was recognized outside profi t or loss.
The utilization of €259 million (2009: €468 million) of tax loss carryforwards was subject to legal or economic restrictions. Consequently, no deferred tax assets were recognized for this amount. If it had been probable that these tax loss carryforwards could be utilized, deferred tax assets of €67 million (2009: €137 million) would have had to be recognized.
Tax credits of €106 million (2009: €112 million) were recognized as deferred tax assets, including €0 million (2009: €1 million) outside profi t or loss. The utilization of €51 million (2009: €32 mil-lion) of tax credits was subject to legal or economic restrictions. Consequently, no deferred tax assets were recognized for this amount.
Unusable tax credits and tax loss carryforwards expired as follows:
Expiration of Unusable Tax Credits and Tax Loss Carryforwards [Table 4.40]
Tax credits Tax loss carryforwards
Dec. 31, 2009
Dec. 31, 2010
Dec. 31, 2009
Dec. 31, 2010
€ million € million € million € million
One year - - - -
Two years - 2 23 -
Three years - 22 28 -
Four years - - 39 -
Five years - - 123 10
Thereafter 32 27 255 249
Total 32 51 468 259
Table of ConTenTs
ConsolidaTed finanCial sTaTemenTs

BAYER ANNUAL REPORT 2010194 CONSOLIDATED FINANCIAL STATEMENTS
Notes14. Income taxes
In 2010, subsidiaries that reported losses for 2010 or 2009 recognized net deferred tax assets totaling €268 million (2009: €40 million) on temporary differences and tax loss carryforwards. These assets were considered to be unimpaired because the companies concerned were expect-ed to generate taxable income in the future.
Deferred tax liabilities of €14 million were recognized in 2010 (2009: €14 million) for planned dividend payments by subsidiaries. Deferred tax liabilities were not recognized for temporary differences on €9,687 million (2009: €8,054 million) of retained earnings of subsidiaries and associates because the Bayer Group is able to control the timing of the difference reversal and the temporary differences will not reverse in the foreseeable future.
The reported tax expense of €411 million for 2010 (2009: €511 million) differed by €32 million (2009: €36 million) from the expected tax expense of €443 million (2009: €547 million) that would have resulted from applying an expected weighted average tax rate to the pre-tax income of the Group. This average rate was derived from the expected tax rates of the individual Group companies and was 25.7% in 2010 (2009: 29.3%). The effective tax rate was 23.9% (2009: 27.3%).
The reconciliation of expected to reported income tax expense and of the expected to the effec-tive tax rate for the Group was as follows:
Reconciliation of Expected to Actual Income Tax Expense [Table 4.41]
2009 2010
€ million % € million %
Expected income tax expense (income) and expected tax rate 547 29.3 443 25.7
Reduction in taxes due to tax-free income
Income from affi liated companies and divestiture proceeds (9) (0.5) (10) (0.6)
Other (41) (2.2) (41) (2.4)
First-time recognition of previously unrecognized deferred tax assets on tax loss carryforwards (2) (0.1) (27) (1.6)
Use of tax loss carryforwards on which deferred tax assets were not previously recognized (1) (0.1) (13) (0.8)
Increase in taxes due to non-tax-deductible expenses
Write-downs of investments in affi liated companies 5 0.3 1 0.1
Expenses related to litigations 1 0.1 2 0.1
Other 103 5.5 80 4.7
New tax loss carryforwards unlikely to be usable 10 0.5 43 2.5
Existing tax loss carryforwards on which deferred tax assets were previously recognized but which are unlikely to be usable 23 1.2 4 0.2
Tax income and expenses relating to other periods (129) (6.9) 3 0.2
Tax effects of changes in tax rates (18) (1.0) (2) (0.1)
Other tax effects 22 1.2 (72) (4.1)
Actual income tax expense (income) and effective tax rate 511 27.3 411 23.9
Table of ConTenTs
ConsolidaTed finanCial sTaTemenTs
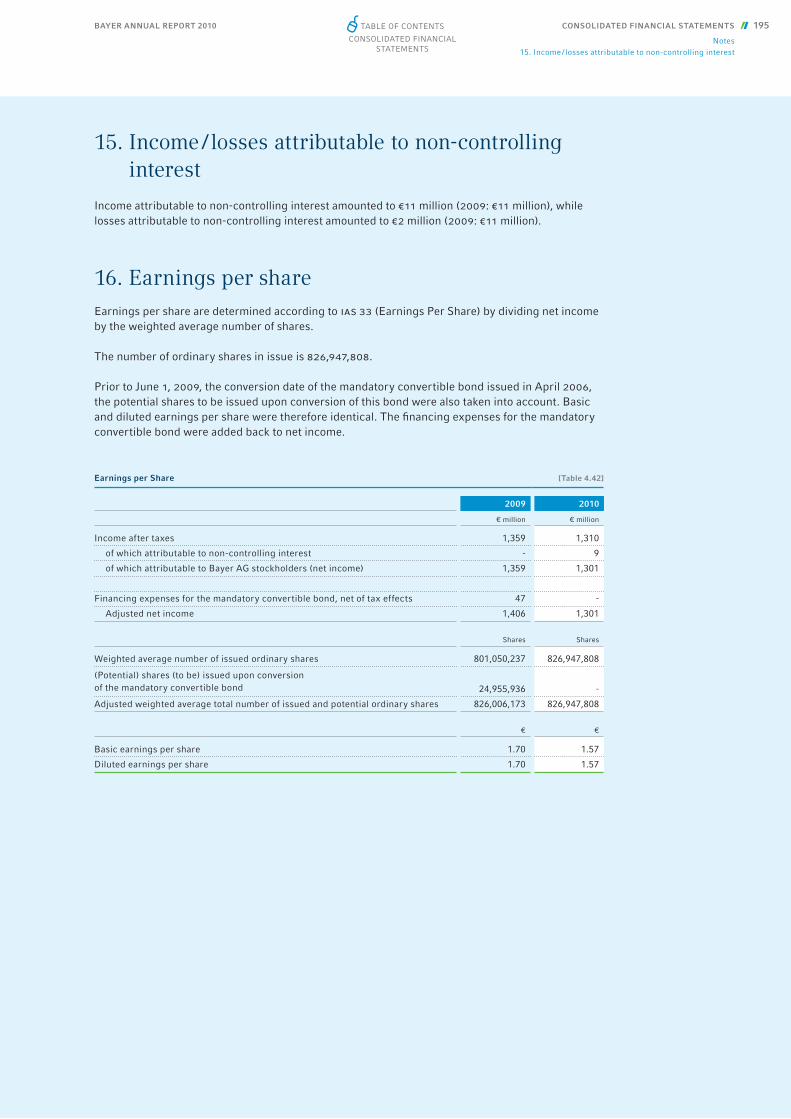
BAYER ANNUAL REPORT 2010 CONSOLIDATED FINANCIAL STATEMENTS 195
Notes15. Income / losses attributable to non-controlling interest
15. Income / losses attributable to non-controlling interest
Income attributable to non-controlling interest amounted to €11 million (2009: €11 million), while losses attributable to non-controlling interest amounted to €2 million (2009: €11 million).
16. Earnings per share Earnings per share are determined according to ias 33 (Earnings Per Share) by dividing net income by the weighted average number of shares.
The number of ordinary shares in issue is 826,947,808.
Prior to June 1, 2009, the conversion date of the mandatory convertible bond issued in April 2006, the potential shares to be issued upon conversion of this bond were also taken into account. Basic and diluted earnings per share were therefore identical. The fi nancing expenses for the mandatory convertible bond were added back to net income.
Earnings per Share [Table 4.42]
2009 2010
€ million € million
Income after taxes 1,359 1,310
of which attributable to non-controlling interest - 9
of which attributable to Bayer AG stockholders (net income) 1,359 1,301
Financing expenses for the mandatory convertible bond, net of tax effects 47 -
Adjusted net income 1,406 1,301
Shares Shares
Weighted average number of issued ordinary shares 801,050,237 826,947,808
(Potential) shares (to be) issued upon conversion of the mandatory convertible bond 24,955,936 -
Adjusted weighted average total number of issued and potential ordinary shares 826,006,173 826,947,808
€ €
Basic earnings per share 1.70 1.57
Diluted earnings per share 1.70 1.57
Table of ConTenTs
ConsolidaTed finanCial sTaTemenTs
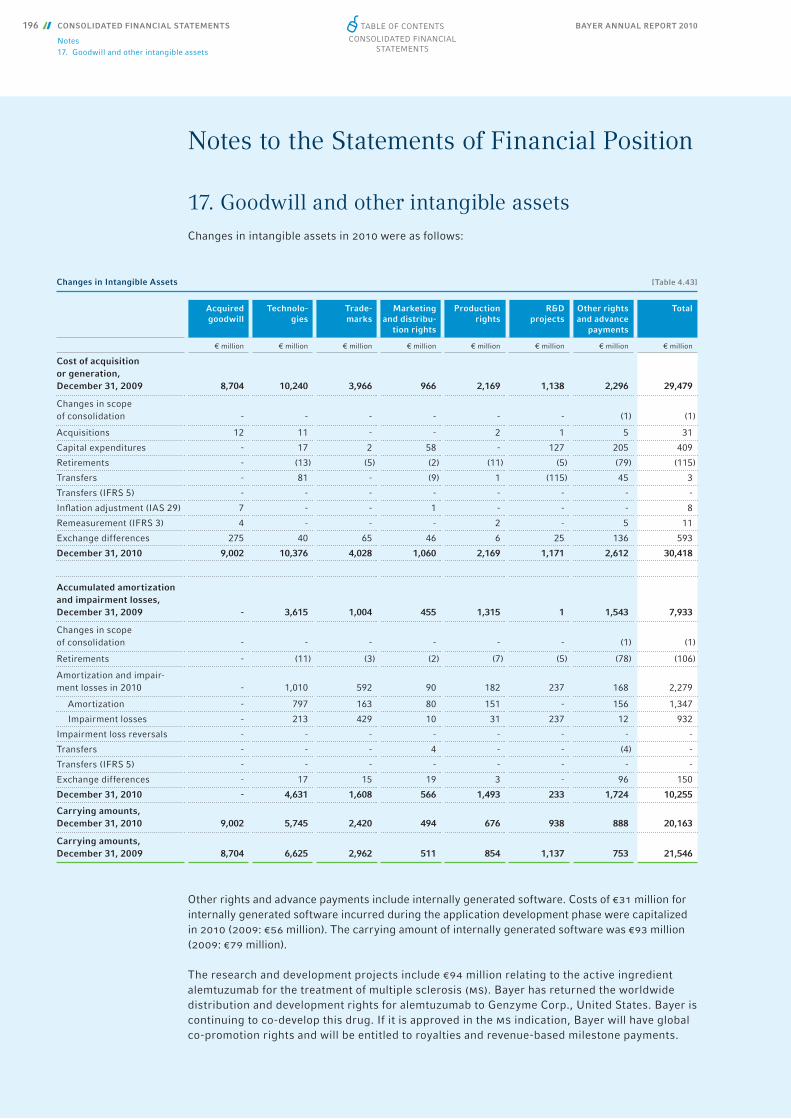
BAYER ANNUAL REPORT 2010196 CONSOLIDATED FINANCIAL STATEMENTS
Notes17. Goodwill and other intangible assets
Notes to the Statements of Financial Position
17. Goodwill and other intangible assetsChanges in intangible assets in 2010 were as follows:
Other rights and advance payments include internally generated software. Costs of €31 million for internally generated software incurred during the application development phase were capitalized in 2010 (2009: €56 million). The carrying amount of internally generated software was €93 million (2009: €79 million). The research and development projects include €94 million relating to the active ingredient alemtuzumab for the treatment of multiple sclerosis (ms). Bayer has returned the worldwide distribution and development rights for alemtuzumab to Genzyme Corp., United States. Bayer is continuing to co- develop this drug. If it is approved in the ms indication, Bayer will have global co-promotion rights and will be entitled to royalties and revenue-based milestone payments.
Changes in Intangible Assets [Table 4.43]
Acquired goodwill
Technolo-gies
Trade-marks
Marketing and distribu-
tion rights
Production rights
R&D projects
Other rights and advance
payments
Total
€ million € million € million € million € million € million € million € million
Cost of acquisition or generation, December 31, 2009 8,704 10,240 3,966 966 2,169 1,138 2,296 29,479
Changes in scope of consolidation - - - - - - (1) (1)
Acquisitions 12 11 - - 2 1 5 31
Capital expenditures - 17 2 58 - 127 205 409
Retirements - (13) (5) (2) (11) (5) (79) (115)
Transfers - 81 - (9) 1 (115) 45 3
Transfers (IFRS 5) - - - - - - - -
Infl ation adjustment (IAS 29) 7 - - 1 - - - 8
Remeasurement (IFRS 3) 4 - - - 2 - 5 11
Exchange differences 275 40 65 46 6 25 136 593
December 31, 2010 9,002 10,376 4,028 1,060 2,169 1,171 2,612 30,418
Accumulated amortization and impairment losses, December 31, 2009 - 3,615 1,004 455 1,315 1 1,543 7,933
Changes in scope of consolidation - - - - - - (1) (1)
Retirements - (11) (3) (2) (7) (5) (78) (106)
Amortization and impair-ment losses in 2010 - 1,010 592 90 182 237 168 2,279
Amortization - 797 163 80 151 - 156 1,347
Impairment losses - 213 429 10 31 237 12 932
Impairment loss reversals - - - - - - - -
Transfers - - - 4 - - (4) -
Transfers (IFRS 5) - - - - - - - -
Exchange differences - 17 15 19 3 - 96 150
December 31, 2010 - 4,631 1,608 566 1,493 233 1,724 10,255
Carrying amounts, December 31, 2010 9,002 5,745 2,420 494 676 938 888 20,163
Carrying amounts, December 31, 2009 8,704 6,625 2,962 511 854 1,137 753 21,546
Table of ConTenTs
ConsolidaTed finanCial sTaTemenTs
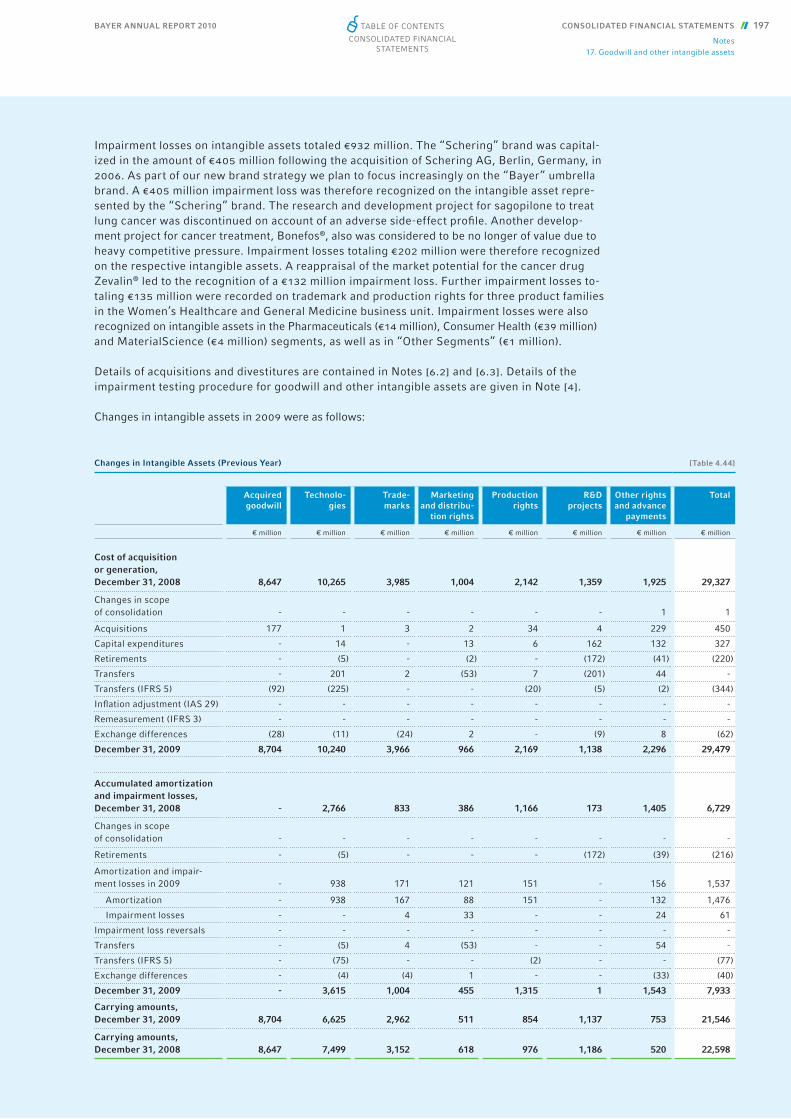
BAYER ANNUAL REPORT 2010 CONSOLIDATED FINANCIAL STATEMENTS 197
Notes17. Goodwill and other intangible assets
Impairment losses on intangible assets totaled €932 million. The “Schering” brand was capital-ized in the amount of €405 million following the acquisition of Schering AG, Berlin, Germany, in 2006. As part of our new brand strategy we plan to focus increasingly on the “Bayer” umbrella brand. A €405 million impairment loss was therefore recognized on the intangible asset repre-sented by the “Schering” brand. The research and development project for sagopilone to treat lung cancer was discontinued on account of an adverse side-effect profi le. Another develop-ment project for cancer treatment, Bonefos®, also was considered to be no longer of value due to heavy competitive pressure. Impairment losses totaling €202 million were therefore recognized on the respective intangible assets. A reappraisal of the market potential for the cancer drug Zevalin® led to the recognition of a €132 million impairment loss. Further impairment losses to-taling €135 million were recorded on trademark and production rights for three product families in the Women’s Healthcare and General Medicine business unit. Impairment losses were also recognized on intangible assets in the Pharmaceuticals (€14 million), Consumer Health (€39 million) and Material Science (€4 million) segments, as well as in “Other Segments” (€1 million).
Details of acquisitions and divestitures are contained in Notes [6.2] and [6.3]. Details of the impairment testing procedure for goodwill and other intangible assets are given in Note [4].
Changes in intangible assets in 2009 were as follows:
Changes in Intangible Assets (Previous Year) [Table 4.44]
Acquired goodwill
Technolo-gies
Trade-marks
Marketing and distribu-
tion rights
Production rights
R&D projects
Other rights and advance
payments
Total
€ million € million € million € million € million € million € million € million
Cost of acquisition or generation, December 31, 2008 8,647 10,265 3,985 1,004 2,142 1,359 1,925 29,327
Changes in scope of consolidation - - - - - - 1 1
Acquisitions 177 1 3 2 34 4 229 450
Capital expenditures - 14 - 13 6 162 132 327
Retirements - (5) - (2) - (172) (41) (220)
Transfers - 201 2 (53) 7 (201) 44 -
Transfers (IFRS 5) (92) (225) - - (20) (5) (2) (344)
Infl ation adjustment (IAS 29) - - - - - - - -
Remeasurement (IFRS 3) - - - - - - - -
Exchange differences (28) (11) (24) 2 - (9) 8 (62)
December 31, 2009 8,704 10,240 3,966 966 2,169 1,138 2,296 29,479
Accumulated amortization and impairment losses, December 31, 2008 - 2,766 833 386 1,166 173 1,405 6,729
Changes in scope of consolidation - - - - - - - -
Retirements - (5) - - - (172) (39) (216)
Amortization and impair-ment losses in 2009 - 938 171 121 151 - 156 1,537
Amortization - 938 167 88 151 - 132 1,476
Impairment losses - - 4 33 - - 24 61
Impairment loss reversals - - - - - - - -
Transfers - (5) 4 (53) - - 54 -
Transfers (IFRS 5) - (75) - - (2) - - (77)
Exchange differences - (4) (4) 1 - - (33) (40)
December 31, 2009 - 3,615 1,004 455 1,315 1 1,543 7,933
Carrying amounts, December 31, 2009 8,704 6,625 2,962 511 854 1,137 753 21,546
Carrying amounts, December 31, 2008 8,647 7,499 3,152 618 976 1,186 520 22,598
Table of ConTenTs
ConsolidaTed finanCial sTaTemenTs

BAYER ANNUAL REPORT 2010198 CONSOLIDATED FINANCIAL STATEMENTS
Notes17. Goodwill and other intangible assets
Changes in the carrying amounts of goodwill for the operating segments in 2010 and 2009 were as follows:
Goodwill by Reporting Segment [Table 4.45]
Pharma-ceuticals
Consumer Health
HealthCare Crop Protection
Environ-mental
Science, BioScience
Crop-Science
€ million € million € million € million € million € million
Carrying amounts, January 1, 2009 5,553 1,323 6,876 1,088 506 1,594
Changes in scope of consolidation - - - - - -
Acquisitions 4 17 21 - 132 132
Capital expenditures - - - - - -
Retirements - - - - - -
Amortization and impairment losses in 2009 - - - - - -
Transfers - - - - - -
Transfers (IFRS 5) (92) - (92) - - -
Infl ation adjustment (IAS 29) - - - - - -
Remeasurement (IFRS 3) - - - - - -
Exchange differences (5) (12) (17) 9 (13) (4)
Carrying amounts, December 31, 2009 5,460 1,328 6,788 1,097 625 1,722
Changes in scope of consolidation - - - - - -
Acquisitions - - - - 2 2
Capital expenditures - - - - - -
Retirements - - - - - -
Amortization and impairment losses in 2010 - - - - - -
Transfers 1 - 1 (3) 2 (1)
Transfers (IFRS 5) - - - - - -
Infl ation adjustment (IAS 29) - 7 7 - - -
Remeasurement (IFRS 3) - - - - - -
Exchange differences 122 80 202 27 41 68
Carrying amounts, December 31, 2010 5,583 1,415 6,998 1,121 670 1,791
Table of ConTenTs
ConsolidaTed finanCial sTaTemenTs
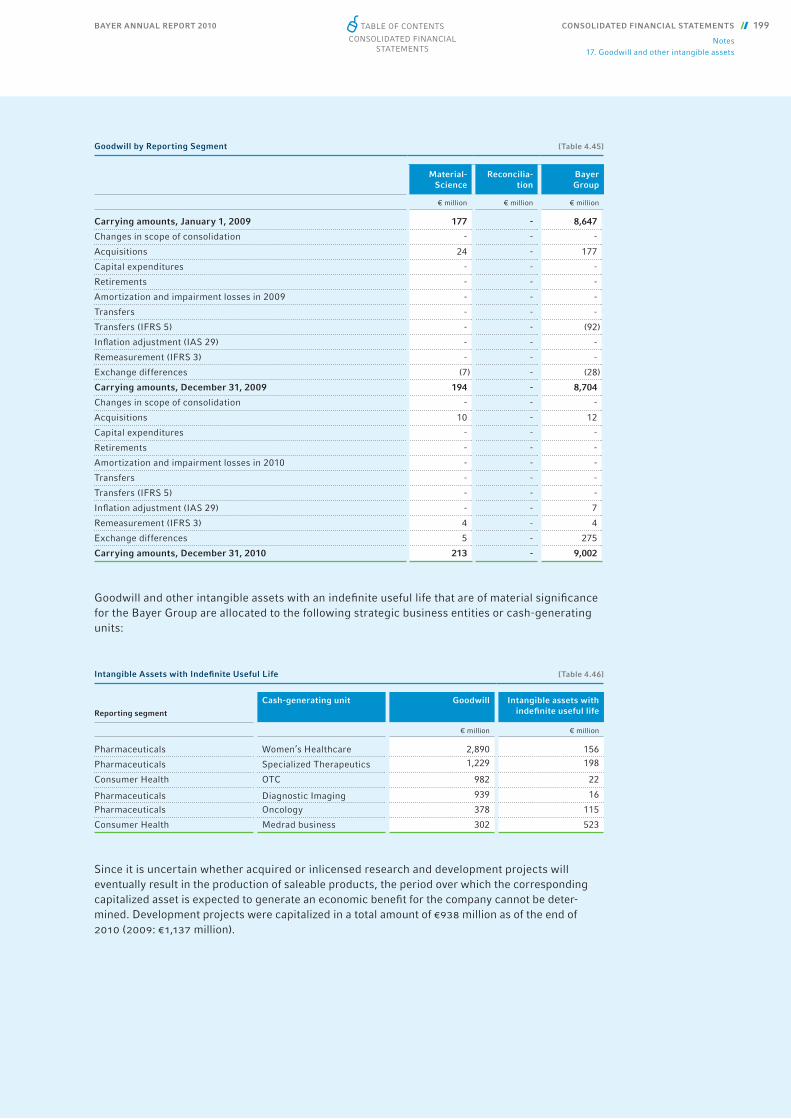
BAYER ANNUAL REPORT 2010 CONSOLIDATED FINANCIAL STATEMENTS 199
Notes17. Goodwill and other intangible assets
Goodwill and other intangible assets with an indefi nite useful life that are of material signifi cance for the Bayer Group are allocated to the following strategic business entities or cash-generating units:
Since it is uncertain whether acquired or inlicensed research and development projects will eventually result in the production of saleable products, the period over which the corresponding capitalized asset is expected to generate an economic benefi t for the company cannot be deter-mined. Development projects were capitalized in a total amount of €938 million as of the end of 2010 (2009: €1,137 million).
Intangible Assets with Indefi nite Useful Life [Table 4.46]
Reporting segment
Cash-generating unit Goodwill Intangible assets with indefi nite useful life
€ million € million
Pharmaceuticals Women’s Healthcare 2,890 156
Pharmaceuticals Specialized Therapeutics 1,229 198
Consumer Health OTC 982 22
Pharmaceuticals Diagnostic Imaging 939 16
Pharmaceuticals Oncology 378 115
Consumer Health Medrad business 302 523
Goodwill by Reporting Segment [Table 4.45]
Material-Science
Reconcilia-tion
Bayer Group
€ million € million € million
Carrying amounts, January 1, 2009 177 - 8,647
Changes in scope of consolidation - - -
Acquisitions 24 - 177
Capital expenditures - - -
Retirements - - -
Amortization and impairment losses in 2009 - - -
Transfers - - -
Transfers (IFRS 5) - - (92)
Infl ation adjustment (IAS 29) - - -
Remeasurement (IFRS 3) - - -
Exchange differences (7) - (28)
Carrying amounts, December 31, 2009 194 - 8,704
Changes in scope of consolidation - - -
Acquisitions 10 - 12
Capital expenditures - - -
Retirements - - -
Amortization and impairment losses in 2010 - - -
Transfers - - -
Transfers (IFRS 5) - - -
Infl ation adjustment (IAS 29) - - 7
Remeasurement (IFRS 3) 4 - 4
Exchange differences 5 - 275
Carrying amounts, December 31, 2010 213 - 9,002
Table of ConTenTs
ConsolidaTed finanCial sTaTemenTs
BAYER ANNUAL REPORT 2010200 CONSOLIDATED FINANCIAL STATEMENTS
Notes17. Goodwill and other intangible assets
The Bayer Cross, which was reacquired for the North America region in 1994, having been award-ed to the United States and Canada under the reparations agreements at the end of the First World War, is recognized as an intangible asset with an indefi nite useful life. The company name “Medrad,” which passed to Bayer with the acquisition of Schering AG, Berlin, Germany, in 2006, also has an indefi nite useful life. The period for which the Bayer Group will derive an economic benefi t from this name cannot be determined as Bayer intends to make continuous use of it. The Bayer Cross is capitalized at €107 million, the “Medrad” name at €305 million.
TECHNOLOGIESThe Bayer Group endeavors to obtain patent protection for its products and technologies in the major markets. Depending on the jurisdiction, patent protection may be available for:
• individual active ingredients,• specifi c compounds, formulations and combinations containing active ingredients,• manufacturing processes,• working methods,• equipment,• intermediates for the manufacture of active ingredients and products,• isolated genes or proteins,• new uses for existing active ingredients or products,• material combinations and• semi-fi nished products.
The protection that a patent provides varies from country to country, depending on the type of claim granted, the scope of the claim’s coverage and the legal remedies available for enforce-ment.
The Bayer Group currently owns some 78,000 patents or patent applications. Although in our Pharmaceuticals segment the patents on Avalox® / Avelox®, Betaferon® / Betaseron®, Kogenate®, Levitra®, Magnevist®, Mirena®, Nexavar®, Xarelto®, yaz®, Yasmin® and Yasminelle® are partic-ularly important to our business, we believe that no single patent (or group of related patents) is crucial to our business as a whole.
TERM AND EXPIRATION OF PATENTSPatents are valid for varying periods, depending on the laws of the jurisdiction granting the patent. In some jurisdictions, patent protection begins from the date a patent application was fi led; in others, it begins on the date the patent is granted.
The European Union member countries as well as the United States, Japan and certain other countries extend patent terms or issue supplementary protection certifi cates to compensate for patent term loss due to regulatory review and for the substantial investments in product research and development. We endeavor to obtain such patent term extensions or supplementary certifi cates wherever possible. Apart from substance and product patents, we continue to seek
• patents on processes and intermediates used in manufacturing an active ingredient,• patents relating to specifi c uses for an active ingredient,• patents relating to novel compositions and formulations, and• market exclusivity in countries where this is possible (such as the United States).
Table of ConTenTs
ConsolidaTed finanCial sTaTemenTs
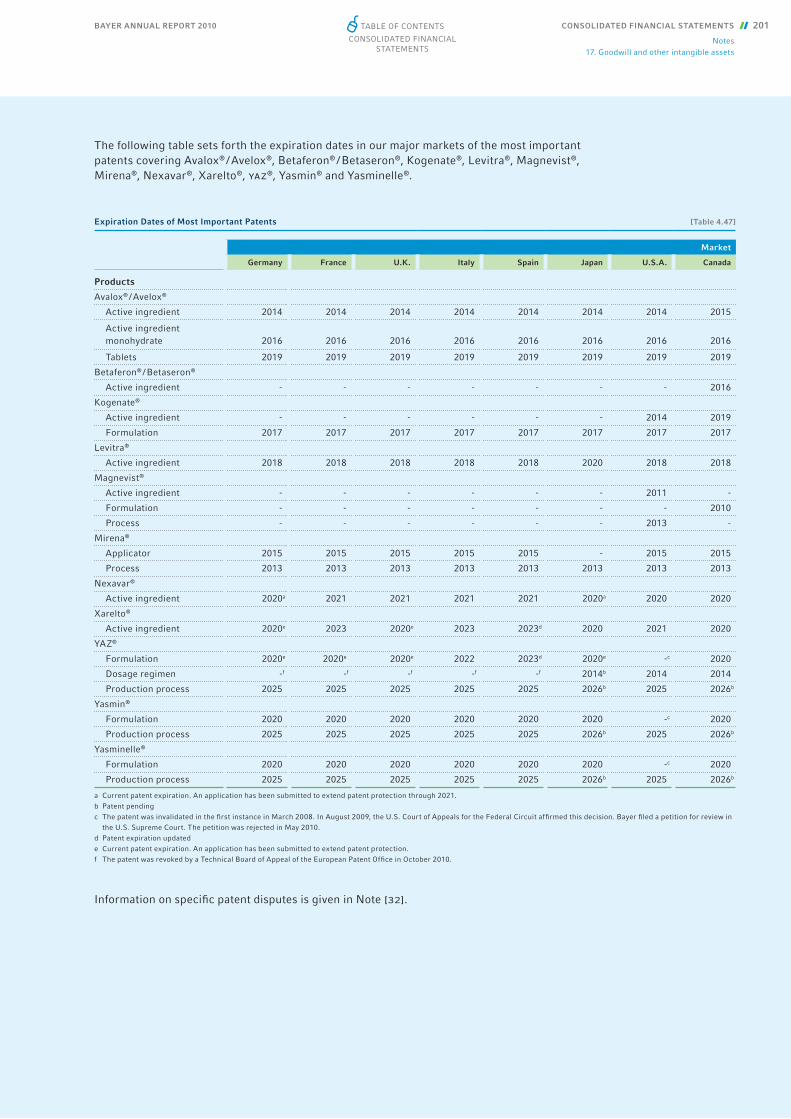
BAYER ANNUAL REPORT 2010 CONSOLIDATED FINANCIAL STATEMENTS 201
Notes17. Goodwill and other intangible assets
The following table sets forth the expiration dates in our major markets of the most important patents covering Avalox® / Avelox®, Betaferon® / Betaseron®, Kogenate®, Levitra®, Magnevist®, Mirena®, Nexavar®, Xarelto®, yaz®, Yasmin® and Yasminelle®.
Information on specifi c patent disputes is given in Note [32].
Expiration Dates of Most Important Patents [Table 4.47]
Market
Germany France U.K. Italy Spain Japan U.S.A. Canada
Products
Avalox® / Avelox®
Active ingredient 2014 2014 2014 2014 2014 2014 2014 2015
Active ingredient monohydrate 2016 2016 2016 2016 2016 2016 2016 2016
Tablets 2019 2019 2019 2019 2019 2019 2019 2019
Betaferon® / Betaseron®
Active ingredient - - - - - - - 2016
Kogenate®
Active ingredient - - - - - - 2014 2019
Formulation 2017 2017 2017 2017 2017 2017 2017 2017
Levitra®
Active ingredient 2018 2018 2018 2018 2018 2020 2018 2018
Magnevist®
Active ingredient - - - - - - 2011 -
Formulation - - - - - - - 2010
Process - - - - - - 2013 -
Mirena®
Applicator 2015 2015 2015 2015 2015 - 2015 2015
Process 2013 2013 2013 2013 2013 2013 2013 2013
Nexavar®
Active ingredient 2020a 2021 2021 2021 2021 2020a 2020 2020
Xarelto®
Active ingredient 2020e 2023 2020e 2023 2023d 2020 2021 2020
YAZ®
Formulation 2020e 2020e 2020e 2022 2023d 2020e -c 2020
Dosage regimen -f -f -f -f -f 2014b 2014 2014
Production process 2025 2025 2025 2025 2025 2026b 2025 2026b
Yasmin®
Formulation 2020 2020 2020 2020 2020 2020 -c 2020
Production process 2025 2025 2025 2025 2025 2026b 2025 2026b
Yasminelle®
Formulation 2020 2020 2020 2020 2020 2020 -c 2020
Production process 2025 2025 2025 2025 2025 2026b 2025 2026b
a Current patent expiration. An application has been submitted to extend patent protection through 2021.b Patent pendingc The patent was invalidated in the fi rst instance in March 2008. In August 2009, the U.S. Court of Appeals for the Federal Circuit affi rmed this decision. Bayer fi led a petition for review in
the U.S. Supreme Court. The petition was rejected in May 2010.d Patent expiration updatede Current patent expiration. An application has been submitted to extend patent protection.f The patent was revoked by a Technical Board of Appeal of the European Patent Offi ce in October 2010.
Table of ConTenTs
ConsolidaTed finanCial sTaTemenTs
BAYER ANNUAL REPORT 2010202 CONSOLIDATED FINANCIAL STATEMENTS
Notes17. Goodwill and other intangible assets
TRADEMARKSWe seek to obtain extensive trademark protection for our products in all jurisdictions in which they are marketed or are to be marketed in the near future. As well as product names, we also register particularly distinctive slogans, logos, graphic elements and designs as global trade-marks.
Wherever possible, trademarks are registered through supranational trademark protection systems, for example as European Community Trademarks or international trademarks, and addi-tionally with the national trademark registration offi ces. The protection actually provided by a trademark may vary considerably from one country to another depending on the distinctiveness of the trademark.
Our trademarks include:
HealthCare: Adalat®, Advantage®, Aleve® / Flanax® / Apronax®, Alka-Seltzer®, Aspirin®, Avalox® / Avelox®, Baytril®, Bepanthen® / Bepanthol®, Berocca®, Betaferon® / Betaseron®, Canesten®, Cipro-bay® / Ciproxin® / Baycip® / Cipro®, Contour®, Kogenate®, Levitra®, Magnevist®, Mirena®, Nexavar®, One A Day®, Redoxon®, Rennie®, Supradyn®, Ultravist®, Xarelto®, yaz®, Yasmin® and Yasminelle®.
CropScience: Basta® / Liberty® / Ignite®, Confi dor® / Gaucho® / Admire® / Merit®, Flint® / Stratego® / Sphere® / Nativo®, Invigor® and Proline® / Input® / Prosaro®.
MaterialScience: Bayblend®, BaySystems®, Desmodur®, Desmopan®, Desmophen®, Makrolon® and Vulkollan®.
We currently have more than 63,000 national trademark registrations or pending registrations, along with over 750 Community Trade Marks, which are valid throughout the European Union, and some 2,000 international trademarks, which provide protection in various countries. Trade-marks are particularly important for those products that are not protected by patents and are exposed to strong competitive pressure from generic products. However, with the exception of the company name “Bayer” and the “Bayer Cross” logo, we do not believe that any single trade-mark is crucial to our business as a whole.
Table of ConTenTs
ConsolidaTed finanCial sTaTemenTs
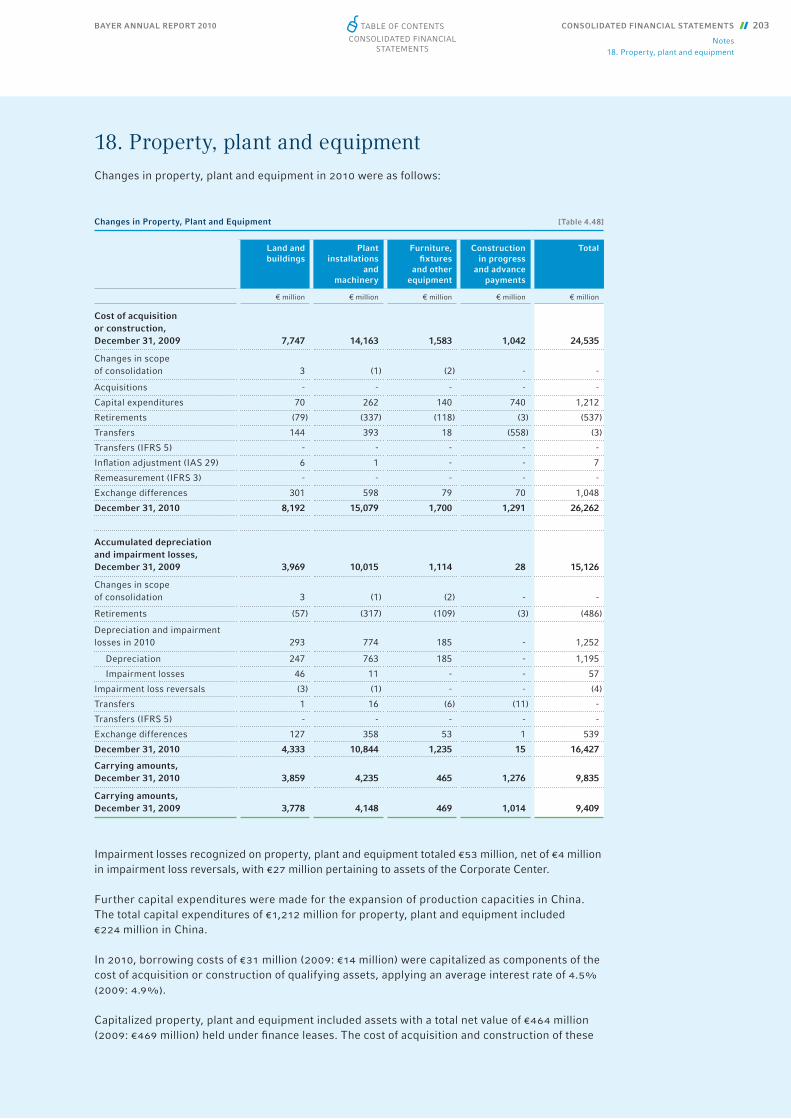
BAYER ANNUAL REPORT 2010 CONSOLIDATED FINANCIAL STATEMENTS 203
Notes18. Property, plant and equipment
18. Property, plant and equipmentChanges in property, plant and equipment in 2010 were as follows:
Impairment losses recognized on property, plant and equipment totaled €53 million, net of €4 million in impairment loss reversals, with €27 million pertaining to assets of the Corporate Center.
Further capital expenditures were made for the expansion of production capacities in China. The total capital expenditures of €1,212 million for property, plant and equipment included €224 million in China.
In 2010, borrowing costs of €31 million (2009: €14 million) were capitalized as components of the cost of acquisition or construction of qualifying assets, applying an average interest rate of 4.5% (2009: 4.9%).
Capitalized property, plant and equipment included assets with a total net value of €464 million (2009: €469 million) held under fi nance leases. The cost of acquisition and construction of these
Changes in Property, Plant and Equipment [Table 4.48]
Land and buildings
Plant installations
and machinery
Furniture, fi xtures
and other equipment
Construction in progress
and advance payments
Total
€ million € million € million € million € million
Cost of acquisition or construction, December 31, 2009 7,747 14,163 1,583 1,042 24,535
Changes in scope of consolidation 3 (1) (2) - -
Acquisitions - - - - -
Capital expenditures 70 262 140 740 1,212
Retirements (79) (337) (118) (3) (537)
Transfers 144 393 18 (558) (3)
Transfers (IFRS 5) - - - - -
Infl ation adjustment (IAS 29) 6 1 - - 7
Remeasurement (IFRS 3) - - - - -
Exchange differences 301 598 79 70 1,048
December 31, 2010 8,192 15,079 1,700 1,291 26,262
Accumulated depreciation and impairment losses, December 31, 2009 3,969 10,015 1,114 28 15,126
Changes in scope of consolidation 3 (1) (2) - -
Retirements (57) (317) (109) (3) (486)
Depreciation and impairment losses in 2010 293 774 185 - 1,252
Depreciation 247 763 185 - 1,195
Impairment losses 46 11 - - 57
Impairment loss reversals (3) (1) - - (4)
Transfers 1 16 (6) (11) -
Transfers (IFRS 5) - - - - -
Exchange differences 127 358 53 1 539
December 31, 2010 4,333 10,844 1,235 15 16,427
Carrying amounts, December 31, 2010 3,859 4,235 465 1,276 9,835
Carrying amounts, December 31, 2009 3,778 4,148 469 1,014 9,409
Table of ConTenTs
ConsolidaTed finanCial sTaTemenTs

BAYER ANNUAL REPORT 2010204 CONSOLIDATED FINANCIAL STATEMENTS
Notes18. Property, plant and equipment
assets as of the closing date totaled €1,128 million (2009: €1,038 million). They comprised plant installations and machinery with a carrying amount of €232 million (2009: €240 million), buildings with a carrying amount of €139 million (2009: €143 million) and other assets with a carrying amount of €93 million (2009: €86 million). For information on the liabilities arising from fi nance leases see Note [27].
In 2010, rental payments of €216 million (2009: €203 million) were made for assets leased under operating leases as defi ned in ias 17 (Leases).
Lease payments of €5 million are expected to be received in 2011 from operating leases – as defi ned in ias 17 (Leases) – pertaining to property, plant and equipment.
In 2008, Bayer sold a registered usufructuary right to real estate to a leasing company and leased it back immediately under an agreement that includes a right of repurchase upon expiration of the lease. The carrying amount of the real estate in 2010 was €153 million (2009: €159 million). This transaction, which was accounted for as a secured loan, does not restrict the operational use of the real estate.
Changes in property, plant and equipment in 2009 were as follows:
Changes in Property, Plant and Equipment (Previous Year) [Table 4.49]
Land and buildings
Plant installations
and machinery
Furniture, fi xtures
and other equipment
Construction in progress
and advance payments
Total
€ million € million € million € million € million
Cost of acquisition or construction, December 31, 2008 7,471 13,612 1,534 1,310 23,927
Changes in scope of consolidation 1 (2) (4) 1 (4)
Acquisitions 1 1 3 - 5
Capital expenditures 203 357 147 635 1,342
Retirements (144) (324) (153) (10) (631)
Transfers 233 607 47 (887) -
Transfers (IFRS 5) 8 - - - 8
Infl ation adjustment (IAS 29) - - - - -
Remeasurement (IFRS 3) - - - - -
Exchange differences (26) (88) 9 (7) (112)
December 31, 2009 7,747 14,163 1,583 1,042 24,535
Accumulated depreciation and impairment losses, December 31, 2008 3,809 9,538 1,069 19 14,435
Changes in scope of consolidation 2 (1) (4) - (3)
Retirements (98) (305) (141) (2) (546)
Depreciation and impairment losses in 2009 253 812 184 23 1,272
Depreciation 238 764 182 - 1,184
Impairment losses 15 48 2 23 88
Impairment loss reversals - - - - -
Transfers 3 9 - (12) -
Transfers (IFRS 5) 4 - - - 4
Exchange differences (4) (38) 6 - (36)
December 31, 2009 3,969 10,015 1,114 28 15,126
Carrying amounts, December 31, 2009 3,778 4,148 469 1,014 9,409
Carrying amounts, December 31, 2008 3,662 4,074 465 1,291 9,492
Table of ConTenTs
ConsolidaTed finanCial sTaTemenTs
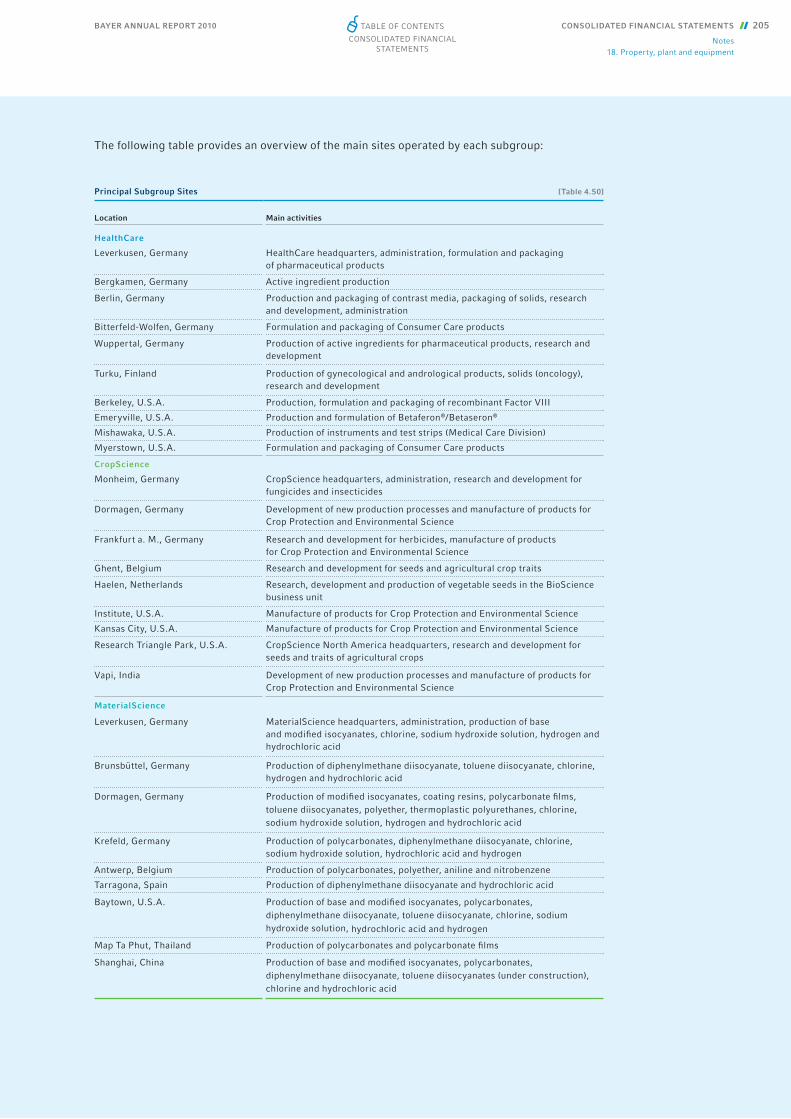
BAYER ANNUAL REPORT 2010 CONSOLIDATED FINANCIAL STATEMENTS 205
Notes18. Property, plant and equipment
The following table provides an overview of the main sites operated by each subgroup:
Principal Subgroup Sites [Table 4.50]
Location Main activities
HealthCare
Leverkusen, Germany HealthCare headquarters, administration, formulation and packaging of pharmaceutical products
Bergkamen, Germany Active ingredient production
Berlin, Germany Production and packaging of contrast media, packaging of solids, research and development, administration
Bitterfeld-Wolfen, Germany Formulation and packaging of Consumer Care products
Wuppertal, Germany Production of active ingredients for pharmaceutical products, research and development
Turku, Finland Production of gynecological and andrological products, solids (oncology), research and development
Berkeley, U.S.A. Production, formulation and packaging of recombinant Factor VIII
Emeryville, U.S.A. Production and formulation of Betaferon®/Betaseron®
Mishawaka, U.S.A. Production of instruments and test strips (Medical Care Division)
Myerstown, U.S.A. Formulation and packaging of Consumer Care products
CropScience
Monheim, Germany CropScience headquarters, administration, research and development forfungicides and insecticides
Dormagen, Germany Development of new production processes and manufacture of products for Crop Protection and Environmental Science
Frankfurt a. M., Germany Research and development for herbicides, manufacture of productsfor Crop Protection and Environmental Science
Ghent, Belgium Research and development for seeds and agricultural crop traits
Haelen, Netherlands Research, development and production of vegetable seeds in the BioScience business unit
Institute, U.S.A. Manufacture of products for Crop Protection and Environmental Science
Kansas City, U.S.A. Manufacture of products for Crop Protection and Environmental Science
Research Triangle Park, U.S.A. CropScience North America headquarters, research and development for seeds and traits of agricultural crops
Vapi, India Development of new production processes and manufacture of products for Crop Protection and Environmental Science
MaterialScience
Leverkusen, Germany MaterialScience headquarters, administration, production of base and modifi ed isocyanates, chlorine, sodium hydroxide solution, hydrogen and hydrochloric acid
Brunsbüttel, Germany Production of diphenylmethane diisocyanate, toluene diisocyanate, chlorine, hydrogen and hydrochloric acid
Dormagen, Germany Production of modifi ed isocyanates, coating resins, polycarbonate fi lms,toluene diisocyanates, polyether, thermoplastic polyurethanes, chlorine,sodium hydroxide solution, hydrogen and hydrochloric acid
Krefeld, Germany Production of polycarbonates, diphenylmethane diisocyanate, chlorine,sodium hydroxide solution, hydrochloric acid and hydrogen
Antwerp, Belgium Production of polycarbonates, polyether, aniline and nitrobenzene
Tarragona, Spain Production of diphenylmethane diisocyanate and hydrochloric acid
Baytown, U.S.A. Production of base and modifi ed isocyanates, polycarbonates, diphenylmethane diisocyanate, toluene diisocyanate, chlorine, sodium hydroxide solution, hydrochloric acid and hydrogen
Map Ta Phut, Thailand Production of polycarbonates and polycarbonate fi lms
Shanghai, China Production of base and modifi ed isocyanates, polycarbonates, diphenylmethane diisocyanate, toluene diisocyanates (under construction), chlorine and hydrochloric acid
Table of ConTenTs
ConsolidaTed finanCial sTaTemenTs
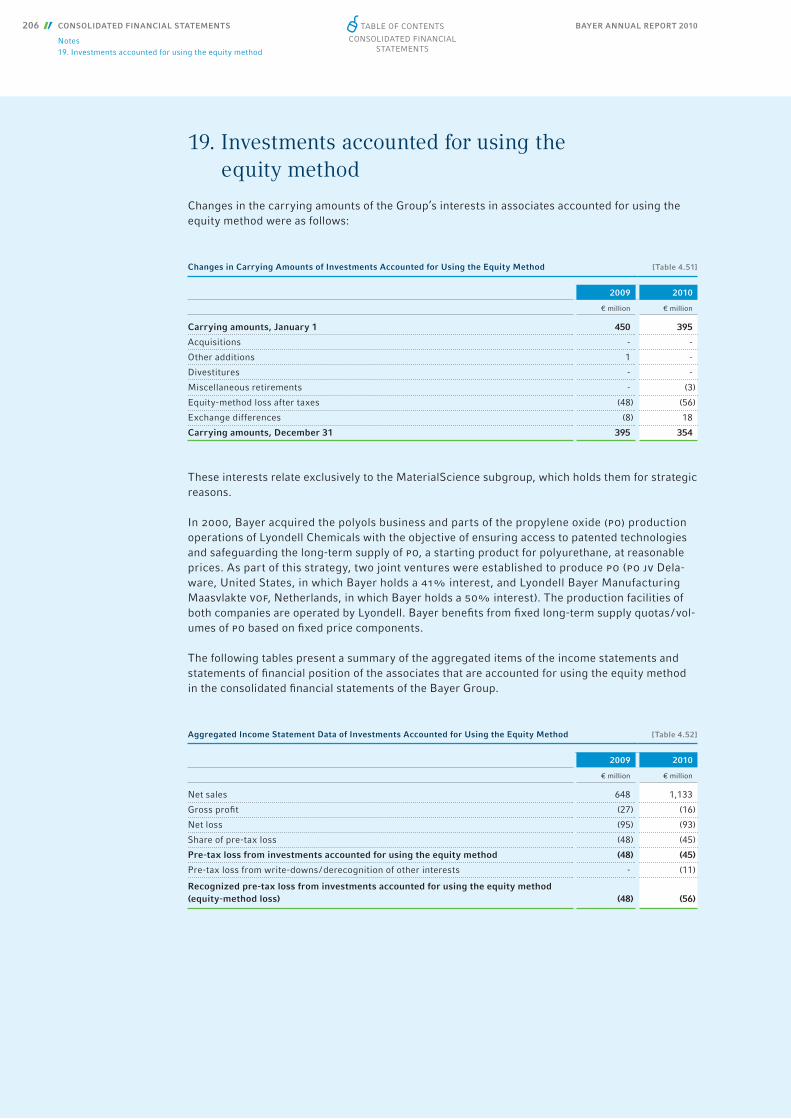
BAYER ANNUAL REPORT 2010206 CONSOLIDATED FINANCIAL STATEMENTS
Notes19. Investments accounted for using the equity method
19. Investments accounted for using the equity method
Changes in the carrying amounts of the Group’s interests in associates accounted for using the equity method were as follows:
These interests relate exclusively to the MaterialScience subgroup, which holds them for strategic reasons.
In 2000, Bayer acquired the polyols business and parts of the propylene oxide (po) production operations of Lyondell Chemicals with the objective of ensuring access to patented technologies and safeguarding the long-term supply of po, a starting product for polyurethane, at reasonable prices. As part of this strategy, two joint ventures were established to produce po (po jv Dela-ware, United States, in which Bayer holds a 41% interest, and Lyondell Bayer Manufacturing Maas vlakte vof, Netherlands, in which Bayer holds a 50% interest). The production facilities of both companies are operated by Lyondell. Bayer benefi ts from fi xed long-term supply quotas / vol-umes of po based on fi xed price components.
The following tables present a summary of the aggregated items of the income statements and statements of fi nancial position of the associates that are accounted for using the equity method in the consolidated fi nancial statements of the Bayer Group.
Changes in Carrying Amounts of Investments Accounted for Using the Equity Method [Table 4.51]
2009 2010
€ million € million
Carrying amounts, January 1 450 395
Acquisitions - -
Other additions 1 -
Divestitures - -
Miscellaneous retirements - (3)
Equity-method loss after taxes (48) (56)
Exchange differences (8) 18
Carrying amounts, December 31 395 354
Aggregated Income Statement Data of Investments Accounted for Using the Equity Method [Table 4.52]
2009 2010
€ million € million
Net sales 648 1,133
Gross profi t (27) (16)
Net loss (95) (93)
Share of pre-tax loss (48) (45)
Pre-tax loss from investments accounted for using the equity method (48) (45)
Pre-tax loss from write-downs / derecognition of other interests - (11)
Recognized pre-tax loss from investments accounted for using the equity method(equity-method loss) (48) (56)
Table of ConTenTs
ConsolidaTed finanCial sTaTemenTs

BAYER ANNUAL REPORT 2010 CONSOLIDATED FINANCIAL STATEMENTS 207
Notes20. Other fi nancial assets
The item “Other” mainly comprised differences arising from adjustments of data to Bayer’s uni-form accounting policies, purchase price allocations and their amortization in income.
20. Other fi nancial assetsOther fi nancial assets were as follows:
Loans mainly comprised capital of €410 million (2009: €310 million) provided to Bayer-Pensions-kasse VVaG (Bayer-Pensionskasse) for its effective initial fund and jouissance right capital (Genuss-rechtskapital) of €150 million (2009: €150 million).
The debt instruments reported as available-for-sale fi nancial assets mainly comprised investments in money market funds totaling €300 million (2009: €0 million) and u.s. treasury bills in the amount of €224 million (2009: €0 million).
The equity instruments reported as available-for-sale fi nancial assets included €54 million (2009: €58 million) in instruments whose fair value could not be determined from a stock exchange or other market price or by discounting reliably determinable future cash fl ows. These equity instru-ments were recognized at amortized cost.
In 2010, loans and receivables were written down by €0 million (2009: €1 million) and available-for-sale fi nancial assets by €11 million (2009: €15 million). Other fi nancial assets of €4 million (2009: €13 million) on which no write-downs had been made were overdue on the closing date.
Further information on the accounting for receivables from derivatives is given in Note [30].
Receivables under lease agreements relate to fi nance leases where Bayer is the lessor and the lessee is the economic owner of the leased assets. These receivables comprised expected lease payments of €77 million (2009: €30 million), including €44 million (2009: €5 million) in interest. Of the expect-ed lease payments, €3 million (2009: €2 million) is due within one year, €30 million (2009: €28 mil-lion) within the following four years and €44 million (2009: €0 million) in subsequent years.
Other Financial Assets [Table 4.54]
Dec. 31, 2009 Dec. 31, 2010
Total Of which current Total Of which current
€ million € million € million € million
Loans and receivables 603 95 783 129
Available-for-sale fi nancial assets 212 14 758 577
of which debt instruments 63 13 629 577
of which equity instruments 149 1 129 -
Held-to-maturity fi nancial investments 107 13 101 8
Receivables from forward commodity contracts 36 34 21 19
Receivables from other derivatives 584 210 476 274
Receivables under lease agreements 25 1 33 1
Total 1,567 367 2,172 1,008
Aggregated Data from the Statements of Financial Position of Investments Accounted for Using the Equity Method [Table 4.53]
Dec. 31, 2009 Dec. 31, 2010
€ million € million
Noncurrent assets 863 765
Current assets 193 237
Noncurrent liabilities 10 13
Current liabilities 171 165
Equity 875 824
Share of equity 377 348
Other 18 6
Carrying amount of investments accounted for using the equity method 395 354
Table of ConTenTs
ConsolidaTed finanCial sTaTemenTs
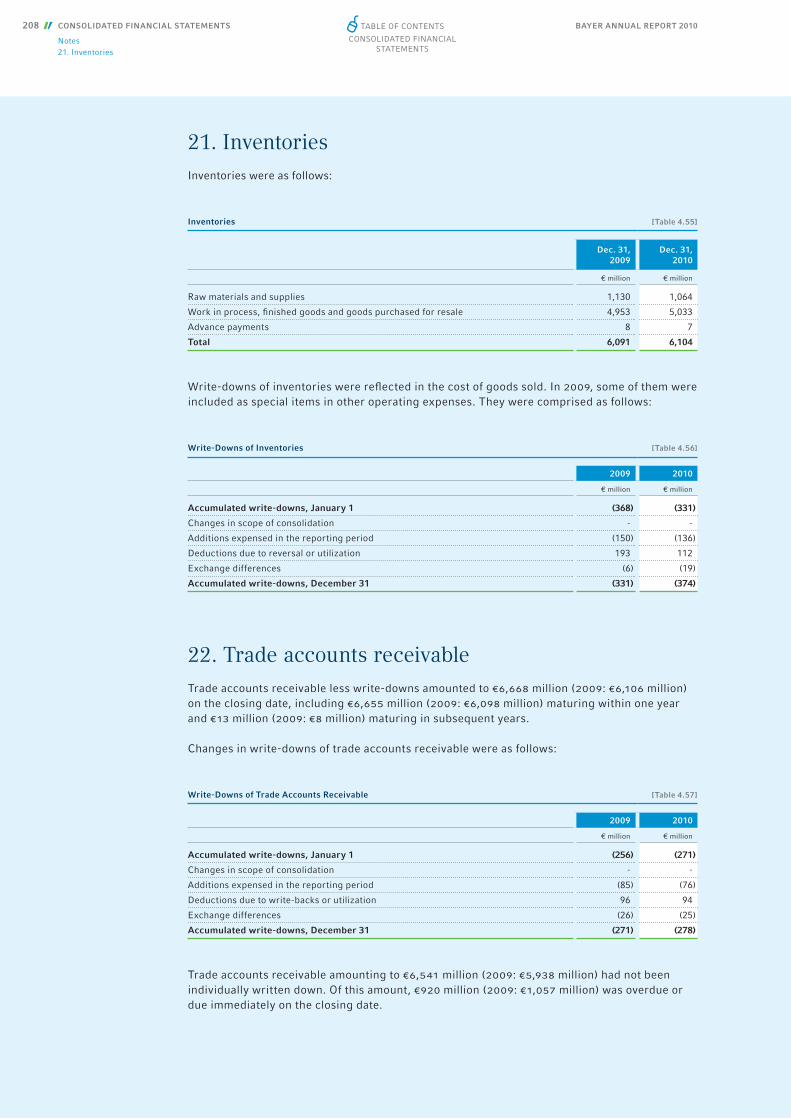
BAYER ANNUAL REPORT 2010208 CONSOLIDATED FINANCIAL STATEMENTS
Notes21. Inventories
21. InventoriesInventories were as follows:
Write-downs of inventories were refl ected in the cost of goods sold. In 2009, some of them were included as special items in other operating expenses. They were comprised as follows:
22. Trade accounts receivableTrade accounts receivable less write-downs amounted to €6,668 million (2009: €6,106 million) on the closing date, including €6,655 million (2009: €6,098 million) maturing within one year and €13 million (2009: €8 million) maturing in subsequent years.
Changes in write-downs of trade accounts receivable were as follows:
Trade accounts receivable amounting to €6,541 million (2009: €5,938 million) had not been individually written down. Of this amount, €920 million (2009: €1,057 million) was overdue or due immediately on the closing date.
Inventories [Table 4.55]
Dec. 31, 2009
Dec. 31, 2010
€ million € million
Raw materials and supplies 1,130 1,064
Work in process, fi nished goods and goods purchased for resale 4,953 5,033
Advance payments 8 7
Total 6,091 6,104
Write-Downs of Inventories [Table 4.56]
2009 2010
€ million € million
Accumulated write-downs, January 1 (368) (331)
Changes in scope of consolidation - -
Additions expensed in the reporting period (150) (136)
Deductions due to reversal or utilization 193 112
Exchange differences (6) (19)
Accumulated write-downs, December 31 (331) (374)
Write-Downs of Trade Accounts Receivable [Table 4.57]
2009 2010
€ million € million
Accumulated write-downs, January 1 (256) (271)
Changes in scope of consolidation - -
Additions expensed in the reporting period (85) (76)
Deductions due to write-backs or utilization 96 94
Exchange differences (26) (25)
Accumulated write-downs, December 31 (271) (278)
Table of ConTenTs
ConsolidaTed finanCial sTaTemenTs
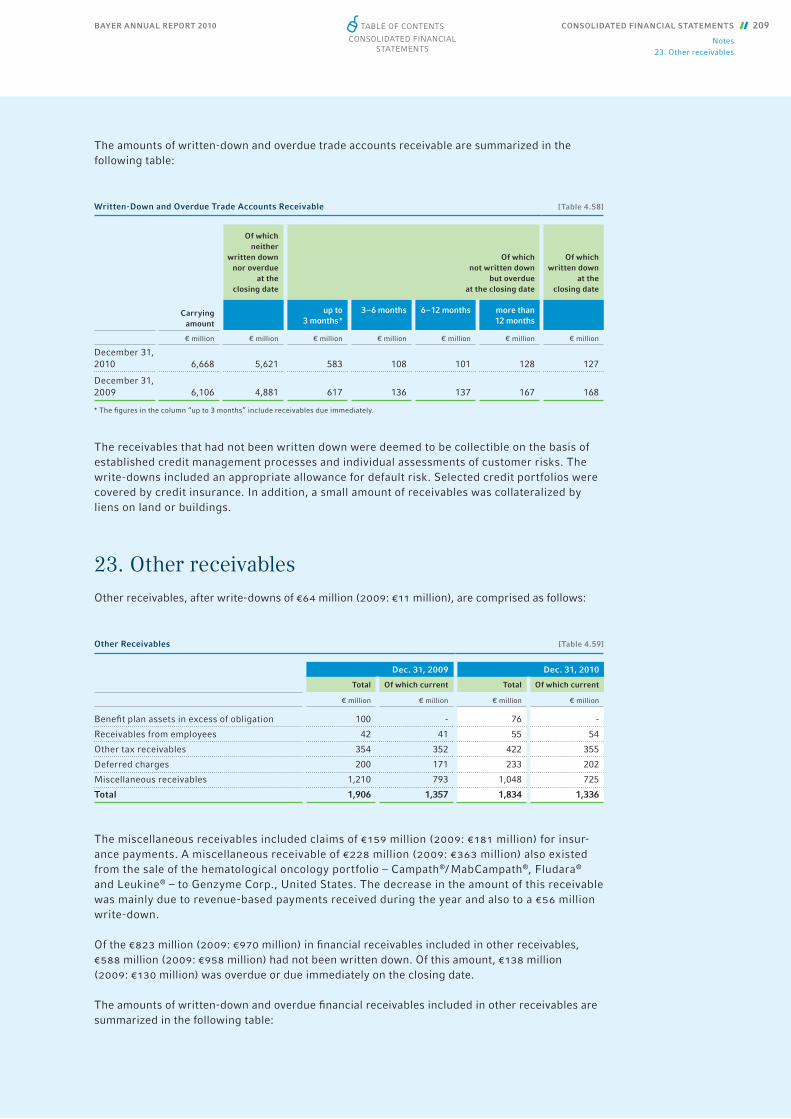
BAYER ANNUAL REPORT 2010 CONSOLIDATED FINANCIAL STATEMENTS 209
Notes23. Other receivables
The amounts of written-down and overdue trade accounts receivable are summarized in the following table:
The receivables that had not been written down were deemed to be collectible on the basis of established credit management processes and individual assessments of customer risks. The write-downs included an appropriate allowance for default risk. Selected credit portfolios were covered by credit insurance. In addition, a small amount of receivables was collateralized by liens on land or buildings.
23. Other receivablesOther receivables, after write-downs of €64 million (2009: €11 million), are comprised as follows:
The miscellaneous receivables included claims of €159 million (2009: €181 million) for insur-ance payments. A miscellaneous receivable of €228 million (2009: €363 million) also existed from the sale of the hematological oncology portfolio – Campath®/ MabCampath®, Fludara® and Leukine® – to Genzyme Corp., United States. The decrease in the amount of this receivable was mainly due to revenue-based payments received during the year and also to a €56 million write-down.
Of the €823 million (2009: €970 million) in fi nancial receivables included in other receivables, €588 million (2009: €958 million) had not been written down. Of this amount, €138 million (2009: €130 million) was overdue or due immediately on the closing date.
The amounts of written-down and overdue fi nancial receivables included in other receivables are summarized in the following table:
Other Receivables [Table 4.59]
Dec. 31, 2009 Dec. 31, 2010
Total Of which current Total Of which current
€ million € million € million € million
Benefi t plan assets in excess of obligation 100 - 76 -
Receivables from employees 42 41 55 54
Other tax receivables 354 352 422 355
Deferred charges 200 171 233 202
Miscellaneous receivables 1,210 793 1,048 725
Total 1,906 1,357 1,834 1,336
Written-Down and Overdue Trade Accounts Receivable [Table 4.58]
Of which neither
written down nor overdue
at the closing date
Of which not written down
but overdue at the closing date
Of which written down
at the closing date
Carrying
amount
up to 3 months *
3 – 6 months
6 – 12 months
more than 12 months
€ million € million € million € million € million € million € million
December 31, 2010 6,668 5,621 583 108 101 128 127
December 31, 2009 6,106 4,881 617 136 137 167 168
* The fi gures in the column “up to 3 months” include receivables due immediately.
Table of ConTenTs
ConsolidaTed finanCial sTaTemenTs
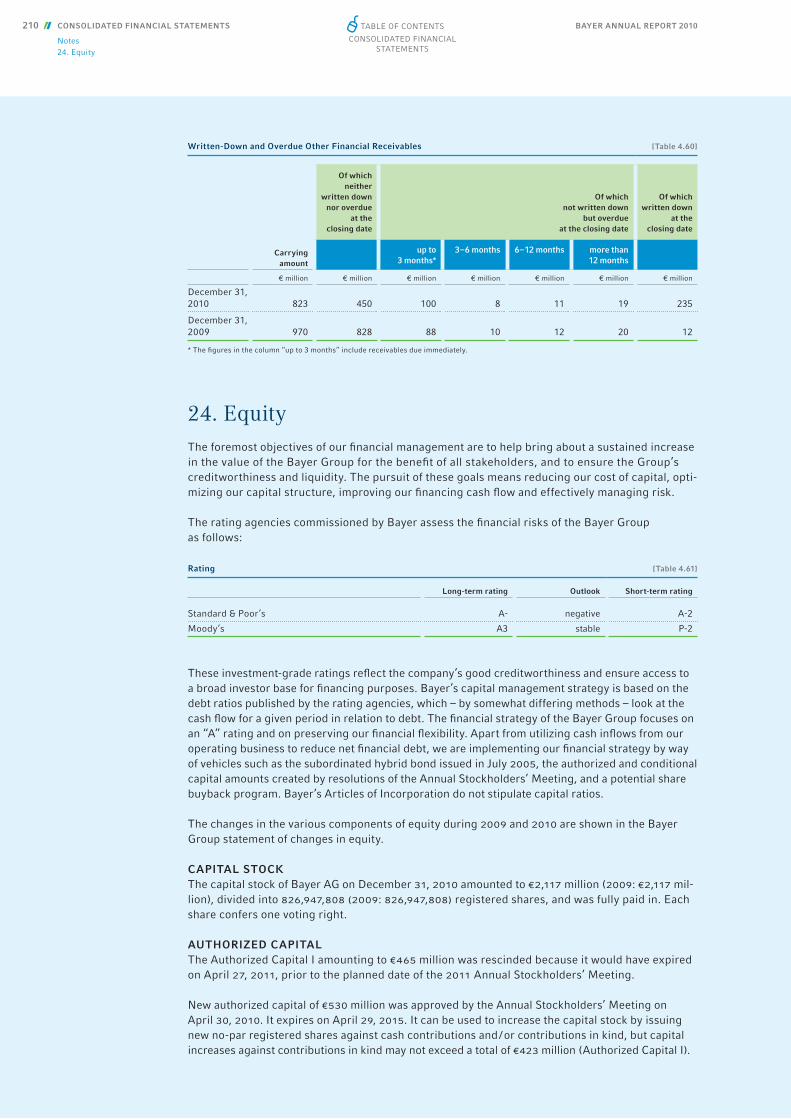
BAYER ANNUAL REPORT 2010210 CONSOLIDATED FINANCIAL STATEMENTS
Notes24. Equity
24. EquityThe foremost objectives of our fi nancial management are to help bring about a sustained increase in the value of the Bayer Group for the benefi t of all stakeholders, and to ensure the Group’s creditworthiness and liquidity. The pursuit of these goals means reducing our cost of capital, opti-mizing our capital structure, improving our fi nancing cash fl ow and effectively managing risk.
The rating agencies commissioned by Bayer assess the fi nancial risks of the Bayer Group as follows:
These investment-grade ratings refl ect the company’s good creditworthiness and ensure access to a broad investor base for fi nancing purposes. Bayer’s capital management strategy is based on the debt ratios published by the rating agencies, which – by somewhat differing methods – look at the cash fl ow for a given period in relation to debt. The fi nancial strategy of the Bayer Group focuses on an “A” rating and on preserving our fi nancial fl exibility. Apart from utilizing cash infl ows from our operating business to reduce net fi nancial debt, we are implementing our fi nancial strategy by way of vehicles such as the subordinated hybrid bond issued in July 2005, the authorized and conditional capital amounts created by resolutions of the Annual Stockholders’ Meeting, and a potential share buyback program. Bayer’s Articles of Incorporation do not stipulate capital ratios.
The changes in the various components of equity during 2009 and 2010 are shown in the Bayer Group statement of changes in equity.
CAPITAL STOCKThe capital stock of Bayer AG on December 31, 2010 amounted to €2,117 million (2009: €2,117 mil-lion), divided into 826,947,808 (2009: 826,947,808) registered shares, and was fully paid in. Each share confers one voting right.
AUTHORIZED CAPITALThe Authorized Capital I amounting to €465 million was rescinded because it would have expired on April 27, 2011, prior to the planned date of the 2011 Annual Stockholders’ Meeting.
New authorized capital of €530 million was approved by the Annual Stockholders’ Meeting on April 30, 2010. It expires on April 29, 2015. It can be used to increase the capital stock by issuing new no-par registered shares against cash contributions and / or contributions in kind, but capital increases against contributions in kind may not exceed a total of €423 million (Authorized Capital I).
Written-Down and Overdue Other Financial Receivables [Table 4.60]
Of which neither
written down nor overdue
at the closing date
Of which not written down
but overdue at the closing date
Of which written down
at the closing date
Carrying
amount
up to 3 months*
3 – 6 months 6 – 12 months more than 12 months
€ million € million € million € million € million € million € million
December 31, 2010 823 450 100 8 11 19 235
December 31, 2009 970 828 88 10 12 20 12
* The fi gures in the column “up to 3 months” include receivables due immediately.
Rating [Table 4.61]
Long-term rating Outlook Short-term rating
Standard & Poor’s A- negative A-2
Moody’s A3 stable P-2
Table of ConTenTs
ConsolidaTed finanCial sTaTemenTs
BAYER ANNUAL REPORT 2010 CONSOLIDATED FINANCIAL STATEMENTS 211
Notes24. Equity
Stockholders must normally be granted subscription rights. However, subject to the approval of the Supervisory Board, the Board of Management is authorized to exclude subscription rights for the stockholders with respect to any excess shares remaining after rights have been allocated (fractional amounts) and also to the extent necessary to grant subscription rights for new shares to holders of bonds with optional or mandatory warrants or conversion rights issued by Bayer AG or its Group companies who would be entitled to subscription rights upon the exercise of such optional or mandatory warrants or conversion rights. In addition, the Board of Management is au-thorized to exclude stockholders’ subscription rights, subject to the approval of the Supervisory Board, in cases where an increase in capital against contributions in kind is carried out for the purpose of acquiring companies, parts of companies, participating interests in companies or other assets. The amount of capital stock represented by shares issued in the above cases against cash contributions and / or contributions in kind without granting subscription rights to the stockholders must not exceed a total of 20% of the capital stock that existed on the date the authorized capital was approved by the Annual Stockholders’ Meeting.
The Authorized Capital II amounting to €195 million, which would have expired on April 26, 2012, was rescinded because, following the increase in the capital stock through the issuance of new shares, it amounted to less than 10% of the capital stock. Therefore it would not have been possi-ble to issue new shares that raise the capital stock by the full amount of 10% of the existing capi-tal stock for which stockholders’ subscription rights can be excluded when new shares are issued at a price not signifi cantly below the market price pursuant to Section 186 Paragraph 3 Sentence 4 of the German Stock Corporation Act.
It was replaced by new authorized capital approved by the Annual Stockholders’ Meeting on April 30, 2010. The Board of Management is authorized until April 29, 2015 to increase the capital stock, subject to the approval of the Supervisory Board, by a total amount of up to €212 million by issuing new no-par registered shares against cash contributions (Authorized Capital II). Under the resolution adopted by the Annual Stockholders’ Meeting, stockholders must normally be granted subscription rights. However, the Board of Management is authorized to exclude subscription rights for stockholders with respect to one or more capital increases out of the Authorized Capital II, sub-ject to the approval of the Supervisory Board, provided that such capital increase or the total of such capital increases does not exceed 10% of the capital stock existing at the time this authorization becomes effective or the time it is exercised, for purposes of issuing new shares against cash contri-butions at a price that is not signifi cantly below the market price of the company’s shares of the same category that are already listed on the stock exchange on the date the issue price is fi nally de-termined. Any treasury shares acquired on the basis of an authorization of the Stockholders’ Meet-ing and sold pursuant to Section 71 Paragraph 1 No. 8 Sentence 5 of the German Stock Corporation Act in conjunction with Section 186 Paragraph 3 Sentence 4 of the German Stock Corporation Act during the term of this authorization shall count toward the above 10% limit. Shares issued or to be issued to service bonds with optional or mandatory warrants or conversion rights shall also count toward this limit where such bonds were issued during the term of this authorization and stockhold-ers’ subscription rights were excluded by application of Section 186 Paragraph 3 Sentence 4 of the German Stock Corporation Act.
Neither of these authorized capital amounts has been utilized so far.
CONDITIONAL CAPITALThe two existing amounts of conditional capital approved by the Annual Stockholders’ Meetings of April 28, 2006 and April 27, 2007 were rescinded.
The Annual Stockholders’ Meeting on April 30, 2010 approved the creation of Conditional Capital 2010, authorizing a conditional increase of up to €212 million in the capital stock through the is-suance of up to 82,694,750 shares. This conditional capital increase may be used to grant regis-tered shares to the holders of warrant bonds, convertible bonds, jouissance rights (Genussrechte) or profi t participation bonds (or combinations of these instruments) with optional or mandatory warrants or conversion rights, issued by Bayer AG or a Group company in which Bayer AG holds a direct or indirect interest of at least 90% on or before April 29, 2015 in accordance with authori-zations granted by the Annual Stockholders’ Meeting of April 30, 2010. The authorization to issue such instruments is limited to a total nominal amount of €6 billion. In principle, stockholders have a statutory right to be granted subscription rights to such instruments. However, the Board of Management is authorized to exclude subscription rights, subject to the approval of the Super-
Table of ConTenTs
ConsolidaTed finanCial sTaTemenTs

BAYER ANNUAL REPORT 2010212 CONSOLIDATED FINANCIAL STATEMENTS
Notes24. Equity
visory Board, if the instruments are issued at a price that is not signifi cantly below the market price. The limit of 10% of the capital stock for the exclusion of stockholders’ subscription rights in analogous application of Section 186 Paragraph 3 Sentence 4 of the German Stock Corporation Act may not be exceeded. Both shares and other such instruments shall count toward this limit if they were issued without granting subscription rights to the stockholders in direct or analogous application of Section 186 Paragraph 3 Sentence 4 of the German Stock Corporation Act.
Absent a further resolution of the Annual Stockholders’ Meeting on the exclusion of stockholders’ subscription rights, the Board of Management will only use the existing authorizations to increase the capital stock out of the Authorized Capital or the Conditional Capital – without granting sub-scription rights to the stockholders – up to a total amount of 20% of the capital stock that existed when the respective resolutions were adopted by the Annual Stockholders’ Meeting on April 30, 2010. This 20% limit includes all issuances or sales of shares or of bonds with optional or manda-tory warrants or conversion rights that are effected without granting subscription rights to the stockholders.
RETAINED EARNINGSThe retained earnings comprise prior years’ undistributed income of consolidated companies and all actuarial gains and losses related to defi ned benefi t pension plans that are not recognized in income.
ACCUMULATED OTHER COMPREHENSIVE INCOMEAccumulated other comprehensive income comprises exchange differences, the changes in fair values of cash fl ow hedges and available-for-sale fi nancial assets, and the revaluation surplus. The latter results from the acquisition in 2005 of the remaining 50% interest in an otc joint venture with Roche in the United States that was established in 1996 and the acquisition of the remaining 50% interest in BaySystems GmbH & Co. KG, Oldenburg, Germany, in 2008. An amount of €5 million (2009: €6 mil-lion) that constitutes scheduled amortization / depreciation of the respective assets and is recognized in income was transferred in 2010 from the revaluation surplus to retained earnings.
DIVIDENDUnder the German Stock Corporation Act (AktG), the dividend payment is determined by the distributable profi t reported in the annual fi nancial statements of Bayer AG, which are prepared according to the German Commercial Code. Retained earnings were diminished by payment of the dividend of €1.40 per share for 2009. The proposed dividend for the 2010 fi scal year is €1.50 per share, which would result in a total dividend payment of €1,240 million. Payment of the proposed dividend is contingent upon approval by the stockholders at the Annual Stockholders’ Meeting and has not been recognized as a liability in the consolidated fi nancial statements of the Bayer Group.
NON-CONTROLLING INTERESTThe changes in the non-controlling interest in Group equity during 2010 and 2009 are shown in the following table:
Components of Non-Controlling Interest in Equity [Table 4.62]
2009 2010
€ million € million
January 1 77 54
Changes in equity not recognized in net income
Changes in fair value of securities and cash fl ow hedges - -
Changes in actuarial gains / losses on defi ned benefi t obligations for pensions and other post-employment benefi ts - -
Exchange differences on translation of operations outside the eurozone 2 6
Deferred taxes on valuation adjustments recognized directly in equity - -
Other changes in equity (21) (3)
Dividend payments (4) (3)
Changes in equity recognized in net income - 9
December 31 54 63
Table of ConTenTs
ConsolidaTed finanCial sTaTemenTs
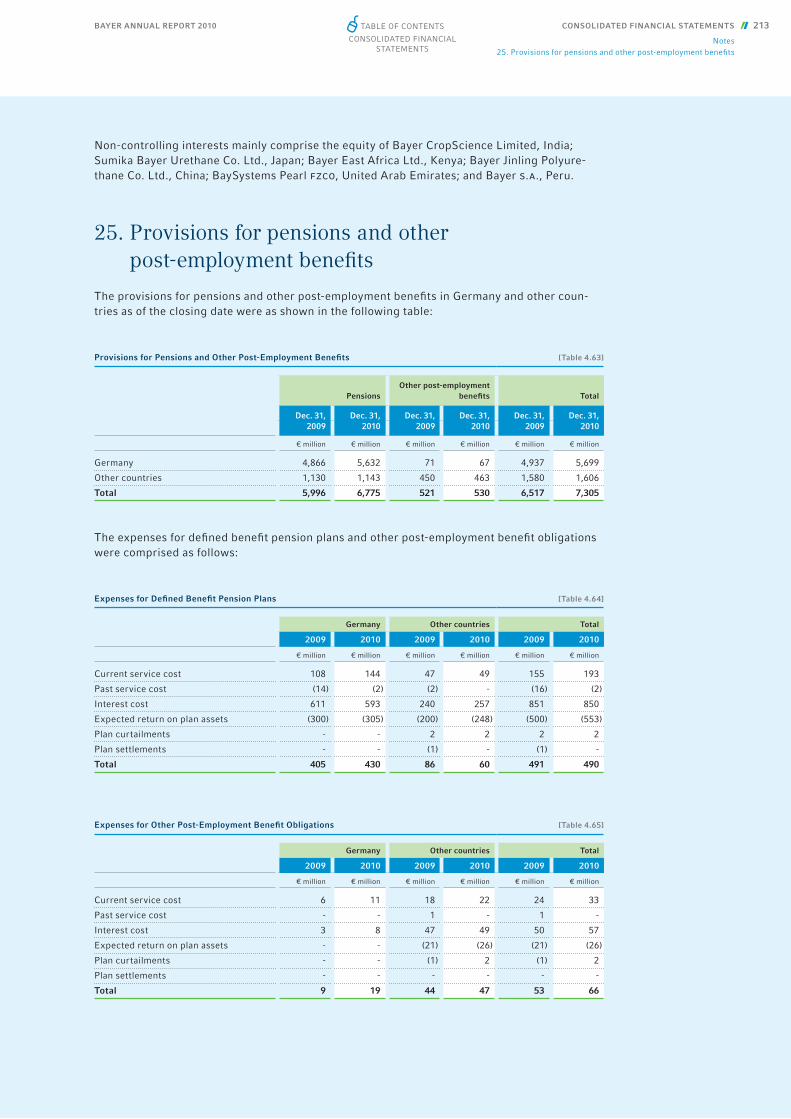
BAYER ANNUAL REPORT 2010 CONSOLIDATED FINANCIAL STATEMENTS 213
Notes25. Provisions for pensions and other post-employment benefi ts
Non-controlling interests mainly comprise the equity of Bayer CropScience Limited, India; Sumika Bayer Urethane Co. Ltd., Japan; Bayer East Africa Ltd., Kenya; Bayer Jinling Polyure-thane Co. Ltd., China; BaySystems Pearl fzco, United Arab Emirates; and Bayer s.a., Peru.
25. Provisions for pensions and other post-employment benefi ts
The provisions for pensions and other post-employment benefi ts in Germany and other coun-tries as of the closing date were as shown in the following table:
The expenses for defi ned benefi t pension plans and other post-employment benefi t obligations were comprised as follows:
Provisions for Pensions and Other Post-Employment Benefi ts [Table 4.63]
PensionsOther post-employment
benefi ts Total
Dec. 31, 2009
Dec. 31, 2010
Dec. 31, 2009
Dec. 31, 2010
Dec. 31, 2009
Dec. 31, 2010
€ million € million € million € million € million € million
Germany 4,866 5,632 71 67 4,937 5,699
Other countries 1,130 1,143 450 463 1,580 1,606
Total 5,996 6,775 521 530 6,517 7,305
Expenses for Defi ned Benefi t Pension Plans [Table 4.64]
Germany Other countries Total
2009 2010 2009 2010 2009 2010
€ million € million € million € million € million € million
Current service cost 108 144 47 49 155 193
Past service cost (14) (2) (2) - (16) (2)
Interest cost 611 593 240 257 851 850
Expected return on plan assets (300) (305) (200) (248) (500) (553)
Plan curtailments - - 2 2 2 2
Plan settlements - - (1) - (1) -
Total 405 430 86 60 491 490
Expenses for Other Post-Employment Benefi t Obligations [Table 4.65]
Germany Other countries Total
2009 2010 2009 2010 2009 2010
€ million € million € million € million € million € million
Current service cost 6 11 18 22 24 33
Past service cost - - 1 - 1 -
Interest cost 3 8 47 49 50 57
Expected return on plan assets - - (21) (26) (21) (26)
Plan curtailments - - (1) 2 (1) 2
Plan settlements - - - - - -
Total 9 19 44 47 53 66
Table of ConTenTs
ConsolidaTed finanCial sTaTemenTs
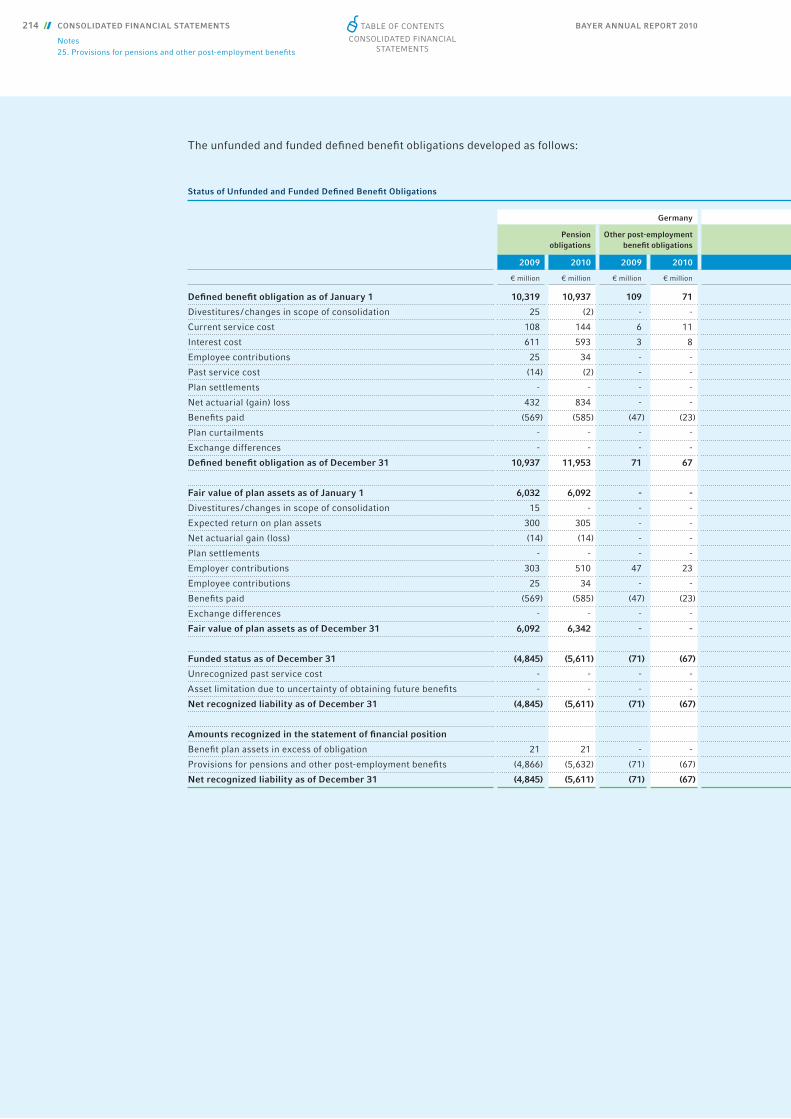
BAYER ANNUAL REPORT 2010214 CONSOLIDATED FINANCIAL STATEMENTS
Notes25. Provisions for pensions and other post-employment benefi ts
The unfunded and funded defi ned benefi t obligations developed as follows:
Status of Unfunded and Funded Defi ned Benefi t Obligations
Germany
Pension obligations
Other post-employment benefi t obligations
2009 2010 2009 2010
€ million € million € million € million
Defi ned benefi t obligation as of January 1 10,319 10,937 109 71
Divestitures / changes in scope of consolidation 25 (2) - -
Current service cost 108 144 6 11
Interest cost 611 593 3 8
Employee contributions 25 34 - -
Past service cost (14) (2) - -
Plan settlements - - - -
Net actuarial (gain) loss 432 834 - -
Benefi ts paid (569) (585) (47) (23)
Plan curtailments - - - -
Exchange differences - - - -
Defi ned benefi t obligation as of December 31 10,937 11,953 71 67
Fair value of plan assets as of January 1 6,032 6,092 - -
Divestitures / changes in scope of consolidation 15 - - -
Expected return on plan assets 300 305 - -
Net actuarial gain (loss) (14) (14) - -
Plan settlements - - - -
Employer contributions 303 510 47 23
Employee contributions 25 34 - -
Benefi ts paid (569) (585) (47) (23)
Exchange differences - - - -
Fair value of plan assets as of December 31 6,092 6,342 - -
Funded status as of December 31 (4,845) (5,611) (71) (67)
Unrecognized past service cost - - - -
Asset limitation due to uncertainty of obtaining future benefi ts - - - -
Net recognized liability as of December 31 (4,845) (5,611) (71) (67)
Amounts recognized in the statement of fi nancial position
Benefi t plan assets in excess of obligation 21 21 - -
Provisions for pensions and other post-employment benefi ts (4,866) (5,632) (71) (67)
Net recognized liability as of December 31 (4,845) (5,611) (71) (67)
Table of ConTenTs
ConsolidaTed finanCial sTaTemenTs

BAYER ANNUAL REPORT 2010 CONSOLIDATED FINANCIAL STATEMENTS 215
Notes25. Provisions for pensions and other post-employment benefi ts
[Table 4.66]
Other Countries Total
Pension obligations
Other post-employment benefi t obligations
Pension obligations
Other post-employment benefi t obligations
2009 2010 2009 2010 2009 2010 2009 2010
€ million € million € million € million € million € million € million € million
3,752 4,173 730 750 14,071 15,110 839 821
- - - - 25 (2) - -
47 49 18 22 155 193 24 33
240 257 47 49 851 850 50 57
4 5 - - 29 39 - -
(2) 4 1 - (16) 2 1 -
(1) (2) - - (1) (2) - -
309 335 4 (48) 741 1,169 4 (48)
(209) (224) (42) (39) (778) (809) (89) (62)
2 2 (1) 2 2 2 (1) 2
31 281 (7) 63 31 281 (7) 63
4,173 4,880 750 799 15,110 16,833 821 866
2,651 3,137 251 304 8,683 9,229 251 304
- - - - 15 - - -
200 248 21 26 500 553 21 26
280 153 38 15 266 139 38 15
(2) (2) - - (2) (2) - -
141 276 45 9 444 786 92 32
4 5 - - 29 39 - -
(209) (224) (42) (39) (778) (809) (89) (62)
72 212 (9) 24 72 212 (9) 24
3,137 3,805 304 339 9,229 10,147 304 339
(1,036) (1,075) (446) (460) (5,881) (6,686) (517) (527)
(1) 2 (4) (3) (1) 2 (4) (3)
(14) (15) - - (14) (15) - -
(1,051) (1,088) (450) (463) (5,896) (6,699) (521) (530)
79 55 - - 100 76 - -
(1,130) (1,143) (450) (463) (5,996) (6,775) (521) (530)
(1,051) (1,088) (450) (463) (5,896) (6,699) (521) (530)
Table of ConTenTs
ConsolidaTed finanCial sTaTemenTs
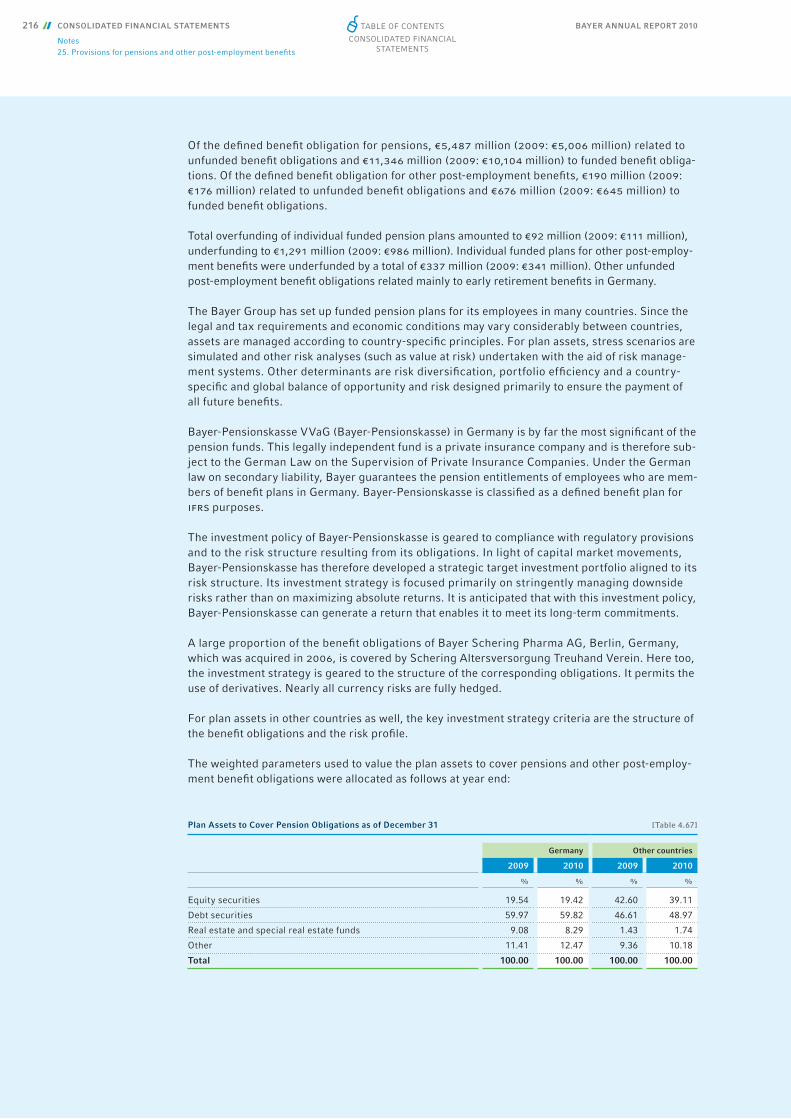
BAYER ANNUAL REPORT 2010216 CONSOLIDATED FINANCIAL STATEMENTS
Notes25. Provisions for pensions and other post-employment benefi ts
Of the defi ned benefi t obligation for pensions, €5,487 million (2009: €5,006 million) related to unfunded benefi t obligations and €11,346 million (2009: €10,104 million) to funded benefi t obliga-tions. Of the defi ned benefi t obligation for other post-employment benefi ts, €190 million (2009:€176 million) related to unfunded benefi t obligations and €676 million (2009: €645 million) to funded benefi t obligations.
Total overfunding of individual funded pension plans amounted to €92 million (2009: €111 million), underfunding to €1,291 million (2009: €986 million). Individual funded plans for other post-employ-ment benefi ts were underfunded by a total of €337 million (2009: €341 million). Other unfunded post-employment benefi t obligations related mainly to early retirement benefi ts in Germany.
The Bayer Group has set up funded pension plans for its employees in many countries. Since the legal and tax requirements and economic conditions may vary considerably between countries, assets are managed according to country-specifi c principles. For plan assets, stress scenarios are simulated and other risk analyses (such as value at risk) undertaken with the aid of risk manage-ment systems. Other determinants are risk diversifi cation, portfolio effi ciency and a country-specifi c and global balance of opportunity and risk designed primarily to ensure the payment of all future benefi ts.
Bayer-Pensionskasse VVaG (Bayer-Pensionskasse) in Germany is by far the most signifi cant of the pension funds. This legally independent fund is a private insurance company and is therefore sub-ject to the German Law on the Supervision of Private Insurance Companies. Under the German law on secondary liability, Bayer guarantees the pension entitlements of employees who are mem-bers of benefi t plans in Germany. Bayer-Pensionskasse is classifi ed as a defi ned benefi t plan for ifrs purposes.
The investment policy of Bayer-Pensionskasse is geared to compliance with regulatory provisions and to the risk structure resulting from its obligations. In light of capital market movements, Bayer-Pensionskasse has therefore developed a strategic target investment portfolio aligned to its risk structure. Its investment strategy is focused primarily on stringently managing downside risks rather than on maximizing absolute returns. It is anticipated that with this investment policy, Bayer-Pensionskasse can generate a return that enables it to meet its long-term commitments.
A large proportion of the benefi t obligations of Bayer Schering Pharma AG, Berlin, Germany, which was acquired in 2006, is covered by Schering Altersversorgung Treuhand Verein. Here too, the investment strategy is geared to the structure of the corresponding obligations. It permits the use of derivatives. Nearly all currency risks are fully hedged.
For plan assets in other countries as well, the key investment strategy criteria are the structure of the benefi t obligations and the risk profi le.
The weighted parameters used to value the plan assets to cover pensions and other post-employ-ment benefi t obligations were allocated as follows at year end:
Plan Assets to Cover Pension Obligations as of December 31 [Table 4.67]
Germany Other countries
2009 2010 2009 2010
% % % %
Equity securities 19.54 19.42 42.60 39.11
Debt securities 59.97 59.82 46.61 48.97
Real estate and special real estate funds 9.08 8.29 1.43 1.74
Other 11.41 12.47 9.36 10.18
Total 100.00 100.00 100.00 100.00
Table of ConTenTs
ConsolidaTed finanCial sTaTemenTs

BAYER ANNUAL REPORT 2010 CONSOLIDATED FINANCIAL STATEMENTS 217
Notes25. Provisions for pensions and other post-employment benefi ts
The fair value of the plan assets included real estate leased by Bayer, recognized at a fair value of €74 million (2009: €78 million), and Bayer shares held through investment funds, recognized at their market value of €24 million (2009: €30 million). The other plan assets principally comprise mortgage loans granted, other receivables, fi xed-term deposits and cash and cash equivalents.
The following weighted parameters were used to value the pension obligations as of December 31 and the expense for pensions and other post-employment benefi ts in the respective year:
Plan Assets to Cover Other Post-Employment Benefi t Obligations as of December 31 [Table 4.68]
Germany Other countries
2009 2010 2009 2010
% % % %
Equity securities - - 45.20 36.60
Debt securities - - 35.18 40.03
Real estate and special real estate funds - - - -
Other - - 19.62 23.37
Total - - 100.00 100.00
Parameters for Benefi t Obligations [Table 4.69]
Germany Other countries Total
2009 2010 2009 2010 2009 2010
% % % % % %
Pension obligations
Discount rate 5.50 4.90 5.90 5.40 5.60 5.05
Projected future remuneration increases 2.50 3.00 4.15 4.25 2.95 3.35
Projected future benefi t increases 1.75 1.75 3.50 3.50 2.25 2.25
Other post-employment benefi t obligations
Discount rate 3.10 3.10 6.20 5.70 5.95 5.50
Parameters for Benefi t Expense [Table 4.70]
Germany Other countries Total
2009 2010 2009 2010 2009 2010
% % % % % %
Pension obligations
Discount rate 6.00 5.50 6.30 5.90 6.10 5.60
Projected future remuneration increases 3.00 2.50 4.00 4.15 3.25 2.95
Projected future benefi t increases 2.00 1.75 2.95 3.50 2.25 2.25
Expected return on plan assets 5.00 4.60 7.50 7.25 5.85 5.60
Other post-employment benefi t obligations
Discount rate 6.40 3.10 6.45 6.20 6.45 5.95
Expected return on plan assets - - 8.25 7.95 8.25 7.95
Table of ConTenTs
ConsolidaTed finanCial sTaTemenTs
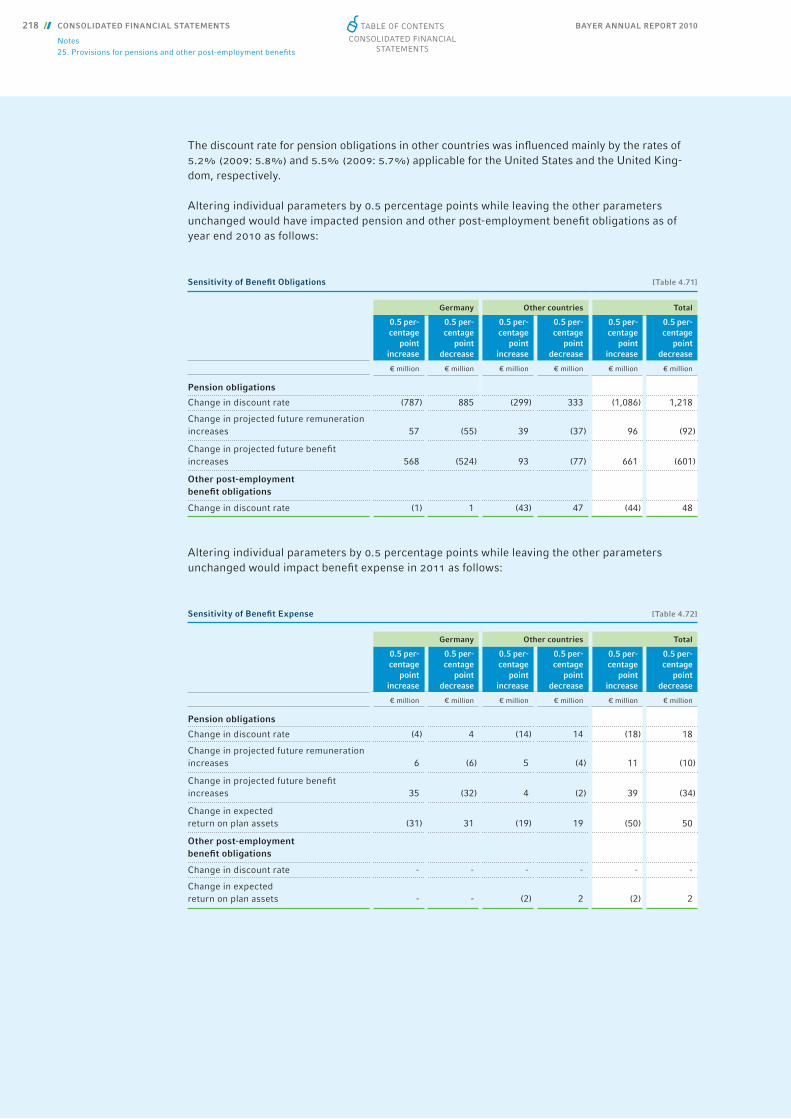
BAYER ANNUAL REPORT 2010218 CONSOLIDATED FINANCIAL STATEMENTS
Notes25. Provisions for pensions and other post-employment benefi ts
The discount rate for pension obligations in other countries was infl uenced mainly by the rates of 5.2% (2009: 5.8%) and 5.5% (2009: 5.7%) applicable for the United States and the United King-dom, respectively.
Altering individual parameters by 0.5 percentage points while leaving the other parameters unchanged would have impacted pension and other post-employment benefi t obligations as of year end 2010 as follows:
Altering individual parameters by 0.5 percentage points while leaving the other parameters unchanged would impact benefi t expense in 2011 as follows:
Sensitivity of Benefi t Obligations [Table 4.71]
Germany Other countries Total
0.5 per-centage
point increase
0.5 per-centage
point decrease
0.5 per-centage
point increase
0.5 per-centage
point decrease
0.5 per-centage
point increase
0.5 per-centage
point decrease
€ million € million € million € million € million € million
Pension obligations
Change in discount rate (787) 885 (299) 333 (1,086) 1,218
Change in projected future remuneration increases 57 (55) 39 (37) 96 (92)
Change in projected future benefi t increases 568 (524) 93 (77) 661 (601)
Other post-employment benefi t obligations
Change in discount rate (1) 1 (43) 47 (44) 48
Sensitivity of Benefi t Expense [Table 4.72]
Germany Other countries Total
0.5 per-centage
point increase
0.5 per-centage
point decrease
0.5 per-centage
point increase
0.5 per-centage
point decrease
0.5 per-centage
point increase
0.5 per-centage
point decrease
€ million € million € million € million € million € million
Pension obligations
Change in discount rate (4) 4 (14) 14 (18) 18
Change in projected future remuneration increases 6 (6) 5 (4) 11 (10)
Change in projected future benefi t increases 35 (32) 4 (2) 39 (34)
Change in expected return on plan assets (31) 31 (19) 19 (50) 50
Other post-employment benefi t obligations
Change in discount rate - - - - - -
Change in expected return on plan assets - - (2) 2 (2) 2
Table of ConTenTs
ConsolidaTed finanCial sTaTemenTs
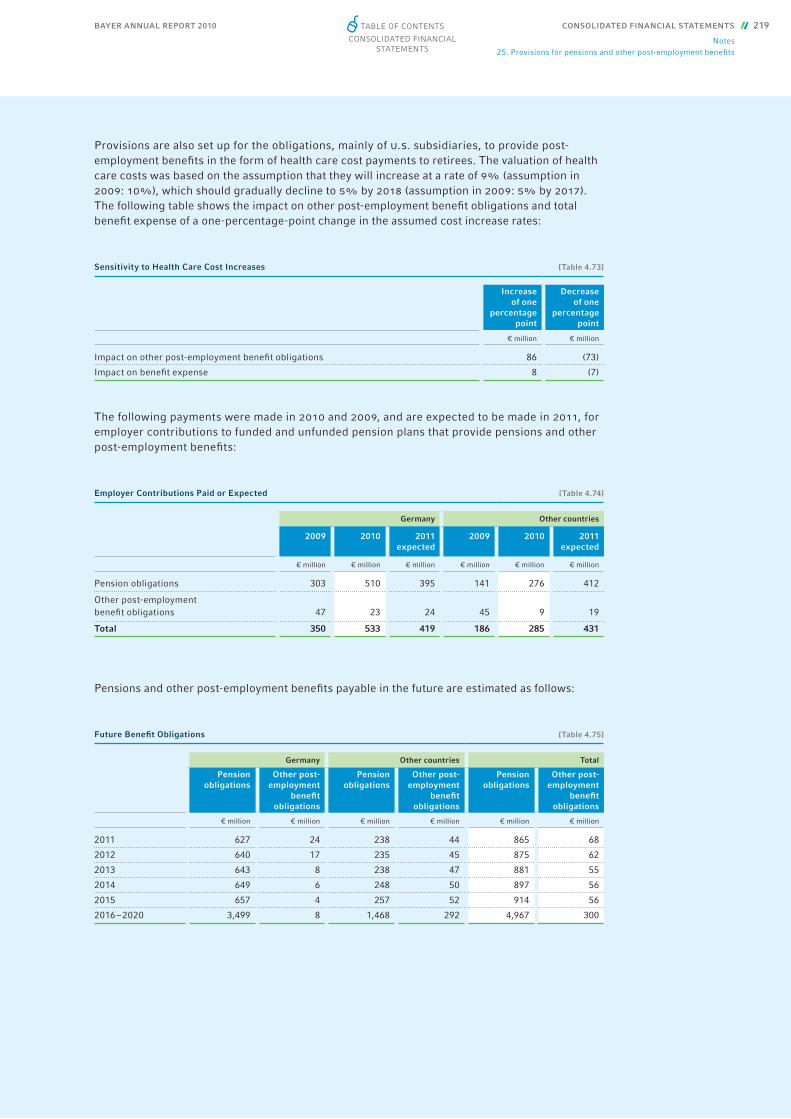
BAYER ANNUAL REPORT 2010 CONSOLIDATED FINANCIAL STATEMENTS 219
Notes25. Provisions for pensions and other post-employment benefi ts
Provisions are also set up for the obligations, mainly of u.s. subsidiaries, to provide post-employment benefi ts in the form of health care cost payments to retirees. The valuation of health care costs was based on the assumption that they will increase at a rate of 9% (assumption in 2009: 10%), which should gradually decline to 5% by 2018 (assumption in 2009: 5% by 2017). The following table shows the impact on other post-employment benefi t obligations and total benefi t expense of a one-percentage-point change in the assumed cost increase rates:
The following payments were made in 2010 and 2009, and are expected to be made in 2011, for employer contributions to funded and unfunded pension plans that provide pensions and other post-employment benefi ts:
Pensions and other post-employment benefi ts payable in the future are estimated as follows:
Sensitivity to Health Care Cost Increases [Table 4.73]
Increase of one
percentage point
Decrease of one
percentage point
€ million € million
Impact on other post-employment benefi t obligations 86 (73)
Impact on benefi t expense 8 (7)
Employer Contributions Paid or Expected [Table 4.74]
Germany Other countries
2009 2010 2011 expected
2009 2010 2011 expected
€ million € million € million € million € million € million
Pension obligations 303 510 395 141 276 412
Other post-employment benefi t obligations 47 23 24 45 9 19
Total 350 533 419 186 285 431
Future Benefi t Obligations [Table 4.75]
Germany Other countries Total
Pension obligations
Other post-employment
benefi t obligations
Pension obligations
Other post-employment
benefi t obligations
Pension obligations
Other post-employment
benefi t obligations
€ million € million € million € million € million € million
2011 627 24 238 44 865 68
2012 640 17 235 45 875 62
2013 643 8 238 47 881 55
2014 649 6 248 50 897 56
2015 657 4 257 52 914 56
2016 – 2020 3,499 8 1,468 292 4,967 300
Table of ConTenTs
ConsolidaTed finanCial sTaTemenTs
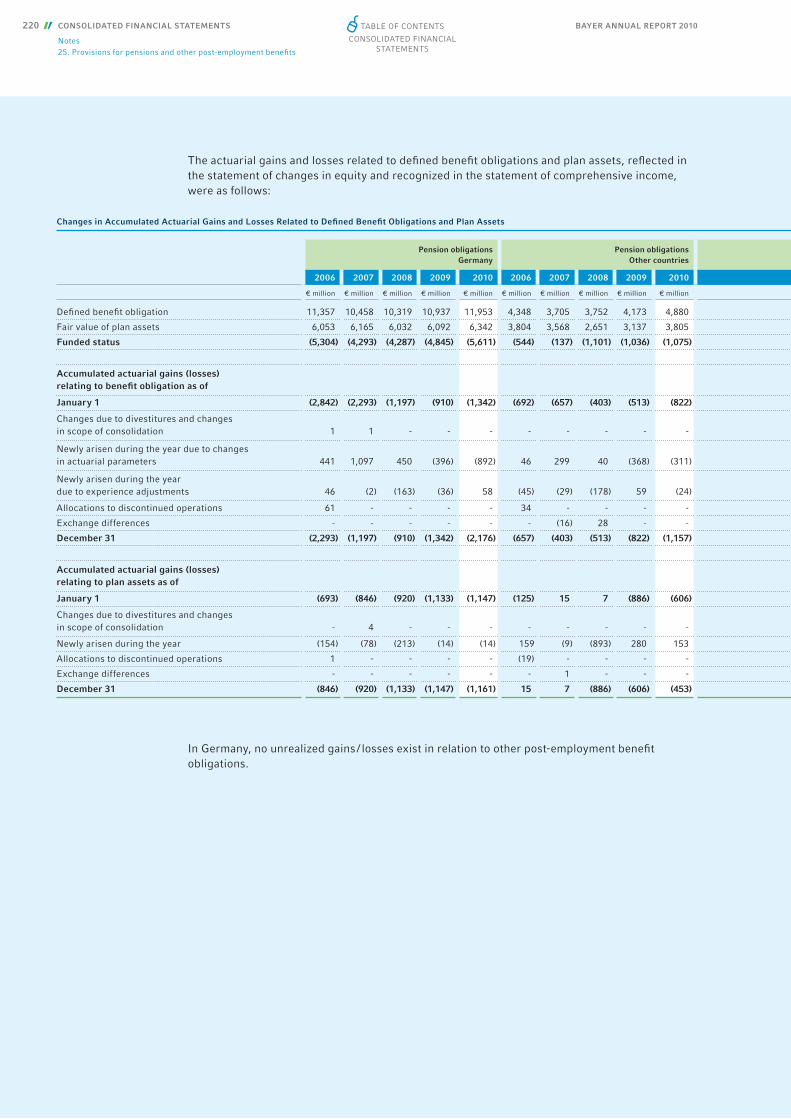
BAYER ANNUAL REPORT 2010220 CONSOLIDATED FINANCIAL STATEMENTS
Notes25. Provisions for pensions and other post-employment benefi ts
The actuarial gains and losses related to defi ned benefi t obligations and plan assets, refl ected in the statement of changes in equity and recognized in the statement of comprehensive income, were as follows:
In Germany, no unrealized gains / losses exist in relation to other post-employment benefi t obligations.
Changes in Accumulated Actuarial Gains and Losses Related to Defi ned Benefi t Obligations and Plan Assets
Pension obligations Germany
Pension obligations Other countries
2006 2007 2008 2009 2010 2006 2007 2008 2009 2010
€ million € million € million € million € million € million € million € million € million € million
Defi ned benefi t obligation 11,357 10,458 10,319 10,937 11,953 4,348 3,705 3,752 4,173 4,880
Fair value of plan assets 6,053 6,165 6,032 6,092 6,342 3,804 3,568 2,651 3,137 3,805
Funded status (5,304) (4,293) (4,287) (4,845) (5,611) (544) (137) (1,101) (1,036) (1,075)
Accumulated actuarial gains (losses) relating to benefi t obligation as of
January 1 (2,842) (2,293) (1,197) (910) (1,342) (692) (657) (403) (513) (822)
Changes due to divestitures and changes in scope of consolidation 1 1 - - - - - - - -
Newly arisen during the year due to changes in actuarial parameters 441 1,097 450 (396) (892) 46 299 40 (368) (311)
Newly arisen during the year due to experience adjustments 46 (2) (163) (36) 58 (45) (29) (178) 59 (24)
Allocations to discontinued operations 61 - - - - 34 - - - -
Exchange differences - - - - - - (16) 28 - -
December 31 (2,293) (1,197) (910) (1,342) (2,176) (657) (403) (513) (822) (1,157)
Accumulated actuarial gains (losses) relating to plan assets as of
January 1 (693) (846) (920) (1,133) (1,147) (125) 15 7 (886) (606)
Changes due to divestitures and changes in scope of consolidation - 4 - - - - - - - -
Newly arisen during the year (154) (78) (213) (14) (14) 159 (9) (893) 280 153
Allocations to discontinued operations 1 - - - - (19) - - - -
Exchange differences - - - - - - 1 - - -
December 31 (846) (920) (1,133) (1,147) (1,161) 15 7 (886) (606) (453)
Table of ConTenTs
ConsolidaTed finanCial sTaTemenTs
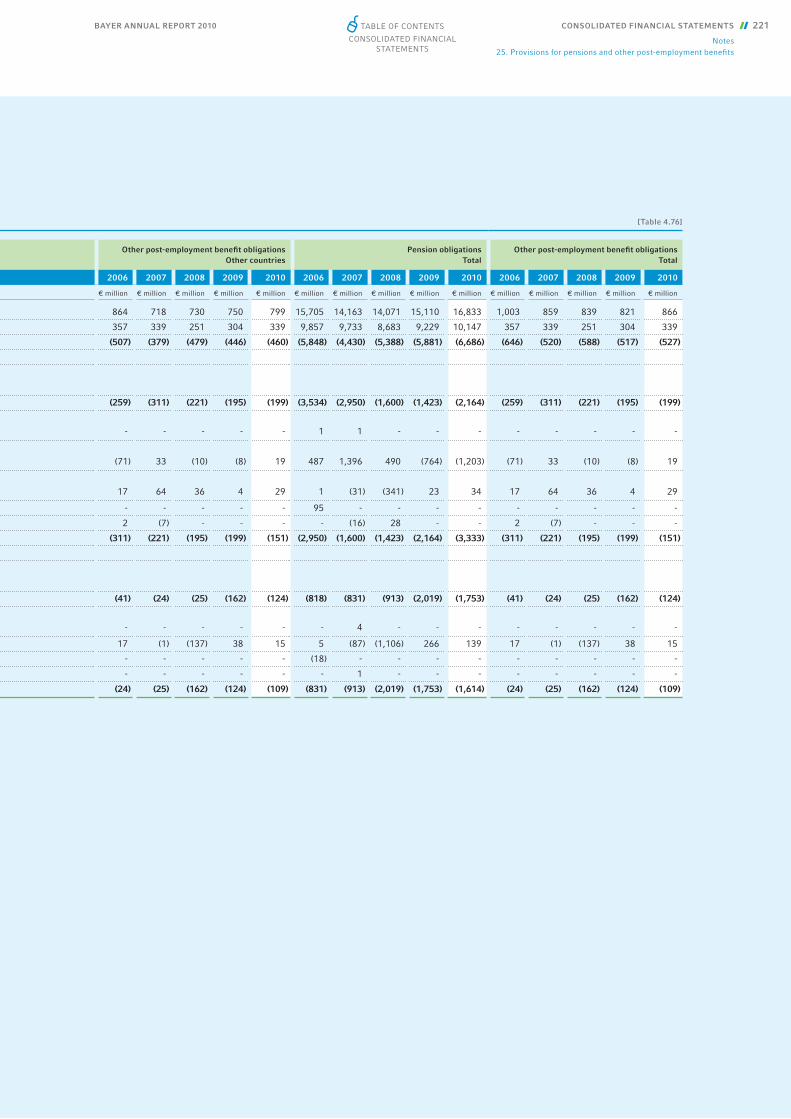
BAYER ANNUAL REPORT 2010 CONSOLIDATED FINANCIAL STATEMENTS 221
Notes25. Provisions for pensions and other post-employment benefi ts
[Table 4.76]
Other post-employment benefi t obligations Other countries
Pension obligations Total
Other post-employment benefi t obligations Total
2006 2007 2008 2009 2010 2006 2007 2008 2009 2010 2006 2007 2008 2009 2010
€ million € million € million € million € million € million € million € million € million € million € million € million € million € million € million
864 718 730 750 799 15,705 14,163 14,071 15,110 16,833 1,003 859 839 821 866
357 339 251 304 339 9,857 9,733 8,683 9,229 10,147 357 339 251 304 339
(507) (379) (479) (446) (460) (5,848) (4,430) (5,388) (5,881) (6,686) (646) (520) (588) (517) (527)
(259) (311) (221) (195) (199) (3,534) (2,950) (1,600) (1,423) (2,164) (259) (311) (221) (195) (199)
- - - - - 1 1 - - - - - - - -
(71) 33 (10) (8) 19 487 1,396 490 (764) (1,203) (71) 33 (10) (8) 19
17 64 36 4 29 1 (31) (341) 23 34 17 64 36 4 29
- - - - - 95 - - - - - - - - -
2 (7) - - - - (16) 28 - - 2 (7) - - -
(311) (221) (195) (199) (151) (2,950) (1,600) (1,423) (2,164) (3,333) (311) (221) (195) (199) (151)
(41) (24) (25) (162) (124) (818) (831) (913) (2,019) (1,753) (41) (24) (25) (162) (124)
- - - - - - 4 - - - - - - - -
17 (1) (137) 38 15 5 (87) (1,106) 266 139 17 (1) (137) 38 15
- - - - - (18) - - - - - - - - -
- - - - - - 1 - - - - - - - -
(24) (25) (162) (124) (109) (831) (913) (2,019) (1,753) (1,614) (24) (25) (162) (124) (109)
Table of ConTenTs
ConsolidaTed finanCial sTaTemenTs
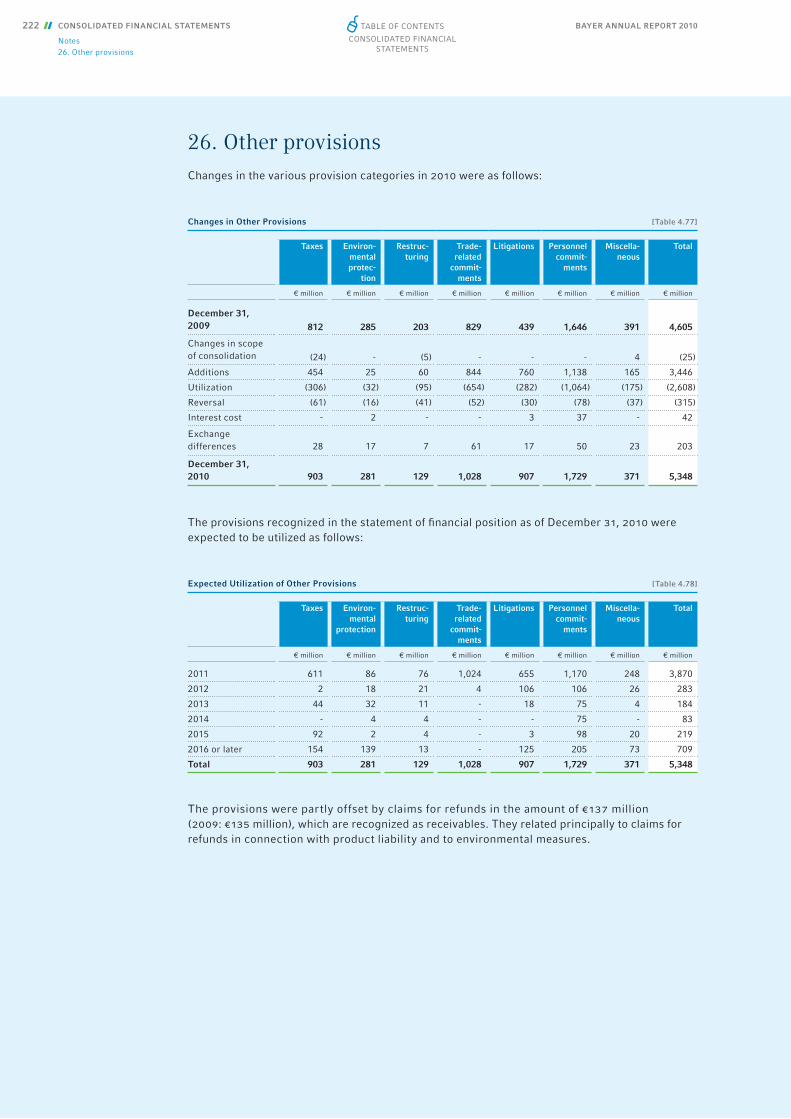
BAYER ANNUAL REPORT 2010222 CONSOLIDATED FINANCIAL STATEMENTS
Notes26. Other provisions
26. Other provisionsChanges in the various provision categories in 2010 were as follows:
The provisions recognized in the statement of fi nancial position as of December 31, 2010 were expected to be utilized as follows:
The provisions were partly offset by claims for refunds in the amount of €137 million (2009: €135 million), which are recognized as receivables. They related principally to claims for refunds in connection with product liability and to environmental measures.
Changes in Other Provisions [Table 4.77]
Taxes Environ-mentalprotec-
tion
Restruc-turing
Trade-related
commit-ments
Litigations Personnel commit-
ments
Miscella-neous
Total
€ million € million € million € million € million € million € million € million
December 31, 2009 812 285 203 829 439 1,646 391 4,605
Changes in scopeof consolidation (24) - (5) - - - 4 (25)
Additions 454 25 60 844 760 1,138 165 3,446
Utilization (306) (32) (95) (654) (282) (1,064) (175) (2,608)
Reversal (61) (16) (41) (52) (30) (78) (37) (315)
Interest cost - 2 - - 3 37 - 42
Exchange
differences 28 17 7 61 17 50 23 203
December 31, 2010 903 281 129 1,028 907 1,729 371 5,348
Expected Utilization of Other Provisions [Table 4.78]
Taxes Environ-mental
protection
Restruc-turing
Trade-related
commit-ments
Litigations Personnelcommit-
ments
Miscella-neous
Total
€ million € million € million € million € million € million € million € million
2011 611 86 76 1,024 655 1,170 248 3,870
2012 2 18 21 4 106 106 26 283
2013 44 32 11 - 18 75 4 184
2014 - 4 4 - - 75 - 83
2015 92 2 4 - 3 98 20 219
2016 or later 154 139 13 - 125 205 73 709
Total 903 281 129 1,028 907 1,729 371 5,348
Table of ConTenTs
ConsolidaTed finanCial sTaTemenTs
BAYER ANNUAL REPORT 2010 CONSOLIDATED FINANCIAL STATEMENTS 223
Notes26. Other provisions
26.1 Taxes
Provisions for taxes comprised provisions for income taxes amounting to €772 million (2009: €686 million) and provisions for other types of taxes amounting to €130 million (2009: €126 million). Further income tax commitments according to ias 12 existed at year end in the amount of €62 mil-lion (2009: €93 million) recognized in the statement of fi nancial position as income tax liabilities.
26.2 Environmental protection
Provisions for environmental protection mainly relate to the rehabilitation of contaminated land, recultivation of landfi lls, and redevelopment and water protection measures.
26.3 Restructuring
Provisions for restructuring included €109 million (2009: €166 million) for severance payments and €20 million (2009: €37 million) for other expenses, which mainly comprised demolition and other costs related to the closure of production facilities.
A restructuring program was launched in the HealthCare subgroup in November 2010 to improve its effi ciency for the long term. The measures, which relate to all functional areas, are intended to produce sustained cost savings and ensure a shift in the subgroup’s activities from the saturated markets toward the growth economies. In addition, the restructuring carried out as part of the in-tegration of Schering AG, Berlin, Germany, led to further disbursements in 2010. Signifi cant indi-vidual restructuring measures took place in the United States and Germany in 2010. Provisions for the above and other restructuring measures as of December 31, 2010, amounted to €77 million. Of this amount, severance payments accounted for €68 million and other restructuring expenses for €9 million.
Restructuring measures also proceeded in the CropScience subgroup, particularly in France, where several companies were merged to enable cost structures to be optimized and the effi -ciency of administrative functions improved. Provisions for restructuring as of December 31, 2010 amounted to €26 million, including €21 million for severance payments and €5 million for other restructuring expenses.
The restructuring measures carried out in the MaterialScience subgroup related mainly to the optimization of the production site in New Martinsville, West Virginia, United States. Provisions for restructuring as of December 31, 2010 amounted to €14 million, including €9 million for severance payments and €5 million for other restructuring expenses.
Table of ConTenTs
ConsolidaTed finanCial sTaTemenTs
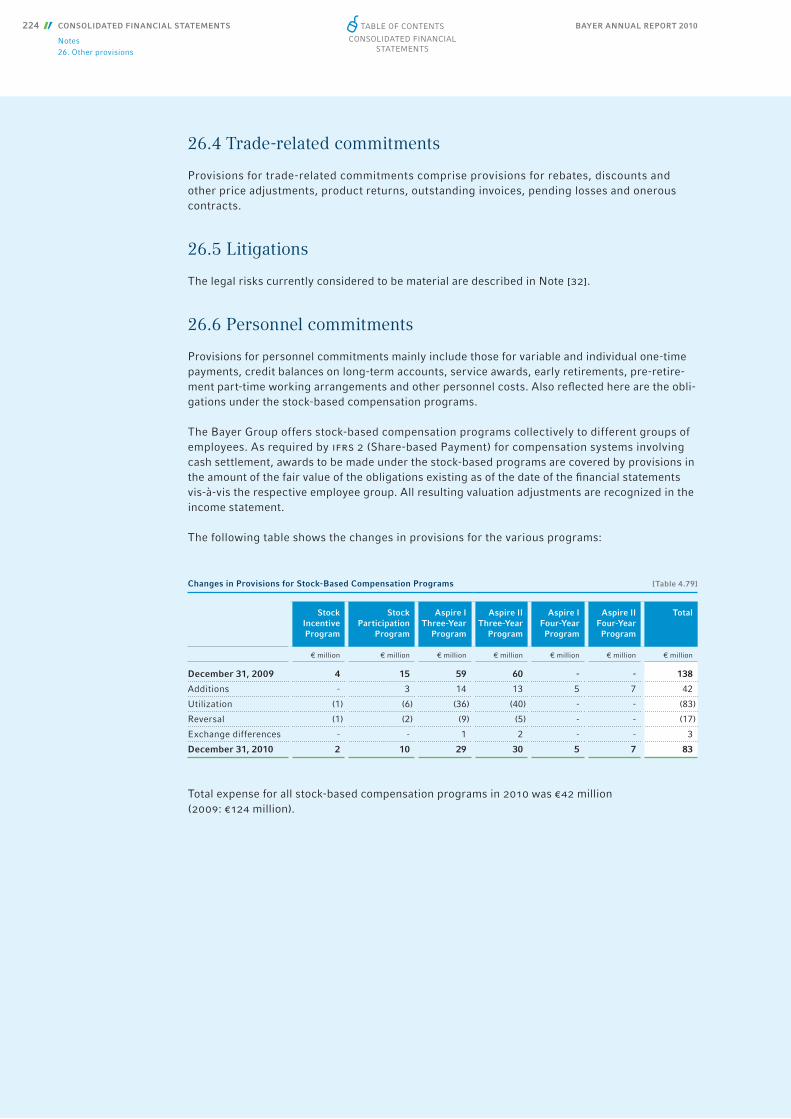
BAYER ANNUAL REPORT 2010224 CONSOLIDATED FINANCIAL STATEMENTS
Notes26. Other provisions
26.4 Trade-related commitments
Provisions for trade-related commitments comprise provisions for rebates, discounts and other price adjustments, product returns, outstanding invoices, pending losses and onerous contracts.
26.5 Litigations
The legal risks currently considered to be material are described in Note [32].
26.6 Personnel commitments
Provisions for personnel commitments mainly include those for variable and individual one-time payments, credit balances on long-term accounts, service awards, early retirements, pre-retire-ment part-time working arrangements and other personnel costs. Also refl ected here are the obli-gations under the stock-based compensation programs.
The Bayer Group offers stock-based compensation programs collectively to different groups of employees. As required by ifrs 2 (Share-based Payment) for compensation systems involving cash settlement, awards to be made under the stock-based programs are covered by provisions in the amount of the fair value of the obligations existing as of the date of the fi nancial statements vis-à-vis the respective employee group. All resulting valuation adjustments are recognized in the income statement.
The following table shows the changes in provisions for the various programs:
Total expense for all stock-based compensation programs in 2010 was €42 million (2009: €124 million).
Changes in Provisions for Stock-Based Compensation Programs [Table 4.79]
Stock Incentive Program
Stock Partici pa tion
Program
Aspire IThree-Year
Program
Aspire IIThree-Year
Program
Aspire IFour-Year Program
Aspire IIFour-YearProgram
Total
€ million € million € million € million € million € million € million
December 31, 2009 4 15 59 60 - - 138
Additions - 3 14 13 5 7 42
Utilization (1) (6) (36) (40) - - (83)
Reversal (1) (2) (9) (5) - - (17)
Exchange differences - - 1 2 - - 3
December 31, 2010 2 10 29 30 5 7 83
Table of ConTenTs
ConsolidaTed finanCial sTaTemenTs

BAYER ANNUAL REPORT 2010 CONSOLIDATED FINANCIAL STATEMENTS 225
Notes26. Other provisions
The fair value of obligations under the standard stock-based compensation programs has been calculated using the Monte Carlo simulation method based on the following key parameters:
LONG-TERM INCENTIVE PROGRAM FOR MEMBERS OF THE BOARD OF MANAGEMENT AND OTHER SENIOR EXECUTIVES (ASPIRE I)Since 2005, members of the Board of Management and other senior executives have been entitled to participate in Aspire i on the condition that they purchase a certain number of Bayer shares – determined for each individual according to specifi c guidelines – and retain them for the full term of the program. A percentage of the executive’s annual base salary – based on his / her position – is defi ned as a target for variable payments (Aspire target opportunity). Depending on the performance of Bayer stock, both in absolute terms and relative to the Dow Jones euro stoxx 50 benchmark index during a three-year performance period (or, starting with the regular 2010 tranche, a four-year performance period), participants are granted an award of up to 300% of their individual Aspire target opportunity for four-year tranches, or 200% for three-year tranches, at the end of the program. In 2010 a fi nal tranche with a three-year performance period was issued in addition.
LONG-TERM INCENTIVE PROGRAM FOR MIDDLE MANAGEMENT (ASPIRE II)Also since 2005, other senior managers and middle managers have been offered Aspire ii, a vari-ant of Aspire i that does not require a personal investment in Bayer shares. In this case, the amount of the award is based entirely on the absolute performance of Bayer stock. The maximum award is 250% of each manager’s Aspire target opportunity for four-year tranches, or 150% for three-year tranches.
BAYSHARE 2010 All management levels and non-managerial employees are offered an annual stock participation program known as “BayShare,” under which Bayer subsidizes their personal investments in the company’s stock. The discount under this program is set separately each year. In 2010 it was 20% (2009: 20%) of the subscription amount. Employees stated a fi xed amount that they wished to in-vest in shares. The maximum subscription amount was set at €2,500 (2009: €2,500) or €5,000 (2009: €5,000) depending on the employee’s position. The shares thus acquired are held in a spe-cial share deposit account and must be retained until December 31 of the year following the year of purchase.
In 2010 employees purchased a total of about 405,000 shares (2009: 395,000 shares) under the BayShare program.
Parameters for Monte Carlo Simulation {Table 4.80]
2009 2010
Dividend yield 2.49% 2.69%
Risk-free interest rate 1.57% 1.12%
Volatility of Bayer stock 34.93% 34.43%
Volatility of the EURO STOXX 50 29.46% 31.09%
Correlation between Bayer stock price and the EURO STOXX 50 0.68 0.69
Table of ConTenTs
ConsolidaTed finanCial sTaTemenTs
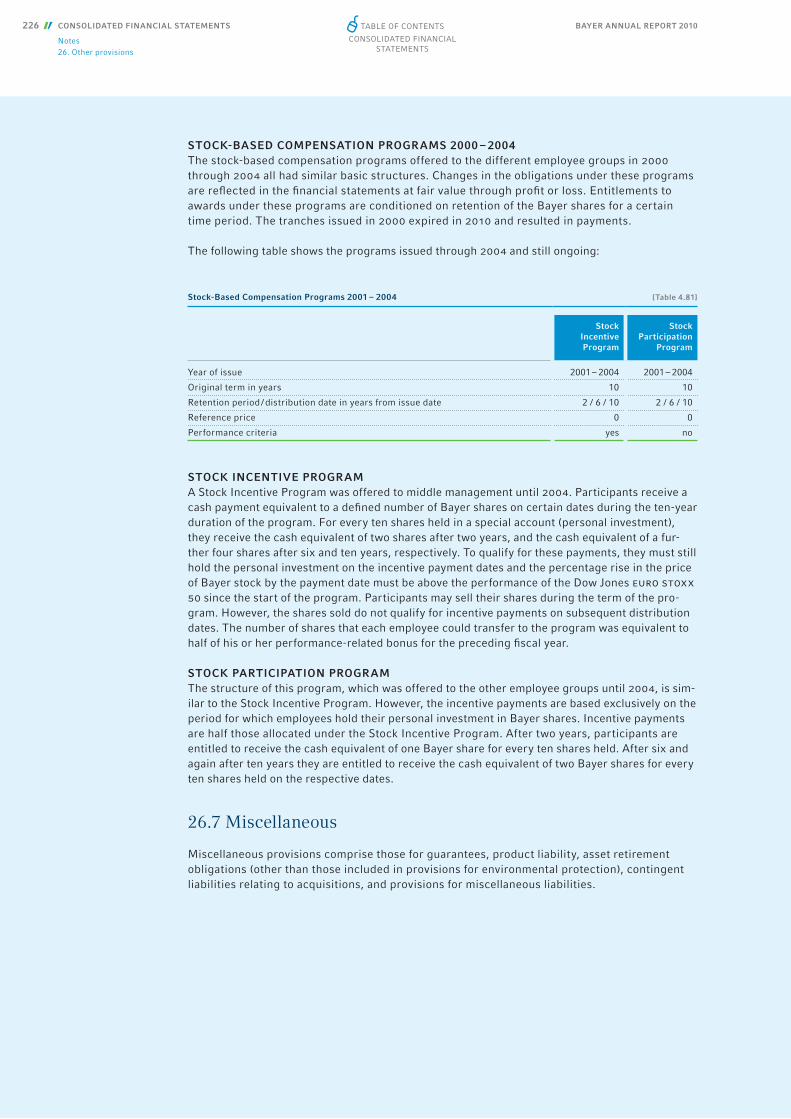
BAYER ANNUAL REPORT 2010226 CONSOLIDATED FINANCIAL STATEMENTS
Notes26. Other provisions
STOCK-BASED COMPENSATION PROGRAMS 2000 – 2004The stock-based compensation programs offered to the different employee groups in 2000 through 2004 all had similar basic structures. Changes in the obligations under these programs are refl ected in the fi nancial statements at fair value through profi t or loss. Entitlements to awards under these programs are conditioned on retention of the Bayer shares for a certain time period. The tranches issued in 2000 expired in 2010 and resulted in payments.
The following table shows the programs issued through 2004 and still ongoing:
STOCK INCENTIVE PROGRAM A Stock Incentive Program was offered to middle management until 2004. Participants receive a cash payment equivalent to a defi ned number of Bayer shares on certain dates during the ten-year duration of the program. For every ten shares held in a special account (personal investment), they receive the cash equivalent of two shares after two years, and the cash equivalent of a fur-ther four shares after six and ten years, respectively. To qualify for these payments, they must still hold the personal investment on the incentive payment dates and the percentage rise in the price of Bayer stock by the payment date must be above the performance of the Dow Jones euro stoxx 50 since the start of the program. Participants may sell their shares during the term of the pro-gram. However, the shares sold do not qualify for incentive payments on subsequent distribution dates. The number of shares that each employee could transfer to the program was equivalent to half of his or her performance-related bonus for the preceding fi scal year.
STOCK PARTICIPATION PROGRAM The structure of this program, which was offered to the other employee groups until 2004, is sim-ilar to the Stock Incentive Program. However, the incentive payments are based exclusively on the period for which employees hold their personal investment in Bayer shares. Incentive payments are half those allocated under the Stock Incentive Program. After two years, participants are entitled to receive the cash equivalent of one Bayer share for every ten shares held. After six and again after ten years they are entitled to receive the cash equivalent of two Bayer shares for every ten shares held on the respective dates.
26.7 Miscellaneous
Miscellaneous provisions comprise those for guarantees, product liability, asset retirement obligations (other than those included in provisions for environmental protection), contingent liabilities relating to acquisitions, and provisions for miscellaneous liabilities.
Stock-Based Compensation Programs 2001 – 2004 [Table 4.81]
Stock Incentive Program
Stock Participation
Program
Year of issue 2001 – 2004 2001 – 2004
Original term in years 10 10
Retention period / distribution date in years from issue date 2 / 6 / 10 2 / 6 / 10
Reference price 0 0
Performance criteria yes no
Table of ConTenTs
ConsolidaTed finanCial sTaTemenTs

BAYER ANNUAL REPORT 2010 CONSOLIDATED FINANCIAL STATEMENTS 227
Notes27. Financial liabilities
27. Financial liabilitiesFinancial liabilities were as follows:
The maturities of fi nancial liabilities were as follows:
The Bayer Group’s fi nancial liabilities are mostly unsecured and – with the exception of the subordinated €1,300 million hybrid bond – are of equal priority.
Financial Liabilities [Table 4.82]
Dec. 31, 2009 Dec. 31, 2010
TotalOf which
current TotalOf which
current
€ million € million € million € million
Bonds and notes / promissory notes 8,301 375 8,209 650
Liabilities to banks 3,251 807 2,271 760
Liabilities under fi nance leases 550 44 562 50
Liabilities from forward commodity contracts 91 46 66 55
Liabilities from other derivatives 578 113 529 240
Other fi nancial liabilities 178 104 196 134
Total 12,949 1,489 11,833 1,889
Maturities of Financial Liabilities [Table 4.83]
Maturity
Dec. 31, 2009 Maturity
Dec. 31, 2010
€ million € million
2010 1,489 2011 1,889
2011 1,867 2012 2,893
2012 2,793 2013 1,513
2013 1,430 2014 1,770
2014 1,785 2015 815
2015 or later 3,585 2016 or later 2,953
Total 12,949 Total 11,833
Table of ConTenTs
ConsolidaTed finanCial sTaTemenTs

BAYER ANNUAL REPORT 2010228 CONSOLIDATED FINANCIAL STATEMENTS
Notes27. Financial liabilities
In addition to promissory notes in the amount of €620 million (2009: €620 million), the Bayer Group has issued the following bonds and notes:
In June 2010, Bayer Holding Ltd. issued a corporate bond under the multi-currency Euro Medium Term Notes (emtn) program with a nominal volume of jpy 10 billion and a coupon of 1.459%. The bond has a maturity of seven years.
In March 2009, Bayer Capital Corporation b.v. issued a corporate bond under the emtn program with a nominal volume of €1,300 million and a maturity of fi ve and a half years. The bond bears a coupon of 4.625%.
In December 2008 Bayer AG issued a bond under the emtn program with a nominal volume of €200 million and a 4% coupon. It was redeemed at maturity on January 27, 2011.
In June 2008 Bayer Holding Ltd. issued a fl oating-rate bond with a nominal volume of jpy 10 bil-lion under the emtn program. The bond has a maturity of fi ve years and a variable coupon com-prising the three-month jpy libor plus 56 basis points. In December 2008, Bayer Holding Ltd. also issued a bond with a nominal volume of jpy 15 billion under this program. This bond has a coupon of 3.575% and matures on December 19, 2018.
In June 2007 Bayer Holding Ltd. launched bond issues under the emtn program. These included a fi ve-year bond with a nominal volume of jpy 15 billion and a coupon of 1.955% and a fl oating-rate note with a nominal volume of jpy 30 billion. The latter has a maturity of fi ve years and a coupon comprising the three-month jpy libor plus 26 basis points. A further bond with a three-year term, a nominal volume of jpy 10 billion and a coupon of 1.585% was redeemed at maturity in June 2010.
Bonds and Notes [Table 4.84]
Effective interest rate Stated rate Nominal volume
Dec. 31, 2009
Dec. 31, 2010
€ million € million
Bayer AG
6.075% 6.000% EMTN bond 2002 / 2012 EUR 2,000 million 2,044 2,030
5.155% 5.000% Hybrid bond 2005 / 2105 (2015) EUR 1,300 million 1,267 1,303
4.621% 4.500% EMTN bond 2006 / 2013 EUR 1,000 million 996 1,003
5.774% 5.625% EMTN bond 2006 / 2018 GBP 250 million 277 287
5.541% 5.625% EMTN bond 2006 / 2018 (increase) GBP 100 million 113 117
Floating Floating EMTN bond 2007 / 2010 EUR 300 million 300 -
4.464% 4.375% EMTN bond 2007 / 2011 EUR 200 million 200 200
4.038% 4.000% EMTN bond 2008 / 2011 EUR 200 million 200 200
Bayer Capital Corporation B.V.
4.750% 4.625% EMTN bond 2009 / 2014 EUR 1,300 million 1,291 1,293
Bayer Corporation
7.180% 7.125% Notes 1995 / 2015 US$ 200 million 153 162
6.670% 6.650% Notes 1998 / 2028 US$ 350 million 241 260
Bayer Holding Ltd.
1.654% 1.585% EMTN bond 2007 / 2010 JPY 10 billion 75 -
2.006% 1.955% EMTN bond 2007 / 2012 JPY 15 billion 112 138
Floating Floating EMTN bond 2007 / 2012 JPY 30 billion 225 275
Floating Floating EMTN bond 2008 / 2013 JPY 10 billion 75 92
3.654% 3.575% EMTN bond 2008 / 2018 JPY 15 billion 112 137
1.459% 1.459% EMTN bond 2010 / 2017 JPY 10 billion - 92
Total 7,681 7,589
Table of ConTenTs
ConsolidaTed finanCial sTaTemenTs
BAYER ANNUAL REPORT 2010 CONSOLIDATED FINANCIAL STATEMENTS 229
Notes27. Financial liabilities
In April 2007, Bayer AG issued a four-year bond under the emtn program with a nominal volume of €200 million and a coupon of 4.375%. At the same time a fl oating-rate bond was issued having a maturity of three years and a nominal volume of €300 million. The coupon was the three-month euribor rate plus 10 basis points. The latter bond was redeemed at maturity in April 2010.
In May 2006 Bayer AG launched a bond with a nominal volume of €1,000 million, a maturity of seven years and a coupon of 4.5% along with a sterling (gbp) bond with a nominal volume of gbp 250 million under its multi-currency emtn program as part of the fi nancing of the Schering acquisition. A second tranche of the latter bond in the amount of gbp 100 million was issued in the same year. The sterling bond has a coupon of 5.625% and matures in 2018. The entire issue has been swapped into euros.
In July 2005, Bayer AG issued a 100-year subordinated hybrid bond with a volume of €1,300 mil-lion. This issue matures in 2105 and has a fi xed coupon of 5% in the fi rst ten years. Thereafter, interest is calculated quarterly at a fl oating rate (three-month euribor plus 280 basis points). After the fi rst ten years, Bayer AG has a quarterly option to redeem the bonds at face value. The coupon is payable in arrears. This bond is treated as 75% equity by Moody’s and as 50% equity by Standard & Poor’s and therefore improves the Bayer Group’s rating-specifi c debt indicators.
In April 2002, Bayer AG issued a ten-year bond with a nominal volume of €2,000 million and a fi xed coupon of 6% under the emtn program. Interest is paid annually in arrears.
In February 1998, Bayer Corporation issued notes with a nominal volume of us$350 million to eligible institutional investors. The notes have a maturity of 30 years and a coupon of 6.65%. Interest is paid semi-annually. In September 1995, Bayer Corporation issued notes with a nomi-nal volume of us$200 million and a 7.125% coupon. These 20-year notes mature in October 2015. Interest is paid semi-annually in April and October.
Bayer AG guarantees all the bonds issued by its subsidiaries.
The long-term liabilities to banks principally comprised bank loans to foreign subsidiaries. The €0.9 billion of the syndicated loan raised in 2006 in connection with the acquisition of Schering AG, Berlin, Germany, that remained outstanding as of December 31, 2009, was repaid in full in September 2010.
As of December 31, 2010, the Group had credit facilities at its disposal totaling €6.6 billion (2009: €7.2 billion), of which €2.3 billion (2009: €3.3 billion) was used and €4.3 billion (2009: €3.9 billion) was unused and thus available for borrowing on an unsecured basis.
Lease payments totaling €704 million (2009: €704 million), including €142 million (2009: €154 million) in interest, are to be made under fi nance leases to the respective lessors in future years.
Table of ConTenTs
ConsolidaTed finanCial sTaTemenTs
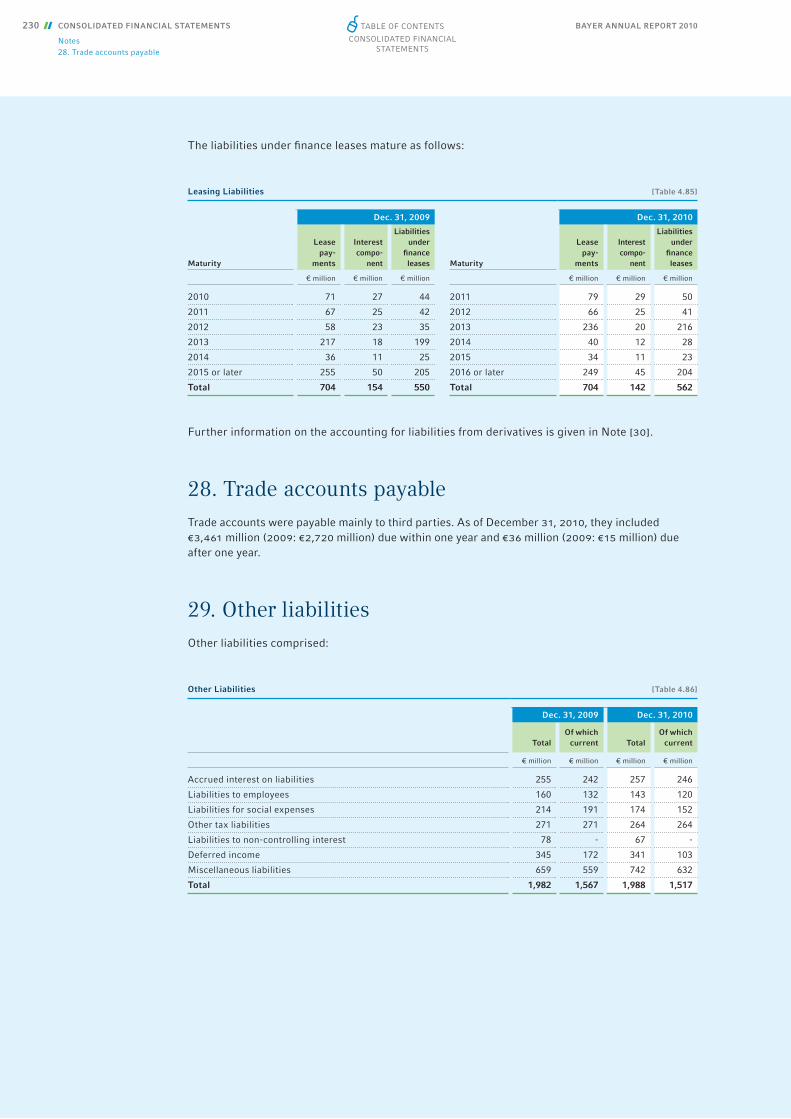
BAYER ANNUAL REPORT 2010230 CONSOLIDATED FINANCIAL STATEMENTS
Notes28. Trade accounts payable
The liabilities under fi nance leases mature as follows:
Further information on the accounting for liabilities from derivatives is given in Note [30].
28. Trade accounts payableTrade accounts were payable mainly to third parties. As of December 31, 2010, they included €3,461 million (2009: €2,720 million) due within one year and €36 million (2009: €15 million) due after one year.
29. Other liabilitiesOther liabilities comprised:
Leasing Liabilities [Table 4.85]
Dec. 31, 2009 Dec. 31, 2010
Maturity
Lease pay-
ments
Interest compo-
nent
Liabilities under
fi nance leases Maturity
Lease pay-
ments
Interest compo-
nent
Liabilities under
fi nance leases
€ million € million € million € million € million € million
2010 71 27 44 2011 79 29 50
2011 67 25 42 2012 66 25 41
2012 58 23 35 2013 236 20 216
2013 217 18 199 2014 40 12 28
2014 36 11 25 2015 34 11 23
2015 or later 255 50 205 2016 or later 249 45 204
Total 704 154 550 Total 704 142 562
Other Liabilities [Table 4.86]
Dec. 31, 2009 Dec. 31, 2010
TotalOf which
current TotalOf which
current
€ million € million € million € million
Accrued interest on liabilities 255 242 257 246
Liabilities to employees 160 132 143 120
Liabilities for social expenses 214 191 174 152
Other tax liabilities 271 271 264 264
Liabilities to non-controlling interest 78 - 67 -
Deferred income 345 172 341 103
Miscellaneous liabilities 659 559 742 632
Total 1,982 1,567 1,988 1,517
Table of ConTenTs
ConsolidaTed finanCial sTaTemenTs

BAYER ANNUAL REPORT 2010 CONSOLIDATED FINANCIAL STATEMENTS 231
Notes30. Financial instruments
Liabilities for social expenses included, in particular, social insurance contributions that had not been paid by the closing date.
The €67 million (2009: €78 million) in liabilities to non-controlling interest included the third-party share of the equity of Currenta GmbH & Co. ohg and its subsidiaries Chemion Logistik GmbH and tectrion GmbH.
The deferred income included €77 million (2009: €63 million) in grants and subsidies received from governments, of which €9 million (2009: €12 million) was reversed and recognized in income.
30. Financial instrumentsThe system used by the Bayer Group to manage credit risk, liquidity risk and the various types of market risks (interest-rate risk, currency risk and other price risks), together with its objec-tives, methods and procedures, is outlined in the Risk Report, which forms part of the Manage-ment Report.
30.1 Information on fi nancial instruments by category
The following table shows the carrying amounts and fair values of fi nancial assets and liabilities by category of fi nancial instrument and a reconciliation to the corresponding line item in the statements of fi nancial position. Since the line items “Other receivables,” “Trade accounts pay-able” and “Other liabilities” contain both fi nancial instruments and non-fi nancial assets or liabilities (such as other tax receivables or advance payments for services to be received in the future), the reconciliation is shown in the column headed “Non-fi nancial assets / liabilities.”
Table of ConTenTs
ConsolidaTed finanCial sTaTemenTs

BAYER ANNUAL REPORT 2010232 CONSOLIDATED FINANCIAL STATEMENTS
Notes30. Financial instruments
Carrying Amounts and Fair Values of Financial Instruments
Dec. 31, 2009
Carried atamortized cost
Carried at fair value
Non-fi nancial
assets / liabilities
Carrying amount Dec. 31,
2009
Fair value (for infor-
mation)
Based on quoted prices
Based on market- derived
data
Based on individual valuation
parameters
Carrying amount in the state-
ment of fi nancial position
Carrying amount
Carrying amount
Carrying amount
Carrying amount
€ million € million € million € million € million € million € million
Trade accounts receivable 6,106 6,106
Loans and receivables 6,106 6,106 6,106
Other fi nancial assets 793 127 605 42 1,567
Loans and receivables 628 700 628
Available-for-sale fi nancial assets 58 127 27 212
Held-to-maturity fi nancial assets 107 111 107
Derivatives that qualify for hedge accounting 218 218
Derivatives that do not qualify for hedge accounting 387 15 402
Other receivables 970 936 1,906
Loans and receivables 970 971 970
Non-fi nancial assets 936 936
Cash and cash equivalents 2,725 2,725
Loans and receivables 2,725 2,725 2,725
Total fi nancial assets 10,594 127 605 42 11,368
of which loans and receivables 10,429 10,429
Financial liabilities 12,280 669 12,949
Carried at amortized cost 12,280 13,072 12,280
Derivatives that qualify for hedge accounting 235 235
Derivatives that do not qualify for hedge accounting 434 434
Trade accounts payable 2,571 164 2,735
Carried at amortized cost 2,571 2,571 2,571
Non-fi nancial liabilities 164 164
Other liabilities 1,033 45 4 900 1,982
Carried at amortized cost 1,033 1,033 1,033
Derivatives that qualify for hedge accounting 37 37
Derivatives that do not qualify for hedge accounting 8 4 12
Non-fi nancial liabilities 900 900
Total fi nancial liabilities 15,884 714 4 16,602
of which carried at amortized cost 15,884 15,884
of which derivatives that qualify for hedge accounting 272 272
of which derivatives that do not qualify for hedge accounting 442 4 446
Table of ConTenTs
ConsolidaTed finanCial sTaTemenTs
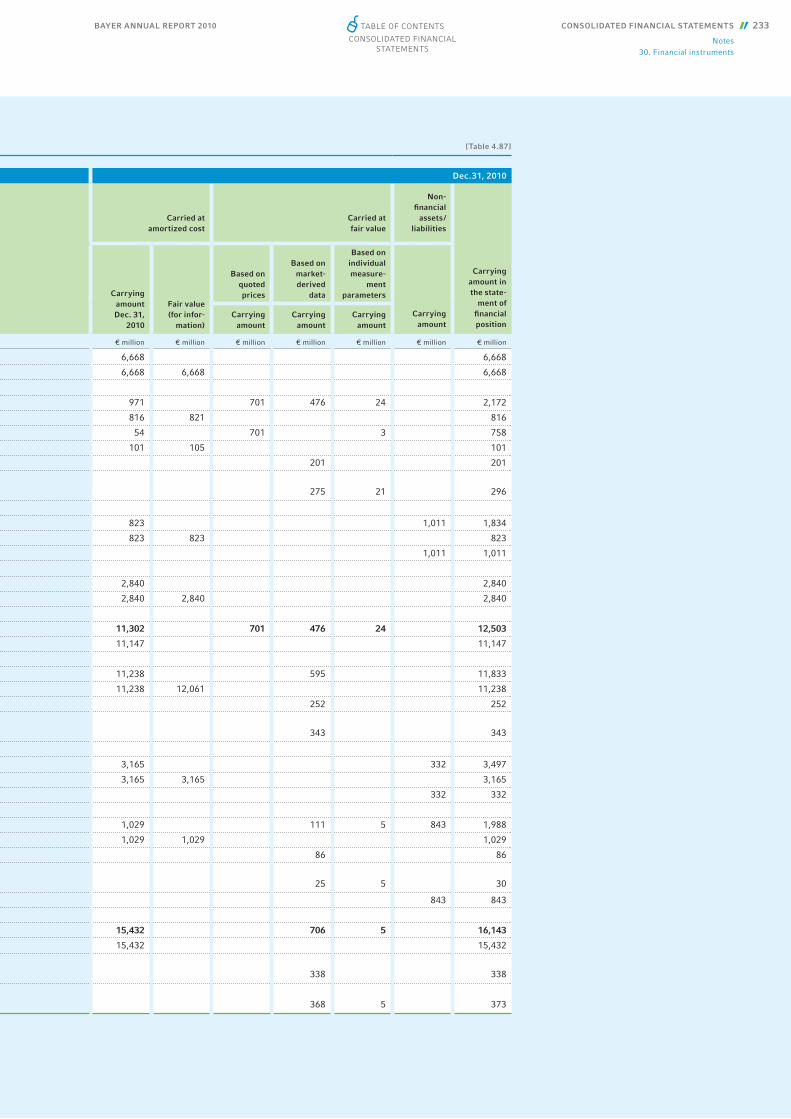
BAYER ANNUAL REPORT 2010 CONSOLIDATED FINANCIAL STATEMENTS 233
Notes30. Financial instruments
[Table 4.87]
Dec.31, 2010
Carried atamortized cost
Carried at fair value
Non-fi nancial
assets / liabilities
Carrying amount Dec. 31,
2010
Fair value (for infor-
mation)
Based on quoted prices
Based on market-derived
data
Based on individual measure-
ment parameters
Carrying amount in the state-
ment of fi nancial position
Carrying amount
Carrying amount
Carrying amount
Carrying amount
€ million € million € million € million € million € million € million
6,668 6,668
6,668 6,668 6,668
971 701 476 24 2,172
816 821 816
54 701 3 758
101 105 101
201 201
275 21 296
823 1,011 1,834
823 823 823
1,011 1,011
2,840 2,840
2,840 2,840 2,840
11,302 701 476 24 12,503
11,147 11,147
11,238 595 11,833
11,238 12,061 11,238
252 252
343 343
3,165 332 3,497
3,165 3,165 3,165
332 332
1,029 111 5 843 1,988
1,029 1,029 1,029
86 86
25 5 30
843 843
15,432 706 5 16,143
15,432 15,432
338
338
368 5 373
Table of ConTenTs
ConsolidaTed finanCial sTaTemenTs
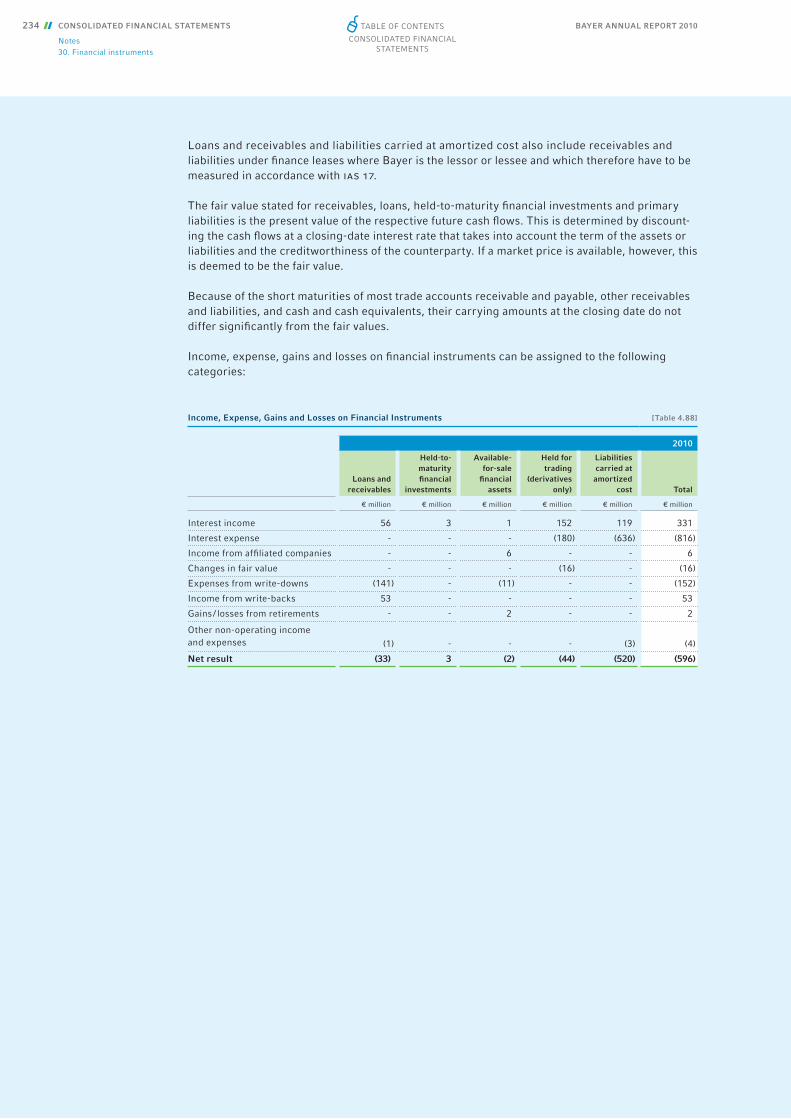
BAYER ANNUAL REPORT 2010234 CONSOLIDATED FINANCIAL STATEMENTS
Notes30. Financial instruments
Loans and receivables and liabilities carried at amortized cost also include receivables and liabilities under fi nance leases where Bayer is the lessor or lessee and which therefore have to be measured in accordance with ias 17.
The fair value stated for receivables, loans, held-to-maturity fi nancial investments and primary liabilities is the present value of the respective future cash fl ows. This is determined by discount-ing the cash fl ows at a closing-date interest rate that takes into account the term of the assets or liabilities and the creditworthiness of the counterparty. If a market price is available, however, this is deemed to be the fair value.
Because of the short maturities of most trade accounts receivable and payable, other receivables and liabilities, and cash and cash equivalents, their carrying amounts at the closing date do not differ signifi cantly from the fair values.
Income, expense, gains and losses on fi nancial instruments can be assigned to the following categories:
Income, Expense, Gains and Losses on Financial Instruments [Table 4.88]
2010
Loans and
receivables
Held-to-maturity fi nancial
investments
Available-for-sale fi nancial
assets
Held for trading
(derivatives only)
Liabilities carried at amortized
cost Total
€ million € million € million € million € million € million
Interest income 56 3 1 152 119 331
Interest expense - - - (180) (636) (816)
Income from affi liated companies - - 6 - - 6
Changes in fair value - - - (16) - (16)
Expenses from write-downs (141) - (11) - - (152)
Income from write-backs 53 - - - - 53
Gains / losses from retirements - - 2 - - 2
Other non-operating income and expenses (1) - - - (3) (4)
Net result (33) 3 (2) (44) (520) (596)
Table of ConTenTs
ConsolidaTed finanCial sTaTemenTs
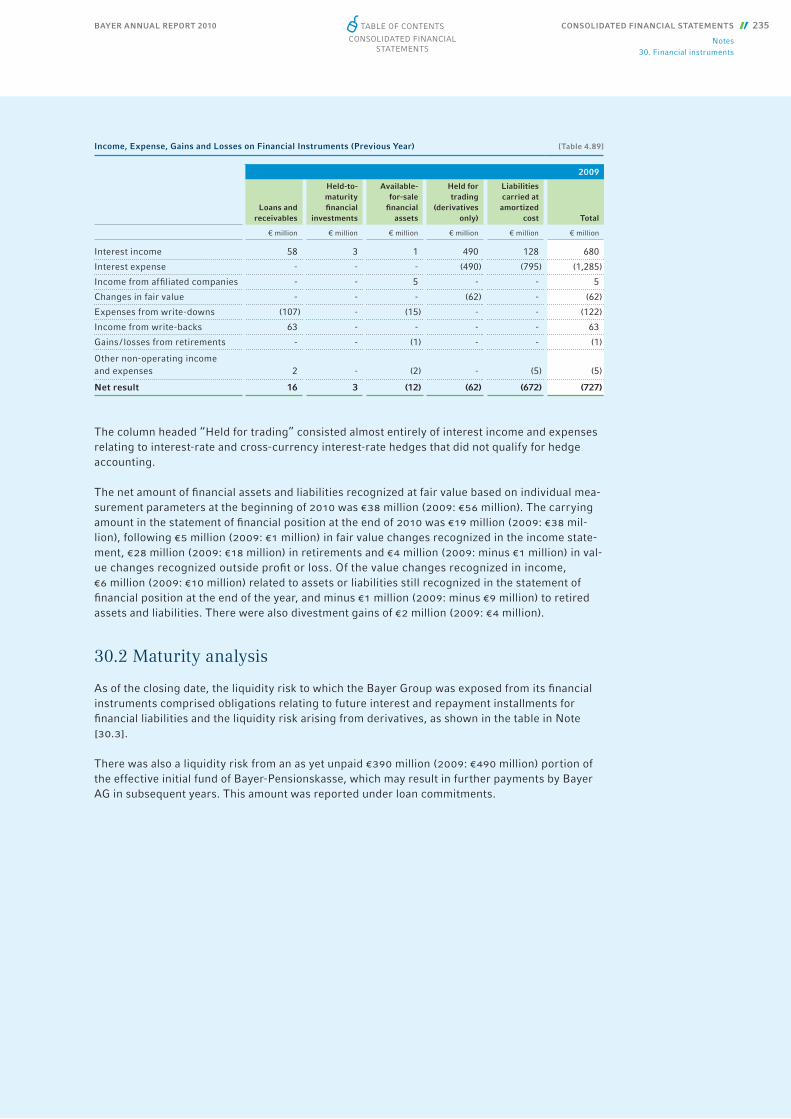
BAYER ANNUAL REPORT 2010 CONSOLIDATED FINANCIAL STATEMENTS 235
Notes30. Financial instruments
The column headed “Held for trading” consisted almost entirely of interest income and expenses relating to interest-rate and cross-currency interest-rate hedges that did not qualify for hedge accounting.
The net amount of fi nancial assets and liabilities recognized at fair value based on individual mea-surement parameters at the beginning of 2010 was €38 million (2009: €56 million). The carrying amount in the statement of fi nancial position at the end of 2010 was €19 million (2009: €38 mil-lion), following €5 million (2009: €1 million) in fair value changes recognized in the income state-ment, €28 million (2009: €18 million) in retirements and €4 million (2009: minus €1 million) in val-ue changes recognized outside profi t or loss. Of the value changes recognized in income, €6 million (2009: €10 million) related to assets or liabilities still recognized in the statement of fi nancial position at the end of the year, and minus €1 million (2009: minus €9 million) to retired assets and liabilities. There were also divestment gains of €2 million (2009: €4 million).
30.2 Maturity analysis
As of the closing date, the liquidity risk to which the Bayer Group was exposed from its fi nancial instruments comprised obligations relating to future interest and repayment installments for fi nancial liabilities and the liquidity risk arising from derivatives, as shown in the table in Note [30.3].
There was also a liquidity risk from an as yet unpaid €390 million (2009: €490 million) portion of the effective initial fund of Bayer-Pensionskasse, which may result in further payments by Bayer AG in subsequent years. This amount was reported under loan commitments.
Income, Expense, Gains and Losses on Financial Instruments (Previous Year) [Table 4.89]
2009
Loans and
receivables
Held-to-maturity fi nancial
investments
Available-for-sale fi nancial
assets
Held for trading
(derivatives only)
Liabilities carried at amortized
cost Total
€ million € million € million € million € million € million
Interest income 58 3 1 490 128 680
Interest expense - - - (490) (795) (1,285)
Income from affi liated companies - - 5 - - 5
Changes in fair value - - - (62) - (62)
Expenses from write-downs (107) - (15) - - (122)
Income from write-backs 63 - - - - 63
Gains / losses from retirements - - (1) - - (1)
Other non-operating income and expenses 2 - (2) - (5) (5)
Net result 16 3 (12) (62) (672) (727)
Table of ConTenTs
ConsolidaTed finanCial sTaTemenTs
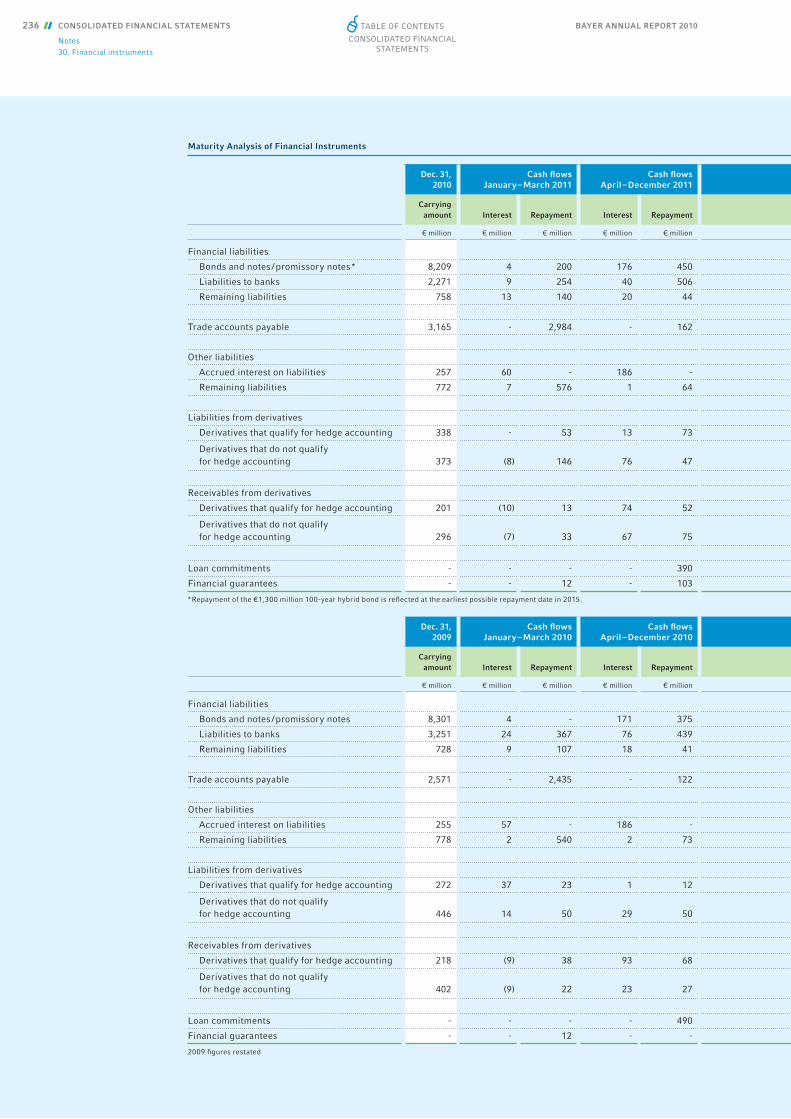
BAYER ANNUAL REPORT 2010236 CONSOLIDATED FINANCIAL STATEMENTS
Notes30. Financial instruments
Maturity Analysis of Financial Instruments
Dec. 31, 2010
Cash fl ows January – March 2011
Cash fl ows April – December 2011
Carrying amount Interest Repayment Interest Repayment
€ million € million € million € million € million
Financial liabilities
Bonds and notes / promissory notes * 8,209 4 200 176 450
Liabilities to banks 2,271 9 254 40 506
Remaining liabilities 758 13 140 20 44
Trade accounts payable 3,165 - 2,984 - 162
Other liabilities
Accrued interest on liabilities 257 60 - 186 -
Remaining liabilities 772 7 576 1 64
Liabilities from derivatives
Derivatives that qualify for hedge accounting 338 - 53 13 73
Derivatives that do not qualify for hedge accounting 373 (8) 146 76 47
Receivables from derivatives
Derivatives that qualify for hedge accounting 201 (10) 13 74 52
Derivatives that do not qualify for hedge accounting 296 (7) 33 67 75
Loan commitments - - - - 390
Financial guarantees - - 12 - 103
* Repayment of the €1,300 million 100-year hybrid bond is refl ected at the earliest possible repayment date in 2015.
Dec. 31, 2009
Cash fl ows January – March 2010
Cash fl ows April – December 2010
Carrying amount Interest Repayment Interest Repayment
€ million € million € million € million € million
Financial liabilities
Bonds and notes / promissory notes 8,301 4 - 171 375
Liabilities to banks 3,251 24 367 76 439
Remaining liabilities 728 9 107 18 41
Trade accounts payable 2,571 - 2,435 - 122
Other liabilities
Accrued interest on liabilities 255 57 - 186 -
Remaining liabilities 778 2 540 2 73
Liabilities from derivatives
Derivatives that qualify for hedge accounting 272 37 23 1 12
Derivatives that do not qualify for hedge accounting 446 14 50 29 50
Receivables from derivatives
Derivatives that qualify for hedge accounting 218 (9) 38 93 68
Derivatives that do not qualify for hedge accounting 402 (9) 22 23 27
Loan commitments - - - - 490
Financial guarantees - - 12 - -
2009 fi gures restated
Table of ConTenTs
ConsolidaTed finanCial sTaTemenTs
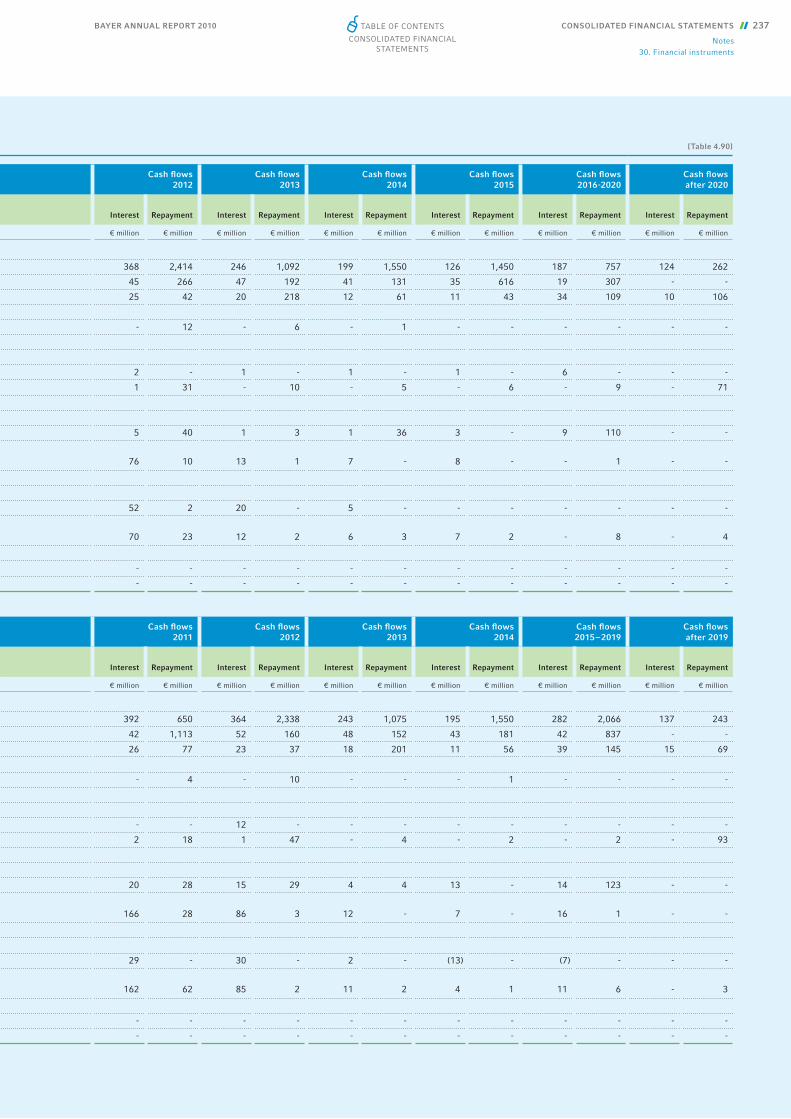
BAYER ANNUAL REPORT 2010 CONSOLIDATED FINANCIAL STATEMENTS 237
Notes30. Financial instruments
[Table 4.90]
Cash fl ows 2012
Cash fl ows 2013
Cash fl ows 2014
Cash fl ows 2015
Cash fl ows 2016-2020
Cash fl ows after 2020
Interest Repayment Interest Repayment Interest Repayment Interest Repayment Interest Repayment Interest Repayment
€ million € million € million € million € million € million € million € million € million € million € million € million
368 2,414 246 1,092 199 1,550 126 1,450 187 757 124 262
45 266 47 192 41 131 35 616 19 307 - -
25 42 20 218 12 61 11 43 34 109 10 106
- 12 - 6 - 1 - - - - - -
2 - 1 - 1 - 1 - 6 - - -
1 31 - 10 - 5 - 6 - 9 - 71
5 40 1 3 1 36 3 - 9 110 - -
76 10 13 1 7 - 8 - - 1 - -
52 2 20 - 5 - - - - - - -
70 23 12 2 6 3 7 2 - 8 - 4
- - - - - - - - - - - -
- - - - - - - - - - - -
Cash fl ows 2011
Cash fl ows 2012
Cash fl ows 2013
Cash fl ows 2014
Cash fl ows 2015 – 2019
Cash fl ows after 2019
Interest Repayment Interest Repayment Interest Repayment Interest Repayment Interest Repayment Interest Repayment
€ million € million € million € million € million € million € million € million € million € million € million € million
392 650 364 2,338 243 1,075 195 1,550 282 2,066 137 243
42 1,113 52 160 48 152 43 181 42 837 - -
26 77 23 37 18 201 11 56 39 145 15 69
- 4 - 10 - - - 1 - - - -
- - 12 - - - - - - - - -
2 18 1 47 - 4 - 2 - 2 - 93
20 28 15 29 4 4 13 - 14 123 - -
166 28 86 3 12 - 7 - 16 1 - -
29 - 30 - 2 - (13) - (7) - - -
162 62 85 2 11 2 4 1 11 6 - 3
- - - - - - - - - - - -
- - - - - - - - - - - -
Table of ConTenTs
ConsolidaTed finanCial sTaTemenTs
BAYER ANNUAL REPORT 2010238 CONSOLIDATED FINANCIAL STATEMENTS
Notes30. Financial instruments
30.3 Information on derivatives
Interest rate swaps are used to eliminate the risk of fl uctuations in the market value of certain fi xed-interest borrowings and to obtain a variable interest rate. The principal borrowings con-cerned are the €2 billion bond issued in 2002, the €1.3 billion bond issued in 2005 and the €1 billion bond issued in 2006. Hedge accounting is applied to the respective borrowings and hedging instruments (fair value hedge).
Gains of €25 million (2009: €45 million) were recorded on fair value hedging instruments in 2010. Losses of €25 million (2009: €44 million) were recorded on the underlying hedged items.
Fluctuations in future cash fl ows resulting from forecasted foreign currency transactions are avoided partly through derivative contracts, most of which are designated as cash fl ow hedges. Hedging contracts, some of which are designated as cash fl ow hedges, are also used to partly reduce exposure to fl uctuations in future cash fl ows resulting from price changes on procure-ment markets. The notional volumes in these two categories are €4,399 million and €173 million (2009: €3,523 million and €323 million), respectively.
Accumulated other comprehensive income decreased by €75 million after taxes in 2010 due to negative changes in the fair values of derivatives designated as cash fl ow hedges (2009: in-creased by €55 million due to positive changes). In 2010, an amount of €18 million (2009: €10 million), representing fair value changes of derivatives designated as cash fl ow hedges, which originally had been recognized in accumulated other comprehensive income, was ex-pensed to the income statement. Similarly, pro-rated deferred taxes of €6 million (2009: €4 mil-lion) previously refl ected in accumulated other comprehensive income were recognized as tax income. No material ineffective portions of hedges had to be recognized in the income state-ment in 2010 or 2009.
Table of ConTenTs
ConsolidaTed finanCial sTaTemenTs

BAYER ANNUAL REPORT 2010 CONSOLIDATED FINANCIAL STATEMENTS 239
Notes30. Financial instruments
The market values of contracts existing at year end in the major categories were as follows:
Fair Values of Derivatives [Table 4.91]
Dec. 31, 2009 Dec. 31, 2010
Fair value Fair value
Notional amount *
Positive fair value
Negative fair value
Notional amount *
Positive fair value
Negative fair value
€ million € million € million € million € million € million
Currency hedging of recorded transactions 7,652 58 (294) 8,759 56 (363)
Forward exchange contracts 5,868 43 (88) 6,251 47 (107)
of which fair value hedges - - - - - -
of which cash fl ow hedges 384 - (5) 371 7 -
Cross-currency interest rate swaps 1,784 15 (206) 2,508 9 (256)
of which fair value hedges - - - - - -
of which cash fl ow hedges 1,512 15 (175) 2,173 9 (240)
Currency hedging of forecasted transactions 3,523 136 (45) 4,399 68 (93)
Forward exchange contracts 3,245 129 (44) 3,631 59 (86)
of which fair value hedges - - - - - -
of which cash fl ow hedges 2,451 104 (37) 3,631 59 (86)
Currency options 278 7 (1) 768 9 (7)
of which fair value hedges - - - - - -
of which cash fl ow hedges 239 7 - - - -
Interest rate hedging of recorded transactions 12,612 368 (284) 8,169 275 (166)
Interest rate swaps 10,612 368 (284) 8,169 275 (166)
of which fair value hedges 2,467 92 - 3,467 126 -
of which cash fl ow hedges - - - 1 - -
Interest rate options 2,000 - - - - -
of which fair value hedges - - - - - -
of which cash fl ow hedges - - - - - -
Commodity price hedging 323 36 (91) 173 21 (66)
Forward commodity contracts 167 13 (68) 138 4 (52)
of which fair value hedges - - - - - -
of which cash fl ow hedges 85 - (55) 19 - (12)
Commodity option contracts 156 23 (23) 35 17 (14)
of which fair value hedges - - - - - -
of which cash fl ow hedges - - - - - -
Total 24,110 598 (714) 21,500 420 (688)
of which short-term derivatives 10,922 239 (204) 11,072 237 (380)
for currency hedging 8,259 179 (126) 10,906 105 (258)
for interest rate hedging ** 2,400 26 (32) - 113 (67)
for commodity hedging 263 34 (46) 166 19 (55)
* The notional amount is reported as gross volume, which also contained economically closed positions. ** The interest rate swaps as of December 31, 2010 had to be classifi ed as noncurrent. The fair value resulting from current interest payments was
classifi ed as short-term.
Table of ConTenTs
ConsolidaTed finanCial sTaTemenTs
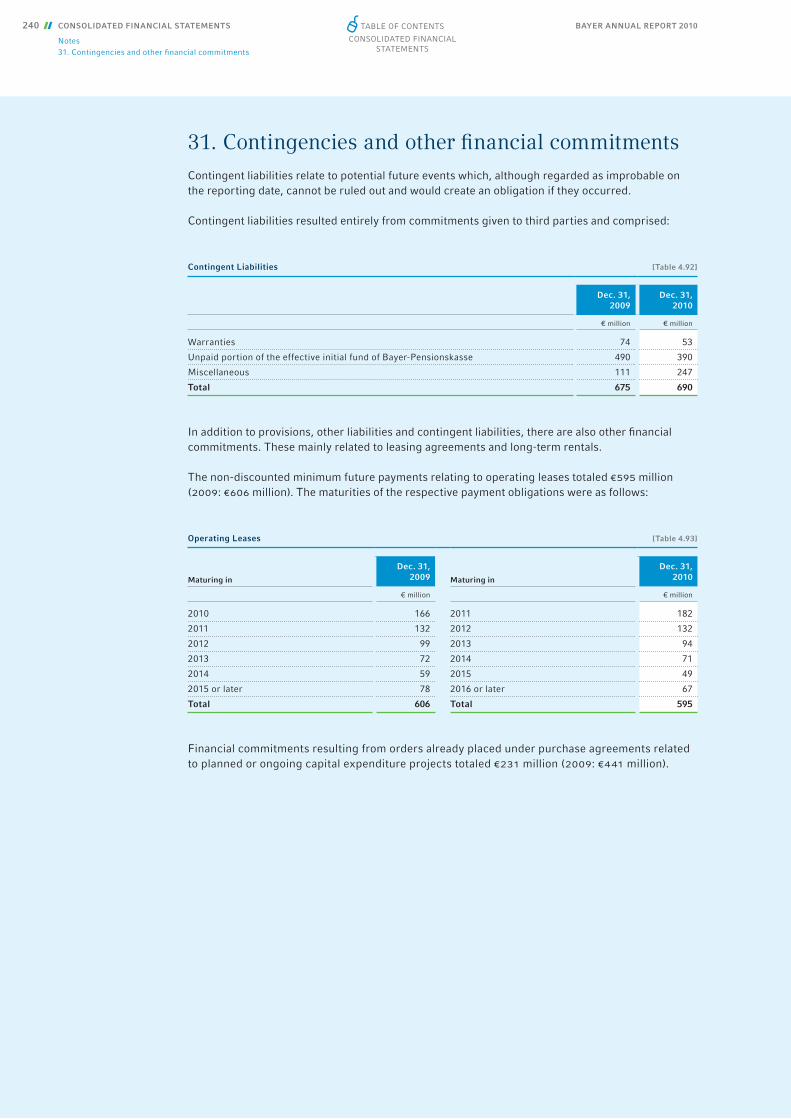
BAYER ANNUAL REPORT 2010240 CONSOLIDATED FINANCIAL STATEMENTS
Notes31. Contingencies and other fi nancial commitments
31. Contingencies and other fi nancial commitmentsContingent liabilities relate to potential future events which, although regarded as improbable on the reporting date, cannot be ruled out and would create an obligation if they occurred.
Contingent liabilities resulted entirely from commitments given to third parties and comprised:
In addition to provisions, other liabilities and contingent liabilities, there are also other fi nancial commitments. These mainly related to leasing agreements and long-term rentals.
The non-discounted minimum future payments relating to operating leases totaled €595 million (2009: €606 million). The maturities of the respective payment obligations were as follows:
Financial commitments resulting from orders already placed under purchase agreements related to planned or ongoing capital expenditure projects totaled €231 million (2009: €441 million).
Contingent Liabilities [Table 4.92]
Dec. 31, 2009
Dec. 31, 2010
€ million € million
Warranties 74 53
Unpaid portion of the effective initial fund of Bayer-Pensionskasse 490 390
Miscellaneous 111 247
Total 675 690
Operating Leases [Table 4.93]
Maturing in
Dec. 31, 2009 Maturing in
Dec. 31, 2010
€ million € million
2010 166 2011 182
2011 132 2012 132
2012 99 2013 94
2013 72 2014 71
2014 59 2015 49
2015 or later 78 2016 or later 67
Total 606 Total 595
Table of ConTenTs
ConsolidaTed finanCial sTaTemenTs

BAYER ANNUAL REPORT 2010 CONSOLIDATED FINANCIAL STATEMENTS 241
Notes32. Legal risks
In addition, the Group has entered into research agreements with a number of third parties under which Bayer has agreed to fund various research projects or has assumed other payment obligations based on the achievement of certain milestones or other specifi c conditions. The total amount of such funding and other commitments was €1,132 million (2009: €661 million). As of December 31, 2010, the remaining payments expected to be made to these parties, assuming the milestones are reached or the other agreed conditions are met in the respective years, were as follows:
32. Legal risksAs a global company with a diverse business portfolio, the Bayer Group is exposed to numerous legal risks, particularly in the areas of product liability, competition and antitrust law, patent disputes, tax assessments and environmental matters. The outcome of any current or future pro-ceedings cannot be predicted. It is therefore possible that legal or regulatory judgments or future settlements could give rise to expenses that are not covered, or not fully covered, by insurers’ compensation payments and could signifi cantly affect our revenues and earnings.
Legal proceedings currently considered to involve material risks are outlined below. The legal proceedings referred to do not represent an exhaustive list.
HealthCare
PRODUCT-RELATED LITIGATION Magnevist®: As of February 1, 2011, there were approximately 230 lawsuits pending and served upon Bayer in the United States involving the gadolinium-based contrast agent Magnevist®. Three other manufacturers of gadolinium-based contrast agents in the United States also have been named party to the same or similar lawsuits.
In the lawsuits, plaintiffs allege that patients developed nephrogenic systemic fi brosis (nsf) as a result of the use of Magnevist® during medical imaging procedures. nsf is a rare, severe condition that can be debilitating and in some cases fatal. Plaintiffs seek compensatory and punitive damages under various theories, including strict liability and negligence and / or breach of warranty, claiming, among other things, that the product is defective and unreasonably dangerous and that Bayer knew, or should have known, of the risks associated with Magnevist® and failed to disclose them or ade-quately warn its users.
All cases pending in federal courts have been consolidated in a multidistrict litigation (mdl) pro-ceeding for common pre-trial management. As of February 1, 2011, Bayer had reached agreements, without admission of liability, with approximately 220 plaintiffs in the United States to settle their claims. Bayer will continue to consider the option of settling individual lawsuits on a case-by-case
Other Commitments [Table 4.94]
Maturing in
Dec. 31, 2009 Maturing in
Dec. 31, 2010
€ million € million
2010 154 2011 119
2011 114 2012 235
2012 83 2013 154
2013 39 2014 200
2014 43 2015 120
2015 or later 228 2016 or later 304
Total 661 Total 1,132
Table of ConTenTs
ConsolidaTed finanCial sTaTemenTs

BAYER ANNUAL REPORT 2010242 CONSOLIDATED FINANCIAL STATEMENTS
Notes32. Legal risks
basis. However, Bayer believes it has meritorious defenses and will continue to defend itself vigor-ously against all claims that are not considered for settlement. Bayer has taken appropriate account-ing measures.
Trasylol® (aprotinin) is a drug approved for use in managing bleeding in patients undergoing coronary artery bypass graft surgery. As of February 1, 2011, there were approximately 1,100 lawsuits pending in the United States and served upon Bayer on behalf of persons alleging, in particular, personal injuries, including renal failure and death, and economic loss from the use of Trasylol®. Bayer also has been served with three class actions in Canada. Plaintiffs in both the United States and the Canadian cases seek compensatory and punitive damages, claiming, among other things, that Bayer knew, or should have known, of these risks and should be held liable for having failed to disclose them or adequately warn users of Trasylol®. All cases pending in u.s. federal courts have been consolidated in a multidistrict litigation (mdl) proceeding for common pre-trial management.
As of February 1, 2011, Bayer had reached agreements, without admission of liability, with approxi-mately 440 plaintiffs. Bayer will continue to consider the option of settling individual lawsuits on a case-by-case basis. However, Bayer believes it has meritorious defenses and will continue to defend itself vigorously against all claims that are not considered for settlement. Bayer has taken appropriate accounting measures.
Yasmin® / yaz®: As of February 1, 2011, there were about 6,850 lawsuits pending in the United States served upon Bayer on behalf of persons alleged to have suffered personal injuries, some of them fatal, from the use of Bayer’s oral contraceptive products Yasmin® and / or yaz® or from the use of Ocella® and / or Gianvi®, generic versions of Yasmin® and yaz®, respectively, marketed by Barr Laboratories, Inc. in the United States. (For details on the generic versions of Yasmin® and yaz®, please refer to the section on “Patent disputes” below.) Pursuant to agreements in 2008 and 2010, Bayer manages product liability litigation for Ocella® and Gianvi®, Bayer retains product lia-bility for Ocella® product supplied by Bayer with certain exceptions, and the parties have allocat-ed potential future product liability relating to Gianvi® product supplied by Bayer. Plaintiffs seek compensatory and punitive damages, claiming, in particular, that Bayer knew, or should have known, of the alleged risks and should be held liable for having failed to disclose them or ade-quately warn users of Yasmin® and / or yaz®. Bayer has also been served with three putative class actions claiming economic loss, one of them also claiming personal injuries. One of these class actions, brought in federal court on behalf of all private health insurers in the United States, was dismissed with prejudice. Plaintiffs did not appeal. All cases pending in u.s. federal courts have been consolidated in a multidistrict litigation (mdl) proceeding for common pre-trial manage-ment. In addition, 13 Canadian class actions have been served upon Bayer as of February 1, 2011. Additional lawsuits are anticipated. Bayer believes that it has meritorious defenses and intends to defend itself vigorously. Based on the information currently available, Bayer has taken accounting measures for anticipated defense costs.
In connection with the above matters concerning Magnevist®, Trasylol® and Yasmin® / yaz®, Bayer is insured against product liability risks to the extent customary in the industry.
COMPETITION LAW PROCEEDINGSCipro®: Approximately 40 putative class action lawsuits and one individual lawsuit against Bayer involving Cipro®, a medication used in the treatment of infectious diseases, have been pending in the United States since 2000. The plaintiffs are suing Bayer and other companies also named as defendants, alleging that a settlement to end patent litigation reached in 1997 between Bayer and Barr Laboratories, Inc. violated antitrust regulations. The plaintiffs claim the alleged violation prevented the marketing of generic ciprofl oxacin as of 1997. In particular, they are seeking triple damages under u.s. law. After the settlement with Barr, the patent was the subject of a successful re-examination by the u.s. Patent and Trademark Offi ce and of successful defenses in u.s. federal courts. It has since expired.
Table of ConTenTs
ConsolidaTed finanCial sTaTemenTs
BAYER ANNUAL REPORT 2010 CONSOLIDATED FINANCIAL STATEMENTS 243
Notes32. Legal risks
All the actions pending in federal courts were consolidated in federal district court in New York in a multidistrict litigation (mdl) proceeding. The Court of Appeals for the Federal Circuit in Wash-ington d.c. affi rmed a 2005 ruling of the federal district court in New York dismissing all lawsuits fi led in federal court. No further avenues of appeal now remain in these federal indirect purchas-ers’ cases. In 2010, the United States Court of Appeals for the Second Circuit (New York) also affi rmed the dismissal of lawsuits brought by direct purchasers of Cipro®. The Second Circuit also has denied plaintiffs’ request for rehearing en banc. Plaintiffs seek certiorari before the United States Supreme Court. Further cases are pending before various state courts. Bayer believes that it has meritorious defenses and intends to defend itself vigorously.
PATENT DISPUTESYasmin®: In 2005, Bayer fi led suit against Barr Pharmaceuticals, Inc. and Barr Laboratories, Inc. in u.s. federal court alleging patent infringement by Barr for the intended generic version of Bayer’s Yasmin® oral contraceptive product in the United States. In 2008, the u.s. federal court invalidated Bayer’s ’531 patent for Yasmin®. In 2009, the u.s. Court of Appeals for the Federal Circuit affi rmed this decision. In May 2010, the u.s. Supreme Court rejected Bayer’s petition for review.
In 2008, Bayer and Barr Laboratories, Inc. signed a supply and licensing agreement for the supply of a generic version of Yasmin® which Barr markets solely in the United States under the Ocella® brand. Barr pays Bayer a fi xed percentage of the revenues from the product sold by Barr. The agreement is under investigation by the u.s. Federal Trade Commission (ftc).
In 2008 Bayer received two and in 2010 another three notices of an Abbreviated New Drug Appli-cation with a Paragraph iv certifi cation (an “anda iv”) pursuant to which Watson Laboratories Inc., Sandoz Inc., Lupin Ltd., Famy Care Ltd. and Sun Pharma Global fze each seek approval to market a generic version of Bayer’s oral contraceptive Yasmin® in the United States. Bayer has fi led suit against Watson, Sandoz and Lupin in u.s. federal court alleging patent infringement for the intended generic version of Yasmin®. In reply, Watson and Sandoz have fi led counterclaims alleging, among other things, the invalidity of various Bayer patents. Sandoz has further alleged that Bayer and Barr have made arrangements that are anticompetitive and violate antitrust and unfair competition laws. In September 2010, the u.s. federal court granted a motion to dismiss Bayer‘s infringement claims against Watson and Sandoz. Bayer will appeal.
yaz®: In 2007 and 2008, Bayer received notices from Barr Laboratories, Inc., Watson Laborato-ries Inc. and Sandoz Inc., and in 2010 Bayer received notices from Lupin Ltd. and Sun Pharma Global fze, that each company has fi led an anda iv seeking approval of a generic version of Bayer’s yaz® oral contraceptive in the United States. Bayer has fi led patent infringement suits against Watson, Sandoz, Lupin and Sun Pharma Global in u.s. federal court claiming that certain of Bayer’s patents have been infringed. In its defense statement, Sandoz has alleged, among other things, that Bayer and Barr have made arrangements that are anticompetitive and violate antitrust and unfair competition laws.
In 2008, Bayer and Barr agreed that Bayer will grant Barr a license to market a generic version of yaz® in the United States starting July 2011 and will supply Barr with the product for this purpose. Barr agreed to pay Bayer a fi xed percentage of the revenues from the product sold by Barr. In December 2008, Barr was acquired by Teva Pharmaceutical Industries Ltd. In June 2010, Teva announced that it had commercially launched Gianvi®, a generic version of yaz®, in the United States. Litigation between Bayer and Teva / Barr in several u.s. federal courts on infringement of certain of Bayer’s patents by the distribution of Gianvi® was settled in December 2010. Bayer and Barr amended the aforementioned licensing and supply agreement of 2008, which is also un-der investigation by the ftc, and Bayer has supplied Barr with the product for Gianvi® since De-cember 2010.
Table of ConTenTs
ConsolidaTed finanCial sTaTemenTs
BAYER ANNUAL REPORT 2010244 CONSOLIDATED FINANCIAL STATEMENTS
Notes32. Legal risks
Blood glucose monitoring devices: In 2005, Abbott Laboratories commenced a lawsuit in the United States against Bayer and another party alleging infringement of two of Abbott’s patents re-lating to blood glucose monitoring devices. The devices concerned are sold by Bayer as part of its Ascensia® Contour® system and its dex® and Autodisc® system. The Ascensia® Contour® system is supplied to Bayer by a Japanese manufacturer, who originally designed the product and is contrac-tually obligated to indemnify Bayer. In 2006, Abbott added a separate claim of infringement against the devices sold by Bayer as part of its dex® and Autodisc® system. Bayer is not entitled to indemni-fi cation on this separate claim. The court and, thereafter, the u.s. Court of Appeals for the Federal Circuit held in favor of Bayer but, on one aspect of the decision with respect to one of the patents, the Court of Appeals granted a rehearing which took place in November 2010. Bayer is waiting for the court decision.
In 2007, Roche Diagnostics Operations and Corange International commenced a lawsuit in the United States against Bayer and several other parties alleging infringement of two of Roche’s pat-ents relating to blood glucose monitoring devices. Two of the accused devices are sold by Bayer as part of its Breeze® 2 and Contour® systems. Bayer believes that these patents are covered by an ex-isting license agreement between the parties, and the litigation has been dismissed in favor of an arbitration under this earlier license agreement. Roche has added to the arbitration four additional patents which Roche alleges the Bayer Contour® systems infringe. Bayer is awaiting the arbitra-tors’ decision.
Betaferon® / Betaseron®: In May 2010, Bayer fi led a complaint against Biogen Idec ma Inc. in u.s. federal court seeking a declaration by the court that a patent issued to Biogen in 2009 is in-valid and not infringed by Bayer’s production and distribution of Betaseron®, Bayer’s drug prod-uct for the treatment of multiple sclerosis. Biogen is alleging patent infringement by Bayer through Bayer’s production and distribution of Betaseron® and Extavia® and has sued Bayer ac-cordingly. Betaseron® is manufactured and distributed in the United States by Bayer. Extavia® is also a drug product for the treatment of multiple sclerosis; it is manufactured by Bayer, but dis-tributed in the United States by Novartis Pharmaceuticals Corporation, another defendant in the lawsuit.
Levitra®: In 2009, Bayer fi led a patent infringement suit in u.s. federal court against Teva Pharma-ceuticals usa, Inc. and Teva Pharmaceutical Industries Ltd. Earlier that year, Bayer had received notice of an anda iv pursuant to which Teva seeks approval to market a generic version of Levitra®, Bayer’s therapy for the treatment of erectile dysfunction, prior to patent expiration in the United States. Bayer intends to pursue its rights vigorously.
Bayer believes it has meritorious defenses in the above patent disputes and intends to defend itself vigorously.
FURTHER LEGAL PROCEEDINGSWholesale prices in the u.s.: Bayer and a number of pharmaceutical companies in the United States are defendants in pending lawsuits in which plaintiffs, including states, are alleging manipulation in the reporting of wholesale prices and / or best prices for their prescription phar-maceutical products. The plaintiffs seek damages, including disgorgement of profi ts and punitive damages. Bayer believes it has meritorious defenses and intends to defend itself vigorously. In ap-propriate cases Bayer has agreed to settlements and will continue to consider this option in the future.
Bayer Schering Pharma AG former shareholder litigation: In 2008, the squeeze-out of the former minority shareholders of Bayer Schering Pharma AG became effective. As usual in such cases, sever-al shareholders have initiated special court proceedings to review the adequacy of the compensation payments made by Bayer for the transfer of the shares in the squeeze-out. The adequacy of the com-pensation and the guaranteed dividend paid by Bayer in connection with the Bayer Schering Pharma AG profi t and loss transfer agreement made in 2006 is also being reviewed by the courts. (Please note that Bayer Schering Pharma AG and the former Schering-Plough Corporation, New Jersey, are unaffi liated companies that have been independent of each other for many years. The names “ Bayer Schering Pharma” or “Schering” as used in this Annual Report always refer to Bayer Schering Phar-ma AG, Berlin, Germany, or its predecessor, Schering AG, Berlin, Germany, respectively).
Table of ConTenTs
ConsolidaTed finanCial sTaTemenTs
BAYER ANNUAL REPORT 2010 CONSOLIDATED FINANCIAL STATEMENTS 245
Notes32. Legal risks
Regorafenib: In 2009, Onyx Pharmaceuticals, Inc. fi led a complaint in the u.s. District Court for Northern California alleging that the compound regorafenib, which is under development by Bayer in cancer indications, is a compound to which Onyx has rights under a collaboration agree-ment that was originally concluded in 1994. Under this agreement, the parties jointly developed Nexavar®, a drug product to treat kidney and liver cancer. In addition, Onyx also claims damages to Nexavar®. Bayer believes it has meritorious defenses and intends to defend itself vigorously. Trial is presently scheduled for June 2011.
Compliance investigation: Bayer is conducting an internal investigation into compliance by a for-mer operating unit of one of its u.s. subsidiaries with the United States Foreign Corrupt Practices Act. That statute prohibits, among other things, corrupt payments by u.s. persons to governmen-tal offi cials outside the United States. The unit, which conducted Bayer’s plasma-derived prod-ucts business, was sold in 2005. The initial focus of the internal investigation has been on sales by that unit to certain eastern European and Middle Eastern countries. In order to evaluate Bayer’s compliance efforts, Bayer is also reviewing sales practices in other units and countries. Bayer has voluntarily advised the United States government of the internal investigation. The United States government has not indicated what action it may take, if any, against Bayer or any individual, or whether it may conduct its own investigation. Because the internal investigation is ongoing, no statements on its outcome, or on any disadvantages for Bayer that may result therefrom, can be made at this point in time.
CropScience
Proceedings involving genetically modifi ed rice: As of February 1, 2011, Bayer was aware of a total of approximately 570 lawsuits, involving about 11,300 plaintiffs, pending in u.s. federal and state courts against several Bayer Group companies in connection with genetically modifi ed rice in the United States. The number of plaintiffs is calculated by totaling the number of plaintiffs identi-fi ed in the complaints. However, the number of plaintiffs does not allow any conclusions on the number of farming operations involved. u.s. rice farmers often have a number of entities associated with their operations. In some cases just an individual sued, in others all the entities sued. In addi-tion, a partnership and its individual partners are counted separately if they are listed as plaintiffs in the complaints.
Plaintiffs allege that they have suffered economic losses after traces of genetically modifi ed rice were identifi ed in samples of conventional long-grain rice grown in the u.s. All the actions pend-ing in federal court were consolidated in 2006 in federal district court in St. Louis, Missouri, in a multidistrict litigation (mdl) proceeding. In 2008, this court denied plaintiffs’ request to certify a class action. Plaintiffs’ subsequent request for interim appeal was denied by the appellate court.
In development of the genetically modifi ed rice, fi eld testing was conducted in the United States in cooperation with third parties from 1998 to 2001. The genetically modifi ed rice was never com-mercialized. The usda and the fda have stated that the genetically modifi ed rice does not present a health risk and is safe for use in food and feed and for the environment. Additionally, in 2007, the usda released its report concerning its investigation into how the genetically modifi ed rice entered the commercial rice supply. The usda was unable to determine a cause and indicated it would not pursue any enforcement actions against Bayer or any other party.
Table of ConTenTs
ConsolidaTed finanCial sTaTemenTs
BAYER ANNUAL REPORT 2010246 CONSOLIDATED FINANCIAL STATEMENTS
Notes32. Legal risks
Bayer tried six cases in front of u.s. juries between December 2009 and July 2010, three in the federal mdl court and three in different state courts in Arkansas. These six cases involved a total of 23 farming operations comprising 91 plaintiffs from Missouri, Louisiana, Mississippi and Arkansas and were tried based on the respective applicable laws of these four states. Plaintiffs claimed various commercial damages, including a decline in the commodity price for long-grain rice, costs associated with restrictions on imports and exports, and costs to secure alternative supplies. The juries found Bayer should pay compensatory damages totaling approx. us$11.5 mil-lion. In two of the Arkansas state court trials, the juries also awarded punitive damages (approxi-mately us$0.5 million in one trial and approximately us$42 million in the other). In a federal mdl trial in July 2010 involving plaintiffs from Louisiana, punitive damages were not available under the applicable laws. The other three juries rejected the farmers’ claims for punitive damages.
Bayer disagrees with the present fi ndings of liability and the awards of compensatory and punitive damages. To the extent it has not already done so, Bayer will appeal the adverse fi ndings.
One trial originally scheduled for September 2010 in a state court in Arkansas has been continued indefi nitely for procedural reasons. Additionally, one federal mdl trial scheduled for 2010, involv-ing three farming operations comprising eight plaintiffs from Texas, was settled in October 2010. The settlement calls for the plaintiffs to receive us$290,000 collectively. The fi rst federal mdl trial scheduled for 2011 was also settled, with four farming operations comprising 18 plaintiffs from Mississippi to receive us$873,000 collectively. In February 2011, Bayer also reached an agree-ment with several farming operations and/or landlord holdings comprising 33 plaintiffs from Arkansas. The settlement calls for the plaintiffs to receive a total of approximately us$4 million. This trial, however, will go forward with regard to a claim by Riceland Foods, Inc., a rice mill from Arkansas. Additional trials have been scheduled for the year 2011, in both the federal mdl and the state court actions.
The facts and the types and amounts of damages claimed differ signifi cantly from case to case. Management believes that the outcomes of these fi rst trials do not allow any direct conclusions on the outcomes of the other cases. The company is willing to discuss with rice growers and other plaintiffs reasonable compensation for economic losses associated with its genetically modifi ed rice without acknowledging liability, but intends to continue to defend itself vigorously in all cases in which resolutions on that basis are not possible.
Without acknowledging liability, Bayer also settled the claims brought forward by fi ve European rice importers, one u.s. rice exporter and one u.s. rice mill at a total settlement value of us$51.6 million.
Bayer has established appropriate provisions, mainly for legal and defense costs and an intended settlement program.
Asbestos: A further risk may arise from asbestos litigation in the United States. In many cases, the plaintiffs allege that Bayer and co-defendants employed third parties on their sites in past de-cades without providing them with suffi cient warnings or protection against the known dangers of asbestos. Additionally, a Bayer affi liate in the United States is the legal successor to companies that sold asbestos products until 1976. Union Carbide has agreed to indemnify Bayer for this lia-bility. Bayer believes it has meritorious defenses and intends to defend itself vigorously.
Table of ConTenTs
ConsolidaTed finanCial sTaTemenTs
BAYER ANNUAL REPORT 2010 CONSOLIDATED FINANCIAL STATEMENTS 247
Notes32. Legal risks
MaterialScience
ANTITRUST PROCEEDINGS IN CONNECTION WITH RUBBER PRODUCTSCompanies of the Bayer Group are subject to civil damage claims in Europe and Australia based on alleged violations of applicable competition laws concerning rubber products that were subject to investigations by regulatory authorities. All of these investigations have been closed.
Since 2008, a group of plaintiffs who are primarily producers of tires have brought actions for damages before the High Court of Justice in London, u.k., against Bayer and other producers of butadiene rubber and emulsion styrene butadiene rubber. The plaintiffs claim damages result-ing from alleged violations of e.u. competition law in the markets for butadiene rubber and emulsion styrene butadiene rubber. Proceedings brought to establish non-liability before a court in Milan to which Bayer joined as intervener were dismissed; Bayer is appealing. The High Court has taken jurisdiction over the actions and the main proceedings are at an early stage of the disclosure process.
Previously, Bayer reported a claim by The Goodyear Tire & Rubber Company alleging that Bayer violated antitrust law in the area of butadiene rubber and styrene butadiene rubber. In March 2010, the case was settled by agreement of the parties and without Bayer admitting liability.
In Australia, a class action alleging antitrust violations in connection with rubber chemicals products was fi led in 2007. The case is at an early stage of the disclosure process.
Bayer is defending itself in the European and Australian litigations. The fi nancial risk from these proceedings cannot currently be quantifi ed. Therefore, Bayer is unable to take any accounting measures in this regard.
It remains possible that further civil damage claims may be fi led in connection with public anti-trust investigations reported on previously and now closed.
PERSONAL INJURY LITIGATIONmdi: In the United States, Bayer, together with other manufacturers, resellers and applicators, is a defendant in multiple cases that seek damages for personal injuries allegedly resulting from exposure to mdi based products used in coal mines. In one case the plaintiffs allege that they were also exposed to tdi and hdi based products. In August 2010, the parties to all but one law-suit reached an agreement in principle to settle all claims – without Bayer admitting liability – on mutually acceptable terms. Final release agreements have not yet been fully executed. Bayer has taken appropriate accounting measures. The remaining case is no longer considered to be material.
Table of ConTenTs
ConsolidaTed finanCial sTaTemenTs
BAYER ANNUAL REPORT 2010248 CONSOLIDATED FINANCIAL STATEMENTS
Notes33. Net cash provided by (used in) operating activities
Notes to the Statements of Cash Flows
The statement of cash fl ows shows how cash infl ows and outfl ows during the year affected the cash and cash equivalents (liquidity) of the Bayer Group as of the closing date. The effects of changes in the scope of consolidation are stated separately. Cash fl ows are classifi ed by operating, investing and fi nancing activities in accordance with ias 7 (Statement of Cash Flows).
The amounts reported by consolidated companies outside the eurozone are translated at average monthly exchange rates, with the exception of cash and cash equivalents, which are translated at closing rates as in the statement of fi nancial position. The effect of changes in exchange rates on cash and cash equivalents is shown separately.
The amounts corresponding to the components of the net operating cash fl ow are shown both in the statement of fi nancial position and in the income statement. This applies, for example, to the amounts of inventories, receivables and payables recognized in the statement of fi nancial position that determine the changes in working capital shown in the statement of cash fl ows. The income after taxes forms the starting point for the statement of cash fl ows.
33. Net cash provided by (used in) operating activitiesThe gross cash fl ow for 2010 of €4,771 million (2009: €4,658 million) is the cash surplus from operating activities before any changes in working capital. The cash fl ows by segment are shown in Note [1].
The net operating cash fl ow of €5,773 million (2009: €5,375 million) takes into account the changes in working capital and other non-cash transactions.
The net operating cash fl ow for 2010 included an income-tax-related net cash outfl ow of €838 mil-lion (2009: €500 million). The changes in income tax liabilities, income tax provisions and claims for reimbursement of income taxes are shown in the line “Changes in other working capital, other non-cash items.”
34. Net cash provided by (used in) investing activitiesNet cash outfl ow for investing activities in 2010 amounted to €2,414 million (2009: €1,501 mil-lion).
Additions to property, plant and equipment and intangible assets in 2010 resulted in a cash out-fl ow of €1,514 million (2009: €1,575 million). Disbursements for property, plant and equipment and intangible assets included those for the expansion of the production site for polymer prod-ucts in Shanghai, China, and for marketing rights in the Pharmaceuticals segment. Cash infl ows from sales of property, plant and equipment and other assets amounted to €61 million (2009: €98 million).
Table of ConTenTs
ConsolidaTed finanCial sTaTemenTs
BAYER ANNUAL REPORT 2010 CONSOLIDATED FINANCIAL STATEMENTS 249
Notes35. Net cash provided by (used in) fi nancing activities
In addition, acquisitions resulted in cash outfl ows of €31 million (2009: €308 million). Included here was the acquisition of Artifi cial Muscle, Inc., United States, for which disbursements of €16 million were made, net of acquired cash. The prior-year fi gure comprised mainly the acquisi-tion of Athenix Corp., United States. Disbursements for this purchase amounted to €247 million, net of acquired cash. Further details of acquisitions and divestitures are given in Notes [6.2] and [6.3], respectively.
35. Net cash provided by (used in) fi nancing activitiesIn 2010 there was a net cash outfl ow of €3,230 million (2009: €3,246 million) for fi nancing activi-ties. Net loan repayments amounted to €1,544 million (2009: €1,442 million).
Cash outfl ows for dividend payments amounted to €1,160 million (2009: €973 million). The prior-year fi gure included €101 million in refunds of withholding tax on intra-Group dividends. Interest payments – including those paid on interest-rate swaps – decreased to €915 million (2009: €1,206 million), while interest received from interest-rate swaps amounted to €398 million (2009: €421 million).
36. Cash and cash equivalentsCash and cash equivalents comprise cash, checks and balances with banks. In accordance with ias 7 (Statement of Cash Flows) this item also includes securities with original maturities of up to three months, refl ecting their high liquidity. Cash and cash equivalents as of December 31, 2010 amounted to €2,840 million (2009: €2,725 million).
Table of ConTenTs
ConsolidaTed finanCial sTaTemenTs

BAYER ANNUAL REPORT 2010250 CONSOLIDATED FINANCIAL STATEMENTS
Notes37. Audit fees
Other Information
37. Audit feesThe following fees for the services of PricewaterhouseCoopers Aktiengesellschaft Wirtschafts-prüfungsgesellschaft were recognized as expenses:
The fees for the auditing of fi nancial statements mainly comprise those for the audits of the consoli-dated fi nancial statements of the Bayer Group and the fi nancial statements of Bayer AG and its German subsidiaries. Fees for other assurance services primarily relate to audits of the internal con-trol system, including project audits in connection with the implementation of new it systems, and to reviews of interim fi nancial statements.
38. Related partiesRelated parties as defi ned in ias 24 (Related Party Disclosures) are those legal entities and natural persons that are able to exert infl uence on Bayer AG and its subsidiaries or over which Bayer AG or its subsidiaries exercise control or have a signifi cant infl uence. They include, in particular, non-consolidated subsidiaries, joint ventures, associates and post-employment benefi t plans, as well as the corporate offi cers of Bayer AG whose compensation is reported in Note [39] and in the Compensation Report, which forms part of the Management Report.
Transactions with non-consolidated subsidiaries, joint ventures, associates and post-employment benefi t plans are carried out on an arm’s-length basis.
The following table shows the volume of transactions with related parties that are included in the consolidated fi nancial statements of the Bayer Group at amortized cost, by proportionate consoli-dation or using the equity method, and with post-employment benefi t plans:
Audit Fees [Table 4.95]
2009 2010
€ million € million
Financial statements audit services 5 5
Other assurance services 2 2
Tax advisory services - -
Other services - 1
Total 7 8
Related Parties [Table 4.96]
2009 2010
Income Receivables Liabilities Income Receivables Liabilities
€ million € million € million € million € million € million
Non-consolidated subsidiaries 19 13 (33) 12 8 (37)
Joint ventures 32 3 (1) 35 2 -
Associates 24 10 (25) 31 10 (37)
Post-employment benefi t plans - 460 (89) - 560 (84)
Table of ConTenTs
ConsolidaTed finanCial sTaTemenTs
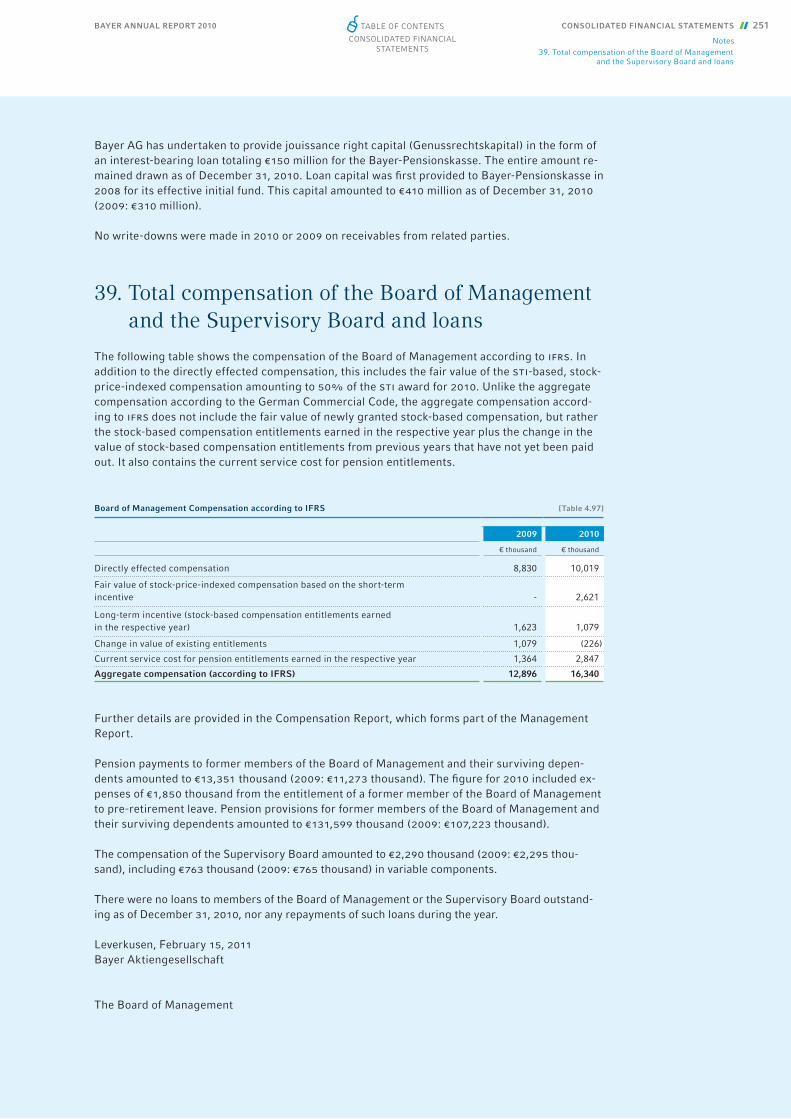
Bayer AG has undertaken to provide jouissance right capital (Genussrechtskapital) in the form of an interest-bearing loan totaling €150 million for the Bayer-Pensionskasse. The entire amount re-mained drawn as of December 31, 2010. Loan capital was fi rst provided to Bayer-Pensionskasse in 2008 for its effective initial fund. This capital amounted to €410 million as of December 31, 2010 (2009: €310 million).
No write-downs were made in 2010 or 2009 on receivables from related parties.
39. Total compensation of the Board of Management and the Supervisory Board and loans
The following table shows the compensation of the Board of Management according to ifrs. In addition to the directly effected compensation, this includes the fair value of the sti-based, stock-price-indexed compensation amounting to 50% of the sti award for 2010. Unlike the aggregate compensation according to the German Commercial Code, the aggregate compensation accord-ing to ifrs does not include the fair value of newly granted stock-based compensation, but rather the stock-based compensation entitlements earned in the respective year plus the change in the value of stock-based compensation entitlements from previous years that have not yet been paid out. It also contains the current service cost for pension entitlements.
Further details are provided in the Compensation Report, which forms part of the Management Report.
Pension payments to former members of the Board of Management and their surviving depen-dents amounted to €13,351 thousand (2009: €11,273 thousand). The fi gure for 2010 included ex-penses of €1,850 thousand from the entitlement of a former member of the Board of Management to pre-retirement leave. Pension provisions for former members of the Board of Management and their surviving dependents amounted to €131,599 thousand (2009: €107,223 thousand).
The compensation of the Supervisory Board amounted to €2,290 thousand (2009: €2,295 thou-sand), including €763 thousand (2009: €765 thousand) in variable components.
There were no loans to members of the Board of Management or the Supervisory Board outstand-ing as of December 31, 2010, nor any repayments of such loans during the year.
Leverkusen, February 15, 2011Bayer Aktiengesellschaft
The Board of Management
Board of Management Compensation according to IFRS [Table 4.97]
2009 2010
€ thousand € thousand
Directly effected compensation 8,830 10,019
Fair value of stock-price-indexed compensation based on the short-term incentive - 2,621
Long-term incentive (stock-based compensation entitlements earned in the respective year) 1,623 1,079
Change in value of existing entitlements 1,079 (226)
Current service cost for pension entitlements earned in the respective year 1,364 2,847
Aggregate compensation (according to IFRS) 12,896 16,340
BAYER ANNUAL REPORT 2010 CONSOLIDATED FINANCIAL STATEMENTS 251
Notes39. Total compensation of the Board of Management and the Supervisory Board and loans
Table of ConTenTs
ConsolidaTed finanCial sTaTemenTs
BAYER ANNUAL REPORT 2010252 MANAGEMENT’S STATEMENT OF RESPONSIBILITY FOR FINANCIAL REPORTING
Management’s Statement of Responsibility for Financial ReportingThe consolidated fi nancial statements of the Bayer Group have been prepared by the manage-ment, which is responsible for the substance and objectivity of the information contained therein. The same applies to the Group management report, which is consistent with the consolidated fi nancial statements and is combined with the management report of Bayer AG.
Our fi nancial reporting takes place according to the rules issued by the International Accounting Standards Board, London, as endorsed by the European Union.
Effective internal monitoring procedures instituted by Group management at the consolidated companies along with appropriate staff training ensure the propriety of our reporting and its com-pliance with legal provisions. Integrity and social responsibility form the basis of our corporate principles and of their application in areas such as environmental protection, quality, product safety, plant safety and adherence to local laws and regulations. The worldwide implementation of these principles and the reliability and effectiveness of the monitoring procedures are conti-nuously verifi ed by our Corporate Auditing Department.
The Board of Management conducts the business of the Group in the interests of the stockholders and in awareness of its responsibilities toward employees, communities and the environment in all the countries in which we operate. Our declared aim is to deploy the resources entrusted to us in order to increase the value of the Bayer Group as a whole.
In accordance with the resolution of the Annual Stockholders’ Meeting, the Supervisory Board appointed PricewaterhouseCoopers Aktiengesellschaft Wirtschaftsprüfungsgesellschaft as the independent auditor of the consolidated fi nancial statements, which were prepared according to the International Financial Reporting Standards – as endorsed by the European Union – pursuant to Section 315a of the German Commercial Code, and of the additional requirements of German commercial law and the combined management report. The scope of the auditor’s unqualifi ed re-port also includes Bayer’s risk management system, audited in light of the German Law on Corpo-rate Supervision and Transparency. The consolidated fi nancial statements, the combined manage-ment report and the auditor’s report were discussed in detail, in the presence of the auditor, by the Audit Committee of the Supervisory Board and at a plenary meeting of the Supervisory Board. The Supervisory Board reports on this separately in the Report of the Supervisory Board in the Bayer Annual Report 2010.
The Board of Management
Table of ConTenTs
BAYER ANNUAL REPORT 2010 RESPONSIBILITY STATEMENT 253
Responsibility StatementTo the best of our knowledge, and in accordance with the applicable reporting principles for fi nancial reporting, the consolidated fi nancial statements give a true and fair view of the assets, liabilities, fi nancial position and profi t or loss of the Bayer Group, and the combined management report includes a fair review of the development and performance of the business and the position of the Bayer Group and Bayer AG, together with a description of the principal opportunities and risks associated with the expected development of the Bayer Group and Bayer AG.
Leverkusen, February 15, 2011Bayer Aktiengesellschaft
The Board of Management
Dr. Marijn Dekkers Werner Baumann Dr. Wolfgang Plischke Dr. Richard PottChairman
Werner B Dr. Richard P
Table of ConTenTs
BAYER ANNUAL REPORT 2010254 AUDITOR’S REPORT
Auditor’s ReportWe have audited the consolidated fi nancial statements prepared by Bayer Aktiengesellschaft, Leverkusen, comprising the income statement and statement of comprehensive income, state-ment of fi nancial position, statement of cash fl ows, statement of changes in equity and the notes to the consolidated fi nancial statements, together with the group management report of Bayer Aktiengesellschaft for the business year from January 1, 2010 to December 31, 2010, which is combined with the management report of the company. The preparation of the consolidated fi nancial statements and the combined management report in accordance with the ifrs, as adopted by the e.u., and the additional requirements of German commercial law pursuant to § (Article) 315a Abs. (paragraph) 1 hgb (“Handelsgesetzbuch”: German Commercial Code) are the responsibility of the parent Company’s Board of Management. Our responsibility is to express an opinion on the consolidated fi nancial statements and on the combined management report based on our audit.
We conducted our audit of the consolidated fi nancial statements in accordance with § 317 hgb and German generally accepted standards for the audit of fi nancial statements promulgated by the Insti-tut der Wirtschaftsprüfer (Institute of Public Auditors in Germany) (idw) and additionally observed the International Standards on Auditing (isa). Those standards require that we plan and perform the audit such that misstatements materially affecting the presentation of the net assets, fi nancial position and results of operations in the consolidated fi nancial statements in accordance with the applicable fi nancial reporting framework and in the combined management report are detected with reasonable assurance. Knowledge of the business activities and the economic and legal envi-ronment of the Group and expectations as to possible misstatements are taken into account in the determination of audit procedures. The effectiveness of the accounting-related internal control sys-tem and the evidence supporting the disclosures in the consolidated fi nancial statements and the combined management report are examined primarily on a test basis within the framework of the audit. The audit includes assessing the annual fi nancial statements of those entities included in consolidation, the determination of the entities to be included in consolidation, the accounting and consolidation principles used and signifi cant estimates made by the Company’s Board of Manage-ment, as well as evaluating the overall presentation of the consolidated fi nancial statements and the combined management report. We believe that our audit provides a reasonable basis for our opinion.
Our audit has not led to any reservations.
In our opinion based on the fi ndings of our audit the consolidated fi nancial statements comply with the ifrs as adopted by the e.u. and with the additional requirements of German commer-cial law pursuant to § 315a Abs. 1 hgb and give a true and fair view of the net assets, fi nancial position and results of operations of the Group in accordance with these requirements. The combined management report is consistent with the consolidated fi nancial statements and as a whole provides a suitable view of the Group’s position and suitably presents the opportunities and risks of future development.
Essen, February 24, 2011
PricewaterhouseCoopersAktiengesellschaftWirtschaftsprüfungsgesellschaft
Armin Slotta Anne BöckerWirtschaftsprüfer Wirtschaftsprüferin
Table of ConTenTs
BAYER ANNUAL REPORT 2010 FURTHER INFORMATION 255
Further Information
Governance Bodies 256Organization Chart 259Glossary 260Index 264Global Commitment to Sustainability 266
Table of ConTenTs

256 FURTHER INFORMATION
Governance Bodies
BAYER ANNUAL REPORT 2010
Governance Bodies
HERMANN JOSEF STRENGER
Honorary Chairman of the Supervisory Board of Bayer AG, Leverkusen
Supervisory BoardMembers of the Supervisory Board held offi ces as members of the supervisory board or a comparable supervising body of the corporations listed (as at December 31, 2010 or the date on which they ceased to be members of the Supervisory Board of Bayer AG):
DR. MANFRED SCHNEIDERCologne, Germanyborn December 21, 1938
Chairman of the Supervisory Board effective April 2002
• Daimler AG
• Linde AG (Chairman)
• RWE AG (Chairman)
• TUI AG
THOMAS DE WINCologne, Germanyborn November 21, 1958
Vice Chairman of the Supervisory Board,Member of the Supervisory Board effective April 2002
Chairman of the Bayer Group Works Council
Chairman of the Bayer Central Works Council
• Bayer MaterialScience AG
DR. PAUL ACHLEITNERMunich, Germanyborn September 28, 1956
Member of the Supervisory Board effective April 2002
Member of the Board of Management of Allianz SE
• Allianz Deutschland AG (until the end of June 2010)
• Allianz Global Investors AG
• Allianz Investment Management SE, Chairman of the Board of Directors
• Daimler AG (effective April 2010)
• RWE AG
• Henkel AG & Co. KGaA, Shareholders’ Committee
ANDRÉ AICHBerlin, Germanyborn February 17, 1969
Member of the Supervisory Board effective April 2007
Member of the Works Council of Bayer Schering Pharma AG *
WILLY BEUMANNWuppertal, Germanyborn April 12, 1956
Member of the Supervisory Board effective February 2007
Chairman of the Works Council of the Wuppertal site of Bayer
• Bayer Schering Pharma AG *
DR. CLEMENS BÖRSIGFrankfurt am Main, Germanyborn July 27, 1948
Member of the Supervisory Board effective April 2007
Chairman of the Supervisory Board of Deutsche Bank AG
• Daimler AG
• Deutsche Bank AG (Chairman)
• Emerson Electric Co.
• Linde AG
DR.-ING. THOMAS FISCHERKrefeld, Germanyborn August 27, 1955
Member of the Supervisory Board effective October 2005
Chairman of the Group Managerial Employees’ Committee of Bayer
• Bayer MaterialScience AG
PETER HAUSMANNWinsen an der Aller, Germanyborn February 13, 1954
Member of the Supervisory Board effective April 2006
Member of the Executive Committee of the German Mining, Chemical and Energy Industrial Union
• Evonik Services GmbH
PROF. DR.-ING. E.H. HANS-OLAF HENKELBerlin, Germanyborn March 14, 1940
Member of the Supervisory Board effective April 2002
Honorary Professor at the University of Mannheim
• Continental AG
• Daimler Luft- und Raumfahrt Holding AG
• Heliad Equity Partners GmbH & Co. KGaA
• Ringier AG
• SMS GmbH
REINER HOFFMANNBrussels, Belgiumborn May 30, 1955
Member of the Supervisory Board effective October 2006
North Rhine District Secretary of the German Mining, Chemical and Energy Industrial Union
• Evonik Services GmbH (effective September 2010)
• SASOL Germany GmbH
DR. RER. POL. KLAUS KLEINFELD New York, U.S.A.born November 6, 1957
Member of the Supervisory Board effective April 2005
Chairman and Chief Executive Offi cer of ALCOA Inc.
PETRA KRONENKrefeld, Germanyborn August 22, 1964
Member of the Supervisory Board effective July 2000
Chairman of the Works Council of the Uerdingen site of Bayer
• Bayer MaterialScience AG (Vice Chair man)
* company to be renamed Bayer Pharma AG
Table of ConTenTs
BAYER ANNUAL REPORT 2010 FURTHER INFORMATION 257
Governance Bodies
DR. RER. NAT. HELMUT PANKE Munich, Germanyborn August 31, 1946
Member of the Supervisory Board effective April 2007
Member of various supervisory boards
• Microsoft Corporation
• Singapore Airlines Limited
• UBS AG
HUBERTUS SCHMOLDTSoltau, Germanyborn January 14, 1945
Member of the Supervisory Board effective January 1995
Member of various supervisory boards
• BP Europe SE (formerly Deutsche BP AG) (Vice Chairman until May 2010)
• Dow Olefi nverbund GmbH (Vice Chairman)
• E.ON AG
• RAG AG (Vice Chairman)
• RAG Deutsche Steinkohle AG (Vice Chairman)
DR.-ING. EKKEHARD D. SCHULZ Krefeld, Germanyborn July 24, 1941
Member of the Supervisory Board effective April 2005
Chairman of the Executive Board ofThyssenKrupp AG
• AXA Konzern AG
• MAN SE (Vice Chairman)
• RWE AG
• ThyssenKrupp Elevator AG (Chairman)
• ThyssenKrupp Steel Europe AG (Chairman)
DR. KLAUS STURANY **Dortmund, Germanyborn October 23, 1946
Member of the Supervisory Board effective April 2007
Member of various supervisory boards
• Hannover Rückversicherung AG
• Heidelberger Druckmaschinen AG
• Österreichische Industrieholding AG
• Sulzer AG
ROSWITHA SÜSSELBECKLeichlingen, Germanyborn March 19, 1954
Member of the Supervisory Board effective July 2010
Vice Chairman of the Works Council of the Leverkusen site of Bayer
• Bayer CropScience AG (Vice Chairman effective December 2010)
DIPL.-ING. DR.-ING. E.H. JÜRGEN WEBERHamburg, Germanyborn October 17, 1941
Member of the Supervisory Board effective April 2003
Chairman of the Supervisory Board of Deutsche Lufthansa AG
• Allianz Lebensversicherungs-AG
• Deutsche Lufthansa AG (Chairman)
• Loyalty Partner GmbH (Chairman)
• Tetra Laval Group
• Voith GmbH
• Willy Bogner GmbH & Co. KGaA (Chairman)
PROF. DR. DR. H.C. ERNST-LUDWIG WINNACKERMunich, Germanyborn July 26, 1941
Member of the Supervisory Board effective April 1997
Secretary General of the Human Frontier Science Program, Strasbourg
• Medigene AG (Chairman)
• Wacker Chemie AG
Standing committees of the Supervisory Board of Bayer AG (as at Dec. 31, 2010)
PRESIDIAL COMMITTEE /
MEDIATION COMMITTEE
Schneider (Chairman), Achleitner, Schmoldt, de Win
AUDIT COMMITTEE
Sturany (Chairman), Fischer, Hausmann, Henkel, Schneider, de Win
HUMAN RESOURCES COMMITTEE
Schneider (Chairman), Beumann, Kronen, Weber
NOMINATIONS COMMITTEE
Schneider (Chairman), Achleitner
** independent expert member pursuant to Section 100 Paragraph 5 of the German Stock Corporation Act (AktG)
OLIVER ZÜHLKESolingen, Germanyborn December 11, 1968
Member of the Supervisory Board effective April 2007
Chairman of the Works Council of the Leverkusen site of Bayer
Chairman of the Bayer European Forum
KARL-JOSEF ELLRICH
Dormagen, Germanyborn October 5, 1949
Member of the Supervisory Board until the end of June 2010
Chairman of the Bayer Group Works Council (until the end of May 2010)
Chairman of the Works Council of the Dormagen site of Bayer (until January 2010)
• Bayer CropScience AG (Vice Chairman until the end of June 2010)
Table of ConTenTs
258 FURTHER INFORMATION
Governance Bodies
BAYER ANNUAL REPORT 2010
DR. MARIJN DEKKERS
born September 22, 1957
Chairman (effective October 1, 2010)
Member of the Board of Management effective January 1, 2010, appointed until December 31, 2014
WERNER BAUMANN
born October 6, 1962
Member of the Board of Management effective January 1, 2010, appointed until December 31, 2012
• Bayer Business Services GmbH (Chairman effective May 1, 2010)
• Bayer CropScience AG (Chairman effective May 1, 2010)
DR. WOLFGANG PLISCHKE
born September 15, 1951
Member of the Board of Managementeffective March 1, 2006, appointed until February 28, 2014
• ARK Therapeutics, Non-Executive Director (until August 16, 2010)
• Bayer MaterialScience AG (Chairman)
• Bayer Technology Services GmbH (Chairman)
• Bayer Innovation GmbH, Shareholders’ Committee (Chairman)
• Bayer Real Estate GmbH, Shareholders’ Committee (Chairman)
DR. RICHARD POTT
born May 11, 1953
Member of the Board of Managementeffective May 1, 2002, appointed until April 30, 2012
Labor Director
• Bayer Chemicals AG (Chairman)
• Bayer HealthCare AG (Chairman)
• Bayer Schering Pharma AG * (Chairman)
• Currenta Geschäftsführungs-GmbH (Chairman)
• Bayer Innovation GmbH, Shareholders’ Committee
KLAUS KÜHN
born February 11, 1952
Member of the Board of Management until April 30, 2010
• Bayer Business Services GmbH (Chairman until April 30, 2010)
• Bayer CropScience AG (Chairman until April 30, 2010)
WERNER WENNING
born October 21, 1946
Member of the Board of Management (Chairman) until September 30, 2010
• Deutsche Bank AG
• E.ON AG
• HDI V.a.G
• Talanx AG
• Henkel AG & Co. KGaA, Shareholders’ Committee
Board of ManagementMembers of the Board of Management held offi ces as members of the supervisory board or a comparable supervising body of the corporations listed (as at December 31, 2010 or the date on which they ceased to be members of the Board of Management):
* company to be renamed Bayer Pharma AG
Table of ConTenTs

BAYER ANNUAL REPORT 2010 FURTHER INFORMATION 259
Organization Chart
Organization Chartas of March 1, 2011 [Graphic 5.1]
Bayer CropScience
S. E. Peterson (photo)ChairmanL. van der BroekChief Operating Offi cerM. HaugHuman ResourcesA. KlausenerResearch
S. KurzawaCommunicationsG. MarchandGeneral CounselA. NoackIndustrial OperationsF. J. PlackeDevelopmentG. RiemannEnvironmental ScienceR. Scheitza *Strategy & BusinessManagement
D. SuwelackBusiness Planning& Administration
Corporate Center
Corporate Offi ce J. KrellCommunications M. SchadeInvestor Relations A. RosarCorporate Auditing R. Meyer
Corporate Human Resources & Organization H. - U. GrohFinance J. DietschCorporate Development A. Moscho
Law & Patents, Insurance R. HartwigEnvironment & Sustainability W. Grosse EntrupGroup Accounting & Controlling U. HauckRegional Coordination I. Paterson
BUSINESS AREAS SERVICE AREAS
* Labor Director** E. L. Mann effective March 14, 2011
Bayer HealthCare
J. Reinhardt (photo)ChairmanJ. - L. LowinskiAnimal HealthG. Balkema**Consumer CareA. MainMedical CareA. FibigPharmaceuticalsA. Busch Global Drug DiscoveryK. MalikGlobal DevelopmentM. VehreschildChief Administration Offi cerH. Klusik*Product SupplyA. BeyGeneral CounselA. GüntherHuman ResourcesM. PickelCommunicationsN.N.Business Development& Licensing
Bayer MaterialScience
P. Thomas (photo)ChairmanA. Steiger-Bagel AdministrationT. Van Osselaer *Industrial OperationsG. HilkenPolycarbonatesP. VanackerPolyurethanesJ. WolffCoatings, Adhesives,Specialties
Bayer Business Services
Executive Board
D. Hartert (photo)ChairmanN. Fieseler *
Bayer Technology Services
D. Van Meirvenne (photo)Managing Director
Currenta
Executive Board
K. Schäfer (photo)ChairmanJ. Waldi *
BAYER AG (HOLDING COMPANY)
Group Management Board
Werner BaumannFinance
Marijn DekkersChairman
Richard Pott *Strategy & HumanResources
Wolfgang PlischkeTechnology, Innovation & Environment
Table of ConTenTs

BAYER ANNUAL REPORT 2010260 FURTHER INFORMATION
Glossary
Glossary
A
A1CNowTM User-friendly device for measuring the long-term blood glucose level A1c at doc-tors’ offi ces and diabetes out-reach clinics
Adalat® Drug product for the treatment of hypertension; active ingredient: nifedipine
Admire® Insecticide; active ingredient: imidacloprid; main applications: vegetables, rice, fruit, potatoes
Advantage® product line (Advantix® and other brands) Flea and tick control product for dogs and cats; active ingredient: imidacloprid
Alemtuzumab Humanized mono-clonal antibody, currently being tested in multiple sclerosis (ms)
Aleve® / Apronax® / Flanax® Anal-gesic; active ingredient: naproxen
Alion® Herbicide; active ingre-dient: indazifl am; main applica-tions: plantation crops, sugarcane
Alka-Seltzer® Drug product that binds excess gastric acid and reduces pain and fever
AlpharadinTM Novel alpha-emit-ting radiopharmaceutical cur-rently undergoing clinical devel-opment for the treatment of bone metastases; active ingredient: radium-223 chloride
Angeliq® Drug product for the treatment of menopause symp-toms; active ingredients: drospi-renone and estradiol
Antacids Drug products to treat heartburn and acid-related stomach complaints
Antra® Drug product that binds excess gastric acid; active in-gredient: omeprazol
Arize® Hybrid rice seed
Aspirin® World-famous anal-gesic; active ingredient: acetyl-salicylic acid
Aspirin® Cardio Drug product for protection against heart attack; active ingredient: acetyl-salicylic acid
Atlantis® Herbicide; active in-gredients: mesosulfuron-methyl, iodosulfuron-methyl-sodium, mefenpyr-diethyl; main applica-tions: wheat, triticale, rye
Avalox® / Avelox® Drug product for the treatment of respiratory tract infections; active ingredi-ent: moxifl oxacin
Aviator® Xpro® Fungicide; ac-tive ingredients: bixafen, pro-thioconazole; main application: cereals
B
Balance® Herbicide; active in-gredient: isoxafl utole; main ap-plications: corn, sugarcane
Basta® Herbicide; active ingre-dient: glufosinate-ammonium; main applications: plantation crops, potatoes, vegetables
Bayblend® Brand name for polymer blends based on poly-carbonate and acrylonitrile-butadiene-styrene
Baycox® Drug product to con-trol coccidiosis, a parasitic in-fectious disease in young live-stock; active ingredient: toltrazuril
Baycusan® C Brand name for polyurethane dispersions used in cosmetic formulations
Bayfol Refl exTM Technology of Bayer subsidiary Artifi cial Mus-cle, Inc. for touchscreens with tactile feedback
Baymedix® Brand name for in-novative biomaterials used in medical technology
Baytril® Drug for the treatment of severe veterinary infectious diseases; active ingredient: enrofl oxacin
Belt® Insecticide; active ingre-dient: fl ubendiamide; main ap-plications: vegetables, soybeans, cotton, rice
Bepanthen® Range of skin care and wound-healing products; active ingredient: dexpanthenol
Bepanthol® Range of care prod-ucts to treat dry, irritated skin; active ingredient: panthenol
Berocca® Dietary supplement containing b-group vitamins, vitamin c, calcium, magnesium and zinc
Betaferon® / Betaseron® Drug product for the treatment of multiple sclerosis; active ingre-dient: interferon beta-1b
Beyaz® Oral contraceptive in-cluding folate; active ingredi-ents: ethinyl estradiol, drospire-none, levomefolate calcium
Breeze® 2 Blood glucose meter for people with diabetes for simple, safe and rapid use at home or while traveling
C
Canesten® Antifungal medica-tion to treat skin infections; active ingredient: clotrimazole or bifonazole
Capital invested (ci) Capital in-vested comprises the assets on which the company must obtain a return by generating an appro-priate cash infl ow; in some cases the cost of ultimately reproduc-ing the assets must be earned in addition.
Cash fl ow return on investment (cfroi) The cash fl ow return on investment is the ratio of the gross cash fl ow to the average capital invested for the year and is thus a measure of the return on capital employed.
Cash value added (cva) This is the difference between the gross cash fl ow and gross cash fl ow hurdle. It is therefore the portion of the gross cash fl ow that ex-ceeds the return and reproduc-tion requirements. If cva is posi-tive, the investors’ return and reproduction requirements have been satisfi ed.
Cipro® / Ciprobay® / Ciproxin® /Baycip® Drug product for the treatment of infectious diseases; active ingredient: ciprofl oxacin
Confi dor® Insecticide; active in-gredient: imidacloprid; main ap-plications: vegetables, rice, fruit, potatoes
Connect® Insecticide; active in-gredients: imidacloprid, beta-cyfl uthrin; main applications: soybeans, corn, cotton
Contour® usb Blood glucose meter for people with diabetes, featuring usb capability and in-tegrated diabetes management software
Core earnings per share (core eps) Core earnings per share comprises adjusted core net in-come divided by the weighted average number of issued ordi-nary shares (taking into account the potential shares resulting from the conversion of the man-datory convertible bond). The adjusted core net income is computed from ebit plus amorti-zation and impairment losses on intangible assets and impair-ment losses on property, plant and equipment, plus / minus spe-cial items, minus non-operating result, plus / minus income taxes, plus / minus tax adjustments, minus income after taxes attrib-utable to non-controlling inter-ests, plus fi nancing expenses for the mandatory convertible bond net of tax effects. Core earnings per share are not de-fi ned in the International Finan-cial Reporting Standards. The company considers that this in-dicator gives readers a clearer picture of the results of opera-tions and ensures greater com-parability of data over time.
Corporate compliance Corpo-rate compliance comprises the observance of statutory and company regulations on lawful and responsible conduct by the company, its employees, and its management and supervisory bodies.
Table of ConTenTs
FURTHER INFORMATION 261
Glossary
BAYER ANNUAL REPORT 2010
Corporate governance Corpo-rate governance comprises the long-term management and oversight of the company in ac-cordance with the principles of responsibility and transparency. The German Corporate Gover-nance Code sets out basic prin-ciples for the management and oversight of listed companies.
Credit default swaps (cds) Credit default swaps are tradable insurance contracts used to hedge against the default of a borrower.
D
Decis® Insecticide; active in-gredient: deltamethrin; main applications: vegetables, fruit, cereals, canola
Delta cash value added (Delta cva) Delta cash value added is an indicator of the difference between the cash value added between two periods. A positive delta cva shows that a unit has created value or destroyed less value compared with the refer-ence period.
Desmodur® Brand name for various isocyanates
Desmopan® Brand name for thermoplastic polyurethanes
Desmophen® Brand name for various polyesters and polyols used in the manufacture of polyurethanes
Desonate® Topical glucocorti-coid for the treatment of atopic dermatitis; active ingredient: desonide
Drontal® product line Deworm-ers for dogs and cats; active in-gredients: combinations of pra-ziquantel, pyrantel and febantel
E
Earnings before interest and taxes (ebit) ebit comprises the operating profi t of a company before deduction of the non-operating result and taxes. In Bayer’s Annual Report, ebit is the operating result shown in the income statement.
Earnings before interest, tax-es, depreciation and amortiza-tion (ebitda) ebit plus amorti-zation and impairment losses on intangible assets and depre-ciation and impairment losses on property, plant and equipment, minus impairment loss rever-sals. ebitda, underlying ebitda and the underlying ebitda mar-gin are not defi ned in the Inter-national Financial Reporting Standards. The company con-siders ebitda before special items to be a more suitable indicator of operating performance since it is not affected by deprecia-tion, amortization, impairments or special items. By reporting this indicator, the company aims to give readers a clearer picture of the results of opera-tions and ensure greater com-parability of data over time.
Earnings per share (eps) eps is calculated by dividing Group net income by the weighted av-erage number of shares as de-fi ned in ias 33.
ebitda margin before special items The ebitda margin before special items is calculated by dividing ebitda before special items by sales.
EcoCommercial Building Inno-vative, globally aligned business model for a range of integrated energy and material solutions culminating in the zero emis-sions building. The model has been included in the Sustainable Buildings & Climate Initiative (sbci) of unep.
Emerion® Fungicide; active in-gredient: penfl ufen; main appli-cations: seed treatment in soy-beans, corn, cereals, canola, cotton, rice
Emesto® Fungicide; active ingre-dient: penfl ufen; main applica-tion: seed treatment in potatoes
emtn and multi-currency emtn program The Euro Me-dium Term Notes (emtn) pro-gram is a documentation plat-form that enables Bayer to raise capital by quickly issuing debt on the European capital market. Securities issued under this program may be listed in Lux-embourg or unlisted. Their ma-turities, currencies and condi-tions may vary considerably.
Extavia® Drug product for the treatment of multiple sclerosis; active ingredient: interferon beta-1b
F
Fandango® Fungicide; active ingredients: fl uoxastrobin and prothioconazole; main applica-tion: cereals
Ficam® Insecticide; active ingre-dient: bendiocarb; main applica-tion: professional non-agricultur-al pest control
Finale® Herbicide; active ingre-dient: glufosinate-ammonium; main applications: plantation crops, potatoes, vegetables
Flint® Fungicide; active ingredi-ent: trifl oxystrobin; main appli-cations: fruit, grapes, vegetables
Florbetaben Novel f18-labeled tracer substance currently un-dergoing clinical development for the detection of beta-amy-loid plaques in the brain using positron emission tomography (pet)
Folicur® Fungicide; active in-gredient: tebuconazole; main applications: cereals, soybeans, canola, peanuts, vegetables, fruit, grapes
G
Gadovist® Contrast agent for magnetic resonance imaging of the central nervous system that enables the number and loca-tion of lesions to be displayed in patients with brain metastases or multiple sclerosis; active in-gredient: gadobutrol
Gaucho® Insecticide; active in-gredient: imidacloprid; main applications: seed treatment for sugar beet, corn, cereals, cotton, canola
Global commercial paper pro-gram Commercial paper is a short-term unsecured debt in-strument normally issued at a discount and redeemed at nominal value. It is a fl exible way of obtaining short-term funding on the capital markets. Bayer’s commercial paper pro-gram allows the company to is-sue commercial paper on both the u.s. and European markets.
Glucobay® Drug product for the treatment of diabetes; active in-gredient: acarbose
Glucofacts® Deluxe Diabetes management software
Gross cash fl ow The gross cash fl ow comprises income after taxes, plus income taxes, plus non-operating result, minus in-come taxes paid or accrued, plus depreciation, amortization and impairment losses, minus impairment loss reversals, plus / minus changes in pension pro-visions, minus gains / plus losses on retirements of noncurrent assets, minus gains from the re-measurement of already held assets in step acquisitions. The change in pension provisions includes the elimination of non-cash components of the operat-ing result (ebit). It also contains benefi t payments during the year.
Gross cash fl ow hurdle The gcf hurdle is the gross cash fl ow that must be generated in light of the respective asset situation in order to satisfy investors’ re-turn and reproduction require-ments.
Table of ConTenTs

BAYER ANNUAL REPORT 2010262 FURTHER INFORMATION
Glossary
H
hdi Hexamethylene diisocya-nate, a raw material for polyure-thane coatings
Hybrid bond A hybrid bond is an equity mezzanine corporate bond, usually with either no or very long maturity. Due to its subordination, issuer bankrupt-cy can lead to a complete fi nan-cial loss.
I
Ignite® Herbicide; active ingre-dient: glufosinate ammonium; main applications: genetically modifi ed crops (cotton, canola, soybeans, corn)
Input® Fungicide; active ingre-dients: prothioconazole, spirox-amine; main application: cereals
Intense® Tomato seed
InVigor® Summer canola seed
Iopamiron® Non-ionic intravas-cular contrast agent for all com-mon x-ray analyses
K
Key performance indicators (kpi) Indicators used to evalu-ate the attainment of targets by the company
Kinzal® Drug product for the treatment of hypertension; ac-tive ingredient: telmisartan
K-Othrine® Insecticide; active ingredient: deltamethrin; main applications: insects that trans-mit malaria, sleeping sickness and Chagas’ disease
Kogenate® Drug product for the treatment of hemophilia; active ingredient: recombinant Factor viii
L
Levitra® Drug product for the treatment of erectile dysfunc-tion; active ingredient: vardenafi l
Liberty® Herbicide; active in-gredient: glufosinate-ammoni-um; main applications: geneti-cally modifi ed crops (cotton, canola, soybeans, corn)
LibertyLink® Plant trait: herbi-cide tolerance; main applica-tions: cotton, canola, soybeans, corn
Lifenet® Mosquito nets to pre-vent malaria based on a textile fi ber incorporating the active ingredient deltamethrin
Life sciences Field of activities comprising particularly health care and nutrition; at Bayer this refers to the activities of the HealthCare and CropScience subgroups.
Luna® Fungicide; active ingre-dient: fl uopyram; main applica-tions: wine and table grapes, fruit, vegetables
M
Magnevist® Contrast agent for diagnosis in the central nervous system and body; active ingre-dient: dimeglumine gadopen-tetate
Makroblend® Brand name for polymer blends made from polycarbonate and polybutylene terephthalate or polyethylene terephthalate
Makrofol® Brand name for fi lms made from Makrolon®
Makrolon® Brand name for polycarbonate
mdi Diphenylmethane diisocya-nate, an important raw material for rigid polyurethane foam used in thermal insulation
Merit® Insecticide; active ingre-dient: imidacloprid; main appli-cation: insecticide for non-agri-cultural grass lawns
Mirena® Intrauterine contracep-tive; active ingredient: levonorg-estrel
N
Nativo® Fungicide; active ingre-dients: trifl oxystrobin, tebucon-azole; main applications: cereals, soybeans, corn, rice
NataziaTM Oral contraceptive whose estrogen component is based on estradiol; active in-gredients: estradiol valerate, dienogest
NatriaTM Product line from Bay-er’s range of garden products for consumers; based on natural or nature-derived active ingre-dients
NeoBenz® Micro Drug product for the treatment of acne: active ingredient: benzoyl peroxide
Net cash fl ow The net cash fl ow is the cash fl ow from opera-ting activities as defi ned in ias 7.
Nexavar® Cancer drug for the treatment of patients with hepa-tocellular carcinoma or ad-vanced renal cell carcinoma; active ingredient: sorafenib
O
One A Day® Multivitamin pro-duct
Over the counter (otc) The trading of securities outside of an organized exchange. otc transactions are still subject to the statutory provisions on se-curities trading. In the Health-Care business, otc refers to non-prescription medication.
P
Poncho® Insecticide; active in-gredient: clothianidin; main ap-plications: seed treatment for corn, canola, sugar beet, cereals
ppa Purchase price allocation
Price / cash fl ow ratio The price / cash fl ow ratio is the ratio of the share price to gross cash fl ow per share. It shows how long it would take for the com-pany’s cash fl ow to cover the share price.
Price / eps This is the ratio of the current share price to earn-ings per share. A high price / eps ratio indicates that the mar-ket assigns a high value to the stock in the expectation of fu-ture earnings growth.
Pritor® Drug product for the treatment of hypertension; ac-tive ingredient: telmisartan
Proline® Fungicide; active in-gredient: prothioconazole; main applications: cereals, canola
Prosaro® Fungicide; active in-gredients: prothioconazole, tebu-conazole; main applications: cereals, canola
Puma® Herbicide; active ingre-dient: fenoxaprop-p-ethyl; main applications: cereals, rice, soy-beans
Q
Qlaira® Oral contraceptive whose estrogen component is based on estradiol; active ingredients: es-tradiol valerate, dienogest
R
Raxil® Fungicide; active ingre-dient: tebuconazole; main ap-plications: seed treatment for wheat and barley
Redoxon® Vitamin product con-taining vitamin c and zinc
Regorafenib Novel oral multi-kinase inhibitor for the treat-ment of gastrointestinal stromal tumors (gist)
Rely® Herbicide; active ingredi-ent: glufosinate-ammonium; main applications: plantation crops, potatoes
Rennie® Medicine to treat heart-burn and acid-related stomach disorders; active ingredients: calcium carbonate and magne-sium carbonate
Table of ConTenTs

BAYER ANNUAL REPORT 2010 FURTHER INFORMATION 263
Glossary
Riociguat Active ingredient from a new class of vasodilative sub-stances; stimulates the enzyme so-luble guanylate cyclase and is currently being tested in a Phase iii program to determine its effi cacy and safety in thetreatment of chronic thrombo-embolic pulmonary hyperten-sion and pulmonary arterial hy-pertension
Routine® Fungicide; active in-gredient: isotianil; main applica-tion: rice
S
SafyralTM Oral contraceptive including folate; active ingre-dients: ethinyl estradiol, drospi-renone, levomefolate calcium
Soberan® Herbicide; active in-gredients: tembotrione and iso-xadifen; main application: corn
Specticle® Herbicide; active ingredient: indazifl am; main application: lawncare for pro-fessional users
Sphere® / Sphere® Max Fungici-de; active ingredients: trifl o-xystrobin and cyproconazole; main applications: soybeans, cereals, sugar beet, coffee
Squeeze-out Transfer of the shares held by minority stock-holders in a stock corporation to the majority stockholder in return for a compensation pay-ment. In Germany, a majority stockholder with an interest of 95 percent can request a squeeze-out.
staxynTM New formulation of the drug Levitra® for the treat-ment of erectile dysfunction; active ingredient: vardenafi l
Stratego® Fungicide; active in-gredients: trifl oxystrobin, propi-conazole; main applications: corn, soybeans, cereals, rice
Supradyn® Vitamin and mineral supplement with trace elements
Syndicated credit facility Cre-dit line agreed with a group of banks. Generally used for ex-tensive fi nancing requirements, such as when making an acqui-sition, to increase the available liquidity reserves or as security for the issuance of debt instru-ments. The credit facility can be utilized and repaid fl exibly, ei-ther in full or in portions, during its term.
T
tdi Toluene diisocyanate, an important raw material for poly-urethane fl exible foam used in upholstery, mattresses and car seats
Temprid® Insecticide; active ingredients: imidacloprid, beta-fl uthrin; main application: pro-fessional non-agricultural pest control
U
Ultravist® Contrast agent for x-ray examinations including computed tomography; active ingredient: iopromide
V
Valette® Plus Oral contracep-tive including folate (vitamin b); active ingredients: dienogest, ethinyl estradiol, levomefolate calcium
vegf Trap-Eye vegf (vascular endothelial growth factor) is a natural growth factor that is also involved in the pathologi-cal formation of new blood ves-sels in the eyes, which leads to wet age-related macular degen-eration (amd). vegf Trap-Eye specifi cally inhibits this process and other growth factors and is currently undergoing Phase iii clinical testing.
VotivoTM Biological agent based on Bacillus fi rmus to protect against nematodes, main appli-cations: seed treatment in com-bination with Poncho® in corn, soybeans and cotton
Vulkollan® Brand name for a high-performance polyurethane elastomer
W
Weighted average cost of capi-tal (wacc) The weighted aver-age cost of capital (wacc) repre-sents the return required by investors on the capital invested in the company. It is computed as a weighted average of the cost of equity and debt. The cost of equity correlates with the return expectations of stockholders while the cost of debt comprises the conditions obtained by the company for its long-term fi nancing.
World-scale production facility Extremely large production plant whose capacity allows the realization of substantial econo-mies of scale.
X
Xarelto® Direct Factor Xa in-hibitor in tablet form. The active ingredient rivaroxaban is used to prevent and treat thrombosis in a wide range of indications and is registered in the Euro-pean Union and other regions as Xarelto® for the prophylaxis of venous thromboembolism (vte) in adults following elective hip and knee replacement sur-gery.
Xpro® Fungicide; active ingre-dients: bixafen, prothiocon-azole; main application: cereals
Y
yaz® / Yasmin® / Yasminelle® Oral contraceptives; active in-gredients: ethinyl estradiol and drospirenone
Z
Zetia® Cholesterol-lowering drug from Merck & Co., co-mar-keted by Bayer in Japan; active ingredient: ezetimib
INTERNET
For explanations of further specialist terminology, go to: www.investor.bayer.com > stock> glossary
Table of ConTenTs
BAYER ANNUAL REPORT 2010264 FURTHER INFORMATION
Index
Index
A
Accounting policies andvaluation principles 153
Accounting standards 150
Acquisition accounting 166
Acquisitions 183
Annual Stockholders’ Meeting Back fl ap
Asset position (Bayer AG)84
Asset structure (Bayer Group) 81
Audit Committee 11, 12, 90
Audit fees 250
Auditor 13, 250
Auditor’s report 254
B
Bayer Business Services Inside front fl ap, 49, 50
Bayer Innovation GmbH 110
Bayer stock data 14, 17
Bayer stock programs 95, 113
Bayer Technology Services Inside front fl ap, 49, 50, 110
Board of Management8, 89, 251, 258
Bonds228
Business strategy131
C
Capital expenditures78, 138, 196
Capital structure81
Changes in equity 82, 146, 212
Commitment to sustainability 266
Commodity price risks 128, 131
Companies consolidated 172
Compensation of the Board of Management 95, 251
Compensation of the Supervisory Board99, 251
Compliance Offi cers 92
Consolidated fi nancial statements 13, 140
Consolidated statements of cash fl ows 145, 248
Consolidated statements of comprehensive income143
Consolidation 153
Contact Inside back fl ap
Contingencies 240
Core earnings per share 75
Corporate citizen 118
Corporate compliance 92
Corporate governance 12, 88
Corporate Governance Code 12, 88
Corporate structure Inside front fl ap, 49
Critical accounting estimates 153
CropScience Inside front fl ap, 50, 52, 54, 56, 64, 77, 106, 133, 137, 139, 245
Currency risk 130
Currenta Inside front fl ap, 49, 50, 231
D
Derivatives
161, 238
Distribution 55, 187
Divestitures 78, 186
Dividend 18, 212
E
Earnings performance(Bayer AG)83
Earnings performance(Bayer Group)72
Earnings per share 17, 195
Economic environment 51
Economic outlook 136
Equity method investments 206
Employees 112, 189
Environmental protection 116, 223
Equity 210
Events after the reportingperiod 121
Exchange rate risk 130
Exchange rates156
F
Fair value 239
Financial calendar Back fl ap
Financial instruments 231
Financial liabilities 166, 227
Financial position (Bayer AG)84
Financial risks 128
Financial strategy 136
Five-year fi nancial summaryInside back fl ap
Future perspectives 122
G
Glossary 260
Goodwill 158, 196
Governance bodies 256
Gross cash fl owInside front and back fl aps,47, 76, 145, 148, 248
Group structure Inside front fl ap, 50
H
HealthCareInside front fl ap, 50, 51, 53, 55, 58, 77, 101, 132, 137, 139, 241
Hedge accounting 130, 131, 151, 238
Highlights 38
Human Resources Committee 11, 12, 90
Table of ConTenTs
BAYER ANNUAL REPORT 2010 FURTHER INFORMATION 265
Index
I
Impairment158
Impairment testing 167
Income (loss) attributable to non-controlling interest 195
Income (loss) from investments in affi liated companies 190
Income statements (Bayer AG) 83
Income statements (Bayer Group)72, 142, 187
Income taxes72, 192
Indices 17, 266
Intangible assets 158, 196, 199
Interest expense191
Interest rate risk 130
Inventories162, 208
Investor information14
Investor relations 19
K
Key data by segment and region 72
Key data by subgroup Inside front fl ap, 49, 51, 58
Key performance indicators 116
L
Leasing159, 207
Legal risks 125, 241
Liquidity (Bayer Group) 78
M
Management report (Combined Management Report of Bayer AG and the Bayer Group) 44
Management‘s statementof responsibility for fi nancial reporting 252
Markets55
MaterialScience Inside front fl ap, 50, 52, 54, 57, 69, 77, 108, 134, 138, 139, 247
Mission statement111, 131
N
Net cash fl ow Inside front fl ap,78, 145, 148, 248
Net debt 80
Net income Inside front fl ap, 46, 48, 142
Nominations Committee 11, 12, 91
Non-operating result 73, 190
Notes to the consolidated fi nancial statements 148
O
Opportunities 122, 124
Organization chart 259
Other fi nancial assets207
Other fi nancial commitments240
Other non-operating income and expenses191
Other operating expenses188
Other operating income156, 188
Other receivables166, 209
P
Performance by subgroup, segment and region 58
Personnel expenses 113, 189
Presidial Committee 11, 12, 90
Procurement 53
Procurement market risk 127
Production 53
Products55
Property, plant and equipment 79, 158, 203
Proposal for distribution of the profi t84
Provisions164, 222
Provisions for pensions and other post-employment benefi ts163, 213
R
R&D expenses 101, 157, 187
Recognition and valuation principles 153
Regions 72, 148
Research and development 101
Responsibility statement253
Responsible Care 266
Restructuring charges165, 223
Risk management 122
Risk report122
S
Salaries (see Compensation)
Sales 46, 48, 58
Scope of consolidation 172
Segment reporting 148, 169
Segments 49, 72, 148, 149, 169
Social commitment 118
Statements of fi nancial position46, 78, 84, 144, 196
Strategy 131
Supervisory Board 10, 90, 251, 256
Sustainability 111
Sustainable development 111, 266
Sustainable investment 18
T
Takeover-relevant information85
Taxes 162, 192, 223
Trade accounts payable 230
Trade accounts receivable 208
U
UNEP 119, 266
V
Value management 76
265Table of ConTenTs
BAYER ANNUAL REPORT 2010266 GLOBAL COMMITMENT TO SUSTAINABILITY
Global Commitment to Sustainability
Sustainability at Bayer is an integral part of a corporate policy geared to long-term success and in-novative solutions. This commitment is also evidenced by the company’s participation in numerous initiatives and projects around the world. Logos relating to a selection of these activities appear in the left margin in the order in which the respective activities are described below.
Bayer has long practiced the concept of Responsible Care. To achieve continuous improvement in the areas of health, safety and environment, the company has been guided by the principles of the voluntary Responsible Care initiative of the chemical and pharmaceutical industry since 1994 and by the Responsible Care Global Charter, which was last revised in 2006.
A member of the World Business Council for Sustainable Development since 1997, Bayer was a co-founder of German industry’s sustainable development forum “econsense” in 2000.
Bayer is a founding member of the United Nations Global Compact (ungc) initiative, also estab-lished in 2000, actively promoting its 10 principles through its support for the lead, “Caring for Climate” and “ceo Water Mandate” initiatives and numerous projects. In Brazil, for example, Bayer supports the Abrinq Foundation in its efforts to combat child labor, and in India the com-pany participates in the “Learning for Life” initiative for the protection and advancement of chil-dren during their education.
Bayer’s collaboration with the United Nations Environment Programme (unep) has been in place since 2004 and has set standards in public-private partnerships. Among the long-standing joint activities is the “Bayer Young Environmental Envoy” program, in which young people from 18 countries on three continents participate.
In 2009 the company joined the unep Climate Neutral Network, which promotes low-co2-emis-sion industrial and social structures. To help reduce greenhouse gas emissions from relevant buildings worldwide, Bayer is also supporting the Sustainable Buildings and Climate Initiative of the u.n. Environment Programme (unep sbci) as part of its EcoCommercial Building Program.
The company places maximum importance on climate protection. Bayer has been included for six consecutive years in the Carbon Disclosure Leadership Index (cdli) published by the Carbon Disclosure Project (cdp), an organization run on behalf of institutional investors, and in 2010 was also included in the cdp’s new Carbon Performance Leadership Index (cpli).
For more than 50 years, Bayer has supported family planning programs in over 130 countries, focusing on cooperation with private and public relief organizations such as the United Nations Population Fund (unfpa). In the fi ght against tuberculosis, Bayer is cooperating with the Global Alliance for tb Drug Development, a u.s. non-profi t organization, with the aim of developing a new drug that reduces treatment times. As part of its Sustainability Program, Bayer offers con-traceptives at reduced prices in developing countries. Activities in the area of family planning also include educating teenagers on sexuality and health issues. In Uganda, for example, Bayer cooperates with the German Foundation for World Population (dsw) in this fi eld.
Bayer is represented in major stock indices and investment funds that focus on companies pursuing responsible and sustainable corporate strategies. For example, Bayer is listed in the Dow Jones Sustainability Indices Europe and World, the ftse4Good index series and the Advanced Sustainable Performance Indices (aspi) Eurozone. It also qualifi ed for inclusion in the Storebrand sri Funds as a “Best in Class” company.
Our sustainability reporting is based on the guidelines of the Global Reporting Initiative (gri), which Bayer supports as an organizational stakeholder.
Table of ConTenTs
The Bayer Group
Bayer HealthCare
Bayer HealthCare is among the world’s foremost innovators in the eld of pharmaceutical and medical products. This subgroup’s mission
is to research, develop, manufacture and market innovative products that improve the health of people and animals throughout the world. Read more on page 58ff.
Bayer CropScience
Bayer CropScience, with its highly effective products, pioneering innovations and keen customer focus, holds global leadership positions in crop protection and non-agricultural pest control. The company also has major activities in seeds and plant traits. Read more on page 64ff.
Bayer MaterialScience
Bayer MaterialScience is a renowned supplier of high-tech polymers and develops innovative solutions for a broad range of applications relevant to everyday life. Products holding leading positions on the world market account for a large proportion of its sales. Read more on page 69ff.
Bayer Business Services is the Bayer Group’s global competence center for it and business services. Its portfolio is focused on services in the core areas of it infrastructure and applications, procurement and logistics, human resources and management services, and nance and accounting.
Bayer Technology Services, the global technological backbone and a major innovation driver of the Bayer Group, is engaged in process development and in process and plant engineering, construction and optimization.
Currenta offers services for the chemical industry including utility supply, waste management, infrastructure, safety, security, analytics and vocational training.
SERVICE COMPANIES
Bayer
Bayer AG de nes common values, goals and strategies for the entire Group. The subgroups and service companies operate independently, led by the management holding company. The Corporate Center supports the Group Management Board in its task of strategic leadership.
000_E_17_Umschlag_innen.indd 1 26.02.11 18:46
Table of ConTenTs
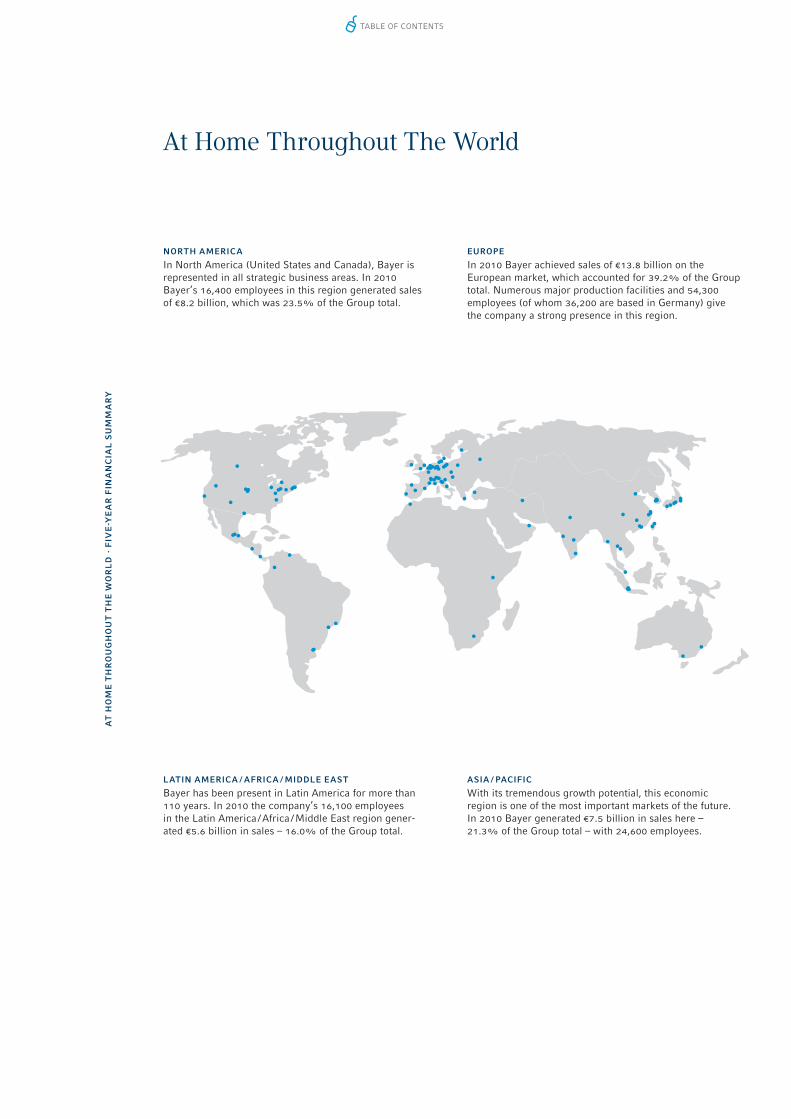
NORTH AMERICA
In North America (United States and Canada), Bayer is represented in all strategic business areas. In 2010 Bayer’s 16,400 employees in this region generated sales of €8.2 billion, which was 23.5% of the Group total.
AT
HO
ME
TH
RO
UG
HO
UT
TH
E W
OR
LD
· F
IVE
-YE
AR
FIN
AN
CIA
L S
UM
MA
RY
At Home Throughout The World
EUROPE
In 2010 Bayer achieved sales of €13.8 billion on the European market, which accounted for 39.2% of the Group total. Numerous major production facilities and 54,300 employees (of whom 36,200 are based in Germany) give the company a strong presence in this region.
LATIN AMERICA / AFRICA / MIDDLE EAST
Bayer has been present in Latin America for more than 110 years. In 2010 the company’s 16,100 employees in the Latin America / Africa / Middle East region gener-ated €5.6 billion in sales – 16.0% of the Group total.
ASIA / PACIFIC
With its tremendous growth potential, this economic region is one of the most important markets of the future. In 2010 Bayer generated €7.5 billion in sales here – 21.3% of the Group total – with 24,600 employees.
000_E_17_Umschlag_innen.indd 1 26.02.11 18:46
Table of ConTenTs

Five-Year Financial Summary
[Table 1.2]
2006 2007 2008 2009 2010
€ million € million € million € million € million
Bayer GroupSales 28,956 32,385 32,918 31,168 35,088
Sales outside Germany 84.4% 85.1% 85.4% 86.7% 87.4%
EBIT (operating result) 2,762 3,154 3,544 3,006 2,730
EBIT before special items1 3,479 4,287 4,342 3,772 4,452
EBITDA1 4,675 5,866 6,266 5,815 6,286
EBITDA before special items1 5,584 6,777 6,931 6,472 7,101
Income before income taxes 1,980 2,234 2,356 1,870 1,721
Income after taxes 1,695 4,716 1,724 1,359 1,310
Earnings per share (€)2 2.22 5.84 2.22 1.70 1.57
Noncurrent assets 35,897 34,712 35,351 34,049 33,188
of which goodwill and other intangible assets 24,034 22,770 22,598 21,546 20,163
of which property, plant and equipment 8,867 8,819 9,492 9,409 9,835
Current assets 17,069 16,582 17,152 16,993 18,318
Inventories 6,153 6,217 6,681 6,091 6,104
Receivables and other current assets 8,001 7,834 8,377 8,177 9,374
Cash and cash equivalents 2,915 2,531 2,094 2,725 2,840
Financial liabilities 19,801 14,417 16,870 12,949 11,833
Noncurrent 14,723 13,081 10,614 11,460 9,944
Current 5,078 1,336 6,256 1,489 1,889
Interest expense – net (728) (701) (702) (548) (499)
Return on equity 14.1% 31.8% 10.4% 7.7% 6.9%
Gross cash ow3 3,913 4,784 5,295 4,658 4,771
Capital expenditures (total) 1,939 1,905 1,982 1,669 1,621
Depreciation and amortization 2,086 2,478 2,570 2,660 2,571
Personnel expenses (including pension expenses) 6,630 7,571 7,491 7,776 8,099
Number of employees4 (Dec. 31) 106,000 106,200 108,600 111,000 111,400
Research and development expenses 2,297 2,578 2,653 2,746 3,053
Equity including non-controlling interest (total) 12,851 16,821 16,340 18,951 18,896
Capital stock 1,957 1,957 1,957 2,117 2,117
Reserves 10,894 14,864 14,383 16,834 16,779
Net income 1,683 4,711 1,719 1,359 1,301
Non-controlling interest 84 87 77 54 63
Liabilities (total) 43,040 34,557 36,171 32,091 32,610
Total assets 55,891 51,378 52,511 51,042 51,506
Equity ratio 23.0% 32.7% 31.1% 37.1% 36.7%
Bayer AGNet income 1,250 1,928 1,161 2,226 1,245
Allocation to retained earnings 486 896 91 1,068 5
Total dividend payment 764 1,032 1,070 1,158 1,240
Dividend per share (€) 1.00 1.35 1.40 1.40 1.50
2009 gures restated, gures for 2006-2008 as last reported1 For de nition see Combined Management Report, Chapter 4.2 “Calculation of EBIT(DA) Before Special Items.”2 Earnings per share as de ned in IAS 33: adjusted net income divided by the average number of shares. For details see Note [16] to the consolidated
nancial statements. 3 For de nition see Combined Management Report, Chapter 4.5 “Liquidity and Capital Expenditures of the Bayer Group.”4 Full-time equivalents
000_E_17_Umschlag_innen.indd 1 26.02.11 18:46
Table of ConTenTs
Financial Calendar
Q1 2011 Interim Report April 28, 2011
Annual Stockholders’ Meeting 2011 April 29, 2011
Payment of Dividend MAy 2, 2011
Q2 2011 Interim Report July 28, 2011
Q3 2011 Interim Report OctOber 27, 2011
2011 Annual Report FebruAry 28, 2012
Q1 2012 Interim Report April 26, 2012
Annual Stockholders’ Meeting 2012 April 27, 2012
MASTHEAD
PublisherBayer AG, 51368 Leverkusen, Germany
EditorJörg Schäfer, phone +49 214 30 39136email: [email protected]
English editionCurrenta GmbH & Co. OHGLanguage Service
Investor RelationsPeter Dahlhoff, phone +49 214 30 33022email: [email protected]
Date of publicationMonday, February 28, 2011
Bayer on the Internetwww.bayer.com
issn 0343 / 1975
Forward-Looking Statements:This Annual Report contains forward-looking statements based on current assumptions and forecasts made by Bayer Group or subgroup management. Various known and unknown risks, uncertainties and other factors could lead to materialdifferencesbetweentheactualfinancialposition,developmentorperformanceofthecompanyandtheestimatesgiven here. These factors include those discussed in Bayer’s public reports, which are available on the Bayer website at www.bayer.com. The company assumes no liability whatsoever to update these forward-looking statements or to conform them to future events or developments.
Important Information: The names “Bayer Schering Pharma” or “Schering” as used in this publication always refer to Bayer Schering Pharma AG, Berlin, Germany, or its predecessor, Schering AG, Berlin, Germany, respectively.
Legal Notice:The product names designated with ® are not necessarily registered in all jurisdictions but are protected as trademarks in at least the principal countries in which the respective products are currently distributed.
Table of ConTenTs