bayesian data fusion of multiview synthetic aperture sonar
TRANSCRIPT

IEEE TRANSACTIONS ON IMAGE PROCESSING, VOL. 18, NO. 6, JUNE 2009 1239
Bayesian Data Fusion of Multiview SyntheticAperture Sonar Imagery for Seabed Classification
David P. Williams
Abstract—A Bayesian data fusion approach for seabed classifi-cation using multiview synthetic aperture sonar (SAS) imagery isproposed. The principled approach exploits all available informa-tion and results in probabilistic predictions. Each data point, corre-sponding to a unique 10 m 10 m area of seabed, is represented bya vector of wavelet-based features. For each seabed type, the dis-tribution of these features is then modeled by a unique Gaussianmixture model. When multiple views of the same data point (i.e.,area of seabed) are available, the views are combined via a jointlikelihood calculation. The end result of this Bayesian formulationis the posterior probability that a given data point belongs to eachseabed type. It is also shown how these posterior probabilities canbe exploited in a form of entropy-based active-learning to deter-mine the most useful additional data to acquire. Experimental re-sults of the proposed multiview classification framework are shownon a large data set of real, multiview SAS imagery spanning morethan 2 km� of seabed.
Index Terms—Bayesian data fusion, Gaussian mixture models(GMMs), multiview data, seabed classification, seabed segmenta-tion, synthetic aperture sonar (SAS).
I. INTRODUCTION
S EABED classification is the process by which one seg-ments a typically large area of seabed into different regions
based on the characteristics of the seabed. For example, an areamay be segmented into flat seabed, rocky seabed, and seabedcharacterized by sand ripples. The need to perform this seabedclassification in an automated manner with no human interven-tion is motivated by the desire to conduct fully autonomous minecountermeasures (MCM) missions with an autonomous under-water vehicle (AUV).
Most MCM AUV missions are either clearance missions orroute-finding missions. In a clearance mission, the objective isto detect, classify, and clear mines from an area. Route-findingmissions, in contrast, attempt to find low-risk routes that can beused safely by subsequent assets. In both scenarios, establishingthe seabed type in the area is important because mine detectionand classification performance is a strong function of seabedtype [1]. For example, because attempting to detect a mine in a
Manuscript received October 13, 2008; revised February 06, 2008. First pub-lished May 02, 2009; current version published May 13, 2009. The associateeditor coordinating the review of this manuscript and approving it for publica-tion was Prof. Scott T. Acton.
The author is with the NATO Undersea Research Centre, 19126 La Spezia(SP), Italy (e-mail: [email protected]).
Color versions of one or more of the figures in this paper are available onlineat http://ieeexplore.ieee.org.
Digital Object Identifier 10.1109/TIP.2009.2017161
boulder field is prohibitively difficult, routes that pass throughrocky areas of seabed would be deemed to be unfeasible.
A fundamental justification for employing intelligent au-tonomy systems for MCM missions is the assumption thatthe classification of an area of seabed—or of an object—willimprove as the number of views of it increases. For instance, ifa mine is observed from one orientation, it may be difficult todistinguish it from a rock; however, viewing it from a secondorientation may reveal previously obscured characteristics thatdifferentiate it from a rock.
The use of AUVs that can adapt their routes is closely re-lated to the topic of active learning. Generally speaking, ac-tive learning is concerned with intelligently selecting whichadditional data to acquire in order to most improve classifica-tion [2]. Active learning techniques have been applied to ma-chine learning problems, but never in the context of seabedclassification.
A. Previous Seabed Classification Approaches and Motivationfor Proposed Approach
The earliest approaches to the seabed classification problemfocused on devising features that would be able to discriminatethe various seabed types, but considered only single images[3]–[7]. Later work [8]–[10] began to address the problemunder the assumption that the seabed classification was to beperformed on multiple, partially overlapping images. Morespecifically, those approaches focused on the manner in whichseparate classification decisions made from individual imageswould be fused into a single unified decision. That is, a standardsingle-view seabed classification approach was adopted, withfusion of the classification decisions performed subsequently.
Because a principled foundational framework for directly ad-dressing the multi-view case was not used, various ad hoc com-promises were needed to obtain the final classification. Thistype of fusion approach then forced the final classifications tobe hard decisions rather than probabilistic predictions. How-ever, the classification of seabed type is rarely a simple clear-cutdecision.
An example that illustrates this fact (and which highlights theadvantage of probabilistic predictions) is shown in Fig. 1.
This figure shows a 10 m 10 m area of seabed—which cor-responds to a single data point in this paper—that contains char-acteristics of both flat and rippled seabeds. In cases such as this,forcing a hard decision regarding seabed type when one is notjustified ignores the full complexity of the seabed classificationproblem.
Moreover, because the seabed type predictions of the pre-vious approaches were hard decisions rather than probabilistic
1057-7149/$25.00 © 2009 IEEE

1240 IEEE TRANSACTIONS ON IMAGE PROCESSING, VOL. 18, NO. 6, JUNE 2009
Fig. 1. Example synthetic aperture sonar image (data point) for which a harddecision regarding seabed type is inappropriate.
in nature, the benefit of viewing an area of seabed multiple timeswas not quantifiable. That is, there would be no way (during theexperiment) to ascertain whether viewing an area of seabed onetime was any more beneficial than viewing it two times; in eithercase, the seabed prediction would be a simple hard decision.
In contrast, with probabilistic predictions, one can quantifythe amount by which the seabed-type prediction could improveif an additional view was obtained. In this manner, when facedwith limited resources, one can establish which areas of theseabed would most greatly benefit from additional views, andwhich areas are already classified to a sufficiently high level ofconfidence from a single view.
Finally, the use of a Bayesian classification approach wouldprovide a principled way to leverage prior knowledge possessedabout the seabed classification task with observations (i.e., data).
Because of these reasons, it is imperative that a principledBayesian multiview seabed classification algorithm that resultsin probabilistic predictions be employed. The proposed algo-rithm exploits these considerations in its formulation.
B. Contribution of Paper
The seabed classification approach proposed in this paperis a principled Bayesian data fusion method that exploits allavailable information. Each data point—corresponding to a10 m 10 m area of seabed in this paper—is represented bya vector of wavelet-based features. For each seabed type, thedistribution of these features is then modeled by a uniqueGaussian mixture model. When multiple views of the samedata point (i.e., area of seabed) are available, the views arecombined via a joint likelihood calculation. The end result ofthis Bayesian formulation for a given data point is the posteriorprobability that it belongs to each seabed type. These posteriorprobabilities can then be used both to classify the seabedprobabilistically, and also to guide active learning.
The main contribution of this paper is the development of afully Bayesian framework that fuses data from multiple viewsin a principled manner to perform seabed classification. Impor-tantly, the probabilistic nature of the classification predictionsalso allows an appealingly intuitive approach to perform activelearning. Specifically, the uncertainty of the classification pre-dictions, as quantified by the entropy, is used to determine theareas of seabed for which the acquisition of additional viewswould most improve classification confidence.
Whereas all previous seabed classification work has consid-ered simple side-scan sonar imagery, this paper is the first toaddress the task when using high-resolution synthetic aperture
sonar (SAS) imagery. Furthermore, the idea of performing ac-tive learning to decide which additional data to collect has neverbefore been broached in this context of seabed classification.
C. Structure of Paper
The remainder of this paper is organized in the followingmanner. In Section II, Gaussian mixture models (GMMs) arediscussed. The manner in which these GMMs are employed toperform Bayesian multiview data fusion is explained in Sec-tion III. The application of active learning to the multiview clas-sification problem is discussed in Section IV. Section V de-scribes the real, multiview, SAS imagery data set on which theproposed seabed classification approach is applied. The experi-mental set-up is outlined in Section VI, with classification andactive-learning results shown in Section VII. The proposed ap-proach is discussed in Section VIII before concluding remarksare made in Section IX.
II. GAUSSIAN MIXTURE MODELS (GMMS)
It is well-known that a Gaussian mixture model (GMM) canaccurately model an arbitrary continuous distribution. More-over, this model estimation can be performed efficiently usingthe expectation-maximization (EM) algorithm [11] or the vari-ational Bayesian EM (VB-EM) algorithm [12]. Whereas the re-sult of the EM algorithm will be point estimates for the param-eters (i.e., the mixing proportions, means, and covariances), theresult of the VB-EM algorithm will be full distributions of theparameters. This fact allows the GMM learned via the VB-EMalgorithm to be accurate even when faced with limited data.
With an EM approach, one must specify the number of mix-ture components a priori. In contrast, the VB-EM approach willautomatically infer the appropriate number of mixture compo-nents that are represented by the data [13], [14]. Whereas thestandard EM algorithm will always favor increasingly complexmodels (i.e., more mixture components), the variational formu-lation automatically penalizes overly complex models. For thesereasons, we choose to employ the VB-EM algorithm for esti-mating the requisite GMMs in this paper.
In particular, the distribution of features of each seabed typeis modeled with its own unique GMM. Therefore, for seabedtypes, separate GMMs will be learned.
This supervised approach of course requires that labeledtraining data is available to perform the estimation. One alterna-tive approach would instead learn a single GMM for all seabedtypes jointly. In this case, no labeled training data would be re-quired. However, with this unsupervised approach, each seabedtype would most likely be represented by multiple Gaussiansof the GMM (because a single Gaussian would not be able tocapture the full variability and complexity of a given seabedtype); human intervention would then be required to establishthe correspondence between seabed types and Gaussians. In thesupervised approach we employ, the mapping from Gaussiansto seabed types is straightforward because each seabed type isassociated with its own GMM; hence, no human assistance isrequired.
In this paper, we model the distribution of the -dimensionalfeature vector, , extracted from an area of seabed—conditioned
WILLIAMS: BAYESIAN DATA FUSION OF MULTIVIEW SYNTHETIC APERTURE SONAR IMAGERY 1241
on each seabed type—with a GMM. The GMM correspondingto seabed type is
(1)
(2)
where , and are the mixing proportion, mean, and co-variance, respectively, of the th Gaussian of the -compo-nent GMM corresponding to seabed type . The non-negativemixing proportions satisfy .
III. BAYESIAN MULTIVIEW DATA FUSION
A. General Case
When a data point (i.e., area of seabed), , is seen a singletime, the likelihood that the data point is seabed type is givenby the GMM corresponding to
(3)
By Bayes’ rule, the posterior probability that the data point isseabed type is then
(4)
where is the prior probability that a data point is seabedtype out of possible seabed types. If no a priori knowledgeis available, uninformative (i.e., equal) priors can be specifiedfor each seabed type. The denominator in (4) is simply a nor-malizing factor, called the evidence.
Now suppose a data point (i.e., area of seabed) is seen twotimes, with these two views represented by and . Assumingthe views are independent, the likelihood that the data point isseabed type becomes
(5)
(6)
The posterior probability that the data point is seabed type isthen simply
(7)
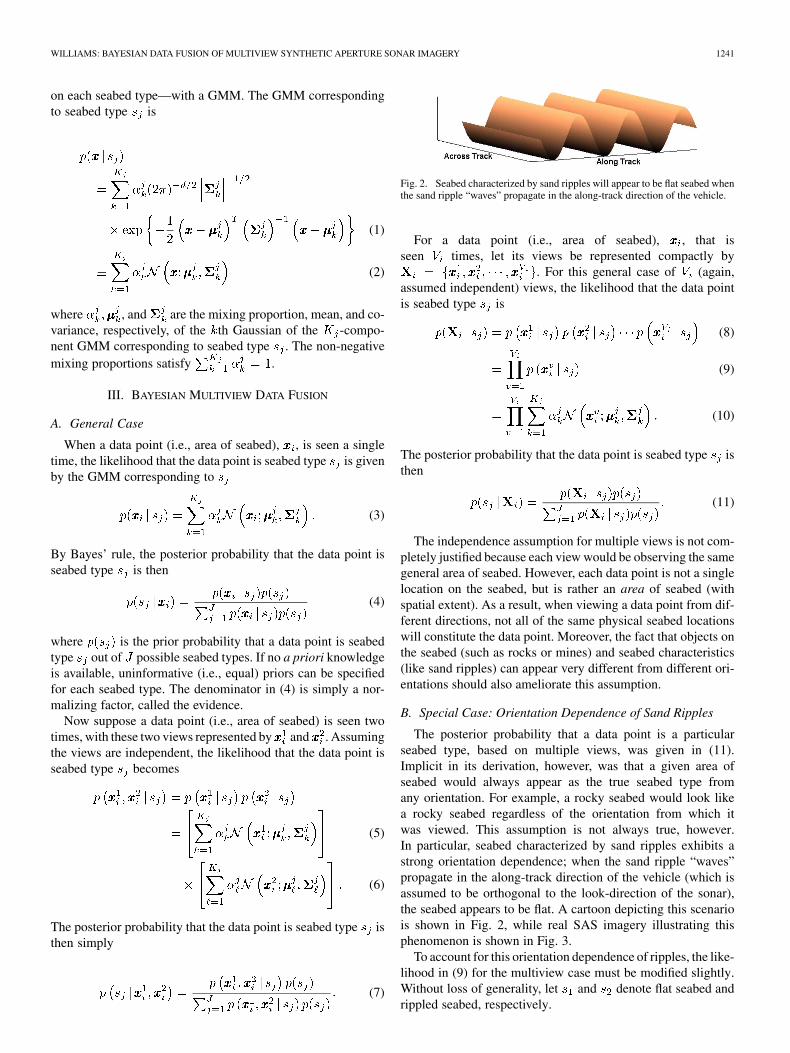
Fig. 2. Seabed characterized by sand ripples will appear to be flat seabed whenthe sand ripple “waves” propagate in the along-track direction of the vehicle.
For a data point (i.e., area of seabed), , that isseen times, let its views be represented compactly by
. For this general case of (again,assumed independent) views, the likelihood that the data pointis seabed type is
(8)
(9)
(10)
The posterior probability that the data point is seabed type isthen
(11)
The independence assumption for multiple views is not com-pletely justified because each view would be observing the samegeneral area of seabed. However, each data point is not a singlelocation on the seabed, but is rather an area of seabed (withspatial extent). As a result, when viewing a data point from dif-ferent directions, not all of the same physical seabed locationswill constitute the data point. Moreover, the fact that objects onthe seabed (such as rocks or mines) and seabed characteristics(like sand ripples) can appear very different from different ori-entations should also ameliorate this assumption.
B. Special Case: Orientation Dependence of Sand Ripples
The posterior probability that a data point is a particularseabed type, based on multiple views, was given in (11).Implicit in its derivation, however, was that a given area ofseabed would always appear as the true seabed type fromany orientation. For example, a rocky seabed would look likea rocky seabed regardless of the orientation from which itwas viewed. This assumption is not always true, however.In particular, seabed characterized by sand ripples exhibits astrong orientation dependence; when the sand ripple “waves”propagate in the along-track direction of the vehicle (which isassumed to be orthogonal to the look-direction of the sonar),the seabed appears to be flat. A cartoon depicting this scenariois shown in Fig. 2, while real SAS imagery illustrating thisphenomenon is shown in Fig. 3.
To account for this orientation dependence of ripples, the like-lihood in (9) for the multiview case must be modified slightly.Without loss of generality, let and denote flat seabed andrippled seabed, respectively.

1242 IEEE TRANSACTIONS ON IMAGE PROCESSING, VOL. 18, NO. 6, JUNE 2009
Fig. 3. SAS imagery of the same area of seabed characterized by ripples whenthe along-track direction of the vehicle is (a) nearly perpendicular to the ripplepropagation direction and (b) nearly parallel to the ripple propagation direction.
Let denote the orientation of the th of views. Assumethat the orientations of the views are sufficiently separatedsuch that for all pairs of views, where
is the assumed span of orientations over which a rip-pled seabed will appear to be flat. Also define .
For the case of views, the likelihood of the data point beingrippled seabed, , is modified to be
(12)
where is as defined in (3). The modification in (12)allows for the case in which one of the views of a rippled seabedappears to be flat seabed. As , which corresponds to thecase in which a rippled seabed never appears to be flat seabed,(12) degenerates into (9).
The assumption that the orientations of the views are suffi-ciently separated enforces that no more than one view of rip-pled seabed appears to be flat seabed. This assumption is justi-fied by the fact that in practice, a sonar-equipped vehicle will beprogrammed to take routes that maximize the angular diversityamong orientations (so that the most informative data can becollected). Although this assumption is not imperative, withoutit the resulting equation would be more cumbersome and lessgeneral (with a greater dependence on the specific orientationstaken).
IV. ENTROPY-BASED ACTIVE LEARNING
Active learning deals with the intelligent acquisition of addi-tional data to improve classification [2]. Traditionally the topicof active learning is considered in the context of acquiring thelabel (e.g., mine or clutter) of an object in classification tasks.But it is equally valid to consider the additional data to be in theform of additional views from a given sensor or views from anew sensor [15].
Active learning seeks to answer the following question: Ifit is possible to acquire additional data, which data should becollected to most improve classification? Interestingly, this fun-damental statement of active learning mirrors the very motiva-tion for employing autonomous underwater vehicles. Namely,
the purpose of giving an AUV the freedom to adapt its routein-mission is to allow it to collect the most useful data.
In the context of seabed classification, the logical approachfor active learning is to acquire additional data (i.e., views) forthe areas of seabed for which the current classifications have thehighest uncertainty. In this paper, we quantify this uncertaintyvia the entropy of the probabilistic classification predictions.
The entropy (in bits) of a discrete random variable, , is de-fined as [16]
(13)
where is the probability that takes on the value in thealphabet of possible values.
If the seabed type of a data point, , is treated as a randomvariable, the entropy (in bits) of the seabed-type prediction interms of the posterior probabilities, , can be written as
(14)
where it is assumed that there are possible seabed types.By employing this entropy-based criterion for active learning,
the resources for collecting the additional data would be opti-mally allocated for improving the confidence in the classifica-tion task.
It should be emphasized that without the principled proba-bilistic foundations of the proposed multiview classification ap-proach, such an elegantly simple active-learning method wouldnot be possible. It is the fully probabilistic nature of the pro-posed multiview classification framework that allows such anintuitive approach to active learning to fall out naturally.
V. DATA SET
A. Synthetic Aperture Sonar (SAS) Imagery
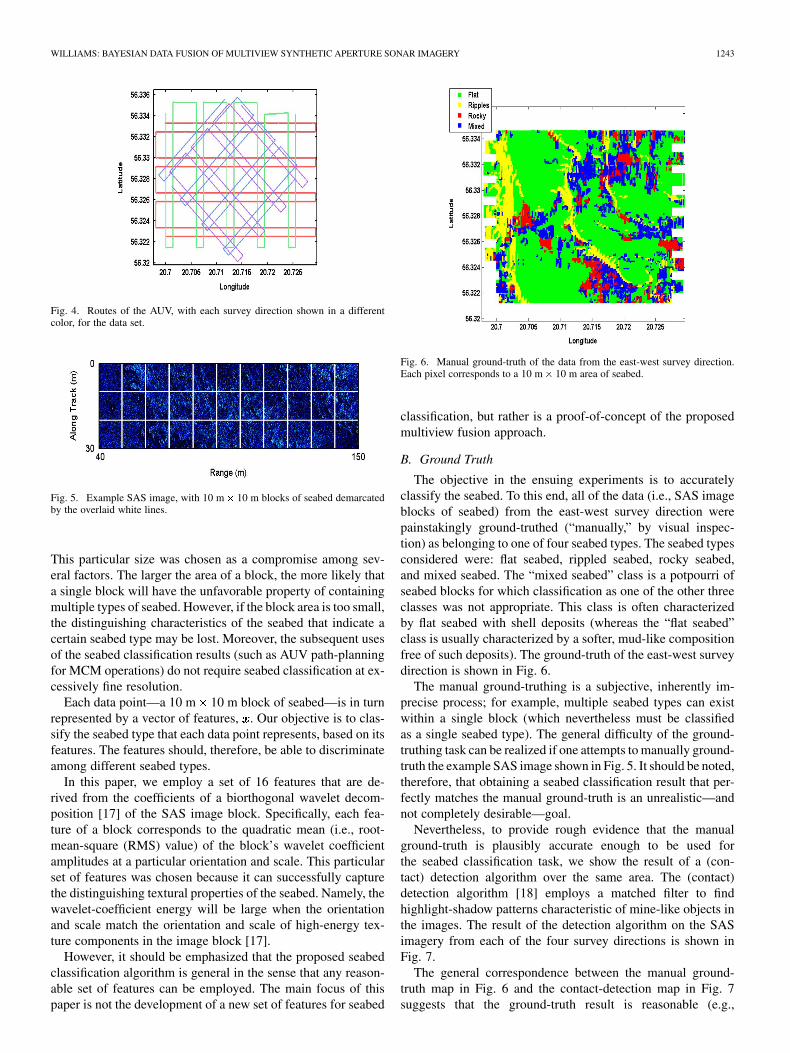
In April–May 2008, the NATO Undersea Research Centre(NURC) conducted the Colossus II sea trial in the Baltic Seaoff the coast of Latvia. During this trial, high-resolution sonardata was collected by the MUSCLE autonomous underwater ve-hicle (AUV). This AUV is equipped with a 300 kHz sonar witha 60 kHz bandwidth that can achieve image resolution of ap-proximately 3 cm. From April 20–22, the vehicle collected dataover an approximately 2 km area in four different survey direc-tions (north-south, northeast-southwest, east-west, and south-east-northwest). The track spacing of the vehicle was designedto prevent dead-zones (lacking sonar coverage), assuming sonarcoverage would be achieved from 40 to 150 m on either side ofthe vehicle. The routes of the vehicle in each survey directionare shown in Fig. 4.
The enormous amount of data that resulted from this collec-tion was then processed into synthetic aperture sonar (SAS) im-agery. This particular three-day data set contains 3550 SAS im-ages (each covering an area of 30 m 110 m), one example ofwhich is shown in Fig. 5.
In this paper, the “atomic” unit for seabed classification isassumed to be a 10 m 10 m block of seabed. That is, each10 m 10 m block of seabed corresponds to one data point.
WILLIAMS: BAYESIAN DATA FUSION OF MULTIVIEW SYNTHETIC APERTURE SONAR IMAGERY 1243
Fig. 4. Routes of the AUV, with each survey direction shown in a differentcolor, for the data set.
Fig. 5. Example SAS image, with 10 m� 10 m blocks of seabed demarcatedby the overlaid white lines.
This particular size was chosen as a compromise among sev-eral factors. The larger the area of a block, the more likely thata single block will have the unfavorable property of containingmultiple types of seabed. However, if the block area is too small,the distinguishing characteristics of the seabed that indicate acertain seabed type may be lost. Moreover, the subsequent usesof the seabed classification results (such as AUV path-planningfor MCM operations) do not require seabed classification at ex-cessively fine resolution.
Each data point—a 10 m 10 m block of seabed—is in turnrepresented by a vector of features, . Our objective is to clas-sify the seabed type that each data point represents, based on itsfeatures. The features should, therefore, be able to discriminateamong different seabed types.
In this paper, we employ a set of 16 features that are de-rived from the coefficients of a biorthogonal wavelet decom-position [17] of the SAS image block. Specifically, each fea-ture of a block corresponds to the quadratic mean (i.e., root-mean-square (RMS) value) of the block’s wavelet coefficientamplitudes at a particular orientation and scale. This particularset of features was chosen because it can successfully capturethe distinguishing textural properties of the seabed. Namely, thewavelet-coefficient energy will be large when the orientationand scale match the orientation and scale of high-energy tex-ture components in the image block [17].
However, it should be emphasized that the proposed seabedclassification algorithm is general in the sense that any reason-able set of features can be employed. The main focus of thispaper is not the development of a new set of features for seabed
Fig. 6. Manual ground-truth of the data from the east-west survey direction.Each pixel corresponds to a 10 m� 10 m area of seabed.
classification, but rather is a proof-of-concept of the proposedmultiview fusion approach.
B. Ground Truth
The objective in the ensuing experiments is to accuratelyclassify the seabed. To this end, all of the data (i.e., SAS imageblocks of seabed) from the east-west survey direction werepainstakingly ground-truthed (“manually,” by visual inspec-tion) as belonging to one of four seabed types. The seabed typesconsidered were: flat seabed, rippled seabed, rocky seabed,and mixed seabed. The “mixed seabed” class is a potpourri ofseabed blocks for which classification as one of the other threeclasses was not appropriate. This class is often characterizedby flat seabed with shell deposits (whereas the “flat seabed”class is usually characterized by a softer, mud-like compositionfree of such deposits). The ground-truth of the east-west surveydirection is shown in Fig. 6.
The manual ground-truthing is a subjective, inherently im-precise process; for example, multiple seabed types can existwithin a single block (which nevertheless must be classifiedas a single seabed type). The general difficulty of the ground-truthing task can be realized if one attempts to manually ground-truth the example SAS image shown in Fig. 5. It should be noted,therefore, that obtaining a seabed classification result that per-fectly matches the manual ground-truth is an unrealistic—andnot completely desirable—goal.
Nevertheless, to provide rough evidence that the manualground-truth is plausibly accurate enough to be used forthe seabed classification task, we show the result of a (con-tact) detection algorithm over the same area. The (contact)detection algorithm [18] employs a matched filter to findhighlight-shadow patterns characteristic of mine-like objects inthe images. The result of the detection algorithm on the SASimagery from each of the four survey directions is shown inFig. 7.
The general correspondence between the manual ground-truth map in Fig. 6 and the contact-detection map in Fig. 7suggests that the ground-truth result is reasonable (e.g.,

1244 IEEE TRANSACTIONS ON IMAGE PROCESSING, VOL. 18, NO. 6, JUNE 2009
Fig. 7. Contacts detected. Each point corresponds to one detection, with colorused to distinguish the survey direction from which each detection was made.
areas ground-truthed as flat are typically free of detections,while areas ground-truthed as rocky typically contain manydetections).
VI. EXPERIMENTAL SET-UP
A. Training Procedure
Associated with each 10 m 10 m block of seabed are lati-tude and longitude coordinates, corresponding to the center ofthe block. If the distance between the center points of two blockson different survey directions is below a set threshold, we con-sider the two blocks to correspond to the same data point. It is inthis manner that a data point can be viewed multiple times. Asnoted previously, however, the multiple views corresponding toa given data point will necessarily be comprised of nonidenticalphysical seabed locations.
In Section III-B, it was discussed that seabed characterized bysand ripples exhibits a special orientation dependence. When thealong-track direction of the vehicle is similar to the propagationdirection of the ripples, the rippled seabed can appear to be flatseabed. For the results presented here, it is assumed that thereexists a span of angles in which rippled seabed appearsto be flat, so in (12).
Because a supervised approach is employed to learn theGMM for each seabed type, some labeled data must be avail-able for the training procedure. In this paper, we learn therequisite GMMs using those seabed blocks from the east-westsurvey (for which manual ground-truthing has been performed)of data points that have no more than one additional view fromthe other survey directions. (Each data point in the data set hasbetween one and four views, because the four surveys do notcover identical areas. Thus, to learn the GMMs, only viewsfrom the east-west survey of certain data points are used.)
The probability is the prior probability that a data pointis seabed type . For the results presented here, we have used
and , whichrepresents a strong (prior) belief that the seabed type will be flat
. As a result, for an area of seabed to be classified as rippled, rocky , or mixed , particularly strong evidence that
supports such a decision will be required. The particular priors
used here are an approximation to the empirical distribution ofthe seabed types found in the training data. However, it shouldalso be noted that as more views are used, the importance andinfluence of the particular priors chosen diminishes (cf., [19]).
Upon training one separate GMM for each of the four seabedtypes—flat, rippled, rocky, and mixed—each data point isevaluated using (11). These calculations result in the posteriorprobability that each data point belongs to each seabed type.Probabilistic seabed classification is based on these posteriorprobabilities.
B. Visual Presentation of Results
The posterior probability that each data point belongs to eachseabed type is best displayed graphically in the form of posteriorprobability “maps.” These posterior probability maps for eachseabed type are generated according to the following conven-tion. The higher the posterior probability for the given seabedtype, the brighter the color. Thus, a purely black pixel corre-sponds to a posterior probability of zero.
If one were instead interested in a hard decision regardingthe seabed type, the maximum a posteriori (MAP) proba-bility—taken across seabed types—would be used for theclassification. However, as noted previously, making harddecisions ignores both the full complexity of the seabed clas-sification problem and the richness of information that theproposed approach provides.
The uncertainty in the classification decisions can be ex-pressed by an associated “entropy map.” Each entropy mapshows the uncertainty of the classification decision—as quan-tified by the entropy of the posterior probabilities, calculatedfrom (14)—for each data point. In these maps, white pixelscorrespond to high uncertainty, while black pixels correspondto low uncertainty. It should be noted that the range of possibleentropy values for this application is from 0 bits to 2 bits (sincethere are seabed types).
In the results that follow in Section VII-B, the posterior prob-ability maps for each seabed type, the maximum a posterioriclassification results, and the associated entropy maps are allshown. To facilitate easy comparison among results, all figuresuse the same axis limits.
VII. EXPERIMENTAL RESULTS
A. Case Study
As a prelude to the full set of experimental results, we firstexamine the results of the proposed approach on one particulardata point. This case study will illuminate some subtle yet im-portant points necessary for the proper interpretation of the fullresults.
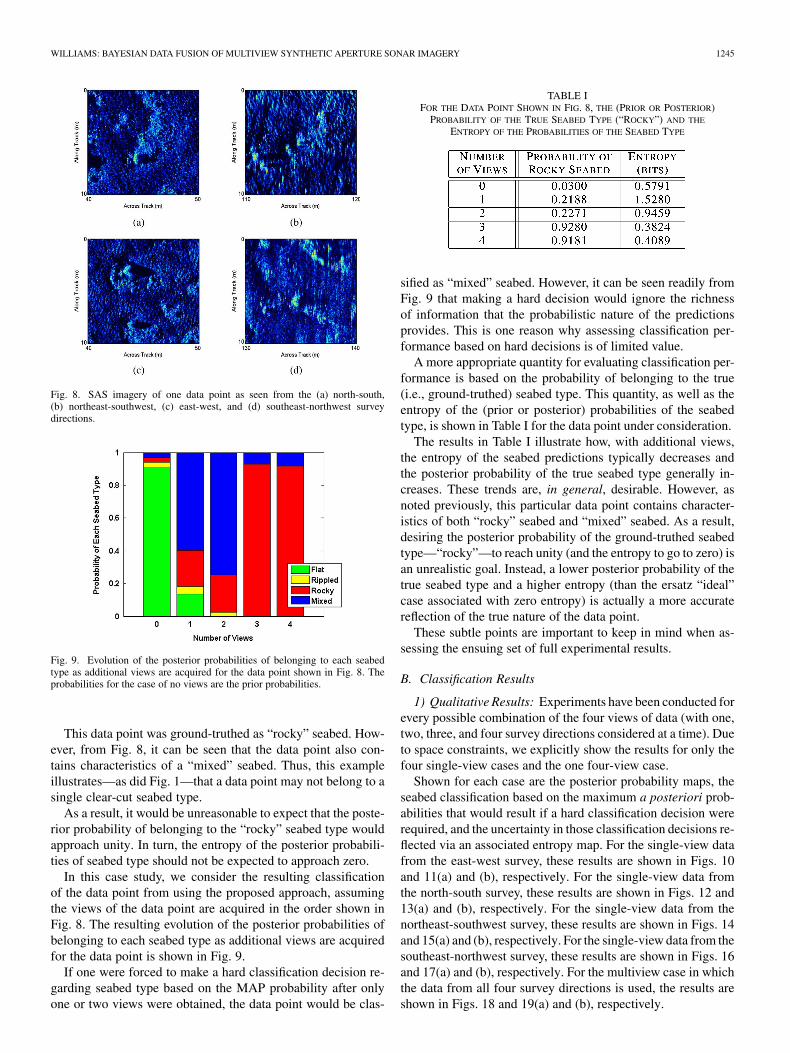
The four views of the data point we consider here are shownin Fig. 8. The data point appears markedly different in each viewbecause each view is at a unique orientation and at a differentrange to the sonar. It should also be noted that the image from thesoutheast-northwest survey, in Fig. 8(d), is blurry due to signif-icant undesired vehicle motion (i.e., yaw, pitch, and roll) at thetime of data collection. This example highlights the fact that ex-ploiting multiple views can prevent the reliance on poor-qualitysingle-view data for performing classification.
WILLIAMS: BAYESIAN DATA FUSION OF MULTIVIEW SYNTHETIC APERTURE SONAR IMAGERY 1245
Fig. 8. SAS imagery of one data point as seen from the (a) north-south,(b) northeast-southwest, (c) east-west, and (d) southeast-northwest surveydirections.
Fig. 9. Evolution of the posterior probabilities of belonging to each seabedtype as additional views are acquired for the data point shown in Fig. 8. Theprobabilities for the case of no views are the prior probabilities.
This data point was ground-truthed as “rocky” seabed. How-ever, from Fig. 8, it can be seen that the data point also con-tains characteristics of a “mixed” seabed. Thus, this exampleillustrates—as did Fig. 1—that a data point may not belong to asingle clear-cut seabed type.
As a result, it would be unreasonable to expect that the poste-rior probability of belonging to the “rocky” seabed type wouldapproach unity. In turn, the entropy of the posterior probabili-ties of seabed type should not be expected to approach zero.
In this case study, we consider the resulting classificationof the data point from using the proposed approach, assumingthe views of the data point are acquired in the order shown inFig. 8. The resulting evolution of the posterior probabilities ofbelonging to each seabed type as additional views are acquiredfor the data point is shown in Fig. 9.
If one were forced to make a hard classification decision re-garding seabed type based on the MAP probability after onlyone or two views were obtained, the data point would be clas-
TABLE IFOR THE DATA POINT SHOWN IN FIG. 8, THE (PRIOR OR POSTERIOR)
PROBABILITY OF THE TRUE SEABED TYPE (“ROCKY”) AND THE
ENTROPY OF THE PROBABILITIES OF THE SEABED TYPE
sified as “mixed” seabed. However, it can be seen readily fromFig. 9 that making a hard decision would ignore the richnessof information that the probabilistic nature of the predictionsprovides. This is one reason why assessing classification per-formance based on hard decisions is of limited value.
A more appropriate quantity for evaluating classification per-formance is based on the probability of belonging to the true(i.e., ground-truthed) seabed type. This quantity, as well as theentropy of the (prior or posterior) probabilities of the seabedtype, is shown in Table I for the data point under consideration.
The results in Table I illustrate how, with additional views,the entropy of the seabed predictions typically decreases andthe posterior probability of the true seabed type generally in-creases. These trends are, in general, desirable. However, asnoted previously, this particular data point contains character-istics of both “rocky” seabed and “mixed” seabed. As a result,desiring the posterior probability of the ground-truthed seabedtype—“rocky”—to reach unity (and the entropy to go to zero) isan unrealistic goal. Instead, a lower posterior probability of thetrue seabed type and a higher entropy (than the ersatz “ideal”case associated with zero entropy) is actually a more accuratereflection of the true nature of the data point.
These subtle points are important to keep in mind when as-sessing the ensuing set of full experimental results.
B. Classification Results
1) Qualitative Results: Experiments have been conducted forevery possible combination of the four views of data (with one,two, three, and four survey directions considered at a time). Dueto space constraints, we explicitly show the results for only thefour single-view cases and the one four-view case.
Shown for each case are the posterior probability maps, theseabed classification based on the maximum a posteriori prob-abilities that would result if a hard classification decision wererequired, and the uncertainty in those classification decisions re-flected via an associated entropy map. For the single-view datafrom the east-west survey, these results are shown in Figs. 10and 11(a) and (b), respectively. For the single-view data fromthe north-south survey, these results are shown in Figs. 12 and13(a) and (b), respectively. For the single-view data from thenortheast-southwest survey, these results are shown in Figs. 14and 15(a) and (b), respectively. For the single-view data from thesoutheast-northwest survey, these results are shown in Figs. 16and 17(a) and (b), respectively. For the multiview case in whichthe data from all four survey directions is used, the results areshown in Figs. 18 and 19(a) and (b), respectively.

1246 IEEE TRANSACTIONS ON IMAGE PROCESSING, VOL. 18, NO. 6, JUNE 2009
Fig. 12. Posterior probability maps from the north-south survey for (a) flat seabed, (b) rippled seabed, (c) rocky seabed, and (d) mixed seabed. The brighter thecolor, the higher the posterior probability for the given seabed type.
Fig. 13. From the north-south survey, (a) single-view seabed classification results based on the seabed type with the MAP probability, and (b) the entropy mapassociated with the classifications (where white denotes the highest uncertainty, and black denotes the lowest uncertainty).
2) Quantitative Results: In general, a higher posterior proba-bility for the trueseabed type isan indicationof improvedclassifi-cation performance. However, as was noted in Section VII-A, anaccurate reflection of the true nature ofa data pointwould not nec-essarilybe achieved when this posterior probability is very high.
Nevertheless, for every possible combination of the fourviews of data (with one, two, three, and four survey directionsconsidered at a time), we show in Table II the mean posteriorprobability of the true seabed type (averaged over the datapoints). The results shown are for only those data points that
WILLIAMS: BAYESIAN DATA FUSION OF MULTIVIEW SYNTHETIC APERTURE SONAR IMAGERY 1247
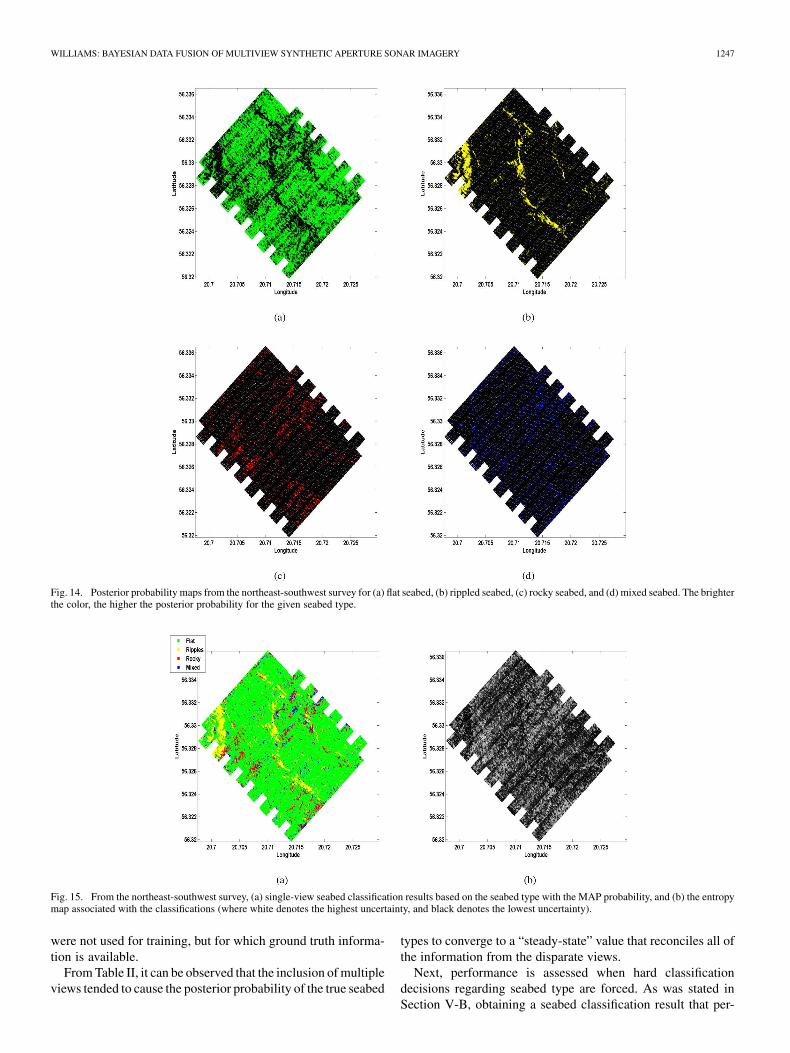
Fig. 14. Posterior probability maps from the northeast-southwest survey for (a) flat seabed, (b) rippled seabed, (c) rocky seabed, and (d) mixed seabed. The brighterthe color, the higher the posterior probability for the given seabed type.
Fig. 15. From the northeast-southwest survey, (a) single-view seabed classification results based on the seabed type with the MAP probability, and (b) the entropymap associated with the classifications (where white denotes the highest uncertainty, and black denotes the lowest uncertainty).
were not used for training, but for which ground truth informa-tion is available.
From Table II, it can be observed that the inclusion of multipleviews tended to cause the posterior probability of the true seabed
types to converge to a “steady-state” value that reconciles all ofthe information from the disparate views.
Next, performance is assessed when hard classificationdecisions regarding seabed type are forced. As was stated inSection V-B, obtaining a seabed classification result that per-

1248 IEEE TRANSACTIONS ON IMAGE PROCESSING, VOL. 18, NO. 6, JUNE 2009
Fig. 10. Posterior probability maps from the east-west survey for (a) flat seabed, (b) rippled seabed, (c) rocky seabed, and (d) mixed seabed. The brighter thecolor, the higher the posterior probability for the given seabed type.
fectly matches the manual ground-truth is an unrealistic—andnot completely desirable—goal. For one, it should be notedthat the ground truth was created by examining the data fromonly one particular orientation. If viewed from a differentorientation, it is reasonable to assume that the ground truthresult would not be identical.
Nevertheless, to demonstrate in a different manner the ben-efit of using multiple views for seabed classification, we presentconfusion matrices for the classification results based on MAPprobabilities. Each confusion matrix represents only those datapoints that were not used for training but for which ground truthinformation is available. Specifically, the th entry in a confu-sion matrix expresses the fraction of times that the th seabedtype was classified as the th seabed type.
We show four distinct confusion matrices, each of which cor-responds to the case of using a different total number of viewsto perform classification. More specifically, each confusion ma-trix is the average of the confusion matrices from every pos-sible combination of survey directions for a fixed number of totalviews. The average confusion matrices from using one view (av-eraged over the four possible cases), from using two views (aver-aged over the six possible combinations), from using three views
(averaged over the four possible combinations), and from usingfour views (the one possible case) are shown in Tables III–VI,respectively.
As can be seen from Tables III–VI, classification performanceimproves, in general, as additional views are added. However, itshould be reiterated that the probabilistic nature of the proposedapproach provides more information than is exploited by a harddecision.
A large portion of the classification differences (“errors”) inTables III–VI can be attributed to imperfect ground truthing.For example, it can be argued that blocks ground-truthed as“rocky” seabed which often contained only a few rock-like ob-jects would be more appropriately ground-truthed as “flat” or“mixed” seabed. Similarly, the difference between the “flat” and“mixed” seabed classes—typically only the absence or presenceof shell deposits—is often difficult to judge. Moreover, blocksthat contain sand ripples in only a portion of the block are alsoprone to be misclassified when a hard decision is demanded.
These situations highlight the fact that the classification ofseabed type is rarely a simple clear-cut decision. It is preciselyfor these reasons that it is imperative that a probabilistic seabedclassification algorithm be employed.
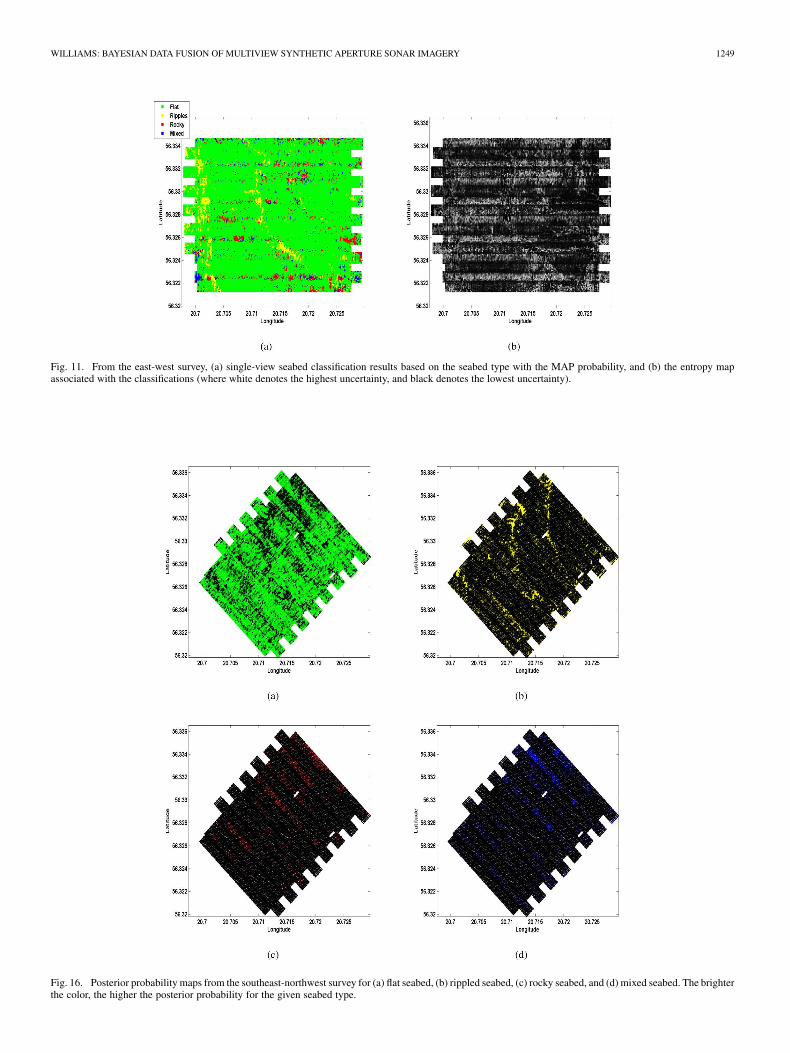
WILLIAMS: BAYESIAN DATA FUSION OF MULTIVIEW SYNTHETIC APERTURE SONAR IMAGERY 1249
Fig. 11. From the east-west survey, (a) single-view seabed classification results based on the seabed type with the MAP probability, and (b) the entropy mapassociated with the classifications (where white denotes the highest uncertainty, and black denotes the lowest uncertainty).
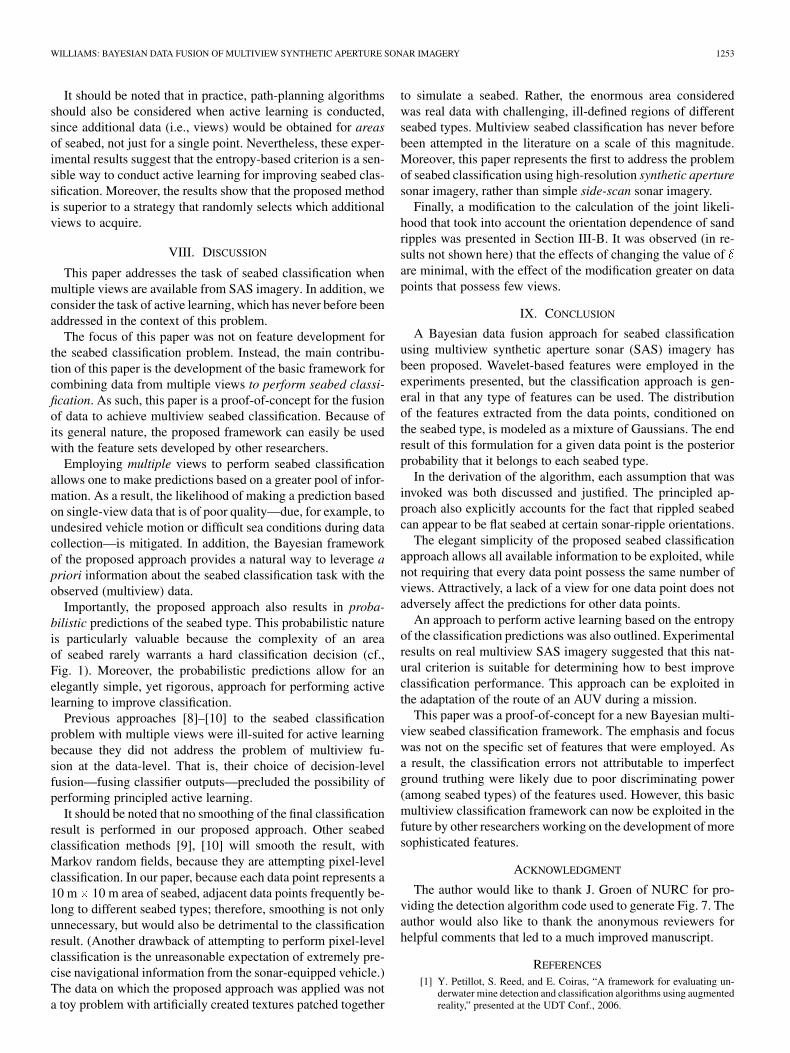
Fig. 16. Posterior probability maps from the southeast-northwest survey for (a) flat seabed, (b) rippled seabed, (c) rocky seabed, and (d) mixed seabed. The brighterthe color, the higher the posterior probability for the given seabed type.

1250 IEEE TRANSACTIONS ON IMAGE PROCESSING, VOL. 18, NO. 6, JUNE 2009
Fig. 17. From the southeast-northwest survey, (a) single-view seabed classification results based on the seabed type with the MAP probability, and (b) the entropymap associated with the classifications (where white denotes the highest uncertainty, and black denotes the lowest uncertainty).
Fig. 18. Multiview posterior probability maps from the north-south, northeast-southwest, east-west, and southeast-northwest surveys for (a) flat seabed, (b) rippledseabed, (c) rocky seabed, and (d) mixed seabed. The brighter the color, the higher the posterior probability for the given seabed type.
Additionally, as will be shown in Section VII-C, the majorityof the classification “errors” in Table VI are for data points
whose maximum a posteriori classification was with low confi-dence (i.e., high uncertainty).

WILLIAMS: BAYESIAN DATA FUSION OF MULTIVIEW SYNTHETIC APERTURE SONAR IMAGERY 1251
Fig. 19. From the north-south, northeast-southwest, east-west, and southeast-northwest surveys, (a) multiview seabed classification results based on the seabedtype with the MAP probability, and (b) the entropy map associated with the classifications (where white denotes the highest uncertainty, and black denotes thelowest uncertainty).
TABLE IIAVERAGE POSTERIOR PROBABILITY OF THE TRUE SEABED TYPE
TABLE IIIAVERAGE CONFUSION MATRIX OF THE SEABED CLASSIFICATION RESULTS
BASED ON THE MAP PROBABILITIES, FROM THE FOUR ONE-VIEW CASES
C. Entropy Results
The results of the proposed multiview seabed classificationalgorithm were presented in Section VII-B. Comparisons of thevarious maximum a posteriori classification results with themanual ground-truth in Fig. 6 suggest that the results are rea-sonable for providing a global assessment of the highly-com-plex area.
However, for active learning in particular, the posterior prob-abilities for each seabed type, and in turn the entropy of the pre-dictions, are of more interest. By calculating the entropy of the
TABLE IVAVERAGE CONFUSION MATRIX OF THE SEABED CLASSIFICATION
RESULTS BASED ON THE MAP PROBABILITIES,FROM THE SIX TWO-VIEW SURVEY COMBINATIONS
TABLE VAVERAGE CONFUSION MATRIX OF THE SEABED CLASSIFICATION
RESULTS BASED ON THE MAP PROBABILITIES,FROM THE FOUR THREE-VIEW SURVEY COMBINATIONS
TABLE VICONFUSION MATRIX OF THE FOUR-VIEW SEABED CLASSIFICATION RESULTS
BASED ON THE MAP PROBABILITIES
seabed classification for each data point (i.e., area of seabed)using (14), and then averaging across all data points in the entiredata set (that were not used for training), the average classifica-tion uncertainty in seabed type can be established. This averageentropy quantity is computed for every possible survey combi-nation, with the results presented in Table VII.
From the results in Table VII, it can be seen that the averageentropy decreases as additional views are used. Specifically, the

1252 IEEE TRANSACTIONS ON IMAGE PROCESSING, VOL. 18, NO. 6, JUNE 2009
TABLE VIIAVERAGE ENTROPY OF SEABED CLASSIFICATION
average entropy of the multiview case was always less than thehighest average entropy from among the single views consid-ered. However, the use of an additional view did not alwaysdecrease the classification uncertainty. Instead, the inclusion ofmultiple views appeared to cause the average entropy to con-verge to a “steady-state” value, which may reflect the true un-certainty inherent in the data. (Recall that a given area of seabedis rarely a single, clear-cut type.)
For the four-view case, the average entropy of blocks thatwere classified correctly based on the maximum a posterioriclassification was 0.2732 bits. The average entropy of blocksthat were classified incorrectly based on the maximum a pos-teriori classification was 0.4835 bits. Thus, the confidence inthe predictions was significantly lower for the cases that werenot correct. This suggests that the active-learning approach pro-posed to improve classification—based on obtaining additionalviews of the areas of seabed with the highest entropy values—issensible.
1) Active-Learning Results: To demonstrate the benefit ofthe active-learning method concretely, we conduct the followingexperiment (using only those data points that were not used fortraining, but for which ground truth information is available).It is assumed that data from a single survey direction is pos-sessed initially. The entropy of the posterior probabilities foreach seabed type can then be computed for each data point.
For the proposed active-learning approach, additional viewsshould be acquired first for the data point with the highest en-tropy (i.e., uncertainty). More generally, the order of data pointsfor which additional views should be acquired are from thosewith the highest entropy to those with the lowest entropy. Analternative approach to active learning would be to randomlyselect the order of data points to acquire additional views for.
We compare the results of the active-learning approach withthe results of randomly selecting which data point to acquireadditional views for, in terms of the mean posterior probabilityof the true seabed type (as in Table II). Specifically, this quantityis shown in Fig. 20 as a function of the fraction of data pointsfor which the remaining views were acquired. Results are shownwhen each of the four survey directions are assumed to be the
Fig. 20. Active-learning comparison of acquiring additional views randomlyversus based on the data points with the highest seabed-classification entropy.Shown is the mean posterior probability of belonging to each data point’s trueseabed type, as a function of the fraction of data points whose remaining viewswere acquired. The legend indicates the method by which the data points toacquire additional views for were selected, with the initial survey-direction viewindicated in parentheses.
TABLE VIIIAREA UNDER CURVES (IN FIG. 20) OF MEAN POSTERIOR PROBABILITY OF
TRUE SEABED TYPES USING ENTROPY-BASED CRITERION AND RANDOM
SELECTION (MEAN � ONE STANDARD DEVIATION, FROM 100 TRIALS)
initial view. When additional views are acquired for a data point,it is assumed that all (i.e., up to three) remaining views of thedata point are acquired.
For the case of randomly selecting which data points to ac-quire additional views for, 100 independent trials are conducted;each trial uses a unique, random acquisition order. The resultspresented in Fig. 20 for this “random” approach are the mean re-sults over the 100 trials. (Error bars, representing one standarddeviation about this mean value, were very tight, as is reflectedin Table VIII).
The entropy-based active-learning results in Fig. 20 suggestthat acquiring additional views of data points whose seabed pre-dictions have high entropy tends to increase the posterior prob-ability of the true seabed type. The converse also tends to hold,as evidenced by the fact that the latter portions of the curvesin Fig. 20 associated with the entropy-based approach have de-creasing slopes.
In practice, resources are limited, so the improvement of clas-sification (e.g., in terms of the posterior probability of the trueseabed type) as quickly as possible is desirable. A measure ofthe success of each approach, therefore, can be quantified by cal-culating the areas under the curves in Fig. 20. Active-learningperformance using this quantity is shown in Table VIII, wherehigher values for this “area” are preferred.
WILLIAMS: BAYESIAN DATA FUSION OF MULTIVIEW SYNTHETIC APERTURE SONAR IMAGERY 1253
It should be noted that in practice, path-planning algorithmsshould also be considered when active learning is conducted,since additional data (i.e., views) would be obtained for areasof seabed, not just for a single point. Nevertheless, these exper-imental results suggest that the entropy-based criterion is a sen-sible way to conduct active learning for improving seabed clas-sification. Moreover, the results show that the proposed methodis superior to a strategy that randomly selects which additionalviews to acquire.
VIII. DISCUSSION
This paper addresses the task of seabed classification whenmultiple views are available from SAS imagery. In addition, weconsider the task of active learning, which has never before beenaddressed in the context of this problem.
The focus of this paper was not on feature development forthe seabed classification problem. Instead, the main contribu-tion of this paper is the development of the basic framework forcombining data from multiple views to perform seabed classi-fication. As such, this paper is a proof-of-concept for the fusionof data to achieve multiview seabed classification. Because ofits general nature, the proposed framework can easily be usedwith the feature sets developed by other researchers.
Employing multiple views to perform seabed classificationallows one to make predictions based on a greater pool of infor-mation. As a result, the likelihood of making a prediction basedon single-view data that is of poor quality—due, for example, toundesired vehicle motion or difficult sea conditions during datacollection—is mitigated. In addition, the Bayesian frameworkof the proposed approach provides a natural way to leverage apriori information about the seabed classification task with theobserved (multiview) data.
Importantly, the proposed approach also results in proba-bilistic predictions of the seabed type. This probabilistic natureis particularly valuable because the complexity of an areaof seabed rarely warrants a hard classification decision (cf.,Fig. 1). Moreover, the probabilistic predictions allow for anelegantly simple, yet rigorous, approach for performing activelearning to improve classification.
Previous approaches [8]–[10] to the seabed classificationproblem with multiple views were ill-suited for active learningbecause they did not address the problem of multiview fu-sion at the data-level. That is, their choice of decision-levelfusion—fusing classifier outputs—precluded the possibility ofperforming principled active learning.
It should be noted that no smoothing of the final classificationresult is performed in our proposed approach. Other seabedclassification methods [9], [10] will smooth the result, withMarkov random fields, because they are attempting pixel-levelclassification. In our paper, because each data point represents a10 m 10 m area of seabed, adjacent data points frequently be-long to different seabed types; therefore, smoothing is not onlyunnecessary, but would also be detrimental to the classificationresult. (Another drawback of attempting to perform pixel-levelclassification is the unreasonable expectation of extremely pre-cise navigational information from the sonar-equipped vehicle.)The data on which the proposed approach was applied was nota toy problem with artificially created textures patched together
to simulate a seabed. Rather, the enormous area consideredwas real data with challenging, ill-defined regions of differentseabed types. Multiview seabed classification has never beforebeen attempted in the literature on a scale of this magnitude.Moreover, this paper represents the first to address the problemof seabed classification using high-resolution synthetic aperturesonar imagery, rather than simple side-scan sonar imagery.
Finally, a modification to the calculation of the joint likeli-hood that took into account the orientation dependence of sandripples was presented in Section III-B. It was observed (in re-sults not shown here) that the effects of changing the value ofare minimal, with the effect of the modification greater on datapoints that possess few views.
IX. CONCLUSION
A Bayesian data fusion approach for seabed classificationusing multiview synthetic aperture sonar (SAS) imagery hasbeen proposed. Wavelet-based features were employed in theexperiments presented, but the classification approach is gen-eral in that any type of features can be used. The distributionof the features extracted from the data points, conditioned onthe seabed type, is modeled as a mixture of Gaussians. The endresult of this formulation for a given data point is the posteriorprobability that it belongs to each seabed type.
In the derivation of the algorithm, each assumption that wasinvoked was both discussed and justified. The principled ap-proach also explicitly accounts for the fact that rippled seabedcan appear to be flat seabed at certain sonar-ripple orientations.
The elegant simplicity of the proposed seabed classificationapproach allows all available information to be exploited, whilenot requiring that every data point possess the same number ofviews. Attractively, a lack of a view for one data point does notadversely affect the predictions for other data points.
An approach to perform active learning based on the entropyof the classification predictions was also outlined. Experimentalresults on real multiview SAS imagery suggested that this nat-ural criterion is suitable for determining how to best improveclassification performance. This approach can be exploited inthe adaptation of the route of an AUV during a mission.
This paper was a proof-of-concept for a new Bayesian multi-view seabed classification framework. The emphasis and focuswas not on the specific set of features that were employed. Asa result, the classification errors not attributable to imperfectground truthing were likely due to poor discriminating power(among seabed types) of the features used. However, this basicmultiview classification framework can now be exploited in thefuture by other researchers working on the development of moresophisticated features.
ACKNOWLEDGMENT
The author would like to thank J. Groen of NURC for pro-viding the detection algorithm code used to generate Fig. 7. Theauthor would also like to thank the anonymous reviewers forhelpful comments that led to a much improved manuscript.
REFERENCES
[1] Y. Petillot, S. Reed, and E. Coiras, “A framework for evaluating un-derwater mine detection and classification algorithms using augmentedreality,” presented at the UDT Conf., 2006.

1254 IEEE TRANSACTIONS ON IMAGE PROCESSING, VOL. 18, NO. 6, JUNE 2009
[2] D. MacKay, “Information-based objective functions for active data se-lection,” Neural Comput., vol. 4, no. 4, pp. 590–604, Jul. 1992.
[3] Z. Reut, N. Pace, and M. Heaton, “Computer classification of seabedsby sonar,” Nature, no. 314, pp. 426–428, 1985.
[4] N. Pace and H. Gao, “Swathe seabed classification,” IEEE J. OceanEng., vol. 13, no. 2, pp. 83–90, Apr. 1988.
[5] B. Dasarathy and E. Holder, “Image characterizations based on jointgray-level run-length distributions,” Pattern Recognit. Lett., vol. 12, no.8, pp. 497–502, 1991.
[6] D. Tamsett, “Seabed characterisation and classification from the powerspectra of sidescan sonar data,” Marine Geophys. Res., vol. 15, no. 1,pp. 43–64, 1993.
[7] D. Carmichael, L. Linnett, S. Clarke, and B. Calder, “Seabed classi-fication through multifractal analysis of sidescan sonar imagery,” IEERadar, Sonar, Navig., vol. 143, no. 3, pp. 140–148, June 1996.
[8] D. Kerneis and B. Zerr, “Multisensor fusion for seabed classification,”in Proc. MTS/IEEE OCEANS, 2005, pp. 815–820.
[9] S. Reed, I. T. Ruiz, C. Capus, and Y. Petillot, “The fusion of large scaleclassified sidescan sonar image mosaics,” IEEE Trans. Image Process.,vol. 15, no. 7, pp. 2049–2060, Jul. 2006.
[10] E. Coiras, V. Myers, and B. Evans, “Reliable seabed characterizationfor MCM operations,” presented at the MTS/IEEE OCEANS, Van-couver, BC, Canada, 2007.
[11] A. Dempster, N. Laird, and D. Rubin, “Maximum likelihood from in-complete data via the EM algorithm,” J. Roy. Statist. Soc. B, vol. 39,pp. 1–38, 1977.
[12] N. Nasios and A. Bors, “Variational expectation-maximization trainingfor Gaussian networks,” in Proc. IEEE Workshop on Neural Networksfor Signal Processing, 2003, pp. 339–348.
[13] M. Beal and Z. Ghahramani, “The variational Bayesian EM algorithmfor incomplete data: Application to scoring graphical model struc-tures,” Bayesian Statist., vol. 7, pp. 453–464, 2003.
[14] M. Beal, “Variational Algorithms for Approximate Bayesian Infer-ence,” Ph.D. dissertation, Gatsby Computational Neuroscience Unit,University College London, , 2003.
[15] V. Fedorov, Theory of Optimal Experiments. New York: Academic,1972.
[16] T. Cover and J. Thomas, Elements of Information Theory. New York:Wiley, 1991.
[17] S. Mallat, A Wavelet Tour of Signal Processing. New York: Aca-demic, 1999.
[18] J. Fawcett, A. Crawford, D. Hopkin, V. Myers, and B. Zerr, Computer-Aided Detection of Targets From the CITADEL Trial Klein Sonar Data,Defence R & D Canada-Atlantic, Tech. Rep. DRDC Atlantic TM 2006-115, 2006.
[19] R. Duda, P. Hart, and D. Stork, Pattern Classification, 2nd ed. NewYork: Wiley, 2001.
David P. Williams received the B.S.E. (magnacum laude), M.S., and Ph.D. degrees in electricalengineering from Duke University in 2002, 2003,and 2006, respectively.
Upon graduating, he joined Signal InnovationsGroup, Durham, NC. Since August 2007, he hasbeen with the Mine Countermeasures Group, NATOUndersea Research Centre, La Spezia, Italy. His re-search interests lie in the fields of machine learning,pattern recognition, and statistical signal processing.
Dr. Williams was the recipient of a James B. DukeGraduate Fellowship (from Duke) and a National Defense Science and Engi-neering Graduate Fellowship (from the Department of Defense).