bayesian inference in oil spill response management · bayesian inference in oil spill response...
TRANSCRIPT

Bayesian inference in oil spill response management
R. Aps1, N. Sawano2, S. Hamada3 & M. Fetissov1
1University of Tartu, Estonian Marine Institute, Estonia 2Inaoki Educational Institute & Seiryo Women's Junior College, Kanazawa City, Japan 3Geological Survey of Hokkaido, Department of Marine Geosciences, Japan
Abstract
La Perouse (Soya) Strait, 40 km in width, separates Hokkaido Island (Japan) from Sakhalin Island (Russia), and connects the Sea of Japan to the west with the Sea of Okhotsk to the east. Vessel Automatic Identification System (AIS) data analysis for that strait, conducted in Japan, has shown extremely busy ship transport and a number of dangerous crossings, with a great deal of that transport being crude oil. The Web application integrates the Potential Incident Simulation, Control and Evaluation System (PISCES 2) and the Environmental Sensitivity Index (ESI) maps for environmental risk assessment, while the Bayesian consensual decision tool is used to support consensus building among oil spill response managers. Keywords: oil spill response, environmental risk assessment, Hokkaido Island, potential incident simulation, control and evaluation system (PISCES 2), environmental sensitivity index (ESI), Bayesian consensual decision ranking.
1 Introduction
The Sea of Okhotsk is a part of the western Pacific Ocean, lying between the Kamchatka Peninsula to the east, the Kuril Islands to the southeast, the island of Hokkaido to the far south, the island of Sakhalin along the west, and a long stretch of the eastern Siberian coast (including the Shantar Islands) along the west and north. In the Sea of Okhotsk, off the Island of Sakhalin, the Royal
www.witpress.com, ISSN 1743-3517 (on-line) WIT Transactions on Information and Communication Technologies, Vol 43, ©2010 WIT Press
doi:10.2495/RISK10 1004
Risk Analysis VII PI-35

Dutch Shell led consortium is operating the Sakhalin-2 oil and gas project, which is Russia’s largest in terms of foreign investment [1]. The project involves the installation of crude oil and gas offshore platforms to be linked to the shore by pipelines. Crude oil production occurs from late May to early December and is shutdown during the remaining period when shuttle tankers are unable to reach the platforms due to winter sea ice. Oil and gas are transported via two 800 kilometre long onshore pipelines to a new liquefied natural gas (LNG) plant and oil and LNG export terminal located at Prigorodnoye, on the south of Sakhalin Island. Peak crude oil/condensate production capacity from the three offshore platforms is expected to be about 180,000 barrels per day (about 8.2 mtpa). The LNG production capacity is expected to be about 9.6 mtpa for more than 25 years. Oil and LNG are shipped to markets in the Asia-Pacific region and beyond. Japan already has extensive experience in combating large scale heavy contamination of its shoreline because of a dramatic tanker accident at sea. In January 1997, the Russian-registered tanker “Nakhodka” broke apart in the Sea of Japan, approximately 110 km north-east of the Oki Islands, whilst en-route from Shanghai, China to Petropavlovsk, Russian Federation, carrying 19,000 tons of medium crude oil as its cargo. The combination of the initial release of 6,200 tons of medium-crude oil, followed by the continual slow leak from the sunken tanker, resulted in heavily-contaminated shorelines in the region estimated at over 1,000 km of coast [2]. Over 1 million volunteers from all over the country took part in the oil recovery work [3]. The “Nakhodka” tanker accident reveals a risk of possible future oil spills hitting the Japanese coastline and served as the impetus for a great deal of research, including spilled oil spreading simulations, aimed at better oil spill combat preparedness in the future [4–6]. Later on, a number of oil spill scenarios were also simulated for the Environmental Impact Assessment (EIA), conducted by Sakhalin Energy Investment Company (SEIC), which is implementing the Sakhalin II Phase 2 project – an integrated oil and gas project to produce crude oil and condensate, and liquefied natural gas (LNG) for international export from Sakhalin Island [1]. Sawano [7] has analyzed the oil pollution impact on sand beaches, caused by the Nakhodka’s accident, and the sensitivity of sand beaches to oil pollution. The author argues that vegetation on a sandy beach is of little importance in relation to oil residue, but plays a great role in protecting the shoreline: following oil recovery works performed by heavy construction machines on sandy beaches with plenty of vegetation, large-scale sand erosion occurred. Terhuisa et al. [8] published the results of studies on the impacts of the “Nakhodka” medium crude oil spill on an intertidal ecosystem, using the geographical information system (GIS) for impact evaluation. The study showed that following the accident there were heavily oiled areas in sheltered regions, but these decreased over a period of three years. GIS based evaluation also showed that coverage by macroalgae and the number of animals increased, although some species of algae with microscopic sporophyte generations, and some populations of perennial shellfish, remained stable or decreased during the
www.witpress.com, ISSN 1743-3517 (on-line) WIT Transactions on Information and Communication Technologies, Vol 43, ©2010 WIT Press
PI-36 Risk Analysis VII

study period. Ishida et al. [9] is analysing the “Nakhodka” oil spill in the Sea of Japan, and concludes that because Japan depends on oil as an important source of energy, it is impossible to reduce the number of tanker accidents to zero, while in fact there is a danger of the number of accidents increasing with the continuing industrialization of Asia. Development of Environmental Sensitivity Index (ESI) maps for the coastal zone of Japan has contributed notably to the oil spill related preparedness of this country [10–12]. ESI maps serve as quick references for oil spill responders, comprising three general types of information: 1) shoreline classification, 2) biological resources, and 3) human-use resources [13]. A well advanced ESI map of the Hokkaido Island shoreline also benefited from this study. There is an existing level of risk to the coastline of Japan from crude oil spills, while full phase Sakhalin 2 production is anticipated to require one oil tanker every four days (approximately 90 per annum) and an LNG tanker every two days, a combined total of approximately 239 per year [1]. Sawano [14] argues that large offshore oil and gas development projects that have been started on the Sakhalin shelf and the sea of Okhotsk require multi-national cooperative spill response. As stated by Schei and Brubaker [15] certain marine areas in the Okhotsk Sea may already be designated as possibly requiring special environmental coverage related to international shipping, due to their sensitivity encompassing, but not to be limited to, grey whale habitats, productive fishing grounds, the eastern shore of Sakhalin, the Tatar Strait, and zones around offshore platforms. The same concerns are valid also for Hokkaido Island’s ecologically extremely valuable and sensitive coastal sea areas. This paper is focused on the issue of integration of the oil spill response simulation tools into an extended simulation environment based on the Bayesian Belief Networks (BBNs), including the Bayesian tool that is used to support consensus building among oil spill response managers. The issue is exemplified by the oil spill scenario development for the coastline of the northern part of Hokkaido Island.
2 Material and methods
Study area includes La Perouse (Soya) Strait, 40 km in width, which separates Hokkaido Island (Japan) from Sakhalin Island (Russia), and connects the Sea of Japan to the west with the Sea of Okhotsk to the east (Figure 1). The region has a dense network of navigation routes traversing its waters and is characterized by the growing risk of accidental oil spills. Vessel Automatic Identification System (AIS) data are collected for that extremely busy shipping area using the Transas T300 AIS station at Soya. The Potential Incident Simulation Control and Evaluation System (PISCES 2) is used to simulate the spreading of spilled oil. The PISCES 2 application simulates processes in an oil spill on the surface of the water: transport by currents and wind, spreading, evaporation, dispersion, emulsification, viscosity variation, burning, and interaction with booms, skimmers, and the coastline (stranding or beaching) [16].
www.witpress.com, ISSN 1743-3517 (on-line) WIT Transactions on Information and Communication Technologies, Vol 43, ©2010 WIT Press
Risk Analysis VII PI-37
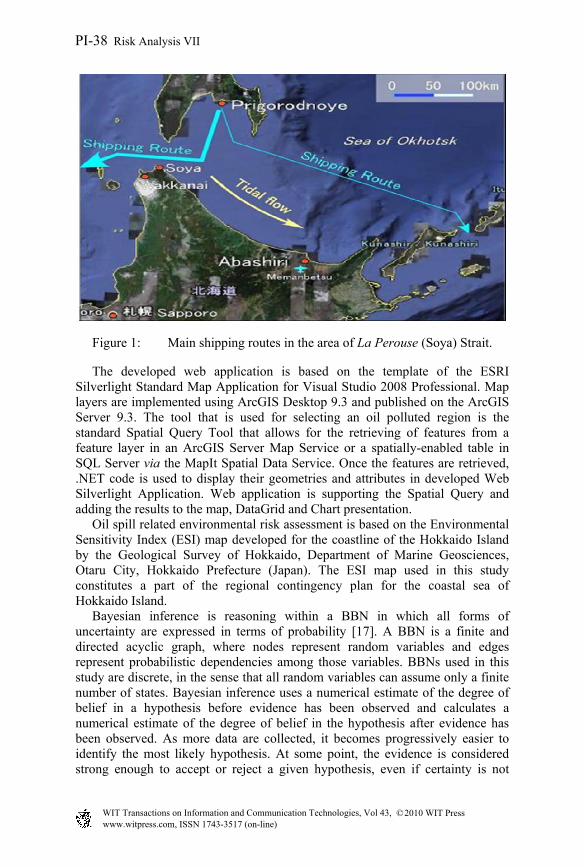
Figure 1: Main shipping routes in the area of La Perouse (Soya) Strait.
The developed web application is based on the template of the ESRI Silverlight Standard Map Application for Visual Studio 2008 Professional. Map layers are implemented using ArcGIS Desktop 9.3 and published on the ArcGIS Server 9.3. The tool that is used for selecting an oil polluted region is the standard Spatial Query Tool that allows for the retrieving of features from a feature layer in an ArcGIS Server Map Service or a spatially-enabled table in SQL Server via the MapIt Spatial Data Service. Once the features are retrieved, .NET code is used to display their geometries and attributes in developed Web Silverlight Application. Web application is supporting the Spatial Query and adding the results to the map, DataGrid and Chart presentation. Oil spill related environmental risk assessment is based on the Environmental Sensitivity Index (ESI) map developed for the coastline of the Hokkaido Island by the Geological Survey of Hokkaido, Department of Marine Geosciences, Otaru City, Hokkaido Prefecture (Japan). The ESI map used in this study constitutes a part of the regional contingency plan for the coastal sea of Hokkaido Island. Bayesian inference is reasoning within a BBN in which all forms of uncertainty are expressed in terms of probability [17]. A BBN is a finite and directed acyclic graph, where nodes represent random variables and edges represent probabilistic dependencies among those variables. BBNs used in this study are discrete, in the sense that all random variables can assume only a finite number of states. Bayesian inference uses a numerical estimate of the degree of belief in a hypothesis before evidence has been observed and calculates a numerical estimate of the degree of belief in the hypothesis after evidence has been observed. As more data are collected, it becomes progressively easier to identify the most likely hypothesis. At some point, the evidence is considered strong enough to accept or reject a given hypothesis, even if certainty is not
www.witpress.com, ISSN 1743-3517 (on-line) WIT Transactions on Information and Communication Technologies, Vol 43, ©2010 WIT Press
PI-38 Risk Analysis VII

achieved. HUGIN RESEARCHER software is used to build up the BBNs used in this study.
3 Results and discussion
Analysis of data collected by the Transas T300 AIS station at Soya shows that the extremely busy shipping in the La Perouse (Soya) Strait (Figure 1) is also characterized by the number of dangerous crossings, while the majority of that transport is oil and LNG: see example in Figure 2. Therefore, the oil spill related risk assessment and the response advice is an issue of high priority for this ecologically highly sensitive marine area. With the aim being to illustrate the use of the web application, the oil spill scenario is developed based on a Net Environmental Benefit Analysis (NEBA) methodology [18]. According to that scenario, 20 tons of ADGO Crude (IV) oil is spilled at sea (accident centre position 45 27.342 N, 142 30.856 E.
3.1 What is the expected drift, behaviour and fate of the spilled oil?
The PISCES 2 software suite was used to simulate the oil spill trajectory and the pollution footprint. Initial weather conditions used for the simulation of the accidental oil spill, close to the coast of Hokkaido Island, are as follows: air temperature 200C, sea surface temperature 150C, current 138 deg and force 0.1 m/s, wind 215 deg and force 25 m/s. Spilled oil transport by current and the wind as well as the shore interaction is simulated. For the sake of simplicity, in this particular case the spilled oil evolution (weather forecast relayed uncertainty, spreading, diffusion, evaporation, dispersion and emulsification) is not
Figure 2: AIS data for the La Perouse (Soya) Strait (2009.06.01–2009.06.30)
www.witpress.com, ISSN 1743-3517 (on-line) WIT Transactions on Information and Communication Technologies, Vol 43, ©2010 WIT Press
Risk Analysis VII PI-39

calculated. Calculated time from the oil spill until oil stranding is 12 hours 11 minutes, and the amount of the oil stranded is 19.9 tones. Centre position of stranded oil is: 45 12.592 N, 142 18.188 E. The oil spill simulation approach used in this study is based on the PISCES 2 software application and it differs from the approaches used, e.g., for the Environmental Impact Assessment (EIA) by Sakhalin Energy Investment Company (SEIC). Our study focuses directly on the particular oil spill scenario, while the mentioned EIA related simulations have produced numerous maps of risk zones (spill trajectory envelopes) that are showing the time in hours for spilled oil to reach a certain sea area [1].
3.2 Can the oil spill be combated at sea?
The BBN developed for the oil spill related NEBA process [18] is used to answer the question: can the particular oil spill in question be combated at sea using booms and skimmers? Scenario specific current and wind fields are used. In more advanced cases, external sources of hydrometeorological data should be used. The hydrometeorological information supplied by the external sources, such as automatic weather stations, meteo buoys, etc., is processed by the Meteo Data Server which transmits it via HMI protocol used in PISCES 2. Based on that information, the PISCES 2 calculates the expected position and the expected time for the oil to come ashore. Mobilization time – the time for a ship/aircraft to reach the site of an oil incident scene depends on the time 1) required to be ready to go and the time 2) to reach the location of the spill – is also imported from the PISCES 2 modelling suite simulation results. Collected and calculated accidental oil spill related actual information (current and wind force, and mobilization time) is used to amend the information variables of the BBN with the aim to bring a hypothesis variable (efficiency of booms and skimmers) to a state that is consistent with the new information [19]. According to the simulated scenario, the estimated probability of the efficient use of booms and skimmers is very low because of rough weather (Figure 3).
Figure 3: Strong current > 0.58 m/s, and a very strong wind > 18 m/s. Mobilization time is less than the time for oil to wash ashore. Use of booms and skimmers is expected to be extremely inefficient with a probability of 0.99.
www.witpress.com, ISSN 1743-3517 (on-line) WIT Transactions on Information and Communication Technologies, Vol 43, ©2010 WIT Press
PI-40 Risk Analysis VII

Simulation of the combating of the spilled oil at sea, by burning and/or use of dispersants and sorbent application, is not a part of this study. It should only be mentioned here that burning is a source of atmospheric pollution via smoke, and the ecological sensitivity of the coastal sea areas may be the reason for the limited use of dispersants.
3.3 Is the oil threatening a sensitive resource?
If the use of the booms and skimmers is expected to be inefficient, it is almost impossible to prevent the oil from reaching shore. In this case, the sensitive resources of the coastal sea areas likely to be impacted by the oil should be identified, with the aim to support decisions on whether or not a response is necessary or what kind and extent of response is appropriate. The ESI map of Hokkaido Island is used to assess the oil spill related environmental risk caused by the stranding of the oil. According to the scenario, the spilled oil is expected to wash ashore and pollute 7731 m of shoreline. The shoreline that is expected to be affected by oil includes the following ESI shoreline elements: (1) 1502 m of a gravel beach (ESI 2 6020), (2) 1793 m of fine to medium grained sand (ESI 2 3010), and (3) 4436 m of coarse grained sand (ESI 2 4010). In this case, the oil spill related environmental risk is characterized by the ESI value and the extent of the corresponding shoreline element: greater extent and a higher ESI value means higher risk. Web-GIS applications have already been successfully used in oil spill response management for the oil spill impacted coastline of Japan. Goto and Oyama [20] reported on the efficient use of integrated GIS and Web-GIS applications for the oil-spill incident response, making use of some lessons from the Nakhodka oil-spill disaster. Use of geo-informatics on near-shore management of oil spill accidents impacting the coastline of Japan has been further discussed by Goto and Kim [21]. The authors argue that the use of geo-informatics proved to be efficient in supporting the decision making on the oil recovery, monitoring of the heavy oil washed ashore, and the overall environmental assessment.
3.4 Consensual decision on the shore cleanup
Cleaning the coastline after an oil spill is time-consuming, extremely costly and, in addition, it may have a destructive and long-term negative impact on the marine habitats concerned. Etkin [22] argues that the type of oil spilled, accident location, and the local social culture are the most important determinants of cleanup costs, while the location itself is a complex factor involving geographical, political and legal considerations. The type of oil spilled is a significant factor in determining cleanup costs: the more persistent and viscous the oil is the more widespread the contamination and the more difficult removal will be. Proximity of stranded oil to sensitive resources and the social culture that places a high value on environmental preservation have a large influence on shore cleanup costs. Therefore, choices made in cleanup strategies and the
www.witpress.com, ISSN 1743-3517 (on-line) WIT Transactions on Information and Communication Technologies, Vol 43, ©2010 WIT Press
Risk Analysis VII PI-41
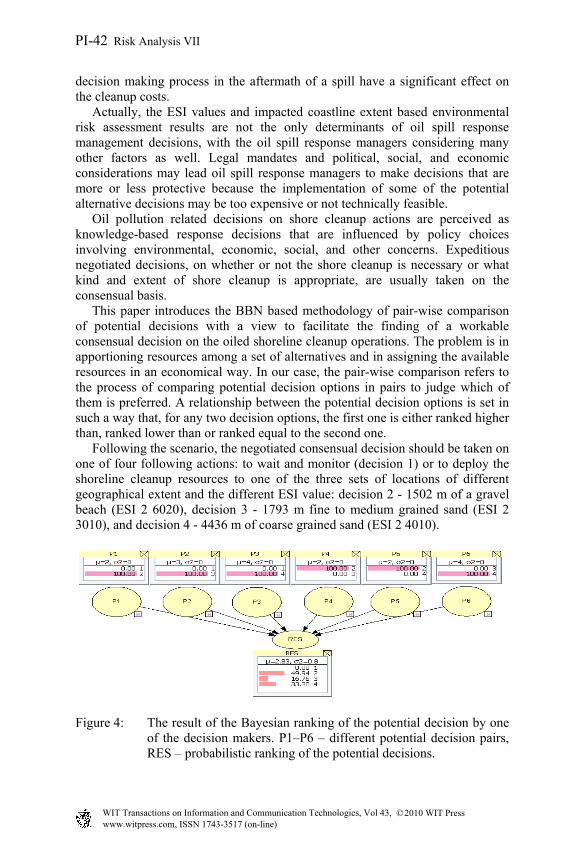
decision making process in the aftermath of a spill have a significant effect on the cleanup costs. Actually, the ESI values and impacted coastline extent based environmental risk assessment results are not the only determinants of oil spill response management decisions, with the oil spill response managers considering many other factors as well. Legal mandates and political, social, and economic considerations may lead oil spill response managers to make decisions that are more or less protective because the implementation of some of the potential alternative decisions may be too expensive or not technically feasible. Oil pollution related decisions on shore cleanup actions are perceived as knowledge-based response decisions that are influenced by policy choices involving environmental, economic, social, and other concerns. Expeditious negotiated decisions, on whether or not the shore cleanup is necessary or what kind and extent of shore cleanup is appropriate, are usually taken on the consensual basis. This paper introduces the BBN based methodology of pair-wise comparison of potential decisions with a view to facilitate the finding of a workable consensual decision on the oiled shoreline cleanup operations. The problem is in apportioning resources among a set of alternatives and in assigning the available resources in an economical way. In our case, the pair-wise comparison refers to the process of comparing potential decision options in pairs to judge which of them is preferred. A relationship between the potential decision options is set in such a way that, for any two decision options, the first one is either ranked higher than, ranked lower than or ranked equal to the second one. Following the scenario, the negotiated consensual decision should be taken on one of four following actions: to wait and monitor (decision 1) or to deploy the shoreline cleanup resources to one of the three sets of locations of different geographical extent and the different ESI value: decision 2 - 1502 m of a gravel beach (ESI 2 6020), decision 3 - 1793 m fine to medium grained sand (ESI 2 3010), and decision 4 - 4436 m of coarse grained sand (ESI 2 4010).
Figure 4: The result of the Bayesian ranking of the potential decision by one of the decision makers. P1–P6 – different potential decision pairs, RES – probabilistic ranking of the potential decisions.
www.witpress.com, ISSN 1743-3517 (on-line) WIT Transactions on Information and Communication Technologies, Vol 43, ©2010 WIT Press
PI-42 Risk Analysis VII
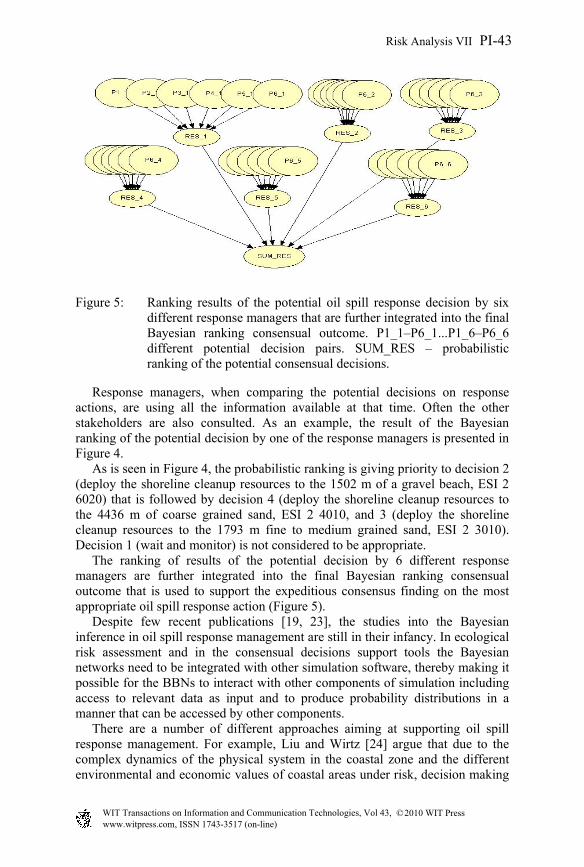
Figure 5: Ranking results of the potential oil spill response decision by six different response managers that are further integrated into the final Bayesian ranking consensual outcome. P1_1–P6_1...P1_6–P6_6 different potential decision pairs. SUM_RES – probabilistic ranking of the potential consensual decisions.
Response managers, when comparing the potential decisions on response actions, are using all the information available at that time. Often the other stakeholders are also consulted. As an example, the result of the Bayesian ranking of the potential decision by one of the response managers is presented in Figure 4. As is seen in Figure 4, the probabilistic ranking is giving priority to decision 2 (deploy the shoreline cleanup resources to the 1502 m of a gravel beach, ESI 2 6020) that is followed by decision 4 (deploy the shoreline cleanup resources to the 4436 m of coarse grained sand, ESI 2 4010, and 3 (deploy the shoreline cleanup resources to the 1793 m fine to medium grained sand, ESI 2 3010). Decision 1 (wait and monitor) is not considered to be appropriate. The ranking of results of the potential decision by 6 different response managers are further integrated into the final Bayesian ranking consensual outcome that is used to support the expeditious consensus finding on the most appropriate oil spill response action (Figure 5). Despite few recent publications [19, 23], the studies into the Bayesian inference in oil spill response management are still in their infancy. In ecological risk assessment and in the consensual decisions support tools the Bayesian networks need to be integrated with other simulation software, thereby making it possible for the BBNs to interact with other components of simulation including access to relevant data as input and to produce probability distributions in a manner that can be accessed by other components. There are a number of different approaches aiming at supporting oil spill response management. For example, Liu and Wirtz [24] argue that due to the complex dynamics of the physical system in the coastal zone and the different environmental and economic values of coastal areas under risk, decision making
www.witpress.com, ISSN 1743-3517 (on-line) WIT Transactions on Information and Communication Technologies, Vol 43, ©2010 WIT Press
Risk Analysis VII PI-43

during the oil spill response planning becomes a difficult task. The authors emphasise that, if not in the process itself then at least in the aftermath and during the political evaluation of the combat strategy, various interested groups such as commercial organizations, NGOs, scientific institutions and local stakeholders are involved. Authors are developing the modelling framework for sequential negotiation in multi-agent systems for oil spill response decision making. Consensus facilitating techniques are used to develop a decision support system in order to take into account the influence of multiple criteria and the knowledge of different interested groups in simulating a consensus based decision process [25–27].
4 Conclusions
This paper is focused on the issue of the integration of oil spill response simulation tools into an extended simulation environment based on BBNs. Furthermore, it is believed that the BBN based integrated modelling environment under development would, at a later stage, also be applicable to a wide range of oil spill response related negotiation problems, such as the allocation of oil spill response resources and the assignment of the associated costs.
Acknowledgements
We would like to thank the TRANSAS GROUP for their kind permission to use the latest edition of the PISCES 2 software. The study was supported by the Estonian Science Foundation through grant No 7609 and target financing program SF0180104s08.
References
[1] Sakhalin Energy Investment Company (SEIC). Environmental Impact Assessment (EIA) for the Sakhalin II Phase 2 project. EIA Addendum: Chapter 2 Oil Spill Response, 116 p. 2005.
[2] Moller, T.H. The NAKHODKA oil spill response – the technical adviser’s perspective. Petroleum Association of Japan (PAJ) Oil Spill Symposium 97, 10-11 July 1997, Tokyo, Japan. 11 p. 1997.
[3] Sawano, N. What has happened after Nakhodka’s oil spill? Recent advances in marine science and technology, 98. PACON International. pp. 245-252. 1998.
[4] Kochergin, I.E., Bogdanovsky, A.A., Budaeva, V.D., Makarov, V.G., Mishukov, V.F., Ovsienko, S.N., Putov, V.F., Reitsema, L.A., Sciallabba, J.W., Sergusheva, O.O., Yarosh, P.V. Modeling of oil spills for the shelf conditions of northeastern Sakhalin (pp. 123-130). In: Lobanov, V.B. and Nagata, Y. and Riser, S.C., (Eds). Proceedings of the Second PICES Workshop on the Okhotsk Sea and Adjacent Areas [Nemuro, Japan,
www.witpress.com, ISSN 1743-3517 (on-line) WIT Transactions on Information and Communication Technologies, Vol 43, ©2010 WIT Press
PI-44 Risk Analysis VII

November 9-12, 1998] Sidney, British Columbia. North Pacific Marine Science Organization (PICES), PICES Scientific Report, 12. 1998.
[5] Varlamov, S.M., Yoon, J.-H., Hirose, N., Kawamura, H., Shiohara, K. Simulation of the oil spill processes in the Sea of Japan with regional ocean circulation model. J. Mar. Sci. Technol. 4, pp. 94–107. 1999.
[6] Kawamura, H., Kobayashi, T., Hirose, N., Ito, T., Togawa, O. Oil spill simulation in the Japan Sea. In: C.A. Brebbia (Ed), Environmental Problems in Coastal Regions VI: Including Oil and Chemical Spill Studies. Wessex Institute of Technology, UK, pp 273-278. 2006.
[7] Sawano, N. What has been happening after oil spill on sand beach. Proceedings of the 1999 International Oil Spill Conference. Seattle, Washington, Paper, 4 p. 1999.
[8] Komatsu Teruhisa, Nakaoka Masahiro, Kawai Hiroshi, Yamamoto Tomoko, Ohwada Kouichi. Impacts of the Nakhodka heavy-oil spill on an intertidal ecosystem: an approach to impact evaluation using geographic information systems. Marine Pollution Bulletin, 47: 99–104, 2003.
[9] Ishida, H., Saitoh, T., Yuhi, M. The Nakhodka oil spill and future preventative measures. Journal of Natural Disaster Science, 20(1), pp. 41-47. 1998.
[10] Sawano, N., Matsui, K. Development of ESI Map and Web-GIS. [in Japanese]. Proc. of JSPRS, pp. 335-337. 2000.
[11] Sawano, N. What makes ESI maps more efficacious? Proceedings of the 2001 International Oil Spill Conference, Tampa, Florida, USA, pp. 405-409. 2001.
[12] Masaki, S., Gell, D., Dauterman, A., Verkennes, K., Sawano, N. Development of environmental sensitivity index maps in Japan. Proceedings of the 2001 International Oil Spill Conference, Tampa, Florida, USA, pp. 775-782. 2001.
[13] NOAA. Environmental Sensitivity Index Guidelines, Version 2.0. NOAA Technical Memorandum NOS ORCA 115. Seattle: Hazardous Materials Response and Assessment Division, National Oceanic and Atmospheric Administration. 79 p. 1997.
[14] Sawano, N. Spill contingency plans: for international ‘regional’ cooperation. International Oil Spill Conference. Miami Beach, Florida, USA, Paper, 4 p. 2005.
[15] Schei, P.J., Brubaker, R.D. Suggestions for a Conceptual Design of an Okhotsk Sea Environmental Regime – Comparison with the Barents Sea. In Kitagawa, Hiromitsu (ed), New Era in Far East Russia & Asia. Tokyo, Ocean Policy Research Foundation, pp. 259-276. 2006.
[16] Delgado, L., Kumzerova, E., Martynov, M. Simulation of oil spill behavior and response operations in PISCES. Environmental Problems in Coastal Regions VI including Oil Spill Studies. Ed. C.A. Brebbia, Wessex Institute of Technology, 279-292. 2006.
[17] Freund, J.E. Introduction to probability. Dover Publications, Inc., New York. 247 p. 1973.
www.witpress.com, ISSN 1743-3517 (on-line) WIT Transactions on Information and Communication Technologies, Vol 43, ©2010 WIT Press
Risk Analysis VII PI-45

[18] Schallier, R., DiMarcantonio, M., Roose, P., Scory, S., Jacques, T.G., Merlin, F. X., Guyomarch, J., Le Guerroué, P., Duboscq, K., Melbye, A., Resby, J.L.M., Singsaas, I., Leirvik, F. NEBAJEX Pilot Project – Final Report. Royal Belgian Institute of Natural Sciences. 100 p. 2004.
[19] Aps, R., Herkül, K., Kotta, J., Kotta, I., Kopti, M., Leiger, R., Mander, Ü., Suursaar, Ü. Bayesian inference for oil spill related Net Environmental Benefit Analysis. In: C.A. Brebbia, G. Benassai, G.R. Rodriguez (Eds). Coastal Processes (pp. 235 - 246). Southampton, Boston: WIT Press. 2009.
[20] Goto, S., Oyama, H. Integration use of GIS and Web-GIS for the oil-spill incident making use of some lessons from the Nakhodka oil-spill disaster in Jan. 1997. Pap. 384, 1999 International Oil Spill Conference. Seattle, Washington. 1999.
[21] Goto, S., Kim, S.-W. Use of geo-informatics on nearshore management in oil spill accidents. Proceedings of the 2001 International Oil Spill Conference, Tampa, Florida, USA, pp. 489-495. 2001.
[22] Etkin, D.S. Worldwide Analysis of Oil Spill Cleanup Cost Factors. Proc. of 23rd Arctic and Marine Oil Spill Program Technical Seminar, pp. 161-174. 2000.
[23] Aps, R., Fetissov, M., Herkül, K., Kotta, J., Leiger, R., Mander, Ü., Suursaar, Ü. Bayesian inference for predicting potential oil spill related ecological risk. In: M. Guarascio, C.A. Brebbia, F. Garzia (Eds). Safety and Security Engineering (pp. 149 - 159). UK: WIT Press. 2009.
[24] Liu, X., Wirtz, K.W. Sequential negotiation in multiagent systems for oil spill response decision-making, Mar. Pollut. Bull. 50, pp 469–474. 2005.
[25] Liu, X., Wirtz, K.W. Consensus oriented fuzzified decision support for oil spill contingency management. Journal of Hazardous Materials, A134, pp.27–35. 2006.
[26] Liu, X., Wirtz, K.W., Adam S. Fuzzy Comprehensive Evaluation for the Optimal Management of Responding to Oil Spill. In: L. Wang and Y. Jin (Eds). Fuzzy Systems and Knowledge Discovery, Lecture Notes in Computer Science, Volume 3613/2005, 662-671. 2005.
[27] Liu, X., Wirtz, K.W. Decision making of oil spill contingency options with fuzzy comprehensive evaluation. Water resources management. 21(4), pp. 663-676. 2007.
www.witpress.com, ISSN 1743-3517 (on-line) WIT Transactions on Information and Communication Technologies, Vol 43, ©2010 WIT Press
PI-46 Risk Analysis VII