bayesian network-based predictive analytics applied to invasive species distribution
TRANSCRIPT

Bayesian network-based predictive analytics applied to invasive species
distribution
Wisdom Mdumiseni Dlamini
-PhD Student / Director of Nature Conservation-
University of South Africa / Swaziland National Trust
Commission

2
Outline of the Talk
Aims Introduction Invasive alien plant species distribution modelling Bayesian networks (BNs) Methods (Predictive analytics –data mining using BNs) Findings Conclusions and on-going research.

3
Aims
Investigate suitability of Bayesian networks (BNs) for species distribution (geospatial) data analysis (Chromolaena odorata and Lantana camara cases in Swaziland)
Apply BN learning for geospatial predictive analytics (data mining) and ecological knowledge discovery
Demonstrate potential/usefulness of BN-based data mining for geospatial analysis and decision-making
4
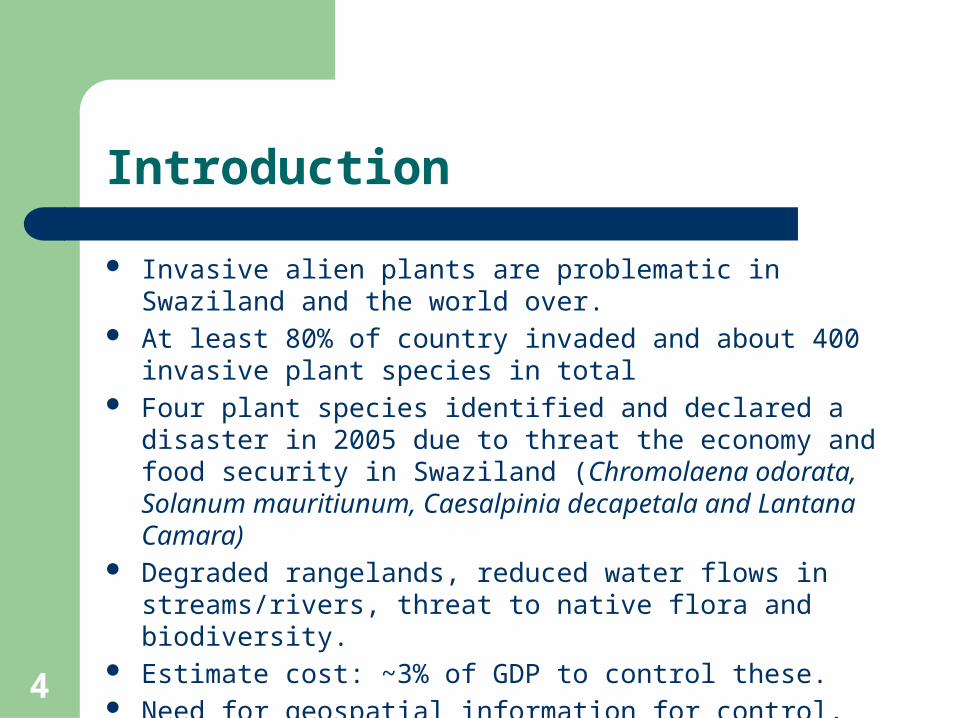
Introduction
Invasive alien plants are problematic in Swaziland and the world over.
At least 80% of country invaded and about 400 invasive plant species in total
Four plant species identified and declared a disaster in 2005 due to threat the economy and food security in Swaziland (Chromolaena odorata, Solanum mauritiunum, Caesalpinia decapetala and Lantana Camara)
Degraded rangelands, reduced water flows in streams/rivers, threat to native flora and biodiversity.
Estimate cost: ~3% of GDP to control these. Need for geospatial information for control, planning and decision-
making and understanding their ecology

5
Introduction
Chromolaena odorata
(Photos R. Mackenzie) Lantana camaraPhoto: K Braun
6
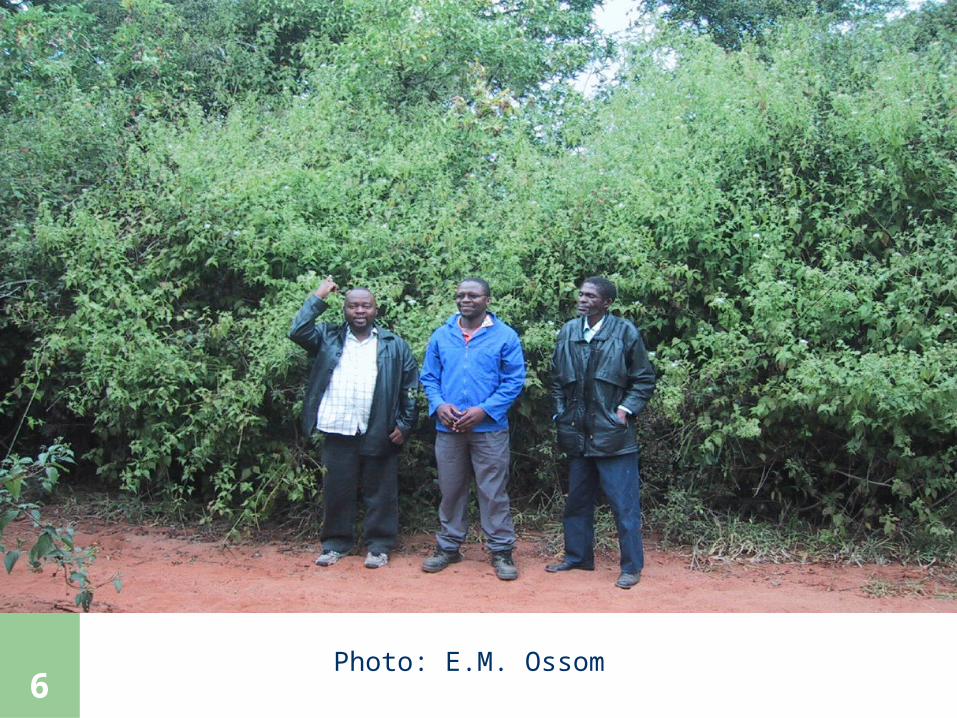
Introduction
Photo: E.M. Ossom

7
Invasive alien plant species distribution modelling
All species distribution modeling approaches model the function approximating the true relationship between the environment and species geographic occurrences/distribution.
Objective is to estimate some function f = μ(Gdata, E) - i.e. applying an algorithm to data given an environmental space E to estimate G (distribution)
Used in ecology to:– model present, past and future distribution of species – predicting disease spread– predicting invasive species spread– niche conservation

8
Invasive alien plant species distribution modelling (ceveats)
Many algorithms do not handle asymmetric data Many don’t handle interaction effects Some do not handle nominal/categorical environmental
variables (e.g. vegetation types) Many stochastic algorithms present different solutions even
under identical parameterization and input data ‘real’ distribution of species not known, so we do not know
when models are making mistakes and when are filling knowledge gaps.

9
Invasive alien plant species distribution modelling (ceveats)
Which factors determine the distribution of species:– The answer is often complicated (but important)– Species have physiological tolerances, migration limitations
and evolutionary forces that limit adaptation– A starting point for physiology may be traits– A starting point for abiotic factors is often climate– Climate variables often also correlate with other variables (e.g.
elevation, land cover)

10
Invasive alien plant species distribution modelling
Need for algorithms that will address the issues in previous slide
Additionally, conventional SDMs are correlative and do not adequately capture causal species-environment relationships and ecological knowledge
There remains a critical gap in the understanding of processes that induce observed invasion spatial patterns
11
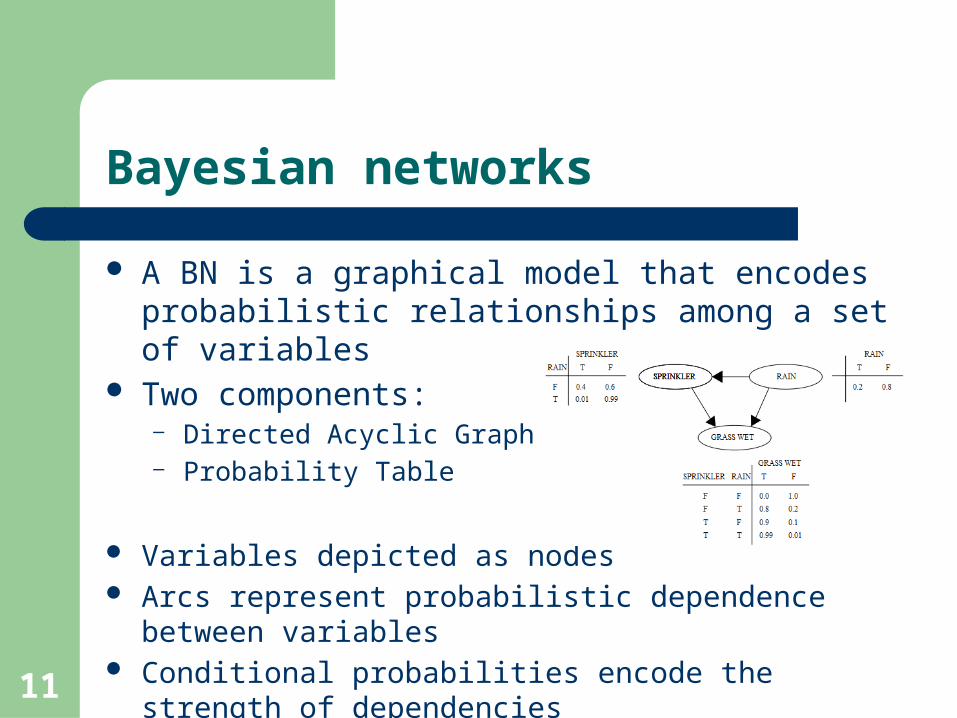
Bayesian networks
A BN is a graphical model that encodes probabilistic relationships among a set of variables
Two components:– Directed Acyclic Graph (DAG)– Probability Table
Variables depicted as nodes Arcs represent probabilistic dependence between variables Conditional probabilities encode the strength of
dependencies Lack of an arc denotes a conditional independence

12
Bayesian networks
• Bayes theorem : the posterior probability for given D and a background knowledge :
p(/D, ) = p( / ) p (D/ , )
P(D / )
Where p(D/ )= p(D/ , ) p( / ) d
Note : is an uncertain variable whose value corresponds to the possible true values of the physical probability

13
Bayesian network example
A B
C
D
A Bayesian network represents potentially causal patterns, which tend to be more useful for intelligent decision making
Bayesian networks
However, algorithms for constructing Bayesian networks from data were not designed to discover interesting patternsCombined novel feature selection and structure learning is interesting by nature
Causality + interestingness tends to improve Usefulness

14
Bayesian networks
BNs can readily handle incomplete (missing) data BNs allow one to learn about causal relationships BNs readily facilitate use of prior knowledge Bayesian methods provide an efficient method for
preventing the over fitting of data (there is no need for complex pre-processing and data transformation)
BNs also handle uncertainty very well Graphical nature readily allows for interpretation of
interrelationships/interactions between variables

15
Methodology
Identify the modelling goals Identify many possible observations/variables that may
be relevant to the problem Determine what subset of those observations is
worthwhile to model Organize the observations into variables having
mutually exclusive and collectively exhaustive states. Build a Directed Acyclic Graph that encodes the
assertions of conditional independence Use the graph to describe the ecology species invasion
patterns and processes
16

17
Methodology
“Knowledge Discovery in Databases (KDD) is the non-trivial process of identifying valid, novel, potentially useful, and ultimately understandable patterns in data” (Fayyad et al., 1996)
Focus on the quality of discovered patterns– A lot of research on discovering valid, accurate patterns– Little research on discovering potentially useful patterns
Data Mining consists of extracting patterns from data, and is the core step of the knowledge discovery process
18
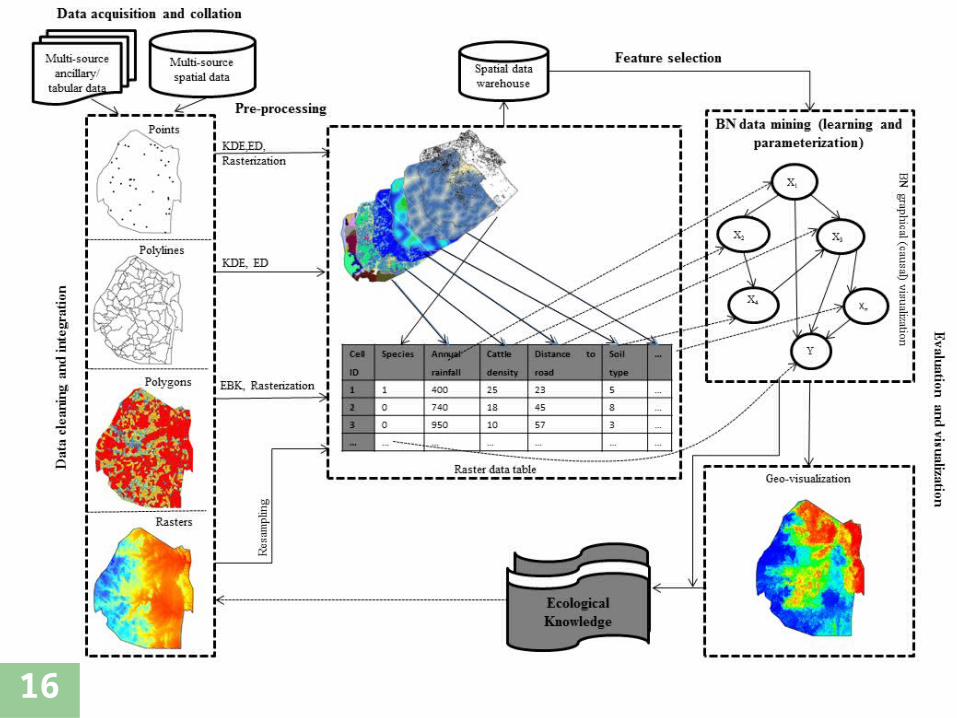
Methodology
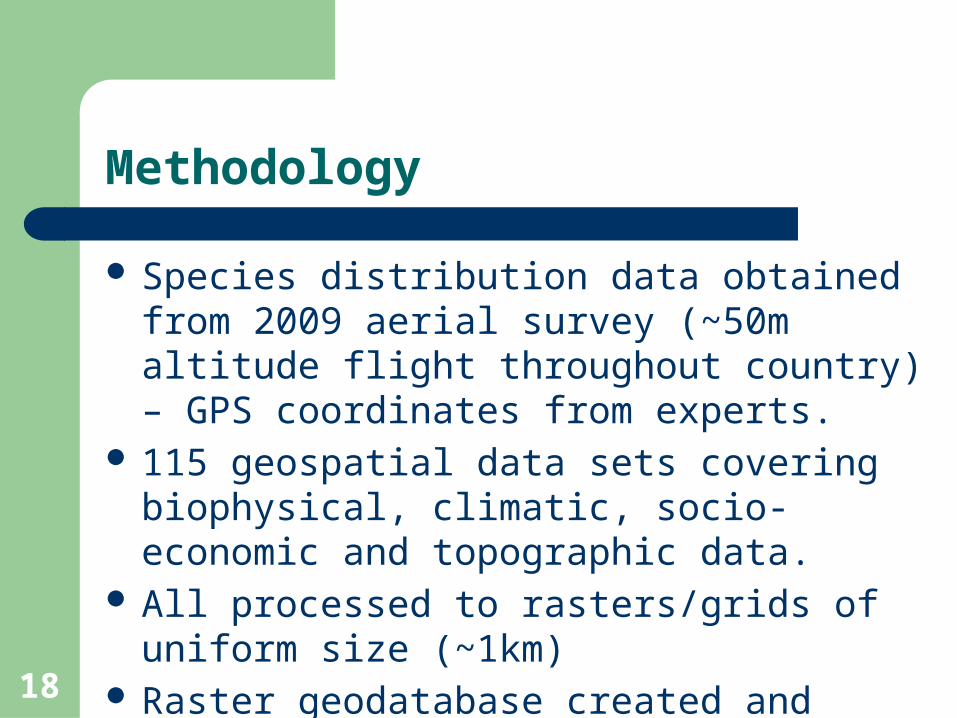
Species distribution data obtained from 2009 aerial survey (~50m altitude flight throughout country) – GPS coordinates from experts.
115 geospatial data sets covering biophysical, climatic, socio-economic and topographic data.
All processed to rasters/grids of uniform size (~1km)
Raster geodatabase created and exported to CSV file

19
Methodology
CSV file imported to Weka (open source machine learning/data mining package) for analysis
Most species occurrence data was imbalanced (i.e. too many absence (-ve) than presence (+ve) instances) - Sampling variation and/or noisy data may mislead the BN construction method, further contributing to the discovery of a sub-optimal BN.
Data balancing implemented using Spread Subsample approach
Discretization (using Minimum Description Length (MDL) criterion with Kononenko correction)

20
Methodology
The problem of constructing the optimal net is too complex in large datasets
Feature selection– Hybrid approach: GainRatio Attribute Evaluation followed by
Peng’s maximum Relevance minimum Redundancy (mRmR) subset evaluation algorithm based on Correlation-based Feature Subset (CFS) selection and Symmetric Uncertainty
– The CFS search was done via particle swarm optimization (PSO)
– Done to reduce data dimensionality and redundancy whilst simultaneously ensuring that only relevant, predictive and uncorrelated features (variables) are selected

21
Methodology
Various structure learning approaches being implemented and tested on final subset of variables.
Both local and global search strategies were implemented using Bayes score.
Methods based on search guided by a scoring function– Iteratively create candidate solutions (BNs) and evaluate the
quality of each created network using a scoring function, until a stopping criteria is satisfied
– Sequential methods consider a single candidate solution at a time
– Population-based methods consider many candidate solutions at a time

22
Methodology
Conditional independence based algorithms also used (CI and Inductive Causation (ICS) to extract causal relationships. – Not scalable to datasets with many variables (attributes)
Markov blanket applied in all cases (i.e. all variables constitute the set of parents and children and parents of children of the class variable).

23
Methodology
Examples of sequential method– Hill climbing algorithm starts with an empty network and at
each iteration adds, to the current candidate solution, the edge that maximizes the value of the scoring function
– K2 algorithm requires that the variables be ordered and the user specifies a parameter: the maximum number of parents of each variable in the network to be constructed
Both are greedy methods (local search), which offer no guarantee of finding the optimal network
Population-based methods are global search methods, but are stochastic, so again no guarantees

24
C. odorata BNNB: the probabilistic dependencies between variables

25
Legend
Probability
Note the complexity on spatial distribution highlighting a complex interplay of factors
26
Identified invasion hotspots not identified by training data but verified with independent tree atlas data

27
Findings
C. odorata ROC Recall (Sensitivity)
Minimum 0.85 0.90
Mean 0.87 0.94
Maximum 0.88 0.99
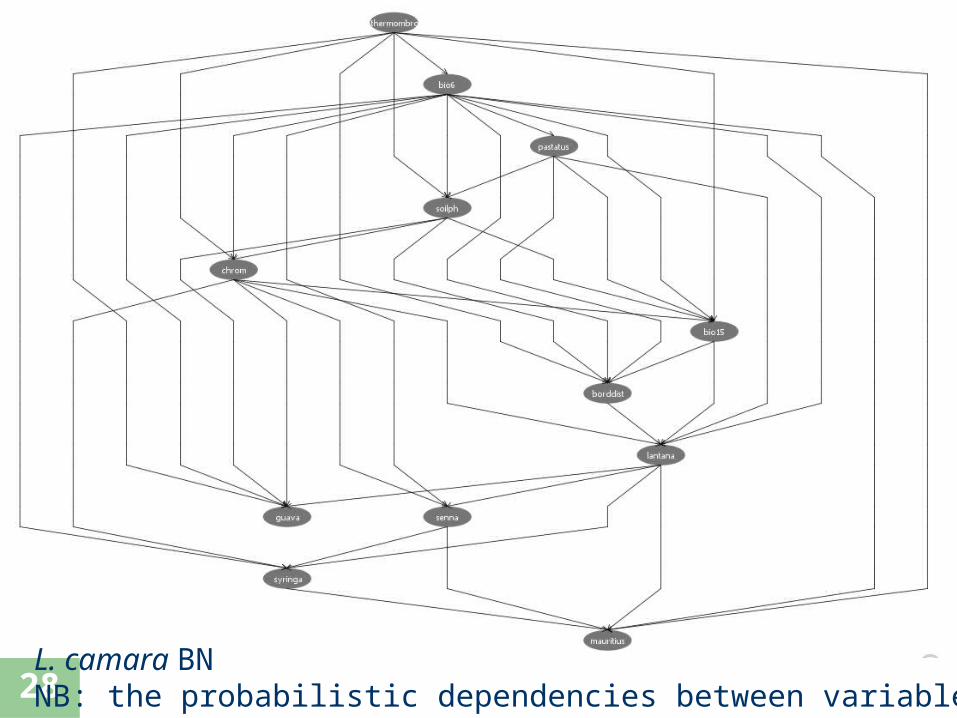
28L. camara BNNB: the probabilistic dependencies between variables

29
Legend
Probability

30
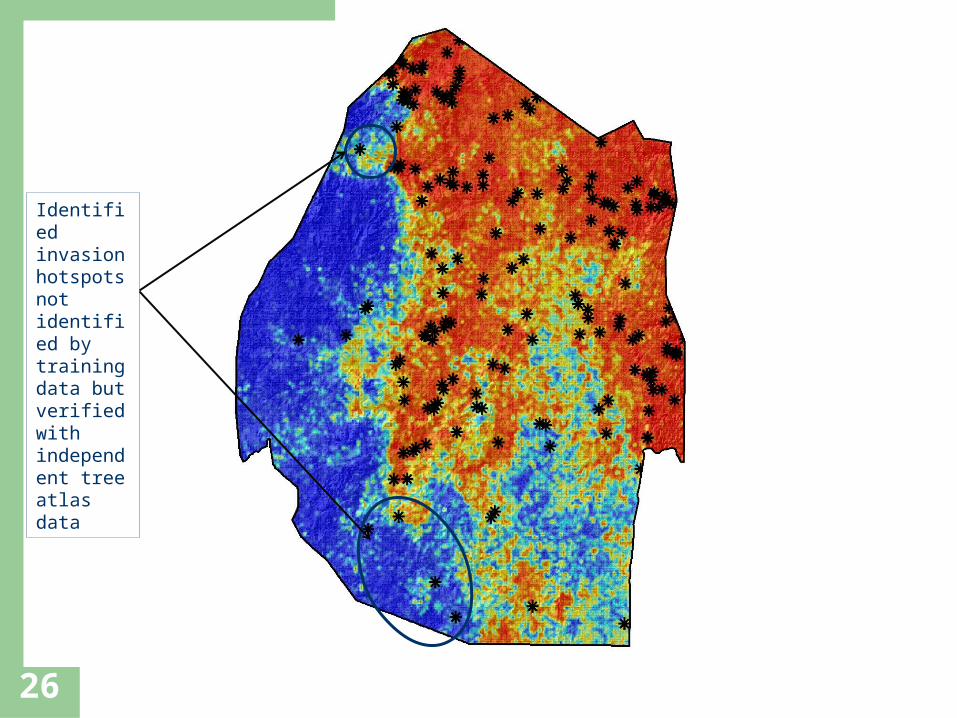
Identified invasion hotspots not identified by training data but verified with independent tree atlas data

31
Findings
L. camara ROC Recall
Minimum 0.80 0.90
Mean 0.83 0.93
Maximum 0.85 0.98

32
Findings
Distinguishing properties of BNs:– their ability to reduce the joint probability distribution
of the model into a set of conditional probabilities– their capability to express model uncertainties,– propagate information quickly, – represent complex topologies, – combine domain knowledge with hard data, and
update model parameters as new information becomes available.

33
Conclusions
We proposed a method for integrating feature selection and BN learning algorithms in non-spatial and geospatial data mining– Algorithms for constructing Bayesian networks
Discover potentially causal, more useful patterns Discover surprising patterns, potentially more useful
Hopefully, combining the “best of both worlds”, increasing the chance of discovering ecological patterns and processes useful for intelligent decision making and invasion plant species management
Ongoing research: computational implementation of the proposed method and ecological knowledge discovery to 14 other species.

34
Conclusions
Geospatial predictive analytics: an emerging field in ‘big data’ era.
Applicability of our method to broader natural resource management and geospatial analysis in particular where both prediction and decision-making are paramount.
Accessibility and sharing are crucial if we are to reap maximum benefits from geospatial data
(A)Spatial data repositories/SDI could act as good data mines from which to extract patterns to solve various socio-economic/NRM problems.

Questions ??
Thanks you for listening!