bayou nezpique watershed tmdl including...
TRANSCRIPT
BAYOU NEZPIQUE WATERSHED TMDLFOR DISSOLVED OXYGEN
INCLUDING WLAS FOR NINE TREATMENT FACILITIES
SUBSEGMENTS 050301, 050302, 050303, AND 050304
SURVEYED SEPTEMBER, 1985
By:
Marian U. Aguillard, P.E.Jeffrey T. Baker
Karen A. LeBlancDivision of Environmental TechnologyOffice of Environmental Assessment
Louisiana Department of Environmental Quality
July, 1999
Revised October, 1999

050301-050304/C:\My Documents\Bayou Nezpique TMDL Report.docBayou Nezpique Watershed TMDLMarian U. Aguillard/Engineer Manager, Jeffrey T.. Baker/EIT 2, Karen LeBlanc/ECS ADVOriginated: March 3, 1999 Rev: April 20, 1999; July 2, 1999; July 20, 1999; October 4, 1999
ii
EXECUTIVE SUMMARY
This report presents the results of a watershed based, calibrated modeling analysis of BayouNezpique. The modeling was conducted to establish a dissolved oxygen TMDL for the BayouNezpique watershed. The model extends from the headwaters near Oakdale, LA to theconfluence of Bayou Nezpique with the Mermentau River near Jennings, La. Bayou Nezpique islocated in south central Louisiana and its watershed includes the following tributaries: BeaverCreek, Boggy Bayou, East and West Forks of Bayou Nezpique, Manwell Gully, Grand LouisBayou, Castor Creek, Bayou Blue, Roger’s Gully, Bayou Duralde, Jennings STP Canal, andseveral unnamed tributaries. The watershed is 611.2 square miles in area. Bayou Nezpique is inthe Mermentau River Basin and includes Water Quality Subsegments 050301, 050302, 050303,and 050304. The area is sparsely populated outside its small municipalities, and land use isdominated by silviculture and agriculture in the upper half of the watershed and agriculture in thelower half. A total of nine sewage treatment facilities were included in the modeling effort.
Input data for the calibration model was developed from the LDEQ Reference Stream Study;data collected during the 1985 intensive survey; data collected by LDEQ and USGS at severalambient monitoring stations in the watershed; DMRs, permits and permit applications for each ofthe point source dischargers; USGS drainage area and low flow publications; previous modelingstudies conducted by LDEQ in the area; and data garnered from several previous LDEQ studieson non-point source loadings. A satisfactory calibration was achieved for the main stem andmost of the tributaries modeled. In those cases where the calibration was not as accurate(primarily due to extremely limited data), the difference was in the conservative direction. Forthe projection models, data was taken from the current municipal discharge permits, currentapplications, and ambient temperature records. The Louisiana Total Maximum Daily LoadTechnical Procedures, 1999, have been followed in this study.
Modeling was limited to low flow scenarios for both the calibration and the projections since theconstituent of concern was dissolved oxygen and the available data was limited to low flowconditions. The model used was QUAL-TX, a modified version of QUAL-II. QUAL-TX wasselected since it offers the ability to model branched systems and has been used successfully inLouisiana in the past.
Bayou Nezpique, Subsegment 050301, was on the 1996 and 1998 303(d) list of impaired waterbodies requiring the development of TMDLs. The subsegment was ranked priority one on boththe 1996 and the 1998 lists. The suspected causes of impairment for the 1996 list were organicenrichment/ low DO, pathogen indicators, suspended solids and turbidity. The suspected causesof impairment for the 1998 list were organic enrichment/ low DO, pathogen indicators, copperand lead. This TMDL addresses the organic enrichment/low DO impairment. The remainingsubsegments in the watershed were not on the 303(d) list, but were either modeled or addressedas point sources in the model since they contribute flow individually to the listed subsegment asshown on the Subsegment Map in Appendix H.

050301-050304/C:\My Documents\Bayou Nezpique TMDL Report.doc Bayou Nezpique Watershed TMDLMarian U. Aguillard/Engineer Manager, Jeffrey T.. Baker/EIT 2, Karen LeBlanc/ECS ADVOriginated: March 3, 1999 Rev: April 20, 1999; July 2, 1999; July 20, 1999; October 4, 1999
iii
The results of the summer projection model show that the water quality standard for dissolvedoxygen for Bayou Nezpique (WQ Subsegment 050301) of 3.0 mg/l can be maintained during thesummer critical season. The water quality standard for dissolved oxygen for Beaver Creek (WQSubsegment 050302) of 2.0 mg/l can also be maintained during the summer critical season. TheBayou Blue (WQ Subsegment 050304) system currently has a dissolved oxygen criterion of 5.0mg/l which can not be maintained. The Castor Creek (WQ Subsegment 050303) systemcurrently has a dissolved oxygen criterion of 5.0 mg/l which is also unlikely to be maintainedbased on the results of the No Load Scenario. The Bayou Blue and Castor Creek systems havebeen reevaluated and more appropriate DO criteria recommended. The results of the summerprojection model show that a DO of 3 mg/l DO can be maintained in all four subsegments withthe imposition of an 85% reduction from all manmade nonpoint sources and the imposition of 5mg/l CBOD5/2 mg/l NH3/6 mg/l DO limits on Oberlin STP, Elton STP, Basile STP, andJennings STP; 5 mg/l CBOD5/5 mg/l NH3/6 mg/l DO limits on Reddell STP; 10 mg/l CBOD5/2mg/l NH3/5 mg/l DO limits for Mamou STP; 10 mg/l CBOD5/10 mg/l NH3/6 mg/l DO limits forOakdale STP and Pine Prairie STP; and, 10 mg/l CBOD5/5 mg/l NH3/6 mg/l DO limits forEvangeline Sewer Co.'s North Mamou Subdivision WWTP. The minimum DO on the mainstem is 2.92 mg/l at RK 58.152. This is well within the 10% guidance for achieving standardsand reflects the conservative nature of the modeling assumptions.
The results of the winter projection model show that the water quality criteria for dissolvedoxygen for Bayou Nezpique and Bayou Blue of 5.0 mg/l and for Beaver Creek of 3.0 mg/l can bemaintained during the winter critical season in the entire watershed. It is also anticipated that a5.0 mg/l DO criterion can be maintained in Castor Creek. The minimum dissolved oxygen is4.98 mg/l and is located in the Basile POTW Tributary. This is acceptable. To achieve thecriteria, the model assumed the imposition of a 90% reduction from all manmade nonpointsources and the imposition of 10 mg/l CBOD5/10 mg/l NH3/5 mg/l DO limits on Oakdale STP,Pine Prairie STP, Oberlin STP, and Elton STP; 10 mg/l CBOD5/7.5 mg/l NH3/5 mg/l DO limitson Basile STP; 5 mg/l CBOD5/5 mg/l NH3/6 mg/l DO limits on Jennings STP; 10 mg/lCBOD5/5 mg/l NH3/5 mg/l DO limits on Reddell STP; 10 mg/l CBOD5/2 mg/l NH3/5 mg/l DOlimits for Mamou STP; and, 20 mg/l CBOD5/10 mg/l NH3/5 mg/l DO limits for EvangelineSewer Co.'s North Mamou Subdivision WWTP. The minimum DO on the main stem is 5.44mg/l at RK 53.904.
LDEQ will work with other agencies such as local Soil Conservation Districts to implementagricultural best management practices in the watershed through the 319 programs. LDEQ willalso continue to monitor the waters to determine whether standards are being attained.
In accordance with Section 106 of the federal Clean Water Act and under the authority of theLouisiana Environmental Quality Act, the LDEQ has established a comprehensive program formonitoring the quality of the state’s surface waters. The LDEQ Surveillance Section collectssurface water samples at various locations, utilizing appropriate sampling methods andprocedures for ensuring the quality of the data collected. The objectives of the surface watermonitoring program are to determine the quality of the state’s surface waters, to develop a long-term data base for water quality trend analysis, and to monitor the effectiveness of pollutioncontrols. The data obtained through the surface water monitoring program is used to develop thestate’s biennial 305(b) report (Water Quality Inventory) and the 303(d) list of impaired waters.
050301-050304/C:\My Documents\Bayou Nezpique TMDL Report.doc Bayou Nezpique Watershed TMDLMarian U. Aguillard/Engineer Manager, Jeffrey T.. Baker/EIT 2, Karen LeBlanc/ECS ADVOriginated: March 3, 1999 Rev: April 20, 1999; July 2, 1999; July 20, 1999; October 4, 1999
iv
This information is also utilized in establishing priorities for the LDEQ nonpoint sourceprogram.
The LDEQ has implemented a watershed approach to surface water quality monitoring. Throughthis approach, the entire state is sampled over a five-year cycle with two targeted basins sampledeach year. Long-term trend monitoring sites at various locations on the larger rivers and LakePontchartrain are sampled throughout the five-year cycle. Sampling is conducted on a monthlybasis or more frequently if necessary to yield at least 12 samples per site each year. Samplingsites are located where they are considered to be representative of the waterbody. Under thecurrent monitoring schedule, targeted basins follow the TMDL priorities. In this manner, thefirst TMDLs will have been implemented by the time the first priority basins will be monitoredagain in the second five-year cycle. This will allow the LDEQ to determine whether there hasbeen any improvement in water quality following implementation of the TMDLs. As themonitoring results are evaluated at the end of each year, waterbodies may be added to orremoved from the 303(d) list. The sampling schedule for the first five-year cycle is shownbelow.
1998 - Mermentau and Vermilion-Teche River Basins1999 - Calcasieu and Ouachita River Basins2000 - Barataria and Terrebonne Basins2001 - Lake Pontchartrain Basin and Pearl River Basin2002 - Red and Sabine River Basins
(Atchafalaya and Mississippi Rivers will be sampled continuously.)Mermentau and Vermilion-Teche Basins will be sampled again in 2003.

050301-050304/C:\My Documents\Bayou Nezpique TMDL Report.doc Bayou Nezpique Watershed TMDLMarian U. Aguillard/Engineer Manager, Jeffrey T.. Baker/EIT 2, Karen LeBlanc/ECS ADVOriginated: March 3, 1999 Rev: April 20, 1999; July 2, 1999; July 20, 1999; October 4, 1999
v
TABLE OF CONTENTS
EXECUTIVE SUMMARY ii
LIST OF TABLES v
LIST OF FIGURES v
1. Introduction 12. Study Area Description 1
2.1 General Information 12.2 Water Quality Standards 22.3 Wastewater Discharges 22.4 Water Quality Conditions/Assessment 32.5 Prior Studies 3
3. Documentation of Calibration Model 33.1 Model Description and Input Data Documentation 3
3.1.1 Program Description 33.1.2 Model Schematic or Vector Diagram 43.1.3 Hydrology and Stream Geometry and Sources 43.1.4 Headwater and Waste Water Loads 63.1.5 Water Quality Input Data and Their Sources 6
3.2 Model Discussion and Results 94. Water Quality Projections 11
4.1 Critical Conditions 11 4.1.1 Seasonality and Margin of Safety 114.1.2 Hydrology and Stream Geometry and Sources 134.1.3 Water Quality Input Data and Their Sources 14
4.2 Model Discussion and Results 154.2.1 No Load Scenario 154.2.2 No Discharge Scenario 154.2.3 No NPS Scenario 164.2.4 Summer Projection 164.2.5 Winter Projection 16
4.3 Calculated TMDL, WLAs and LAs 195. Sensitivity Analysis 196. Conclusions 207. References 228. Appendices 23
APPENDIX A - Recommended TMDLAPPENDIX B - Calibration Model Input and Output Data SetsAPPENDIX C - Calibration Model Development
APPENDIX C1 - Reach and Element DesignAPPENDIX C2 - Development of Hydraulic Input DataAPPENDIX C3 - Development of Leopold CoefficientsAPPENDIX C4 - POTW Data

050301-050304/C:\My Documents\Bayou Nezpique TMDL Report.doc Bayou Nezpique Watershed TMDLMarian U. Aguillard/Engineer Manager, Jeffrey T.. Baker/EIT 2, Karen LeBlanc/ECS ADVOriginated: March 3, 1999 Rev: April 20, 1999; July 2, 1999; July 20, 1999; October 4, 1999
vi
APPENDIX C5 - Water Quality Input DataAPPENDIX C6 - Reaeration Analysis
APPENDIX D - Projection Model Input and Output Data SetsAPPENDIX D1 - Summer ProjectionAPPENDIX D2 - Winter ProjectionAPPENDIX D3 - No Load ScenarioAPPENDIX D4 - No Discharge ScenarioAPPENDIX D5 - NPS Scenario
APPENDIX E - Projection Model DevelopmentAPPENDIX E1 - Summer ProjectionAPPENDIX E2 - Winter ProjectionAPPENDIX E3 - No Load ScenarioAPPENDIX E4 - No Discharge ScenarioAPPENDIX E5 - No NPS ScenarioAPPENDIX E6 - General Projection Data Development
APPENDIX F - Survey Data Measurements and Analysis ResultsAPPENDIX G - Historical and Ambient DataAPPENDIX H - Maps and DiagramsAPPENDIX I - Sensitivity Analysis
LIST OF TABLES
Table 1. Land Uses in Segment 0503 1Table 2. Water Quality Numerical Criteria and Designated Uses 2Table 3. Treatment Plant Flow Information 5Table 4. Treatment Plant Flows for Calibration 5Table 5. Projected Treatment Plant Flow Information 14Table 6. Summer Projections Minimum Dissolved Oxygen for each Reach 17Table 7. Winter Projections Minimum Dissolved Oxygen for each Reach 18Table 8. Total Maximum Daily Loads 19Table 9. Minimum Dissolved Oxygen for Bayou Nezpique
Main Stem for Projections 20
LIST OF FIGURES
Figure 1. Calibration Model Dissolved Oxygen versus River Kilometer 9Figure 2. Summer Projection Model Dissolved Oxygen versus River Kilometer 17Figure 3. Winter Projection Model Dissolved Oxygen versus River Kilometer 18

050301-050304/C:\My Documents\Bayou Nezpique TMDL Report.doc Page 1Bayou Nezpique Watershed TMDLMarian U. Aguillard/Engineer Manager, Jeffrey T.. Baker/EIT 2, Karen LeBlanc/ECS ADVOriginated: March 3, 1999 Rev: April 20, 1999; July 2, 1999; July 20, 1999; October 4, 1999
1. Introduction
The 1996 and 1998 303(d) lists cited Bayou Nezpique, Subsegment 050301, as being impaireddue to organic enrichment/low DO and required the development of a Total Maximum DailyLoad (TMDL) for dissolved oxygen (DO). The subsegment was ranked priority one on both the1996 and the 1998 lists. A calibrated water quality model for the entire watershed wasdeveloped and projections were modeled to quantify the point source and non-point source wasteload reductions which would be necessary in order for Bayou Nezpique to comply with itsestablished water quality standards and criteria. This report presents the results of that analysis.
2. Study Area Description
2.1 General Information
Water quality segment 0503 is part of the Mermentau River Basin. The Basin encompasses theprairie region of the state and a section of the coastal zone. The drainage area for the Basin,excluding the gulf water segment, is 3,710 square miles. The segment is located in south centralLouisiana in the parishes of Evangeline, Acadia, Allen, and Jefferson Davis and has a drainagearea of 611.2 square miles. The segment is long and narrow and spans the land usescharacteristic of the entire basin. The northern part of the segment is a flatwoods area. Themidsection is prairie, characterized by large expanses of flat grassland and scattered areas of oaktrees and other mixed hardwoods, and the southern part is marshland. The flatwoods and theprairie are generally considered upland areas while the marshland is considered a coastal area.The slope of the land is generally north to south. Because of its relatively low relief, especiallyin the prairie and marsh areas, the region is characterized by poor drainage and annual backwaterflooding of agricultural lands. The land use in the watershed is vividly depicted on the SPOT-TM map in Appendix H and summarized in Table 1.
Table 1. Land Uses in Segment 0503LAND USE TYPE NUMBER OF ACRES % OF TOTAL AREAUrban 9,979 1.63Extractive 123 0.02Agricultural 318,357 52.07Forest Land 169,531 27.73Water 3,312 0.54Wetland 106,581 17.43Barren Land 3,282 0.54Other 224 0.04TOTAL AREA 611,389 100
The model extends from the headwaters near Oakdale and Pine Prairie to the confluence ofBayou Nezpique with the Mermentau River near Jennings, La. The Bayou Nezpique watershedincludes the following tributaries: Beaver Creek, Boggy Bayou, East and West Forks of BayouNezpique, Manwell Gully, Grand Louis Bayou, Castor Creek, Bayou Blue, Roger’s Gully,Bayou Duralde, Jennings STP canal and several unnamed tributaries. The watershed includesWater Quality Subsegments 050301, 050302, 050303, and 050304. The area is sparselypopulated outside its small municipalities and land use is dominated by silviculture and

050301-050304/C:\My Documents\Bayou Nezpique TMDL Report.doc Page 2Bayou Nezpique Watershed TMDLMarian U. Aguillard/Engineer Manager, Jeffrey T.. Baker/EIT 2, Karen LeBlanc/ECS ADVOriginated: March 3, 1999 Rev: April 20, 1999; July 2, 1999; July 20, 1999, October 4, 1999
agriculture in the upper half of the watershed and by agriculture in the lower half. A total of ninesewage treatment facilities were included in the modeling effort. Maps of the study area arepresented in Appendix H.
2.2 Water Quality Standards
The Water Quality criteria and designated uses for subsegments in the Bayou Nezpiquewatershed are shown in Table 2.
Table 2. Water Quality Numerical Criteria and Designated UsesSubsegment 050301 050302 050303 050304StreamDescription
Bayou Nezpique –Headwaters toMermentau R.
Beaver Creek -Headwaters toBoggy Creek
Castor Creek -Headwaters toB. Nezpique
Bayou Blue -Headwaters toB. Nezpique
DesignatedUses
A B C F B C: NOV – APRNONE: MAY-OCT
A B C A B C
Criteria:Cl 90 90 90 90
SO4 30 30 30 30DO 5 : DEC-FEB
3 : MAR-NOV5 : NOV – APR2 : MAY-OCT
5 5
pH 6.0 – 8.5 6.0 – 8.5 6.0 – 8.5 6.0 – 8.5BAC 1 2 1 1
ΕC 32 32 32 32TDS 260 260 260 260
USES: A – primary contact recreation; B – secondary contact recreation; C – propagation of fishand wildlife; D – drinking water supply; E – oyster propagation; F – agriculture; G – outstandingnatural resource water; L – limited aquatic life and wildlife use.
A Use Attainability Analysis (UAA) was recently completed for Mermentau River Basinsupporting revision of the dissolved oxygen criterion of 5 mg/L to seasonal criteria of 5 mg/LDecember through February and 3 mg/L March through November. The seasonal criteria havebeen promulgated and apply to Bayou Nezpique and its tributaries. However, Castor Creek andBayou Blue were not included in the UAA. An addendum to the Mermentau River Basin UAAhas been prepared to support revision of the dissolved oxygen criterion for Bayou Blue andCastor Creek and two other bayous. The same seasonal criteria of 5 mg/L (winter) and 3 mg/L(summer) have been proposed for these bayous.
2.3 Wastewater Discharges
The discharger inventory for the Bayou Nezpique watershed was reviewed. There are only 25dischargers listed in the LDEQ Permit Tracking System and the Discharger Inventory combined.Of these 25, eleven facilities were either no longer discharging to the watershed or did notdischarge oxygen demanding pollutants. The remaining facilities were evaluated based on thevolume of their discharge, their location with respect to the listed waterbody, any water qualitydata which demonstrated their impact or lack of impact, whether or not the NPS contribution

050301-050304/C:\My Documents\Bayou Nezpique TMDL Report.doc Page 3Bayou Nezpique Watershed TMDLMarian U. Aguillard/Engineer Manager, Jeffrey T.. Baker/EIT 2, Karen LeBlanc/ECS ADVOriginated: March 3, 1999 Rev: April 20, 1999; July 2, 1999; July 20, 1999, October 4, 1999
included any small facilities, and best professional judgement. Only 9 facilities were consideredto have any ability to impact the target reaches: the cities of Oakdale, Pine Prairie, Reddell,Mamou, Oberlin, Elton, Basile, and Jennings and the North Mamou subdivision (operated by theEvangeline Sewer Co.). The list of facilities and the modeling decision for each is shown inAppendix C4. The permits record, permits applications, and Discharger Monitoring Reports(DMR) for these facilities were examined and appropriate input information for the calibrationand projection modeling runs was derived to the maximum extent possible. The input datadevelopment for the calibration model is presented in Appendix C.
2.4 Water Quality Conditions/Assessment
Subsegment 050301, Bayou Nezpique from the headwaters to the Mermentau River, is partiallysupporting its designated uses according to the 1998 305(b) Water Quality assessment forLouisiana. Suspected pollutants are Organic Enrichment/Low DO, Copper, Lead, and Pathogensfrom minor point sources, irrigated and nonirrigated crop production, forest management, andnatural sources. The subsegment is on the 1998 303(d) list and is scheduled for current TMDLdevelopment. An excerpt from the 1998 303(d) list is presented in Appendix G. Thesubsegment was also on the 1996 303(d) list for organic enrichment/low DO, pathogenindicators, suspended solids, and turbidity.
2.5 Prior Studies
Several prior studies have been performed on portions of the Bayou Nezpique watershed. BayouNezpique from the headwaters to the Mermentau River was the subject of an intensive survey in1985. The lower reach of Bayou Nezpique, the upper Mermentau River and the Jennings STPCanal were the subject of an intensive survey in 1982 and a reconnaissance survey in 1990.Modeling studies performed on these waterbodies resulted in recommendations for standardsreevaluation and phased approach TMDLs. Bayou Grand Louis has also been the subject of anintensive survey and an Advanced Treatment Review modeling study. A standards reevaluationfor Bayou Grand Louis was also recommended. Use Attainability Analyses have beenconducted in the watershed and revised standards have been issued as shown in Table 2.
3. Documentation of Calibration Model
3.1 Model Description and Input Data Documentation
3.1.1 Program Description
"Simulation models are used extensively in water quality planning and pollution control. Modelsare applied to answer a variety of questions, support watershed planning and analysis anddevelop total maximum daily loads (TMDLs). . . . Receiving water models simulate themovement and transformation of pollutants through lakes, streams, rivers, estuaries, or nearshoreocean areas. . . . Receiving water models are used to examine the interactions between loadingsand response, evaluate loading capacities (LCs), and test various loading scenarios. . . . Afundamental concept for the analysis of receiving waterbody response to point and nonpointsource inputs is the principle of mass balance (or continuity). Receiving water models typicallydevelop a mass balance for one or more constituents, taking into account three factors: transport

050301-050304/C:\My Documents\Bayou Nezpique TMDL Report.doc Page 4Bayou Nezpique Watershed TMDLMarian U. Aguillard/Engineer Manager, Jeffrey T.. Baker/EIT 2, Karen LeBlanc/ECS ADVOriginated: March 3, 1999 Rev: April 20, 1999; July 2, 1999; July 20, 1999, October 4, 1999
through the system, reactions within the system, and inputs into the system." (EPA841-B-97-006, pp. 1-30)
The model used for this TMDL was QUAL-TX, "a steady-state one-dimensional water qualitymodel that has been developed by the Water Quality Standards and Evaluation Section of theTexas Water Commission. It is a modified version of QUAL-II. The original QUAL-II modelwas developed by Water Resources Engineers (now Camp Dresser & McKee) for the UnitedStates Environmental Protection Agency. Since that time, many modifications have been madeto QUAL-II by many people. QUAL-TX is a user oriented model incorporating many of thosemodifications and is intended to provide the basis for evaluating waste load allocations in theState of Texas.” (QUAL-TX User's Manual, rev. 1990). QUAL-TX was selected since it offersthe ability to model branched systems and it has been used successfully in Louisiana in the past.
The development of a TMDL for dissolved oxygen generally occurs in 3 stages. Stage 1encompasses the data collection activities. These activities may include gathering suchinformation as stream cross-sections, stream flow, stream water chemistry, stream temperatureand dissolved oxygen and various locations on the stream, location of the stream centerline andthe boundaries of the watershed which drains into the stream, and other physical and chemicalfactors which are associated with the stream. Additional data gathering activities includegathering all available information on each facility which discharges pollutants in to the stream,gathering all available stream water quality chemistry and flow data from other agencies andgroups, gathering population statistics for the watershed to assist in developing projections offuture loadings to the water body, land use and crop rotation data where available, and any otherinformation which may have some bearing on the quality of the waters within the watershed.During Stage 1, any data available from reference or least impacted streams which can be used togauge the relative health of the watershed is also collected.
Stage 2 involves organizing all of this data into one or more useable forms from which the inputdata required by the model can be obtained or derived. Water quality samples, fieldmeasurements, and historical data must be analyzed and statistically evaluated in order todetermine a set of conditions which have actually been measured in the watershed. The findingsare then input to the model . Best professional judgement is used to determine initial estimatesfor parameters which were not or could not be measured in the field. These estimated variablesare adjusted in sequential runs of the model until the model reproduces the field conditionswhich were measured. In other words, the model produces a value of the dissolved oxygen,temperature, or other parameter which matches the measured value within an acceptable marginof error at the locations along the stream where the measurements were actually made. Whenthis happens, the model is said to be calibrated to the actual stream conditions. At this point, themodel should confirm that there is an impairment and give some indications of the causes of theimpairment. If a second set of measurements is available for slightly different conditions, thecalibrated model is run with these conditions to see if the calibration holds for both sets of data.When this happens, the model is said to be verified.
Stage 3 covers the projection modeling which results in the TMDL. The critical conditions offlow and temperature are determined for the waterbody and the maximum pollutant dischargeconditions from the point sources are determined. These conditions are then substituted into themodel along with any related condition changes which are required to perform worst case

050301-050304/C:\My Documents\Bayou Nezpique TMDL Report.doc Page 5Bayou Nezpique Watershed TMDLMarian U. Aguillard/Engineer Manager, Jeffrey T.. Baker/EIT 2, Karen LeBlanc/ECS ADVOriginated: March 3, 1999 Rev: April 20, 1999; July 2, 1999; July 20, 1999, October 4, 1999
scenario predictions. At this point, the loadings from the point and nonpoint sources (increasedby an acceptable margin of safety) are run at various levels and distributions until the modeloutput shows that dissolved oxygen criteria are achieved. It is critical that a balanceddistribution of the point and nonpoint source loads be made in order to predict any success infuture achievement of water quality standards. At the end of Stage 3, a TMDL is producedwhich shows the point source permit limits and the amount of reduction in man-made nonpointsource pollution which must be achieved to attain water quality standards. The man-madeportion of the NPS pollution is estimated from the difference between the calibration loads andthe loads observed on reference or least impacted streams.
The model was hydrologically calibrated to the 1985 survey measurements of flow andchlorides. Water quality parameters and coefficients were then established based on availabledata and best professional judgement. The calibration model output was then compared to the1985 survey measurements of water quality and the calibration was determined to be successful.
3.1.2 Model Schematic or Vector Diagram
A vector diagram of the modeled area is presented in Appendix H. The vector diagram showsthe locations of survey stations, the reach/element design, the locations of modeled tributariesand POTWs, and the locations of tributaries contributing flow but not modeled. A digitized mapof the streams showing river miles and survey sampling sites is also included in Appendix H andhas been marked to depict the drainage areas associated with each reach and headwater.
3.1.3 Hydrology and Stream Geometry and Sources
The USGS maintains a daily flow gauging station on the Mermentau River near the village ofMermentau. The USGS maintained a daily flow gauging station on Bayou Nezpique near Basilethrough September 30, 1997. LDEQ has a monthly water quality sampling station at theMermentau River at Mermentau station. LDEQ conducted bimonthly sampling at the BayouNezpique at Basile gauging station through March, 1998 , and at Bayou Nezpique near Jenningsthrough May, 1998. Beginning in July, 1998, the LDEQ began a new ambient monitoringstrategy which focuses on each Basin intensely for a limited period of time over a five yearcycle. During 1998, six sites were monitored in the Bayou Nezpique watershed twice a month.These sites were at Bayou Nezpique near Jennings, Bayou Nezpique near Basile, Castor Creekeast of Oberlin, Bayou Nezpique east of Jennings, Beaver Creek and Bayou Blue. The data,which was collected through September, 1998, is presented in Appendix G. LDEQ continues toperform monthly sampling at the Mermentau River near Mermentau station as part of a statewidetrend program. Data from these stations was used to determine critical temperatures for eachseason and to evaluate critical flows.
Data collected during an intensive survey conducted from September 23 – 24, 1985, was used toestablish the input for the model calibration and is presented in Appendix F. Using the surveystations where discharge measurements were made and the digitized mapping as guides, thereaches and elements were established. The survey had been performed in terms of river milesso a conversion was made to river kilometers. The reach and element design for BayouNezpique was made within the limitations of the model to avoid having to link multiple models.“The current version is dimensioned for a maximum of 130 reaches, 60 headwaters, 230 waste

050301-050304/C:\My Documents\Bayou Nezpique TMDL Report.doc Page 6Bayou Nezpique Watershed TMDLMarian U. Aguillard/Engineer Manager, Jeffrey T.. Baker/EIT 2, Karen LeBlanc/ECS ADVOriginated: March 3, 1999 Rev: April 20, 1999; July 2, 1999; July 20, 1999, October 4, 1999
loads and 460 elements.”(Qual-Tx User’s Manual) The limiting factor for the Bayou Nezpiquemodel was the number of elements. During the calibration process, several adjustments weremade in order to better delineate the dissolved oxygen sag points and to accommodate changingconditions within long reaches. The resulting design incorporated 20 reaches, 9 headwaters, 15wasteloads, and 459 elements. A simple spreadsheet was used to calculate the reach length,element length and cumulative number of elements at the bottom of each reach. The locations ofeach survey station, treatment plant and unmodeled tributary were fed into a related spread sheetand the element number for each of these locations was determined. These spreadsheets arepresented in Appendix C1.
Table 3. Treatment Plant Flow InformationTreatment Plant 1998
ExpectedFlow, cfs
1998 DesignFlow, cfs
1985 DesignFlow, cfs
1998 Jul–SeptAverageFlow, cfs
1988 Aug–Oct AverageFlow, cfs
Oakdale 2.26 2.26 2.21Pine Prairie 0.178 0.115Reddell 0.105EvangelineSew. Co.
0.056
Mamou 0.930 1.32Oberlin 0.294 0.093 0.248Elton 0.201 0.299 0.299 0.110Basile 0.546 0.775 0.223Jennings 3.87 3.87 2.0 1.317
Table 4. Treatment Plant Flows for CalibrationTreatment Plant Calibration
Flow, cfsCalibrationFlow, cms
Source
Oakdale 0.35 0.011 Appendix C2, Flow CalculationSheet #01, Item IV.
Pine Prairie 0.058 0.002 50% of 1985 DesignReddell 0.053 0.002 50% of 1998 ExpectedEvangeline Sew. Co. 0.028 0.001 50% of 1998 DesignMamou 0.93 0.026 1985 DesignOberlin 0.248 0.007 1998 Jul-Sept AvgElton 0.166 0.0047 Appendix C2, Flow Calculation
Sheet #03, Item I.Basile 0.223 0.006 1998 Jul-Sept AvgJennings 1.317 0.037 1988 Aug-Oct Avg
The flow in each reach, headwater, and unmodeled tributary was determined based on the surveydischarge measurements, the drainage area associated with each flow, and a determination ofappropriate incremental nonpoint source flowrate in terms of cms/mile. Best professionaljudgement was used to determine where similar streams concepts could be used. Treatment

050301-050304/C:\My Documents\Bayou Nezpique TMDL Report.doc Page 7Bayou Nezpique Watershed TMDLMarian U. Aguillard/Engineer Manager, Jeffrey T.. Baker/EIT 2, Karen LeBlanc/ECS ADVOriginated: March 3, 1999 Rev: April 20, 1999; July 2, 1999; July 20, 1999, October 4, 1999
plant flows were determined based on available data from permits, applications, and DMRs.Where this type of data was lacking or inconsistent, determinations were made based on bestprofessional judgement from available information. Flow determinations are presented inAppendix C2. The vector diagram and the digitized map showing the individual drainage areasare presented in Appendix H. Tables 3 and 4 summarize the POTW flow information and modelinput.
Rather than directly inputting the widths and depths of the stream, the model requires that theadvective hydraulic characteristics (Leopold Coefficients and Exponents) be entered. Because ofthe limited amount of data, the default values for the velocity exponent (b) and the depthcoefficient (d) established by Texas were used (Texas Waste Load Evaluation Methodology).The determinations of the remaining coefficients and exponents from the dischargemeasurements made during the survey are shown in Appendix C3.
Since the lower reaches are tidal in nature with frequent flow reverses and are very deep, wideand sluggish especially at low flow, the dispersive hydraulic coefficients were used for reaches17 –20. The fraction of the boundary tide was decreased in the upstream direction and theexponents were assumed to be zero. The dispersion coefficient was then given values from zeroto one. The use of this option was required to achieve calibration in the lower reaches.
3.1.4 Headwater and Waste Water Loads
Upstream water quality, except for dissolved oxygen, for unsampled headwaters was derivedfrom the 1995 reference stream work performed by the LDEQ (see Smythe). Dissolved oxygenfor the headwaters was determined from the average of the 4 samples taken on the East and WestForks and Castor Creek. These three streams are relatively unimpacted streams for this area.Treatment plant wasteloads were derived from permit information, permit applications, andDMRs. Some of this data was obtained directly from the LDEQ Permit Tracking System (PTS)database and the LDEQ Discharger Inventory database. Summaries and copies of selected dataare presented in Appendix C4. Additional supporting documents are presented in Appendix C5.
3.1.5 Water Quality Input Data and Their Sources.
Water quality data collected on September 23-24, 1985, on Bayou Nezpique was entered in aspreadsheet for ease of analysis. The Louisiana GSBOD program was applied to the BOD datain the spreadsheet and values were computed for each sample taken of ultimate CBOD, CBODdecay rate, CBOD Lag, ultimate NBOD, NBOD decay rate, NBOD lag and ratios of ultimate to5 day values of CBOD and NBOD. Since multiple samples were taken at each station, theaverage value of each parameter was computed for each station. A complete listing, as well asan abridged version of the list for convenience, are presented in Appendix F. This data was theprimary source for the model input data for initial conditions; decay rates; incrementaltemperature, DO, and NBOD; headwater temperature and DO; and, wasteload data. Three othersources of data also figured prominently in developing the input data set: reference stream data,previous models of Bayou Nezpique, and previous determinations of nonpoint source loadingsfor nearby heavily impacted streams.

050301-050304/C:\My Documents\Bayou Nezpique TMDL Report.doc Page 8Bayou Nezpique Watershed TMDLMarian U. Aguillard/Engineer Manager, Jeffrey T.. Baker/EIT 2, Karen LeBlanc/ECS ADVOriginated: March 3, 1999 Rev: April 20, 1999; July 2, 1999; July 20, 1999, October 4, 1999
3.1.5.1 Temperature Correction of Kinetics, Data Type 4
The temperature correction factors specified in the LTP were entered in the model.
3.1.5.2 Initial Conditions, Data Type 11
The initial conditions are used to reduce the number of iterations required by the model. Thevalues required for this model were temperature and DO by reach. The input values came fromthe survey station located closest to the reach or from an average of samples taken from adjacentstreams considered similar. The input data and sources are shown in Appendix C5.
3.1.5.3 Reaeration Rates, Data Type 12
Initially in the calibration runs, the Louisiana Equation was used to determine a constantreaeration rate for those reaches with average depths less than 3.0 feet. This approach did notwork well since several reaches are long and the depths vary significantly from the upper end tothe bottom end. The use of a constant reach value gave stepped output and unrealistic results inlong reaches. The model does not allow the input of a value for each element. In order to usethe Louisiana Equation, the model would have to be revised and recompiled. The TexasEquation was therefore used in the model for streams with depths less than one meter. Ananalysis of the reaeration rates, presented in Appendix C6, showed that the minimum K2 wasactually used in lieu of the Texas Equation for several of these reaches. Owens & Gibbs and theminimum K2 were used for the remaining reaches. The reaeration rate equations selected foreach reach are shown in Appendix C5.
3.1.5.4 Sediment Oxygen Demand, Data Type 12
Values of SOD from the LTP were used in several preliminary calibration runs but those valueshad been established for wasteload allocation modeling of short stream reaches directly belowtreatment plant outfalls and were not suitable for a watershed level model. The SOD values weretherefore achieved through calibration and are generally higher than those predicted by the LTPin the upper reaches and lower in the lower, deeper reaches. The SOD value for each reach isshown in Appendix C5. The conversion ratio of settled CBOD and settled NBOD to SOD wasconsidered to be one for all reaches except reach 19, Jennings STP Canal where calibration couldnot be achieved with any conversion.
3.1.5.5 Carbonaceous BOD Decay and Settling Rates, Data Type 12
These rates are labeled Aerobic BOD Decay and BOD Settling in Qual-Tx. The decay rates usedwere based on the bottle rates from the survey or multiples of the bottle rates in general. Theconcept of similar streams was used to transfer rates between streams in the watershed. Theinitial settling rates were taken from the LTP and multiplied by the depths to obtain the velocityform of the settling rate required by the model. The settling rates finally used were the result ofcalibration. The decay and settling rates used for each reach are shown in Appendix C5.

050301-050304/C:\My Documents\Bayou Nezpique TMDL Report.doc Page 9Bayou Nezpique Watershed TMDLMarian U. Aguillard/Engineer Manager, Jeffrey T.. Baker/EIT 2, Karen LeBlanc/ECS ADVOriginated: March 3, 1999 Rev: April 20, 1999; July 2, 1999; July 20, 1999, October 4, 1999
3.1.5.6 Nitrogenous BOD Decay and Settling Rates, Data Type 15
These rates are labeled Nonconservative Material (NCM) Decay and Settling in Qual-Tx. Thedecision to use the nonconservative material option was based on the inadequacy of the data tomodel the complete nitrogen cycle. The data was originally gathered for a very different modeland thus did not cover every required input parameter for a Qual-Tx model. The decay ratesused were based on the bottle rates from the survey or multiples of the bottle rates in general.The concept of similar streams was used to transfer rates between streams in the watershed. Adefault value from the LTP was used for the Basile POTW tributary and the rates used in aprevious modeling effort were the basis for those used in reaches 18 and 20. The settling rateswere determined through calibration. The decay and settling rates used for each reach are shownin Appendix C5.
3.1.5.7 Incremental Conditions, Data Types 16, 17, and 18
The incremental conditions were used in the calibration to represent nonpoint source loadsassociated with flows. It is likely that there were overland discharges from agricultural andsilvicultural areas as a result of a storm in the area just prior to the survey or that there was someinput from groundwater as a result of the rain recharging the underlying water table. Since bothof these sources would have been naturally filtered prior to entering the stream, reference streamdata and some of the survey data from relatively unimpacted “upstream” sampling sites wereused to develop the Temperature, DO, Chlorides, CBOD and NBOD. The data and its source foreach reach and a summary of the reference stream findings are presented in Appendix C5.
3.1.5.8 Nonpoint Sources, Data Type 19
Nonpoint source loads which are not associated with a flow are input into this part of the model.These can be most easily understood as resuspended load from the bottom sediments and aremodeled as SOD, CBOD and NBOD loads. Over the years LDEQ has collected data on heavilyimpacted streams in Louisiana. These data were reviewed and summarized by Smythe andWaldon and have been used to develop part of the input data for Bayou Nezpique. A copy of thesummary table is presented in Appendix G. LDEQ also determined these types of loadings aspart of the 1995 Reference Stream work and these loads have also been used to determine someof the input data. It is important to note that the reference stream data available at this time is fornon-flowing streams. The nonpoint source loading for a non-flowing stream is expected to besignificantly greater than that for a flowing stream but this has not been verified to date. TheBayou Nezpique system is not a non-flowing stream, but neither is it a free-flowing stream. Itwas therefore decided to use the non-flowing reference stream data mean values for this model.In some cases a percentage of the reference stream loading has been adequate to achievecalibration. Some of the nonpoint source loads in kg/km/day which were based on referencestream data appear to be very small loads, but they do not address stream width. An analysis wasmade of the calibration NPS and SOD loads in terms of gm-O2/m2/day and compared to thereference stream loads in the same terms (which accounted for the width differences between thereference and the modeled streams). The analysis is presented in Appendix C5. In general thetotal NPS load exceeds the reference stream load. The manmade portion of the NPS loading isthe difference between the calibration load and the reference stream load where the calibrationload is higher. Only two streams do not show an exceedance of the reference stream loads,

050301-050304/C:\My Documents\Bayou Nezpique TMDL Report.doc Page 10Bayou Nezpique Watershed TMDLMarian U. Aguillard/Engineer Manager, Jeffrey T.. Baker/EIT 2, Karen LeBlanc/ECS ADVOriginated: March 3, 1999 Rev: April 20, 1999; July 2, 1999; July 20, 1999, October 4, 1999
Bayou Grand Louis and Jennings STP Canal. It appears from the survey data, particularly thechloride samples, that these streams are primarily effluent conveyances and do not actuallyreceive significant NPS contributions during low flow conditions. The data and sources arepresented in Appendix C5. A description of the methodology used to evaluate the various NPSloads is in Appendix E8.
3.1.5.9 Headwaters, Data Types 20, 21, and 22
The reference stream data was assumed to be representative of the chlorides, UCBOD andUNBOD of the headwaters. Since the reference streams were studied at significantly lowertemperatures than the Bayou Nezpique survey, the average values of temperature and DO for the4 least impacted streams surveyed and sampled during the 1985 survey were used as headwaterconditions. The data and sources are presented in Appendix C5.
3.1.5.10 Wasteloads, Data Types 24, 25, and 26
The wasteloads entered in the model were of two different types: treatment plant effluent andunmodeled tributaries. There are no known point source dischargers to the unmodeledtributaries. Several of the unmodeled tributaries were sampled during the survey and the resultsof these samples were the basis for the input data. Where the unmodeled tributary had not beensampled, then either reference stream, least impacted area streams, or similar streams conceptswere used to develop the input data. The wasteloads from the treatment plants were determinedfrom permits, applications and DMRs which have been included or summarized in Appendix C4.The temperature of treated effluent has been assumed to be 30º C. The data and sources arepresented in Appendix C5.
3.1.5.11 Boundary Conditions, Data Type 27
The lower boundary conditions were assumed to be equivalent to the measurements taken atsurvey station 05-BN-16.
3.2 Model Discussion and Results
The calibration model input and output is presented in Appendix B. The overlay plotting optionwas used to determine if calibration had been achieved. A plot of the dissolved oxygenconcentration versus river kilometer is presented in Figure 1.
Bayou Nezpique main stem extends from Manwell Gully to the Mermentau River and isrepresented by Reaches 6, 10, 15, 17, 18, and 20. None of the treatment plants discharge directlyinto the main stem. Very good calibration was achieved for DO, CBOD, Chlorides and NBODon the main stem. The calibration model shows that in the summer of 1985, the DO standard of3 mg/l was not being met in Bayou Nezpique downstream of RK 60.287, the beginning of Reach17 at the junction with the Basile POTW tributary. The use of the model’s dispersion capabilitywas required in Reaches 18, 19, and 20 to achieve calibration. These waters are known to beaffected by tides, wind tides, and irrigation water withdrawals causing reverse flows. Theprevious model of Lower Bayou Nezpique/Mermentau River also made use of dispersion inthese reaches. The minimum DO on the main stem was 1.03 mg/l at RK 36.9.

050301-050304/C:\My Documents\Bayou Nezpique TMDL Report.doc Page 11Bayou Nezpique Watershed TMDLMarian U. Aguillard/Engineer Manager, Jeffrey T.. Baker/EIT 2, Karen LeBlanc/ECS ADVOriginated: March 3, 1999 Rev: April 20, 1999; July 2, 1999; July 20, 1999, October 4, 1999
Beaver Creek/Boggy Bayou/East Fork Bayou Nezpique is a system of tributaries to the mainstem of Bayou Nezpique. The system extends from Oakdale to Manwell Gully and isrepresented by Reaches 2, 3, 4, and 5. Two dischargers are located on these tributaries, Oakdaleand Pine Prairie. Pine Prairie discharges into an unnamed tributary, Reach 4, and is discussedbelow. Oakdale POTW actually discharges upstream from the beginning of Reach 2 andachieves some load reduction before reaching the model beginning point. In order to achievecalibration, a 30% reduction of the treated effluent above Reach 2 was required. The capabilityto do this is built into Qual-Tx. Very good calibration was achieved for DO and NBOD. Thecalibrations for CBOD and Chlorides were acceptable and were the best that could be achievedwith the limited data. All calibrations were very good in the lower reach which empties into themain stem of Bayou Nezpique at RK 113.8. The calibration shows that the DO criteria of 2 mg/lin Beaver Creek (Reaches 2 and part of 3, Subsegment 050302), and 3 mg/l (Headwaters ofBayou Nezpique) in the remaining reaches (part of 3 and 5) were being met. The minimum DOin reaches 2, 3, and 5 was 3.22 mg/l at RK 36.5.
Beaver Creek/Boggy Bayou/East Fork Bayou Nezpique is a system of tributaries to the mainstem of Bayou Nezpique. The system extends from Oakdale to Manwell Gully and isrepresented by Reaches 2, 3, 4, and 5. Two dischargers are located on these tributaries, Oakdaleand Pine Prairie. Pine Prairie discharges into an unnamed tributary, Reach 4, and is discussedbelow. Oakdale POTW actually discharges upstream from the beginning of Reach 2 andachieves some load reduction before reaching the model beginning point. In order to achievecalibration, a 30% reduction of the treated effluent above Reach 2 was required. The capabilityto do this is built into Qual-Tx. Very good calibration was achieved for DO and NBOD. Thecalibrations for CBOD and Chlorides were acceptable and were the best that could be achievedwith the limited data. All calibrations were very good in the lower reach which empties into themain stem of Bayou Nezpique at RK 113.8. The calibration shows that the DO criteria of 2 mg/lin Beaver Creek (Reaches 2 and part of 3, Subsegment 050302), and 3 mg/l (Headwaters ofBayou Nezpique) in the remaining reaches (part of 3 and 5) were being met. The minimum DOin reaches 2, 3, and 5 was 3.22 mg/l at RK 36.5.
Bayou Grand Louis system includes two dischargers, Evangeline Sewer Co. and Mamou and isrepresented by Reaches 7, 8, and 9. Evangeline Sewer Co. discharges into an unnamed tributary,Reach 8, and is discussed below. Mamou POTW actually discharges upstream from thebeginning of Reach 7 and achieves some load depletion before reaching the model beginningpoint. A 25 % reduction of the treated effluent above Reach 7 was needed to achievecalibration. Bayou Grand Louis enters the main stem of Bayou Nezpique at RK 101.0. A goodcalibration was achieved for CBOD and NBOD. Dissolved oxygen was underestimated in theupper part of the system but was very well calibrated in the lower part of the system. Chloridesare calibrated in the upper part of the system but underestimated in the lower part of the systemIt is apparent from the data that Bayou Grand Louis functions primarily as a treated effluentconveyance. The calibration shows that the DO criterion of 3.0 mg/l (Headwater of BayouNezpique) was not being met in the summer of 1985. The minimum DO in reaches 7 and 9 was1.01 mg/l at RK 13.6.

050301-050304/C:\My Documents\Bayou Nezpique TMDL Report.doc Page 12Bayou Nezpique Watershed TMDLMarian U. Aguillard/Engineer Manager, Jeffrey T.. Baker/EIT 2, Karen LeBlanc/ECS ADVOriginated: March 3, 1999 Rev: April 20, 1999; July 2, 1999; July 20, 1999, October 4, 1999
Figure 1. Calibration Model Dissolved Oxygen versus River Kilometer
The Bayou Blue system (Subsegment 050304) extends from Oberlin to the main stem of BayouNezpique at RK 78.0 and is represented by Reaches 11-14. Two dischargers are located in thissystem, Oberlin and Elton. Elton POTW discharges into an unnamed tributary, Reach 13, and isdiscussed below. A good calibration was achieved for DO, CBOD, Chlorides and NBOD. Thecalibration shows that the DO criterion of 5.0 mg/l was not being met in the summer of 1985anywhere in the system. The minimum DO in reaches 11, 12, and 14 was 0.0 mg/l from RK48.308 to RK 45.956.
Basile POTW Canal (Reach 16) receives the Basile effluent and enters the main stem at RK 62.4.With only one point to calibrate to, the calibration results are reasonably good. Dissolvedoxygen is slightly underestimated, CBOD is very well calibrated, Chlorides are slightlyunderestimated, and NBOD is somewhat overestimated. The calibration shows that the DOcriterion of 3.0 mg/l (Headwater of Bayou Nezpique) was being met in the summer of 1985.The headwater value for DO of 2.8 mg/l may account for the underestimated DO. The minimumDO in reach 16 downstream of the headwater was 3.17 mg/l at RK 0.0.
Since no data were collected on Manwell Gully (Reach 1) during the survey, a calibration wasnot possible. The minimum DO value produced by the model was 1.96 mg/l at RK 123.3. Thisdoes not meet the DO criterion of 3.0 mg/l.
Calibration Run - B. Nezpique Model (1985 Survey)
0
1
2
3
4
5
6
7
020406080100120140
River Kilometer
Dis
solv
ed O
xyge
n (m
g/l)

050301-050304/C:\My Documents\Bayou Nezpique TMDL Report.doc Page 13Bayou Nezpique Watershed TMDLMarian U. Aguillard/Engineer Manager, Jeffrey T.. Baker/EIT 2, Karen LeBlanc/ECS ADVOriginated: March 3, 1999 Rev: April 20, 1999; July 2, 1999; July 20, 1999, October 4, 1999
Since no data were collected on Unnamed Tributary to Pine Prairie POTW (Reach 4) during thesurvey, a calibration was not possible. The minimum DO value produced by the model was 2.71mg/l at RK 10.0. This does not meet the DO criterion of 3.0 mg/l.
Since no data were collected on Unnamed Tributary to Evangeline Sewer Co. (Reach 8) duringthe survey, a calibration was not possible. The minimum DO value produced by the model was1.6 mg/l at RK 5.76. This does not meet the DO criterion of 3.0 mg/l.
The Unnamed Tributary to Elton POTW (Reach 13) receives the Elton effluent and enters theBayou Blue system at RK 21.6. With only one point to calibrate to, the calibration results arevery good. The calibration shows that the DO criterion of 5.0 mg/l was not being met in thesummer of 1985. The minimum DO in reach 13 was 0.8 mg/l at RK 0.76.
Jennings STP Canal (Reach 19) receives the Jennings effluent and enters the main stem at RK9.3. With only one point to calibrate to, the calibration results are very good. The calibrationcould not be made without the use of the dispersion feature. The calibration shows that the DOcriterion of 3.0 mg/l (Headwater of Bayou Nezpique) was not being met in the summer of 1985.The minimum DO in reach 19 was 0.82 mg/l at RK 0.3.
4. Water Quality Projections
Since the calibrated model indicated that the DO criterion was not being met in the lower reachesof Bayou Nezpique and many of its tributaries, three summer loading scenarios were performedin addition to the traditional summer and winter projections. These additional scenarios were:
a. No Load Scenario - No point source loads and no nonpoint source loads above referencestream backgroundb. No Discharge Scenario – No point source loads with the calibrated nonpoint source loadsc. No NPS Scenario – Current permitted dischargers with no NPS loads above referencestream background
4.1 Critical Conditions
4.1.1 Seasonality and Margin of Safety
The Clean Water Act requires the consideration of seasonal variation of conditions affecting theconstituent of concern, and the inclusion of a margin of safety (MOS) in the development of aTMDL. For the Bayou Nezpique TMDL, LDEQ has employed an analysis of its long-termambient data to determine critical seasonal conditions and used a combination of implied andexplicit margins of safety.
Critical conditions for dissolved oxygen were determined for the Mermentau Basin using longterm water quality data from six stations on the LDEQ Ambient Monitoring Network and theLouisiana Office of State Climatology water budget. Graphical and regression techniques wereused to evaluate the temperature and dissolved oxygen data from the Ambient MonitoringNetwork and the run-off determined from the water budget. Since nonpoint loading is conveyedby run-off, this seemed a reasonable correlation to use. Temperature is strongly inversely
050301-050304/C:\My Documents\Bayou Nezpique TMDL Report.doc Page 14Bayou Nezpique Watershed TMDLMarian U. Aguillard/Engineer Manager, Jeffrey T.. Baker/EIT 2, Karen LeBlanc/ECS ADVOriginated: March 3, 1999 Rev: April 20, 1999; July 2, 1999; July 20, 1999, October 4, 1999
proportional to dissolved oxygen and moderately inversely proportional to run-off. Dissolvedoxygen and run-off are also moderately directly proportional. The analysis concluded that thecritical conditions for stream dissolved oxygen concentrations were those of negligible nonpointrun-off and low stream flow combined with high stream temperature.
When the rainfall run-off (and non-point loading) and stream flow are high, turbulence is higherdue to the higher flow and the temperature is lowered by the run-off. In addition, run-offcoefficients are higher in cooler weather due to reduced evaporation and evapotranspiration, sothat the high flow periods of the year tend to be the cooler periods. Reaeration rates are, ofcourse, much higher when water temperatures are cooler, but BOD decay rates are much lower.For these reasons, periods of high loading are periods of higher reaeration and dissolved oxygenbut not necessarily periods of high BOD decay.
LDEQ interprets this phenomenon in its TMDL modeling by assuming that the annual nonpointloading, rather than loading for any particular day, is responsible for the accumulated benthicblanket of the stream, which is, in turn, expressed as SOD and/or resuspended BOD in themodel. This accumulated loading has its greatest impact on the stream during periods of highertemperature and lower flow. The manmade portion of the NPS loading is the difference betweenthe calibration load and the reference stream load where the calibration load is higher.
LDEQ simulated critical summer conditions in the Bayou Nezpique dissolved oxygen TMDLprojection modeling by using the annual 7Q10 flow or 0.1 cfs, whichever is higher, for allheadwaters, and 90th percentile temperature for the summer season. Incremental flow wasassumed to be zero; model loading was from point sources, perennial tributaries, sedimentoxygen demand, and resuspension of sediments. LDEQ simulated critical winter conditions byusing the lowest of the monthly 7Q10 flow published for the winter months or 1 cfs, whicheverwas higher, for all headwaters, and 90th percentile temperature for the season. Again,incremental flow was assumed to be zero; model loading was from point sources, perennialtributaries, sediment oxygen demand, and resuspension of sediments. In addition, LDEQassumes that all point sources are discharging at maximum capacity.
In reality, the highest temperatures occur in July-August, the lowest stream flows occur inOctober-November, and the maximum point source discharge occurs following a significantrainfall, i.e., high-flow conditions. The combination of these conditions plus the impact of otherconservative assumptions regarding rates and loadings yields an implied margin of safety whichis estimated to be in excess of 10%. Over and above this implied margin of safety, LDEQ usedan explicit MOS of 20% for both point and nonpoint loads. The total MOS is estimated toexceed 30% for the Bayou Nezpique TMDL.
4.1.2 Hydrology and Stream Geometry and Sources
The only tributary considered to have the potential for a non-zero 7Q10 was the East Fork ofBayou Nezpique upstream from the confluence with Boggy Bayou. This stream is fed fromMiller’s Lake and accounted for a significant proportion of the flow during calibration (surveysite 05-BN-02). A 7Q10 determination was made for the sampling site 05-BN-10 located at rivermile 34.1. Documentation for this determination is presented in Appendix E6. The 7Q10 valueof 1.92 cfs at river mile 34.1 was then proportioned based on the measured discharges at 05-BN-

050301-050304/C:\My Documents\Bayou Nezpique TMDL Report.doc Page 15Bayou Nezpique Watershed TMDLMarian U. Aguillard/Engineer Manager, Jeffrey T.. Baker/EIT 2, Karen LeBlanc/ECS ADVOriginated: March 3, 1999 Rev: April 20, 1999; July 2, 1999; July 20, 1999, October 4, 1999
10 and 05-BN-02 to determine the 7Q10 flow in the East Fork. A winter critical flow wasdeveloped from the average of the monthly 7Q10s at the Basile gauging station. A proportionwas again assigned to East Fork Bayou Nezpique for the winter projection.
Critical temperatures for each season were determined from the temperature data collected byLDEQ as part of its historical and current ambient monitoring strategy. The 90th percentiletemperature for each season was computed for Bayou Nezpique near Jennings from 1991 to thepresent and for Bayou Nezpique near Basile for the last ten years. A limited amount of data,primarily from 1998, was available on some of the tributaries to Bayou Nezpique. These datawere combined and the 90th percentile season temperature was computed for use on thetributaries. The temperature spreadsheets are shown in Appendix E6.
The stream cross-section was automatically adjusted for the projection flows by the modelthrough the use of the Leopold coefficients and exponents. For reaches 1-14 and 16, the Leopoldcoefficients and exponents used for calibration were not changed for the projection runs. For thelower reaches however, the widths produced by the projection model using the calibration valuesof the Leopold coefficients and exponents were much too narrow and would in turn haveproduced very unrealistic modeling results in these reaches. For this reason, an adjustment wasmade in the velocity coefficient and exponent which would produce widths in the lower reachesbased on the side slopes at the gauging station at Basile. By doing this, the coefficients andexponents no longer followed the “rules of one” which usually govern the Leopold Equations.The model output was examined and it was determined that even though the “rules of one” wereviolated, the model produced consistent flows, widths, depths and velocities. It is probable thatthe addition of the default depth at zero flow (input “e” in data type 9), renders the “rules of one”moot. The projections and scenarios were then made using the new coefficients in the lowerreaches. It was decided that it would not change the calibration results if the new coefficientswere used since the results of the calibration model were used to determine the new coefficients.The determinations of the new coefficients and exponents for reaches 15, 17, 18, 19, and 20 areshown in Appendix E6.
The flow in each headwater and unmodeled tributary except for East Fork Bayou Nezpique wasset at 0.1 cfs = 0.00283 cms for summer critical conditions in accordance with the LTP. Theflow in each headwater and unmodeled tributary except for East Fork Bayou Nezpique was set at1.0 cfs = 0.0283 cms for winter critical conditions in accordance with the LTP.
Treatment plant flows were determined based on available data from current permits andapplications and then increased by 25% in order to explicitly incorporate a 20% margin of safetyin the effluent loads. Treatment plant projected flows are summarized in Table 5.
4.1.3 Water Quality Input Data and Their Sources.
The initial conditions were set to the 90th percentile critical season temperature in accordancewith the LTP. The dissolved oxygen values for the initial conditions were set at the streamcriteria.

050301-050304/C:\My Documents\Bayou Nezpique TMDL Report.doc Page 16Bayou Nezpique Watershed TMDLMarian U. Aguillard/Engineer Manager, Jeffrey T.. Baker/EIT 2, Karen LeBlanc/ECS ADVOriginated: March 3, 1999 Rev: April 20, 1999; July 2, 1999; July 20, 1999, October 4, 1999
Table 5. Projected Treatment Plant Flow InformationTreatment Plant Current or Expected Flow,
MGDModeled Flow,
MGDModeled Flow,
cmsOakdale 1.46 1.825 2.824Pine Prairie 0.100 0.125 0.193Reddell 0.068 0.085 0.132Evangeline Sew. Co. 0.0364 0.0455 0.070Mamou 0.6 0.75 1.16Oberlin 0.363 0.454 0.702Elton 0.193 0.241 0.373Basile 0.5 0.625 0.967Jennings 2.5 3.125 4.835
The reaeration rate equations, CBOD decay and settling rates, NBOD decay and settling rates,and the fractions converting settled CBOD and settled NBOD to SOD were not changed from thecalibration.
The incremental conditions were used in the calibration to represent nonpoint source loadsassociated with flows. For the projection and scenario runs, the incremental flows were set tozero to emulate the critical conditions for dissolved oxygen.
The reference stream data was assumed to be representative of the chlorides, UCBOD andUNBOD of the headwaters. The 90th percentile critical season temperature and 90% of thesaturation value for dissolved oxygen at that temperature were used for the headwaters inaccordance with the LTP. Calculations of the DO for these conditions are in Appendix E8.
The lower boundary conditions were set at the 90th percentile critical season temperature, thedissolved oxygen criteria, and the reference stream CBOD and NBOD loads for all projectionsand scenarios.
4.1.3.1 Sediment Oxygen Demand, Data Type 12
Except for the “No Discharge Scenario” (No point source loads with the calibrated nonpointsource loads), the SOD values were set at the reference stream values. For both the summer andwinter projection runs, the values had to remain at the reference stream values in order to meetthe DO criteria. The value and sources for SOD for each projection run are presented inAppendices E1-E7.
4.1.3.2 Nonpoint Sources, Data Type 19
Except for the “No Discharge Scenario” (No point source loads with the calibrated nonpointsource loads), the NPS values were based on the reference stream values except where thecalibration value was smaller than the reference stream value. In some cases a percentage of thereference stream loading has been used. Some of the nonpoint source loads in kg/km/day whichwere based on reference stream data appear to be very small loads, but only because they do notaddress stream width. An analysis was made of the projected NPS and SOD loads in terms ofgm-O2/m2/day and compared to the reference stream loads in the same terms. The values and
050301-050304/C:\My Documents\Bayou Nezpique TMDL Report.doc Page 17Bayou Nezpique Watershed TMDLMarian U. Aguillard/Engineer Manager, Jeffrey T.. Baker/EIT 2, Karen LeBlanc/ECS ADVOriginated: March 3, 1999 Rev: April 20, 1999; July 2, 1999; July 20, 1999, October 4, 1999
sources of the nonpoint input and the load analyses are presented in Appendices E1 through E7for each of the projection runs. A brief summary of the methodology used is presented inAppendix E8.
4.1.3.3 Wasteloads, Data Types 24, 25, and 26
Except for the “No Discharge Scenario” (no point source loads with the calibrated nonpointsource loads) and the “No Load Scenario” (no point source loads and no nonpoint source loadsabove reference stream background), the wasteloads entered in the projection models for thetreatment plants were taken from the current permit or application or determined by theprojection. The unmodeled tributary wasteloads were set at reference stream values for the “NoNPS Scenario” and the “No Load Scenario”. For the “No Discharge Scenario”, the wasteloadsentered for the unmodeled tributaries were set at the calibration values. For the summer andwinter projection runs, the wasteloads entered for the unmodeled tributaries were set at 50% ofthe calibration values. The values and sources of the data are presented in Appendices E1-E5.
4.2 Model Discussion and Results
The projection model input and output data sets are presented in Appendix D. The summer andwinter projections are presented as complete printouts. The three scenarios are presented as theinput data set and the dissolved oxygen graphs only.
4.2.1 No Load Scenario
Under this Scenario, the treatment plant discharges were eliminated and the SOD was reduced toreference stream values except where the calibration value was less than the reference streamvalue. The NPS load was also reduced to reference stream values except where the calibrationvalue was smaller. As shown in the output graphs, the main stem and all tributaries except theBayou Blue system meet the existing dissolved oxygen criteria. It is obvious from this plot thatthe current DO criterion of 5 mg/l DO for Bayou Blue should be reevaluated. By analogy, theadjacent Castor Creek system should also be evaluated for a DO criterion change.
4.2.2 No Discharge Scenario
Under this Scenario, the treatment plant discharges were eliminated and the SOD value was setat the calibration value. The NPS load used was also set at the calibration value. As shown inthe output graphs, the main stem and tributaries except Manwell Gully, Beaver Creek,Evangeline Sewer Co. Tributary, and Bayou Grand Louis do not meet the existing dissolvedoxygen criteria. These plots clearly show that the main stem is overwhelmed by the NPS loads.
4.2.3 No NPS Scenario
Under this Scenario, the treatment plant discharges were set at current permit values and theSOD was reduced to reference stream values except where the calibration value was less than thereference stream value. The NPS load was also reduced to reference stream values except wherethe calibration value was smaller. As shown in the output graphs, Beaver Creek/BoggyBayou/East Fork system, Pine Prairie POTW Tributary, and Bayou Grand Louis meet the

050301-050304/C:\My Documents\Bayou Nezpique TMDL Report.doc Page 18Bayou Nezpique Watershed TMDLMarian U. Aguillard/Engineer Manager, Jeffrey T.. Baker/EIT 2, Karen LeBlanc/ECS ADVOriginated: March 3, 1999 Rev: April 20, 1999; July 2, 1999; July 20, 1999, October 4, 1999
existing dissolved oxygen criteria. The main stem, Basile Tributary and Bayou Blue do not meetthe criteria. The plots show that the impact of the treatment plants on the main stem is much lessthan the impact of the nonpoint sources. This is reasonable since the treatment plants do notdirectly discharge into the main stem. The impact in some tributaries is greater from thetreatment plants than from the NPS loads. These tributaries however, are primarily effluentconveyances and do not receive significant NPS loads.
4.2.4 Summer Projection
Bayou Nezpique main stem was modeled from the headwaters of Manwell Gully to theMermentau River. The results of the model show that the water quality standard for dissolvedoxygen for Bayou Nezpique of 3.0 mg/l can be maintained during the summer critical season inthe Bayou Nezpique watershed. The Bayou Blue system currently has a dissolved oxygencriteria of 5.0 mg/l which can not be maintained. The Bayou Blue and the adjacent Castor Creeksystems have been reevaluated and more appropriate DO criteria recommended. To meet a DOcriterion of 3.0 mg/l throughout the entire watershed requires the imposition of an 85% reductionfrom all manmade nonpoint sources and the imposition of 5 mg/l CBOD5/2 mg/l NH3/6 mg/l DOlimits on Oberlin, Elton, Basile, and Jennings; 5 mg/l CBOD5/5 mg/l NH3/6 mg/l DO limits onReddell; 10 mg/l CBOD5/2 mg/l NH3/5 mg/l DO limits for Mamou; 10 mg/l CBOD5/10 mg/lNH3/6 mg/l DO limits for Oakdale and Pine Prairie; and, 10 mg/l CBOD5/5 mg/l NH3/6 mg/l DOlimits for Evangeline Sewer CO. The minimum DO on the main stem is 2.92 mg/l at RK 58.152.This is well within the 10% guidance for achieving standards and reflects the conservative natureof the modeling assumptions. The minimum DO and its location for each reach is shown in thefollowing Table 6. A graph of the dissolved oxygen concentration versus river kilometer for thesummer projection is presented in Figure 2.
4.2.5 Winter Projection
The results of the model show that the water quality criterion for dissolved oxygen for BayouNezpique of 5.0 mg/l can be maintained during the winter critical season in the entire watershed.The minimum dissolved oxygen is 4.98 mg/l and located in the Basile POTW Tributary. This isacceptable. To achieve the criterion, the model assumed the imposition of a 90% reduction fromall manmade nonpoint sources and the imposition of 10 mg/l CBOD5/10 mg/l NH3/5 mg/l DOlimits on Oakdale, Pine Prairie, Oberlin, and Elton; 10 mg/l CBOD5/7.5 mg/l NH3/5 mg/l DOlimits on Basile; 5 mg/l CBOD5/5 mg/l NH3/6 mg/l DO limits on Jennings; 10 mg/l CBOD5/5mg/l NH3/5 mg/l DO limits on Reddell; 10 mg/l CBOD5/2 mg/l NH3/5 mg/l DO limits forMamou; and, 20 mg/l CBOD5/10 mg/l NH3/5 mg/l DO limits for Evangeline Sewer CO. Theminimum DO on the main stem is 5.44 mg/l at RK 53.904. The minimum DO and its locationfor each reach is shown in the following Table 7. A graph of the dissolved oxygen concentrationversus river kilometer for the winter projection is presented in Figure 3.

050301-050304/C:\My Documents\Bayou Nezpique TMDL Report.doc Page 19Bayou Nezpique Watershed TMDLMarian U. Aguillard/Engineer Manager, Jeffrey T.. Baker/EIT 2, Karen LeBlanc/ECS ADVOriginated: March 3, 1999 Rev: April 20, 1999; July 2, 1999; July 20, 1999, October 4, 1999
Table 6. Summer Projections Minimum Dissolved Oxygen for Each Reach.Reach
NumberDO Criteria @Minimum DOLocation, mg/l
Minimum DO inReach,mg/l
Location of MinimumDO,
River Kilometers1 3 3.11 121.55-121.32 2 3.9 31.9-29.73 2 2.99 23.78-23.0404 3 3.66 8.0-6.255 3 3.72 13.416 3 3.61 101.07 3 3.91 13.68 3 3.69 4.32-4.089 3 4.05 13.32810 3 3.79 96.411 5 3.58 45.95612 5 3.87 38.03513 5 3.74 0.014 5 3.78 18.7215 3 3.21 70.216 3 2.99 0.017 3 2.92 58.15218 3 5.01 34.78819 3 3.68 0.220 3 3.61 0.0
Figure 2. Summer Projection Model Dissolved Oxygen versus River Kilometer
Summer Projection Run - B. Nezpique Model
0
1
2
3
4
5
6
7
020406080100120140
River Kilometer
Dis
solv
ed O
xyge
n (m
g/l)

050301-050304/C:\My Documents\Bayou Nezpique TMDL Report.doc Page 20Bayou Nezpique Watershed TMDLMarian U. Aguillard/Engineer Manager, Jeffrey T.. Baker/EIT 2, Karen LeBlanc/ECS ADVOriginated: March 3, 1999 Rev: April 20, 1999; July 2, 1999; July 20, 1999, October 4, 1999
Table 7. Winter Projections Minimum Dissolved Oxygen for Each Reach.Reach
NumberDO Criteria @Minimum DO
Location,mg/l
Minimum DO inReach,mg/l
Location of MinimumDO,
River Kilometers
1 5 6.38 117.8-116.552 3 5.91 39.53 5 5.98 22.3-19.344 5 6.79 2.75-0.005 5 6.6 13.416 5 6.82 102.28-101.007 5 6.39 13.68 5 6.7 1.2-0.009 5 6.56 13.32810 5 6.84 91.811 5 5.66 45.95612 5 6.31 38.03513 5 6.36 0.0014 5 5.96 15.8415 5 5.91 62.416 5 4.98 0.217 5 5.44 53.90418 5 6.16 34.78819 5 5.24 0.3020 5 5.77 0.00
Figure 3. Winter Projection Model Dissolved Oxygen versus River Kilometer 4.3
Winter Projection Run - B. Nezpique Model
0
1
2
3
4
5
6
7
8
9
10
020406080100120140
River Kilometer
Dis
solv
ed O
xyge
n (m
g/l)
050301-050304/C:\My Documents\Bayou Nezpique TMDL Report.doc Page 21Bayou Nezpique Watershed TMDLMarian U. Aguillard/Engineer Manager, Jeffrey T.. Baker/EIT 2, Karen LeBlanc/ECS ADVOriginated: March 3, 1999 Rev: April 20, 1999; July 2, 1999; July 20, 1999, October 4, 1999
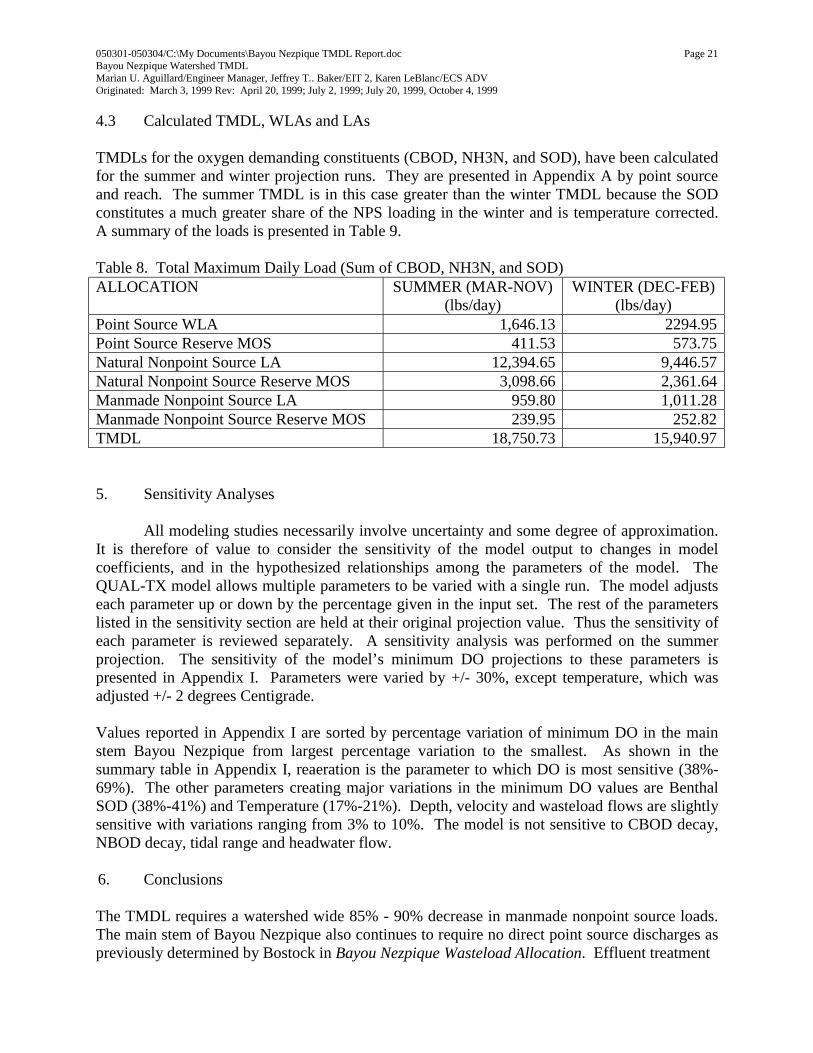
4.3 Calculated TMDL, WLAs and LAs
TMDLs for the oxygen demanding constituents (CBOD, NH3N, and SOD), have been calculatedfor the summer and winter projection runs. They are presented in Appendix A by point sourceand reach. The summer TMDL is in this case greater than the winter TMDL because the SODconstitutes a much greater share of the NPS loading in the winter and is temperature corrected.A summary of the loads is presented in Table 9.
Table 8. Total Maximum Daily Load (Sum of CBOD, NH3N, and SOD)ALLOCATION SUMMER (MAR-NOV)
(lbs/day)WINTER (DEC-FEB)
(lbs/day)Point Source WLA 1,646.13 2294.95Point Source Reserve MOS 411.53 573.75Natural Nonpoint Source LA 12,394.65 9,446.57Natural Nonpoint Source Reserve MOS 3,098.66 2,361.64Manmade Nonpoint Source LA 959.80 1,011.28Manmade Nonpoint Source Reserve MOS 239.95 252.82TMDL 18,750.73 15,940.97
5. Sensitivity Analyses
All modeling studies necessarily involve uncertainty and some degree of approximation.It is therefore of value to consider the sensitivity of the model output to changes in modelcoefficients, and in the hypothesized relationships among the parameters of the model. TheQUAL-TX model allows multiple parameters to be varied with a single run. The model adjustseach parameter up or down by the percentage given in the input set. The rest of the parameterslisted in the sensitivity section are held at their original projection value. Thus the sensitivity ofeach parameter is reviewed separately. A sensitivity analysis was performed on the summerprojection. The sensitivity of the model’s minimum DO projections to these parameters ispresented in Appendix I. Parameters were varied by +/- 30%, except temperature, which wasadjusted +/- 2 degrees Centigrade.
Values reported in Appendix I are sorted by percentage variation of minimum DO in the mainstem Bayou Nezpique from largest percentage variation to the smallest. As shown in thesummary table in Appendix I, reaeration is the parameter to which DO is most sensitive (38%-69%). The other parameters creating major variations in the minimum DO values are BenthalSOD (38%-41%) and Temperature (17%-21%). Depth, velocity and wasteload flows are slightlysensitive with variations ranging from 3% to 10%. The model is not sensitive to CBOD decay,NBOD decay, tidal range and headwater flow.
6. Conclusions
The TMDL requires a watershed wide 85% - 90% decrease in manmade nonpoint source loads.The main stem of Bayou Nezpique also continues to require no direct point source discharges aspreviously determined by Bostock in Bayou Nezpique Wasteload Allocation. Effluent treatment

050301-050304/C:\My Documents\Bayou Nezpique TMDL Report.doc Page 22Bayou Nezpique Watershed TMDLMarian U. Aguillard/Engineer Manager, Jeffrey T.. Baker/EIT 2, Karen LeBlanc/ECS ADVOriginated: March 3, 1999 Rev: April 20, 1999; July 2, 1999; July 20, 1999, October 4, 1999
Table 9. Minimum Dissolved Oxygen for Bayou Nezpique Main Stem for Projections.PERMIT
NO.FACILITY CURRENT
FLOW,MGD
CURRENT LIMITS, mg/l MODELEDFLOW,MGD
SUMMERPROJECTION LIMITS,
mg/l
WINTERPROJECTIONLIMITS, mg/l
LA0033430 OAKDALE, CITY OF(WWTP)
1.46 10BOD5/15TSS 1.83 10BOD5/10NH3/6DO 10BOD5/10NH3/5DO
LA0079057 PINE PRAIRIE,VILLAGE OF (STP)
0.1 10BOD5/15TSS 0.13 10BOD5/10NH3/6DO 10BOD5/10NH3/5DO
LA0109452 REDDELL STP 0.068 10BOD5/15TSS/5NH3/5DO-SUMMER
20BOD5/15TSS/10NH3/5DO-WINTER
0.084 5BOD5/5NH3/6DO 10BOD5/5NH3/5DO
LAG560049 EVANGELINESEWER CO INC
0.0364 20BOD5/20TSS 0.05 10BOD5/5NH3/6DO 20BOD5/10NH3/5DO
LA0020125 MAMOU, TOWN OF(WWTP)
0.6 10BOD5/15TSS/2NH3/5DO 0.75 10BOD5/2NH3/5DO 10BOD5/2NH3/5DO
LA0020087 OBERLIN, TOWN OF(STP)
0.363 10BOD5/15TSS 0.45 5BOD5/2NH3/6DO 10BOD5/10NH3/5DO
LA0061719 ELTON, TOWN OF(WWTP)
0.193 10BOD5/15TSS 0.24 5BOD5/2NH3/6DO 10BOD5/10NH3/5DO
LA0044865 BASILE WWTP 0.5 10BOD5/15TSS 0.63 5BOD5/2NH3/6DO 10BOD5/7.5NH3/5DO
LA0041769 JENNINGS, CITY OF(STP)
2.5 10BOD5/15TSS 3.13 5BOD5/2NH3/6DO 5BOD5/5NH3/6DO
MINIMUM DO INBAYOUNEZPIQUE MAINSTEM
2.92 5.41
levels are required to be upgraded to advanced levels or better with effluent reaeration by alldischargers.
In the event that Bayou Blue continues to have a DO criterion of 5 mg/l year round, no dischargefrom all sources would be required during the summer months. Although Castor Creek was notdirectly modeled and has no point source discharges, it is unlikely that a 5.0 mg/l DO standardcan be achieved in Castor Creek if it cannot be achieved in Bayou Blue in a "no load" condition.Also, as in Bayou Blue, the 85%-90% reduction in manmade nonpoint source loads is unlikely toallow the stream to meet a DO criterion of 5 mg/l. Dissolved Oxygen criteria revisions arerecommended for both Bayou Blue and Castor Creek based on the results of the “No LoadScenario”.
The modeling which has been conducted for this TMDL is very conservative and based onlimited, somewhat dated information. Also, the data gathering design for the 1985 survey wasbased on the use of a non-branched steady state model which required different types of inputdata from that required by Qual-Tx. A larger than normal number of assumptions were requiredto conduct the current modeling effort. The inherently conservative nature of the model has beenincreased due to these assumptions.

050301-050304/C:\My Documents\Bayou Nezpique TMDL Report.doc Page 23Bayou Nezpique Watershed TMDLMarian U. Aguillard/Engineer Manager, Jeffrey T.. Baker/EIT 2, Karen LeBlanc/ECS ADVOriginated: March 3, 1999 Rev: April 20, 1999; July 2, 1999; July 20, 1999, October 4, 1999
Many of the treatment plants have been at advanced levels of treatment for many years and manyBMPs have been implemented in the Mermentau Basin. It is possible that the watershed has notyet begun to exhibit the improvements in water quality which can be expected from these controlmeasures. Future studies may show that this TMDL is smaller than that which can actually beaccommodated by the watershed.
LDEQ will work with other agencies such as local Soil Conservation Districts to implementagricultural best management practices in the watershed through the 319 programs. LDEQ willalso continue to monitor the waters to determine whether standards are being attained.
In accordance with Section 106 of the federal Clean Water Act and under the authority of theLouisiana Environmental Quality Act, the LDEQ has established a comprehensive program formonitoring the quality of the state’s surface waters. The LDEQ Surveillance Section collectssurface water samples at various locations, utilizing appropriate sampling methods andprocedures for ensuring the quality of the data collected. The objectives of the surface watermonitoring program are to determine the quality of the state’s surface waters, to develop a long-term data base for water quality trend analysis, and to monitor the effectiveness of pollutioncontrols. The data obtained through the surface water monitoring program is used to develop thestate’s biennial 305(b) report (Water Quality Inventory) and the 303(d) list of impaired waters.This information is also utilized in establishing priorities for the LDEQ nonpoint sourceprogram.
The LDEQ has implemented a watershed approach to surface water quality monitoring. Throughthis approach, the entire state is sampled over a five-year cycle with two targeted basins sampledeach year. Long-term trend monitoring sites at various locations on the larger rivers and LakePontchartrain are sampled throughout the five-year cycle. Sampling is conducted on a monthlybasis or more frequently if necessary to yield at least 12 samples per site each year. Samplingsites are located where they are considered to be representative of the waterbody. Under thecurrent monitoring schedule, targeted basins follow the TMDL priorities. In this manner, thefirst TMDLs will have been implemented by the time the first priority basins will be monitoredagain in the second five-year cycle. This will allow the LDEQ to determine whether there hasbeen any improvement in water quality following implementation of the TMDLs. As themonitoring results are evaluated at the end of each year, waterbodies may be added to orremoved from the 303(d) list. The sampling schedule for the first five-year cycle is shownbelow.
1998 - Mermentau and Vermilion-Teche River Basins1999 - Calcasieu and Ouachita River Basins2000 - Barataria and Terrebonne Basins2001 - Lake Pontchartrain Basin and Pearl River Basin2002 - Red and Sabine River Basins
(Atchafalaya and Mississippi Rivers will be sampled continuously.)Mermentau and Vermilion-Teche Basins will be sampled again in 2003.

050301-050304/C:\My Documents\Bayou Nezpique TMDL Report.doc Page 24Bayou Nezpique Watershed TMDLMarian U. Aguillard/Engineer Manager, Jeffrey T.. Baker/EIT 2, Karen LeBlanc/ECS ADVOriginated: March 3, 1999 Rev: April 20, 1999; July 2, 1999; July 20, 1999, October 4, 1999
7. References
Bostock, Helen. Bayou Nezpique Wasteload Allocation. Louisiana Department ofEnvironmental Quality Report Number WLA 90.29. Baton Rouge, LA: December, 1990.
Bowie, G. L., et. al. Rates, Constants, and Kinetics Formulations in Surface Water QualityModeling (Second Edition). Env. Res. Lab., USEPA, EPA/600/3-85/040. Athens, GA: 1985.
Forbes, Max J., Jr. Low-Flow Characteristics of Louisiana Streams. USGS Water ResourcesTechnical Report No. 22. Baton Rouge, LA: Louisiana Department of Transportation andDevelopment, Office of Public Works, 1980.
Hebel, Max. Survey Report for the Bayou Nezpique Intensive Survey. Louisiana Department ofEnvironmental Quality. University of Southwestern Louisiana, Center for Louisiana InlandWater Studies, Report Number SUR 90.27. Baton Rouge, LA: December, 1990.
Louisiana Department of Environmental Quality. Dissolved Oxygen Use Attainability Analysis,Mermentau River Basin. Baton Rouge, LA: May, 1998.
Louisiana Department of Environmental Quality. Environmental Regulatory Code, Part IX.Water Quality Regulations. Baton Rouge, LA: 1998.
Rogers, Madeline. Town of Mamou Advanced Treatment Facility Water Quality Review.Louisiana Department of Environmental Quality Report Number ATR 89.18. Baton Rouge, LA:December, 1989.
Rogers, Madeline. Proposed Phased Approach TMDL for the Jennings STP Canal. LouisianaDepartment of Environmental Quality. University of Southwestern Louisiana, Center forLouisiana Inland Water Studies Report Number CLIWS-WLA 92.06. Baton Rouge, LA:March, 1993.
Shoemaker, L., et. al. Compendium of Tools for Watershed Assessment and TMDLDevelopment. Office of Wetland, Oceans, and Watersheds, USEPA, EPA841-B-97-006.Washington, DC: May, 1997.
Smythe, E. deEtte and M. G. Waldon. Bayou Queue de Tortue Steady-State Calibrated WaterQuality Model: Limnoss. Louisiana Department of Environmental Quality. University ofSouthwestern Louisiana, Center for Louisiana Inland Water Studies Report Number CLIWS-WQR 93.03. Baton Rouge, LA: February 16, 1995.
Smythe, E. deEtte. Overview of the 1995 Reference Streams. Louisiana Department ofEnvironmental Quality. Baton Rouge, LA: August 15, 1997.
Texas Water Commission. Qual-Tx User’s Manual (Version 3.3). Water Quality Division,Water Quality Standards and Evaluation Section, Water Quality Evaluation Unit. Austin, TX:December 3, 1990.
050301-050304/C:\My Documents\Bayou Nezpique TMDL Report.doc Page 25Bayou Nezpique Watershed TMDLMarian U. Aguillard/Engineer Manager, Jeffrey T.. Baker/EIT 2, Karen LeBlanc/ECS ADVOriginated: March 3, 1999 Rev: April 20, 1999; July 2, 1999; July 20, 1999, October 4, 1999
Texas Water Commission. Waste Load Evaluation Methodology. Water Quality Division,Water Quality Evaluation Unit. Austin, TX: November, 1990.
Waldon, M. G. Mermentau River – Lower Bayou Nezpique Calibrated Water Quality Model.Louisiana Department of Environmental Quality. University of Southwestern Louisiana, Centerfor Louisiana Inland Water Studies Report Number WQR 92.04. Baton Rouge, LA: January,1993.
Waldon, M. G., R. K. Duerr, and Marian U. Aguillard. Louisiana Total Maximum Daily LoadTechnical Procedures. Louisiana Department of Environmental Quality. Baton Rouge, LA:April, 1998.
8.0 Appendices
See Attached Appendices A-I.