bazaarvoice conversation index volume 1
DESCRIPTION
TRANSCRIPT

The Conversation IndexVolume 1

We’ve reached another turning point.
For as long as humans have been able to communicate, we’ve been evaluating, recommending and sharing. After thousands of years of word of mouth, these conversations began to take place online, where it is now digitally archived.
Naturally, smart businesses got hungry. Here was a chance to capture what their customers — real people actually using their products and services – were saying about them. But, as has happened so many times before, technology eventually outpaced our capacity to truly understand its impact. To companies that were hungry for social data, suddenly it seemed there was simply too much of it. Navigating the flood of social content and arriving at meaningful insights about customers became a challenge — and still is — for many businesses.
Social data isn’t slowing down, but we’re now able to get ahead of it, to make sense of it.
We’ve arrived at a turning point at which social data can be captured, analyzed—and most importantly, acted upon—to drive true, customer-centric change across companies, and even entire industries.
But this report isn’t about social data. It’s about the people behind the data. We’re excited to share with you what we’ve learned about them from the hundreds of billions of conversations our technologies have been a part of.
The Conversation Index you’re about to read is the first of many to come. Now, on to the insights…
Best,
Erin Nelson (@erinclaire) Chief Marketing Officer, Bazaarvoice

Table of ContentsThe Conversation Index ......................................................................................................2
Consumer language reflects economic uncertainty ..................................................................5
All over the map: sentiment by region, country .....................................................................6
The Friday Facebook flood ................................................................................................ 10
Women fuel word of mouth .............................................................................................. 12
Controlling spending, leading conversations ....................................................................... 14
Summer warms traveler sentiment .................................................................................... 18
Poor service destroys product sentiment ............................................................................ 21
One in five spread the love ...............................................................................................22
Pivot language reveals product opportunities ......................................................................25
As price and complexity increase, consumer… .....................................................................26
UGC served at 3 kilohertz, volume soars .............................................................................30
Conclusion .....................................................................................................................32
Citations ........................................................................................................................34
About Bazaarvoice .........................................................................................................35
2
Product quality and interactions with brand representatives
are inseparable in the minds of many consumers—poor
customer service is the product sentiment killer.
Consumers seek facts and details, not opinions and
subjective comparisons, when the price and complexity of
products and services increase.
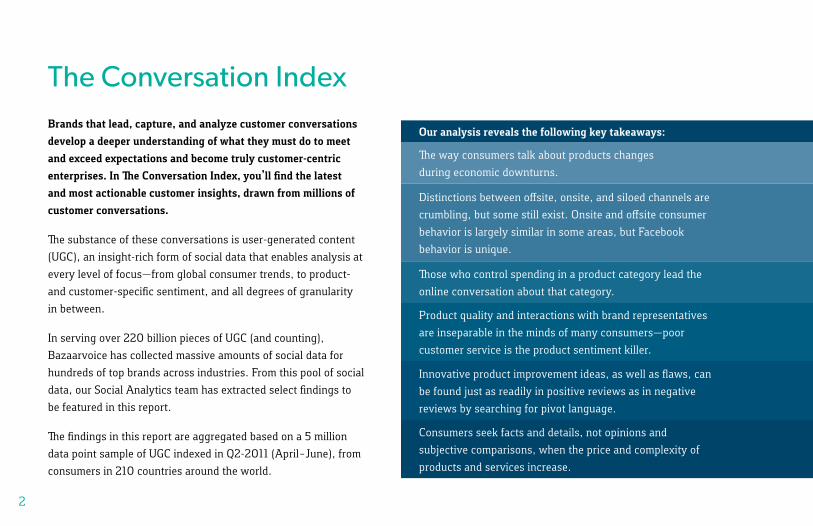
Our analysis reveals the following key takeaways:
The Conversation Index Brands that lead, capture, and analyze customer conversations develop a deeper understanding of what they must do to meet and exceed expectations and become truly customer-centric enterprises. In The Conversation Index, you’ll find the latest and most actionable customer insights, drawn from millions of customer conversations.
The substance of these conversations is user-generated content
(UGC), an insight-rich form of social data that enables analysis at
every level of focus—from global consumer trends, to product-
and customer-specific sentiment, and all degrees of granularity
in between.
In serving over 220 billion pieces of UGC (and counting),
Bazaarvoice has collected massive amounts of social data for
hundreds of top brands across industries. From this pool of social
data, our Social Analytics team has extracted select findings to
be featured in this report.
The findings in this report are aggregated based on a 5 million
data point sample of UGC indexed in Q2-2011 (April–June), from
consumers in 210 countries around the world.
The way consumers talk about products changes
during economic downturns.
Distinctions between offsite, onsite, and siloed channels are
crumbling, but some still exist. Onsite and offsite consumer
behavior is largely similar in some areas, but Facebook
behavior is unique.
Those who control spending in a product category lead the
online conversation about that category.
Innovative product improvement ideas, as well as flaws, can
be found just as readily in positive reviews as in negative
reviews by searching for pivot language.

Product quality and interactions with brand representatives
are inseparable in the minds of many consumers—poor
customer service is the product sentiment killer.
Consumers seek facts and details, not opinions and
subjective comparisons, when the price and complexity of
products and services increase.
Our analysis reveals the following key takeaways:
The way consumers talk about products changes
during economic downturns.
Distinctions between offsite, onsite, and siloed channels are
crumbling, but some still exist. Onsite and offsite consumer
behavior is largely similar in some areas, but Facebook
behavior is unique.
Those who control spending in a product category lead the
online conversation about that category.
Innovative product improvement ideas, as well as flaws, can
be found just as readily in positive reviews as in negative
reviews by searching for pivot language.
4
14% Pricereferences
ConsumerConfidence
Index
Dow JonesIndustrial
Index
Q1 2009: Highest number of reviews mention price when Dow and CCI at lowest points.14K
13K
12K
11K
10K
9K
8K
7K
6K
120
100
80
60
40
20
0
12%
10%
8%
6%
4%
2%
0%
Q3
20
07
Q4
20
07
Q1
20
08
Q2
20
08
Q3
20
08
Q4
20
08
Q1
20
09
Q2
20
09
Q3
20
09
Q4
20
09
Q1
20
10
Q2
20
10
Q3
20
10
Q4
20
10
Q1
20
11
Q2
20
11
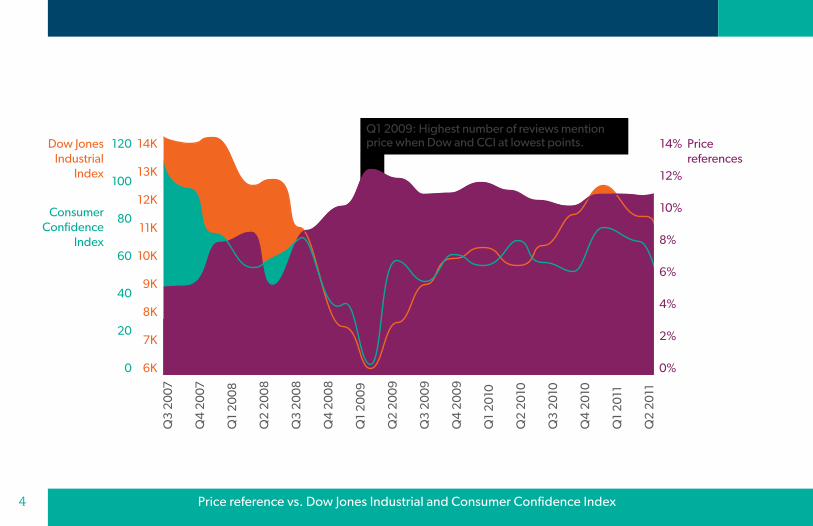
Price reference vs. Dow Jones Industrial and Consumer Confidence Index
5
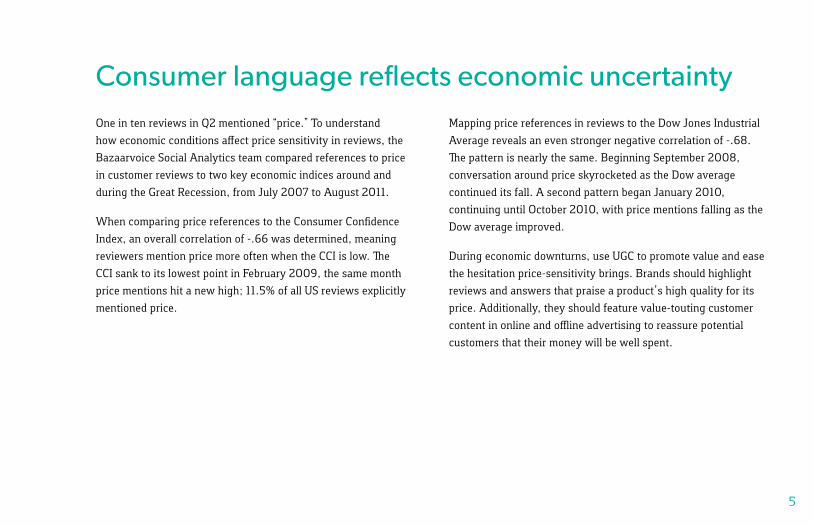
Consumer language reflects economic uncertaintyOne in ten reviews in Q2 mentioned “price.” To understand
how economic conditions affect price sensitivity in reviews, the
Bazaarvoice Social Analytics team compared references to price
in customer reviews to two key economic indices around and
during the Great Recession, from July 2007 to August 2011.
When comparing price references to the Consumer Confidence
Index, an overall correlation of -.66 was determined, meaning
reviewers mention price more often when the CCI is low. The
CCI sank to its lowest point in February 2009, the same month
price mentions hit a new high; 11.5% of all US reviews explicitly
mentioned price.
Mapping price references in reviews to the Dow Jones Industrial
Average reveals an even stronger negative correlation of -.68.
The pattern is nearly the same. Beginning September 2008,
conversation around price skyrocketed as the Dow average
continued its fall. A second pattern began January 2010,
continuing until October 2010, with price mentions falling as the
Dow average improved.
During economic downturns, use UGC to promote value and ease
the hesitation price-sensitivity brings. Brands should highlight
reviews and answers that praise a product’s high quality for its
price. Additionally, they should feature value-touting customer
content in online and offline advertising to reassure potential
customers that their money will be well spent.
6
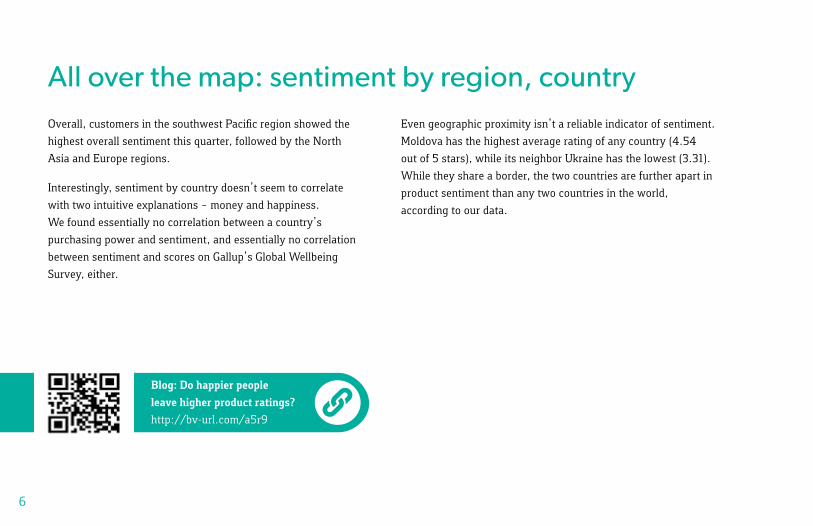
All over the map: sentiment by region, countryOverall, customers in the southwest Pacific region showed the
highest overall sentiment this quarter, followed by the North
Asia and Europe regions.
Interestingly, sentiment by country doesn’t seem to correlate
with two intuitive explanations – money and happiness.
We found essentially no correlation between a country’s
purchasing power and sentiment, and essentially no correlation
between sentiment and scores on Gallup’s Global Wellbeing
Survey, either.
Even geographic proximity isn’t a reliable indicator of sentiment.
Moldova has the highest average rating of any country (4.54
out of 5 stars), while its neighbor Ukraine has the lowest (3.31).
While they share a border, the two countries are further apart in
product sentiment than any two countries in the world,
according to our data.
Blog: Do happier people leave higher product ratings?
http://bv-url.com/a5r9

15 most positive countries Average rating
Moldova 4.54
Georgia 4.52
Latvia 4.45
Chile 4.41
Russia 4.38
Bulgaria 4.36
Australia 4.35
United Kingdom 4.34
New Zealand 4.33
Puerto Rico 4.32
Kenya 4.31
Germany 4.31
Azerbaijan 4.31
Macedonia 4.30
Ireland 4.30
15 most negative countries Average rating
Pakistan 4.00
Spain 4.00
Nigeria 3.99
Romania 3.99
United Arab Emirates 3.98
Argentina 3.98
Indonesia 3.97
Peru 3.96
Algeria 3.95
Uruguay 3.94
India 3.89
Morocco 3.80
Thailand 3.79
Iran 3.73
Ukraine 3.31
8
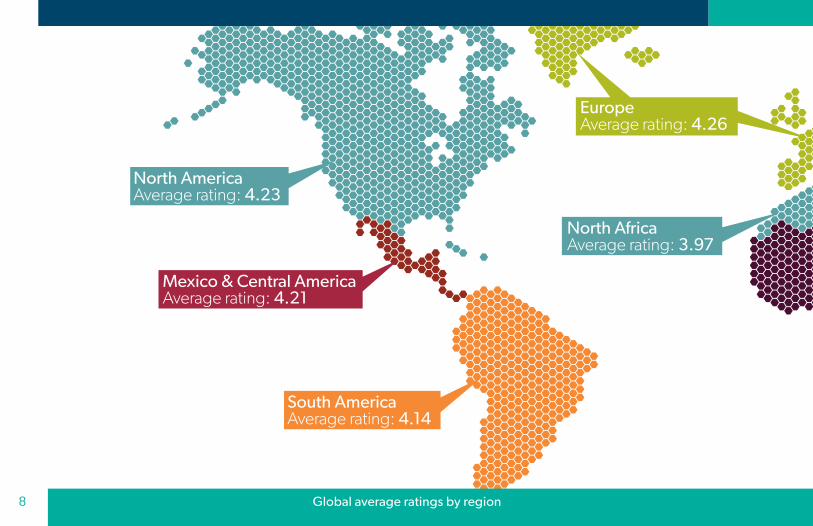
South AmericaAverage rating: 4.14
Southwest PacificAverage rating: 4.35
Sub-Saharan AfricaAverage rating: 4.16
North AfricaAverage rating: 3.97
EuropeAverage rating: 4.26 North Asia
Average rating: 4.32
South & Southeast AsiaAverage rating: 3.95
East AsiaAverage rating: 4.09
West & Central AsiaAverage rating: 4.11
North AmericaAverage rating: 4.23
Mexico & Central AmericaAverage rating: 4.21
Global average ratings by region
9
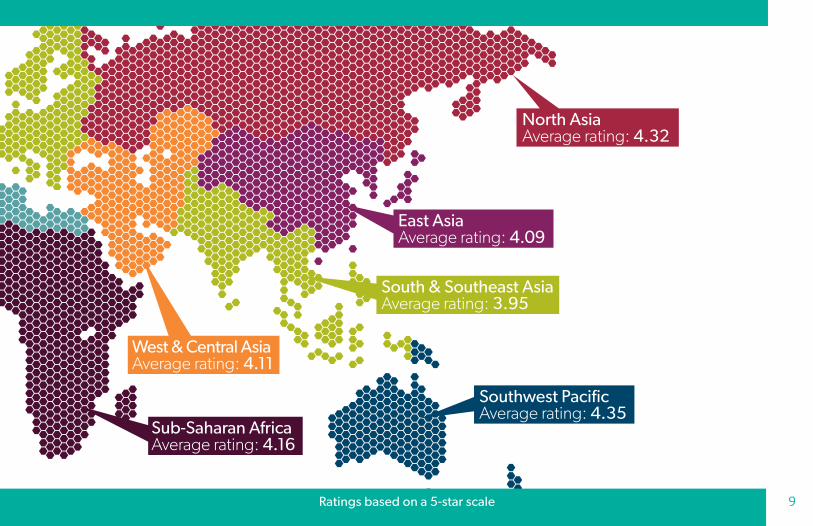
South AmericaAverage rating: 4.14
Southwest PacificAverage rating: 4.35
Sub-Saharan AfricaAverage rating: 4.16
North AfricaAverage rating: 3.97
EuropeAverage rating: 4.26 North Asia
Average rating: 4.32
South & Southeast AsiaAverage rating: 3.95
East AsiaAverage rating: 4.09
West & Central AsiaAverage rating: 4.11
North AmericaAverage rating: 4.23
Mexico & Central AmericaAverage rating: 4.21
Global average ratings by region Ratings based on a 5-star scale
10
The Friday Facebook floodNearly a third (32%) of all reviews collected on Facebook in Q2
were submitted on Fridays. The remaining reviews were collected
fairly evenly throughout the week.
This Friday spike in Facebook reviews doesn’t match overall
usage patterns for Facebook pages, which see the most activity
on Wednesdays.1 Nor does it mirror onsite review submission
data, where 21% of reviews gathered this quarter were
submitted on a Tuesday, the most popular day of week for this
activity. In fact, Fridays accounted for only 11% of onsite review
submissions—only Saturdays (9%) saw lower activity rates.
However, a study of 50,000 posts from the top 14,000 pages
on Facebook found that Friday posts had the highest weekday
interaction rates2, so it’s likely that when brands invite Facebook
users to review their products, the calls to action posted on
Fridays are driving more review submissions than similar posts
throughout the week.
Facebook reviewers are also more positive, with a 12% higher
average sentiment for Facebook reviews over reviews not
collected on the social network. With many of these reviews
coming from existing Facebook fans, this can be attributed to the
more positive disposition of Facebook fans toward the brands
they like. In fact, 60% of Facebook fans say they’re more likely
to recommend the brand since becoming a fan.3
Facebook reviewers are also more
positive, with a 12% higher average
sentiment for Facebook reviews
over reviews not collected on the
social network.
11Daily review submissions via Facebook
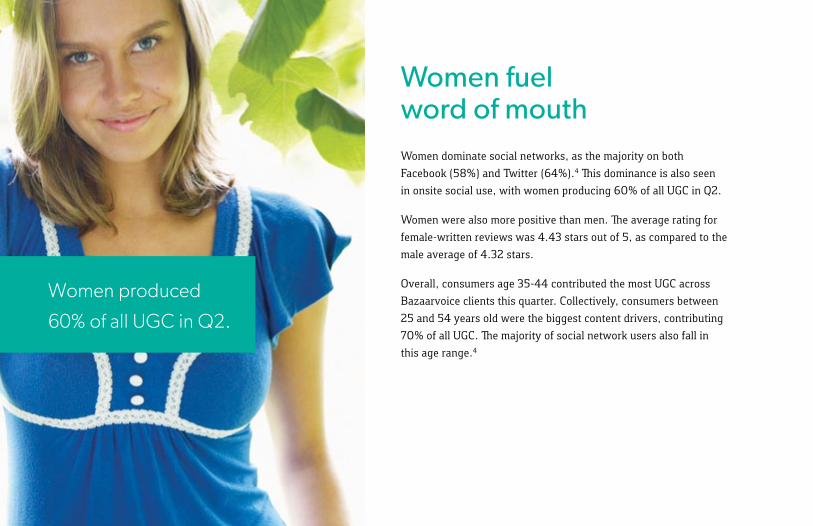
Women fuel word of mouth Women dominate social networks, as the majority on both
Facebook (58%) and Twitter (64%).4 This dominance is also seen
in onsite social use, with women producing 60% of all UGC in Q2.
Women were also more positive than men. The average rating for
female-written reviews was 4.43 stars out of 5, as compared to the
male average of 4.32 stars.
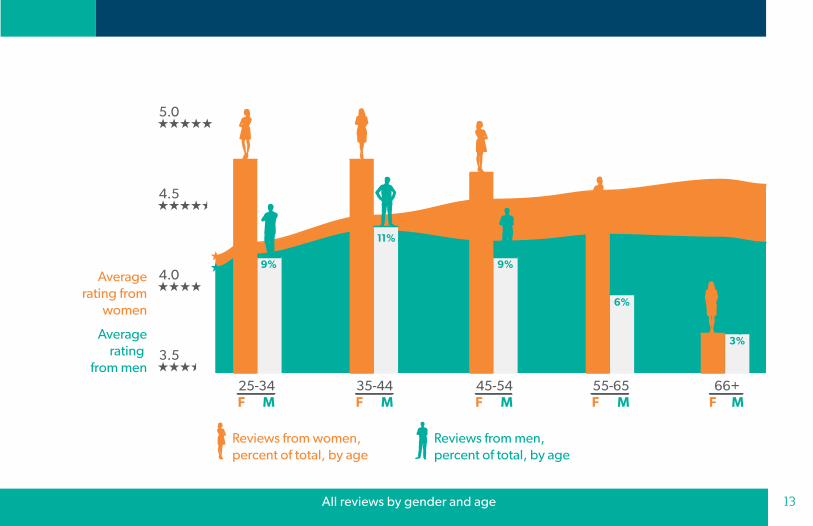
Overall, consumers age 35-44 contributed the most UGC across
Bazaarvoice clients this quarter. Collectively, consumers between
25 and 54 years old were the biggest content drivers, contributing
70% of all UGC. The majority of social network users also fall in
this age range.4
Women produced
60% of all UGC in Q2.
13
25-34MF
35-44MF
45-54MF
55-65MF
66+MF
Averagerating from
women
Averagerating
from men
16%
9%
11%
9%
6%
3% 3%
16%15%
11%
5.0
4.0
3.5
4.5
Reviews from women,percent of total, by age
Reviews from men,percent of total, by age
All reviews by gender and age
18
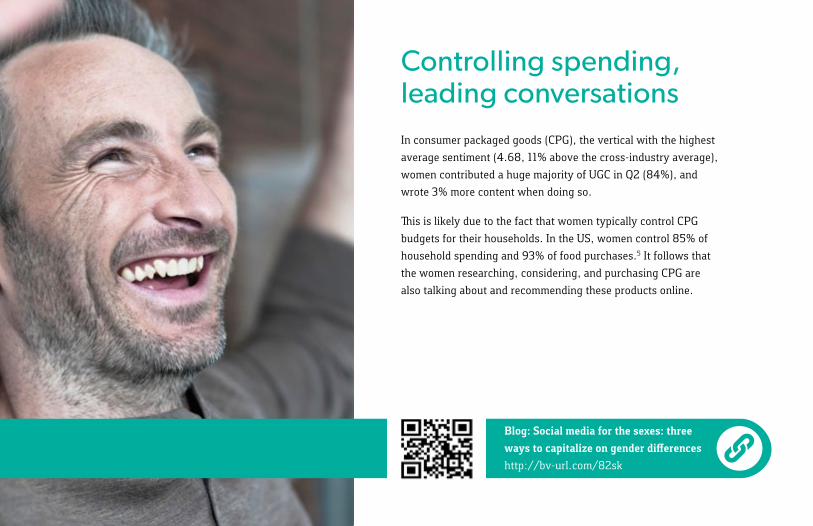
Blog: Social media for the sexes: three ways to capitalize on gender differences
http://bv-url.com/82sk
Controlling spending, leading conversations In consumer packaged goods (CPG), the vertical with the highest
average sentiment (4.68, 11% above the cross-industry average),
women contributed a huge majority of UGC in Q2 (84%), and
wrote 3% more content when doing so.
This is likely due to the fact that women typically control CPG
budgets for their households. In the US, women control 85% of
household spending and 93% of food purchases.5 It follows that
the women researching, considering, and purchasing CPG are
also talking about and recommending these products online.
15
Controlling spending, leading conversations
Averagerating from
women
Averagerating
from men
5.0
4.0
3.5
4.5
25-34MF
35-44MF
45-54MF
55-65MF
66+MF
Reviews from women,percent of total, by age
Reviews from men,percent of total, by age
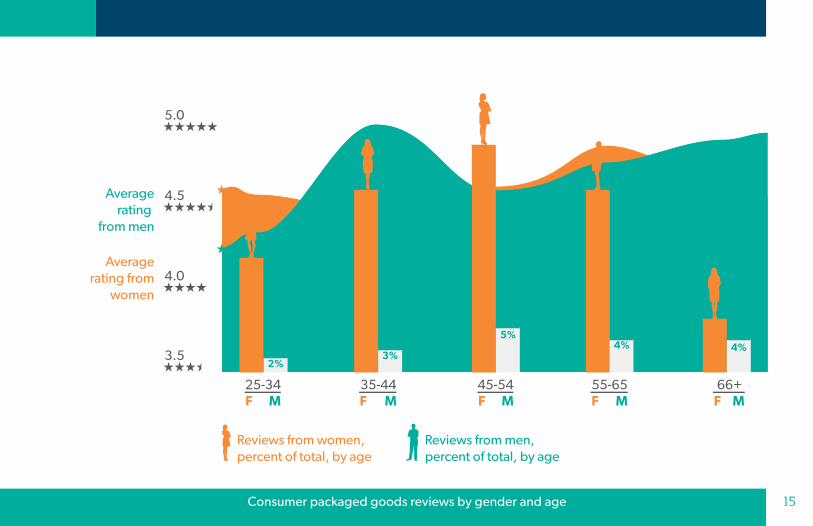
13%
20%
25%
20%
6%5%
4%
2%3%
4%
Consumer packaged goods reviews by gender and age
16
25-34MF
35-44MF
45-54MF
55-65MF
66+MF
Averagerating from
women
Averagerating
from men
5.0
4.0
3.5
4.5
Reviews from women,percent of total, by age
Reviews from men,percent of total, by age
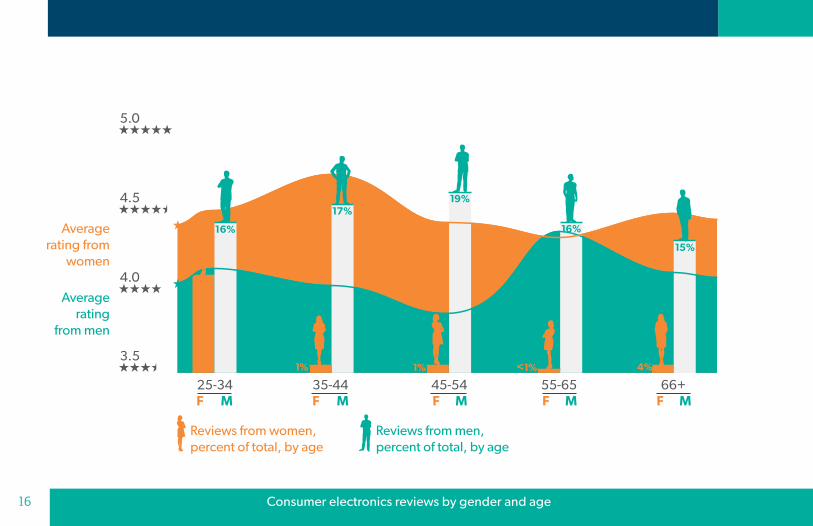
10%
1% 1% 4%<1%
16%
17%19%
16%
15%
Consumer electronics reviews by gender and age
21
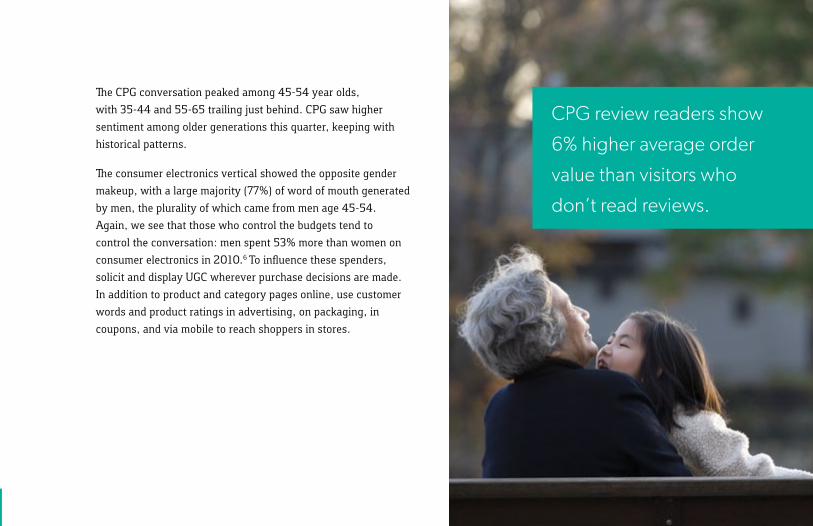
The CPG conversation peaked among 45-54 year olds,
with 35-44 and 55-65 trailing just behind. CPG saw higher
sentiment among older generations this quarter, keeping with
historical patterns.
The consumer electronics vertical showed the opposite gender
makeup, with a large majority (77%) of word of mouth generated
by men, the plurality of which came from men age 45-54.
Again, we see that those who control the budgets tend to
control the conversation: men spent 53% more than women on
consumer electronics in 2010.6 To influence these spenders,
solicit and display UGC wherever purchase decisions are made.
In addition to product and category pages online, use customer
words and product ratings in advertising, on packaging, in
coupons, and via mobile to reach shoppers in stores.
CPG review readers show
6% higher average order
value than visitors who
don’t read reviews.
Consumer electronics reviews by gender and age

22
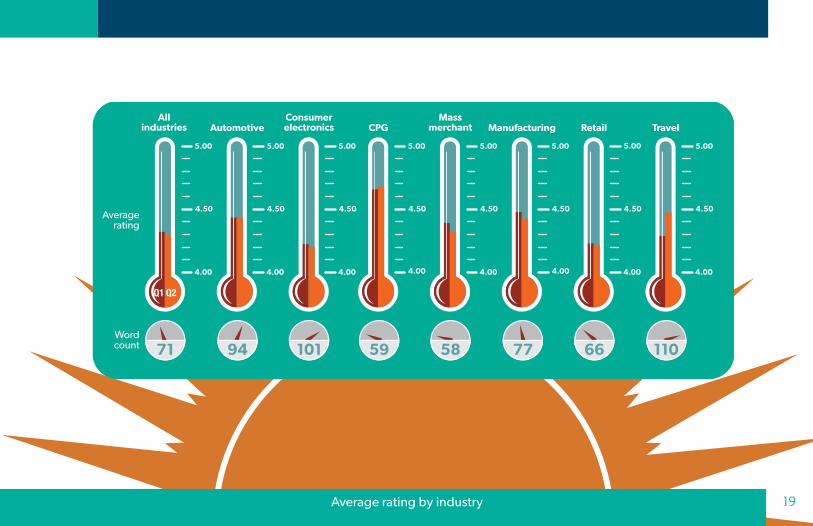
Summer warms traveler sentimentThe travel vertical saw a 4% increase in average rating in Q2
to 4.46 stars on a 5 star scale, while most other verticals
only fluctuated +/- 1%. We saw a similar seasonal sentiment
increase for the travel industry in Q2 2010, and the sentiment
spike is likely caused by the fact that summer is the peak
season for pleasure travel.
Overall, travel had the longest average review of any vertical
in Q2. Travel has always been a category that lends itself to
storytelling, so this is no surprise.
Average rating by industry
Blog: Use this word of mouth metric to create customer fanatics
http://bv-url.com/yppj
Wordcount
Averagerating
Allindustries
4.00
5.00
4.50
Q1 Q2
71
Consumerelectronics
4.00
5.00
4.50
101
Massmerchant
4.00
5.00
4.50
58
Retail
4.00
5.00
4.50
66
Automotive
4.00
5.00
4.50
94
Travel
4.00
5.00
4.50
110
CPG
4.00
5.00
4.50
59
Manufacturing
4.00
5.00
4.50
77
Average rating by industry 19
20
14%
16%
18%
Averagerating forreviews withcustomer service mentions
Averagerating basedon a 5 starscale
Percent ofreviews with
customer service
mentions
91% lower average rating when tagged with customer service.
12%
10%
8%
6%
4%
2%
0%
ALL
Clie
nts
Reta
il
Man
ufac
turin
g
Fina
ncia
l ser
vice
s
Ap
par
el
Con
sum
er e
lect
roni
cs
Hom
e im
pro
vem
ent
Hou
sew
ares
Mas
s m
erch
ant
Spor
ting
goo
ds
3.0
2.0
1.0
5.0
4.0
1.5
2.5
3.5
4.5
Customer service mentions by industry
21
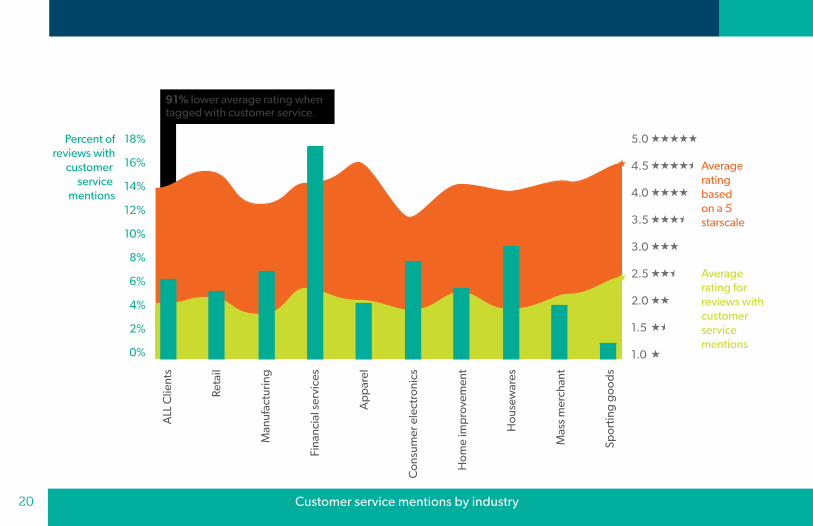
Poor service destroys product sentimentAcross industries, 6% of reviews mentioned customer service
in Q2. Overall, the average rating for these reviews was a
staggering 91% lower than the general average rating. Many
consumers are clearly unwilling to evaluate a product’s quality
separately from their experiences with brand representatives. A
great product won’t save brand word of mouth if the company
doesn’t support customers with good service.
Financial services saw the highest portion of reviews that
mention customer service (17%), but also showed the smallest
gap in average rating between service reviews and reviews not
mentioning service (62%). Service industries can expect a higher
rate of customer service mentions in reviews, as customers have
a higher expectation of service from these businesses and are
therefore more likely to discuss service as part of the product.
Historically, February sees an increase in customer service
mentions in reviews. This is likely due to the surge of holiday gift
purchases and returns, which accounted for nearly one quarter
of all retail returns in 2010.7
Though reviews are inherently product-specific, brands shouldn’t
overlook the massive opportunity to learn more about how
customers view other elements of the brand like customer
service. Rather than waiting for and reacting to individual
inquiries, proactively search for customer service issues in UGC.
When appropriate, responding to service complaints in line with
a review shows other customers that service teams are truly
listening to their feedback, and can present an opportunity to
turn a negative experience into a positive one.
Additionally, aggregated customer feedback offers insights
businesses can act on to improve their overall customer
experience. Analyze reviews mentioning service for key positive
and negative themes, and distribute these trends to service
teams to reveal how to delight customers.
Financial services saw the highest
portion of reviews that mention
customer service (17%).
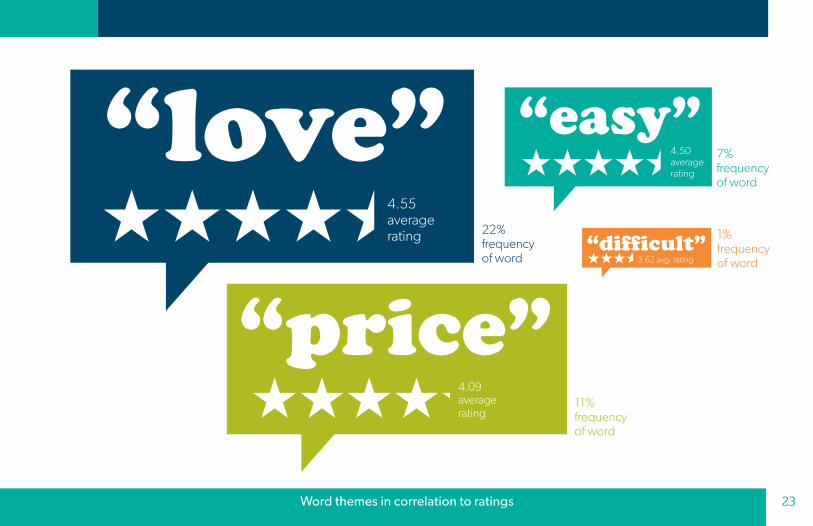
One in five spread the loveOne in five reviews in Q2 contained the word “love.” Ratings for
reviews containing “love” averaged 4.55 stars—10% higher than
the overall average.
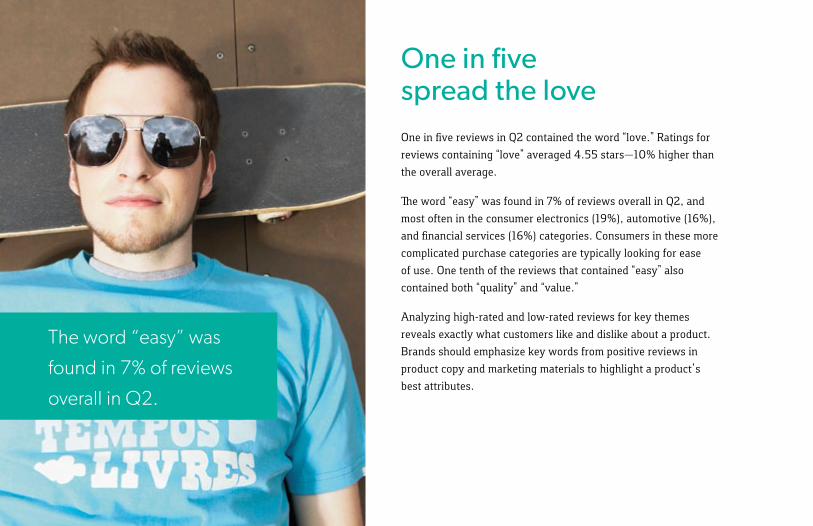
The word “easy” was found in 7% of reviews overall in Q2, and
most often in the consumer electronics (19%), automotive (16%),
and financial services (16%) categories. Consumers in these more
complicated purchase categories are typically looking for ease
of use. One tenth of the reviews that contained “easy” also
contained both “quality” and “value.”
Analyzing high-rated and low-rated reviews for key themes
reveals exactly what customers like and dislike about a product.
Brands should emphasize key words from positive reviews in
product copy and marketing materials to highlight a product’s
best attributes.
The word “easy” was
found in 7% of reviews
overall in Q2.
23
1% frequency of word
7% frequency of word
22% frequency of word
11% frequency of word
“difficult”
“easy”“love”
“price”
4.55averagerating
4.09averagerating
4.50averagerating
3.62 avg. rating
Word themes in correlation to ratings

28
“Even though”
“Only Problem”
“although...”
“but wish”
“IF ONLY”
“HOWEVER”
25
Pivot language reveals product opportunitiesLow-rated reviews often contain ideas for improving products. But
when it comes to UGC, businesses shouldn’t rely on ratings alone to
uncover opportunities to innovate. While it’s not surprising that 86%
of reviews mentioning “never again” were one- or two-star, many
reviews contain “pivot language”—critical review points within an
otherwise positive review with a high rating.
For example, 75% of customers who “wish” a product was better
in some way still rated the product four or five stars. And 87% of
reviews that identified a product’s “only problem” also rated the
product four or five stars.
Even the best products can get better, so don’t focus solely on low-
rated products for opportunities to improve. Devote just as much
scrutiny to high-rated products for innovation suggestions. And while
it’s important to closely monitor negative reviews for potential issues,
some of the best insights for improvements come from a product’s
biggest fans. Use text analysis to locate pivot language in positive
reviews and uncover trends in suggestions. These insights empower
product teams to co-innovate better products with customers.
26
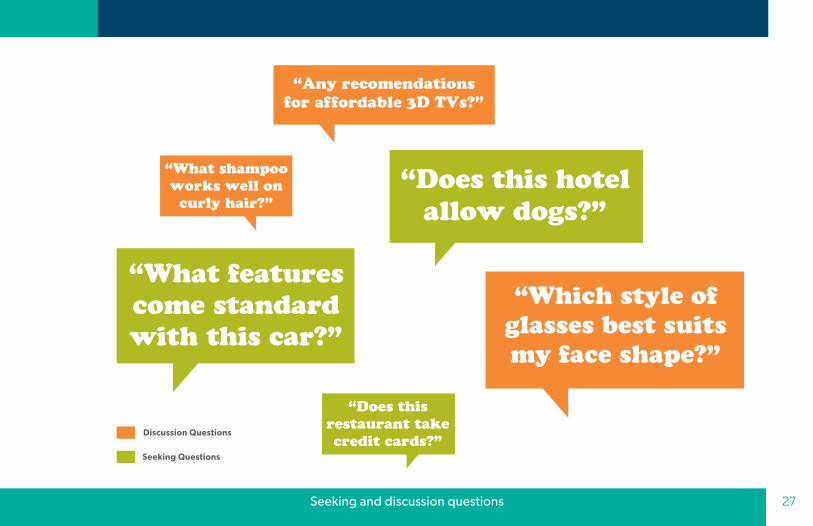
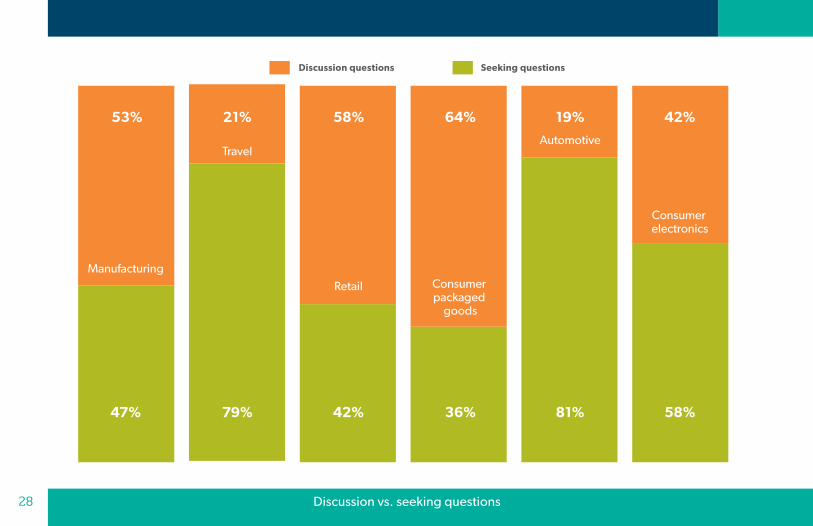
As price and complexity increase, consumer questions get specific The questions consumers asked about products in Q2 can
be divided into two broad types—seeking questions and
discussion questions.
“Seeking” questions ask for product-specific use cases and
information, and are looking for facts rather than opinions.
Example seeking questions include:
“Does GPS navigation in this truck come standard?”
“At what decibel do these speakers max out?”
“Does this hotel offer free wireless internet?”
Seeking questions were more prevalent in verticals where
products are more expensive and complicated. Consumers risk
more if they have less knowledge about these products, so they
make sure to ask detailed questions before they purchase. In the
automotive, travel, and consumer electronics categories,
seeking questions comprised 81%, 79%, and 58% of
questions asked, respectively.
Brands in these categories should closely monitor Q&A
communities in near real time, and have representatives provide
fact-based answers to help shoppers find the right products
for their specific needs. Analyzing trends in seeking questions
also gives insight into which product attributes and information
brands should emphasize in product copy.
“Discussion” questions are open-ended, or concern categories
or comparisons of products, and are often invitations to other
consumers to weigh in with more subjective answers and
recommendations. Example discussion questions include:
“What type of baby wipes do you recommend for infants?”
“Which of these two sweaters looks better on my body type?”
“Which of these lamps is the best, and why?”
27Seeking and discussion questions
28
Discussion questions Seeking questions
ManufacturingRetail
AutomotiveTravel
Consumer electronics
Consumer packaged
goods
21% 64%58%53% 42%
79% 36%42%47% 81% 58%
19%
Discussion vs. seeking questions
33
Discussion questions were seen most often in verticals where
product price and complexity were lower, allowing more leeway
to discuss subjective favorites and opinions. In the CPG, retail,
and general manufacturing verticals, discussion questions
comprised 64%, 58%, and 53% of questions asked, respectively.
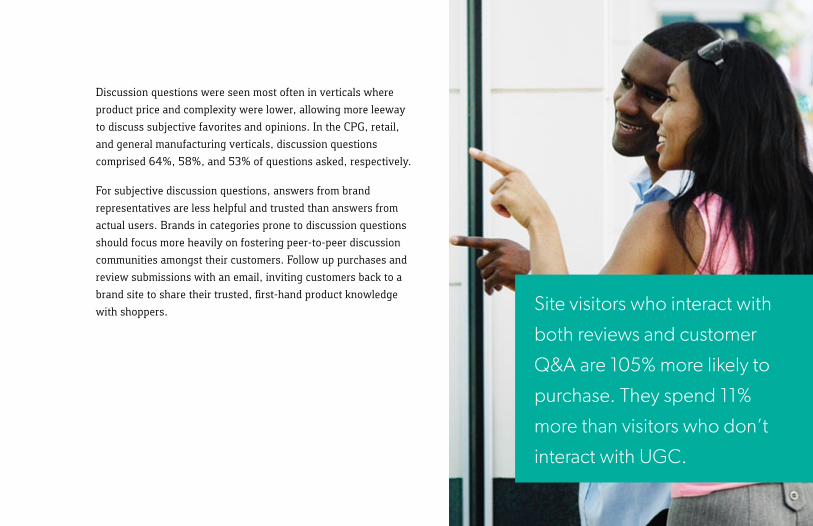
For subjective discussion questions, answers from brand
representatives are less helpful and trusted than answers from
actual users. Brands in categories prone to discussion questions
should focus more heavily on fostering peer-to-peer discussion
communities amongst their customers. Follow up purchases and
review submissions with an email, inviting customers back to a
brand site to share their trusted, first-hand product knowledge
with shoppers. Site visitors who interact with
both reviews and customer
Q&A are 105% more likely to
purchase. They spend 11%
more than visitors who don’t
interact with UGC.
Runningtotal ofreviewcount(Since 3/1/2010)
Monthlyreview
volumetrend
Mar
ch 2
010
Ap
ril 2
010
May
20
10
June
20
10
July
20
10
Ap
ril 2
011
May
20
11
June
20
11
Aug
ust 2
010
Sep
tem
ber
20
10
Oct
ober
20
10
Nov
emb
er 2
010
Dec
emb
er 2
010
Janu
ary
20
11
Mar
ch 2
011
Feb
ruar
y 2
011
0
1M
2M
3M
4M
5M
6M
7M
8M
9M
Monthly review growth across all industries30
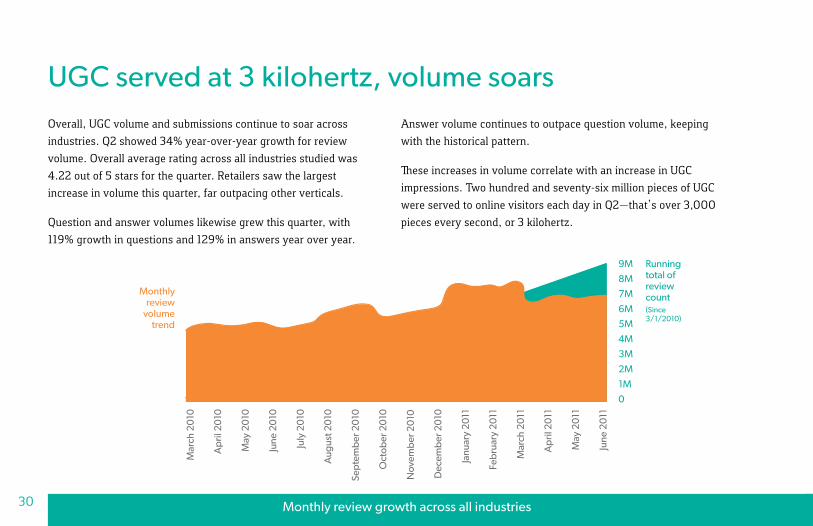
UGC served at 3 kilohertz, volume soarsOverall, UGC volume and submissions continue to soar across
industries. Q2 showed 34% year-over-year growth for review
volume. Overall average rating across all industries studied was
4.22 out of 5 stars for the quarter. Retailers saw the largest
increase in volume this quarter, far outpacing other verticals.
Question and answer volumes likewise grew this quarter, with
119% growth in questions and 129% in answers year over year.
Answer volume continues to outpace question volume, keeping
with the historical pattern.
These increases in volume correlate with an increase in UGC
impressions. Two hundred and seventy-six million pieces of UGC
were served to online visitors each day in Q2—that’s over 3,000
pieces every second, or 3 kilohertz.
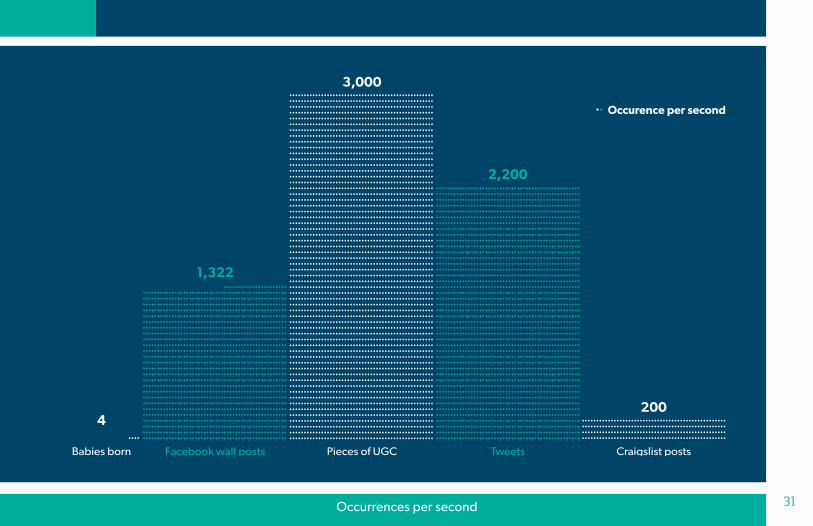
31Occurrences per second
........................................................................................................................................................................................................................................................................................................................................................................................................................................................................................................................................................................................................................................................................................................................................................................................................................................................................................................................................................................................................................................................................................................................................................................................................................................................................................................................................................................................................................................................................................................................................................................................................................................................................................................................................................................................................................................................................................................................................................................................................................................................................................................................................................................................................................................................................................................................................................................................................................................................................................................................................................................................................................................................................................................................................................................................................................................................................................................................................................................................................................................................................................................................Pieces of UGC
........................................................................................................................................................................................................................................................................................................................................................................................................................................................................................................................................................................................................................................................................................................................................................................................................................................................................................................................................................................................................................................................................................................................................................................................................................................................................................................................................................................................................................................................................................................................................................................................................................................................................................................................................................................................................................................................................................................................................................................................................................................................................................................................................................................................................................................................................................Tweets
2,200
3,000
..........................................................................................................................................................................................................................................................................................................................................................................................................................................................................................................................................................................................................................................................................................................................................................................................................................................................................................................................................................................................................................................................................................................................................................................................................................................................................................................................................................................Facebook wall posts
1,322
........................................................................................................................................................................................................Craigslist posts
200
....4
Babies born
.. Occurence per second
36
ConclusionSocial data is a wellspring of rich customer and product intelligence. By analyzing customer conversations, businesses uncover insights to develop a holistic picture of their customers—who they are, what they want, and how they talk about products and services.
But these insights are only as powerful as the actions they enable companies to take and the choices they inform. Our marketplace is increasingly driven to deliver exactly what customers want, as soon as they want it. Only the companies that can operationalize their social insights across the business, and empower business decision makers in every function with the insights to make customer-centric choices, will fully capture the value of social data.
37
Contact usThis paper should raise just as many questions as it answers.
Contact us at bazaarvoice.com to see how we help brands
gain invaluable consumer and product insights by
enabling conversations.
US: (866) 522-9227
UK: +44 (0) 208.080.1100
France: +33 (0) 1.53.53.14.99
Germany: +49.89.24218508
Netherlands +31.20.301.2169
Australia/Asia-Pacific: +61.2.9362.2200
Sweden: +46.8.463.1083
38
Citations 1 “When Are Facebook Users Most Active? [STUDY].” Mashable.
http://mashable.com/2010/10/28/facebook-activity-study/
2 “Weekend Facebook Posts Shows High Interaction Rates.” Momentus Media. http://momentusmedia.com/blog/?p=899
3 “Consumers Engaged Via Social Media Are More Likely To Buy, Recommend.” Chadwick Martin Bailey.
http://blog.cmbinfo.com/press-center-content/bid/46920/Consumers-Engaged-Via-Social-Media-Are-More-Likely-To-Buy-Recommend
4 “Twitter, Facebook And LinkedIn: Age, Ethnicity And Gender Of The Major Social Networks [STUDY].” All Twitter.
http://www.mediabistro.com/alltwitter/pew-social-network-age-ethnicity-gender_b11681
5 “Social Media Marketing to Women: What Every Brand Needs to Know.” Pontiflex.
http://www.pontiflex.com/download/socialwomen.pdf
6 “Do Women Really Control 80% of Household Spending?” The Wall Street Journal.
http://blogs.wsj.com/numbersguy/do-women-really-control-80-of-household-spending-1054/tab/interactive/
7 “Returning Those Unwanted Gifts: The Life Cycle of a Gift Receipt.” Milo.
http://milo.com/blog/returning-those-unwanted-gifts-the-life-cycle-of-a-gift-receipt/?display=wide
39
About Bazaarvoice Bazaarvoice’s Software as a Service (SaaS) solutions have powered more than 240 billion customer
conversations on brand web sites like Best Buy, Blue Shield of California, Costco, Dell, Macy’s, P&G, Panasonic,
QVC, and USAA. The company connects organizations to their influencers through a unique network that reaches
hundreds of millions of consumers around the globe, enabling authentic customer-powered marketing. Through
syndication, analytics, partnerships, and consulting, Bazaarvoice brings the voice of the customer to the center
of their clients’ business strategy, proving “social” can drive measured revenue growth and cost savings for
manufacturing, retail, travel, and financial services companies. Headquartered in Austin, the company has offices
in Amsterdam, London, Munich, Paris, Stockholm, and Sydney. For more information and access to client success
stories, visit www.bazaarvoice.com, read the blog at www.bazaarvoice.com/blog, and follow on Twitter at
www.twitter.com/bazaarvoice.


Notes