Öbb compact on the move always sheet total 27,344.1 non-current assets 25,876.8 current assets...
TRANSCRIPT
Alwayson the moveÖ
BB
com
pact
Facts & Figures
35 mil. long-distance passengers
217 mil. bus passengers
209 mil. regional transport passengers
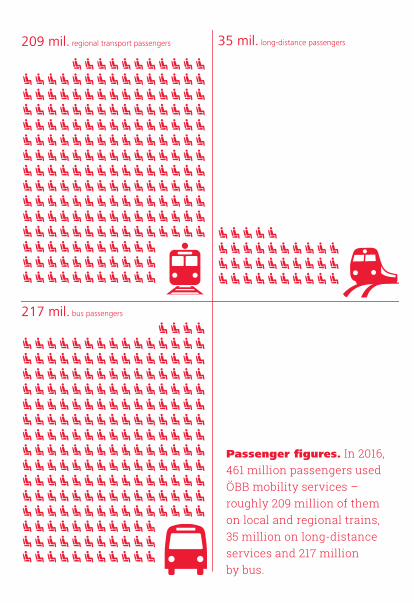
Passenger fi gures. In 2016, 461 million passengers used ÖBB mobility services – roughly 209 million of them on local and regional trains, 35 million on long-distance services and 217 million by bus.

FOREWORD 3
Always on the move for you. 40,000 ÖBB employees ensure that around 1.3 million passengers and roughly 300,000 tons of freight arrive safely and punctually at their destination every day. That makes ÖBB Austria’s biggest mobility provider, one that makes an important contribution to environmental protection. By moving people and goods by rail, ÖBB saves 3 million tons of CO2 each year.
A key prerequisite for ÖBB’s sustainable train services is the construction and maintenance of a modern railroad infrastructure. With an annual investment of 2.5 billion euro, ÖBB not only creates value for future generations but also ranks among the biggest contracting authorities in the country, making it an important economic factor. ÖBB also puts this importance to the test as an attractive employer. Because ÖBB is one of the biggest employers in Austria and the leader when it comes to technical training. No fewer than 1,700 apprentices are trained at ÖBB every year.
In this “Facts & Figures” booklet, you’ll find these and many other exciting details about ÖBB as a company. Take a peek behind the scenes and be impressed by the economic power of ÖBB.
FACTS & FIGURESFOREWORD
2067 | 1959–197727 in fl eet, 111 built
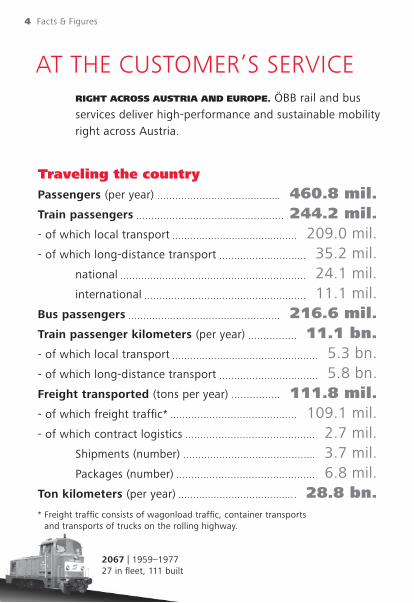
Traveling the countryPassengers (per year) 460.8 mil.Train passengers 244.2 mil.- of which local transport 209.0 mil.- of which long-distance transport 35.2 mil. national 24.1 mil. international 11.1 mil.Bus passengers 216.6 mil.Train passenger kilometers (per year) 11.1 bn.- of which local transport 5.3 bn.- of which long-distance transport 5.8 bn.Freight transported (tons per year) 111.8 mil.- of which freight traffi c* 109.1 mil.- of which contract logistics 2.7 mil. Shipments (number) 3.7 mil. Packages (number) 6.8 mil.Ton kilometers (per year) 28.8 bn.* Freight traffi c consists of wagonload traffi c, container transports
and transports of trucks on the rolling highway.
RIGHT ACROSS AUSTRIA AND EUROPE. ÖBB rail and bus services deliver high-performance and sustainable mobility right across Austria.
AT THE CUSTOMER’S SERVICE
4 Facts & Figures

Trains (per day) 6,420- of which local transport* 4,065- of which long-distance transport* 320 ÖBB trains 277- of which freight traffi c* 1,140- of which service trains 895* incl. train operating companies (TOC)
Rapid transit systemLines Austria-wide (managed by ÖBB) 34Passengers (per day) 410,850Lines Vienna/LA/Burgenland (since 1962) 10Passengers (per day) 216,785Lines Upper Austria* (since 2016) 4Passengers (per day) 38,000 Lines Styria** (since 2007) 6Passengers (per day) 40,275Lines Carinthia*** (since 2010) 4Passengers (per day) 19,790Lines Salzburg (since 2003) 2Passengers (per day) 22,000Lines Tyrol (since 2007) 6Passengers (per day) 42,000Lines Vorarlberg (since 2011) 2Passengers (per day) 32,000 * 4 new lines since 11 December 2016, passenger numbers from December 2016 ** 2 new lines since 11 December 2016, passenger numbers from January 2017*** 1 new line since 11 December 2016, passenger numbers from May 2017
MOBILITY PROVIDER 5
2043 | 1964–197710 in fl eet, 77 built
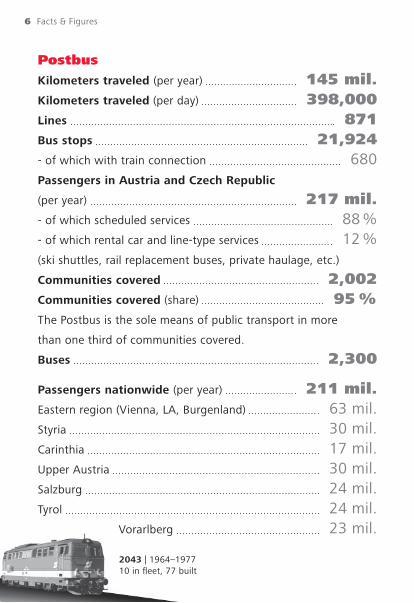
PostbusKilometers traveled (per year) 145 mil.Kilometers traveled (per day) 398,000Lines 871Bus stops 21,924- of which with train connection 680Passengers in Austria and Czech Republic
(per year) 217 mil.- of which scheduled services 88 %- of which rental car and line-type services 12 %(ski shuttles, rail replacement buses, private haulage, etc.)
Communities covered 2,002Communities covered (share) 95 %The Postbus is the sole means of public transport in more
than one third of communities covered.
Buses 2,300
Passengers nationwide (per year) 211 mil.Eastern region (Vienna, LA, Burgenland) 63 mil.Styria 30 mil.Carinthia 17 mil.Upper Austria 30 mil.Salzburg 24 mil.Tyrol 24 mil. Vorarlberg 23 mil.
6 Facts & Figures

Train ticketsTickets sold (per year) 39.4 mil. - of which at ticket machine 59 % - of which at ticket counter* 23 %- of which on internet/smartphones/tablets 18 %
SCOTTY app downloads 3.5 mil.ÖBB app downloads* 550,000
SCOTTY timetable inquiries (per month) 19 mil.SCOTTY timetable inquiries (per minute) 439Page views on oebb.at (per month) 3.5 mil.* Ticket counters/external partners/customer service/lounge/business customer
advisors/infra-partners/ÖBB travel agencies
MOBILITY PROVIDER 7
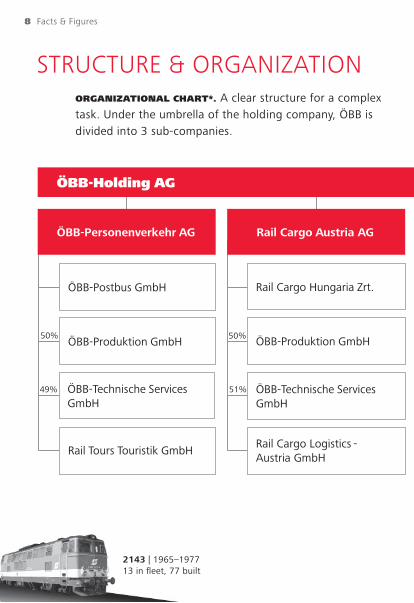
50% 50%
51%
49%
ÖBB-Holding AG
ÖBB-Produktion GmbH
ÖBB-Technische Services GmbH
Rail Tours Touristik GmbH
ÖBB-Postbus GmbH
ÖBB-Produktion GmbH
ÖBB-Technische Services GmbH
Rail Cargo Hungaria Zrt.
ÖBB-Personenverkehr AG Rail Cargo Austria AG
Rail Cargo Logistics - Austria GmbH
2143 | 1965–197713 in fl eet, 77 built
ORGANIZATIONAL CHART*. A clear structure for a complex task. Under the umbrella of the holding company, ÖBB is divided into 3 sub-companies.
STRUCTURE & ORGANIZATION
8 Facts & Figures

60%
Mungos Sicher & Sauber GmbH
Rail Equipment GmbH
ÖBB-ImmobilienmanagementGmbH
ÖBB-Werbung GmbH
ÖBB-Business CompetenceCenter GmbH
ÖBB-Infrastruktur AG Q Logistics GmbH
* This organizational chart includes a selection of important companies within the ÖBB Group. Date: 1 August 2017
ORGANIZATIONAL CHART 9
1142 | 1969–1977Conversion from 1042.5, 66 in fl eet, 177 built
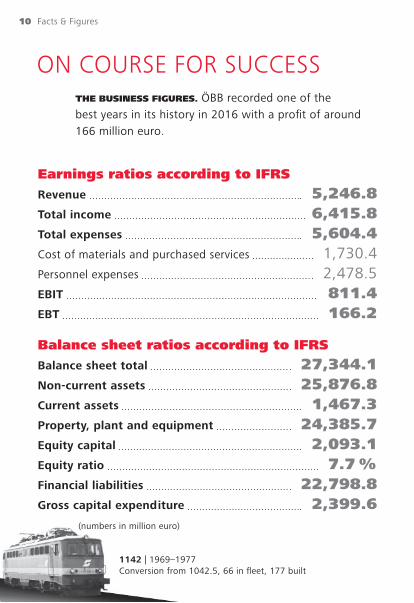
Earnings ratios according to IFRSRevenue 5,246.8Total income 6,415.8Total expenses 5,604.4Cost of materials and purchased services 1,730.4Personnel expenses 2,478.5EBIT 811.4EBT 166.2
Balance sheet ratios according to IFRSBalance sheet total 27,344.1Non-current assets 25,876.8Current assets 1,467.3Property, plant and equipment 24,385.7Equity capital 2,093.1Equity ratio 7.7 %Financial liabilities 22,798.8Gross capital expenditure 2,399.6 (numbers in million euro)
THE BUSINESS FIGURES. ÖBB recorded one of the best years in its history in 2016 with a profi t of around 166 million euro.
ON COURSE FOR SUCCESS
10 Facts & Figures
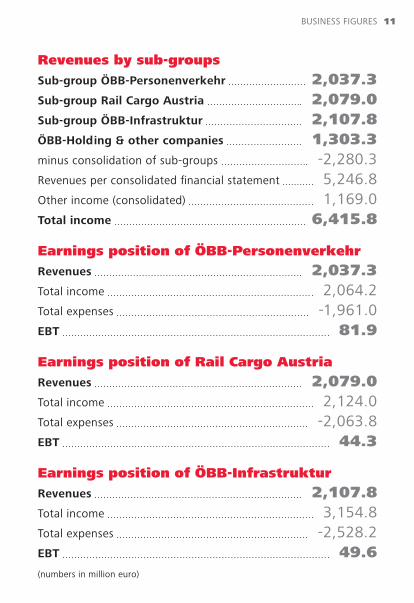
Revenues by sub-groups Sub-group ÖBB-Personenverkehr 2,037.3Sub-group Rail Cargo Austria 2,079.0Sub-group ÖBB-Infrastruktur 2,107.8ÖBB-Holding & other companies 1,303.3minus consolidation of sub-groups -2,280.3Revenues per consolidated fi nancial statement 5,246.8Other income (consolidated) 1,169.0Total income 6,415.8
Earnings position of ÖBB-PersonenverkehrRevenues 2,037.3Total income 2,064.2Total expenses -1,961.0EBT 81.9
Earnings position of Rail Cargo AustriaRevenues 2,079.0Total income 2,124.0Total expenses -2,063.8EBT 44.3
Earnings position of ÖBB-InfrastrukturRevenues 2,107.8Total income 3,154.8Total expenses -2,528.2EBT 49.6(numbers in million euro)
BUSINESS FIGURES 11

1044/1144 | 1978–1995209 in fl eet, 217 built
Train ridesTrain rides (per year) 2,342,186- of which passenger trains 1,600,030 Long-distance transport 116,453 Local transport 1,483,577- of which freight trains 416,045- of which service trains 326,111
PunctualityLong-distance passenger transport 87.7 %Local passenger transport 96.4 %Passenger transport total 95.9 %
Punctuality threshold
Passenger traffi c (minutes) 5Freight traffi c (minutes) 15
MOBILITY PROVIDER. 461 million passengers traveled on board the trains and buses of ÖBB in 2016. An insight into the numbers of a complex system.
THE WORLD OF TRAINS
12 Facts & Figures 12 Facts & Figures
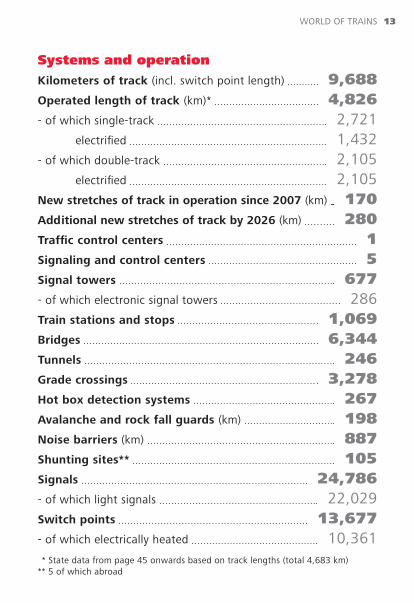
Systems and operationKilometers of track (incl. switch point length) 9,688Operated length of track (km)* 4,826- of which single-track 2,721 electrifi ed 1,432- of which double-track 2,105 electrifi ed 2,105New stretches of track in operation since 2007 (km) 170Additional new stretches of track by 2026 (km) 280Traffi c control centers 1Signaling and control centers 5Signal towers 677- of which electronic signal towers 286Train stations and stops 1,069Bridges 6,344Tunnels 246Grade crossings 3,278Hot box detection systems 267Avalanche and rock fall guards (km) 198Noise barriers (km) 887Shunting sites** 105Signals 24,786- of which light signals 22,029Switch points 13,677- of which electrically heated 10,361 * State data from page 45 onwards based on track lengths (total 4,683 km) ** 5 of which abroad
WORLD OF TRAINS 13

1063 | 1983–199148 in fl eet, 50 built
Train stations/stops updated by 2016 200Train stations/stops updated by 2025 270Platforms (km) 420Train stations/stops with bathrooms 379Elevators 668Escalators 194Wheelchair elevators 205PA systems 1,819Platform emergency call boxes 549 Clocks in customer area approx. 4,000
Average infrastructure investments
2017–2022 (euro per year) approx. 2.5 bn.average new construction and expansion investments
2017–2022 (euro per year) approx. 1.9 bn.average reinvestments
(incl. P & R and noise control) + repair
2017–2022 (euro per year) approx. 1.3 bn.
Park & Ride spaces 108,102- of which car parking spaces 62,451- of which two-wheeler parking spaces 45,651
14 Facts & Figures

Passengers with an accessible train station
2016 approx. 75 % 2020 85 % 2025 90 %
Number of train operating companies (TOC)
on the Austrian route network in 2016 42
Train kilometersTrain kilometers (per year) 146.1 mil.- of which passenger traffi c 98.3 mil. ÖBB Group 93.3 mil.- of which freight traffi c 40.5 mil. ÖBB Group 31.7 mil.- of which service traffi c 7.3 mil. ÖBB Group 6.1 mil.
WORLD OF TRAINS 15

Capacity utilization
Trains traveling the ÖBB network at peak times 579average traveling Mon-Fri 06:00–20:00 483average traveling Mon-Sun 00:00–24:00 350 Train departures throughout Austria during peak times
(per minute) 10
Vehicle fl eetEngines in fl eet 1,033- of which in use 1,000Coaches 2,646Freight cars 21,533
Real estate
Buildings 4,496Building space
incl. outside rented spaces (m²) 2.7 mil.Real estate management 23,609Net land owned by ÖBB (m²)* 193.5 mil.- of which in Vienna (m²) 11.8 mil.Repairs and investment projects (per year) 1,830Lease and rental contracts (external) 18,100 Technical assets (technology management) 75,700* The value for net land owned by ÖBB refers to areas managed by IMMO.
1064 | 1984–199010 in fl eet
16 Facts & Figures
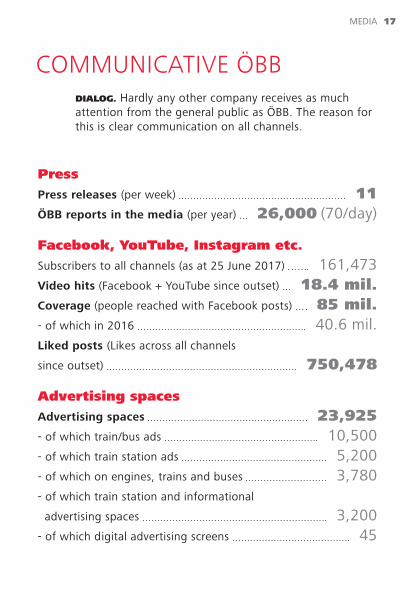
PressPress releases (per week) 11ÖBB reports in the media (per year) 26,000 (70/day)
Facebook, YouTube, Instagram etc.Subscribers to all channels (as at 25 June 2017) 161,473Video hits (Facebook + YouTube since outset) 18.4 mil. Coverage (people reached with Facebook posts) 85 mil.- of which in 2016 40.6 mil. Liked posts (Likes across all channels
since outset) 750,478
Advertising spacesAdvertising spaces 23,925- of which train/bus ads 10,500- of which train station ads 5,200 - of which on engines, trains and buses 3,780 - of which train station and informational
advertising spaces 3,200- of which digital advertising screens 45
DIALOG. Hardly any other company receives as much attention from the general public as ÖBB. The reason for this is clear communication on all channels.
COMMUNICATIVE ÖBB
MEDIA 17

MOVING AUSTRIA. With a widespread and dense network of connections, ÖBB offers its passengers attractive connection options.
WITH THE BEST CONNECTIONS
18 Facts & Figures
205
98
107
70
37
POSTBUS
STOPSTOTAL
STOPS PER WORKING DAY
LONG-DISTANCE
LOCAL
TRAINS TOTAL
TULLNER-FELD
34
0
34
16
181
479
428
51
480
SEMMERINGSouthern line. From Vienna to Graz or on via Bruck an der Mur to Villach
WIENER NEUSTADT
Western line. From Vienna to Innsbruck
120
961
771
190
767
0
767
625
142
VIENNA MAIN STATION
VIENNA MEIDLING
370
213
157
89
68
VIENNAAIRPORT
1,081

Tens of thousands of stops every dayÖBB ensures that around 1.3 million passengers arrive safely and punctu-ally at their destination each and every day. To achieve this, around 4,000 passenger trains and 870 bus routes are linked into a nationwide public transport network. The graphic below gives an insight into the dense net-work of connections taking the Southern and Western lines as an example – with our 12,000 train and bus stops as well as boarding, alighting and connection options. ➔
HUBS 19
AMSTETTEN LINZST. VALENTIN
358
211
147
103
44
0
169
132
37
169
KAPFEN-BERG
+GRAZ LEOBENBRUCK/MUR
105
0
105
73
32
349
109
240
192
48
83
111
78
33
194
101
199
148
51
300
652
405
308
97
1,057
ST. PÖLTEN
34
90
56
34
124
MÜRZ-ZUSCHLAG
344
252
92
1,406
1,062
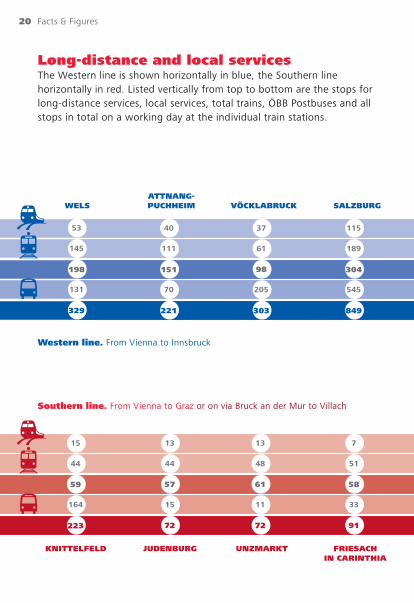
Long-distance and local servicesThe Western line is shown horizontally in blue, the Southern line horizontally in red. Listed vertically from top to bottom are the stops for long-distance services, local services, total trains, ÖBB Postbuses and all stops in total on a working day at the individual train stations.
20 Facts & Figures
Western line. From Vienna to Innsbruck
Southern line. From Vienna to Graz or on via Bruck an der Mur to Villach
ATTNANG- PUCHHEIM
221
70
151
111
40
SALZBURG
849
545
304
189
115
VÖCKLABRUCKWELS
205
98
61
37
303
JUDENBURGKNITTELFELD FRIESACH IN CARINTHIA
UNZMARKT
72
15 11 33
57 61 58
44 48 51
223
164
59
44
15 13 13 7
9172
131
198
145
53
329
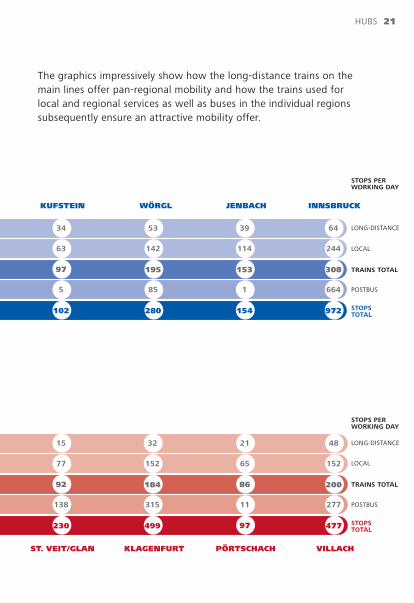
The graphics impressively show how the long-distance trains on the main lines offer pan-regional mobility and how the trains used for local and regional services as well as buses in the individual regions subsequently ensure an attractive mobility offer.
HUBS 21
INNSBRUCKJENBACH
154
1
153
114
39
POSTBUS
STOPSTOTAL
STOPS PER WORKING DAY
KUFSTEIN
5
97
63
34
102
664
308
244
64
972
WÖRGL
85
195
142
53
280
LONG-DISTANCE
LOCAL
TRAINS TOTAL
ST. VEIT/GLAN PÖRTSCHACHKLAGENFURT VILLACH
230
138 277
92 200
77 152
15
97
11
86
65
21 48
POSTBUS
STOPSTOTAL
STOPS PER WORKING DAY
477
315
184
152
32
499
LONG-DISTANCE
LOCAL
TRAINS TOTAL

2068 | 1989–199458 in fl eet, 60 built
Networked in EuropeTotal tons transported (per year) 109.1 mil.- of which conventional wagonload traffi c 85.6 mil.- unaccompanied combined traffi c 16.8 mil.
(corresponds to approx. 1.7 mil. Intermodal Transport Units)
- Rolling highway 6.7 mil.(corresponds to approx. 189,483 transported trucks)
Number of trains (per year) 518,329Train kilometers (per year) 49.4 mil.Ton kilometers (per year) 28.8 mil.Modal share of rail in total freight traffi c
in ton-km in Austria 30.7 %
Market shares of the Rail Cargo GroupAustria 74.5 %Hungary 63.6 %Bulgaria 3.6 %Germany 2.8 %
INTERNATIONAL. Between the North Sea, Mediterranean and Black Sea, over 109 million tons of freight are transported reliably and in an environmentally friendly way every year.
MOVING FREIGHT
22 Facts & Figures
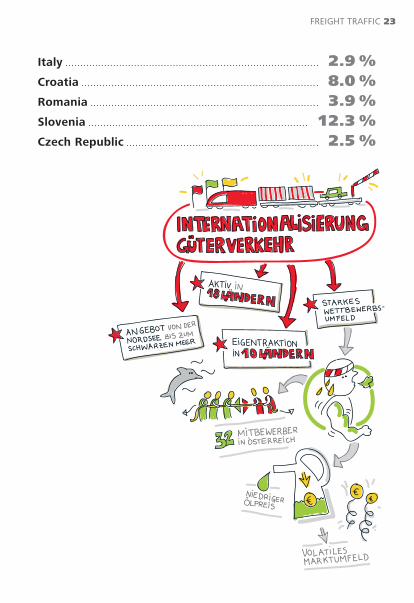
Italy 2.9 %Croatia 8.0 %Romania 3.9 %Slovenia 12.3 %Czech Republic 2.5 %
FREIGHT TRAFFIC 23
North Sea
Mediterranean Sea
24 Facts & Figures
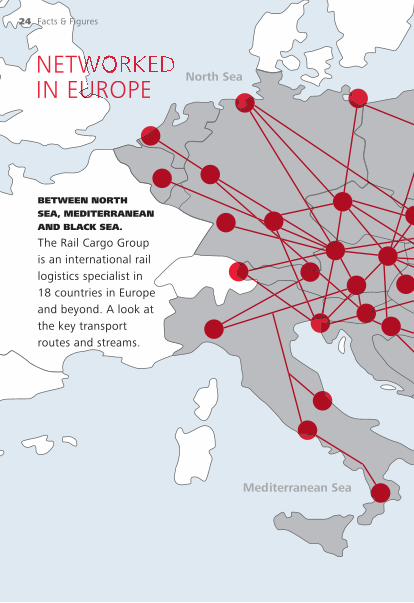
BETWEEN NORTH SEA, MEDITERRANEAN AND BLACK SEA. The Rail Cargo Group is an international rail logistics specialist in 18 countries in Europe and beyond. A look at the key transport routes and streams.
NETWWUROPEIN EURUR

Black Sea
FREIGHT TRAFFIC 25

1163 | 1994–199520 in fl eet
26 Facts & Figures
SATISFIED CUSTOMERS. The results of the customer satisfaction analysis as well as the ten most frequented train stations and the busiest in each state.
A COUNTRY OF RAILWAYS
Austria’s busiest train stations(passenger movements per day)
1 Vienna Main Station (Vienna) 120,0002 Vienna Meidling 72,1343 Wien Mitte 56,9094 Vienna Praterstern 54,8715 Vienna Floridsdorf 46,5776 Linz Main Station (UA) 41,9517 Vienna Handelskai 39,7528 Wiener Neustadt Main Station (LA) 39,5639 Innsbruck Main Station (Tyrol) 39,42710 St. Pölten 32,303
The busiest stations in the other states
12 Salzburg Main Station (Salzburg) 25,65813 Graz Main Station (Styria) 25,57719 Klagenfurt Main Station (Carinthia) 14,73323 Feldkirch train station (Vorarlberg) 12,955 87 Neusiedl am See train station (Burgenland) 3,224

ÖBB customer satisfaction analysis(school grading system)
Overall grade 2.0 Passengers feel safe on the bus 1.4Passengers feel safe on the train 1.5Punctuality of the trains 1.5Personal advice when booking at the counter 1.6Regular announcements on the train 1.6Convenience, travel comfort on the bus 1.6Train station accessibility 1.7Cleanliness of trains 1.8Ticket machine available 1.9Total trip time, travel time 1.9Announcements at the train station for incidents 1.9Suitable connections to other trains 1.9Bus price-performance ratio 1.9 Information on cell phone, via app 2.0Cleanliness and state of train stations 2.0Meals and beverages provided on the train 2.0Telephone information 2.1Convenience, travel comfort on the train 2.1Announcements on the train if delayed 2.1Train station infrastructure, guidance system 2.2Train price-performance ratio 2.3Handling of claims and complaints 3.2Source: ÖBB customer satisfaction analysis 2016
NATIONAL 27

Vienna Main Station Total area of new bridge construction (m²) 30,000 Track (km) 100Switch points 300Covered island platforms (completely accessible) 5Platform edges 10Crossing points of TEN corridors 3TEN 17, TEN 22, TEN 23
Connections to rapid transit lines 8Subway lines 1Tram lines 3Bus lines 2
Rail Freight Center Vienna SouthArea (ha) 55Track length (km)* 27Switch points* 96Loading track group 1* refers to full expansion
INTERNATIONAL AXIS. From Vienna Main Station through the Semmering Base Tunnel and further south on the Koralm railway.
THE NEW SOUTHERN LINE
28 Facts & Figures

Gantry cranes 2Handling capacity full expansion (ITU per year)* 420,000* ITU – Intermodal Transport Unit
Semmering Base TunnelTunnel length (km) 27.3Maximum grade (per mil) 8.4Number of tunnel borings 14Possible top speed (km/h) 230Travel time saved (in minutes) 30Possible towing capacity for one engine (t) 1,600
Koralm railwayLength of Koralm railway (km) 130Length of Koralm tunnel (km) 33Number of tunnels (total length 47 km) 11Newly constructed and updated train stations 23Lines with limited service or under construction approx. 90 %Possible top speed (km/h) 250
New speed from 2026Line current travel time future travel time time savings
Vienna–Graz 2:35 1:50 0:45
Vienna–Klagenfurt 3:55 2:40 1:15
Graz–Klagenfurt 2:00* 0:45 1:15
* Bus connection
TRANSPORT AXIS 29
VIENNA MAIN STATION | 1,100 trains per day

2070 | 2001–200390 in fl eet
Personnel fi guresEmployees 40,265- of which general staff and workers 17,791- of which employees with a permanent position 22,474Apprentices*/** (= 4 % of ÖBB employees) 1,689Total 41,954- of which in Austria* 38,075- of which abroad 3,879Employee nationalities
(5,215 people without exceptional tariff) 61Number of job profi les at ÖBB 125 * of which 3 abroad ** A further 136 apprentices in the General Private Foundation for Professional
Training
ApprenticesTraining workshops 11Apprentice hostels 4Apprenticeships* 23* since 2017: 22 apprenticeships
EMPLOYEES. Ultimately, it is the dedication, know-how and experience of the employees that move a company like ÖBB.
MOVING FORCE
30 Facts & Figures

Apprentices (number)*
Offi ce administrator 52Finance & accounting assistant 4Forwarding agent & forwarding logistics 90Mobility service 78Railway operating technology 165Railway safety technology 160Railway vehicle engineering 0Railway vehicle maintenance technology 62Railway transport technology 96Railway electrical engineering 171Railway telecommunications technology 49Electrical engineering – installation & operating tech. 179Electrical engineering – electro- & building technology** 18Information & telecommunications technology 26Electronics – applied electronics 1Metals technology – mechanical engineering 269Mechatronics – automation technology 54Track construction technology 279Body construction technology/commercial vehicles 3Automotive engineering/commercial vehicles 1Automotive engineering & systems electronics 24Metal working 41Cleaning technology 2 * incl. foundation apprentices** no longer offered since 2017
EMPLOYEES 31

Employees by companyÖBB-Infrastruktur* 18,048Rail Cargo Group* 14,366ÖBB-Personenverkehr* 7,069Other companies 2,471* incl. apprentices
The 11 biggest professional groupsEngine driver 4,209Controller 3,391Shunting 2,691Dispatcher 2,502Rail vehicle technology craft 2,088Construction technology craft 2,054Train attendant for ticket inspection 1,208Scheduling and order processing 829Control and safety technology craft 829Electrical engineering craft 715Storage 715
32 Facts & Figures
2016 | 2002–2004100 in fl eet
EMPLOYEES 33
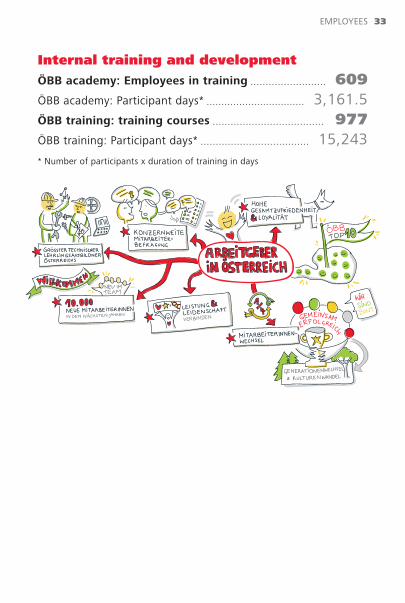
Internal training and developmentÖBB academy: Employees in training 609ÖBB academy: Participant days* 3,161.5 ÖBB training: training courses 977ÖBB training: Participant days* 15,243* Number of participants x duration of training in days

34 Facts & Figures
Rail Freight Center Vienna SouthMulti-function freight terminal at the junction between the Pot-tendorf line and the S1 expressway. P: 246 mil. euro, C: 2017
Vienna–Wiener Neustadt (Pottendorf line)Two-track expansion of the existing line to relieve the Southern line. P: 673 mil. euro, C: 2023
EbenfurthFaster to Vienna with the Ebenfurth loop. P: 182 mil. euro, C: 2025
MüllendorfDirect from Eisenstadt to Vienna in 45 minutes with the Müllendorf and Ebenfurth loop. P: 22 mil. euro, C: 2019
Semmering Base TunnelConstruction of a 27 km two tube tunnel, reducing travel time Vienna–Graz: 30 minutes P: 3,320 mil. euro, C: 2026
Bruck a. d. Mur–GrazOptimization of the infrastructure between Bruck a. d. Mur and Graz as part of the new Southern line. P: 205 mil. euro, C: 2023
Graz–WeitendorfNeeds-based expansion of the Koralm railway between Graz and Weitendorf. P: 363 mil. euro, C: 2023
Koralm railway Graz–KlagenfurtNew 130 km section as part of the new Southern line, time gained: 2 hours 11 minutes. P: 5,180 mil. euro, C: 2023
Karawanks TunnelUpdate of the Karawanks Tunnel including increase in tunnel safety. P: 73 mil. euro*, C: 2022* Share of Austria
20
22
21
23
24
25
26
19
18

35 Facts & Figures
Buchs(SG)
Lochau Hörbranz
Schönbichl
Section of lineNew or conversion
four-track (2 x two-track)
three-tracktwo-tracksingle-track
St. Anton a.Arlberg
Ehrwald-ZugspitzbahnFeldkirch
Ötztal
FrastanzRankweilKlaus in Vorarlberg
Tosters
Nenzing
Seefeld in T
InnsbruMesse-S
Innsbruck Westbf.
Innsbruck WIFI
Innsbruck HöttingAllerheiligen-
höfeKranebitten
VölsKematenin Tirol
Greater InnsbrConstruction of
ochau HörbranzLochau Hochau Hö
hSchönbichlh hlchl
St. Margrethen-Lauterach Expansion
184 mil. € | 2020
Feldkirch-national borderFL.A.CH. local transport expansion
159 mil. € | 2025
WolfurtTerminal
62 mil. € | 2018
€ 15
Bregenz
Innsbruck
Phase 1
St. Margrethen (SG)
approx. 30 €per year
Construction > 2,000 car parking spacesConstruction > 1,000 Bike & Ride parking spaces
mil.
approx. 1 €RPL 2017-2022Increase in safety
ETCS expansion
BFS continuation
Construction of train tracking
check points
Conversion of grade crossings
bn.
approx. 600€per year
in reinvestment
mil.
580approx. €per year
in maintenance
mil.
approx. 170€ mil.RPL 2017-2022
Terminals (Vienna South, Wels, Wolfurt, Linz)
approx. 70 € mil.RPL 2017-2022
Expansion of WLAN, mobile communications
Austria: Line & station projectInfrastructure projects ÖBB master plan (RPL) 2017–2022
3
1
2
4

Klagenfurt Hbf
Scharnitz
Neumarkt-Kallham
Wietersdorf
Lavanttal
Zell am See
Bischofshofen
Station/stop New/conversion (in planning)
Station/stop New/conversion (under construction)
Station/stop
TEN-T Core Network Corridors
Kufstein
Unzmarkt
Schwarzach-St. Veit
Grünaui. Almtal
Laakirchen
Aschacha. d. Donau
Aigen-Schlägl
Sarmingste
Irdning
Selzthal Eisenerz
Zeltweg
Trofa
St. Micha
Hieflau
Kastenreith
Gres
St. Valentin
St. Veita. d. Glan
Arnoldstein
Spittal-Millstättersee
Kötschach-MauthenWeitlanbrunn
Rosenbach
VillachKlagenfurt Hbf
Thörl-Maglern Bleiburg
LaunsdorfHochosterwitz
Brennero/Brenner
InnsbruckVolders-Baumkirchen
Jenbach
Wörgl-Kundl Wörgl Hbf
Neumarkt-
l
Lienz
LedenitzenHermagor Krumpendorf
Pörtschacha. Wörthersee
K
Steyrling
Schalchen-Mattighofen
Braunau a. Inn
SchärdingWernstein
Klaus
Kirchdorf a. d. Krems
Amste
Linz Hbf
Velden a. Wörthersee
Tirol
Völs
SchwazKirchbergin Tirol
Zell am SeeSchüttdorf
ck Saggen
Hall-Thaur
Volders-Baum-kirchen
Rum
Hall inTirol
ruckstops
Grünaui. Almtal
LaLaLaakakirchenL
hofen
Brenner Northern Approach€ 49 mil. | Planning
Linz-Wels4-track expansion
997 mil. | €2026 onwards
Wels-PassauModernization
205 mil. € | 2022
Linz-SumImproveme
76 mil.€
East Tyrol | Phase1 Expansion suitable for local transport
58 mil. € | 2020
Karawanks Tunnel73 mil. € | 2022
Koralm Railway5.180 mil. € | 20
Brenner Base Tunnel4.960 mil. € | 2026
mil. | 2020
Wels Freight Station Terminal
35 mil. € | 2019
Neumarkt-Köstendorf
Wels Hbf
Linz Kleinmünchen-Linz Main Station4-track expansion
444 mil. | €2026 onwards
Linz Freight StationStadthafenModernizationFreight tracks
44 mil. € | 2020
KremsdorfKremsdorf
TraunTraun
Summerau
Scheifling
ÖblarnGröbming
Pöls
Hbf
s
5
6
7
9
8
1011
12
13
25
26

Bruck a. d.Mur
Gmünd Sigmunds-herberg
Retz
Waldhausen
Hadersdorf a. Kamp
ein
Knoten Wien HBFWien Hbf
Götzendorfa. d. L.
Brucka. d. L.
NickelsdorfNeusiedl am See
Kittsee
Wolfsthal
Krems a. d. Donau
ErnstbrunnMistelbach
Zellerndorf
Laa a. d. Thaya
Bernhardsthal
Gänserndorf
Hohenau
ZistersdorfDrösing
Schwarzenau
a. Schneeberg
Payerbach-Reichenau
MürzzuschlagDeutschkreutz
Loipersbach - Schattendorf
Wulkaprodersdorf
Werndorf
Bad RadkersburgSpielfeld-Straß
Wettmannstätten
Fehring Mogersdorf
Gloggnitz
Friedberg
g
Leoben Hbfiach
ael
sten Scheibbs
MoosbierbaumHeiligeneich
St. Pölten Hbf
Graz Hbf
Peggau-DeutschfeistritzFrohnleitenMixnitz-Bärenschützklamm
Kapfenberg
St. Pölten Hbf
Moosbierbaum-Heiligeneich
Tulln
Wien Stadlau
Himberg
Eisenstadt
Ternitz
WienHütteldorf
Unter
ettenbbbss
Vienna-Bratislava
550 mil. € | 2023
Northern Line expansion592 mil. € | 2026
mmerauents | 2022
Vienna-Wiener NeustadtPottendorf line
673 mil. € | 2023
Ebenfurth Construction of loop
182 mil. € | 2025
MüllendorfConstruction of loop
22 mil. € | 2019
Graz-WeitendorfKoralm Railway integration
363 mil.€ | 2023
Bruck a. d. Mur-GrazStation conversions
205 mil. € | 2023
Semmering Base Tunnel3.320 mil. € | 2026
Closing the gapSt. Pölten-Loosdorf
731 mil. € | 2017
y Graz-Klagenfurt23
246 mil. € | 2017
Freight Center Vienna South
Vienna junction line272 mil. € | 2025
Wartbergim Mürztal
Gratwein-Gratkorn
Marchegg
Oberwart
Bad PirawarthGroß Schweinbarth
incl. Gänserndorf-Marchegg14
15
16
17
19
18
20
21
22
23
24
TEN-T core network in Austria
Scandinavia-Mediterranean Corridor with the Brenner Base Tunnel (TEN 1)Rhine-Danube Corridor with the Western line at its center (TEN 17)Orient/East-Mediterranean Corridor (TEN 22)Baltic-Adriatic Corridor with Semmering Base Tunnel and Koralm railway (TEN 23)

LINE & CONSTRUCTION PROJECTS 38
Wels–PassauExpansion of the approx. 80 km-long existing line including remodeling of train stations and ETCS. P: 205 mil. euro, C: 2022
Linz–WelsFour-track expansion of the Western line between Linz and Wels. P: 997 mil. euro, C: 2026 onwards
Linz Stadthafen shunting stationUpdate for freight traffi c through conversion/expansion of the tracks and electrifi cation. P: 44 mil. euro, C: 2020
Linz Kleinmünchen–Linz Main StationThrough-connection of the four-tracked Western line. P: 444 mil. euro, C: 2026 onwards
Linz–SummerauUpdate of the line and of 7 train stations. P: 76 mil. euro, C: 2022
Closing the gap: St. Pölten–Loosdorf Reduce traffi c for the city of St. Pölten with a freight train bypass and an increase in capacity. P: 731 mil. euro, C: 2017
Vienna junction lineIncrease appeal of the rapid transit train with 15 minute intervals; new stops. P: 272 mil. euro, C: 2025
Northern line expansionExpansion of the line to the Czech border.P: 592 mil. euro, C: 2026
Vienna–BratislavaThe existing line from Vienna to Bratislava will be selectively ex-panded to two tracks and electrifi ed. P: 550 mil. euro, C: 2023
10
11
12
13
14
15
16
17
9
LINE & CONSTRUCTION PROJECTS 39
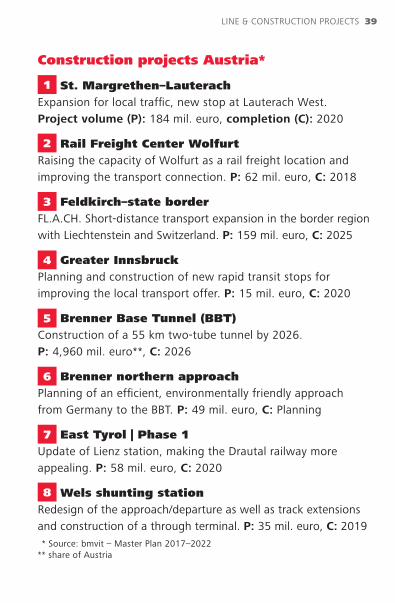
Construction projects Austria*
St. Margrethen–LauterachExpansion for local traffi c, new stop at Lauterach West.Project volume (P): 184 mil. euro, completion (C): 2020
Rail Freight Center WolfurtRaising the capacity of Wolfurt as a rail freight location and improving the transport connection. P: 62 mil. euro, C: 2018
Feldkirch–state borderFL.A.CH. Short-distance transport expansion in the border region with Liechtenstein and Switzerland. P: 159 mil. euro, C: 2025
Greater InnsbruckPlanning and construction of new rapid transit stops for improving the local transport offer. P: 15 mil. euro, C: 2020
Brenner Base Tunnel (BBT)Construction of a 55 km two-tube tunnel by 2026. P: 4,960 mil. euro**, C: 2026
Brenner northern approachPlanning of an effi cient, environmentally friendly approach from Germany to the BBT. P: 49 mil. euro, C: Planning
East Tyrol | Phase 1Update of Lienz station, making the Drautal railway more appealing. P: 58 mil. euro, C: 2020
Wels shunting stationRedesign of the approach/departure as well as track extensions and construction of a through terminal. P: 35 mil. euro, C: 2019 * Source: bmvit – Master Plan 2017–2022** share of Austria
1
2
3
4
5
6
7
8

Energy management & climate protectionElectricity provided (GWh per year) 2,252Traction current provided (GWh per year) 1,835
ElectricityGeneration of traction current
from hydropower 90 %from other renewable energy sources 2 %from natural gas 8 %
Energy & emissions savedEnergy saved vs. 2011 (GWh) 185 ÖBB climate balance – total greenhouse gas emissions
of ÖBB: CO2 equivalent (t per year) 387,382Greenhouse gas emissions saved through
ÖBB rail transport (t CO2 per year) 3 mil.CO2 emissions of ÖBB passenger transport (g/pkm*) 14.2CO2 emissions of ÖBB freight transport (g/tkm*) 5.7* pkm = passenger kilometers / tkm = ton kilometers
POWER & ENVIRONMENTAL PROTECTION. Electricity is the key power source for rail operations. 90 percent of the electricity used by ÖBB is renewable energy.
SUSTAINABLE TRANSPORT
40 Facts & Figures

ENERGY & THE ENVIRONMENT 41
CO2 emissions Postbus (g/pkm*) 76CO2 emissions for ÖBB passenger services
vs. car/airplane 1 : 13/1 : 28 * pkm = passenger kilometers

1216 | 2006–200850 in fl eet
The European rail transport market Countries 24Track kilometers 24 countries 205,538 km- of which electrifi ed 22 countries 112,223 kmTrain kilometers 22 countries 4.15 bn.- of which passenger transport 81.6 %- of which freight traffi c 18.4 %Passenger kilometers 21 countries 432 bn.Ton kilometers 24 countries 392 bn.
Comparison of European rail useAnnual distance traveled by train per capita in kilometers
Switzerland 2,449Austria 1,427France 1,387Sweden 1,293Denmark 1,203Germany 1,121 United Kingdom 1,020
VIEW OVER THE BORDER. Austria also comes out on top compared with the rest of Europe. We are the hardest work-ing train drivers in the EU and in second place in Europe.
EUROPE’S RAILROADS
42 Facts & Figures
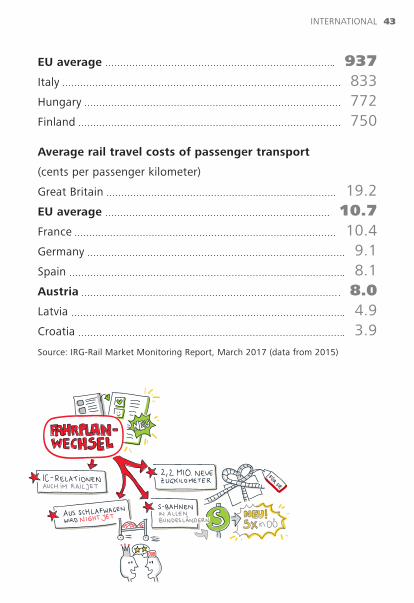
EU average 937Italy 833Hungary 772Finland 750
Average rail travel costs of passenger transport
(cents per passenger kilometer)
Great Britain 19.2EU average 10.7France 10.4Germany 9.1Spain 8.1Austria 8.0Latvia 4.9Croatia 3.9Source: IRG-Rail Market Monitoring Report, March 2017 (data from 2015)
INTERNATIONAL 43

Railjet | 2007–201660 units in operation
The entire rail system (ÖBB, private railroads, railroad industry)
Employees 54,000Revenue (euro) 8.4 bn.
Railroad investments create added valueTotal added value effects of the master plan (billion)
Total gross added value 2014–2019 11,350direct added value 5,223indirect added value 5,241
Railroad investments create jobsAnnual jobs in Austria
2014–2019 during construction 168,310direct employment 93,658indirect employment 64,616Full-time employment per year
during construction 24,000Source: Economica Institute studies, 2013 / 2014
ECONOMIC FACTOR RAIL. The rail sector is a driving force in Austria’s economy – as a principal, as an engine of innovation, as an employer …
ECONOMIC DRIVER
44 Facts & Figures

FIGURES 45
Moving Austria. ÖBB is the key mobility provider for local and regional transport. We take a look at the key figures for the individual states and compare them with nationwide figures.
ÖBB IN THE STATES. FACTS & FIGURES

Traveling by train Local transport passengers 3.168 mil.Local transport trains per day 257Rapid transit lines* 1Rapid transit trains per day 48Local transport train kilometers (in km) 2.186 mil.Local transport passenger kilometers 134.9 mil.Freight transported (tons per year) 0.954 mil. * Total number of rapid transit lines in the eastern region
(Vienna, LA, Burgenland): 10 (some cross over national borders)** As at: 5 April 2017
The Postbus is runningPassengers 9.0 mil.Lines 45Buses 148
SMALL BUT NICE. About 292,000 people live in Burgen-land on an area of 3,965 km2 – over seven percent of which is bodies of water.
BURGENLAND
46 Facts & Figures
NEUSIEDL/SEE TRAIN STATION | 3,224 passengersNo. 1 in Burgenland, no. 87 nationwide (see page 26)
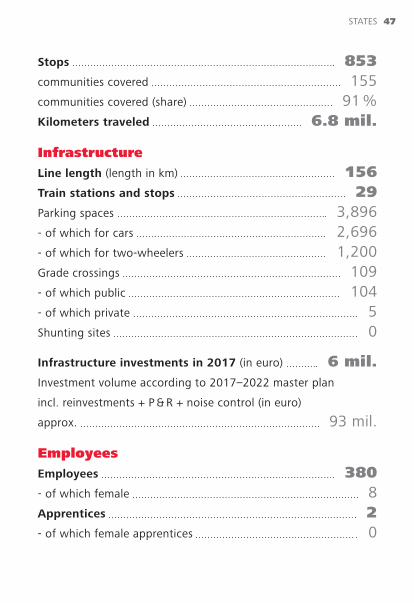
Stops 853communities covered 155communities covered (share) 91 % Kilometers traveled 6.8 mil.
InfrastructureLine length (length in km) 156Train stations and stops 29Parking spaces 3,896- of which for cars 2,696- of which for two-wheelers 1,200Grade crossings 109- of which public 104- of which private 5Shunting sites 0
Infrastructure investments in 2017 (in euro) 6 mil.Investment volume according to 2017–2022 master plan
incl. reinvestments + P & R + noise control (in euro)
approx. 93 mil.
EmployeesEmployees 380- of which female 8Apprentices 2- of which female apprentices 0
STATES 47

Traveling by train Local transport passengers 7.725 mil.Local transport trains per day 267Rapid transit lines 4Rapid transit trains per day 190Local transport train kilometers (in km) 4.735 mil.Local transport passenger kilometers 252.1 mil.Freight transported (tons per year) 6.118 mil.* As at: 5 April 2017
The Postbus is runningPassengers 17.0 mil.Lines 75Buses 176Stops 2,484communities covered 131communities covered (share) 99 % Kilometers traveled 10.6 mil.
AUSTRIA’S SOUTH. Our southernmost state has a population of about 561,000 on an area of 9,535 km2 - incl. the Grossglockner, Austria’s highest peak.
CARINTHIA
48 Facts & Figures
KLAGENFURT TRAIN STATION | 14,733 passengersNo. 1 in Carinthia, no. 19 nationwide (see page 26)

InfrastructureLine length (length in km) 510Train stations and stops 109Parking spaces 6,149- of which for cars 3,646- of which two-wheelers 2,503Grade crossings 342- of which public 270- of which private 72Shunting sites 11
Infrastructure investments in 2017 (in euro) 280 mil.Investment volume according to 2017–2022 master plan
incl. reinvestments + P & R + noise control (in euro)
approx. 1.9 bn.
EmployeesEmployees 2,894- of which female 205Apprentices 13- of which female 5
STATES 49

Traveling by train Local transport passengers 48.588 mil.Local transport trains per day 1,788Rapid transit lines* 9Rapid transit trains per day** 620Local transport train kilometers (in km) 24.533 mil.Local transport passenger kilometers 2,227.3 mil.Freight transported (tons per year) 17.526 mil. * Total number of rapid transit lines in the eastern region
(Vienna, LA, Burgenland): 10 (some cross over national borders) ** As at: 5 April 2017
The Postbus is runningPassengers 44.2 mil.Lines 203Buses 485Stops 5,897communities covered 563communities covered (share) 98 % Kilometers traveled 31.9 mil.
DIVERSE. With an area of a little over 19,000 km2, Lower Austria is the largest state by area. About 1.66 million people live here.
LOWER AUSTRIA
50 Facts & Figures
WIENER NEUSTADT MAIN STATION 39,563 passengers, no. 1 in Lower Austria, no. 8 nationwide (see page 26)

InfrastructureLine length (length in km) 1,455Train stations and stops 346Parking spaces 51,814- of which for cars 33,024- of which for two-wheelers 18,790Grade crossings 1,339- of which public 1,140- of which private 199Shunting sites 23
Infrastructure investments in 2017 (in euro) 464 mil.Investment volume according to 2017–2022 master plan
incl. reinvestments + P & R + noise control (in euro)
approx. 3.3 bn.
EmployeesEmployees 5,611- of which female 267Apprentices 140- of which female 8
STATES 51

Traveling by train Local transport passengers 16.2 mil.Local transport trains per day 609Rapid transit lines 4Rapid transit trains per day* 198Local transport train kilometers (in km) 10.540 mil.Local transport passenger kilometers 543.6 mil.Freight transported (tons per year) 25.175 mil.* As at: 5 April 2017
The Postbus is runningPassengers 30.3 mil.Lines 195Buses 406Stops 3,798communities covered 425communities covered (share) 96 % Kilometers traveled 28.0 mil.
THE CENTER OF INDUSTRY. About 1.47 million people live in Upper Austria on an area of about 12,000 km2, and about half of them live in the Linz metropolitan area.
UPPER AUSTRIA
52 Facts & Figures
LINZ MAIN STATION | 41,951 passengersNo. 1 in Upper Austria, no. 6 nationwide (see page 26)

InfrastructureLine length (length in km) 862Train stations and stops 223Parking spaces 15,858- of which for cars 8,270- of which for two-wheelers 7,588Grade crossings 776- of which public 539- of which private 237Shunting sites 20
Infrastructure investments in 2017 (in euro) 180 mil.Investment volume according to 2017–2022 master plan
incl. reinvestments + P & R + noise control (in euro)
approx. 1.7 bn.
EmployeesEmployees 5,398- of which female 395Apprentices 283- of which female 22
STATES 53
Wappen von SalzburgDavid Liuzzo 2006
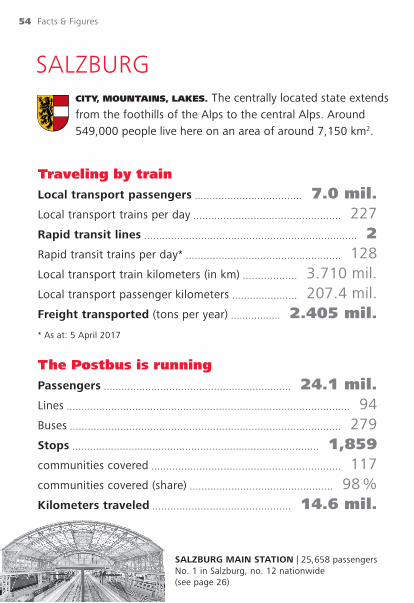
Traveling by train Local transport passengers 7.0 mil.Local transport trains per day 227Rapid transit lines 2Rapid transit trains per day* 128Local transport train kilometers (in km) 3.710 mil.Local transport passenger kilometers 207.4 mil.Freight transported (tons per year) 2.405 mil.* As at: 5 April 2017
The Postbus is runningPassengers 24.1 mil.Lines 94Buses 279Stops 1,859communities covered 117communities covered (share) 98 % Kilometers traveled 14.6 mil.
CITY, MOUNTAINS, LAKES. The centrally located state extends from the foothills of the Alps to the central Alps. Around 549,000 people live here on an area of around 7,150 km2.
SALZBURG
54 Facts & Figures
SALZBURG MAIN STATION | 25,658 passengersNo. 1 in Salzburg, no. 12 nationwide (see page 26)
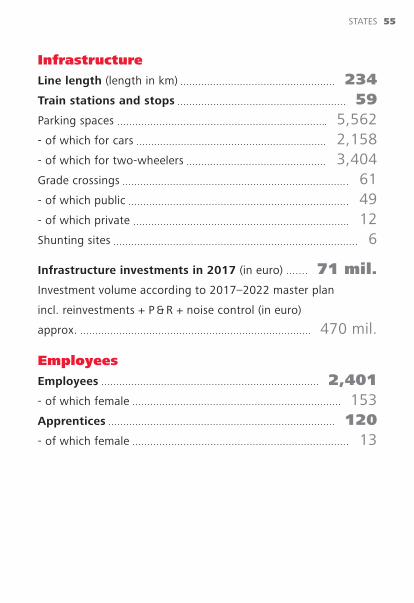
InfrastructureLine length (length in km) 234Train stations and stops 59Parking spaces 5,562- of which for cars 2,158- of which for two-wheelers 3,404Grade crossings 61- of which public 49- of which private 12Shunting sites 6
Infrastructure investments in 2017 (in euro) 71 mil.Investment volume according to 2017–2022 master plan
incl. reinvestments + P & R + noise control (in euro)
approx. 470 mil.
EmployeesEmployees 2,401- of which female 153Apprentices 120- of which female 13
STATES 55

Traveling by train Local transport passengers 10.8 mil.Local transport trains per day 387Rapid transit lines 6Rapid transit trains per day* 273Local transport train kilometers (in km) 7.266 mil.Local transport passenger kilometers 328.1 mil.Freight transported (tons per year) 17.882 mil.* As at: 5 April 2017
The Postbus is runningPassengers 29.8 mil.Lines 126Buses 242Stops 3,461communities covered 256communities covered (share) 89 %Kilometers traveled 17.4 mil.
THE GREEN ONE. At about 16,400 km2, Styria is Austria’s second largest state, and its population of 1.24 million puts it in fourth place.
STYRIA
56 Facts & Figures
GRAZ MAIN STATION | 25,577 passengersNo. 1 in Styria, no. 13 nationwide (see page 26)
communities covered (share)
Kilometers traveled
Wappen der SteiermarkDavid Liuzzo 2006

InfrastructureLine length (length in km) 749Train stations and stops 124Parking spaces 11,900- of which for cars 6,796- of which for two-wheelers 5,104Grade crossings 442- of which public 386- of which private 56Shunting sites 20
Infrastructure investments in 2017 (in euro) 348 mil.Investment volume according to 2017–2022 master plan
incl. reinvestments + P & R + noise control (in euro)
approx. 2.8 bn.
EmployeesEmployees 4,232- of which female 246Apprentices 303- of which female 45
STATES 57

Traveling by train Local transport passengers 14.3 mil.Local transport trains per day 349Rapid transit lines 6Rapid transit trains per day* 243Local transport train kilometers (in km) 6.917 mil.Local transport passenger kilometers 576.0 mil.Freight transported (tons per year) 16.572 mil.* As at: 5 April 2017
The Postbus is runningPassengers 23.6 mil.Lines 87Buses 328Stops 2,020communities covered 267communities covered (share) 96 % Kilometers traveled 20.3 mil.
AMIDST THE ALPS. Tyrol has the longest external border of 719 km. The area within the border is 12,640 km2 and home to 746,000 people.
TYROL
58 Facts & Figures
INNSBRUCK MAIN STATION 39,427 passengers, no. 1 in Tyrol, no. 9 nationwide (see page 26)

InfrastructureLine length (length in km) 420Train stations and stops 95Parking spaces 7,372- of which for cars 3,842- of which for two-wheelers 3,530Grade crossings 128- of which public 124- of which private 4Shunting sites 7
Infrastructure investments in 2017 (in euro) 247 mil.Investment volume according to 2017–2022 master plan
incl. reinvestments + P & R + noise control (in euro)
approx. 3.0 bn.
EmployeesEmployees 3,168- of which female 145Apprentices 146- of which female 17
STATES 59

Traveling by train Local transport passengers 12.2 mil.Local transport trains per day 193Rapid transit lines 2Rapid transit trains per day* 136Local transport train kilometers (in km) 2.838 mil.Local transport passenger kilometers 292.4 mil.Freight transported (tons per year) 3.522 mil.* As at: 5 April 2017
The Postbus is runningPassengers 23.0 mil.Lines 31Buses 144Stops 1,122communities covered 87communities covered (share) 91 % Kilometers traveled 9.7 mil.
AUSTRIA’S WEST. About 389,000 people live between Arlberg and Lake Constance on an area of about 2,600 km2.
VORARLBERG
60 Facts & Figures
communities covered (share)
Kilometers traveled
FELDKIRCH TRAIN STATION | 12,955 passengersNo. 1 in Vorarlberg, no. 23 nationwide (see page 26)

InfrastructureLine length (length in km) 111Train stations and stops 31Parking spaces 3,082- of which for cars 888- of which for two-wheelers 2,194Grade crossings (incl. Liechtenstein) 30- of which public 27- of which private 3Shunting sites 3
Infrastructure investments in 2017 (in euro) 80 mil.Investment volume according to 2017–2022 master plan
incl. reinvestments + P & R + noise control (in euro)
approx. 356 mil.
EmployeesEmployees 1,158- of which female 124Apprentices 90- of which female 12
STATES 61

THE NATION’S CAPITAL. A city and state in one, it has the biggest population on the smallest area – 1.87 million people on around 415 km2.
VIENNA
62 Facts & Figures
Traveling by train Local transport passengers 89.003 mil.Local transport trains per day 1,410Rapid transit lines* 10Rapid transit trains per day** 890Local transport train kilometers (in km) 7.380 mil.Local transport passenger kilometers 762.6 mil.Freight transported (tons per year) 7.139 mil. * Total number of rapid transit lines in the eastern region
(Vienna, LA, Burgenland): 10 (some cross over national borders) ** As at: 5 April 2017
The Postbus is runningPassengers 10.2 mil.Lines 15Buses 92Stops 430communities covered 1communities covered (share) 100 % Kilometers traveled 5.8 mil.

VIENNA MAIN STATION | 120,000 passengersNo. 1 in Vienna and nationwide (see page 26)
InfrastructureLine length (length in km) 186Train stations and stops 51Parking spaces 2,469- of which for cars 1,131- of which for two-wheelers 1,338Grade crossings 51- of which public 47- of which private 4Shunting sites 10
Infrastructure investments in 2017 (in euro) 108 mil.Investment volume according to 2017–2022 master plan
incl. reinvestments + P & R + noise control (in euro)
approx. 659 mil.
EmployeesEmployees 11,147- of which female 1,977Apprentices 589- of which female 122
STATES 63

ÖBB TRAIN UNITS
Nightjet (3–11 coaches)
Length incl. traction unit in m 99–310Seats* 156–588
Railjet (seven unit) Length incl. traction unit in m 206Seats 408
Talent 4023 (three unit) Talent 4024/4124 (four unit)
Length in m 52/67Seats 151/199
Desiro 5022 Length in m 42Seats 117
LO
CA
L A
ND
RE
GIO
NA
L T
RA
FF
ICL
ON
G-D
IST
AN
CE
64 Facts & Figures
* Standard, couchette and sleeping car places

PASSENGER TRANSPORT. The key ÖBB train units for long-distance traffi c as well as for local and regional traffi c at a glance.
Weight incl. traction unit in t 233–680Top speed in km/h* 200
Number of standard (52), couchette (74) and sleeping cars (52)* 178
Weight incl. traction unit in t 446Top speed in km/h 230
Number 60
Weight in t 95/115/117Top speed in km/h 140
Power in kW 1,440/1,520Number 187
Weight in t 71Top speed in km/h 120
Power in kW 2 x 315Number 60
TRAIN UNITS 65
* with car transporter units 160 * plus 36 car transporter units

Double-stack push-pull car DOSTO
Length (per car) in m 27Seats in control car 86Seats in intermediate car 114
4020 – Vienna rapid transit system (three unit)
Length in m 69Seats 184
Cityjet – Desiro ML (since Dec. 2015) Length in m 75Seats 244 (rapid transit system)/ 259 (regional train)
CityShuttle push-pull train CRD Length (per car) in m 26Seats in control car 44Seats in intermediate car 80
LOCAL & REGIONAL TRAFFIC. Train units for commuter services on lines throughout Austria.
LO
CA
L A
ND
RE
GIO
NA
L T
RA
FF
IC66 Facts & Figures
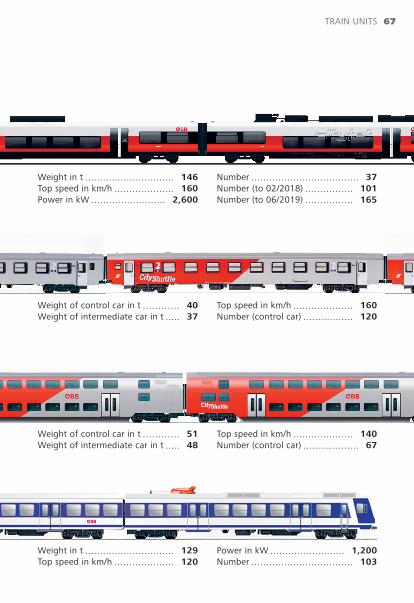
Weight of control car in t 51Weight of intermediate car in t 48
Top speed in km/h 140Number (control car) 67
Weight in t 129Top speed in km/h 120
Power in kW 1,200Number 103
Weight in t 146 Top speed in km/h 160Power in kW 2,600
Number 37Number (to 02/2018) 101Number (to 06/2019) 165
Weight of control car in t 40 Weight of intermediate car in t 37
Top speed in km/h 160Number (control car) 120
TRAIN UNITS 67
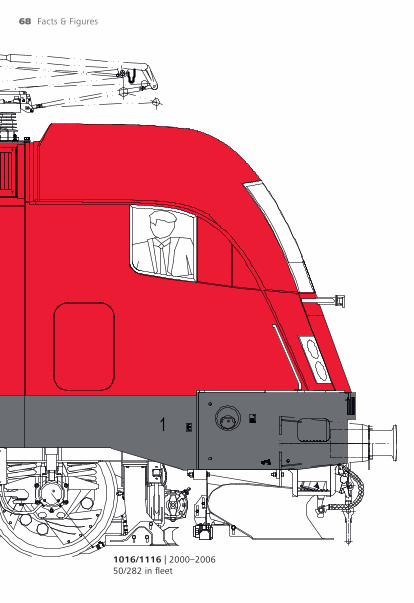
1016/1116 | 2000–200650/282 in fl eet
68 Facts & Figures

Traction unit series 2067 (drawing see page 4)Number 27 in fl eet, 111 builtManufacturer Simmering-Graz-Pauker (SGP)Year of manufacture 1959–1977Wheel arrangement C dhTank capacity in l 1,600Drive power in kW 442Top speed in km/h 65Total weight in t 49Length over buffers in m 10.5 Series 1042.0 (1042.5)Number 0 in fl eet, 257 builtManufacturer SGPYear of manufacture 1963–1965 (1969–1977)Wheel arrangement B0’B0‘Drive power in kW 3,560 (4,000)Top speed in km/h 130 (150)Total weight in t 84Length over buffers in m 16.2 Series 2043 (p. 6)Number 10 in fl eet, 77 builtManufacturer Jenbacher WerkeYear of manufacture 1964–1977Tank capacity in l 1,700Drive power in kW 1,104Top speed in km/h 110Total weight in t 70Length over buffers in m 01-04: 14.8; 05-ff: 15.8 Series 2143 (p. 8)Number 13 in fl eet, 77 builtManufacturer SGP Year of manufacture 1965–1977Wheel arrangement B’B‘ Tank capacity in l 2,045Drive power in kW 1,115Top speed in km/h 110Total weight in t 65
Length over buffers in m 15.8
Series 1142 (p. 10)Number Conversion from 1042.5 66 in fl eet, 177 builtManufacturer SGP, Conversion: ÖBB-TSYear of manufacture 1969–1977Wheel arrangement B0’B0‘Drive power in kW 4,000Top speed in km/h 150Total weight in t 83Length over buffers in m 16.2 Series 1044/1144 (p. 12)Number 209 in fl eet, 217 builtMFG SGP, Conversion: ÖBB-TSYear of manufacture 1978–1995Wheel arrangement B0’B0‘Drive power in kW 5,280Top speed in km/h 160Total weight in t 84Length over buffers in m 16.1 Series 1063 (p. 14)Number 48 in fl eet, 50 builtMFG BBC, ELIN, SGP, SiemensYear of manufacture 1983–1991Wheel arrangement B0’B0‘Drive power in kW 1,520Top speed in km/h 100Total weight in t 82Length over buffers in m 15.6 Series 1064 (p. 16)Number 10 suspendedMFG BBC, ELIN, SGP, SiemensYear of manufacture 1984–1990Wheel arrangement C0’C0‘Drive power in kW 1,560Top speed in km/h 100Total weight in t 112Length over buffers in m 18.5
ÖBB ENGINES*
ENGINE INDEX 69

Series 2068 (p. 22)Number 58 in fl eet, 60 builtManufacturer Jenbacher WerkeYear of manufacture 1989–1994Wheel arrangement B’B‘ dhTank capacity in l 1,500Drive power in kW 820Top speed in km/h 100Total weight in t 72Length over buffers in m 13.8 Series 1822Number 0 in fl eet, 5 builtMFG SGP, BBC, SiemensYear of manufacture 1991Wheel arrangement B0’B0‘Drive power in kW 4,400Top speed in km/h 140Total weight in t 83Length over buffers in m 19.3 Series 1014Number 0 in fl eet, 18 builtMFG BBC, ELIN, SGP, Siemens Year of manufacture 1993–1994Wheel arrangement B0’B0‘Drive power in kW 3,000Top speed in km/h 160Total weight in t 74Length over buffers in m 17.5 Series 1163 (p. 26)Number 20 in fl eetMFG BBC, ELIN, SGP, SiemensYear of manufacture 1994–1995Wheel arrangement B0’B0‘Drive power in kW 1,560Top speed in km/h 100Total weight in t 80.5Length over buffers in m 16.4 Series 1016 Taurus (p. 68)Number 50 in fl eetManufacturer Siemens AustriaYear of manufacture 2000–2001Wheel arrangement B0’B0‘Drive power in kW 6,400
Top speed in km/h 230Total weight in t 86Length over buffers in m 19.3 Series 1116 Taurus (p. 68)Number 282 in fl eetManufacturer Siemens AustriaYear of manufacture 2000–2006Drive power in kW 6,400Top speed in km/h 230Total weight in t 86Length over buffers in m 19.3 Series 2070 Hector (p. 30)Number 90 in fl eetManufacturer VosslohYear of manufacture 2001–2003Wheel arrangement B’B‘ Tank capacity in l 3,000Drive power in kW 745Top speed in km/h 100Total weight in t 72Length over buffers in m 14.1 Series 2016 Herkules (p. 32)Number 100 in fl eetManufacturer Siemens AustriaYear of manufacture 2002–2004Wheel arrangement B0’B0‘ Tank capacity in l 2,800Drive power in kW 2,000Top speed in km/h 140Total weight in t 80Length over buffers in m 19.3 Series 1216 Taurus (p. 42)Number 50 in fl eetManufacturer Siemens AustriaYear of manufacture 2006–2008Wheel arrangement B0’B0‘ deDrive power in kW 6,000Top speed in km/h 230Total weight in t 87Length over buffers in m 19.6
* In order of year of manufacture
70 Facts & Figures

About this report
Media Owner & PublisherÖBB-Holding AGCorporate Communication Mag. Sven PusswaldAm Hauptbahnhof 2, 1100 Vienna
Project managementDieter Marek Design & realizationMatthias Flödl & Sebastian Treytl
EditorialMatthias Flödl, communicators and press spokespeople of ÖBB
IllustrationsManuel Böhm, Michael Ambrosch/ÖBB-Werbung, Graphic recording: VerVieVas/Sophie Wilhelm Translation & ProofreadingInterlingua Language Services-ILS
ProductionÖBB-Werbung GmbHProduction no. 111017-1557
Print & ProductionDruckerei Paul Gerin
5th Issue /1st Edition© 2017, ÖBB-Holding AG
All information from 2016 (unless otherwise specifi ed), typographical and printing errors reserved.
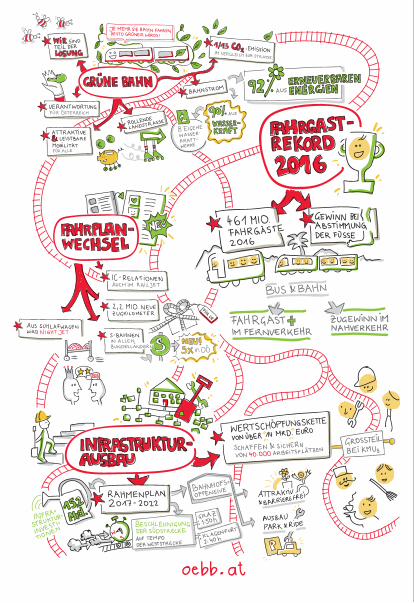
ONE YEAR, ONE PICTURE. We captured our activities in 2016 in a graphic recording. The result is a kind of mind map of our last year as well as a glimpse of the future – all in one illustration. You can fi nd the whole picture on the back of the ÖBB fi nancial report for 2016. You can also see excerpts of it on the back of this booklet and on several pages inside it.