bb education on tour | cloud services | glenn philpott, director, education services apac
TRANSCRIPT
Journey to the Cloud, Supporting
Institutional Growth
Glenn PhilpottDirector, Cloud Services APAC
2014Huge year for the Cloud
2014 HUGE YEAR for the Cloud
3
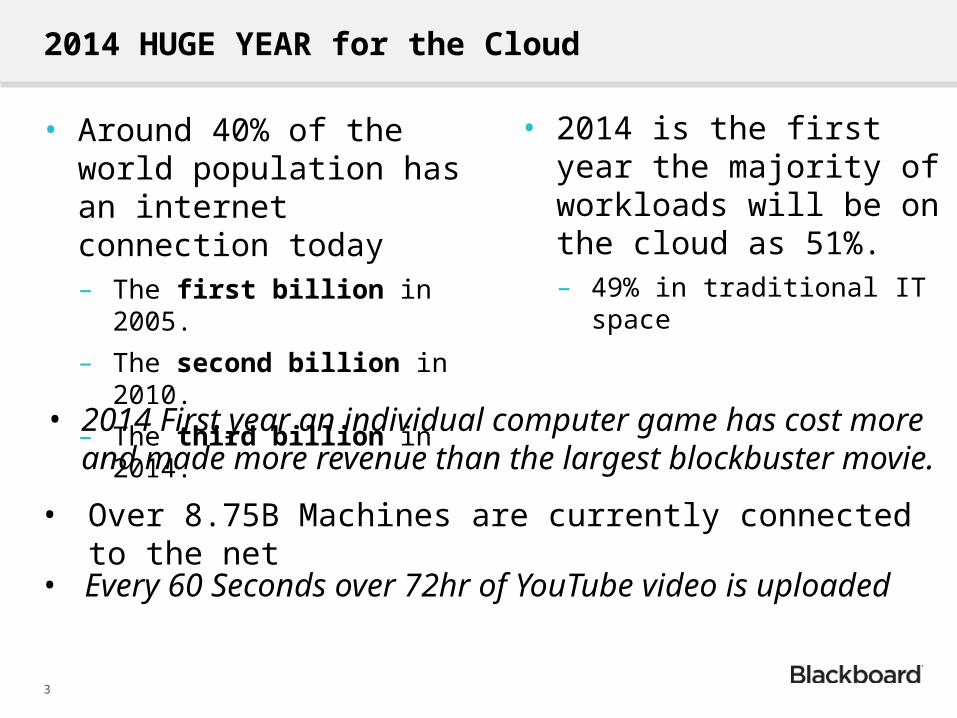
• Around 40% of the world population has an internet connection today – The first billion in 2005.
– The second billion in 2010.
– The third billion in 2014.
• 2014 is the first year the majority of workloads will be on the cloud as 51%.– 49% in traditional IT space
• Over 8.75B Machines are currently connected to the net
• Every 60 Seconds over 72hr of YouTube video is uploaded
• 2014 First year an individual computer game has cost more and made more revenue than the largest blockbuster movie.
2014 Statistics
4
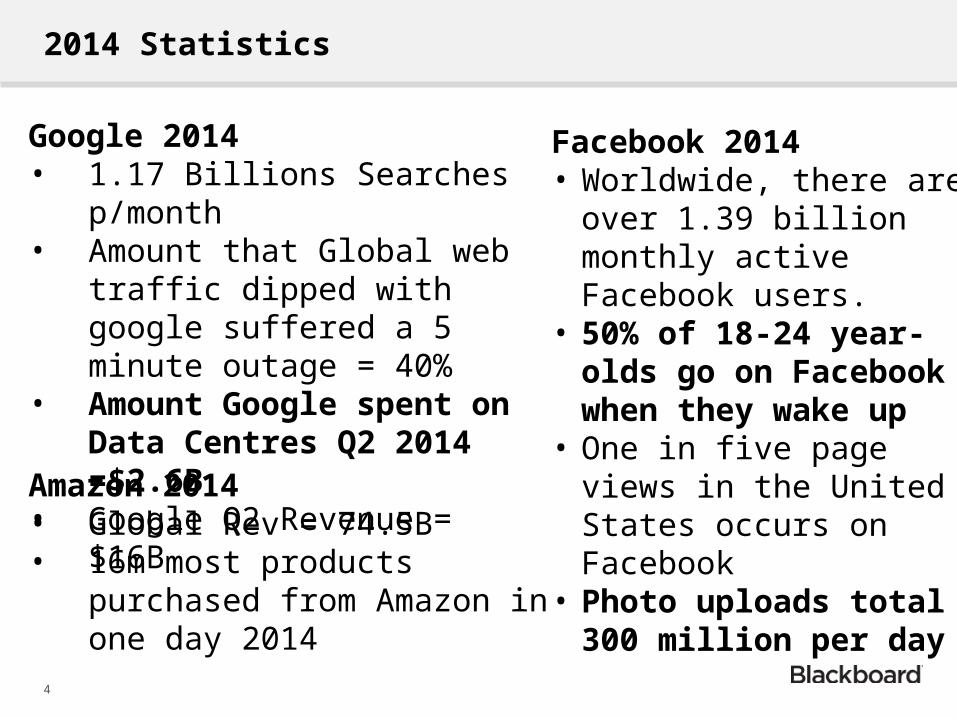
Google 2014• 1.17 Billions Searches p/month• Amount that Global web traffic
dipped with google suffered a 5 minute outage = 40%
• Amount Google spent on Data Centres Q2 2014 =$2.6B
• Google Q2 Revenue = $16B
Facebook 2014• Worldwide, there are over
1.39 billion monthly active Facebook users.
• 50% of 18-24 year-olds go on Facebook when they wake up
• One in five page views in the United States occurs on Facebook
• Photo uploads total 300 million per day
Amazon 2014• Global Rev = 74.5B• 16m most products purchased
from Amazon in one day 2014
2015Where to from here?
2015 Forecasts
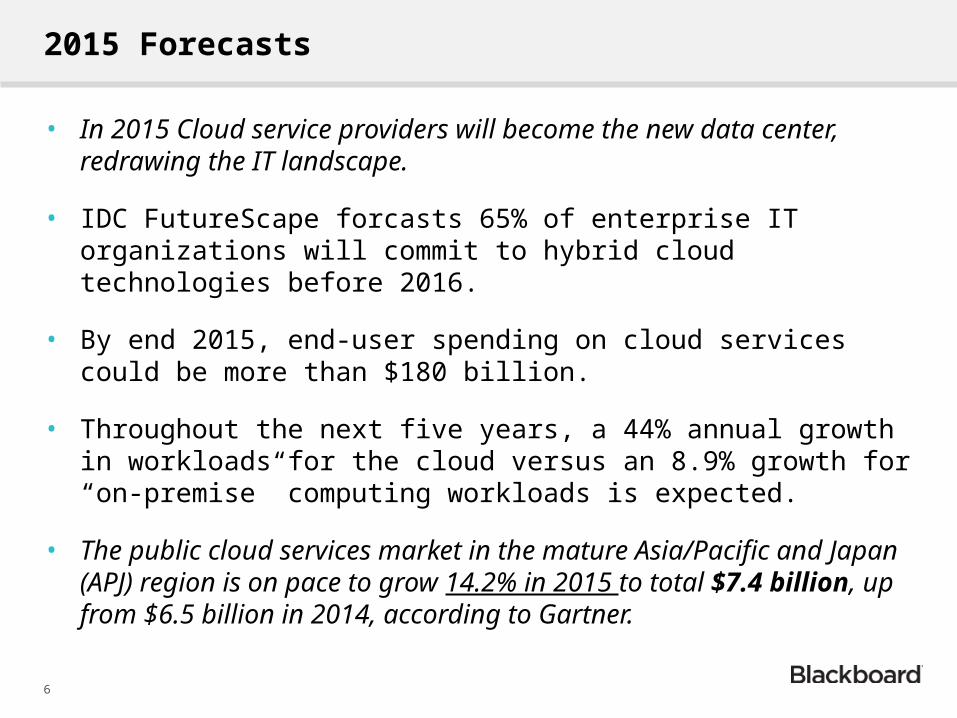
• In 2015 Cloud service providers will become the new data center, redrawing the IT landscape.
• IDC FutureScape forcasts 65% of enterprise IT organizations will commit to hybrid cloud technologies before 2016.
• By end 2015, end-user spending on cloud services could be more than $180 billion.
• Throughout the next five years, a 44% annual growth in workloads for the cloud versus an 8.9% growth for “on-premise” computing workloads is expected.
• The public cloud services market in the mature Asia/Pacific and Japan (APJ) region is on pace to grow 14.2% in 2015 to total $7.4 billion, up from $6.5 billion in 2014, according to Gartner.
6
2015 Cloud Prediction
DOUG CLARK IBM UK Cloud Leader
• Alignment / Convergence– 2015 will see a frenzy of activity aimed to assist interoperability and
integration
• Enterprise Cloud Race will begin– late 2014 announcements by WPP, Reuters, Lufthansa and ABN
AMRO, in 2015 we’ll continue to see BIG names go “all-in” on cloud
7
2015 Cloud Prediction
MAC DEVINE, VP SDN Cloud Services, CTO IM Cloud Div.
• Internet of things:– 2015 will see a frenzy of activity aimed to assist interoperability and
integration
• Real-time Data And Analytics.
• Collaborative and Secure Commerce will become commonplace.
8

2015Australia ?
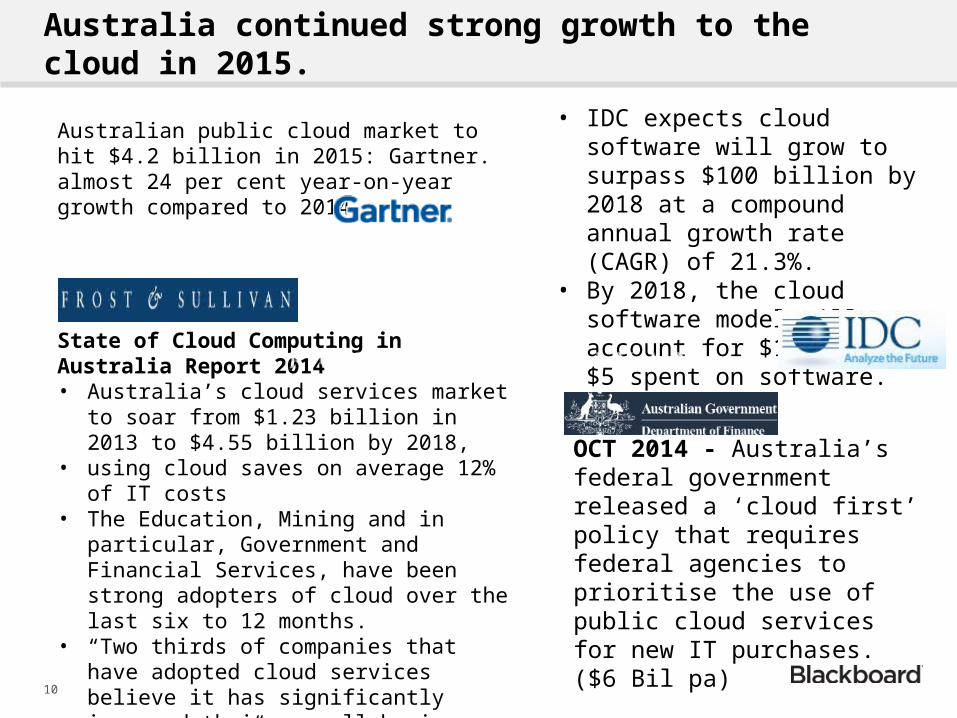
Australia continued strong growth to the cloud in 2015.
10
• IDC expects cloud software will grow to surpass $100 billion by 2018 at a compound annual growth rate (CAGR) of 21.3%.
• By 2018, the cloud software model will account for $1 of every $5 spent on software.
Australian public cloud market to hit $4.2 billion in 2015: Gartner.almost 24 per cent year-on-year growth compared to 2014
OCT 2014 - Australia’s federal government released a ‘cloud first’ policy that requires federal agencies to prioritise the use of public cloud services for new IT purchases.($6 Bil pa)
State of Cloud Computing in Australia Report 2014 • Australia’s cloud services market to soar from
$1.23 billion in 2013 to $4.55 billion by 2018,• using cloud saves on average 12% of IT
costs• The Education, Mining and in particular,
Government and Financial Services, have been strong adopters of cloud over the last six to 12 months.
• “Two thirds of companies that have adopted cloud services believe it has significantly improved their overall business performance.”
Blackboard Cloud Solutions
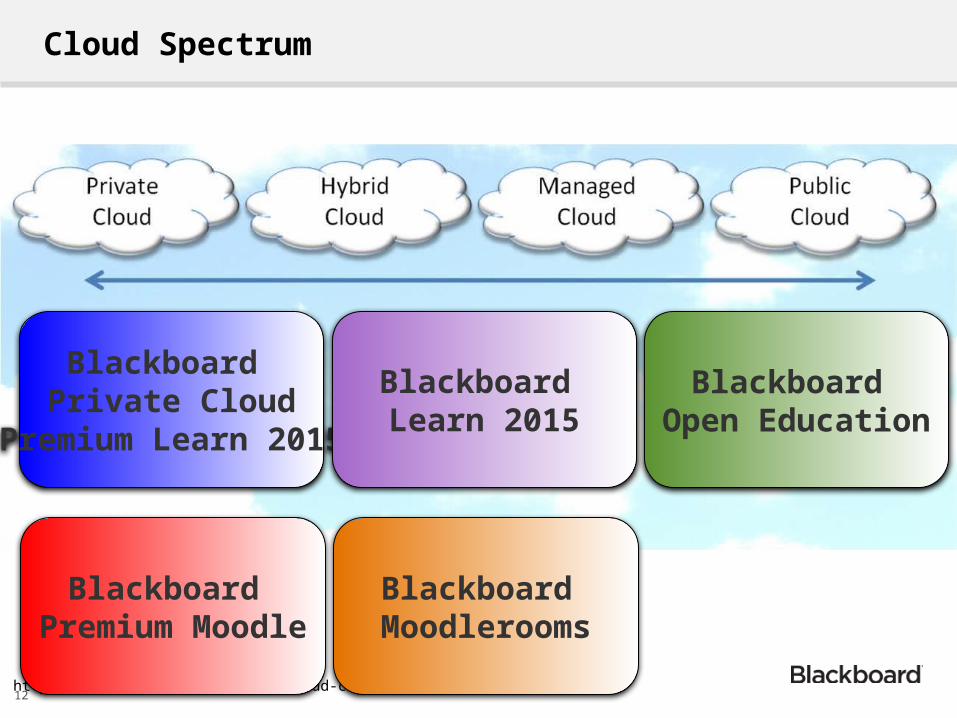
Cloud Spectrum
12 http://resource.onlinetech.com/cloud-computing-spectrum/
Blackboard Private Cloud
(Premium Learn 2015)
Blackboard Learn 2015
Blackboard Open Education
Blackboard Premium Moodle
Blackboard Moodlerooms
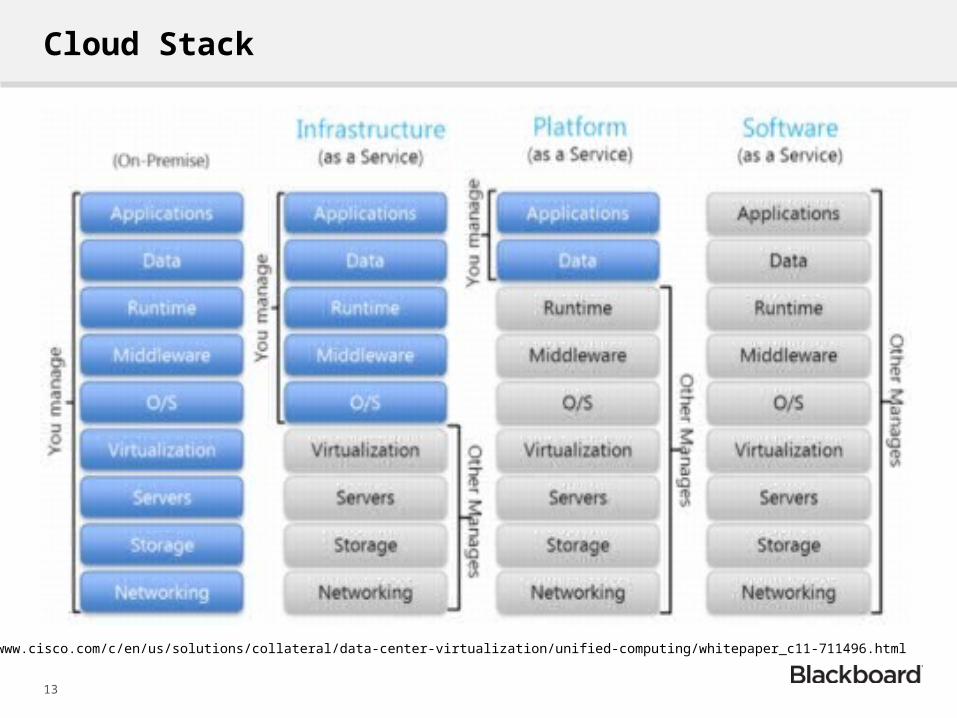
Cloud Stack
13
http://www.cisco.com/c/en/us/solutions/collateral/data-center-virtualization/unified-computing/whitepaper_c11-711496.html
14
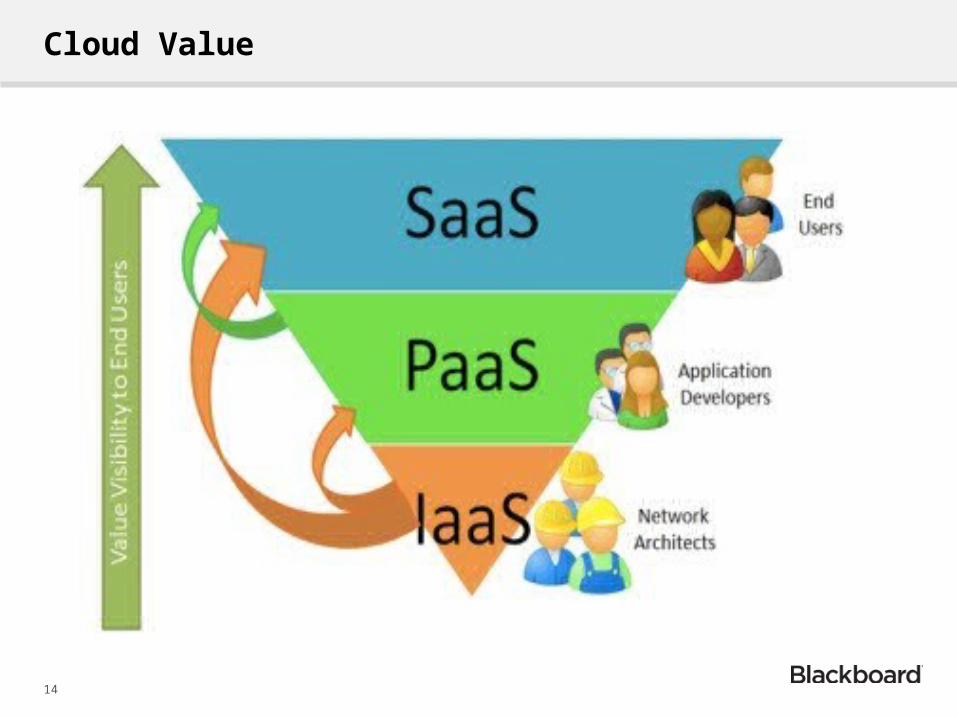
Cloud Value

Cloud Spectrum
15 http://resource.onlinetech.com/cloud-computing-spectrum/
Blackboard Private Cloud
(Premium Learn 2015)
Blackboard Learn 2015
Blackboard Open Education
Blackboard Premium Moodle
Blackboard Moodlerooms
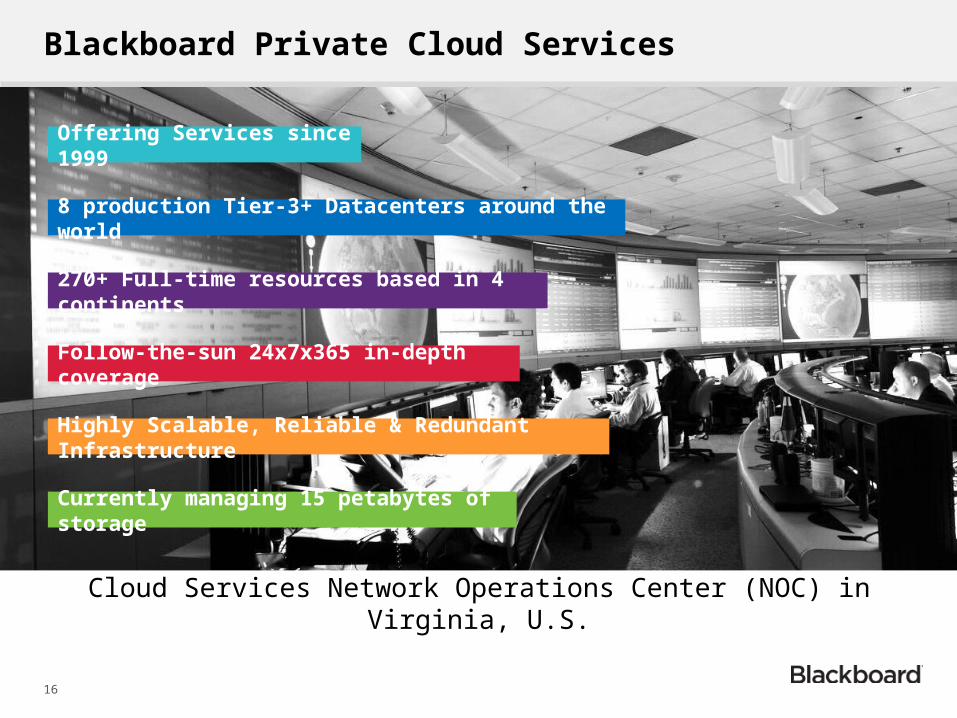
Blackboard Private Cloud Services
Cloud Services Network Operations Center (NOC) in Virginia, U.S.
Offering Services since 1999
8 production Tier-3+ Datacenters around the world
270+ Full-time resources based in 4 continents
Follow-the-sun 24x7x365 in-depth coverage
Highly Scalable, Reliable & Redundant Infrastructure
Currently managing 15 petabytes of storage
16
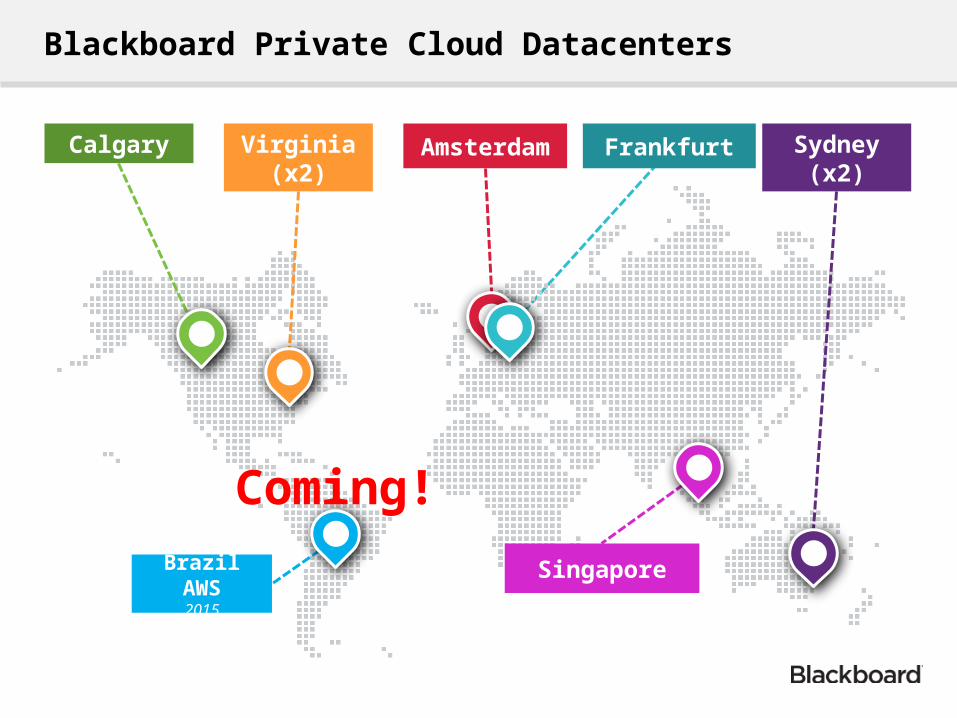
Blackboard Private Cloud Datacenters
Calgary Virginia (x2)
Amsterdam Frankfurt Sydney (x2)
SingaporeBrazil AWS2015
Coming!
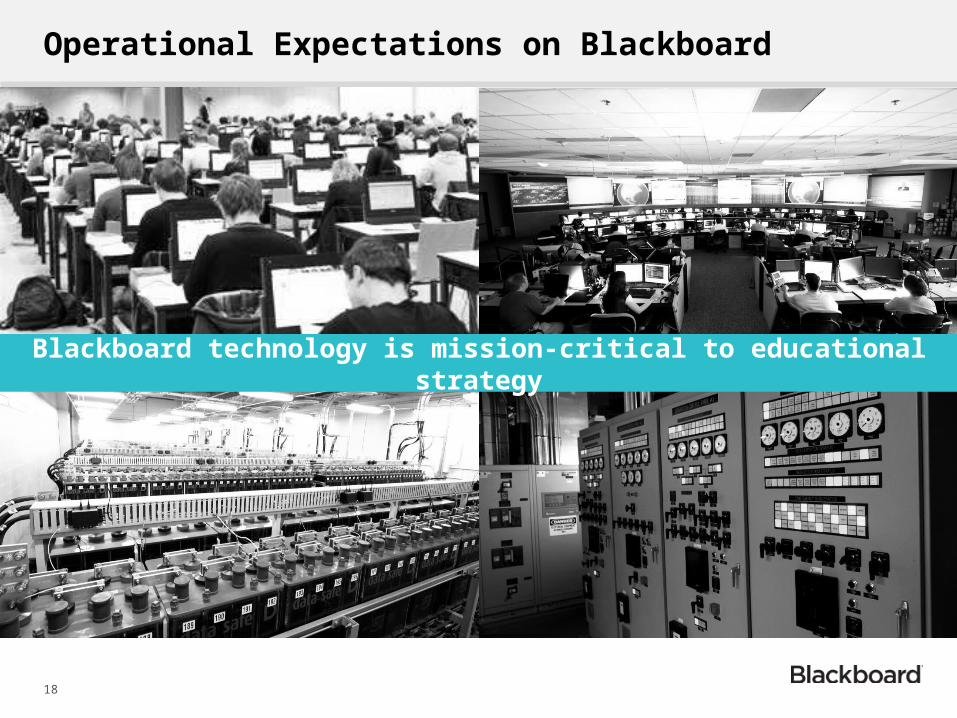
Operational Expectations on Blackboard
Blackboard technology is mission-critical to educational strategy
18
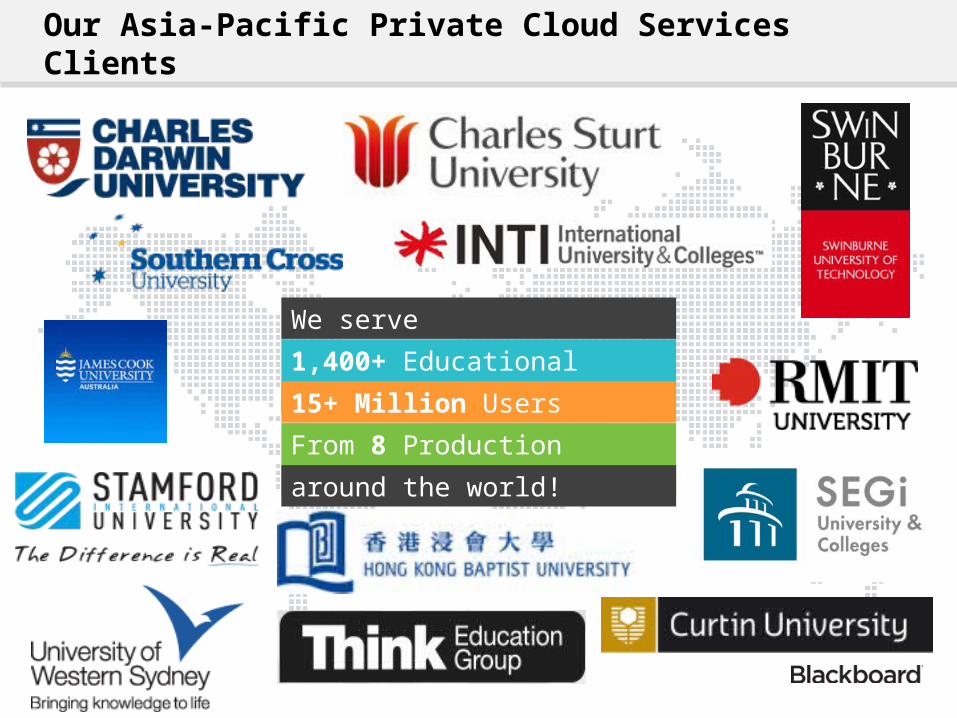
Our Asia-Pacific Private Cloud Services Clients
1,400+ Educational Institutions
15+ Million Users
From 8 Production Datacenters
We serve
around the world!
19
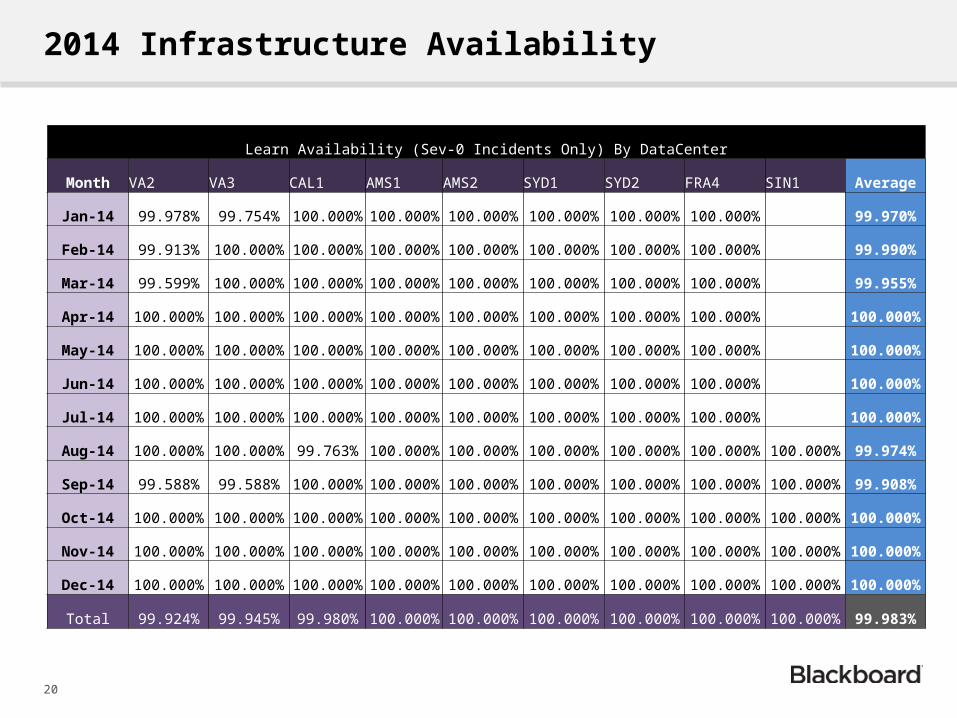
2014 Infrastructure Availability
20
Learn Availability (Sev-0 Incidents Only) By DataCenter
Month VA2 VA3 CAL1 AMS1 AMS2 SYD1 SYD2 FRA4 SIN1 Average
Jan-14 99.978% 99.754% 100.000% 100.000% 100.000% 100.000% 100.000% 100.000% 99.970%
Feb-14 99.913% 100.000% 100.000% 100.000% 100.000% 100.000% 100.000% 100.000% 99.990%
Mar-14 99.599% 100.000% 100.000% 100.000% 100.000% 100.000% 100.000% 100.000% 99.955%
Apr-14 100.000% 100.000% 100.000% 100.000% 100.000% 100.000% 100.000% 100.000% 100.000%
May-14 100.000% 100.000% 100.000% 100.000% 100.000% 100.000% 100.000% 100.000% 100.000%
Jun-14 100.000% 100.000% 100.000% 100.000% 100.000% 100.000% 100.000% 100.000% 100.000%
Jul-14 100.000% 100.000% 100.000% 100.000% 100.000% 100.000% 100.000% 100.000% 100.000%
Aug-14 100.000% 100.000% 99.763% 100.000% 100.000% 100.000% 100.000% 100.000% 100.000% 99.974%
Sep-14 99.588% 99.588% 100.000% 100.000% 100.000% 100.000% 100.000% 100.000% 100.000% 99.908%
Oct-14 100.000% 100.000% 100.000% 100.000% 100.000% 100.000% 100.000% 100.000% 100.000% 100.000%
Nov-14 100.000% 100.000% 100.000% 100.000% 100.000% 100.000% 100.000% 100.000% 100.000% 100.000%
Dec-14 100.000% 100.000% 100.000% 100.000% 100.000% 100.000% 100.000% 100.000% 100.000% 100.000%
Total 99.924% 99.945% 99.980% 100.000% 100.000% 100.000% 100.000% 100.000% 100.000% 99.983%
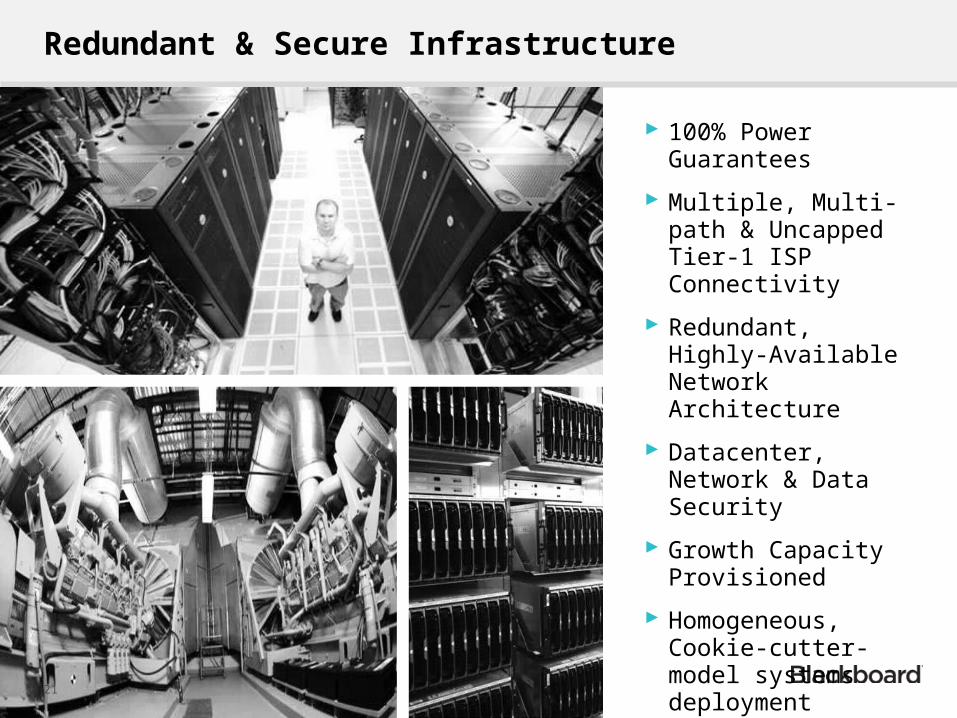
Redundant & Secure Infrastructure
100% Power Guarantees
Multiple, Multi-path & Uncapped Tier-1 ISP Connectivity
Redundant, Highly-Available Network Architecture
Datacenter, Network & Data Security
Growth Capacity Provisioned
Homogeneous, Cookie-cutter-model systems deployment
21
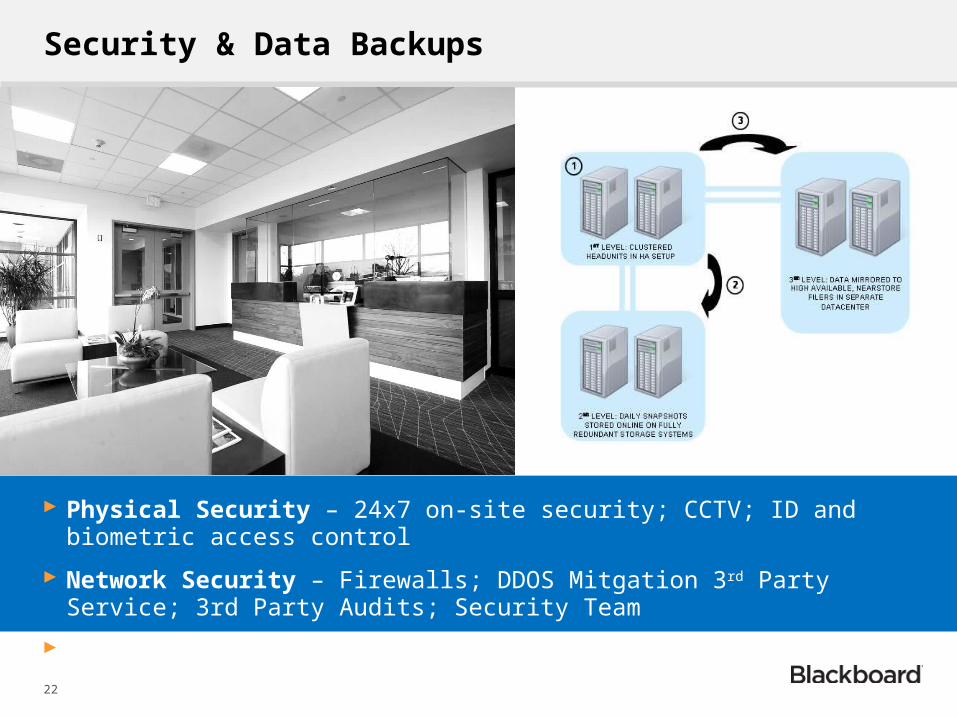
Security & Data Backups
Physical Security – 24x7 on-site security; CCTV; ID and biometric access control
Network Security – Firewalls; DDOS Mitgation 3rd Party Service; 3rd Party Audits; Security Team
Data Security – multi-layer & off-site data backups and 30-day retention
22
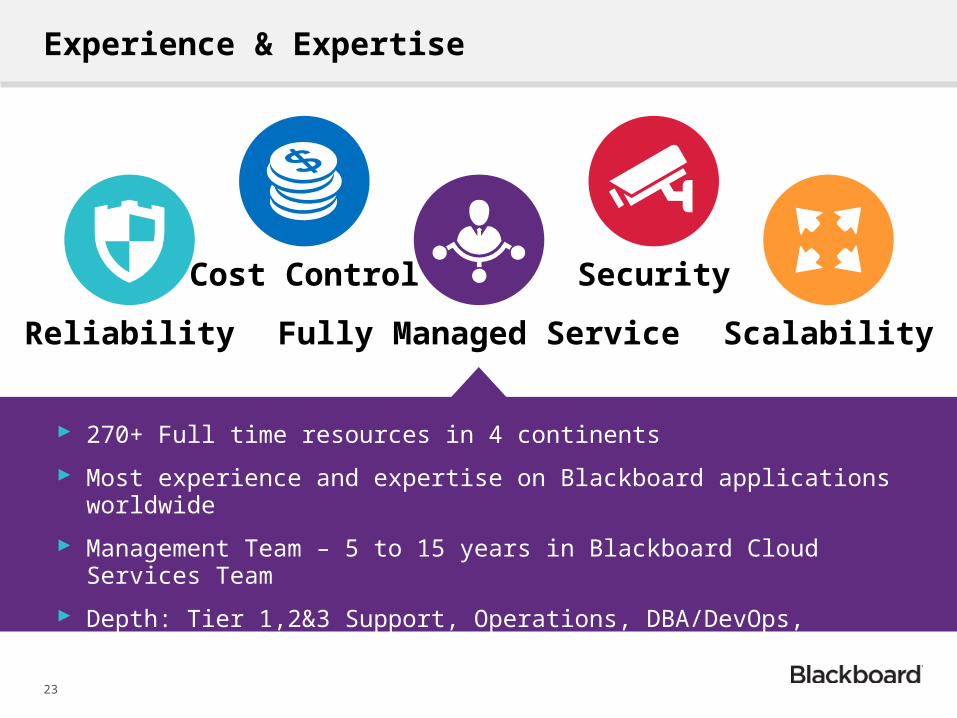
Experience & Expertise
Reliability
Cost Control Security
Fully Managed Service Scalability
270+ Full time resources in 4 continents
Most experience and expertise on Blackboard applications worldwide
Management Team – 5 to 15 years in Blackboard Cloud Services Team
Depth: Tier 1,2&3 Support, Operations, DBA/DevOps, Application, Storage, Infrastructure, Datacenter & Project Management Resources available 24x7
23
Reporting Solutions
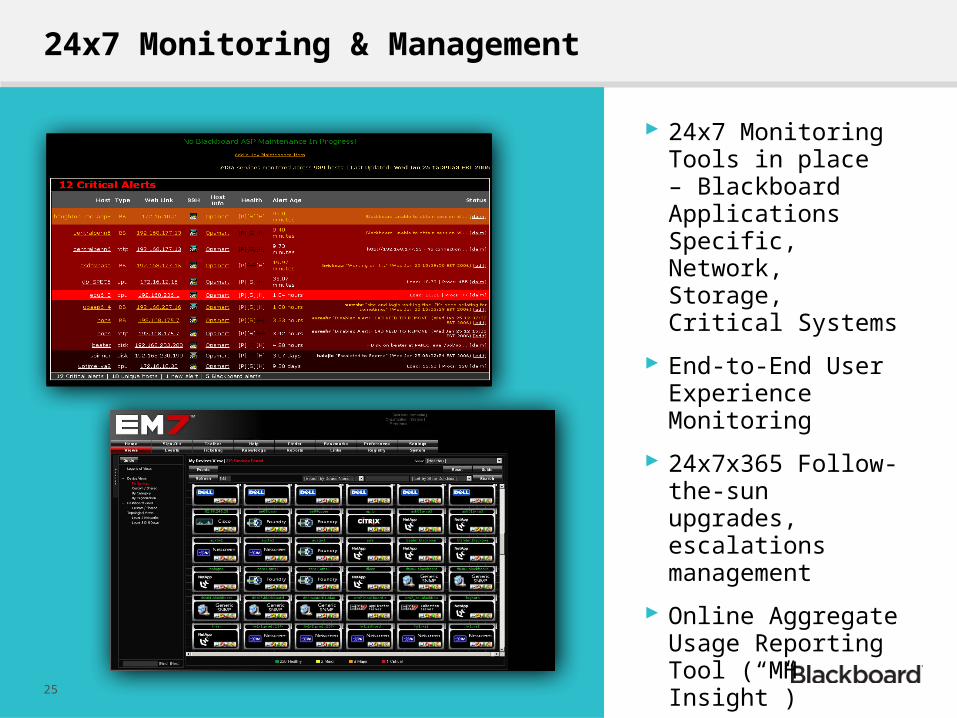
24x7 Monitoring & Management
24x7 Monitoring Tools in place – Blackboard Applications Specific, Network, Storage, Critical Systems
End-to-End User Experience Monitoring
24x7x365 Follow-the-sun upgrades, escalations management
Online Aggregate Usage Reporting Tool (“MH Insight”)
Centralized Enterprise Management System
25
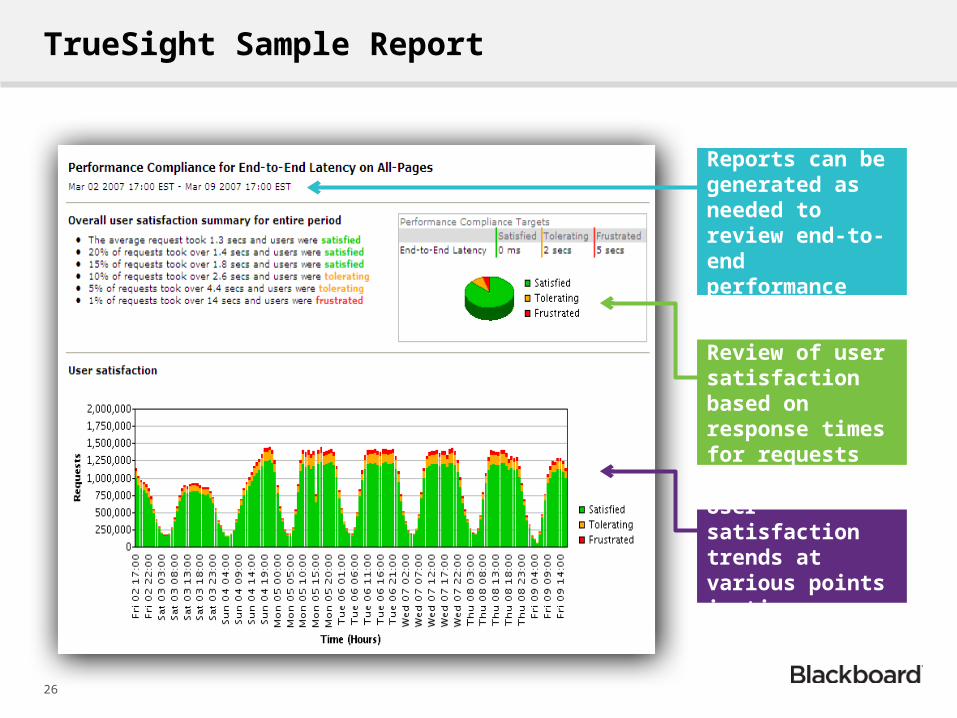
TrueSight Sample Report
Reports can be generated as needed to review end-to-end performance
Review of user satisfaction based on response times for requests
User satisfaction trends at various points in time
26
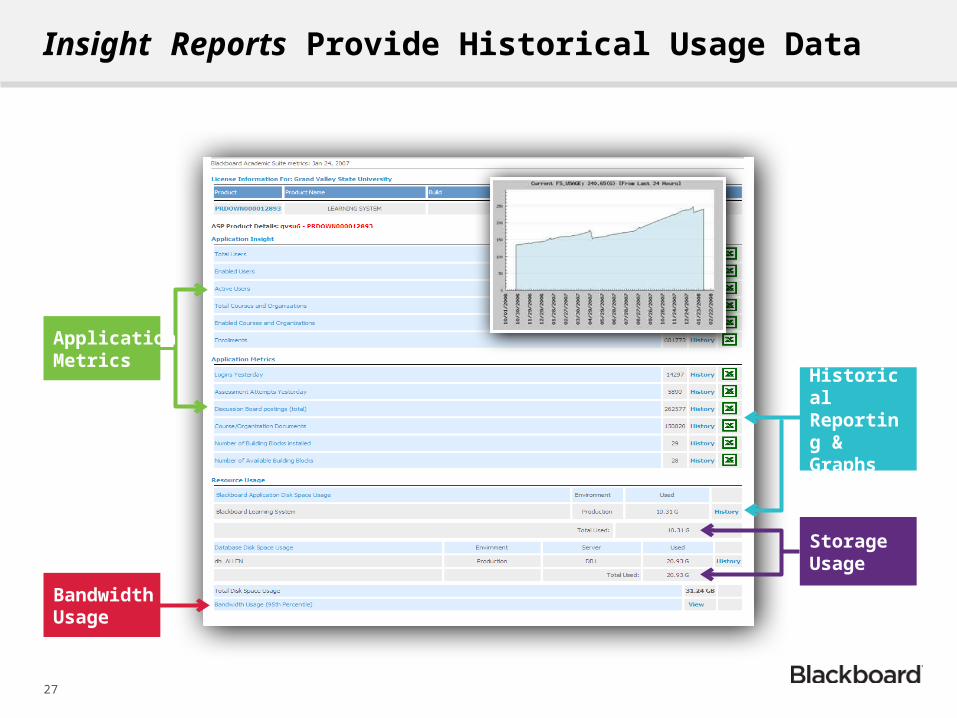
Insight Reports Provide Historical Usage Data
Storage Usage
Historical Reporting & Graphs
Application Metrics
Bandwidth Usage
27
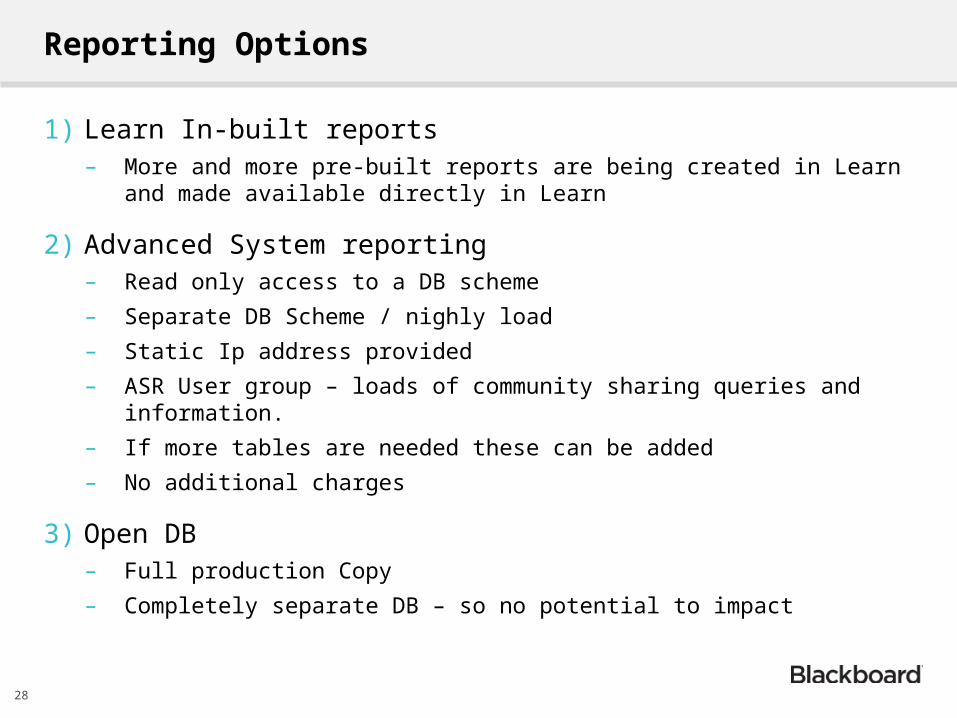
Reporting Options
1) Learn In-built reports– More and more pre-built reports are being created in Learn and made
available directly in Learn
2) Advanced System reporting– Read only access to a DB scheme
– Separate DB Scheme / nighly load
– Static Ip address provided
– ASR User group – loads of community sharing queries and information.
– If more tables are needed these can be added
– No additional charges
3) Open DB– Full production Copy
– Completely separate DB – so no potential to impact
28
Migration Services
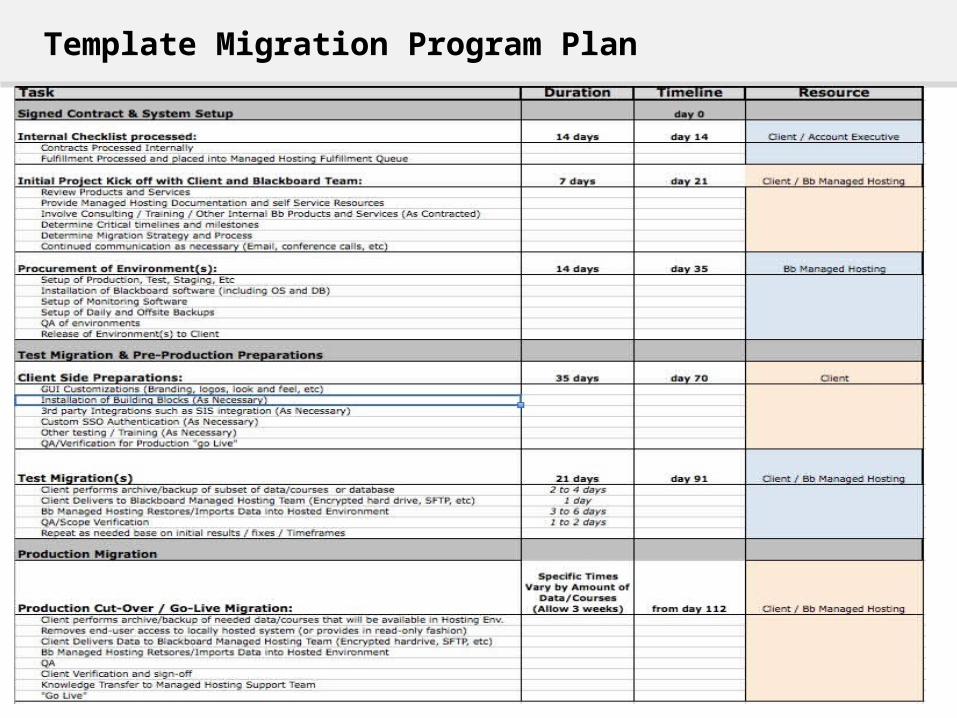
Template Migration Program Plan
30
Typical Questions
What Service Level Agreements (SLA) does Cloud Services offer?
What about planned maintenance windows?
What about disaster scenarios?
What to expect with migrating data/customizations to Cloud Services?
Visit to our datacenter?
Other questions?
31