bba 1584 scm
TRANSCRIPT

BBA 1564
Supply Chain Management
Prof. Dr. Prem

What Is a Supply Chain?
Flow of products and services from:
– Raw materials manufacturers
– Intermediate products manufacturers
– End product manufacturers
– Wholesalers and distributors and
– Retailers
• Connected by transportation and storage activities
• Integrated through information, planning, and integration activities
• Cost and service levels

What Is Supply Chain
Management?
• Supply chain management is a set of approaches
utilized to efficiently integrate suppliers,
manufacturers, warehouses, and stores, so that
merchandise is produced and distributed at the
right quantities, to the right locations, and at the
right time, in order to minimize system wide costs
while satisfying service level requirements.
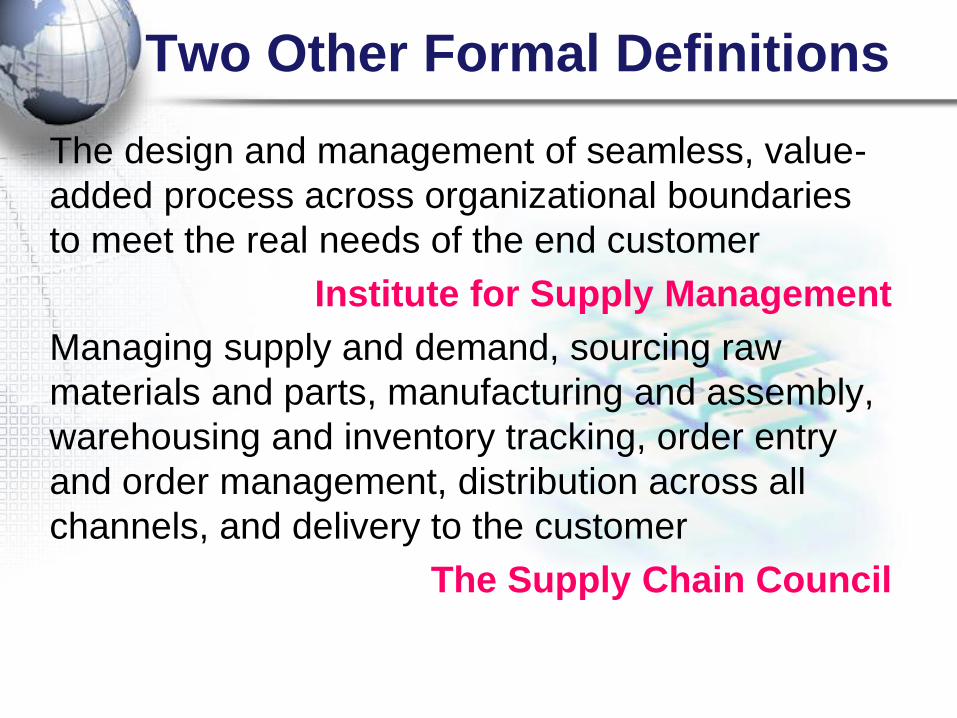
Two Other Formal Definitions
The design and management of seamless, value-
added process across organizational boundaries
to meet the real needs of the end customer
Institute for Supply Management
Managing supply and demand, sourcing raw
materials and parts, manufacturing and assembly,
warehousing and inventory tracking, order entry
and order management, distribution across all
channels, and delivery to the customer
The Supply Chain Council
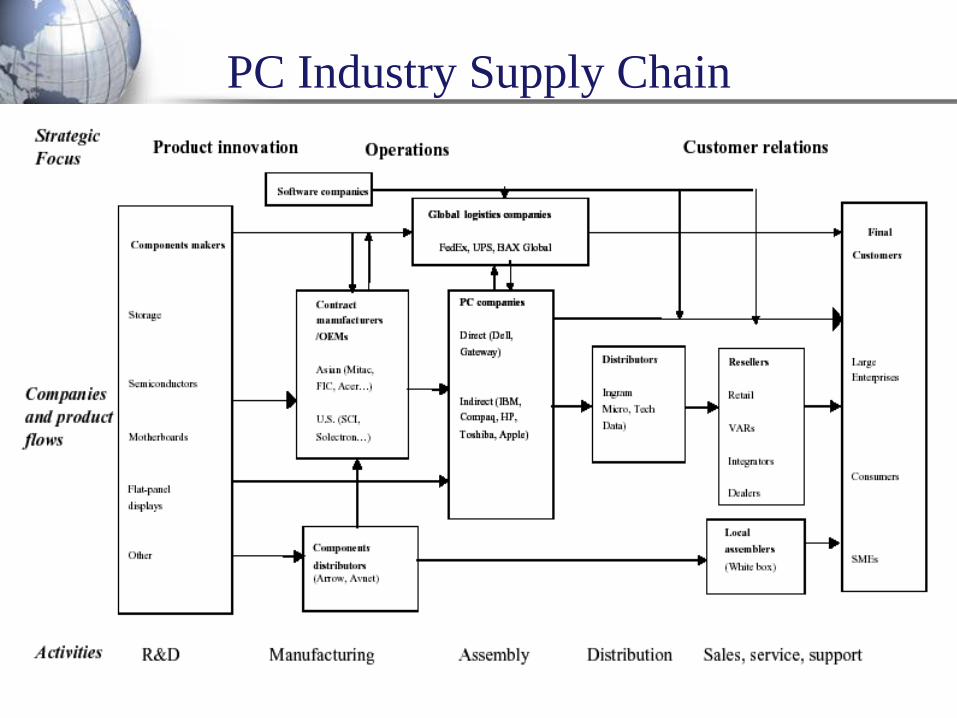
PC Industry Supply Chain

Cisco’s Value Network

• Supply chain - ―A network of organizations connected in their
processes and activities, with the ultimate goal of delivering value
to the final customer.‖ (Christopher, 2005 p57.)
• This new discipline was a response to changes in prevailing trends
in business strategy, which in turn demanded that internal functional
self-interests be put aside to achieve a greater good of delivering
better value to customers
Supply Chain Management
1. Lee, (2000) Creating value through supply chain integration. Supply Chain Management Review. v4 i4. 30-36.
2. Christopher M (2005) Logistics and supply chain management: creating value-adding networks. 3rd edn, FT Prentice Hall.

Supply Chain: Manufacturing Example
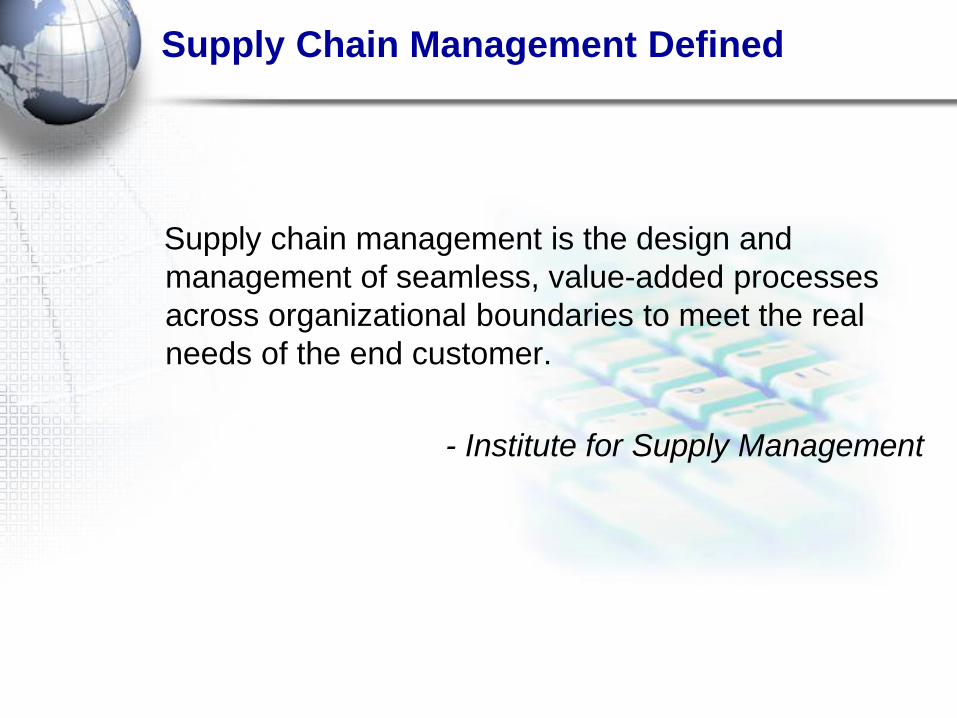
Supply Chain Management Defined
Supply chain management is the design and
management of seamless, value-added processes
across organizational boundaries to meet the real
needs of the end customer.
- Institute for Supply Management

Internal Value Chain: Local Focus
10
R & D
Operations
Executive
Management
Logistics
Marketing
Human
Resource
Management
Accounting
Finance
Supply
Management
Information
Technology
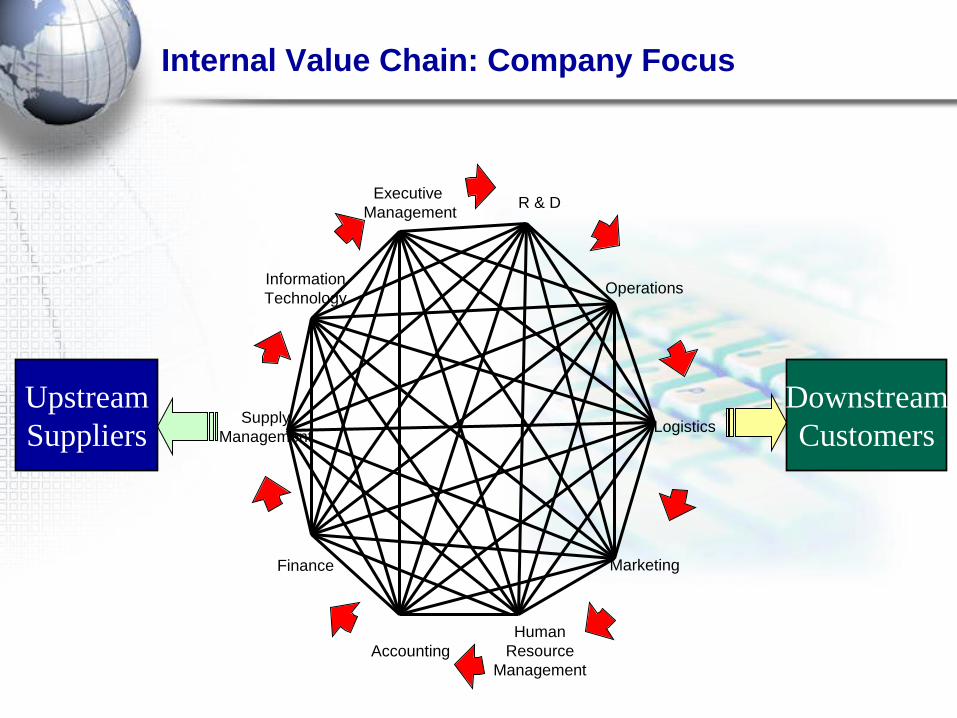
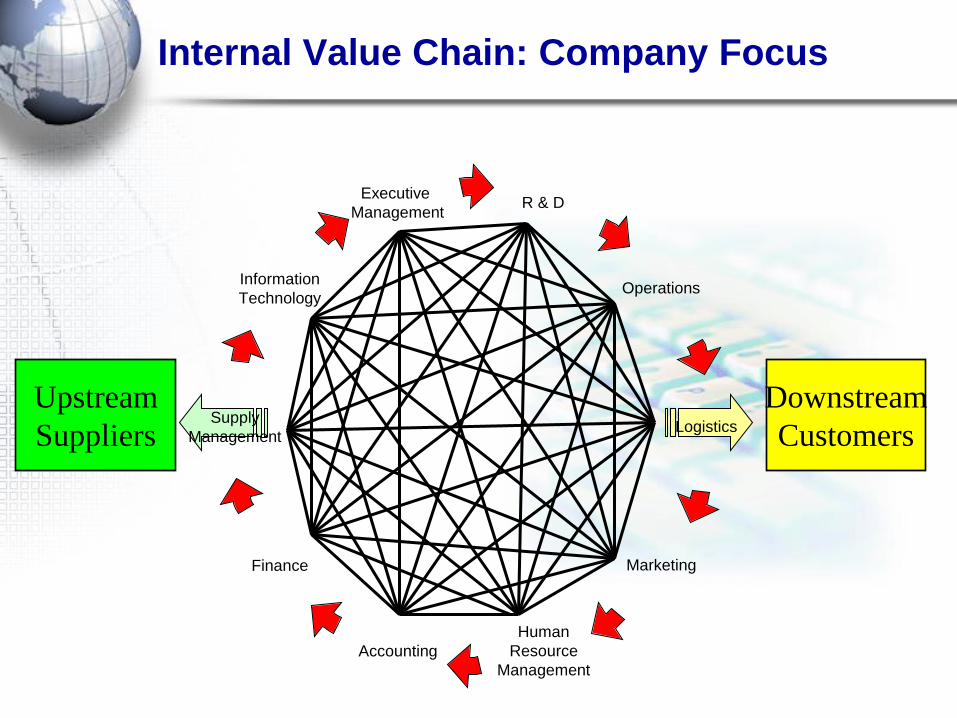
Internal Value Chain: Company Focus
R & D
Operations
Executive
Management
Logistics
Marketing
Human
Resource
Management
Accounting
Finance
Supply
Management
Information
Technology
Upstream
Suppliers
Downstream
Customers
Internal Value Chain: Company Focus
R & D
Operations
Executive
Management
Logistics
Marketing
Human
Resource
Management
Accounting
Finance
Supply
Management
Information
Technology
Upstream
Suppliers
Downstream
Customers
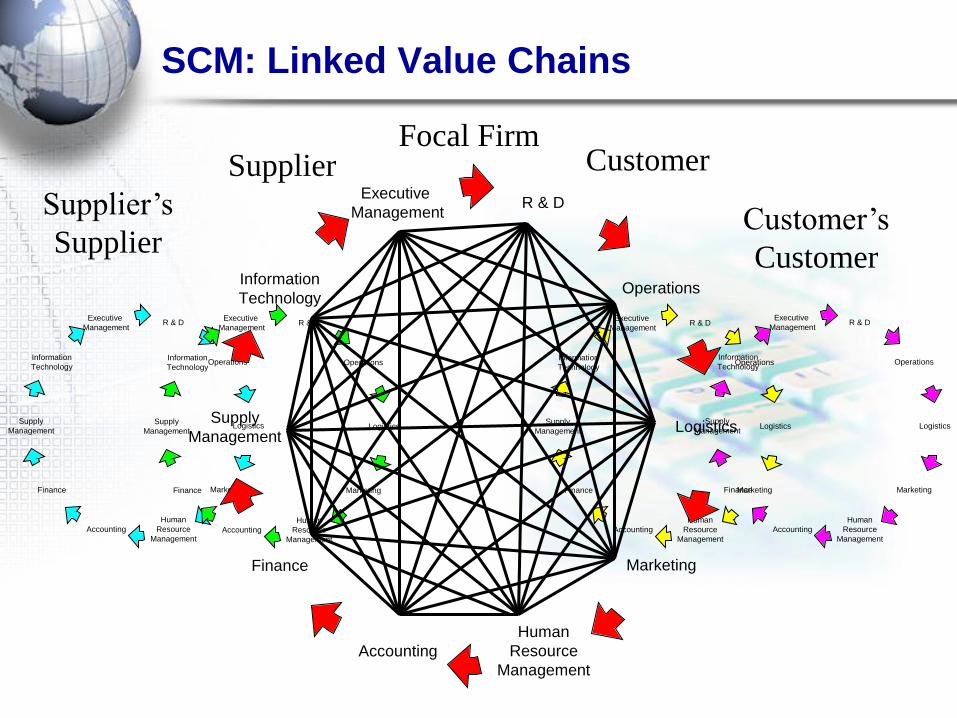
SCM: Linked Value Chains
R & D
Operations
Executive
Management
Logistics
Marketing
Human
Resource
Management
Accounting
Finance
Supply
Management
Information
Technology
R & D
Operations
Executive
Management
Logistics
Marketing
Human
Resource
Management
Accounting
Finance
Supply
Management
Information
Technology
R & D
Operations
Executive
Management
Logistics
Marketing
Human
Resource
Management
Accounting
Finance
Supply
Management
Information
Technology
R & D
Operations
Executive
Management
Logistics
Marketing
Human
Resource
Management
Accounting
Finance
Supply
Management
Information
Technology
R & D
Operations
Executive
Management
Logistics
Marketing
Human
Resource
Management
Accounting
Finance
Supply
Management
Information
Technology
Focal Firm Supplier
Supplier’s
Supplier
Customer
Customer’s
Customer
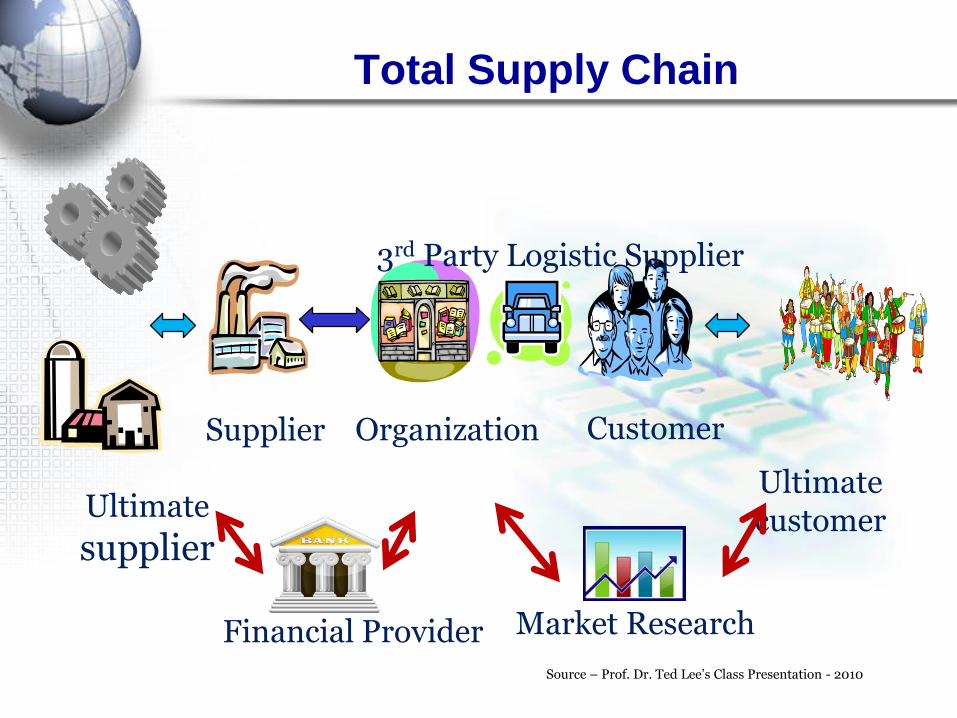
Total Supply Chain
Supplier Organization Customer
Ultimate
supplier
Ultimate customer
Financial Provider Market Research
3rd Party Logistic Supplier
Source – Prof. Dr. Ted Lee’s Class Presentation - 2010

Key Observations
• Every facility that impacts costs need to be
considered
– Suppliers‘ suppliers
– Customers‘ customers
• Efficiency and cost-effectiveness
throughout the system is required
– System level approach
• Multiple levels of activities
– Strategic – Tactical – Operational

Other Related Observations
• Supply chain strategy linked to the Development
Chain
• Challenging to minimize system costs and
maximize system service levels
• Inherent presence of uncertainty and risk
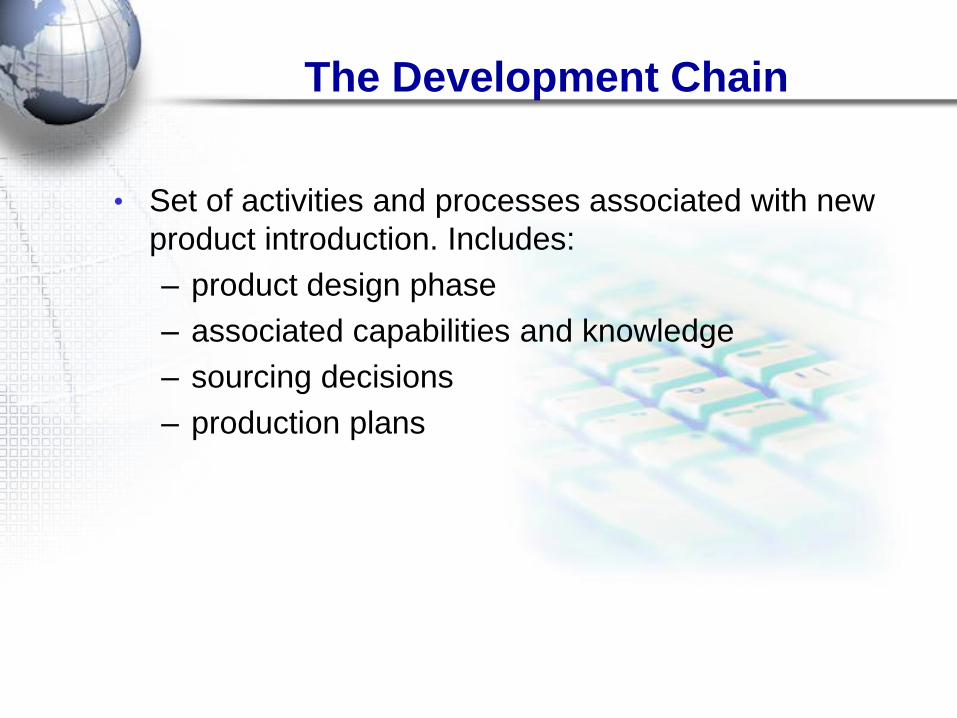
• Set of activities and processes associated with new
product introduction. Includes:
– product design phase
– associated capabilities and knowledge
– sourcing decisions
– production plans
The Development Chain
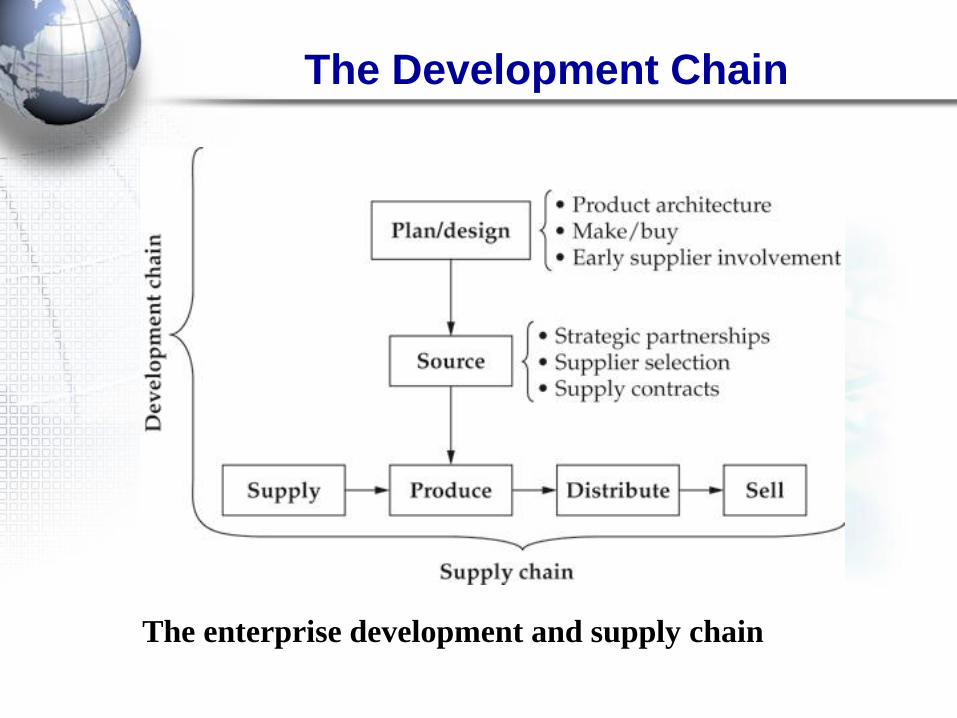
The Development Chain
The enterprise development and supply chain

Global Optimization
• Geographically dispersed complex network
• Conflicting objectives of different facilities
• Dynamic system
– Variations over time
– Matching demand-supply difficult
– Different levels of inventory and backorders
• Recent developments have increased risks
– Lean production/Off-shoring/Outsourcing
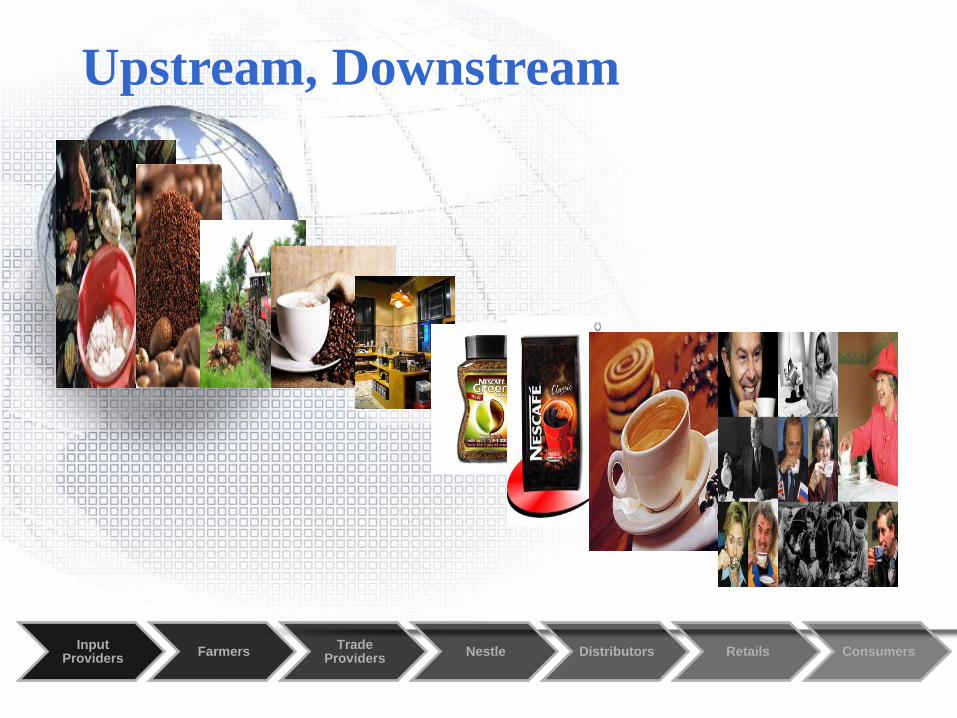
Input Providers
Farmers Trade
Providers Nestle Distributors Retails Consumers
Upstream, Downstream
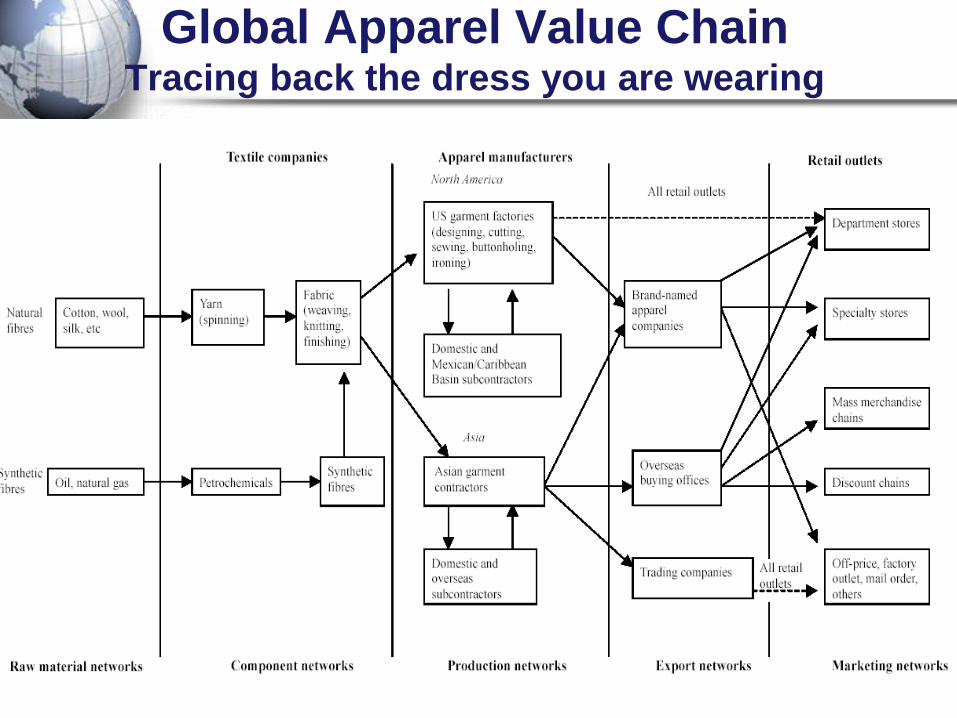
Global Apparel Value Chain Tracing back the dress you are wearing


• Forecasts are never right
– Very unlikely that actual demand will exactly equal forecast
demand
• The longer the forecast horizon, the worse the forecast
– A forecast for a year from now will never be as accurate as a
forecast for 3 months from now
• Aggregate forecasts are more accurate
– A demand forecast for all CV therapeutics will be more accurate
than a forecast for a specific CV-related product
Nevertheless, forecasts (or plans, if you prefer) are important management
tools when some methods are applied to reduce uncertainty
Supply Chain Management – Key Issues

Key Business Challenges
Competitive Pressures are Intense –
• In a crowded marketplace, an firm must execute flawlessly to
make gains on the competition.
• With buyers viewing products as commodities, the ability to
compete more effectively or differentiate their value to
customers is crucial to continued success.
Need to Increase Business Agility –
• Business agility is a strategic imperative as firms try to
respond quickly to changing business needs, governing
regulation or the competitive marketplace.
• Organization must build new processes into rigid and
inflexible infrastructures in order to address these needs
effectively.

Key Business Challenges
Focus on Customer as Partners in Business
(build experience)
• Firms must understand all too well the impact a
negative customer service experience can have on
their bottom line.
• As a result, many firms are working to improve
their customer service and deliver a cohesive
service experience to customers and business
partners.
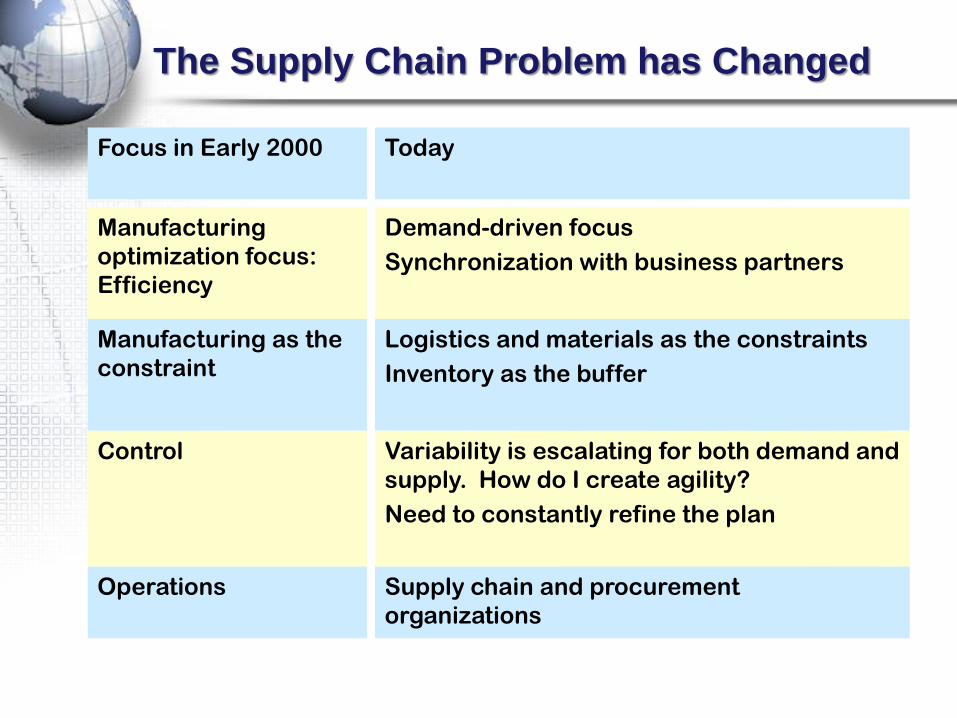
The Supply Chain Problem has Changed
Demand-driven focus
Synchronization with business partners
Manufacturing
optimization focus:
Efficiency
Supply chain and procurement
organizations
Operations
Today Focus in Early 2000
Logistics and materials as the constraints
Inventory as the buffer
Manufacturing as the
constraint
Variability is escalating for both demand and
supply. How do I create agility?
Need to constantly refine the plan
Control
-Traditionally supply chains have been characterized by arms-
length, even adversarial relationships between the different
players.
- There has been limited history of sharing information either with
suppliers or customers.
- Conventionally supply chains have often been designed to
optimise for cost and/or customer service
- Many organisations are at risk because their response times to
demand changes or supply disruption are too long.
Conventional Supply Chains

Types of supply chains
• Product oriented (e.g. making and selling beer) – Manufacturing centric
– Capital intensive (usually) & geographically concentrated
– Physical product
– Separation of provision and consumption, therefore movement
– Inventory buffers demand variability
• Service oriented (e.g. professional services; house purchase) – People centric
– Not capital intensive & geographically more dispersed
– Intangible
– Customer and provider interact as part of the fulfilment process
– Capacity buffers demand variability
• Hybrids (e.g. equipment maintenance & repair/ construction/ retailing)
– Both product and people skills equally required to deliver the solution
– Capacity and inventory both important in managing demand variability

Comparison of Product and Service Supply Chains
Product based Supply Chains Service based Supply Chains
Tangible, physical Intangible
Transported from production to
point of consumption
‗Consumed‘ at point of production
Customer removed from
production process
Customer contributes to
production process
Inventory buffers variability of
demand (& supply)
Resources buffer variability of
demand
Capital intensive Resource intensive
Standard & mass produced Unique & customised
Linear; sequential Networked; non-sequential

Article review – Retail Supply Chain outlook 2012
1. Summarize the article and reflect it to the
Malaysian Logistics Industry.
2. What is the relationship between new hours of
service rulemaking and its impact to movement of
goods.
3. List some of the innovation in Logistics in the
recent years.

Article review- The Internet-Enabled Supply Chain
1. Elaborate ―The Internet harness the ability to
connect buyers and suppliers‖ and relate it to the
definition of SC
2. Prof Dr Hau Lee claims that ―Competition now
occurs at the supply Chain level, not just company
versus company‖
3. Briefly explain POS, WMS and Order
Management system.
4. Visibility is the key for Information management in
Supply Chain. Explain how visibility can be
achieved in a downstream and upstream.
INVENTORY MANAGEMENT
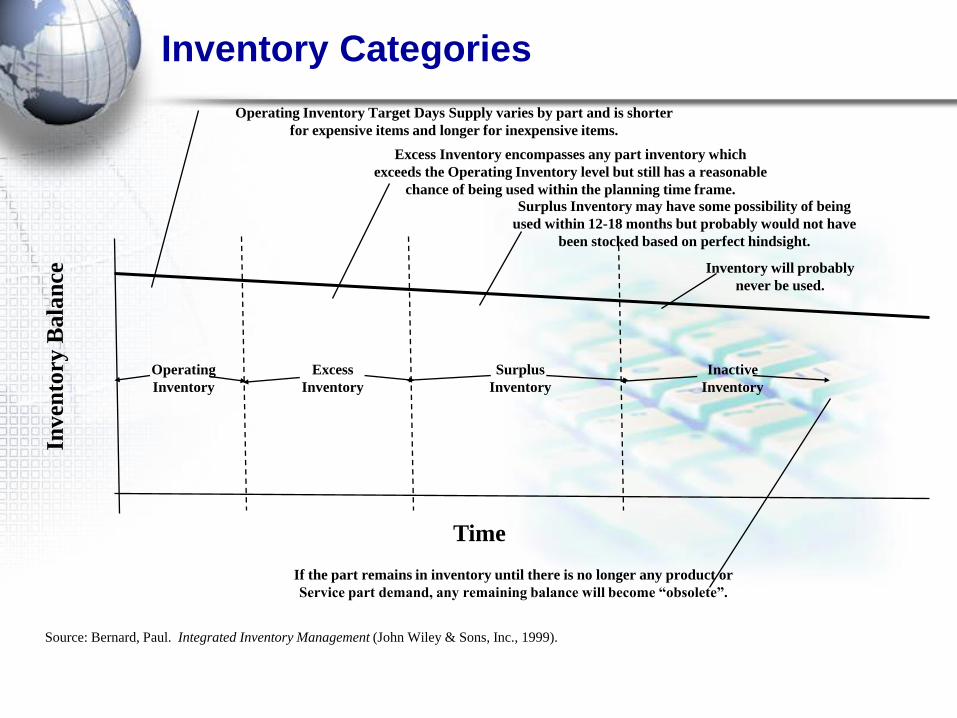
Inventory Categories
Source: Bernard, Paul. Integrated Inventory Management (John Wiley & Sons, Inc., 1999).
Operating Inventory Target Days Supply varies by part and is shorter
for expensive items and longer for inexpensive items.
Excess Inventory encompasses any part inventory which
exceeds the Operating Inventory level but still has a reasonable
chance of being used within the planning time frame.
Surplus Inventory may have some possibility of being
used within 12-18 months but probably would not have
been stocked based on perfect hindsight.
Inven
tory
Bala
nce
Time
If the part remains in inventory until there is no longer any product or
Service part demand, any remaining balance will become “obsolete”.
Inventory will probably
never be used.
Operating
Inventory
Excess
Inventory
Surplus
Inventory
Inactive
Inventory

Classifying Inventory: ABC Analysis
• Ranking system
– Developed in 1951 by H. Ford Dicky of General
Electric3.
– Suggested that GE classify items according to
relative sales volume, cash flows, lead time, or
stockout cost.
– Most important inventory put in Group A.
– Lesser impact goods put in Groups B and C
respectively.
Classifying Inventory: ABC Analysis
• Pareto‘s Rule (80-20 Rule)
– Based on a nineteenth century mathematician‘s
observation that many situations were
dominated by a very few elements.
– Conversely, most elements had very little
influence in most situations.
– Separates the ―trivial many‖ from the ―vital few‖.

Classifying Inventory: ABC Analysis
• 80-20 Rule
– 80% of sales will come from 20% of the inventory
SKUs.
– 20% of sales will come from 80% of the inventory
SKUs.
• The 80-20 Rule has been found to explain many
phenomena that interest managers.
– For example, 80% of sales come from 20% of
customers; and vice versa.

ABC Inventory Analysis
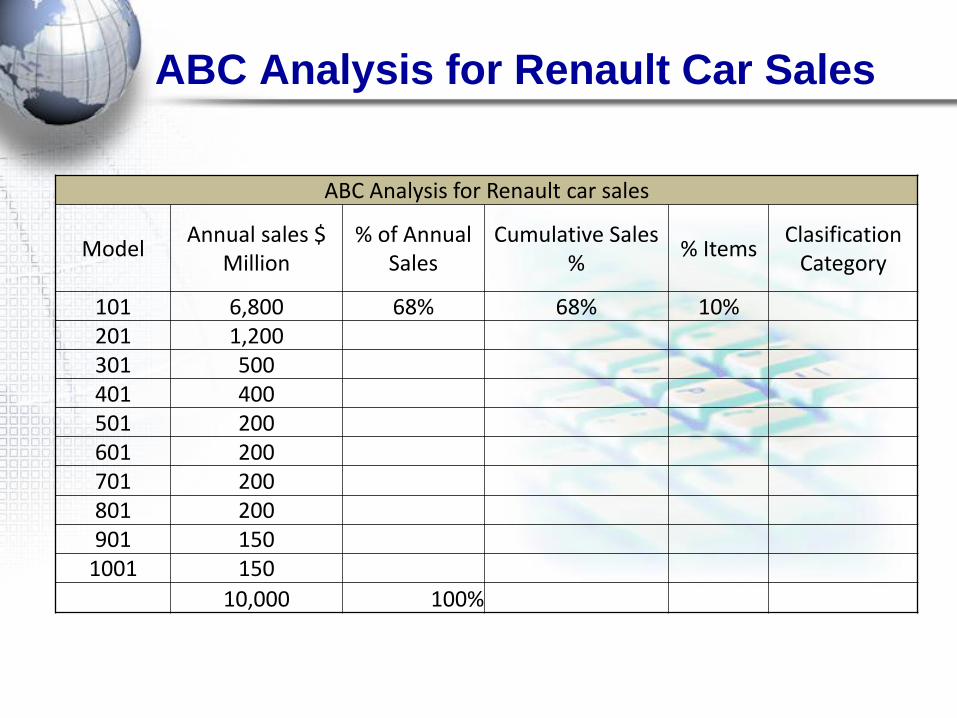
ABC Analysis for Renault Car Sales
ABC Analysis for Renault car sales
Model Annual sales $
Million % of Annual
Sales Cumulative Sales
% % Items
Clasification Category
101 6,800 68% 68% 10% 201 1,200 301 500 401 400 501 200 601 200 701 200 801 200 901 150
1001 150
10,000 100%

Bullwhip Effect
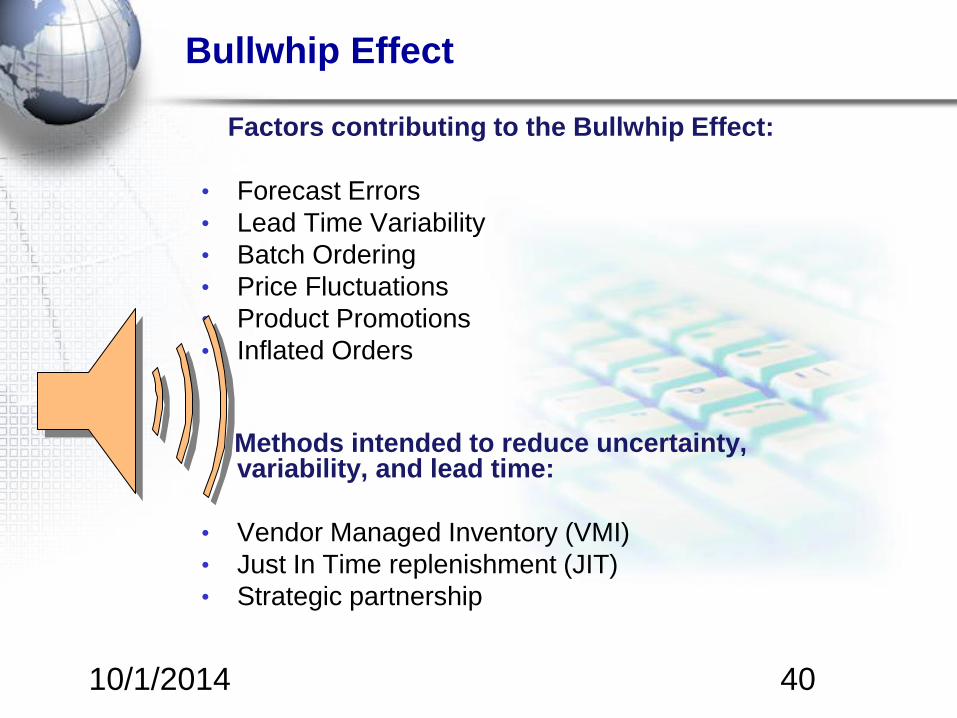
Bullwhip Effect
Factors contributing to the Bullwhip Effect:
• Forecast Errors
• Lead Time Variability
• Batch Ordering
• Price Fluctuations
• Product Promotions
• Inflated Orders
Methods intended to reduce uncertainty, variability, and lead time:
• Vendor Managed Inventory (VMI)
• Just In Time replenishment (JIT)
• Strategic partnership
10/1/2014 40
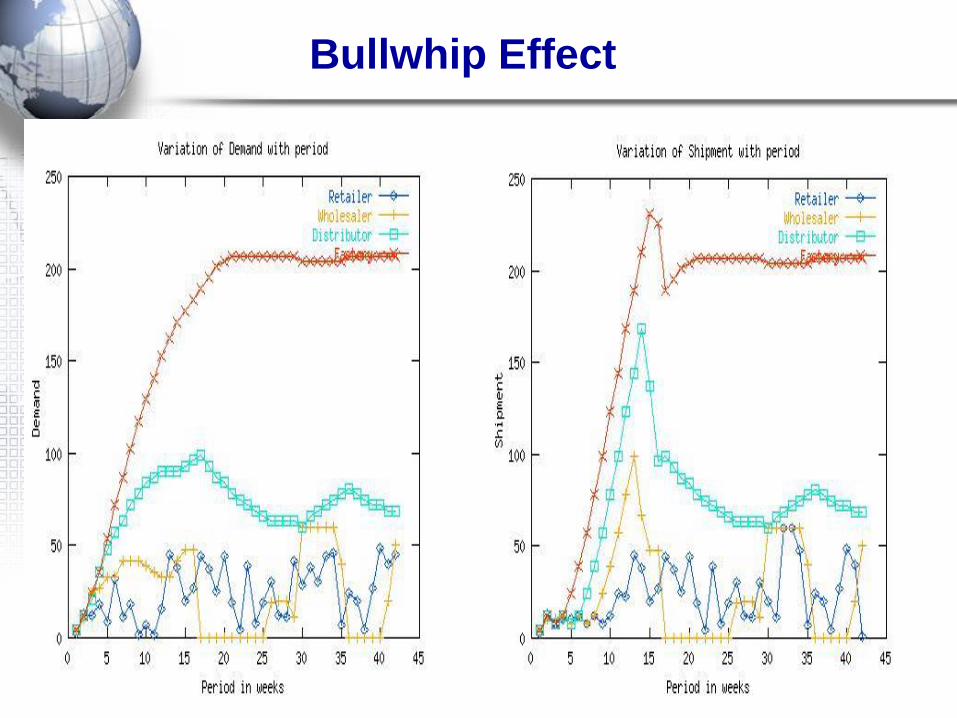
Bullwhip Effect
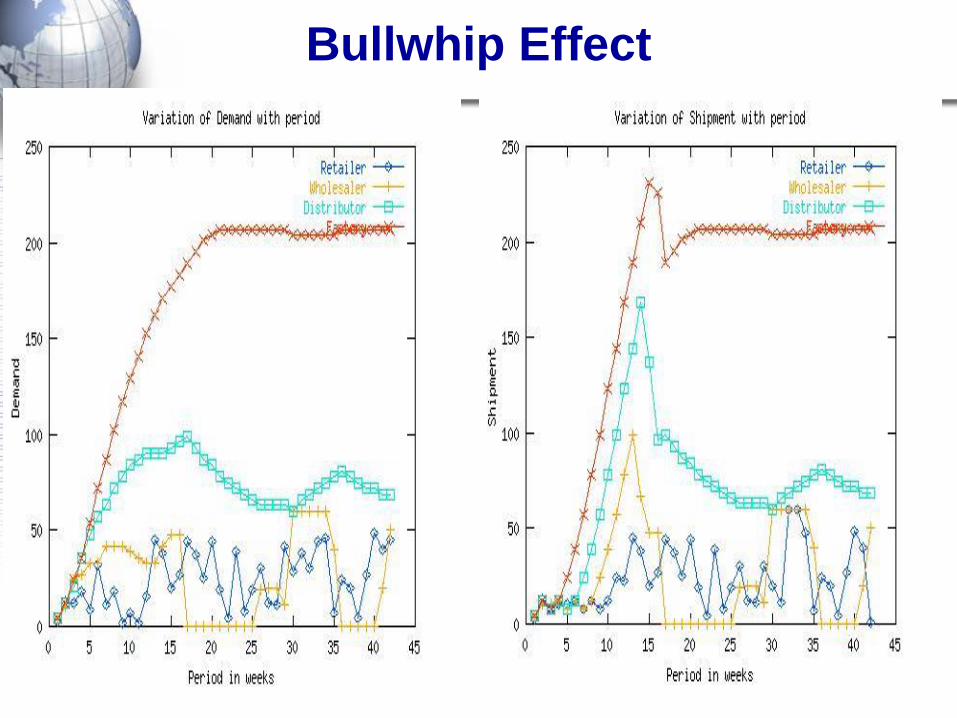
Bullwhip Effect

Causes of Bullwhip Effect
Demand Signal Processing (frequent updates of forecasts; only next echelon orders considered)
Order Batching (to realise logistic Economies of scale + Reducing order processing costs)
Price Fluctuations (resulting in over-reactions)
Supply Rationing (Proportionate rationing; unrestricted order acceptance + free return policy)
10/1/2014 43

Counter-Measures for BWE
• Avoid multiple demand forecasts
– Order based on ultimate customer demand
– Use EDI+POS+VMI
– Choose a good forecasting method (PLC has a
major say)
– Move from decentralized DM to centralized
planning (visibility+control is better)
– Remove layers in channel if possible
• Eg: HP, Apple, IBM, P&G/Walmart
10/1/2014 44
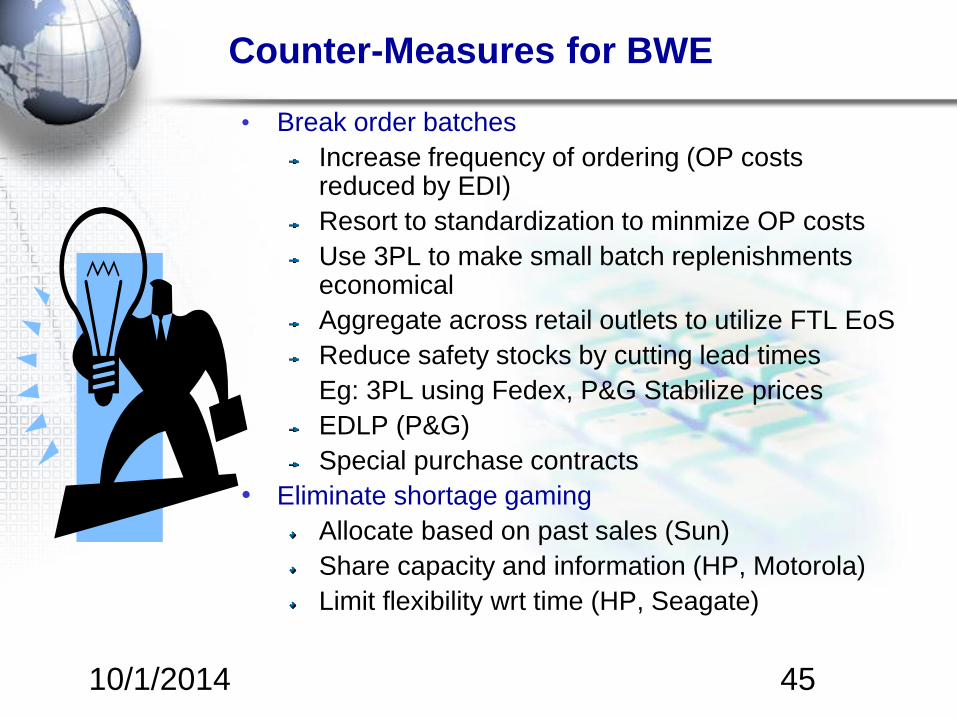
Counter-Measures for BWE
• Break order batches
Increase frequency of ordering (OP costs reduced by EDI)
Resort to standardization to minmize OP costs
Use 3PL to make small batch replenishments economical
Aggregate across retail outlets to utilize FTL EoS
Reduce safety stocks by cutting lead times
Eg: 3PL using Fedex, P&G Stabilize prices
EDLP (P&G)
Special purchase contracts
• Eliminate shortage gaming
Allocate based on past sales (Sun)
Share capacity and information (HP, Motorola)
Limit flexibility wrt time (HP, Seagate)
10/1/2014 45

ERP for Organizational Value Chain
− Stream of activities
− Applies to both products and services
Pro
fit
Marg
in
Support:
Primary:
Infrastructure, HR, R&D, Procurement
Inbound
logistics Operations
Outbound
logistics
Marketing
& Sales Service

Push/Pull Strategies
Hig
h
Low
Low High
Economies of scale
De
ma
nd
of u
nce
rta
inty
Pull
Push
Pull Push
• Customization is High
• Demand is uncertain
• Scale economies are
Low
• E.g., Computer
Peripherals
• Demand is uncertain
• Scale economies are
High
• Low economies of scale
• E.g., Furniture
• Uncertainty is low
• Low economies of scale
• Push-pull supply chain
• E.g., Stationeries
(Books, Pens, CDs)
• Standard processes are
the norm
• Demand is stable
• Scale economies are High
• E.g., Vegetables, Soft
drinks
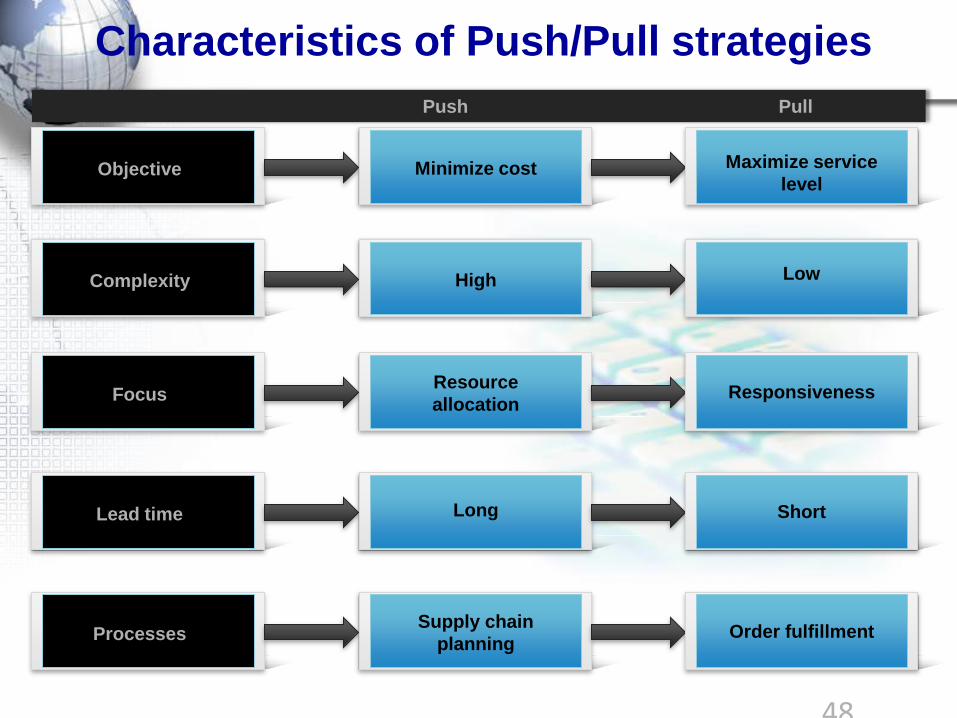
Characteristics of Push/Pull strategies
48
Push Pull
Objective Minimize cost Maximize service
level
Complexity High Low
Focus Resource
allocation Responsiveness
Lead time Long Short
Processes Supply chain
planning Order fulfillment
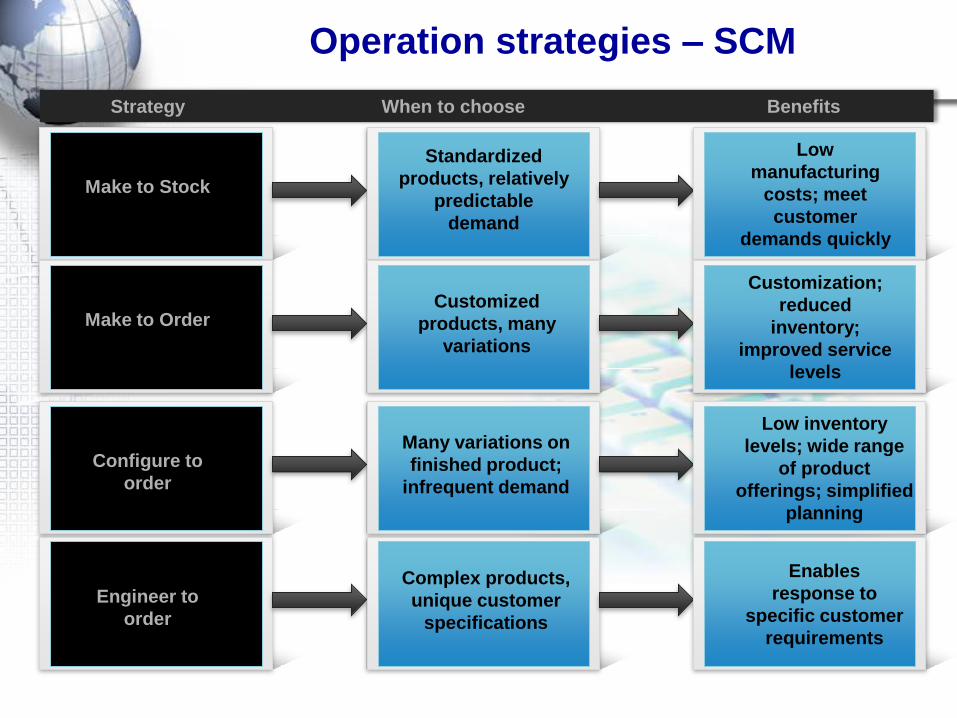
Operation strategies – SCM
Strategy When to choose Benefits
Make to Stock
Standardized
products, relatively
predictable
demand
Low
manufacturing
costs; meet
customer
demands quickly
Make to Order Customized
products, many
variations
Customization;
reduced
inventory;
improved service
levels
Configure to
order
Many variations on
finished product;
infrequent demand
Low inventory
levels; wide range
of product
offerings; simplified
planning
Engineer to
order
Complex products,
unique customer
specifications
Enables
response to
specific customer
requirements
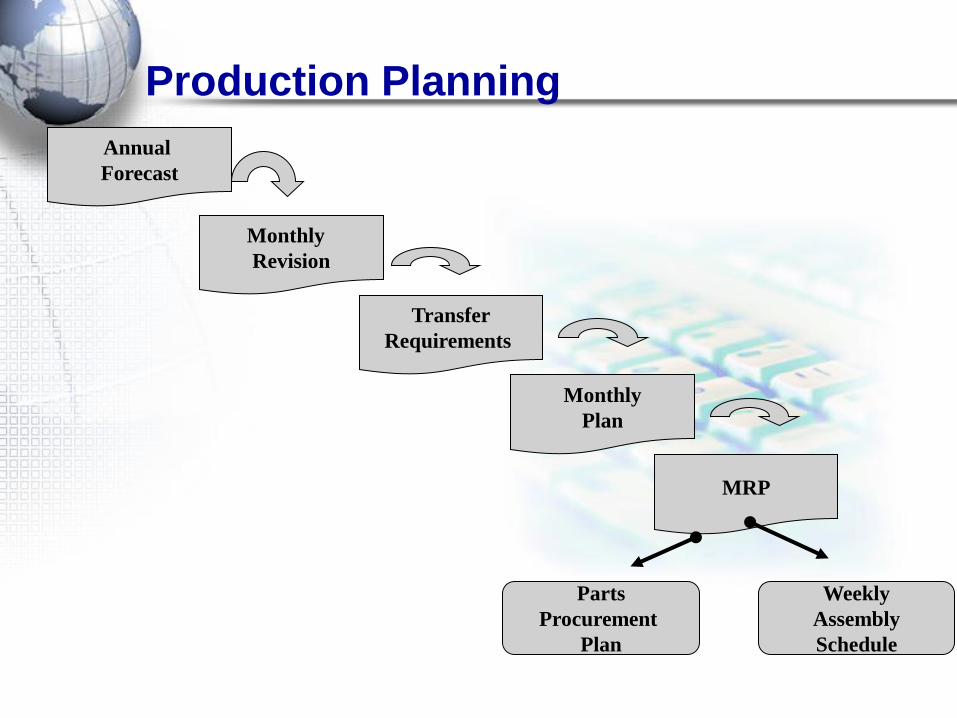
Production Planning
Annual
Forecast
Monthly
Revision
Transfer
Requirements
Monthly
Plan
MRP
Parts
Procurement
Plan
Weekly
Assembly
Schedule

Production Planning
Parts Inventory Assembly Bulk Inventory Packaging &
Sterilization FG inventory
Monthly
Plan
MRP
Material
Plan Order point;
Order quantity
What’s Wrong?
• Poor service for new product introductions
• Poor forecasting?
• Panic ordering?
• And high FG inventory

What Is Going On?
• Demand is quite predictable
• Usage in hospitals is quite stable
• Market share moves slowly over time
• With each new product, dealer must build inventory
to fill pipeline

What to Do?
• Recognize that demand is stable and predictable
• Establish accountability for forecast
• Eliminate planning delays and/or reduce time
bucket
• Alternatively, put assembly within pull system and
eliminate bulk inventory

Business Process Management
Visibility
Analytics
15
Inbound Mfg
10
Distributor
100
Customer
5
Business Activity Monitoring
Optimization
The Five Most Important Capabilities in
SCM
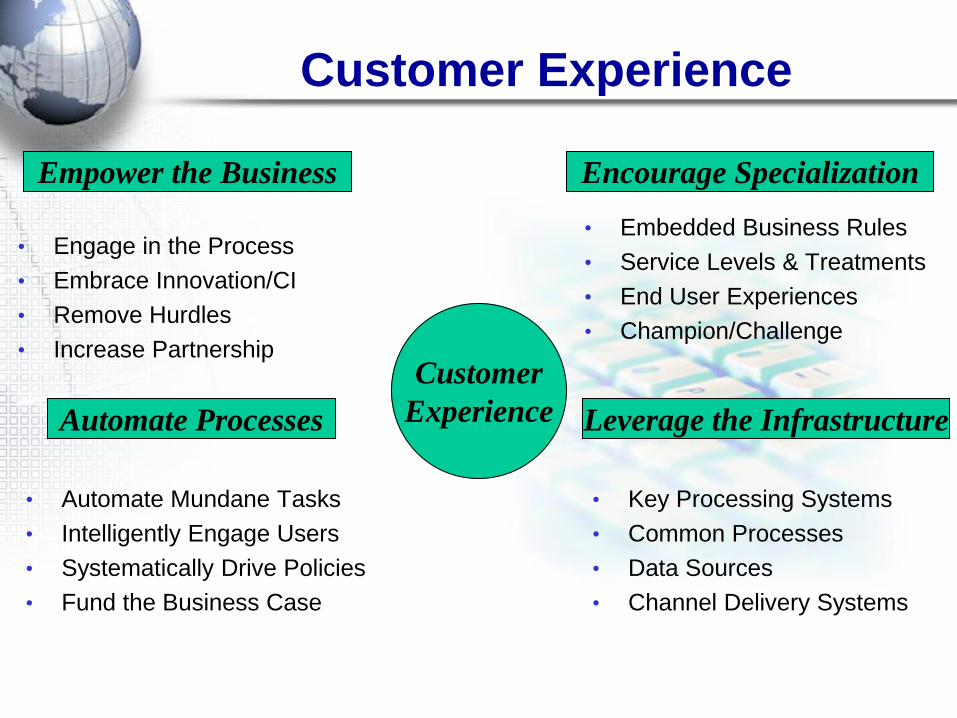
Customer Experience
• Engage in the Process
• Embrace Innovation/CI
• Remove Hurdles
• Increase Partnership
• Embedded Business Rules
• Service Levels & Treatments
• End User Experiences
• Champion/Challenge
• Automate Mundane Tasks
• Intelligently Engage Users
• Systematically Drive Policies
• Fund the Business Case
• Key Processing Systems
• Common Processes
• Data Sources
• Channel Delivery Systems
Empower the Business Encourage Specialization
Automate Processes Leverage the Infrastructure
Customer
Experience
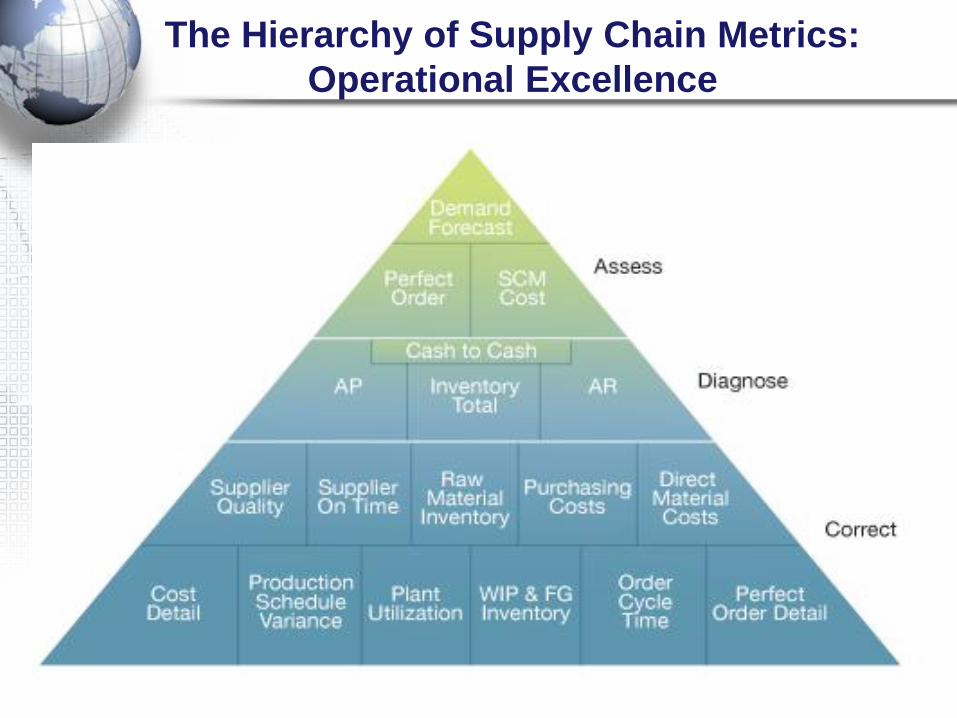
The Hierarchy of Supply Chain Metrics:
Operational Excellence
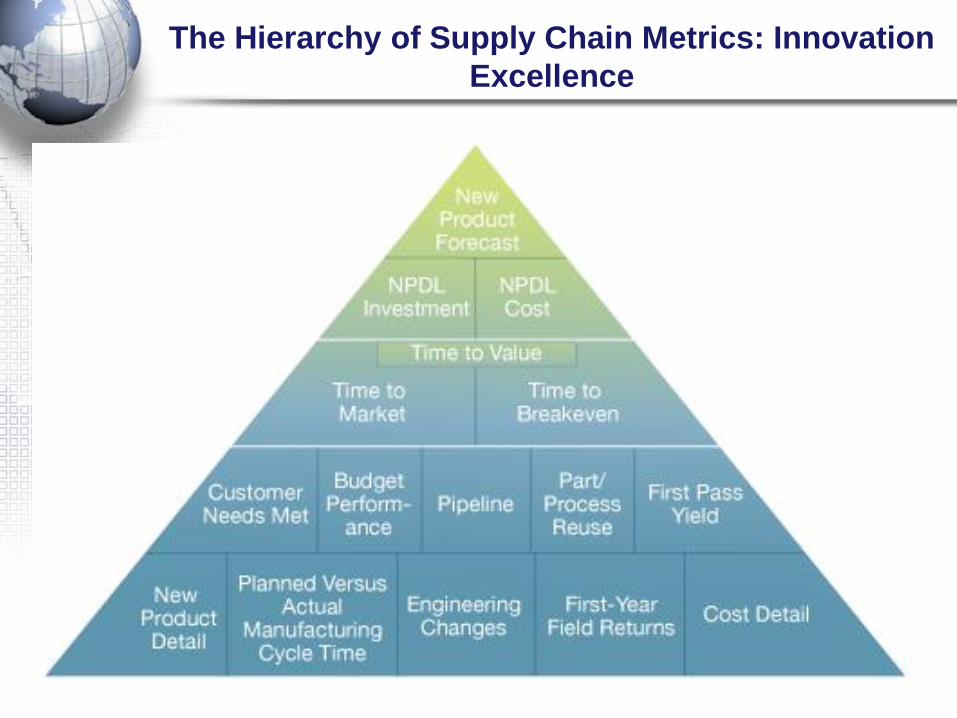
The Hierarchy of Supply Chain Metrics: Innovation
Excellence

Supply Chain Performance Measures
Source/Make Cycle
Time
The cumulative time to build a shippable product from scratch—if you start with
no inventory on hand or on order. Consists of total sourcing lead time, release-to-
start build, total build cycle time, and complete build-to-ship time
Customer Inquiry
Response Time
The average elapsed time between receipt of a customer call and connection with
the appropriate company representative
Customer Inquiry
Resolution Time
The average elapsed time required to completely resolve a customer inquiry
Order Fulfillment
Cycle Time
The average actual lead times consistently achieved, in calendar days, from
customer order to customer delivery. Includes, order authorization to entry, entry
to release, release to shippable, shippable to customer receipt, and receipt to
customer acceptance
On-Shelf In-Stock
Percentage
The percentage of time that a product is available on the shelf, rack, or wherever
the customer expects to find and buy it. Measures the supply chain’s ultimate
ability to satisfy the end customer
Value-Added
Productivity
Total company revenues generated less the value of externally sourced materials
expressed as a ratio of total company headcount
10/1/2014 59
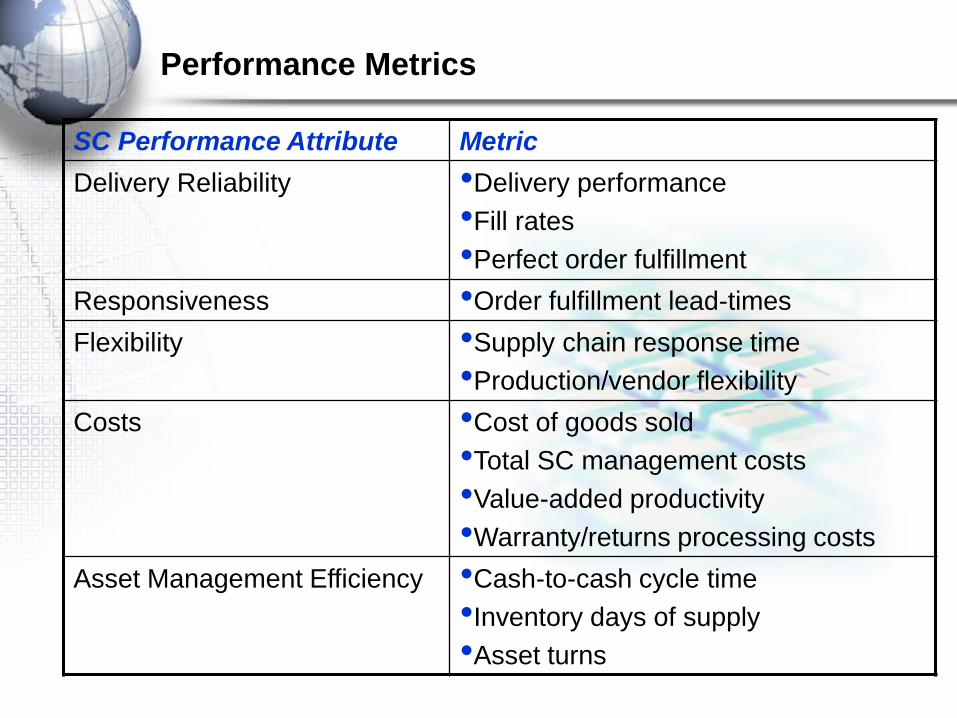
Performance Metrics
SC Performance Attribute Metric
Delivery Reliability •Delivery performance
•Fill rates
•Perfect order fulfillment
Responsiveness •Order fulfillment lead-times
Flexibility •Supply chain response time
•Production/vendor flexibility
Costs •Cost of goods sold
•Total SC management costs
•Value-added productivity
•Warranty/returns processing costs
Asset Management Efficiency •Cash-to-cash cycle time
•Inventory days of supply
•Asset turns

Supply Chain Performance Measures
SC Inventory
Days of Supply
Total number of days of inventory required to support the supply chain—
from raw materials to the final customer acquisition. Expressed as
calendar days of supply based on recent actual daily cost of sales
Supply-Chain
Response Time
The theoretical number of days required to recognize a major shift in
market demand and increase production by 20 percent
Total Supply
Chain Cost
The sum of all the costs incurred in planning, designing, sourcing,
making, and delivering a product broken down for each member of the
supply chain
Cash-to-Cash
Cycle Time
The time required to convert a dollar spent to acquire raw materials into
a dollar collected for finished product. (Total Inventory Days of Supply +
Days Sales Outstanding – Days Payables Outstanding).
Perfect Order
Fulfillment
A perfect order is an order that is delivered complete, on time, in perfect
condition, and with accurate and complete documentation. Fulfillment is
the percent of orders that are perfect (Perfect orders/Total orders).
Inventory Dwell
Time
The ratio of days inventory sits idle to days inventory is being
productively used or positioned 10/1/2014 61
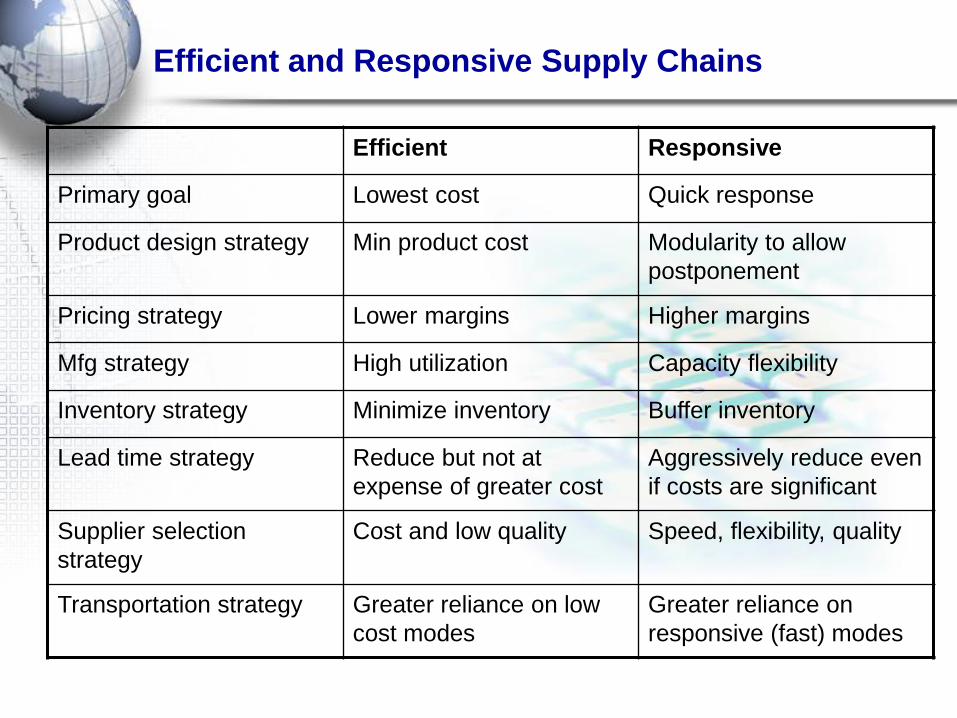
Efficient and Responsive Supply Chains
Efficient Responsive
Primary goal Lowest cost Quick response
Product design strategy Min product cost Modularity to allow
postponement
Pricing strategy Lower margins Higher margins
Mfg strategy High utilization Capacity flexibility
Inventory strategy Minimize inventory Buffer inventory
Lead time strategy Reduce but not at
expense of greater cost
Aggressively reduce even
if costs are significant
Supplier selection
strategy
Cost and low quality Speed, flexibility, quality
Transportation strategy Greater reliance on low
cost modes
Greater reliance on
responsive (fast) modes

Summary
• Increased outsourcing network of suppliers Brand owning companies
• Efficiency vs. Responsiveness
• Agile Supply Chain Measurement -Production Flexibility
– Upside Flexibility
– Downside Flexibility
• Decision making speed must also be increased
– Implement collaborative supply chain solutions
• Supply chain centric private exchanges enable more agile supply chains
– Participate in private exchanges ASAP or develop your own

Supply Chain Top 10 Companies
Source: Gartner (2010)