bbva 1q16 results
TRANSCRIPT

1Q Results BBVAResults Results Presentation
2016
1Q16 Results
Carlos Torres Vila Chief Executive Officer Madrid, April 28th 2016
April 28th 2016
3 2016 First Quarter Results
This document is only provided for information purposes and does not constitute, nor should it be interpreted as, an offer to sell or exchange or acquire,
or an invitation for offers to buy securities issued by any of the aforementioned companies. Any decision to buy or invest in securities in relation to a
specific issue must be made solely and exclusively on the basis of the information set out in the pertinent prospectus filed by the company in relation to
such specific issue. No one who becomes aware of the information contained in this report should regard it as definitive, because it is subject to changes
and modifications.
This document contains or may contain forward looking statements (in the usual meaning and within the meaning of the US Private Securities Litigation
Reform Act of 1995) regarding intentions, expectations or projections of BBVA or of its management on the date thereof, that refer to or incorporate
various assumptions and projections, including projections about the future earnings of the business. The statements contained herein are based on our
current projections, but the actual results may be substantially modified in the future by various risks and other factors that may cause the results or final
decisions to differ from such intentions, projections or estimates. These factors include, without limitation, (1) the market situation, macroeconomic
factors, regulatory, political or government guidelines, (2) domestic and international stock market movements, exchange rates and interest rates, (3)
competitive pressures, (4) technological changes, (5) alterations in the financial situation, creditworthiness or solvency of our customers, debtors or
counterparts. These factors could cause or result in actual events differing from the information and intentions stated, projected or forecast in this
document or in other past or future documents. BBVA does not undertake to publicly revise the contents of this or any other document, either if the
events are not as described herein, or if such events lead to changes in the information contained in this document.
This document may contain summarised information or information that has not been audited, and its recipients are invited to consult the
documentation and public information filed by BBVA with stock market supervisory bodies, in particular, the prospectuses and periodical information filed
with the Spanish Securities Exchange Commission (CNMV) and the Annual Report on Form 20-F and information on Form 6-K that are filed with the US
Securities and Exchange Commission.
Distribution of this document in other jurisdictions may be prohibited, and recipients into whose possession this document comes shall be solely
responsible for informing themselves about, and observing any such restrictions. By accepting this document you agree to be bound by the foregoing
restrictions.
April 28th 2016
4 2016 First Quarter Results
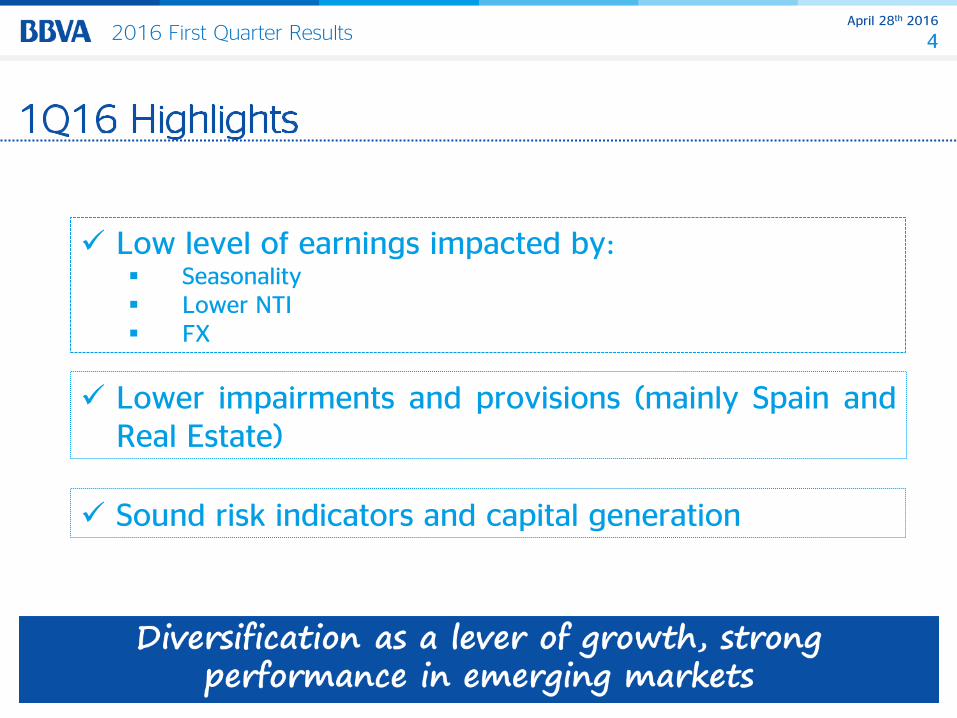
Low level of earnings impacted by: Seasonality Lower NTI FX
Lower impairments and provisions (mainly Spain and Real Estate)
Sound risk indicators and capital generation
April 28th 2016
5 2016 First Quarter Results
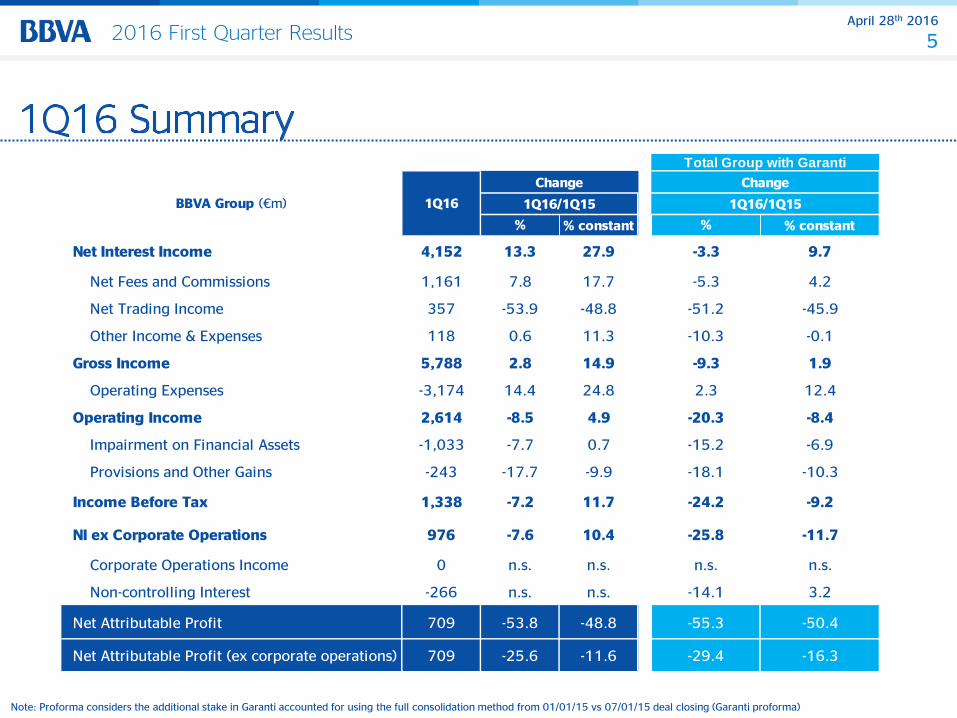
% constant % constant
7.8 17.7
-18.1 -10.3-243 -17.7 -9.9Provisions and Other Gains
-15.2 -6.9-7.7 0.7-1,033Impairment on Financial Assets
-10.3 -0.10.6 11.3118Other Income & Expenses
-51.2 -45.9-53.9 -48.8357Net Trading Income
-5.3 4.21,161Net Fees and Commissions
BBVA Group (€m) 1Q16
Change
1Q16/1Q15
13.3 27.9
%
Net Interest Income 4,152
5,788 2.8Gross Income 14.9
Operating Expenses
Operating Income 2,614
14.4 24.8
-8.5 4.9
-3,174
1,338Income Before Tax -7.2 11.7
NI ex Corporate Operations -7.6 10.4976
0Corporate Operations Income n.s. n.s.
Net Attributable Profit -53.8 -48.8709
Net Attributable Profit (ex corporate operations) -25.6 -11.6709
Change
1Q16/1Q15
%
Total Group with Garanti
-3.3 9.7
-9.3 1.9
2.3 12.4
-20.3 -8.4
-24.2 -9.2
-25.8 -11.7
n.s. n.s.
-55.3 -50.4
-29.4 -16.3
Non-controlling Interest -266 n.s. n.s. -14.1 3.2
Note: Proforma considers the additional stake in Garanti accounted for using the full consolidation method from 01/01/15 vs 07/01/15 deal closing (Garanti proforma)
April 28th 2016
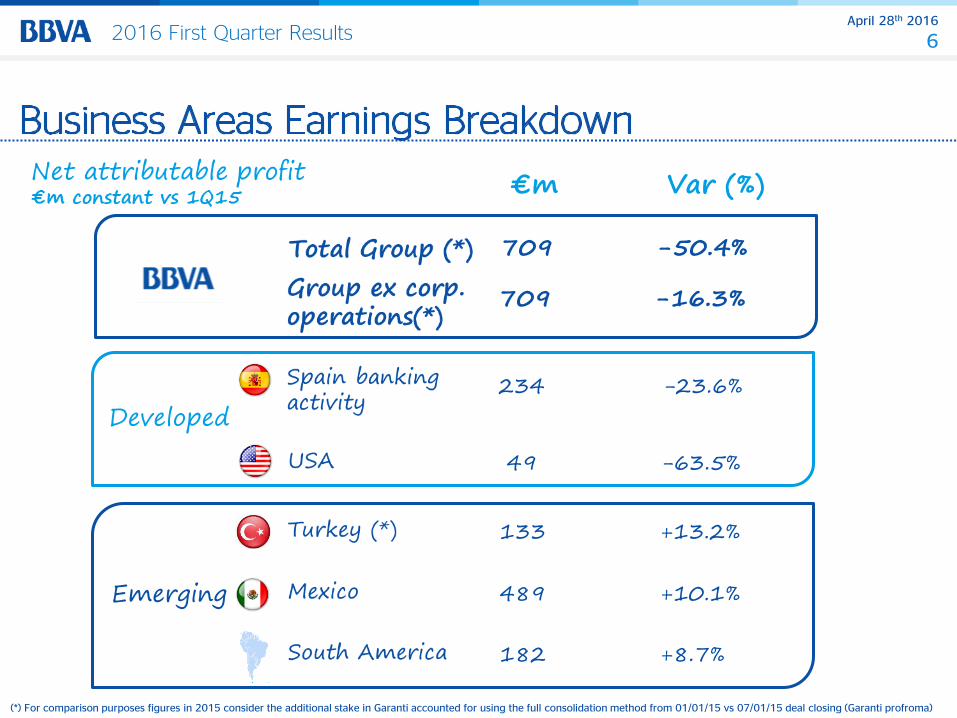
6 2016 First Quarter Results
(*) For comparison purposes figures in 2015 consider the additional stake in Garanti accounted for using the full consolidation method from 01/01/15 vs 07/01/15 deal closing (Garanti profroma)
-23.6%
-63.5%
+13.2%
+10.1%
+8.7%
Emerging
Developed
-16.3%
-50.4%
234
49
133
489
182
709
709
Var (%) €m
April 28th 2016
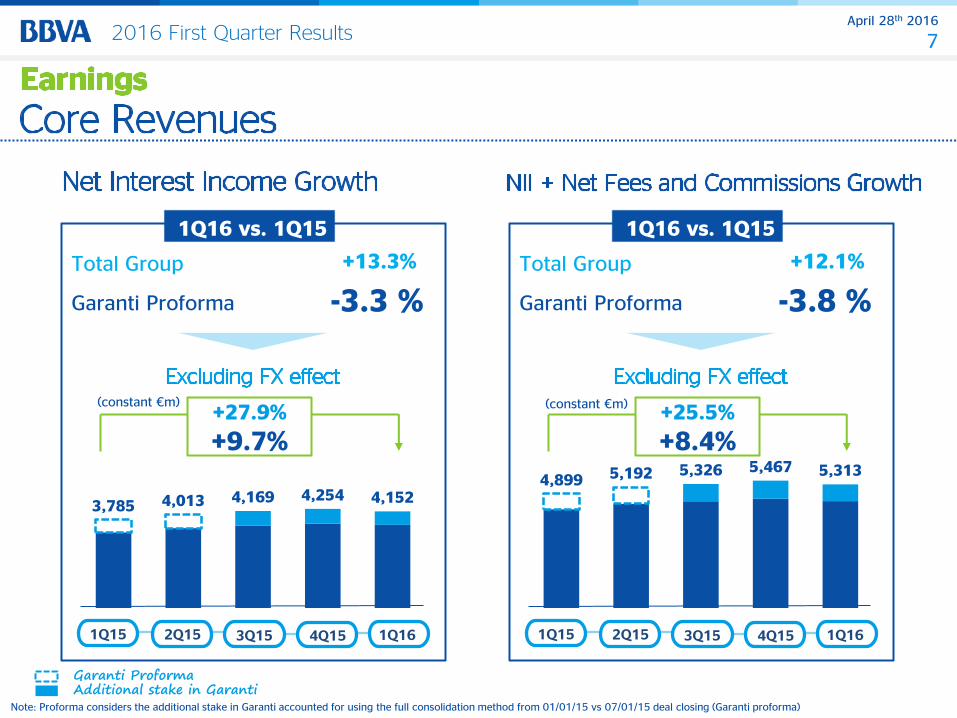
7 2016 First Quarter Results
3,785 4,013 4,169 4,254 4,152
1Q15 2Q15 3Q15 4Q15 1Q16
+27.9%
+9.7%
+13.3%
1Q16 vs. 1Q15
Total Group
Garanti Proforma -3.3 %
(constant €m)
Additional stake in Garanti Garanti Proforma
4,899 5,192 5,326 5,467 5,313
1Q15 2Q15 3Q15 4Q15 1Q16
+25.5%
+8.4%
+12.1%
1Q16 vs. 1Q15
Total Group
Garanti Proforma -3.8 %
(constant €m)
Note: Proforma considers the additional stake in Garanti accounted for using the full consolidation method from 01/01/15 vs 07/01/15 deal closing (Garanti proforma)
April 28th 2016
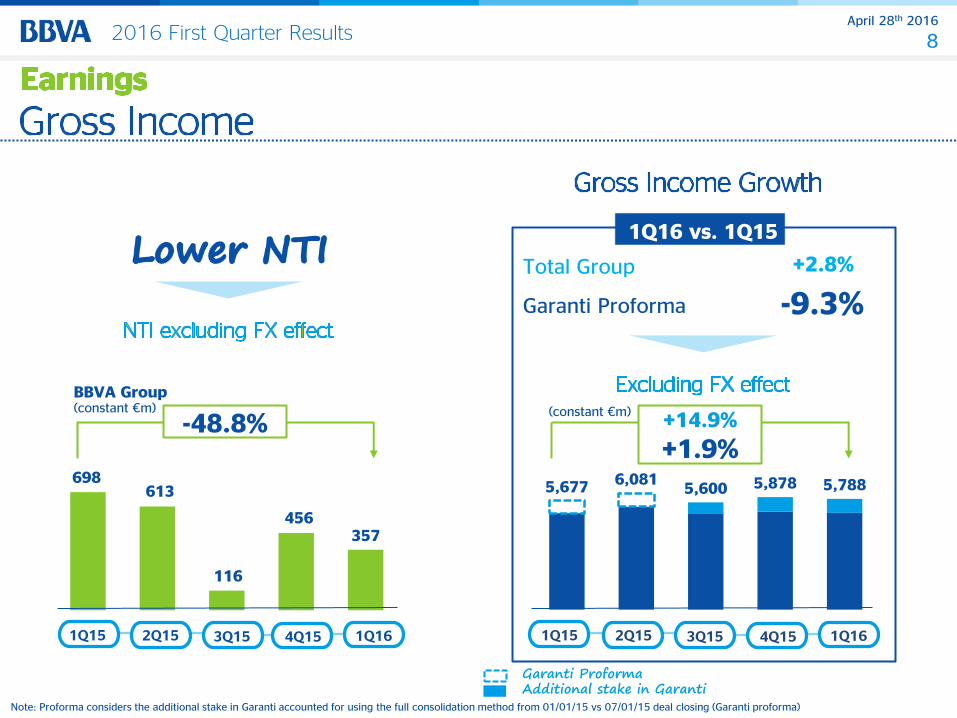
8 2016 First Quarter Results
5,677 6,081 5,600 5,878 5,788
Additional stake in Garanti Garanti Proforma
1Q15 2Q15 3Q15 4Q15 1Q16
+14.9%
+1.9%
1Q16 vs. 1Q15
+2.8% Total Group
Garanti Proforma -9.3%
(constant €m)
698 613
116
456 357
1Q15 2Q15 3Q15 4Q15 1Q16
-48.8%
BBVA Group (constant €m)
Note: Proforma considers the additional stake in Garanti accounted for using the full consolidation method from 01/01/15 vs 07/01/15 deal closing (Garanti proforma)
April 28th 2016
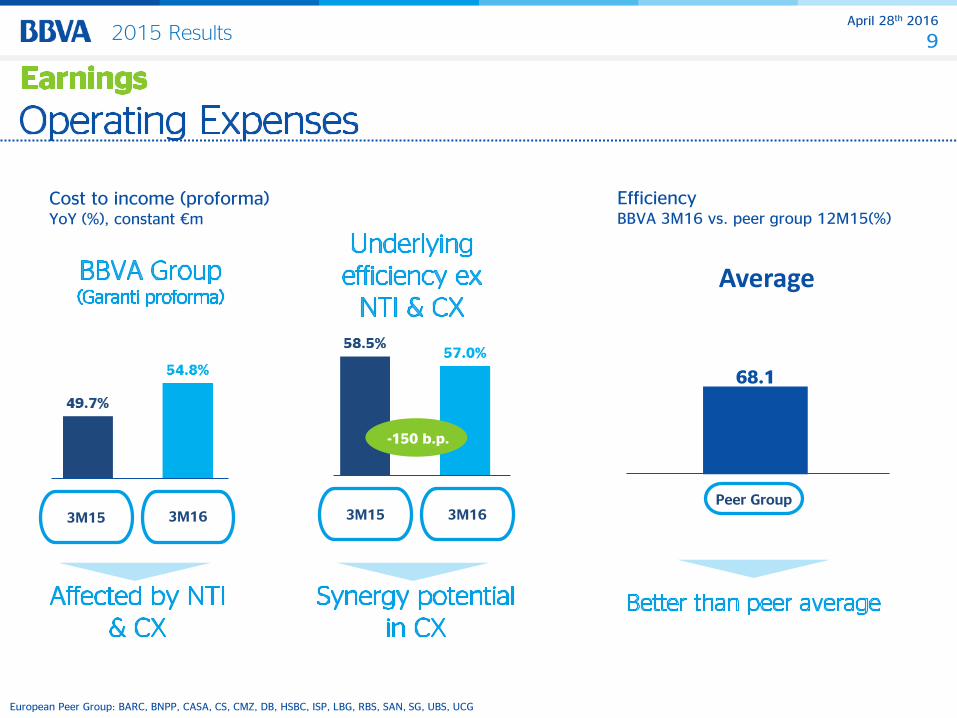
9 2015 Results
68.1
Average
Efficiency BBVA 3M16 vs. peer group 12M15(%)
Cost to income (proforma) YoY (%), constant €m
3M15
European Peer Group: BARC, BNPP, CASA, CS, CMZ, DB, HSBC, ISP, LBG, RBS, SAN, SG, UBS, UCG
Peer Group 3M16 3M15 3M16
-150 b.p.
April 28th 2016
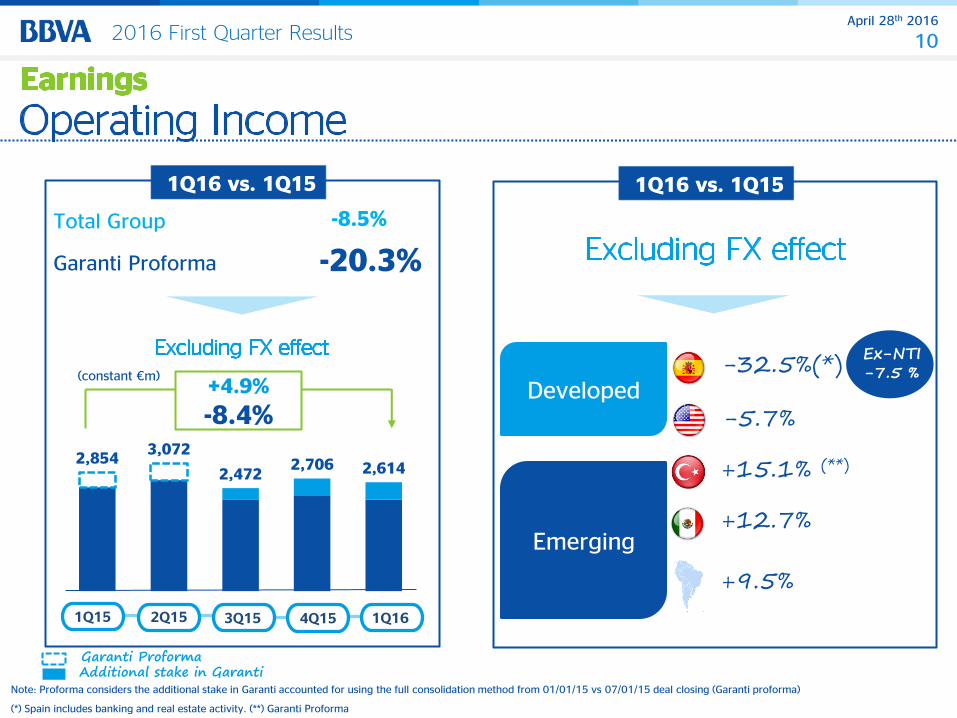
10 2016 First Quarter Results
2,854 3,072
2,472 2,706 2,614
1Q15 2Q15 3Q15 4Q15 1Q16
+4.9%
-8.4%
1Q16 vs. 1Q15
-8.5% Total Group
Garanti Proforma -20.3%
(constant €m)
Additional stake in Garanti Garanti Proforma
-32.5%(*)
-5.7%
+15.1% (**)
+12.7%
+9.5%
1Q16 vs. 1Q15
Note: Proforma considers the additional stake in Garanti accounted for using the full consolidation method from 01/01/15 vs 07/01/15 deal closing (Garanti proforma)
(*) Spain includes banking and real estate activity. (**) Garanti Proforma
Emerging
Developed
Ex-NTI -7.5 %
April 28th 2016
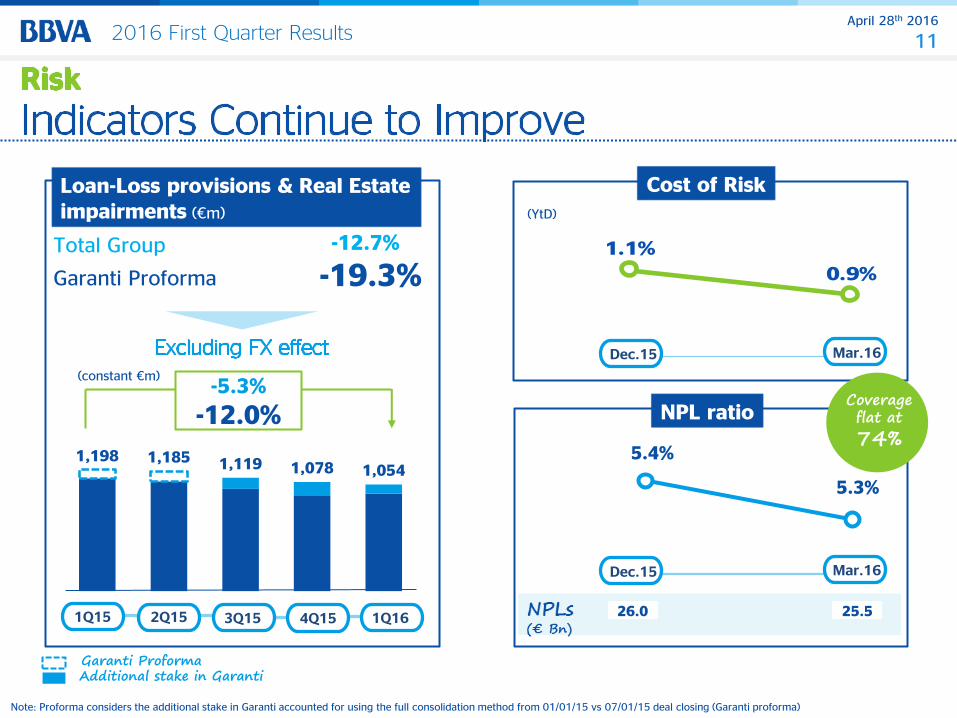
11 2016 First Quarter Results
1.1%
0.9%
1,198 1,185 1,119 1,078 1,054
1Q15 2Q15 3Q15 4Q15 1Q16
-5.3%
-12.0%
-12.7% Total Group
Garanti Proforma -19.3%
(constant €m)
Additional stake in Garanti Garanti Proforma
Cost of Risk
Dec.15 Mar.16
Loan-Loss provisions & Real Estate impairments (€m)
NPL ratio
5.4%
5.3%
26.0 25.5
Dec.15 Mar.16
Coverage flat at
74%
Note: Proforma considers the additional stake in Garanti accounted for using the full consolidation method from 01/01/15 vs 07/01/15 deal closing (Garanti proforma)
(YtD)
April 28th 2016
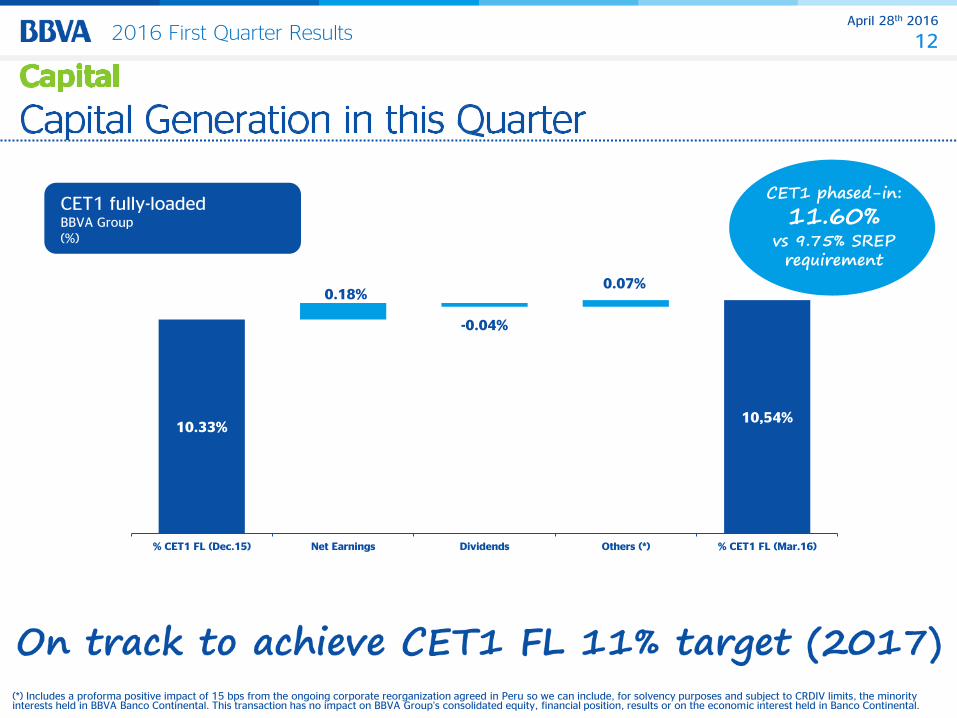
12 2016 First Quarter Results
10.33% 10,54%
0.18%
-0.04%
0.07%
% CET1 FL (Dec.15) Net Earnings Dividends Others (*) % CET1 FL (Mar.16)
(*) Includes a proforma positive impact of 15 bps from the ongoing corporate reorganization agreed in Peru so we can include, for solvency purposes and subject to CRDIV limits, the minority interests held in BBVA Banco Continental. This transaction has no impact on BBVA Group’s consolidated equity, financial position, results or on the economic interest held in Banco Continental.
CET1 fully-loaded BBVA Group (%)
CET1 phased-in:
11.60% vs 9.75% SREP requirement
April 28th 2016
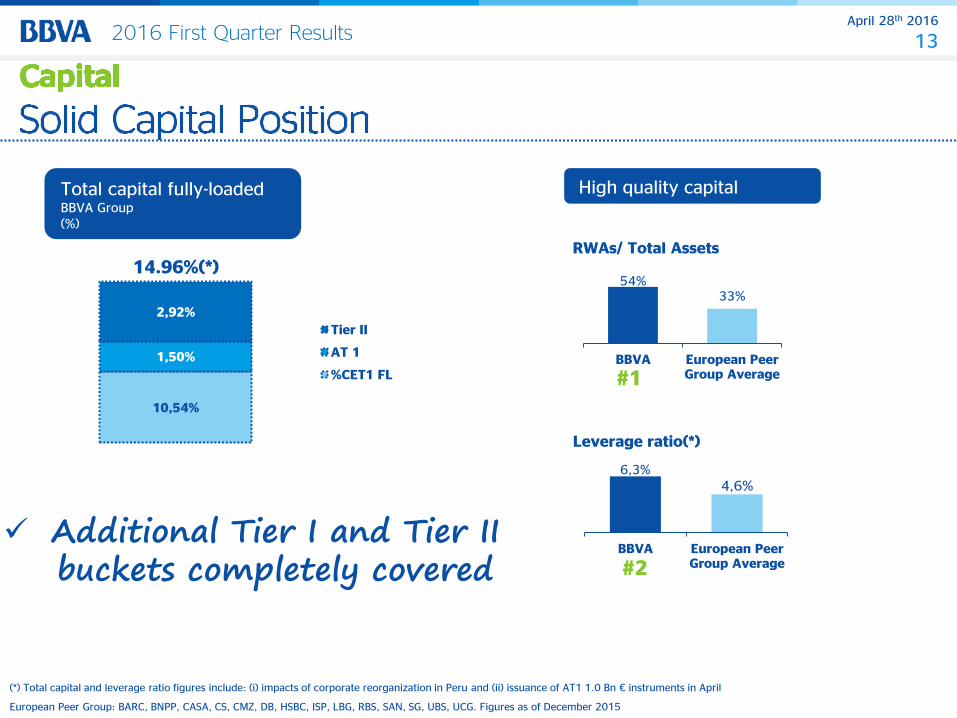
13 2016 First Quarter Results
(*) Total capital and leverage ratio figures include: (i) impacts of corporate reorganization in Peru and (ii) issuance of AT1 1.0 Bn € instruments in April
European Peer Group: BARC, BNPP, CASA, CS, CMZ, DB, HSBC, ISP, LBG, RBS, SAN, SG, UBS, UCG. Figures as of December 2015
Total capital fully-loaded BBVA Group (%)
10,54%
1,50%
2,92%
Tier II
AT 1
%CET1 FL
14.96%(*) 54%
33%
BBVA European PeerGroup Average
6,3% 4,6%
BBVA European PeerGroup Average#2
#1
RWAs/ Total Assets
Leverage ratio(*)
High quality capital
Additional Tier I and Tier II buckets completely covered
April 28th 2016
14 2016 First Quarter Results
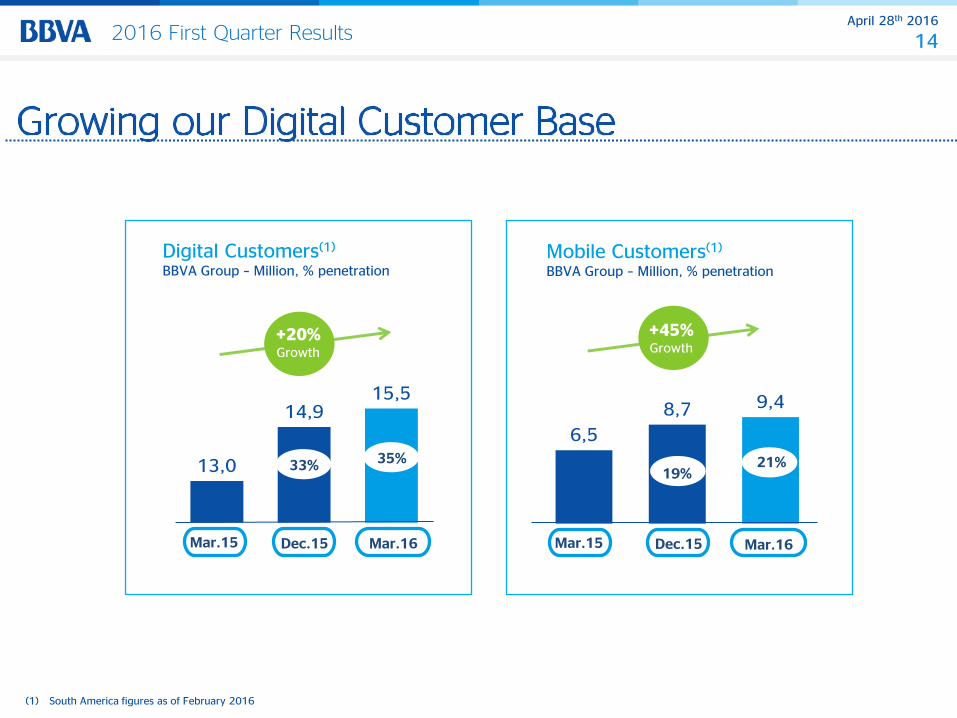
(1) South America figures as of February 2016
13,0
14,9 15,5
Digital Customers(1) BBVA Group – Million, % penetration
6,5
8,7 9,4
Mobile Customers(1) BBVA Group – Million, % penetration
Mar.15 Dec.15
+20% Growth
Mar.15 Dec.15
33% 19%
Mar.16
35%
Mar.16
21%
+45% Growth
April 28th 2016
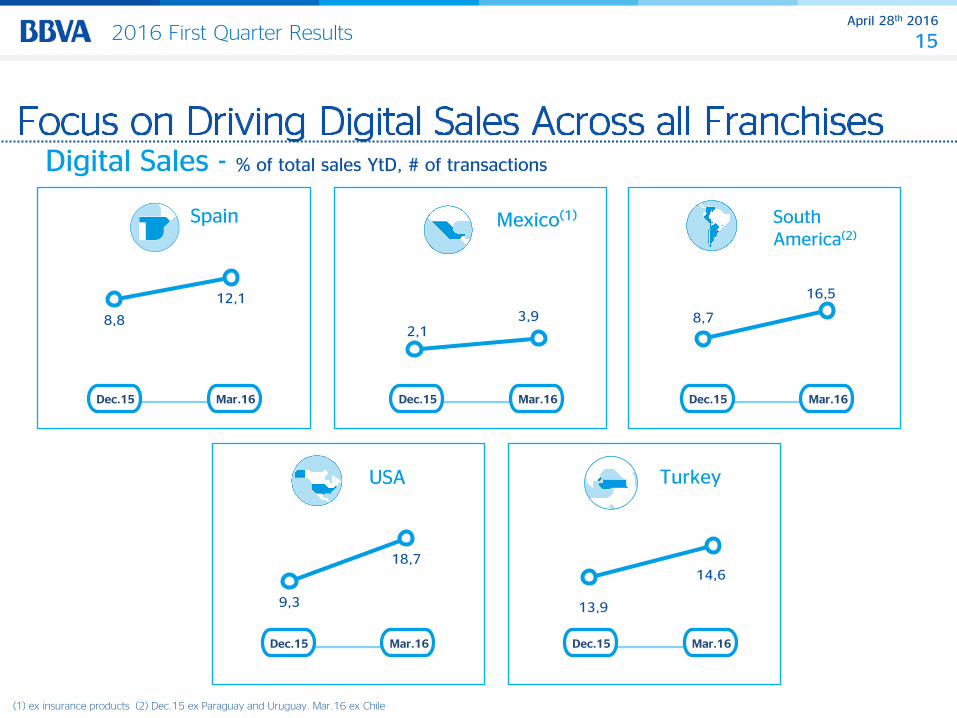
15 2016 First Quarter Results
8,8
12,1
Dec.15
2,1 3,9 8,7
16,5
Spain Mexico(1)
South America(2)
9,3
18,7
13,9
14,6
USA Turkey
Mar.16
Digital Sales - % of total sales YtD, # of transactions
Dec.15 Mar.16 Dec.15 Mar.16
Dec.15 Mar.16 Dec.15 Mar.16
(1) ex insurance products (2) Dec.15 ex Paraguay and Uruguay. Mar.16 ex Chile
April 28th 2016
16 2016 First Quarter Results
Business Areas
April 28th 2016
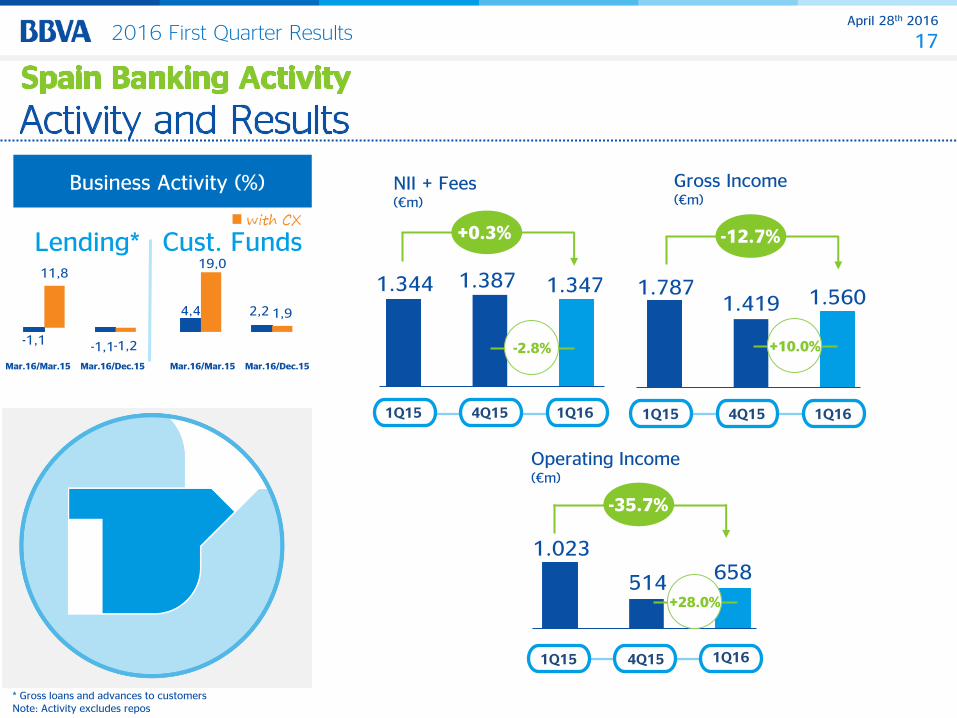
17 2016 First Quarter Results
1.023
514 658
1.344 1.387 1.347 1.787 1.419 1.560
Business Activity (%)
Lending* Cust. Funds
Gross Income (€m)
Operating Income (€m)
NII + Fees (€m)
1Q15 4Q15 1Q16
1Q15 4Q15 1Q16 1Q15 4Q15 1Q16
* Gross loans and advances to customers Note: Activity excludes repos
(%)
+0.3% -12.7%
-35.7%
-2.8%
+28.0%
+10.0% -1,1 -1,1
11,8
-1,2
Mar.16/Mar.15 Mar.16/Dec.15 Mar.16/Mar.15 Mar.16/Dec.15
4,4 2,2
19,0
1,9
April 28th 2016
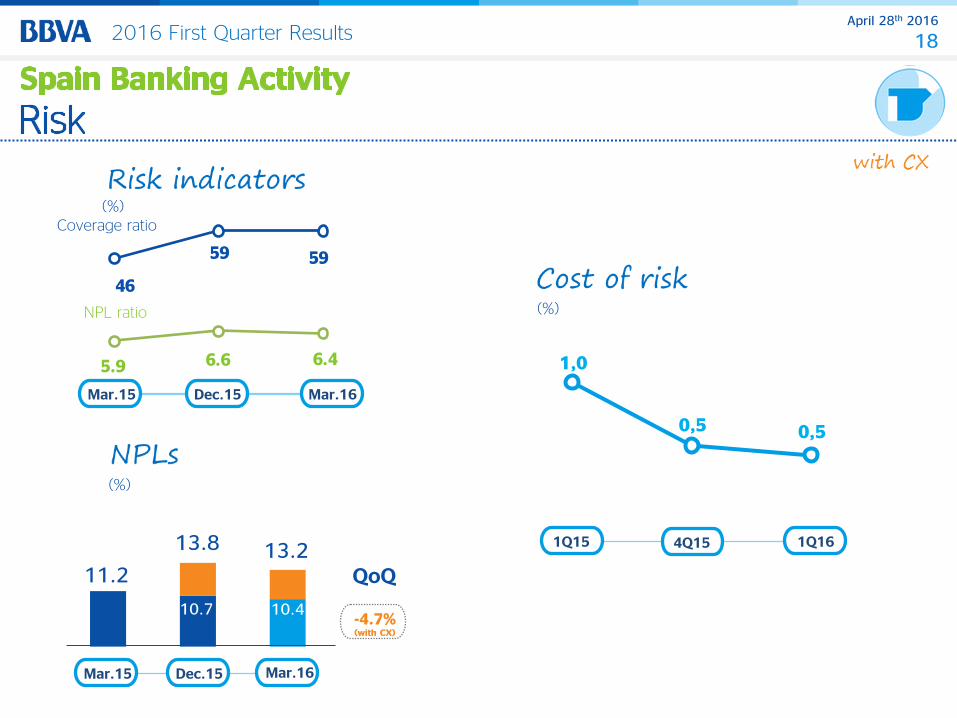
18 2016 First Quarter Results
46
59 59
5.9 6.6 6.4
11.2
10.7 10.4
13.2
NPL ratio
Coverage ratio
1,0
0,5 0,5
Mar.15 Dec.15 Mar.16
Mar.15 Dec.15 Mar.16
1Q15 1Q16 4Q15
13.8
-4.7% (with CX)
QoQ
(%)
(%)
(%)
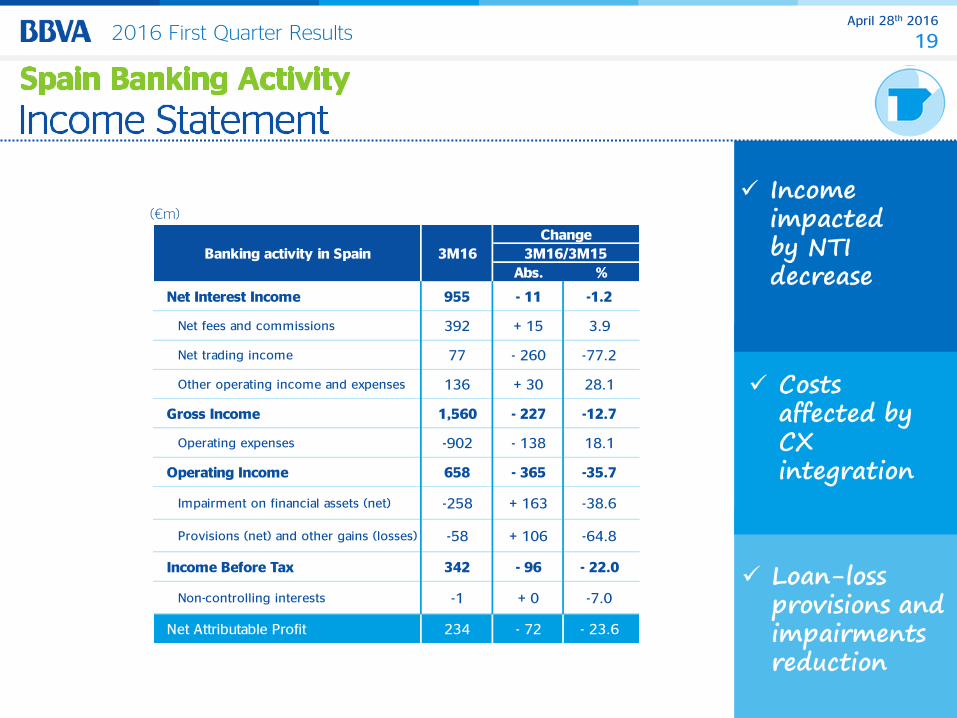
April 28th 2016
19 2016 First Quarter Results
Operating expenses -902 - 138 18.1
3M16/3M15
- 260 -77.2
- 22.0
Operating Income 658 - 365 -35.7
Gross Income 1,560 - 227 -12.7
Net Interest Income 955 - 11 -1.2
Abs. %
Banking activity in Spain
Income Before Tax 342 - 96
Change
3M16
Net Attributable Profit 234 - 72 - 23.6
Net fees and commissions
Net trading income
Other operating income and expenses
Impairment on financial assets (net)
Provisions (net) and other gains (losses)
Non-controlling interests -1 + 0 -7.0
-58 + 106
392 + 15 3.9
-38.6 -258 + 163
77
-64.8
136 + 30 28.1
(€m)
April 28th 2016
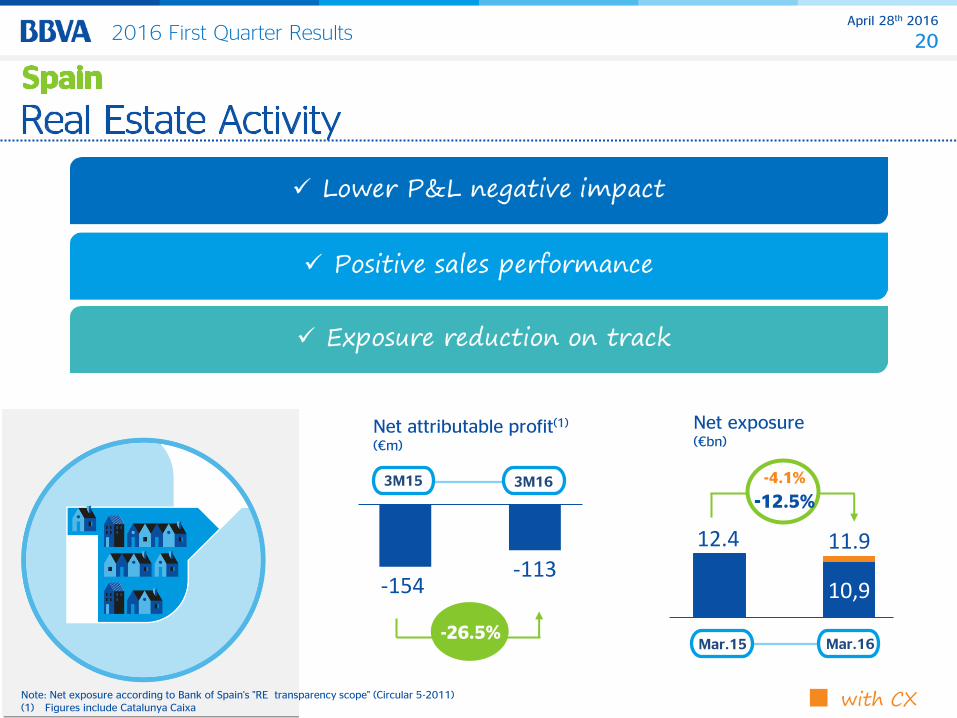
20 2016 First Quarter Results
-154 -113
Note: Net exposure according to Bank of Spain's "RE transparency scope" (Circular 5-2011) (1) Figures include Catalunya Caixa
with CX
3M15 3M16
-26.5%
Net attributable profit(1)
(€m)
12.4
10,9
11.9
Mar.15 Mar.16
Net exposure (€bn)
-4.1%
-12.5%
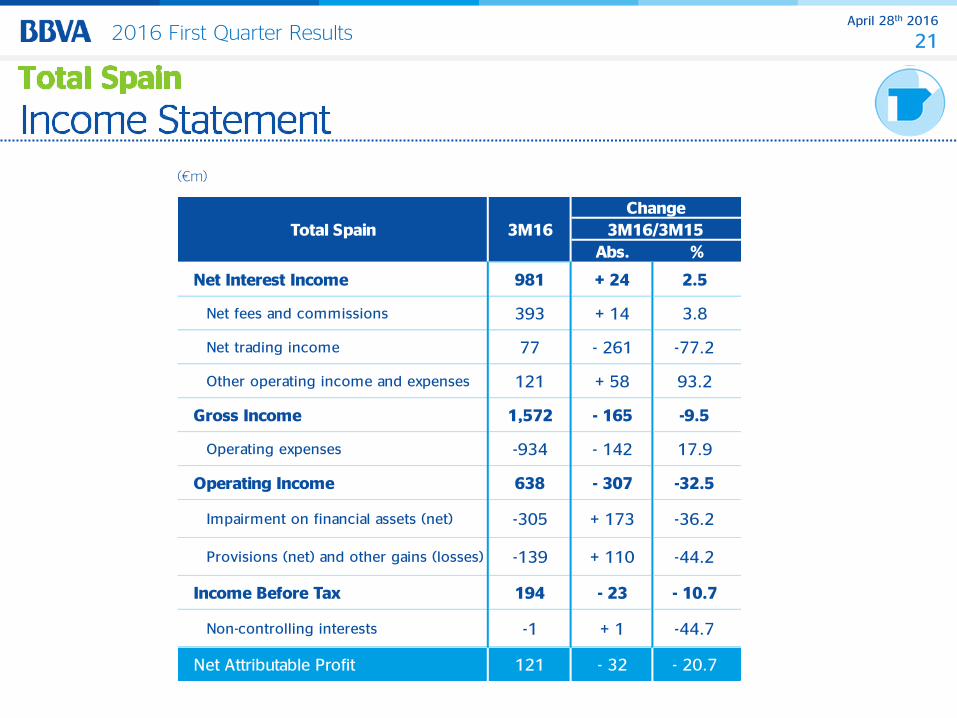
April 28th 2016
21 2016 First Quarter Results
(€m)
Change
3M16/3M15
Net Attributable Profit 121 - 32 - 20.7
Non-controlling interests -1 + 1 -44.7
Income Before Tax 194 - 23 - 10.7
Provisions (net) and other gains (losses) -139 + 110 -44.2
Impairment on financial assets (net) -305 + 173 -36.2
Operating Income 638 - 307 -32.5
Operating expenses -934 - 142 17.9
Gross Income 1,572 - 165 -9.5
Other operating income and expenses 121 + 58 93.2
Net trading income 77 - 261 -77.2
Net fees and commissions 393 + 14 3.8
Net Interest Income 981 + 24 2.5
Abs. %
Total Spain 3M16
April 28th 2016
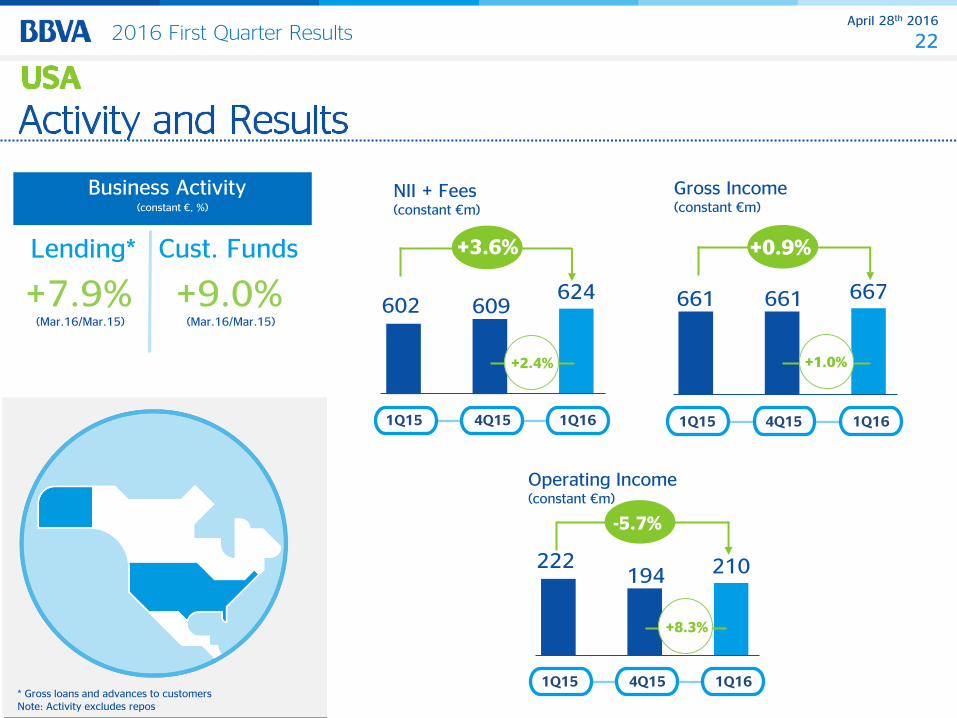
22 2016 First Quarter Results
Lending* Cust. Funds
602 609 624
1Q15 4Q15 1Q16
661 661 667
1Q15 4Q15 1Q16
Gross Income (constant €m)
222 194 210
1Q15 4Q15 1Q16
Operating Income (constant €m)
NII + Fees (constant €m)
* Gross loans and advances to customers Note: Activity excludes repos
+2.4%
+7.9% (Mar.16/Mar.15)
+9.0% (Mar.16/Mar.15)
Business Activity (constant €, %)
+1.0%
+8.3%
+3.6% +0.9%
-5.7%
April 28th 2016
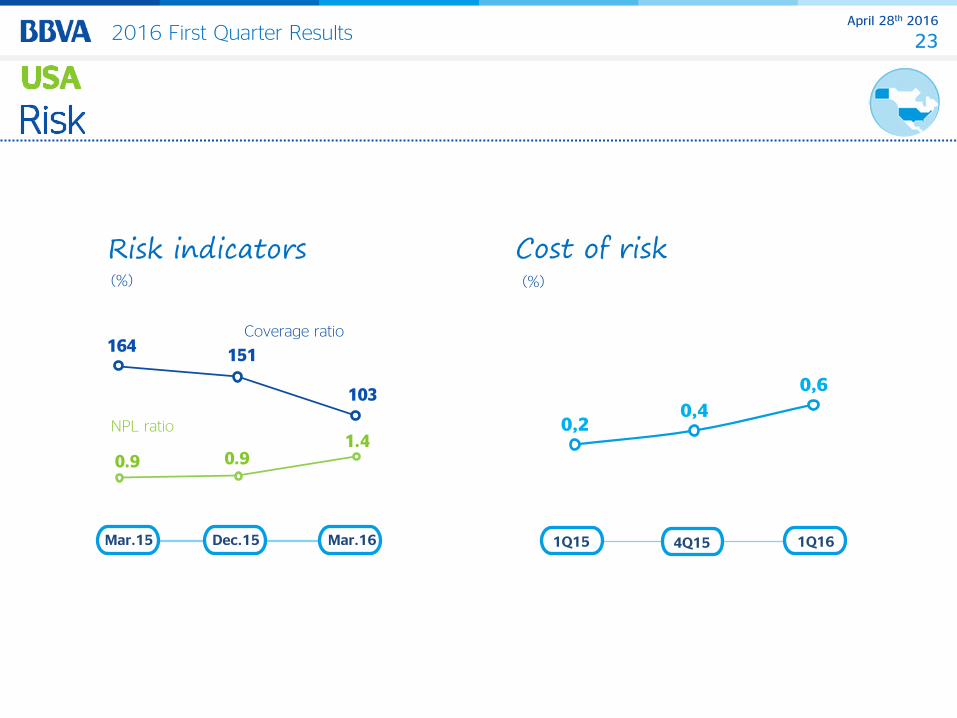
23 2016 First Quarter Results
164151
103
0.9 0.9 1.4
0,2 0,4
0,6
NPL ratio
Coverage ratio
Mar.15 Dec.15 Mar.16
(%)
1Q15 1Q16 4Q15
(%)
April 28th 2016
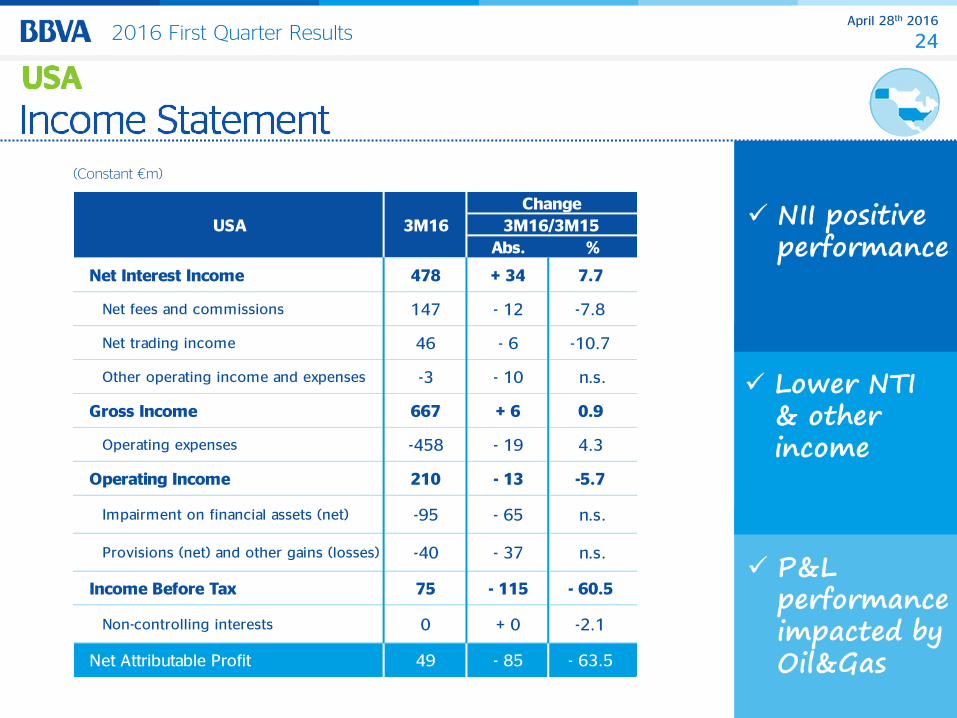
24 2016 First Quarter Results
Non-controlling interests 0 + 0 -2.1
Net Attributable Profit 49 - 85 - 63.5
Income Before Tax 75 - 115 - 60.5
Impairment on financial assets (net) -95 - 65 n.s.
Provisions (net) and other gains (losses) -40 - 37 n.s.
Operating Income 210 - 13 -5.7
Operating expenses -458 - 19 4.3
Gross Income 667 + 6 0.9
n.s.
Net trading income 46 - 6 -10.7
Other operating income and expenses -3 - 10
Net fees and commissions 147 - 12 -7.8
Net Interest Income 478 + 34 7.7
3M16/3M15
Abs. %
USA 3M16
Change
(Constant €m)
April 28th 2016
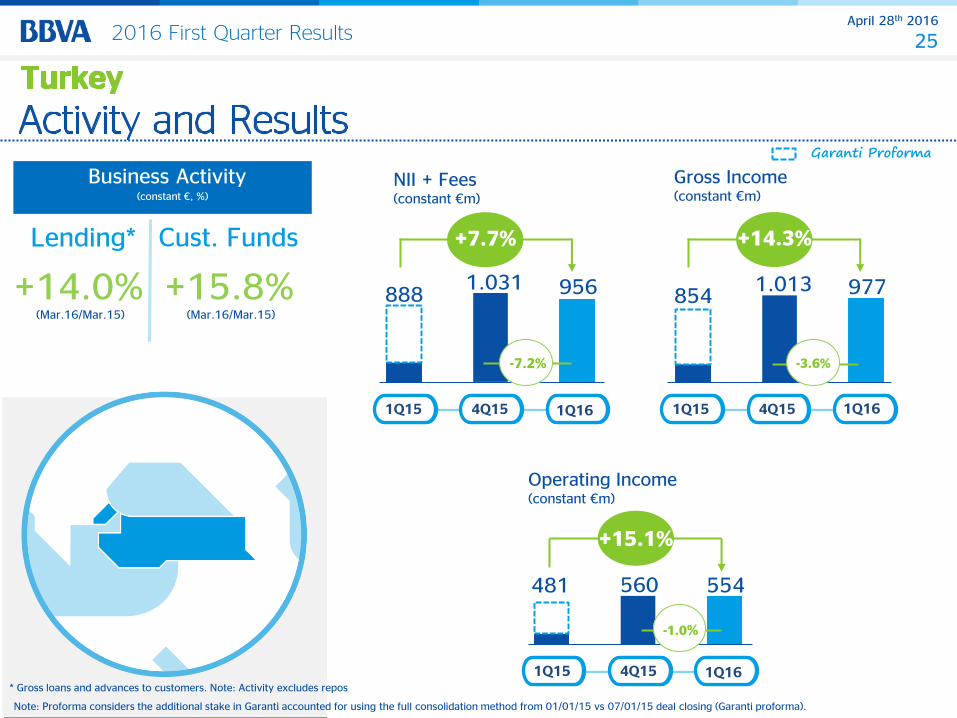
25 2016 First Quarter Results
888 1.031 956
481 560 554
854 1.013 977
Lending* Cust. Funds
3Q14 2Q15 3Q15
Gross Income (constant €m)
Operating Income (constant €m)
NII + Fees (constant €m)
Business Activity (constant €, %)
1Q15 4Q15 1Q16
-7.2%
3Q14 2Q15 1Q15 4Q15 1Q16
-3.6%
3Q14 2Q15 3Q15 1Q15 4Q15 1Q16
-1.0%
* Gross loans and advances to customers. Note: Activity excludes repos
+7.7% +14.3%
+15.1%
+14.0% (Mar.16/Mar.15)
+15.8% (Mar.16/Mar.15)
Garanti Proforma
Note: Proforma considers the additional stake in Garanti accounted for using the full consolidation method from 01/01/15 vs 07/01/15 deal closing (Garanti proforma).
April 28th 2016
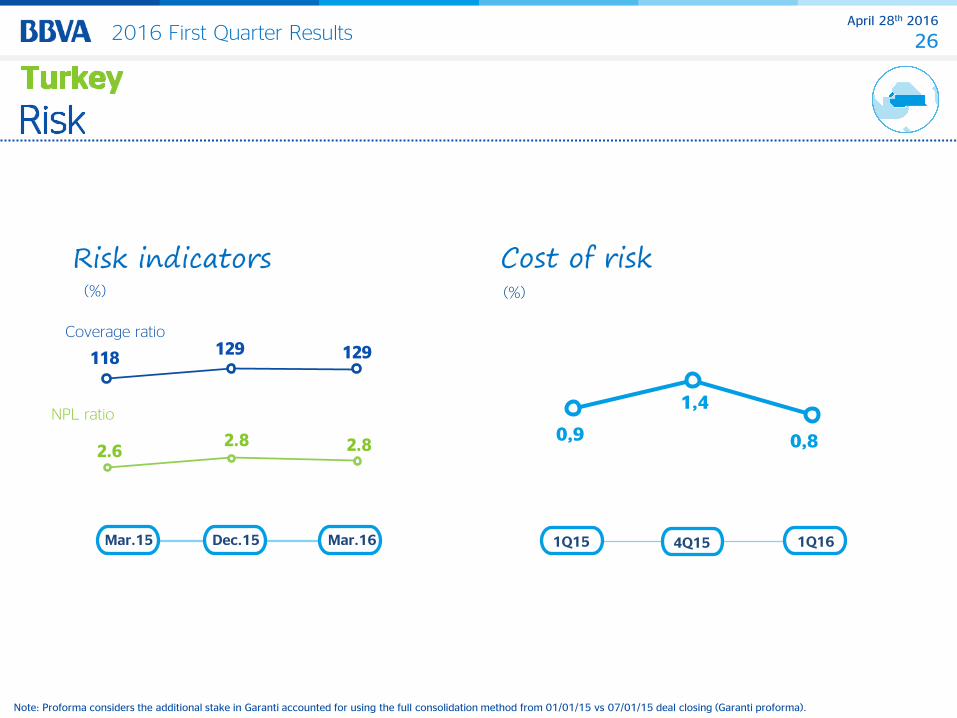
26 2016 First Quarter Results
118129 129
2.6 2.8 2.8
0,9
1,4
0,8
NPL ratio
Coverage ratio
Mar.15 Dec.15 Mar.16
(%)
(%)
1Q15 1Q16 4Q15
Note: Proforma considers the additional stake in Garanti accounted for using the full consolidation method from 01/01/15 vs 07/01/15 deal closing (Garanti proforma).
April 28th 2016
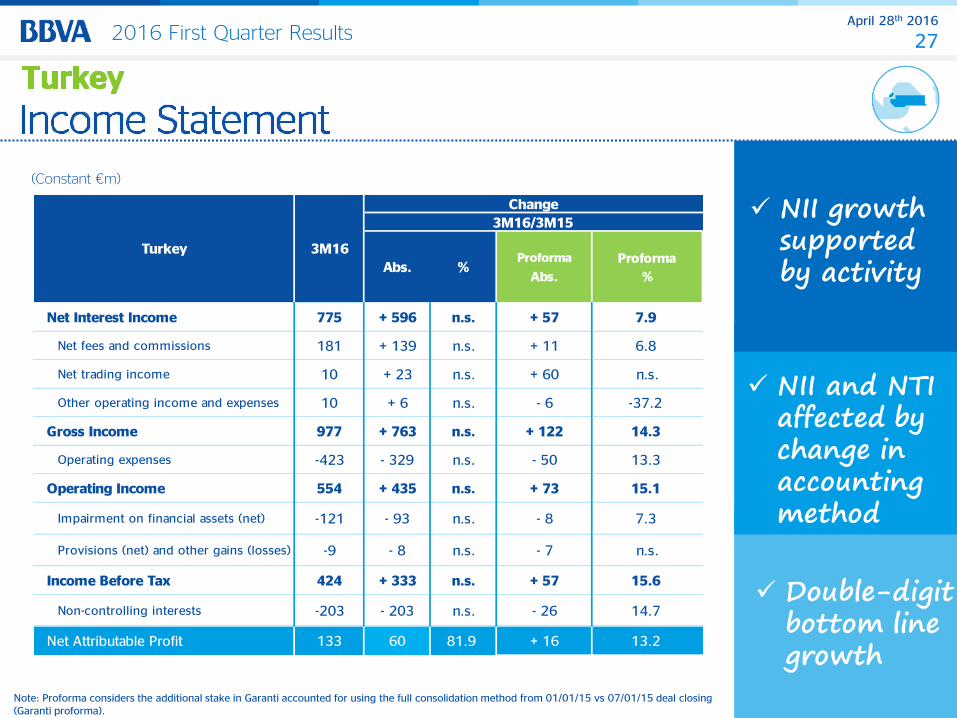
27 2016 First Quarter Results
(Constant €m)
Note: Proforma considers the additional stake in Garanti accounted for using the full consolidation method from 01/01/15 vs 07/01/15 deal closing (Garanti proforma).
Turkey 3M16
Change
3M16/3M15
Abs. %Proforma
Abs.
Proforma
%
Net Interest Income 775 + 596 n.s. + 57 7.9
Net fees and commissions 181 + 139 n.s. + 11 6.8
Net trading income 10 + 23 n.s. + 60 n.s.
Other operating income and expenses 10 + 6 n.s. - 6 -37.2
Gross Income 977 + 763 n.s. + 122 14.3
Operating expenses -423 - 329 n.s. - 50
Operating Income 554 + 435 n.s. + 73
13.3
15.1
Impairment on financial assets (net) -121 - 93 n.s. - 8 7.3
Provisions (net) and other gains (losses) -9 - 8 n.s. - 7 n.s.
Income Before Tax 424 + 333 n.s. + 57 15.6
14.7
81.9 + 16
-203 - 203 n.s. - 26
13.2
Non-controlling interests
Net Attributable Profit 133 60
April 28th 2016
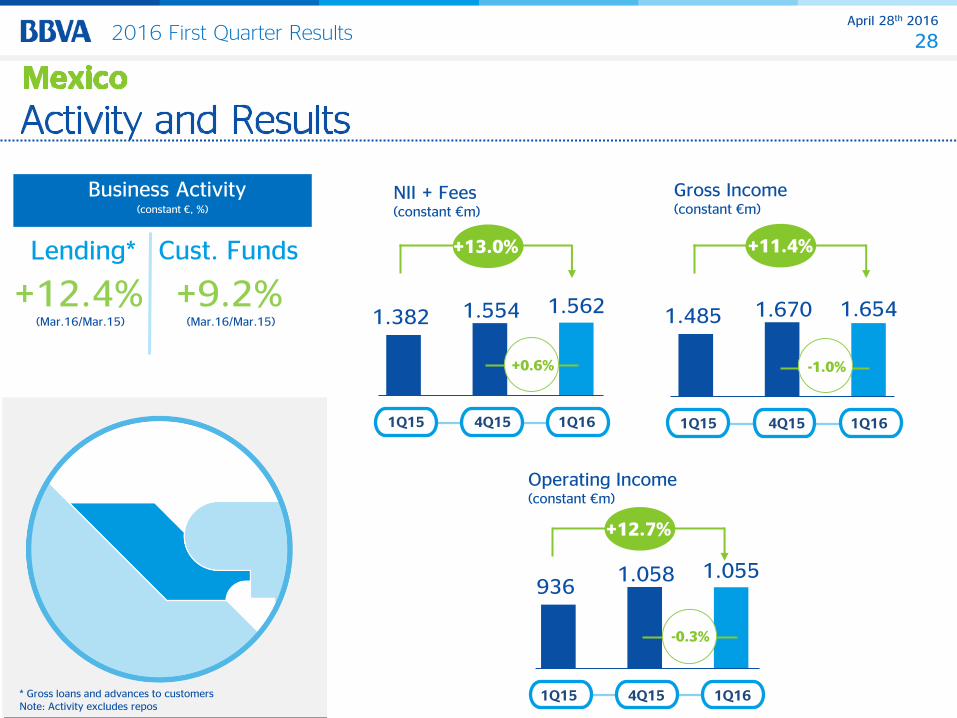
28 2016 First Quarter Results
Lending* Cust. Funds
1.382 1.554 1.562
1Q15 4Q15 1Q16
1.485 1.670 1.654
1Q15 4Q15 1Q16
Gross Income (constant €m)
936 1.058 1.055
1Q15 4Q15 1Q16
Operating Income (constant €m)
NII + Fees (constant €m)
* Gross loans and advances to customers Note: Activity excludes repos
+0.6% -1.0%
-0.3%
Business Activity (constant €, %)
+13.0% +11.4%
+12.7%
+12.4% (Mar.16/Mar.15)
+9.2% (Mar.16/Mar.15)
April 28th 2016
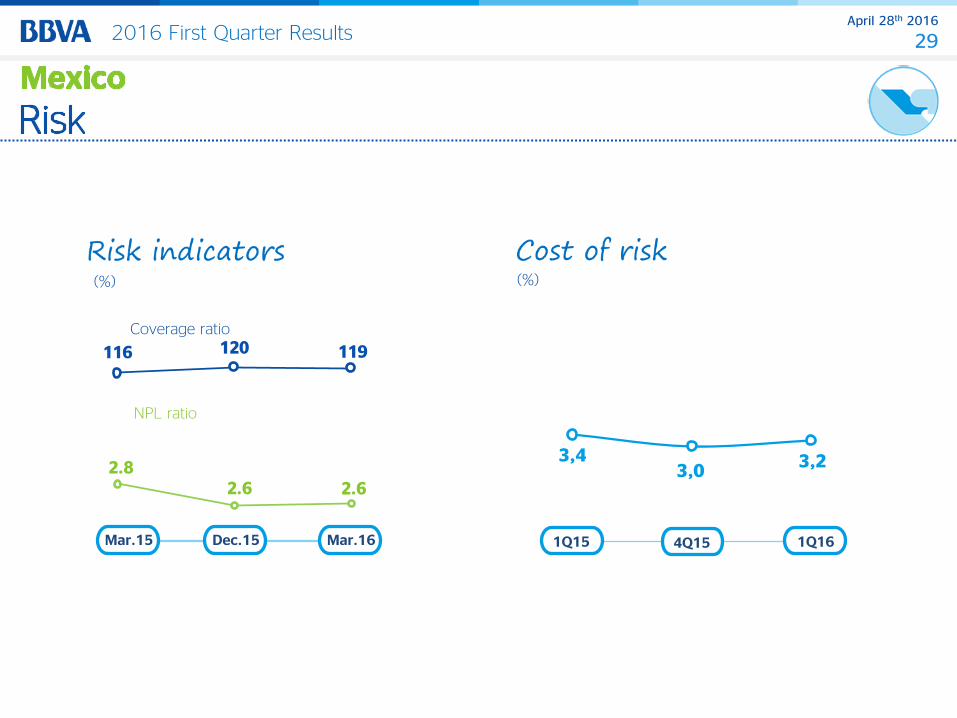
29 2016 First Quarter Results
116 120 119
2.8 2.6 2.6
NPL ratio
Coverage ratio
Mar.15 Dec.15 Mar.16
(%)
3,4 3,0
3,2
(%)
1Q15 1Q16 4Q15
April 28th 2016
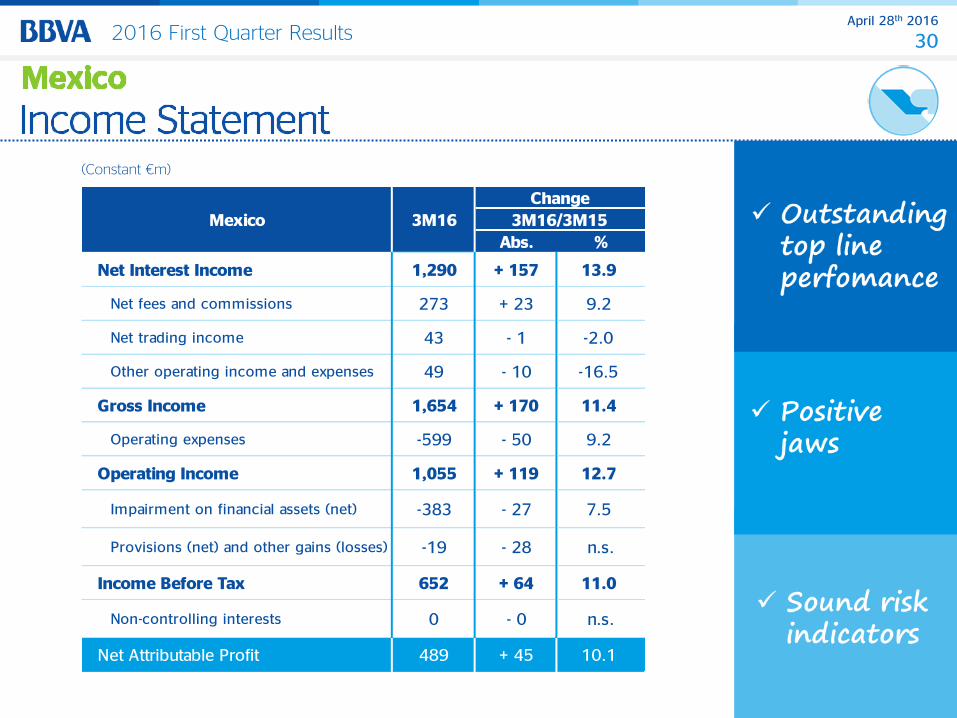
30 2016 First Quarter Results
Non-controlling interests 0 - 0 n.s.
Net Attributable Profit 489 + 45 10.1
Income Before Tax 652 + 64 11.0
Impairment on financial assets (net) -383 - 27 7.5
Provisions (net) and other gains (losses) -19 - 28 n.s.
Operating Income 1,055 + 119 12.7
Operating expenses -599 - 50 9.2
Gross Income 1,654 + 170 11.4
-16.5
Net trading income 43 - 1 -2.0
Other operating income and expenses 49 - 10
Net fees and commissions 273 + 23 9.2
Net Interest Income 1,290 + 157 13.9
3M16/3M15
Abs. %
Mexico 3M16
Change
(Constant €m)
April 28th 2016
31 2016 First Quarter Results
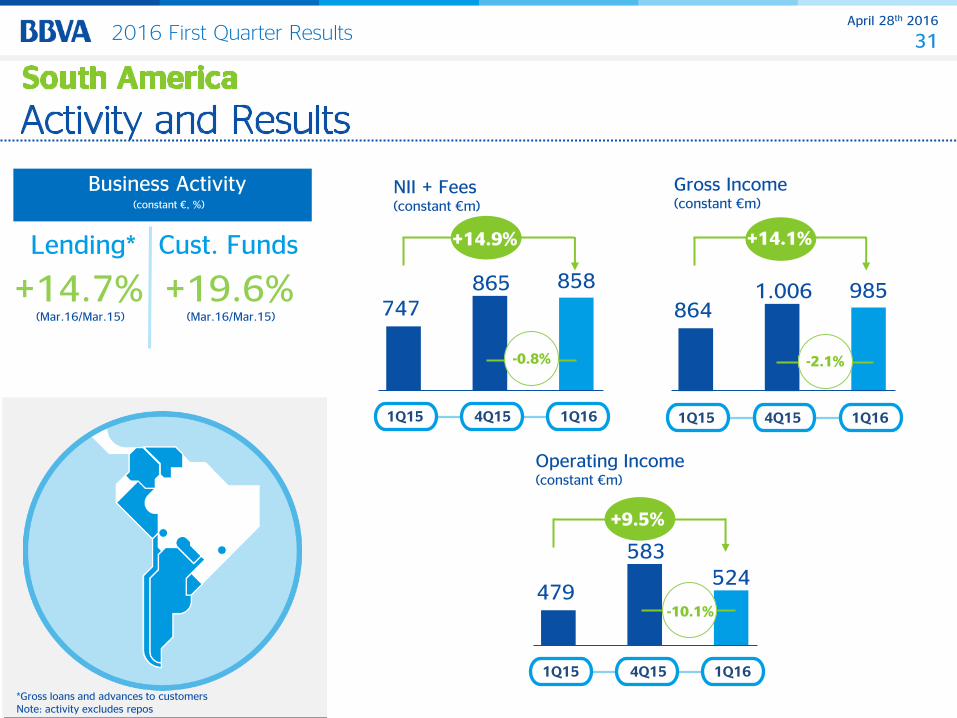
Business Activity (constant €, %)
Lending* Cust. Funds
747 865 858
1Q15 4Q15 1Q16
864 1.006 985
1Q15 4Q15 1Q16
Gross Income (constant €m)
479
583 524
1Q15 4Q15 1Q16
Operating Income (constant €m)
NII + Fees (constant €m)
+14.9%
*Gross loans and advances to customers Note: activity excludes repos
-0.8% -2.1%
-10.1%
+14.1%
+9.5%
+14.7% (Mar.16/Mar.15)
+19.6% (Mar.16/Mar.15)
April 28th 2016
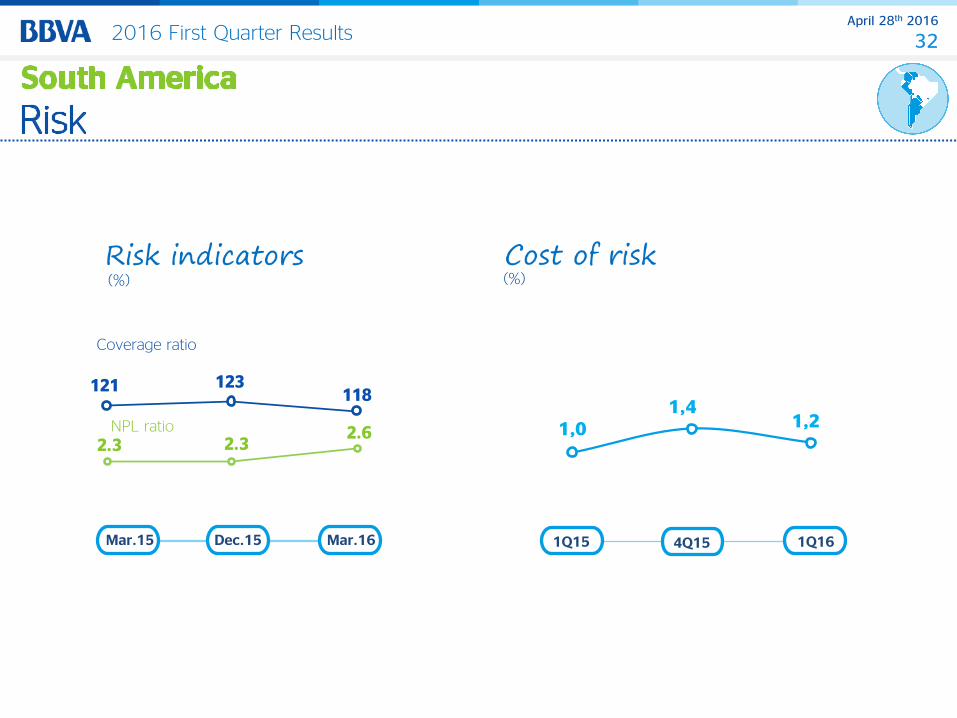
32 2016 First Quarter Results
1,0 1,4
1,2
121 123118
2.3 2.3 2.6 NPL ratio
Coverage ratio
Mar.15 Dec.15 Mar.16
(%)
(%)
1Q15 1Q16 4Q15
April 28th 2016
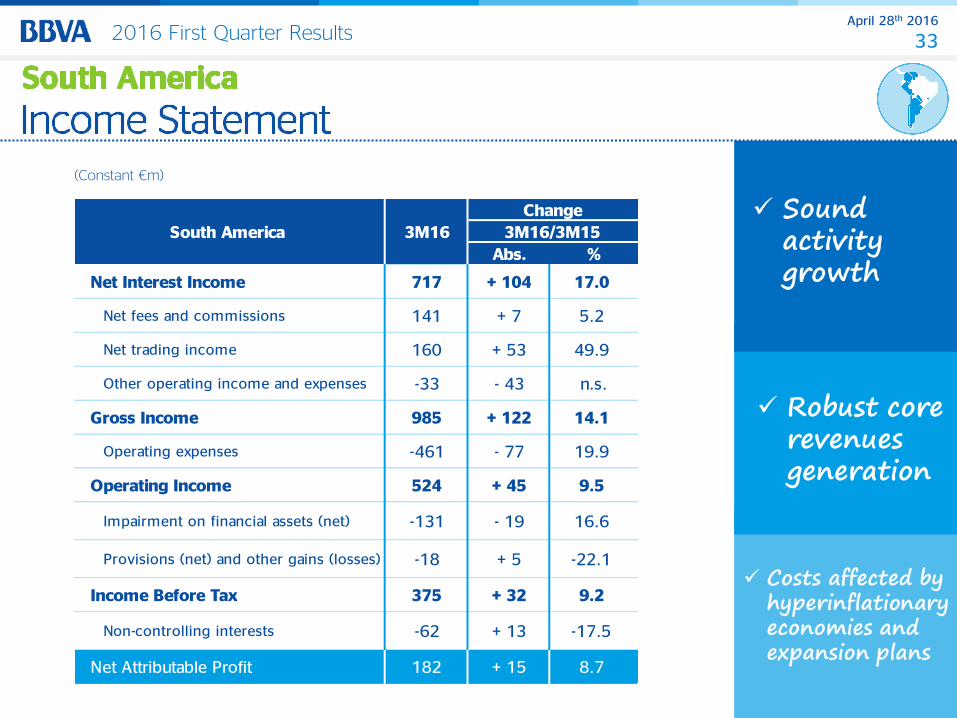
33 2016 First Quarter Results
(Constant €m)
South America 3M16
Change
3M16/3M15
Abs. %
Net Interest Income 717 + 104 17.0
- 43
Net fees and commissions 141 + 7 5.2
Net trading income 160 + 53 49.9
Other operating income and expenses -33
985 + 122 14.1
n.s.
Operating expenses -461 - 77 19.9
Gross Income
Operating Income 524 + 45 9.5
Impairment on financial assets (net) -131 - 19 16.6
Provisions (net) and other gains (losses) -18 + 5 -22.1
Income Before Tax 375 + 32 9.2
Non-controlling interests -62 + 13 -17.5
Net Attributable Profit 182 + 15 8.7
April 28th 2016
34 2016 First Quarter Results
Quarter results impacted by seasonality, lower NTI and FX
Strong performance in emerging markets
Good evolution of risk indicators despite higher provisions in the USA
April 28th 2016
35 2016 First Quarter Results
Annex
April 28th 2016
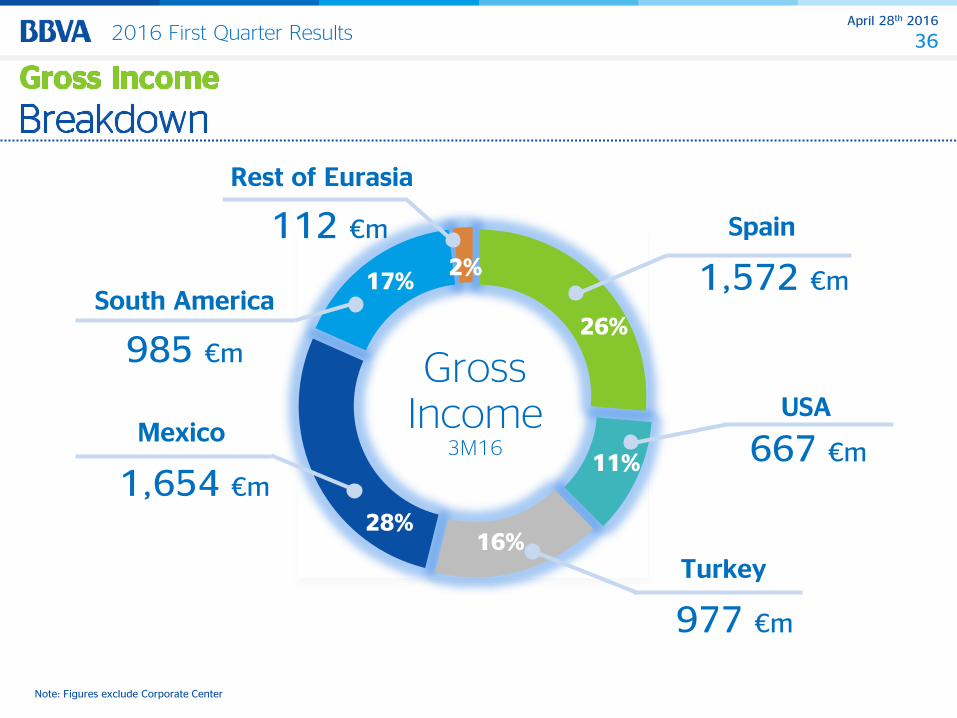
36 2016 First Quarter Results
Spain
1,572 €m
667 €m
USA
977 €m
Turkey
Rest of Eurasia
112 €m
26%
Gross Income
3M16
16%
11%
28%
Mexico
1,654 €m
17% South America
985 €m
2%
Note: Figures exclude Corporate Center
April 28th 2016
37 2016 First Quarter Results
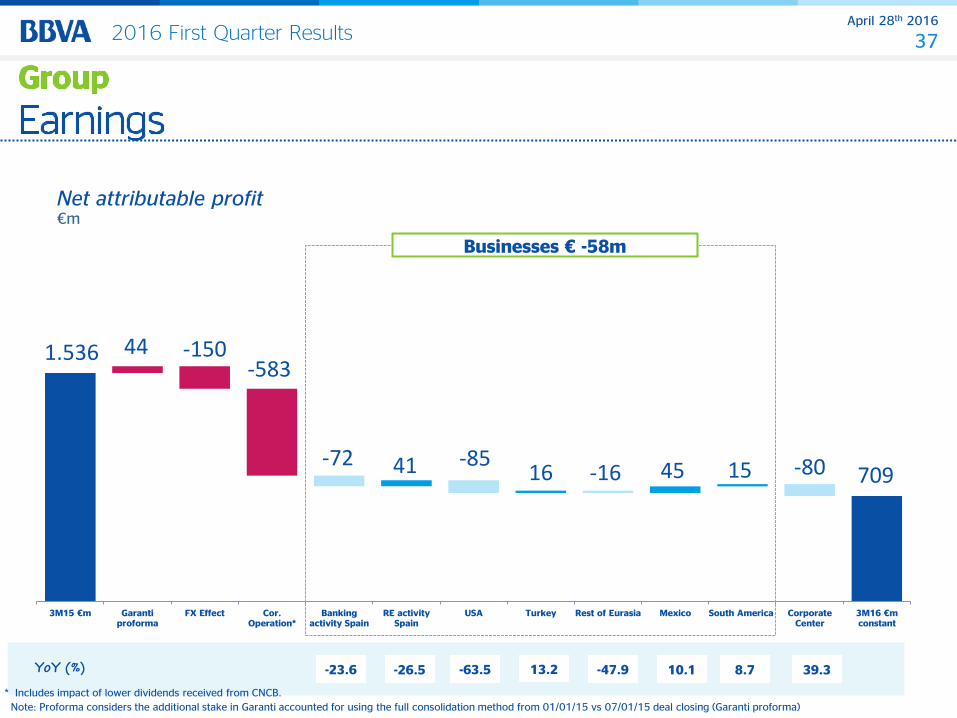
1.536 44 -150 -583
-72 41 -85 16 -16 45 15 -80 709
3M15 €m Garantiproforma
FX Effect Cor.Operation*
Bankingactivity Spain
RE activitySpain
USA Turkey Rest of Eurasia Mexico South America CorporateCenter
3M16 €m constant
Net attributable profit €m
Businesses € -58m
YoY (%) -26.5 -23.6 10.1 -47.9 -63.5 13.2 8.7 39.3
* Includes impact of lower dividends received from CNCB.
Note: Proforma considers the additional stake in Garanti accounted for using the full consolidation method from 01/01/15 vs 07/01/15 deal closing (Garanti proforma)
April 28th 2016
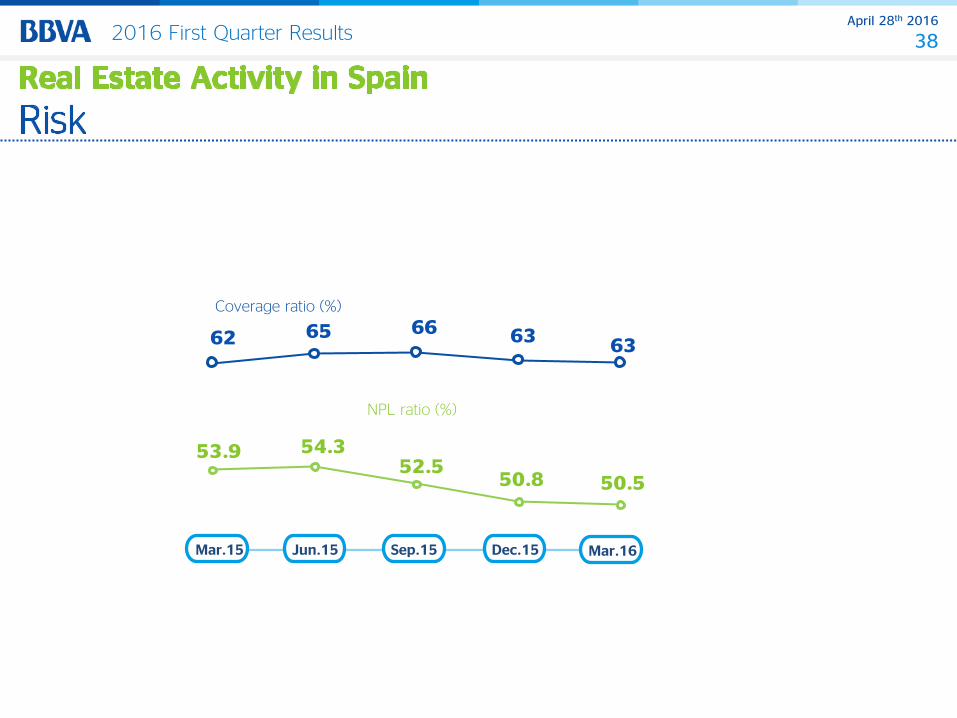
38 2016 First Quarter Results
62 65 66 63 63
53.9 54.3 52.5
50.8 50.5
NPL ratio (%)
Coverage ratio (%)
Jun.15 Sep.15 Mar.15
Dec.15 Mar.16
April 28th 2016
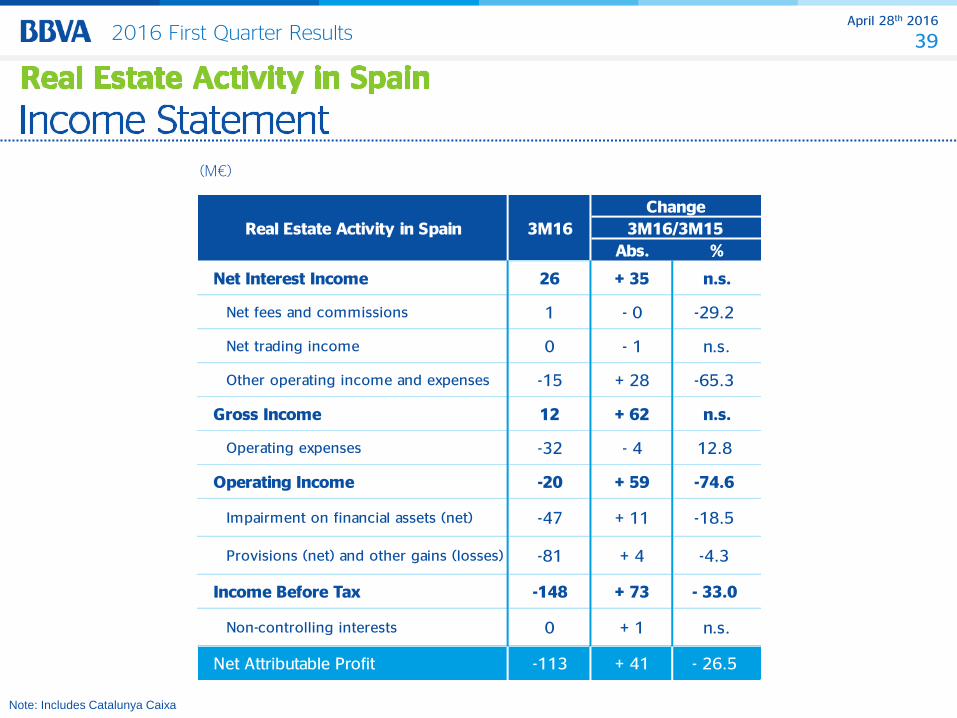
39 2016 First Quarter Results
Note: Includes Catalunya Caixa
(M€)
Real Estate Activity in Spain 3M16
Change
3M16/3M15
Abs. %
Net Interest Income 26 + 35 n.s.
+ 28
Net fees and commissions 1 - 0 -29.2
Net trading income 0 - 1 n.s.
Other operating income and expenses -15
12 + 62 n.s.
-65.3
Operating expenses -32 - 4 12.8
Gross Income
Operating Income -20 + 59 -74.6
Impairment on financial assets (net) -47 + 11 -18.5
Provisions (net) and other gains (losses) -81 + 4 -4.3
Income Before Tax -148 + 73 - 33.0
Non-controlling interests 0 + 1 n.s.
Net Attributable Profit -113 + 41 - 26.5
April 28th 2016
40 2016 First Quarter Results
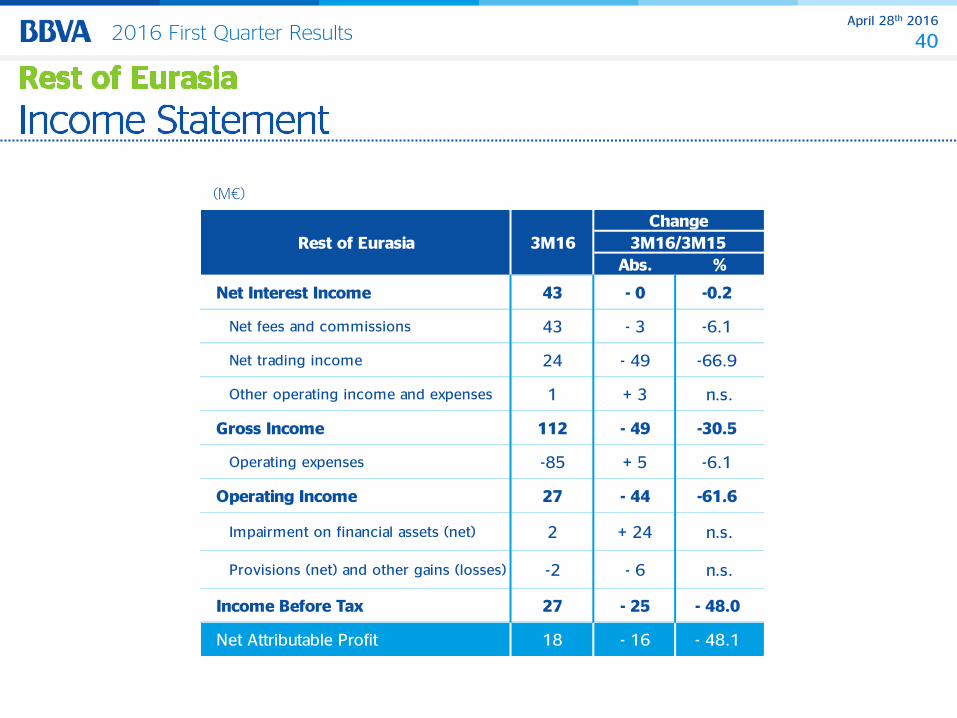
(M€)
Rest of Eurasia 3M16
Change
3M16/3M15
Abs. %
Net Interest Income 43 - 0 -0.2
+ 3
Net fees and commissions 43 - 3 -6.1
Net trading income 24 - 49 -66.9
Other operating income and expenses 1
112 - 49 -30.5
n.s.
Operating expenses -85 + 5 -6.1
Gross Income
Operating Income 27 - 44 -61.6
Impairment on financial assets (net) 2 + 24 n.s.
Provisions (net) and other gains (losses) -2 - 6 n.s.
Income Before Tax 27 - 25 - 48.0
Net Attributable Profit 18 - 16 - 48.1
April 28th 2016
41 2016 First Quarter Results
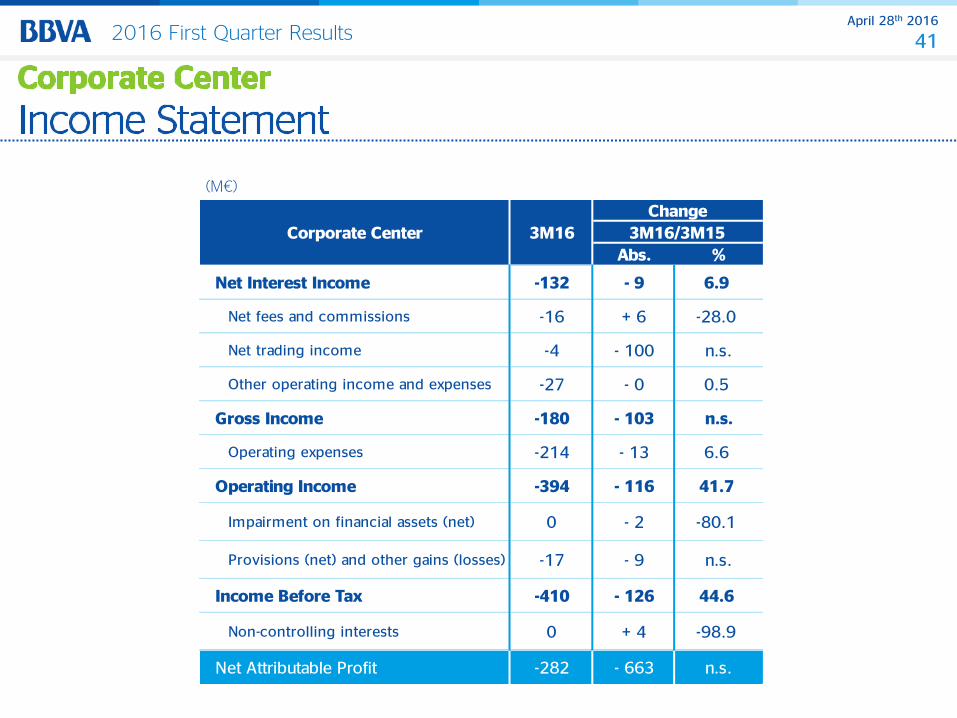
(M€)
Non-controlling interests 0 + 4 -98.9
Net Attributable Profit -282 - 663 n.s.
Income Before Tax -410 - 126 44.6
Impairment on financial assets (net) 0 - 2 -80.1
Provisions (net) and other gains (losses) -17 - 9 n.s.
Operating Income -394 - 116 41.7
Operating expenses -214 - 13 6.6
Gross Income -180 - 103 n.s.
0.5
Net trading income -4 - 100 n.s.
Other operating income and expenses -27 - 0
Net fees and commissions -16 + 6 -28.0
Net Interest Income -132 - 9 6.9
3M16/3M15
Abs. %
Corporate Center 3M16
Change
April 28th 2016
42 2016 First Quarter Results
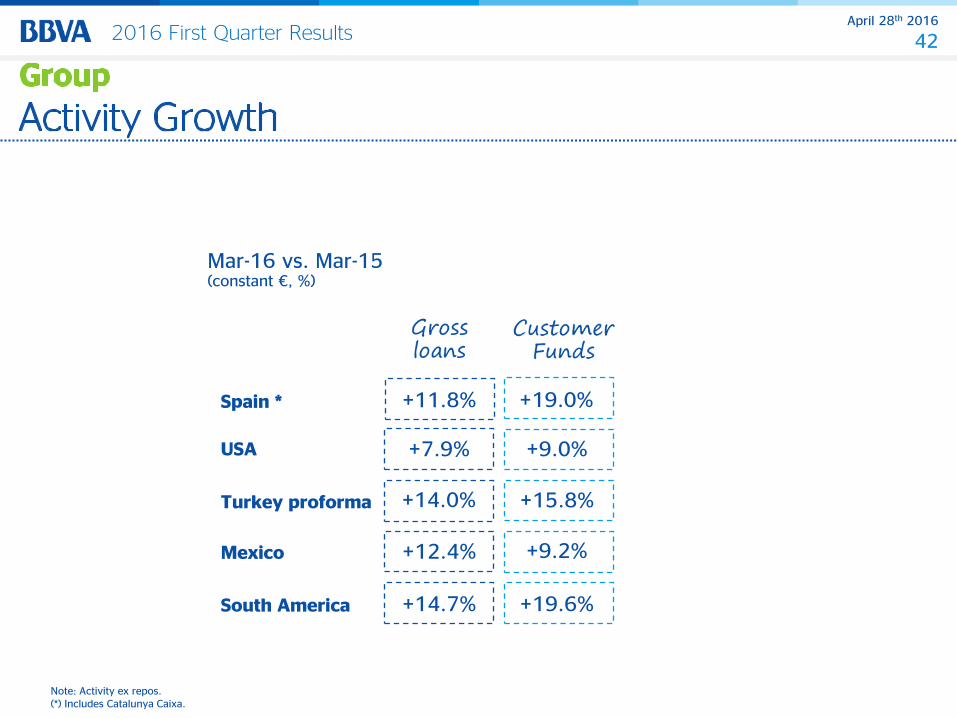
Spain *
USA
Turkey proforma
Mexico
South America
Note: Activity ex repos. (*) Includes Catalunya Caixa.
+11.8% +19.0%
+7.9% +9.0%
+12.4% +9.2%
+14.7% +19.6%
Mar-16 vs. Mar-15 (constant €, %)
+14.0% +15.8%
April 28th 2016
43 2016 First Quarter Results
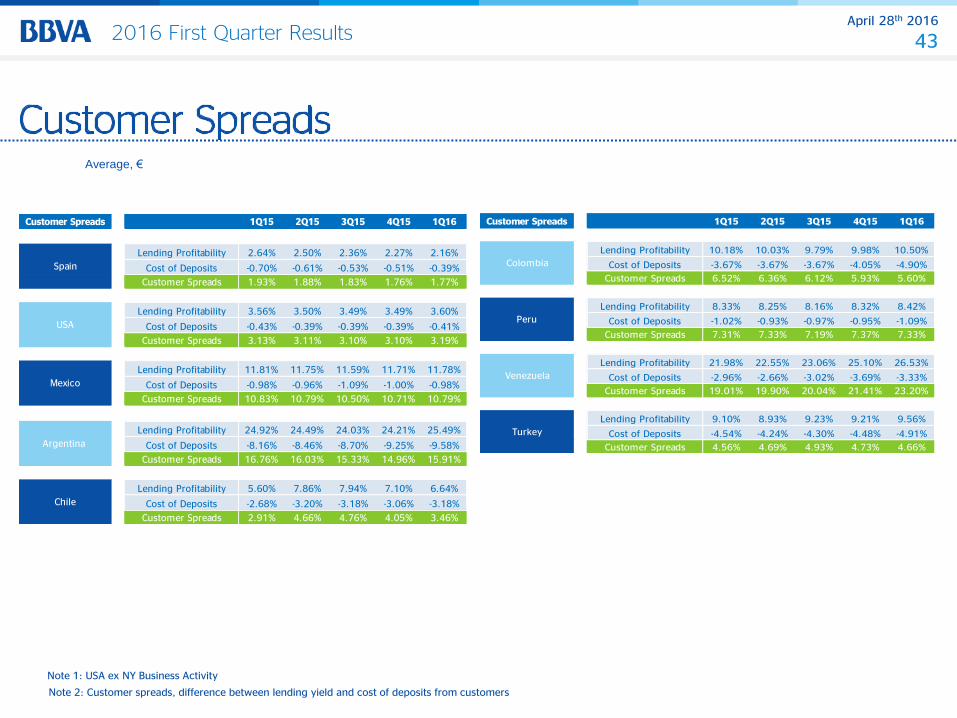
Note 2: Customer spreads, difference between lending yield and cost of deposits from customers
Note 1: USA ex NY Business Activity
Average, €
1Q15 2Q15 3Q15 4Q15 1Q16
Lending Profitability 2.64% 2.50% 2.36% 2.27% 2.16%
Cost of Deposits -0.70% -0.61% -0.53% -0.51% -0.39%
Customer Spreads 1.93% 1.88% 1.83% 1.76% 1.77%
Lending Profitability 3.56% 3.50% 3.49% 3.49% 3.60%
Cost of Deposits -0.43% -0.39% -0.39% -0.39% -0.41%
Customer Spreads 3.13% 3.11% 3.10% 3.10% 3.19%
Lending Profitability 11.81% 11.75% 11.59% 11.71% 11.78%
Cost of Deposits -0.98% -0.96% -1.09% -1.00% -0.98%
Customer Spreads 10.83% 10.79% 10.50% 10.71% 10.79%
Lending Profitability 24.92% 24.49% 24.03% 24.21% 25.49%
Cost of Deposits -8.16% -8.46% -8.70% -9.25% -9.58%
Customer Spreads 16.76% 16.03% 15.33% 14.96% 15.91%
Lending Profitability 5.60% 7.86% 7.94% 7.10% 6.64%
Cost of Deposits -2.68% -3.20% -3.18% -3.06% -3.18%
Customer Spreads 2.91% 4.66% 4.76% 4.05% 3.46%
Spain
USA
Mexico
Customer Spreads
Argentina
Chile
1Q15 2Q15 3Q15 4Q15 1Q16
Lending Profitability 10.18% 10.03% 9.79% 9.98% 10.50%
Cost of Deposits -3.67% -3.67% -3.67% -4.05% -4.90%
Customer Spreads 6.52% 6.36% 6.12% 5.93% 5.60%
Lending Profitability 8.33% 8.25% 8.16% 8.32% 8.42%
Cost of Deposits -1.02% -0.93% -0.97% -0.95% -1.09%
Customer Spreads 7.31% 7.33% 7.19% 7.37% 7.33%
Lending Profitability 21.98% 22.55% 23.06% 25.10% 26.53%
Cost of Deposits -2.96% -2.66% -3.02% -3.69% -3.33%
Customer Spreads 19.01% 19.90% 20.04% 21.41% 23.20%
Lending Profitability 9.10% 8.93% 9.23% 9.21% 9.56%
Cost of Deposits -4.54% -4.24% -4.30% -4.48% -4.91%
Customer Spreads 4.56% 4.69% 4.93% 4.73% 4.66%
Customer Spreads
Turkey
Colombia
Peru
Venezuela
April 28th 2016
44 2016 First Quarter Results
Columna1€ Bn
% Credit
Risk%IG %NIG %NPLs
Up
stream
Mid
stream
Down
stream
Integra-
tedOthers € Bn
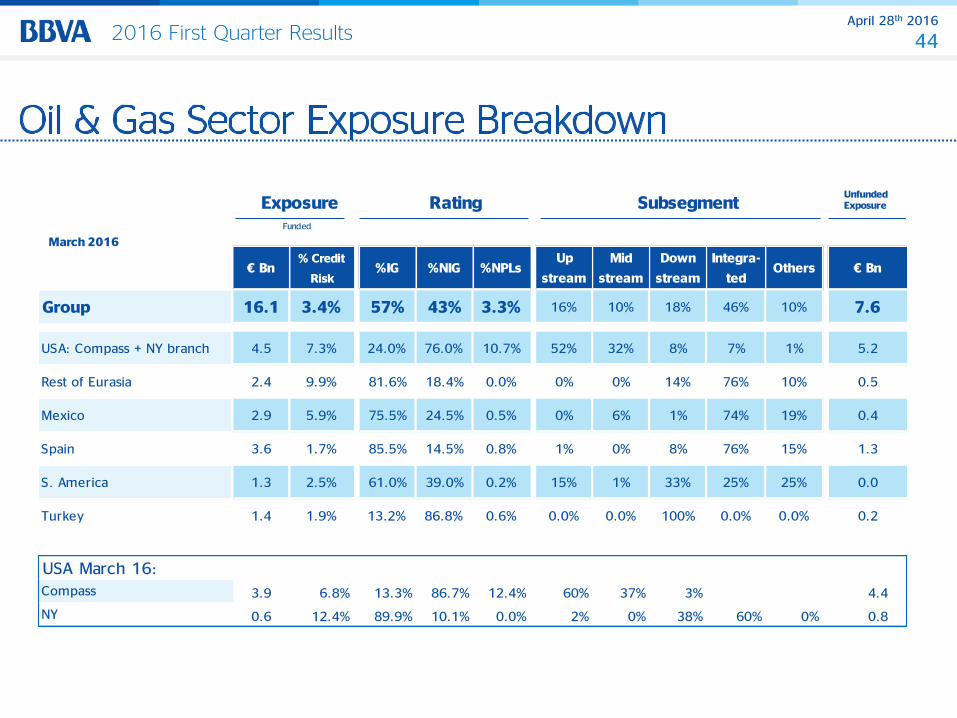
Group 16.1 3.4% 57% 43% 3.3% 16% 10% 18% 46% 10% 7.6
USA: Compass + NY branch 4.5 7.3% 24.0% 76.0% 10.7% 52% 32% 8% 7% 1% 5.2
Rest of Eurasia 2.4 9.9% 81.6% 18.4% 0.0% 0% 0% 14% 76% 10% 0.5
Mexico 2.9 5.9% 75.5% 24.5% 0.5% 0% 6% 1% 74% 19% 0.4
Spain 3.6 1.7% 85.5% 14.5% 0.8% 1% 0% 8% 76% 15% 1.3
S. America 1.3 2.5% 61.0% 39.0% 0.2% 15% 1% 33% 25% 25% 0.0
Turkey 1.4 1.9% 13.2% 86.8% 0.6% 0.0% 0.0% 100% 0.0% 0.0% 0.2
USA March 16:
Compass 3.9 6.8% 13.3% 86.7% 12.4% 60% 37% 3% 4.4
NY 0.6 12.4% 89.9% 10.1% 0.0% 2% 0% 38% 60% 0% 0.8
Rating SubsegmentExposureFunded
UnfundedExposure
March 2016

1Q16 Results
Carlos Torres Vila Chief Executive Officer Madrid, April 28th 2016