bc public sector compensation review - british … 4 bc public sector compensation review | october...
TRANSCRIPT
BC Public SectorCompensation Review
October 2014
Page 2
BC Public Sector Compensation Review | October 2014
Cont
ents
1
2
3
Executive summary
Objectives and scope
Variations in trends in compensation
4 Variation in philosophies and governance models
3
6
8
16
5 Talent management implications 25
6 Recommendations 30
7 Limitations 43
REPORT
D Spectrum of strategies for Regional & LocalGovernment
A Approach to building the evidence base
B Total Public Sector wages
C Supplementary evidence
45
49
51
81
APPENDICES
Page 3
BC Public Sector Compensation Review | October 2014
1. Executive summary
The Mandate
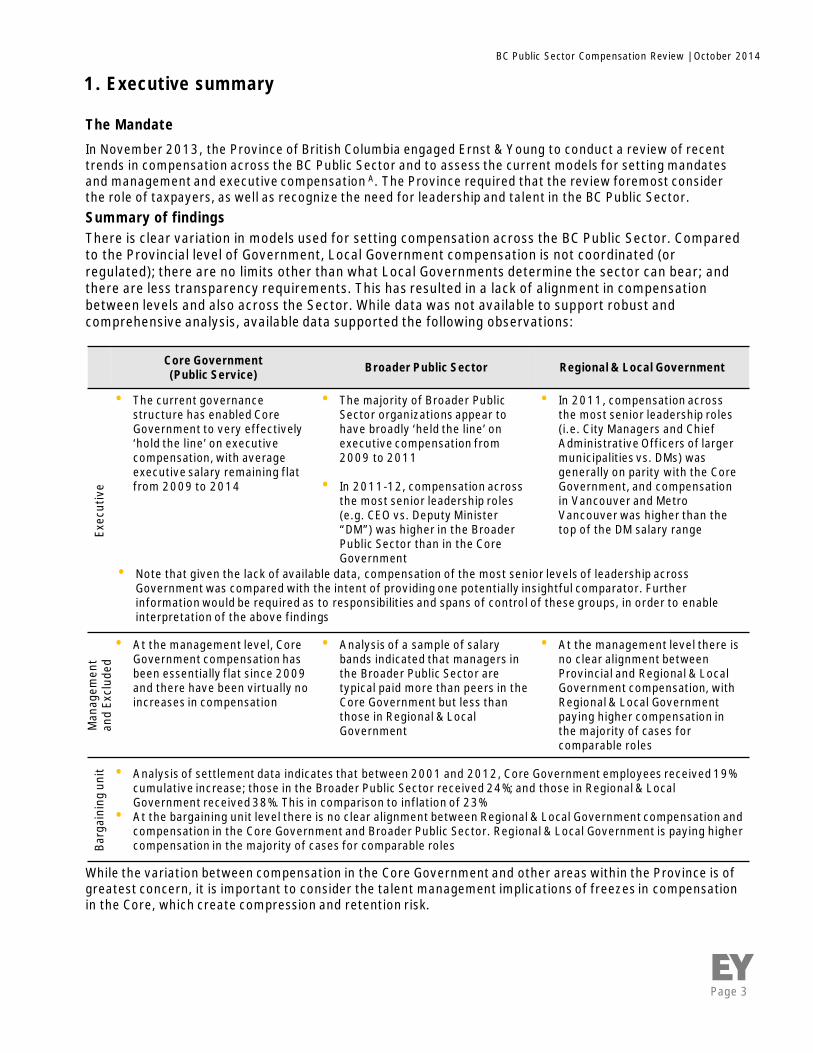
In November 2013, the Province of British Columbia engaged Ernst & Young to conduct a review of recenttrends in compensation across the BC Public Sector and to assess the current models for setting mandatesand management and executive compensation A. The Province required that the review foremost considerthe role of taxpayers, as well as recognize the need for leadership and talent in the BC Public Sector.Summary of findingsThere is clear variation in models used for setting compensation across the BC Public Sector. Comparedto the Provincial level of Government, Local Government compensation is not coordinated (orregulated); there are no limits other than what Local Governments determine the sector can bear; andthere are less transparency requirements. This has resulted in a lack of alignment in compensationbetween levels and also across the Sector. While data was not available to support robust andcomprehensive analysis, available data supported the following observations:
While the variation between compensation in the Core Government and other areas within the Province is ofgreatest concern, it is important to consider the talent management implications of freezes in compensationin the Core, which create compression and retention risk.
Core Government(Public Service) Broader Public Sector Regional & Local Government
Exec
utiv
e
• The current governancestructure has enabled CoreGovernment to very effectively‘hold the line’ on executivecompensation, with averageexecutive salary remaining flatfrom 2009 to 2014
• The majority of Broader PublicSector organizations appear tohave broadly ‘held the line’ onexecutive compensation from2009 to 2011
• In 2011-12, compensation acrossthe most senior leadership roles(e.g. CEO vs. Deputy Minister“DM”) was higher in the BroaderPublic Sector than in the CoreGovernment
• In 2011, compensation acrossthe most senior leadership roles(i.e. City Managers and ChiefAdministrative Officers of largermunicipalities vs. DMs) wasgenerally on parity with the CoreGovernment, and compensationin Vancouver and MetroVancouver was higher than thetop of the DM salary range
Man
agem
ent
and
Excl
uded
• At the management level, CoreGovernment compensation hasbeen essentially flat since 2009and there have been virtually noincreases in compensation
• Analysis of a sample of salarybands indicated that managers inthe Broader Public Sector aretypical paid more than peers in theCore Government but less thanthose in Regional & LocalGovernment
• At the management level there isno clear alignment betweenProvincial and Regional & LocalGovernment compensation, withRegional & Local Governmentpaying higher compensation inthe majority of cases forcomparable roles
Barg
aini
ngun
it • Analysis of settlement data indicates that between 2001 and 2012, Core Government employees received 19%cumulative increase; those in the Broader Public Sector received 24%; and those in Regional & LocalGovernment received 38%. This in comparison to inflation of 23%
• At the bargaining unit level there is no clear alignment between Regional & Local Government compensation andcompensation in the Core Government and Broader Public Sector. Regional & Local Government is paying highercompensation in the majority of cases for comparable roles
• Note that given the lack of available data, compensation of the most senior levels of leadership acrossGovernment was compared with the intent of providing one potentially insightful comparator. Furtherinformation would be required as to responsibilities and spans of control of these groups, in order to enableinterpretation of the above findings
Page 4
BC Public Sector Compensation Review | October 2014
Philosophies A and models for setting compensation
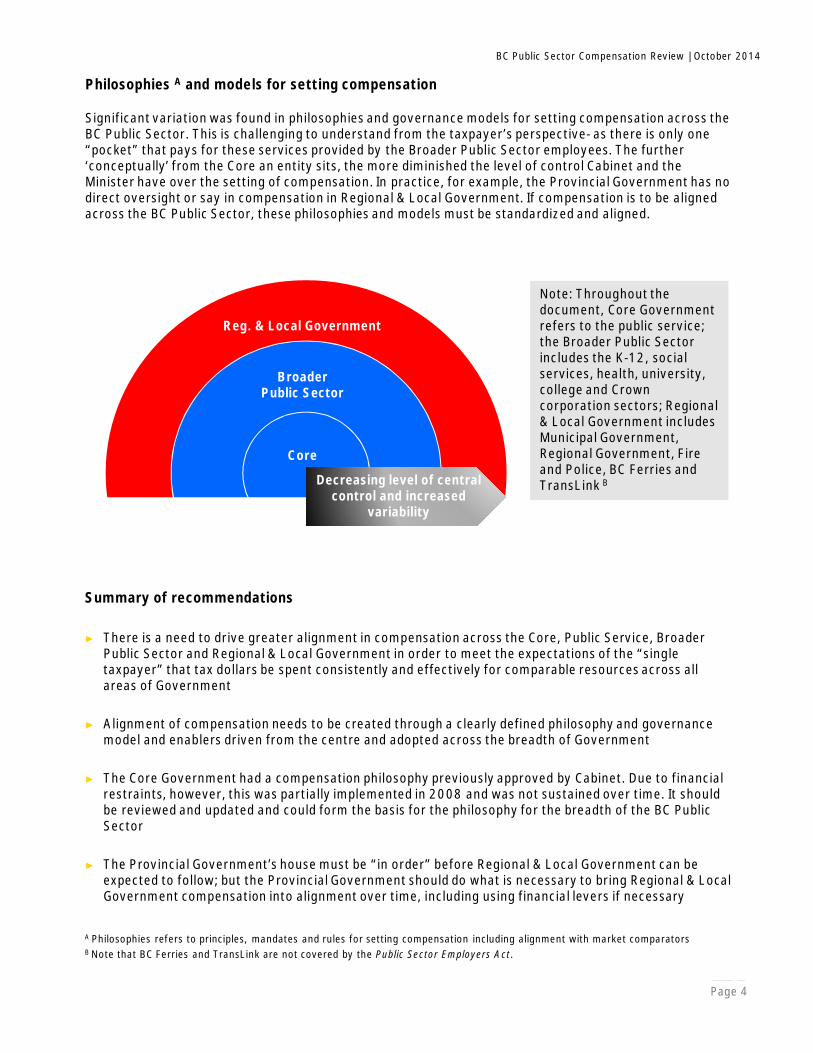
Significant variation was found in philosophies and governance models for setting compensation across theBC Public Sector. This is challenging to understand from the taxpayer’s perspective- as there is only one“pocket” that pays for these services provided by the Broader Public Sector employees. The further‘conceptually’ from the Core an entity sits, the more diminished the level of control Cabinet and theMinister have over the setting of compensation. In practice, for example, the Provincial Government has nodirect oversight or say in compensation in Regional & Local Government. If compensation is to be alignedacross the BC Public Sector, these philosophies and models must be standardized and aligned.
A Philosophies refers to principles, mandates and rules for setting compensation including alignment with market comparatorsB Note that BC Ferries and TransLink are not covered by the Public Sector Employers Act.
Core
BroaderPublic Sector
Reg. & Local Government
Decreasing level of centralcontrol and increased
variability
Summary of recommendations
► There is a need to drive greater alignment in compensation across the Core, Public Service, BroaderPublic Sector and Regional & Local Government in order to meet the expectations of the “singletaxpayer” that tax dollars be spent consistently and effectively for comparable resources across allareas of Government
► Alignment of compensation needs to be created through a clearly defined philosophy and governancemodel and enablers driven from the centre and adopted across the breadth of Government
► The Core Government had a compensation philosophy previously approved by Cabinet. Due to financialrestraints, however, this was partially implemented in 2008 and was not sustained over time. It shouldbe reviewed and updated and could form the basis for the philosophy for the breadth of the BC PublicSector
► The Provincial Government’s house must be “in order” before Regional & Local Government can beexpected to follow; but the Provincial Government should do what is necessary to bring Regional & LocalGovernment compensation into alignment over time, including using financial levers if necessary
Note: Throughout thedocument, Core Governmentrefers to the public service;the Broader Public Sectorincludes the K-12, socialservices, health, university,college and Crowncorporation sectors; Regional& Local Government includesMunicipal Government,Regional Government, Fireand Police, BC Ferries andTransLink B
Page 5
BC Public Sector Compensation Review | October 2014
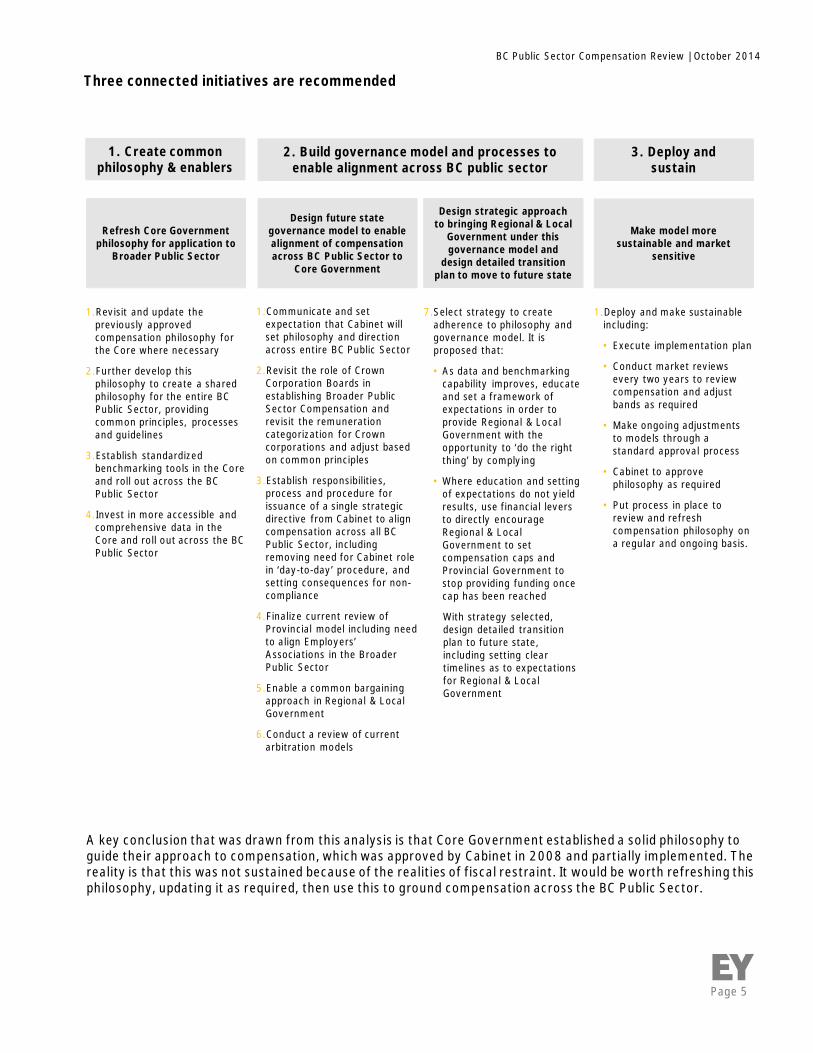
A key conclusion that was drawn from this analysis is that Core Government established a solid philosophy toguide their approach to compensation, which was approved by Cabinet in 2008 and partially implemented. Thereality is that this was not sustained because of the realities of fiscal restraint. It would be worth refreshing thisphilosophy, updating it as required, then use this to ground compensation across the BC Public Sector.
Three connected initiatives are recommended
Make model moresustainable and market
sensitive
Design future stategovernance model to enablealignment of compensationacross BC Public Sector to
Core Government
Refresh Core Governmentphilosophy for application to
Broader Public Sector
3. Deploy andsustain
2. Build governance model and processes toenable alignment across BC public sector
1. Create commonphilosophy & enablers
Design strategic approachto bringing Regional & Local
Government under thisgovernance model and
design detailed transitionplan to move to future state
1.Deploy and make sustainableincluding:
• Execute implementation plan
• Conduct market reviewsevery two years to reviewcompensation and adjustbands as required
• Make ongoing adjustmentsto models through astandard approval process
• Cabinet to approvephilosophy as required
• Put process in place toreview and refreshcompensation philosophy ona regular and ongoing basis.
1.Communicate and setexpectation that Cabinet willset philosophy and directionacross entire BC Public Sector
2.Revisit the role of CrownCorporation Boards inestablishing Broader PublicSector Compensation andrevisit the remunerationcategorization for Crowncorporations and adjust basedon common principles
3.Establish responsibilities,process and procedure forissuance of a single strategicdirective from Cabinet to aligncompensation across all BCPublic Sector, includingremoving need for Cabinet rolein ‘day-to-day’ procedure, andsetting consequences for non-compliance
4.Finalize current review ofProvincial model including needto align Employers’Associations in the BroaderPublic Sector
5.Enable a common bargainingapproach in Regional & LocalGovernment
6.Conduct a review of currentarbitration models
7.Select strategy to createadherence to philosophy andgovernance model. It isproposed that:
• As data and benchmarkingcapability improves, educateand set a framework ofexpectations in order toprovide Regional & LocalGovernment with theopportunity to ‘do the rightthing’ by complying
• Where education and settingof expectations do not yieldresults, use financial leversto directly encourageRegional & LocalGovernment to setcompensation caps andProvincial Government tostop providing funding oncecap has been reached
With strategy selected,design detailed transitionplan to future state,including setting cleartimelines as to expectationsfor Regional & LocalGovernment
1.Revisit and update thepreviously approvedcompensation philosophy forthe Core where necessary
2.Further develop thisphilosophy to create a sharedphilosophy for the entire BCPublic Sector, providingcommon principles, processesand guidelines
3.Establish standardizedbenchmarking tools in the Coreand roll out across the BCPublic Sector
4.Invest in more accessible andcomprehensive data in theCore and roll out across the BCPublic Sector
Page 6
BC Public Sector Compensation Review | October 2014
2. Objectives and scope
BC is undertaking a Core Review with clearlydefined objectives
British Columbia is fortunate to not have been assignificantly impacted by the economic downturn asother jurisdictions, due largely to its strong fiscalpolicy. However, continued financial restraint isrequired in the face of an economic outlook of slowrecovery and prolonged economic risk.
In this context, in July 2013, the Province releasedthe Terms of Reference for its 2013/14 CoreReview. As part of its ongoing commitment to fiscalresponsibility Government has initiated a corereview process with a goal to ensure the bestpossible use of Government resources and respectfor the interests of taxpayers. The Cabinet WorkingGroup on Core Review is tasked with examining allGovernment programs including ministries, SUCHsector organizations (school districts, universities,colleges and health authorities/hospital societies)and all Crown Corporations, agencies, boards andcommissions, with a view of positioning theprovince for sustained economic growth andprosperity.
The Core Review process has six objectives:
► Ensure that the programs and activities ofministries are focused on achievingGovernment’s vision of a strong economy andsecure tomorrow
► Ensure that Government is operating asefficiently and effectively as possible
► Confirm Government’s core responsibilitiesand eliminate programs that could providebetter service at less cost through alternativeservice delivery models
► Ensure budget targets are achievedconsistent with Budget 2013 (June Update)
► Identify opportunities where further savingscan be re-directed to high priority programs
► Ensure public sector management wagelevels are appropriate while recognizing theneed for leaders who can positively impactthe effectiveness and productivity of publicsector agencies.
The Core Review has created the mandate toreview variations in compensation
In considering the stated objective of the CoreReview of ensuring appropriate public sector wagelevels, it has been observed by the Province thatvariation may exist in recent trends incompensation across the BC Public Sector. It isbelieved that while some areas of the Public Sectorhave achieved year on year compensation freezes,other have seen significant increases.
This variation gives rise to two principle questionsconcerning the appropriateness of public servicewages:
► On the one hand, when viewed from a ‘singletaxpayer' perspective, the apparent lack ofcorrelation between the province's economicposition and compensation increases incertain areas of Government as well as themere existence of inconsistency acrossGovernment, creates concern that tax dollarsare not being spent consistently andeffectively on comparable resources acrossall areas of the BC Public Sector
► On the other hand, the existence of sustainedcompensation freezes may lead to significanttalent management challenges, givenconstraints in attracting and retaining skilledresources
As well as this issue being a priority forGovernment, numerous communities of interestexternal to the Government have recently drawnattention to the issue of variations in compensationbetween comparable parties, including theBusiness Council of British Columbia; theIndependent Contractors and Business Association;the Fraser Institute; and the provincial press.
Page 7
BC Public Sector Compensation Review | October 2014
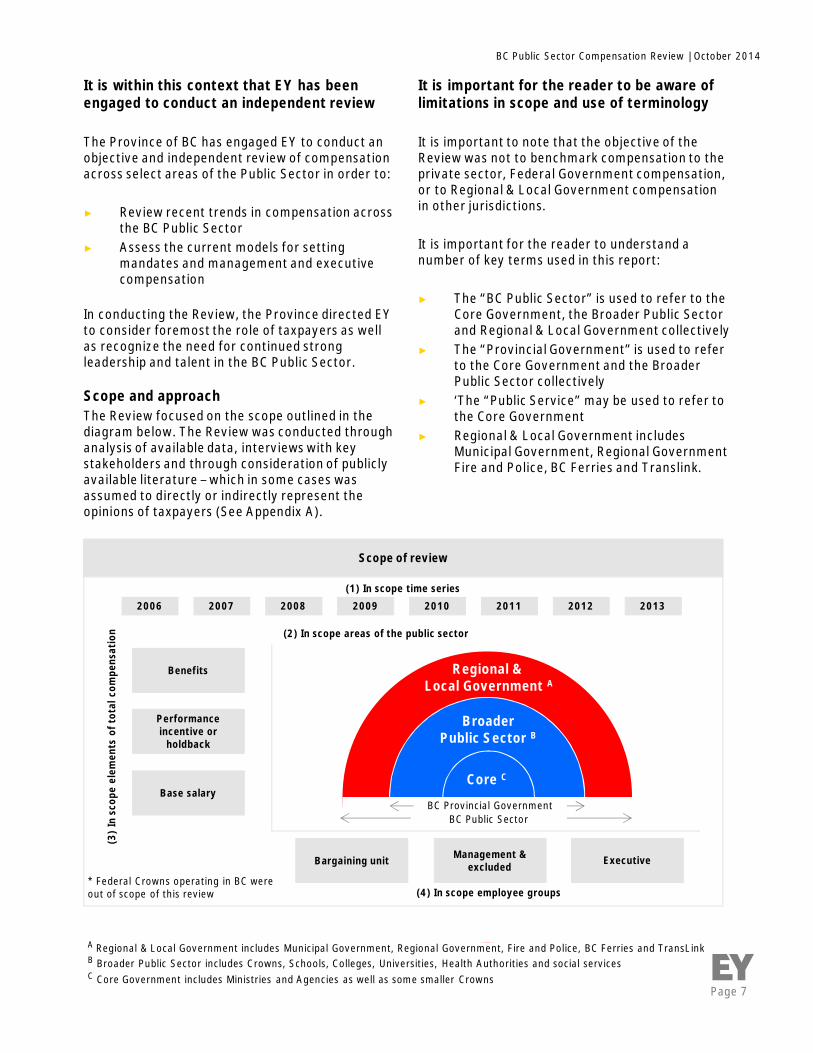
Scope and approachThe Review focused on the scope outlined in thediagram below. The Review was conducted throughanalysis of available data, interviews with keystakeholders and through consideration of publiclyavailable literature – which in some cases wasassumed to directly or indirectly represent theopinions of taxpayers (See Appendix A).
Core C
BroaderPublic Sector B
Regional &Local Government A
BC Provincial GovernmentBC Public Sector
It is within this context that EY has beenengaged to conduct an independent review
The Province of BC has engaged EY to conduct anobjective and independent review of compensationacross select areas of the Public Sector in order to:
► Review recent trends in compensation acrossthe BC Public Sector
► Assess the current models for settingmandates and management and executivecompensation
In conducting the Review, the Province directed EYto consider foremost the role of taxpayers as wellas recognize the need for continued strongleadership and talent in the BC Public Sector.
Scope of review
(4) In scope employee groups
(3)
Insc
ope
elem
ents
ofto
talc
ompe
nsat
ion
(1) In scope time series
(2) In scope areas of the public sector
2006 2007 2008 2009 2010 2011 2012 2013
Benefits
Performanceincentive or
holdback
Base salary
Bargaining unit Management &excluded Executive
* Federal Crowns operating in BC wereout of scope of this review
It is important for the reader to be aware oflimitations in scope and use of terminology
It is important to note that the objective of theReview was not to benchmark compensation to theprivate sector, Federal Government compensation,or to Regional & Local Government compensationin other jurisdictions.
It is important for the reader to understand anumber of key terms used in this report:
► The “BC Public Sector” is used to refer to theCore Government, the Broader Public Sectorand Regional & Local Government collectively
► The “Provincial Government” is used to referto the Core Government and the BroaderPublic Sector collectively
► ‘The “Public Service” may be used to refer tothe Core Government
► Regional & Local Government includesMunicipal Government, Regional GovernmentFire and Police, BC Ferries and Translink.
A Regional & Local Government includes Municipal Government, Regional Government, Fire and Police, BC Ferries and TransLinkB Broader Public Sector includes Crowns, Schools, Colleges, Universities, Health Authorities and social servicesC Core Government includes Ministries and Agencies as well as some smaller Crowns
Page 8
BC Public Sector Compensation Review | October 2014
3. Variation in recent trends in compensation within the sector
At the management and excluded level, the CorePublic Sector has been essentially frozen oncompensation since 2009. No comprehensive datawas available to analyse how well the BroaderPublic Sector is ‘holding the line’ on managementcompensation; however, analysis of a sample ofmanagement level pay bands in use in BroaderPublic Sector entities indicates that these bandsare materially higher than those used by the CoreGovernment. In addition, comparing both the paybands and actual compensation of Regional &Local Government managers to those of peers inthe Provincial Government indicates that Regional& Local Government is paying more in the majorityof cases for comparable management andexcluded roles.
At the bargaining unit level, data indicates thatRegional & Local Government employees coveredunder collective agreements have receivedsignificantly higher increases in compensation thanthose in the Core Government and Broader PublicSector between 2001 - 12. In addition, dataindicates that Regional & Local Government ispaying more than the Provincial Government in themajority of cases.
It is important to note that there is a fundamentaldifference between the compensation governanceof Provincial entities and Regional & LocalGovernment. The Province acts as both thelegislator and the employer, thus having morecontrol and power over employees’ compensation.Regional & Local Government does not have thissame direct control, and in addition the servicesthey provide are closer to the citizenry (e.g.garbage collection, recreation centres, etc.) andthus decision-makers feel enormous pressure notto disrupt these services. This fundamentaldifference, exacerbated by a lack of common dataand processes may explain the incrementalincreases we have observed in Regional & LocalGovernment compensation, particularly in theLower Mainland region.
It has been a challenge to access sufficientdata to allow a detailed comparison ofcompensation
The following section presents findings as tovariations in recent increases in compensation acrossthe BC Public Sector and absolute levels ofcompensation. It should be noted that significantdata limitations were encountered in constructingthis analysis, including but not limited to: lack of dataacross all areas of the BC Public Sector, limited timeseries of data, lack of comparability in terms of theelements of total compensation included in datareported, and lack of means of identifying job typeswith comparable roles and responsibilities. Inaddition, it should be noted that a number ofdisparate sources of data were collected to constructthis analysis. As a result, it has not been possible inall cases to present findings in the manner of aconsistent and integrated story.
Analysis of trends in compensation
While comprehensive data was not available tosupport robust and detailed analysis, available datasuggested a significant lack of alignment incompensation across the BC Public Sector. It shouldbe noted that robust data has become of increasingimportance in the move to open data andtransparency, but a structure for consistent anddetailed data is not yet available. Data to supportstatutory requirements and related policy is in placein the Provincial Government. Since local levels ofGovernment are not subject to the statutoryframework for the public sector, comparable data isnot available for Regional & Local Government.
At the executive level, evidence was found that theCore Government and to a lesser extent the BroaderPublic Sector have effectively ‘held the line’ oncompensation since 2009. Comparing thecompensation of the most senior levels of leadershipfor example, indicates that a significant number ofBroader Public Sector CEOs are paid more than theaverage Deputy Minister (“DM”) and that totalcompensation across this sector shows considerablevariability. In 2011, some Regional & LocalGovernment leaders were compensated at asignificantly higher level than leaders in the CoreGovernment.
Page 9
BC Public Sector Compensation Review | October 2014
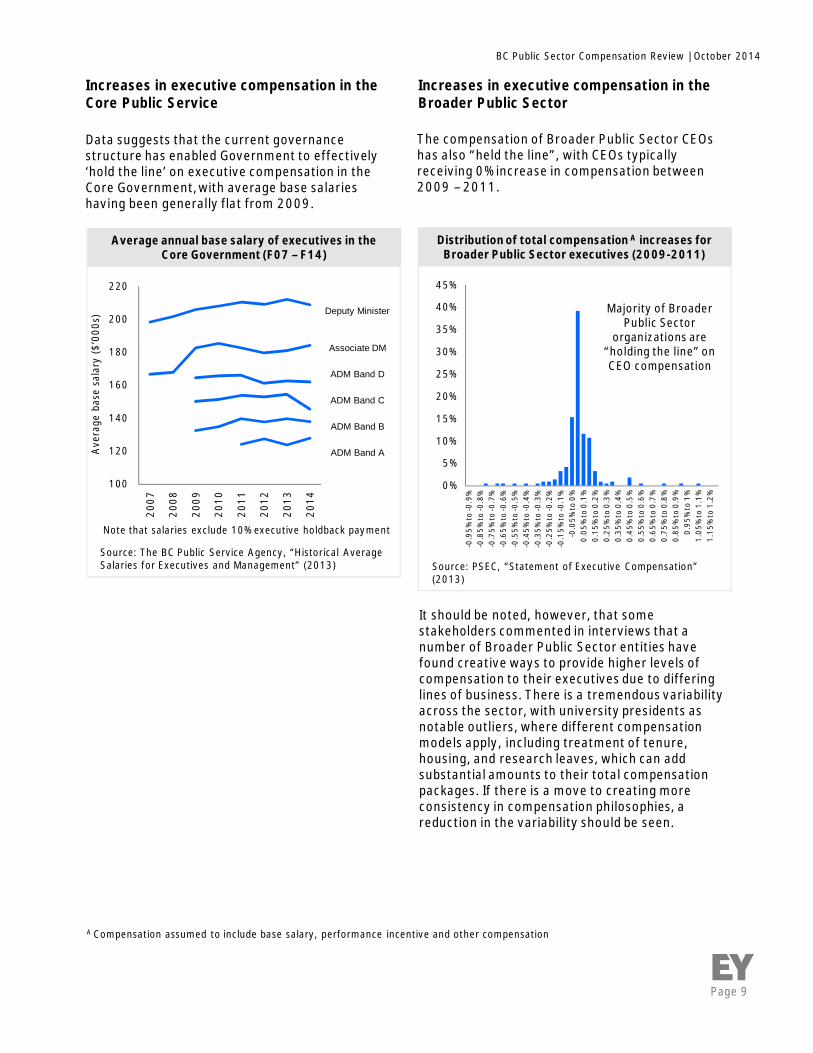
Data suggests that the current governancestructure has enabled Government to effectively‘hold the line’ on executive compensation in theCore Government,with average base salarieshaving been generally flat from 2009.
100
120
140
160
180
200
220
2007
2008
2009
2010
2011
2012
2013
2014
Ave
rage
base
sala
ry($
’000
s)
Average annual base salary of executives in theCore Government (F07 – F14)
0%
5%
10%
15%
20%
25%
30%
35%
40%
45%
-0.9
5%to
-0.9
%-0
.85%
to-0
.8%
-0.7
5%to
-0.7
%-0
.65%
to-0
.6%
-0.5
5%to
-0.5
%-0
.45%
to-0
.4%
-0.3
5%to
-0.3
%-0
.25%
to-0
.2%
-0.1
5%to
-0.1
%-0
.05%
to0%
0.05
%to
0.1%
0.15
%to
0.2%
0.25
%to
0.3%
0.35
%to
0.4%
0.45
%to
0.5%
0.55
%to
0.6%
0.65
%to
0.7%
0.75
%to
0.8%
0.85
%to
0.9%
0.95
%to
1%1.
05%
to1.
1%1.
15%
to1.
2%
Distribution of total compensation A increases forBroader Public Sector executives (2009-2011)
Majority of BroaderPublic Sector
organizations are“holding the line” onCEO compensation
The compensation of Broader Public Sector CEOshas also “held the line”, with CEOs typicallyreceiving 0% increase in compensation between2009 – 2011.
It should be noted, however, that somestakeholders commented in interviews that anumber of Broader Public Sector entities havefound creative ways to provide higher levels ofcompensation to their executives due to differinglines of business. There is a tremendous variabilityacross the sector, with university presidents asnotable outliers, where different compensationmodels apply, including treatment of tenure,housing, and research leaves, which can addsubstantial amounts to their total compensationpackages. If there is a move to creating moreconsistency in compensation philosophies, areduction in the variability should be seen.
Note that salaries exclude 10% executive holdback payment
Increases in executive compensation in theBroader Public Sector
Increases in executive compensation in theCore Public Service
A Compensation assumed to include base salary, performance incentive and other compensation
Deputy Minister
Associate DM
ADM Band D
ADM Band C
ADM Band B
ADM Band A
Source: The BC Public Service Agency, “Historical AverageSalaries for Executives and Management” (2013) Source: PSEC, “Statement of Executive Compensation”
(2013)
Page 10
BC Public Sector Compensation Review | October 2014
0
2
4
6
8
10
12
14
0to
50
100
to15
0
200
to25
0
300
to35
0
400
to45
0
500
to55
0
600
to65
0
700
to75
0
800
to85
0
900
to95
0
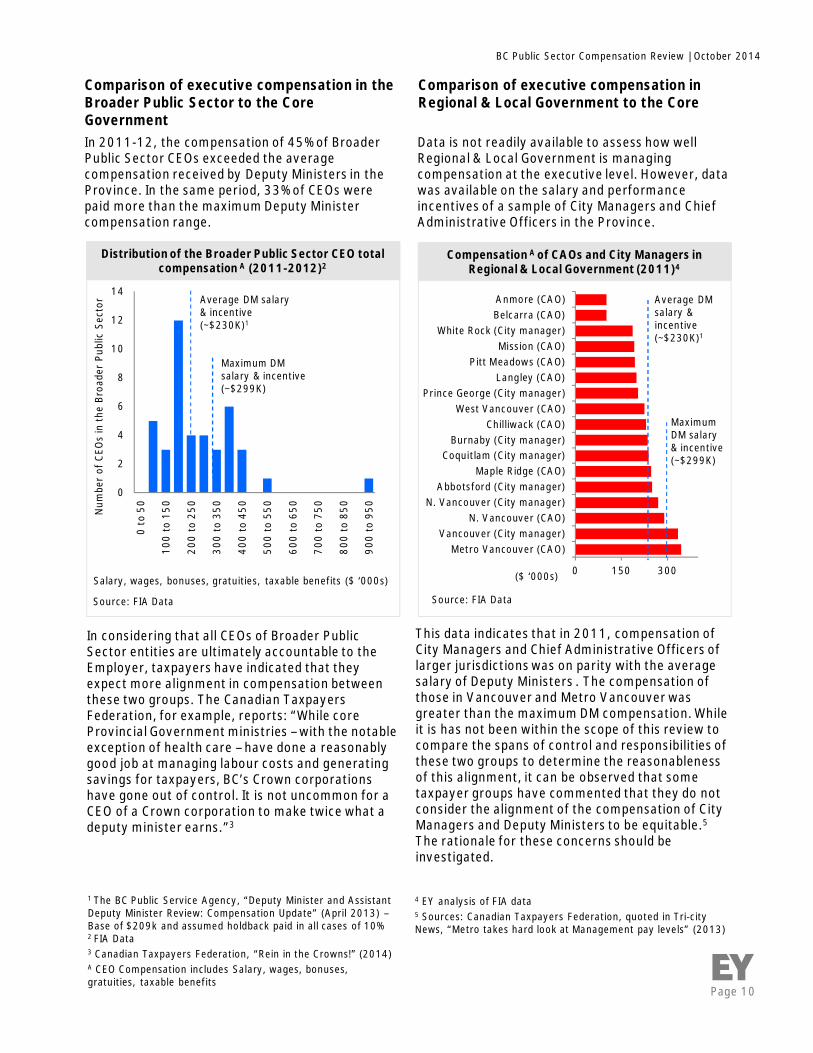
In 2011-12, the compensation of 45% of BroaderPublic Sector CEOs exceeded the averagecompensation received by Deputy Ministers in theProvince. In the same period, 33% of CEOs werepaid more than the maximum Deputy Ministercompensation range.
Distribution of the Broader Public Sector CEO totalcompensation A (2011-2012)2
Average DM salary& incentive(~$230K)1
1 The BC Public Service Agency, “Deputy Minister and AssistantDeputy Minister Review: Compensation Update” (April 2013) –Base of $209k and assumed holdback paid in all cases of 10%2 FIA Data3 Canadian Taxpayers Federation, “Rein in the Crowns!” (2014)A CEO Compensation includes Salary, wages, bonuses,gratuities, taxable benefits
In considering that all CEOs of Broader PublicSector entities are ultimately accountable to theEmployer, taxpayers have indicated that theyexpect more alignment in compensation betweenthese two groups. The Canadian TaxpayersFederation, for example, reports: “While coreProvincial Government ministries – with the notableexception of health care – have done a reasonablygood job at managing labour costs and generatingsavings for taxpayers, BC’s Crown corporationshave gone out of control. It is not uncommon for aCEO of a Crown corporation to make twice what adeputy minister earns.”3
Salary, wages, bonuses, gratuities, taxable benefits ($ ‘000s)
Num
ber
ofCE
Os
inth
eBr
oade
rPu
blic
Sect
orComparison of executive compensation in theBroader Public Sector to the CoreGovernment
0 150 300
Metro Vancouver (CAO)Vancouver (City manager)
N. Vancouver (CAO)N. Vancouver (City manager)
Abbotsford (City manager)Maple Ridge (CAO)
Coquitlam (City manager)Burnaby (City manager)
Chilliwack (CAO)West Vancouver (CAO)
Prince George (City manager)Langley (CAO)
Pitt Meadows (CAO)Mission (CAO)
White Rock (City manager)Belcarra (CAO)Anmore (CAO)
($ ‘000s)
Average DMsalary &incentive(~$230K)1
Compensation A of CAOs and City Managers inRegional & Local Government (2011)4
This data indicates that in 2011, compensation ofCity Managers and Chief Administrative Officers oflarger jurisdictions was on parity with the averagesalary of Deputy Ministers . The compensation ofthose in Vancouver and Metro Vancouver wasgreater than the maximum DM compensation. Whileit is has not been within the scope of this review tocompare the spans of control and responsibilities ofthese two groups to determine the reasonablenessof this alignment, it can be observed that sometaxpayer groups have commented that they do notconsider the alignment of the compensation of CityManagers and Deputy Ministers to be equitable.5
The rationale for these concerns should beinvestigated.
Comparison of executive compensation inRegional & Local Government to the Core
Data is not readily available to assess how wellRegional & Local Government is managingcompensation at the executive level. However, datawas available on the salary and performanceincentives of a sample of City Managers and ChiefAdministrative Officers in the Province.
Maximum DMsalary & incentive(~$299K)
4 EY analysis of FIA data5 Sources: Canadian Taxpayers Federation, quoted in Tri-cityNews, “Metro takes hard look at Management pay levels” (2013)
MaximumDM salary& incentive(~$299K)
Source: FIA Data Source: FIA Data
Page 11
BC Public Sector Compensation Review | October 2014
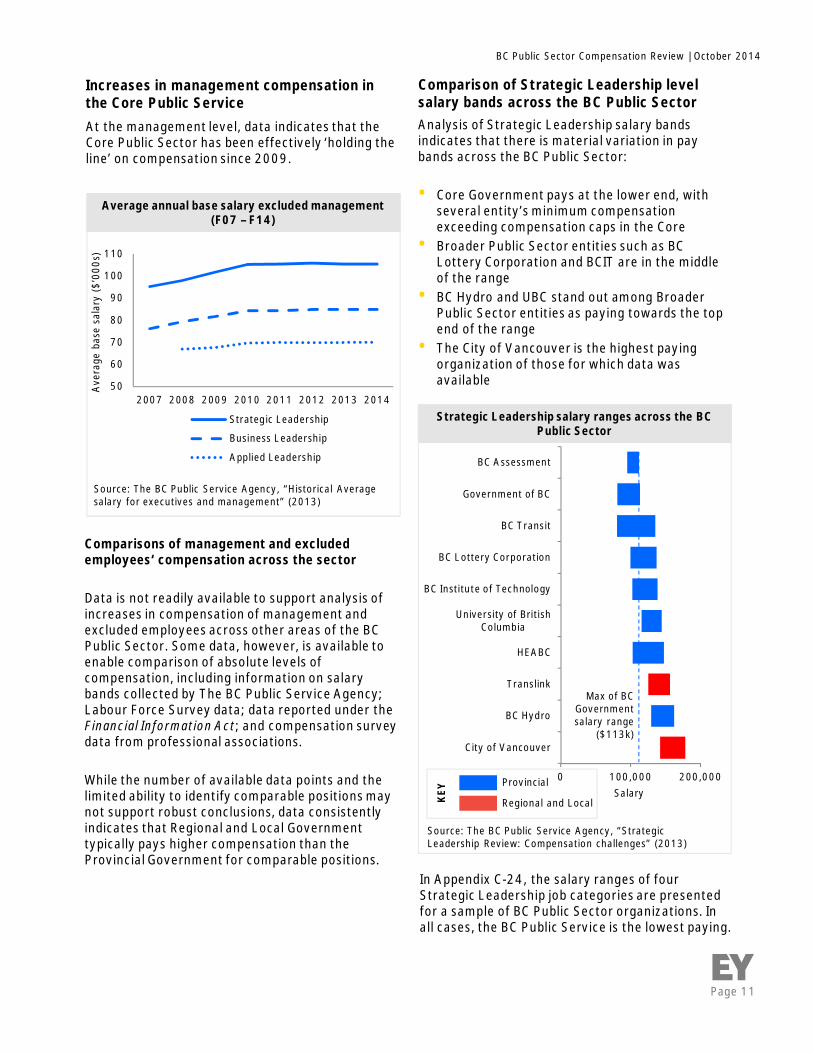
At the management level, data indicates that theCore Public Sector has been effectively ‘holding theline’ on compensation since 2009.
50
60
70
80
90
100
110
2007 2008 2009 2010 2011 2012 2013 2014
Ave
rage
base
sala
ry($
’000
s)
Strategic Leadership
Business Leadership
Applied Leadership
Average annual base salary excluded management(F07 – F14)
Source: The BC Public Service Agency, “Historical Averagesalary for executives and management” (2013)
0 100,000 200,000
City of Vancouver
BC Hydro
Translink
HEABC
University of BritishColumbia
BC Institute of Technology
BC Lottery Corporation
BC Transit
Government of BC
BC Assessment
Max of BCGovernmentsalary range
($113k)
Analysis of Strategic Leadership salary bandsindicates that there is material variation in paybands across the BC Public Sector:
• Core Government pays at the lower end, withseveral entity’s minimum compensationexceeding compensation caps in the Core
• Broader Public Sector entities such as BCLottery Corporation and BCIT are in the middleof the range
• BC Hydro and UBC stand out among BroaderPublic Sector entities as paying towards the topend of the range
• The City of Vancouver is the highest payingorganization of those for which data wasavailable
Strategic Leadership salary ranges across the BCPublic Sector
Source: The BC Public Service Agency, “StrategicLeadership Review: Compensation challenges” (2013)
Salary
Comparisons of management and excludedemployees‘ compensation across the sector
Data is not readily available to support analysis ofincreases in compensation of management andexcluded employees across other areas of the BCPublic Sector. Some data, however, is available toenable comparison of absolute levels ofcompensation, including information on salarybands collected by The BC Public Service Agency;Labour Force Survey data; data reported under theFinancial Information Act; and compensation surveydata from professional associations.
While the number of available data points and thelimited ability to identify comparable positions maynot support robust conclusions, data consistentlyindicates that Regional and Local Governmenttypically pays higher compensation than theProvincial Government for comparable positions.
Comparison of Strategic Leadership levelsalary bands across the BC Public Sector
Increases in management compensation inthe Core Public Service
Provincial
Regional and LocalKEY
In Appendix C-24, the salary ranges of fourStrategic Leadership job categories are presentedfor a sample of BC Public Sector organizations. Inall cases, the BC Public Service is the lowest paying.
Page 12
BC Public Sector Compensation Review | October 2014
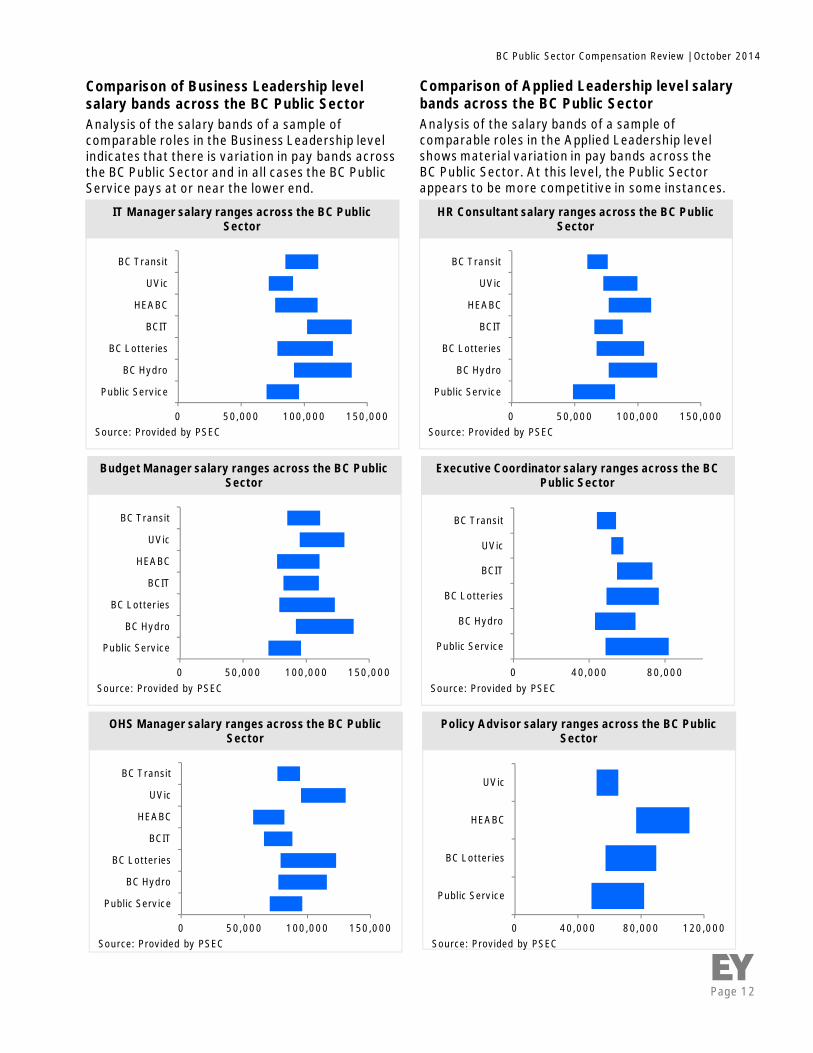
Comparison of Business Leadership levelsalary bands across the BC Public Sector
0 50,000 100,000 150,000
Public Service
BC Hydro
BC Lotteries
BCIT
HEABC
UVic
BC Transit
Analysis of the salary bands of a sample ofcomparable roles in the Business Leadership levelindicates that there is variation in pay bands acrossthe BC Public Sector and in all cases the BC PublicService pays at or near the lower end.
IT Manager salary ranges across the BC PublicSector
Source: Provided by PSEC
0 50,000 100,000 150,000
Public Service
BC Hydro
BC Lotteries
BCIT
HEABC
UVic
BC Transit
Budget Manager salary ranges across the BC PublicSector
Source: Provided by PSEC
0 50,000 100,000 150,000
Public Service
BC Hydro
BC Lotteries
BCIT
HEABC
UVic
BC Transit
OHS Manager salary ranges across the BC PublicSector
Source: Provided by PSEC
Comparison of Applied Leadership level salarybands across the BC Public SectorAnalysis of the salary bands of a sample ofcomparable roles in the Applied Leadership levelshows material variation in pay bands across theBC Public Sector. At this level, the Public Sectorappears to be more competitive in some instances.
0 50,000 100,000 150,000
Public Service
BC Hydro
BC Lotteries
BCIT
HEABC
UVic
BC Transit
HR Consultant salary ranges across the BC PublicSector
Source: Provided by PSEC
0 40,000 80,000
Public Service
BC Hydro
BC Lotteries
BCIT
UVic
BC Transit
Executive Coordinator salary ranges across the BCPublic Sector
Source: Provided by PSEC
0 40,000 80,000 120,000
Public Service
BC Lotteries
HEABC
UVic
Policy Advisor salary ranges across the BC PublicSector
Source: Provided by PSEC
Page 13
BC Public Sector Compensation Review | October 2014
0 50 100
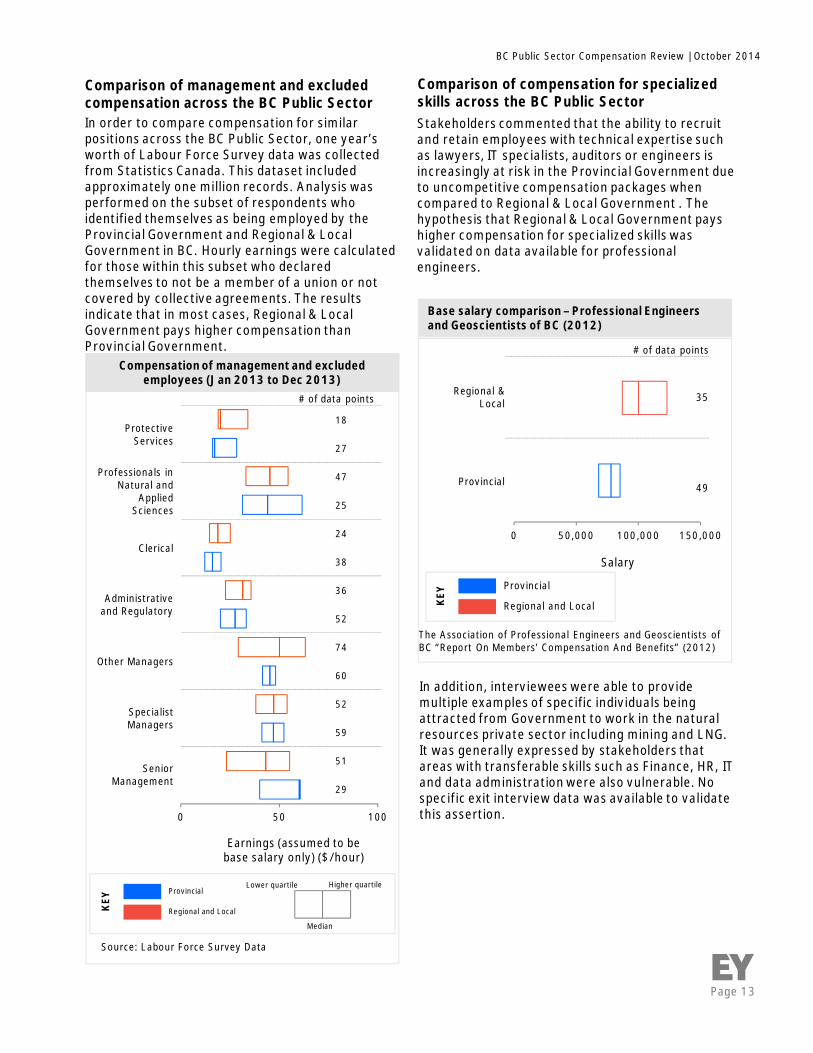
In order to compare compensation for similarpositions across the BC Public Sector, one year’sworth of Labour Force Survey data was collectedfrom Statistics Canada. This dataset includedapproximately one million records. Analysis wasperformed on the subset of respondents whoidentified themselves as being employed by theProvincial Government and Regional & LocalGovernment in BC. Hourly earnings were calculatedfor those within this subset who declaredthemselves to not be a member of a union or notcovered by collective agreements. The resultsindicate that in most cases, Regional & LocalGovernment pays higher compensation thanProvincial Government.
Compensation of management and excludedemployees (Jan 2013 to Dec 2013)
# of data points
18
27
47
25
24
38
36
52
74
60
52
59
51
29
Earnings (assumed to bebase salary only) ($/hour)
ProtectiveServices
Professionals inNatural and
AppliedSciences
Clerical
Administrativeand Regulatory
Other Managers
SpecialistManagers
SeniorManagement
Comparison of management and excludedcompensation across the BC Public Sector
0 50,000 100,000 150,000
The Association of Professional Engineers and Geoscientists ofBC “Report On Members’ Compensation And Benefits” (2012)
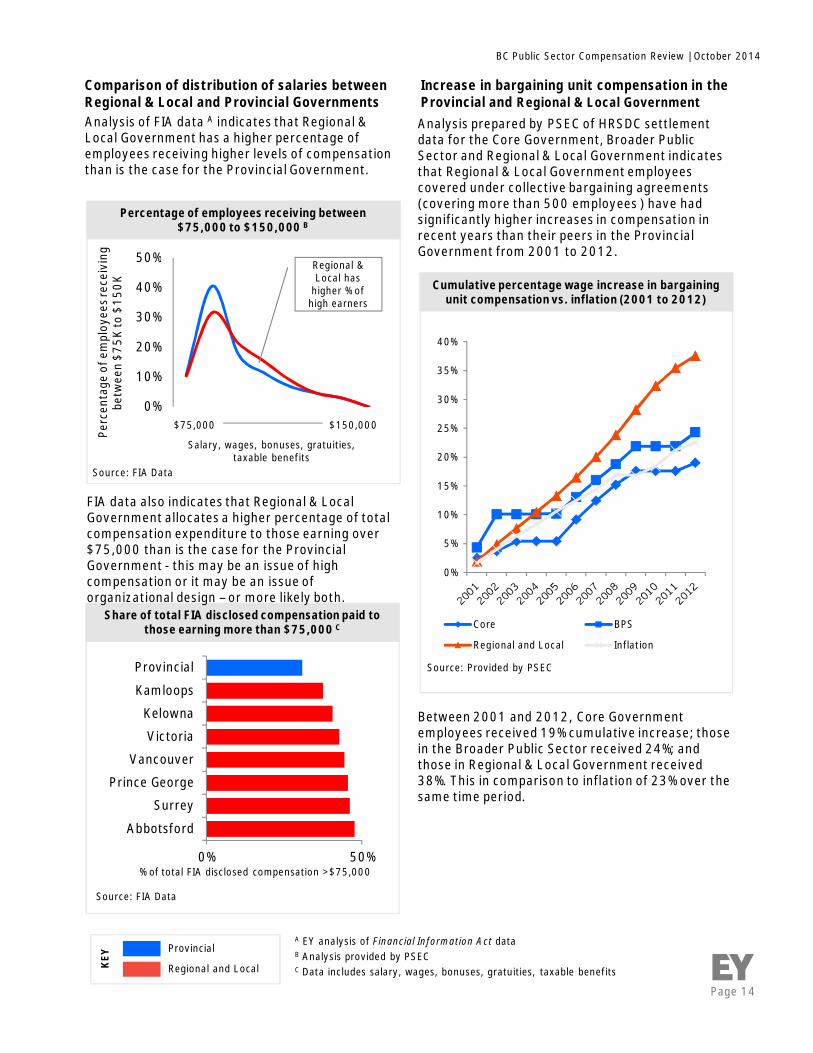
Base salary comparison – Professional Engineersand Geoscientists of BC (2012)
# of data points
Regional &Local 35
Provincial 49
Comparison of compensation for specializedskills across the BC Public SectorStakeholders commented that the ability to recruitand retain employees with technical expertise suchas lawyers, IT specialists, auditors or engineers isincreasingly at risk in the Provincial Government dueto uncompetitive compensation packages whencompared to Regional & Local Government . Thehypothesis that Regional & Local Government payshigher compensation for specialized skills wasvalidated on data available for professionalengineers.
In addition, interviewees were able to providemultiple examples of specific individuals beingattracted from Government to work in the naturalresources private sector including mining and LNG.It was generally expressed by stakeholders thatareas with transferable skills such as Finance, HR, ITand data administration were also vulnerable. Nospecific exit interview data was available to validatethis assertion.
Salary
Source: Labour Force Survey Data
Provincial
Regional and LocalKEY
Provincial
Regional and LocalKEY
Lower quartile Higher quartile
Median
Page 14
BC Public Sector Compensation Review | October 2014
0%
10%
20%
30%
40%
50%
$75,000 $150,000
Percentage of employees receiving between$75,000 to $150,000 B
Share of total FIA disclosed compensation paid tothose earning more than $75,000 C
0% 50%
Abbotsford
Surrey
Prince George
Vancouver
Victoria
Kelowna
Kamloops
Provincial
% of total FIA disclosed compensation >$75,000
Perc
enta
geof
empl
oyee
srec
eivi
ngbe
twee
n$7
5Kto
$150
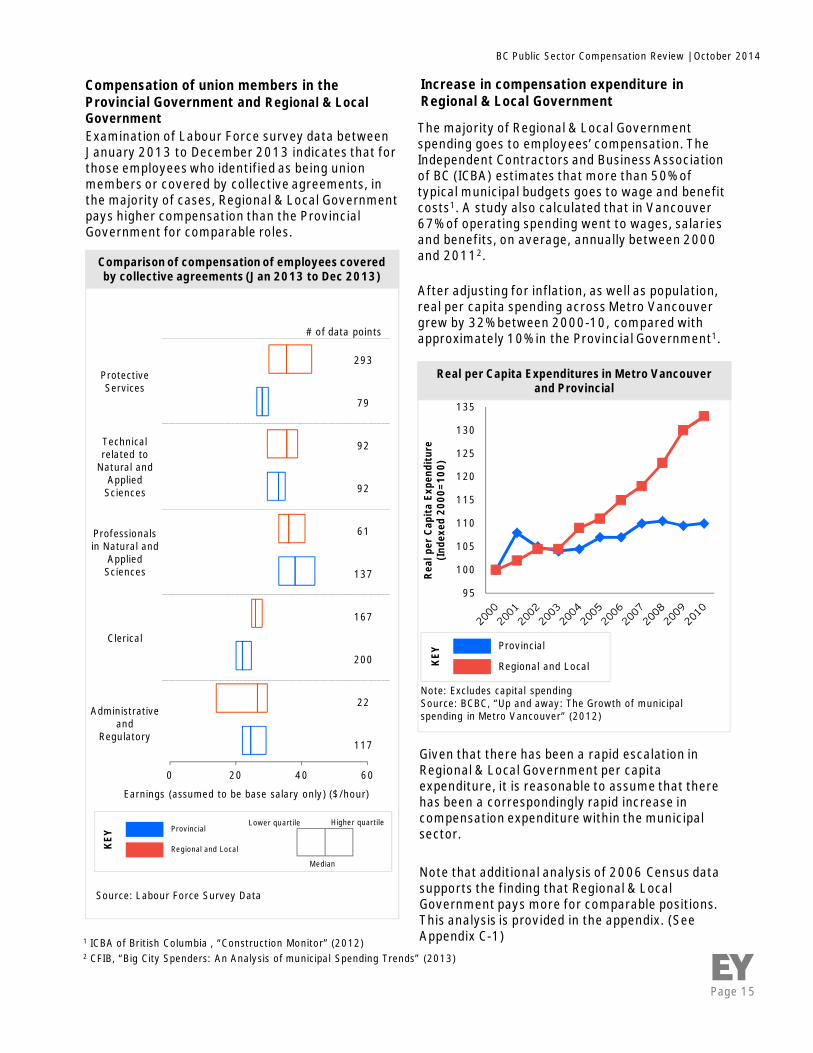
KAnalysis of FIA data A indicates that Regional &Local Government has a higher percentage ofemployees receiving higher levels of compensationthan is the case for the Provincial Government.
FIA data also indicates that Regional & LocalGovernment allocates a higher percentage of totalcompensation expenditure to those earning over$75,000 than is the case for the ProvincialGovernment - this may be an issue of highcompensation or it may be an issue oforganizational design – or more likely both.
A EY analysis of Financial Information Act dataB Analysis provided by PSECC Data includes salary, wages, bonuses, gratuities, taxable benefits
Regional &Local has
higher % ofhigh earners
Comparison of distribution of salaries betweenRegional & Local and Provincial Governments
Salary, wages, bonuses, gratuities,taxable benefits
Analysis prepared by PSEC of HRSDC settlementdata for the Core Government, Broader PublicSector and Regional & Local Government indicatesthat Regional & Local Government employeescovered under collective bargaining agreements(covering more than 500 employees ) have hadsignificantly higher increases in compensation inrecent years than their peers in the ProvincialGovernment from 2001 to 2012.
Cumulative percentage wage increase in bargainingunit compensation vs. inflation (2001 to 2012)
Increase in bargaining unit compensation in theProvincial and Regional & Local Government
Source: FIA Data
Source: FIA Data
Source: Provided by PSEC
Provincial
Regional and LocalKEY
0%
5%
10%
15%
20%
25%
30%
35%
40%
Core BPS
Regional and Local Inflation
Between 2001 and 2012, Core Governmentemployees received 19% cumulative increase; thosein the Broader Public Sector received 24%; andthose in Regional & Local Government received38%. This in comparison to inflation of 23% over thesame time period.
Page 15
BC Public Sector Compensation Review | October 2014
# of data points
ProtectiveServices
293
79
Technicalrelated to
Natural andApplied
Sciences
92
92
Professionalsin Natural and
AppliedSciences
61
137
Clerical
167
200
Administrativeand
Regulatory
22
117
0 20 40 60
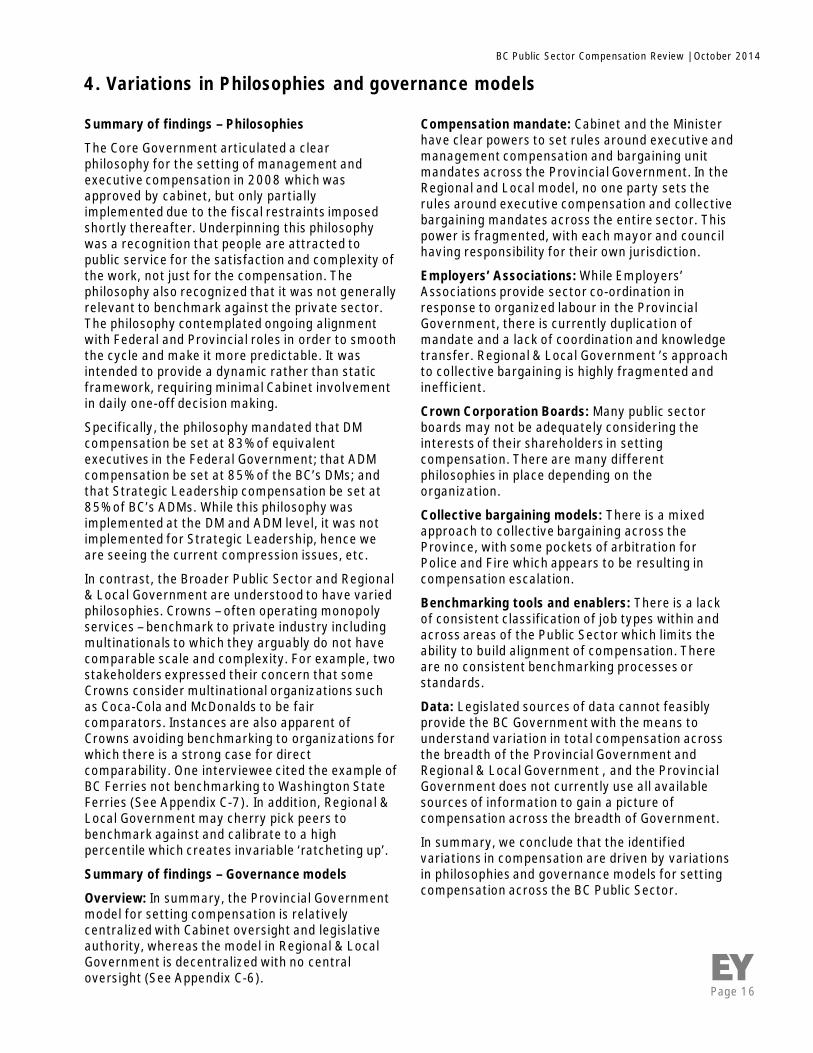
Examination of Labour Force survey data betweenJanuary 2013 to December 2013 indicates that forthose employees who identified as being unionmembers or covered by collective agreements, inthe majority of cases, Regional & Local Governmentpays higher compensation than the ProvincialGovernment for comparable roles.
Comparison of compensation of employees coveredby collective agreements (Jan 2013 to Dec 2013)
Earnings (assumed to be base salary only) ($/hour)
Compensation of union members in theProvincial Government and Regional & LocalGovernment
The majority of Regional & Local Governmentspending goes to employees’ compensation. TheIndependent Contractors and Business Associationof BC (ICBA) estimates that more than 50% oftypical municipal budgets goes to wage and benefitcosts1. A study also calculated that in Vancouver67% of operating spending went to wages, salariesand benefits, on average, annually between 2000and 20112.
After adjusting for inflation, as well as population,real per capita spending across Metro Vancouvergrew by 32% between 2000-10, compared withapproximately 10% in the Provincial Government1.
Increase in compensation expenditure inRegional & Local Government
95
100
105
110
115
120
125
130
135
Rea
lper
Cap
ita
Expe
ndit
ure
(Ind
exed
2000
=100
)
Note: Excludes capital spendingSource: BCBC, “Up and away: The Growth of municipalspending in Metro Vancouver” (2012)
Real per Capita Expenditures in Metro Vancouverand Provincial
1 ICBA of British Columbia , “Construction Monitor” (2012)2 CFIB, “Big City Spenders: An Analysis of municipal Spending Trends” (2013)
Given that there has been a rapid escalation inRegional & Local Government per capitaexpenditure, it is reasonable to assume that therehas been a correspondingly rapid increase incompensation expenditure within the municipalsector.
Note that additional analysis of 2006 Census datasupports the finding that Regional & LocalGovernment pays more for comparable positions.This analysis is provided in the appendix. (SeeAppendix C-1)
Source: Labour Force Survey Data
Provincial
Regional and LocalKEY
Provincial
Regional and LocalKEY
Lower quartile Higher quartile
Median
Page 16
BC Public Sector Compensation Review | October 2014
4. Variations in Philosophies and governance models
Compensation mandate: Cabinet and the Ministerhave clear powers to set rules around executive andmanagement compensation and bargaining unitmandates across the Provincial Government. In theRegional and Local model, no one party sets therules around executive compensation and collectivebargaining mandates across the entire sector. Thispower is fragmented, with each mayor and councilhaving responsibility for their own jurisdiction.
Employers’ Associations: While Employers’Associations provide sector co-ordination inresponse to organized labour in the ProvincialGovernment, there is currently duplication ofmandate and a lack of coordination and knowledgetransfer. Regional & Local Government ’s approachto collective bargaining is highly fragmented andinefficient.
Crown Corporation Boards: Many public sectorboards may not be adequately considering theinterests of their shareholders in settingcompensation. There are many differentphilosophies in place depending on theorganization.
Collective bargaining models: There is a mixedapproach to collective bargaining across theProvince, with some pockets of arbitration forPolice and Fire which appears to be resulting incompensation escalation.
Benchmarking tools and enablers: There is a lackof consistent classification of job types within andacross areas of the Public Sector which limits theability to build alignment of compensation. Thereare no consistent benchmarking processes orstandards.
Data: Legislated sources of data cannot feasiblyprovide the BC Government with the means tounderstand variation in total compensation acrossthe breadth of the Provincial Government andRegional & Local Government , and the ProvincialGovernment does not currently use all availablesources of information to gain a picture ofcompensation across the breadth of Government.
In summary, we conclude that the identifiedvariations in compensation are driven by variationsin philosophies and governance models for settingcompensation across the BC Public Sector.
Summary of findings – Philosophies
The Core Government articulated a clearphilosophy for the setting of management andexecutive compensation in 2008 which wasapproved by cabinet, but only partiallyimplemented due to the fiscal restraints imposedshortly thereafter. Underpinning this philosophywas a recognition that people are attracted topublic service for the satisfaction and complexity ofthe work, not just for the compensation. Thephilosophy also recognized that it was not generallyrelevant to benchmark against the private sector.The philosophy contemplated ongoing alignmentwith Federal and Provincial roles in order to smooththe cycle and make it more predictable. It wasintended to provide a dynamic rather than staticframework, requiring minimal Cabinet involvementin daily one-off decision making.
Specifically, the philosophy mandated that DMcompensation be set at 83% of equivalentexecutives in the Federal Government; that ADMcompensation be set at 85% of the BC’s DMs; andthat Strategic Leadership compensation be set at85% of BC’s ADMs. While this philosophy wasimplemented at the DM and ADM level, it was notimplemented for Strategic Leadership, hence weare seeing the current compression issues, etc.
In contrast, the Broader Public Sector and Regional& Local Government are understood to have variedphilosophies. Crowns – often operating monopolyservices – benchmark to private industry includingmultinationals to which they arguably do not havecomparable scale and complexity. For example, twostakeholders expressed their concern that someCrowns consider multinational organizations suchas Coca-Cola and McDonalds to be faircomparators. Instances are also apparent ofCrowns avoiding benchmarking to organizations forwhich there is a strong case for directcomparability. One interviewee cited the example ofBC Ferries not benchmarking to Washington StateFerries (See Appendix C-7). In addition, Regional &Local Government may cherry pick peers tobenchmark against and calibrate to a highpercentile which creates invariable ‘ratcheting up’.
Summary of findings – Governance models
Overview: In summary, the Provincial Governmentmodel for setting compensation is relativelycentralized with Cabinet oversight and legislativeauthority, whereas the model in Regional & LocalGovernment is decentralized with no centraloversight (See Appendix C-6).
Page 17
BC Public Sector Compensation Review | October 2014
4a. Philosophies
Core Government – compensation philosophy
Executive: In 2008, Cabinet approved a philosophyfor executive compensation in the Core Government.This philosophy mandated that Deputy Ministers’compensation be set at 83% of equivalent executivesin the Federal Government that Assistant DeputyMinister compensation be set at 85% of thecompensation of BC’s DMs. It was also determinedthat BC’s target position for executive compensationin the public sector was to rank 3rd to 5th highestamongst other Provincial Governments. A specificdetermination respecting the appropriate rankingwas to be made based on consideration ofdemographic and labour market trends, andeconomic variables.
Under this philosophy, the critical comparators forCore Government executives are the Canadianprovincial and federal jurisdictions. As a result, whilethe philosophy explicitly identifies the primarycompetitors for talent as including the privatesector, the philosophy makes it inappropriate to setcompensation based on private sector comparators.
Under this philosophy, ranges for executives werelast set in August 2008. While Cabinet approved thatexecutive salary ranges will be periodically reviewedsubject to changes in executive compensation in thefederal Government, there have been noadjustments to the salary ranges sinceimplementation because of the restraint measuressubsequently implemented.
Management: The Strategic Leadershipcompensation was mandated to be set at 85% of thecompensation of BC’s ADMs; however, while thisphilosophy was implemented at the DM and ADMlevel, it was not implemented for StrategicLeadership due to fiscal constraint.
Bargaining unit: Cabinet has the prerogative to setphilosophy in the form of mandates for increases inunionized employee compensation. Since 1993,bargaining within the Core Government has beengoverned by mandates established by theGovernment. (See Appendix C-2).
Broader Public Sector – compensation philosophy
The Government sets certain parameters for BroaderPublic Sector executive compensation. CEOcompensation maximums are set by PSEC across theBroader Public Sector in accordance with aclassification structure for entities that was last set in2008 (See Appendix C-3). Many Crowns perceivedthe classification categories to be illogical andinconsistent. In addition to CEO caps, in 2012, theGovernment introduced a policy to cap executivecompensation in Crowns at no more than 85% of CEOsalary.
Each organization develops and applies its ownphilosophy to create an executive compensationwithin these parameters. Analysis indicates littleconsistency in the philosophies applied by BroaderPublic Sector entities to develop compensation plans(See Appendix C-5). CEO salaries tend to be set at thetop of the available ranges.
At the bargaining unit level, Cabinet has theprerogative to set philosophy in the form of mandatesfor increases in compensation across the BroaderPublic Sector (See Appendix C-4). Since 1993,bargaining within the Broader Public Sector has beengoverned by the same mandates that have applied tothe Core Government. (See Appendix C-2).
Regional & Local Government – compensationphilosophy
A sample of 10 local Governments was investigated.Only one Government reported publicly on itscompensation philosophy. The compensationphilosophy for the one reported instance – that of theCity of Richmond – is to ensure that employeesreceive a base salary within the 75th percentile of thedefined external marketplace. It is assumed thatmaterial variation may exist in the compensationphilosophies applied across Regional & LocalGovernment (See Recommendation 2.1).
Page 18
BC Public Sector Compensation Review | October 2014
4b. Compensation Mandate
Under the Provincial Government model, theCabinet and Minister have powers to set thecompensation mandate across the ProvincialGovernment
The Cabinet may set mandates and rules for the CoreGovernment. The Public Sector Employers Act alsoprovides the Minister with the authority to: (1) directpublic sector employers to prepare compensationplans consistent with the Minister’s direction; (2)requires that employee compensation plans andcontracts be approved by the Minister responsiblefor the Act prior to implementation; (3) empowersthe Minister to direct parties to provide specificinformation including information on themethodology used in devising plans, and (4)comparisons of actual compensation provided topersons employed in the same or similar sector,position or occupation. The Minister also has thepower to issue mandates covering public sectorbargaining.1
There are a number of exceptions in theProvincial model
A number of Government entities are excluded fromthe provisions of the Public Sector Employers Actand the Public Service Act that are not directlycontrolled by the centre, e.g.: BC InvestmentManagement Corporation, British Columbia FerryServices and TransLink.
While not explicitly covered by Government rules andmandates, these entities are ultimately accountableto the Government, and generally claim to followGovernment’s guidelines in setting employeecompensation. For example, a recent TransLinkspokesperson commented: “while we are not aCrown corporation, we operate prudently withinGovernment guidelines." With a 14% increase in thenumber of employees making over $100,000 dollarsin TransLink in 2012, a number of communities ofinterest have expressed doubts about the validity ofsuch claims.2 In summary, the additional levels ofcompensation autonomy have led to someembarrassment for Government over one-off oroverly rich compensation for executives.
In Regional & Local Government, no one partysets mandates and rules across the entiresector. This power is fragmented
In Regional & Local Government, there is no entity,policy or procedure across the sector that is intendedto support the establishment of sector wide rules onexecutive compensation and mandates for bargainingunit compensation.
Authority for setting compensation is held byindividual decision-makers, which have theprerogative to set direction for their region only.While there are indications that Regional & LocalGovernment expenditure constraints exist, (e.g.Metro Vancouver regional Government scrappedplans to raise taxes and fees by 12%, and set a newtarget that limits the increase for each household to amaximum of 2.5% in 2013), stakeholders generallypointed out concerns around the lack of governanceto enable setting of consistent Regional & LocalGovernment mandates to constrain compensationgrowth. Without such governance, unions can focusefforts on Regional & Local Government whereoutcomes are more likely to be favourable and usethe resulting agreements to ratchet up increases inother Regional & Local Government. No evidence wasfound, however, of other jurisdictions in Canadasetting consistent regional mandates and rules apartfrom in the face of extreme fiscal pressure (SeeAppendix C-9).
In conclusion, the variation in models for settingmandates and rules across the three groups results ina lack of alignment in compensation across the PublicSector. (See Recommendation 2.1) .
1 BCPSEA, “Public Sector Management & Executive Compensation Freeze Policy” (2012)2 Newsleader, “TransLink staff earning 6-figure salaries” (2013)
Page 19
BC Public Sector Compensation Review | October 2014
4c. Strategic advice, coordination and enforcement
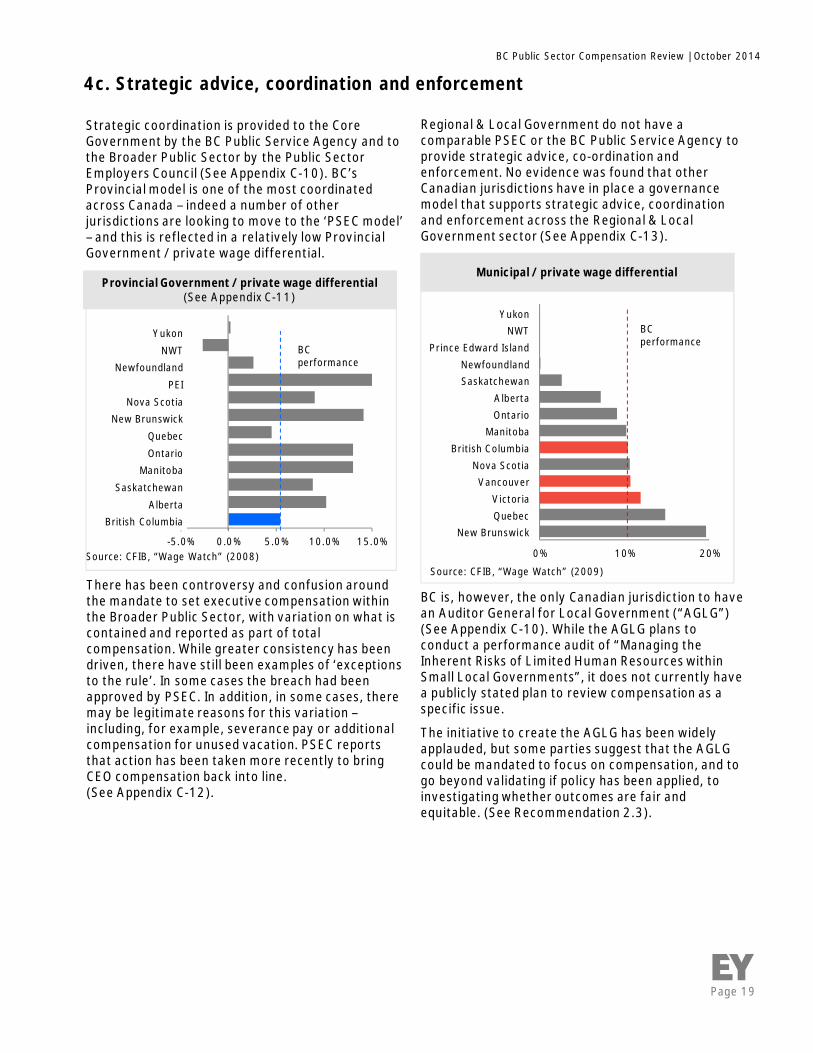
Strategic coordination is provided to the CoreGovernment by the BC Public Service Agency and tothe Broader Public Sector by the Public SectorEmployers Council (See Appendix C-10). BC’sProvincial model is one of the most coordinatedacross Canada – indeed a number of otherjurisdictions are looking to move to the ‘PSEC model’– and this is reflected in a relatively low ProvincialGovernment / private wage differential.
Regional & Local Government do not have acomparable PSEC or the BC Public Service Agency toprovide strategic advice, co-ordination andenforcement. No evidence was found that otherCanadian jurisdictions have in place a governancemodel that supports strategic advice, coordinationand enforcement across the Regional & LocalGovernment sector (See Appendix C-13).
-5.0% 0.0% 5.0% 10.0% 15.0%
BCperformance
Yukon
NWTNewfoundland
PEI
Nova ScotiaNew Brunswick
Quebec
OntarioManitoba
Saskatchewan
AlbertaBritish Columbia
There has been controversy and confusion aroundthe mandate to set executive compensation withinthe Broader Public Sector, with variation on what iscontained and reported as part of totalcompensation. While greater consistency has beendriven, there have still been examples of ‘exceptionsto the rule’. In some cases the breach had beenapproved by PSEC. In addition, in some cases, theremay be legitimate reasons for this variation –including, for example, severance pay or additionalcompensation for unused vacation. PSEC reportsthat action has been taken more recently to bringCEO compensation back into line.(See Appendix C-12).
Provincial Government / private wage differential(See Appendix C-11)
Source: CFIB, “Wage Watch” (2008)
BC is, however, the only Canadian jurisdiction to havean Auditor General for Local Government (“AGLG”)(See Appendix C-10). While the AGLG plans toconduct a performance audit of “Managing theInherent Risks of Limited Human Resources withinSmall Local Governments”, it does not currently havea publicly stated plan to review compensation as aspecific issue.
The initiative to create the AGLG has been widelyapplauded, but some parties suggest that the AGLGcould be mandated to focus on compensation, and togo beyond validating if policy has been applied, toinvestigating whether outcomes are fair andequitable. (See Recommendation 2.3).
0% 10% 20%
New BrunswickQuebecVictoria
VancouverNova Scotia
British ColumbiaManitoba
OntarioAlberta
SaskatchewanNewfoundland
Prince Edward IslandNWT
YukonBCperformance
Municipal / private wage differential
Source: CFIB, “Wage Watch” (2009)
Page 20
BC Public Sector Compensation Review | October 2014
4d. Employers’ Association
The BC Public Service Agency providesemployers’ association services to the CoreGovernment
Under the Public Service Labour Relations Act, theBC Public Service Agency has the responsibility toact as the bargaining agent on behalf of theGovernment, with those unions which representemployees directly employed by the Government.
Six Employers’ Associations provide servicesto the Public Sector
The purposes of an Employers’ Association are tocoordinate the following with respect to the sectorfor which they are responsible:1
• Compensation for employees who are not subjectto collective agreements
• Benefit administration
• Human resource practices
• Collective bargaining objectives . Note that anEmployers’ Association may bargain collectivelyon behalf of its members if authorized to do so
In addition, it is the purpose of an EA to:
• Foster consultation between the association andrepresentatives of employees in that sector
• Assist the council in carrying out any objectivesand strategic directions established by the councilfor the employers' association
While Employers’ Associations provide sector co-ordination in response to organized labour in theProvincial Government, stakeholders commentedthat there is currently duplication of mandate and alack of coordination and knowledge transfer.(See Recommendation 2.4) .
At Regional & Local Government level, there isdisparity in the power of those at the table
At the smaller local Government level, electedofficials are often unwilling to delegate bargaining toprofessionals, despite the lack of skills of theirnegotiating teams compared to their unioncounterparts.2 No evidence was found ofcoordination in smaller municipalities in BC.
Vancouver and Victoria have built more co-ordinatedresponses to organized labour in the form of theLabour Relations department of Metro Vancouverand the Greater Victoria Labour RelationsAssociation. However, the co-ordination of labourrelations in the Lower Mainland, is increasinglyfragmented with members leaving the association.(See Appendix C-14)
The implications of the lack of co-ordination areclear. The vast majority of Regional and LocalGovernment workers are part of large andsophisticated unions. Even local Government unions,for example, are local chapters of the Canadian Unionof Public Employees, which is a member of theCanadian Labour Congress. CUPE provides evensmall local unions with sophisticated assistance forbargaining and contract negotiations. (See AppendixC-15).
As Langley Township Councillor, Bob Longcommented: “It would be nice if we were all members[of the Bureau]. We don’t have the resources in mytownship [to bargain on our own] … but the reality isthe big players want to leave. We wish them the best,but we’re all going to be paying for it.” Without a co-ordinated response to organized labour, there is areal risk, that unions can divide and conquer’. As onestakeholder observed in interview, unions can targeta given Regional and Local Government whichexhibits a more favourable attitude towards unioninterests and use that factor to secure a favourableoutcome at the bargaining table.This then sets theprecedent for negotiations with other municipalities.As Port Moody Mayor Joe Trasolini commented:“Nobody can tell me any contract negotiating in onecity is not going to be part and parcel of thenegotiations in another municipality”.3
In conclusion, Regional & Local Governmentapproach to collective bargaining is highlyfragmented and inefficient (See Recommendation2.5).
1 Government of BC, “Public Sector Employers Act” (2013)2 R.L. Bish, “Local Government in British Columbia” (2008)3 Vancouver Sun, “Labour Relation’s broken” (2011)
Page 21
BC Public Sector Compensation Review | October 2014
4e. Crown Corporation Boards
Most entities in the Broader Public Sectorhave their own boards
The Boards have responsibility for settingcompensation philosophy, approving compensationplans, and ensuring that executive compensationpaid is within approved plans. In the case of Crownsand school districts, there are boards of directors,and in the case of universities, there are boards ofgovernors.
One of PSEC’s intended roles is to provide a controlon the risk for excessive executive compensation, atthe same time, there is an expectation that Boards ofDirectors act in the interests of their shareholders(i.e. the Government and population) and act to keepexecutive compensation costs at reasonable levelsand follow Government guidelines.
Crown compensation categories were established in2006, amid significant controversy. Eachorganization was placed in a specific category, andthese were not subsequently updated. Crowncompensation categories have subsequently beenreplaced by CEO compensation maximums – themaximum sets the highest level for the rest of theorganization. Boards spend significant time andenergy in determining compensation for theirexecutive and employees, but are given little in theway of standard tools, benchmarking guidelines,comparable data and processes to support theirdecision making.
While Boards can be replaced, there are few othermechanisms to hold Boards accountable fordecisions that they make with respect tocompensation. There is a wide variation in skill setsand compensation expertise on Crown broads, aswell as confusion as to their role in establishingcompensation. There is concern that Boards do notalways consider the interests of their shareholders inproposing and setting compensation; one seniorinterviewee commented that they may even be“being held captive by their executives” on thematter of compensation. A number of communitiesof interest have also highlighted this concern.
A number of stakeholders commented that Boards inboth the Provincial and Regional & Local Governmentmight benefit from retraining as to their fundamentalroles and responsibilities including ethics, operatingvalues and codes of conduct. It was suggested thatsuch efforts are already underway on the ProvincialGovernment side.
There are examples of the use of compensationcommittees in the Broader Public Sector. UBC’sboard of directors, for example, delegatesresponsibilities for executive compensation to itsManagement Resources Compensation Committee. Itappears some municipalities may have suchcommittees. However, other smaller municipalities donot have compensation committees.
In conclusion, while Boards have internal guidelinesand standards for determining compensation, thoseguidelines are not necessarily consistent across thepublic sector. Furthermore, they may not beadequately considering the interests of theirshareholders in setting compensation, nor be awareof their fundamental responsibilities.(See Recommendation 2.2).
Page 22
BC Public Sector Compensation Review | October 2014
4f. Benchmarking tools
The approach to benchmarking is also highlyfragmented in Regional & Local Government
In addition, evidence from individual municipalitiesoutside of the Lower Mainland suggests that theyinitiate their own benchmarking studies to supportcompensation setting. It is not apparent thatcentralized benchmarking sources are available tomunicipalities in BC. This is in contrast to Ontario,where every year Mercer and the Ontario municipalHuman Resources Association (OMHRA) – anorganization created to enable the sharing ofinformation and ideas between municipalities in theProvince – issues the Ontario municipalCompensation Survey:
► The survey consists of 222 benchmark jobsfor municipalities across Ontario
► In addition to compensation data,participants are also be able to accessinformation on pay policies and practicessuch as job rate adjustments, performancepay, attraction and retention, hours of work,overtime, vacation entitlement, automobilebenefits and more
► Mercer also offers a small municipalitiesreport, which includes data for 32 of the 222survey positions1
It can be considered that the approach in Ontariowould potentially:
► Optimize the efficiency of benchmarking
► Increase the population considered forcomparison
► Increase the reliability of analysis
In conclusion, there are no standardized tools andsupport for benchmarking across either the BroaderPublic Sector or Regional & Local Government (Seerecommendation 1.3).
1 Mercer, “Ontario municipal Compensation Survey” (2012)
No evidence was found of a comprehensivemapping table across the BC Public Sector
In order to enable meaningful comparisons betweenorganizations, a mapping of job types acrossorganizations of some sort is required. While a fullmapping table is the 'holy grail' across alljurisdictions, no evidence was found that BC has astandard approach to comparators, that wouldenable meaningful analysis of a ‘single source oftruth’ dataset. The lack of a standardized mappingtool restricts the ability to implement philosophieseffectively.
Broader Public Sector entities conduct theirown benchmarking
Typically Broader Public Sector entities conduct theirown benchmarking generally through the hiring ofthird party consultants. There is no consistent use ofcomparators - some Crowns use private sectormultinationals, for instance. There are, howeversome exceptions to this. For example, VIHA, PHSAand Interior Health rely on HEABC to develop salaryranges based on 50th percentile of the blendedhealthcare and external market pay policy guidelines.
Page 23
BC Public Sector Compensation Review | October 2014
Unions may have undue influence in thecollective bargaining process at Regional &Local Government level
The model of collective bargaining was originallyadopted by the Public Sector from the privatesector. It is now held as a basic principle in mostareas of the Public Sector that employees andemployers should voluntarily agree the conditionsof employment, with either side having the right towithhold agreement through strikes or lockouts.However, as much academic and community ofinterest literature on the topic argues, this modelhas two key potential implications for most public-sector activities that are fundamentally different tothe implications in the private sector:
► Influence of strikes on political players:When work ceases in the public sector,services cease to be available which causessignificant inconvenience for citizens. Theinconvenience may potentially cause theelectorate to withhold support or deliberatelyvote against elected officials in power at thetime of the work-stoppage at future elections
► Political influence of unions: Union membersmay contribute to campaigns or work onbehalf of elected officials who promise toprovide them with more generous settlementsor to increase services and may work againstthose who promise to cut taxes or reduceservices. (See appendix C-16)
Some stakeholders interviewed speculated that thispressure may be more acutely felt at the municipallevel, where municipal employees may have astrong influence on election results, if they decideto organize. Stakeholders commented that turnoutat municipal elections is much lower than at theProvincial level which gives such political action agreater impact on outcomes. Unions may thereforebe able to influence compensation policy inadvance. 3 In addition, unlike the ProvincialGovernment, Regional & Local Government cannotlegislate employees “back to work”, and faceshigher pressure due to the immediacy of theservices at risk, such as refuse collection. A numberof stakeholders summarized this as municipalitiesbeing more prone to “union capture”4.See recommendation 2.5).
1 Labour Relations Board BC, “Guide to the Labour RelationsCode Province of BC (2014)2 JIBC, “Police Compensation/ Negotiation of Contractsvideo” (2013)3 R.L. Bish, “Local Government in British Columbia” (2008)4 The Fraser Institute, “Wage board: The solution to reiningin public sector compensation” (2012)
4g. Collective bargaining models and processes
There is a mix of arbitration and collectivebargaining models in Regional & LocalGovernment
In BC, legislation requires employers and unions tomaintain certain essential services to the public whenthey take job action in a labour dispute. Essentialservices are those related to the health, safety or thewelfare of BC residents, or to the provision of primaryor secondary education programs and specificallyinclude Fire and Police Services.1
Under the Fire and Police Services CollectiveBargaining Act, strike action is not permissible forFire and Police services and in the event of a failureto reach a collective bargaining agreement thedispute must be referred to an arbitrator.
There is a belief amongst some parties thatarbitrators match outcomes to those of recentsettlements already established in the larger cities.For example, the Deputy Chief Officer of AbbotsfordPolice Department argues that police compensation inBC is largely set by aligning compensation to the ‘Big12’ police services boards in Ontario. When one of the‘Big 12’ boards will reach negotiated settlements andthis becomes the benchmark or standard foreveryone else. 2 As a result, a number of parties areattempting to change the current arbitration systemin BC. (See appendix C-17).
It is interesting to note, however, that under currentlegislation, the BC Government already has the rightto specify specific terms of reference for arbitration.This could be used to limit the range of outcomes.Indeed, academic studies suggest that if arbitration isset up to consider a range of factors, it will havecomparable outcomes to mediation.(See appendix C-17).
In conclusion, there is a mixed approach to collectivebargaining across the Province, with some pockets ofarbitration for Police and Fire which stakeholdersbelieve may be resulting in compensation escalation.(See recommendation 2.6).
Page 24
BC Public Sector Compensation Review | October 2014
The BC Government does not currently use allavailable sources of information to gain apicture of compensation across the breadth ofGovernment
There are legislated requirements for the publicreporting of public sector compensation in BritishColumbia. There are also a number of aggregatedata sources available from Statistics Canada andother sources (See Appendix C-18).
The BC Government has made initial efforts to usethese sources to begin to understand variation incompensation across the breadth of the PublicSector. Not all sources are currently used, however.For example, data reported under the FinancialInformation Act is not currently collected,aggregated or analysed by the Government. Whilethe data may be available on organizations’respective websites, to collect this data would takeconsiderable time and effort. This is compoundedby the fact that many organizations report theirdata in scanned ‘hard copy’, limiting the ability toextract and manipulate data. It is worth noting thatthe Vancouver Sun has collected and aggregatedthis data in electronic format over the last six years,through Freedom of Information requests submittedto individual organizations across both theProvincial Government and Regional & LocalGovernment . This dataset is, in turn, madeavailable in searchable form to the public.
In addition, available sources of data cannotfeasibly provide the BC Government with themeans to understand variation in totalcompensation across the arms of the ProvincialGovernment and Regional & Local Government
One of the major constraints identified inconducting this Review was the availability andcomparability of compensation data of employeesacross the BC Public Sector. In order todemonstrate this, in the appendix three primarysources are reconciled against a number of keyfundamentals required to provide meaningfulcomparisons across organizations within the BCPublic Sector including: data being available for allareas of Government; reported for employees;including all elements of total compensation;including information on FTEs; including jobdescriptions and provided with regular frequency inelectronic format. (See Appendix C-19).
4h. Data
The lack of standardized data createssignificant limitations
The lack of means to build a single compensationdataset means that entities within the BC PublicSector lack a key foundational dataset to enablecomparison and setting of compensation. In additionthe BC Government does not have at its disposal the‘evidence base’ to identify and analyse (and therebypotentially oversee and control if so desired)compensation across the different arms ofGovernment, including considering comparabilityacross the Public Sector and understanding andmaking trade-offs as required.
In the absence of a single dataset collected throughlegislated requirements, stakeholders are required tosupplement data through creative and more timeintensive means most notably through the use ofsurveys.
The absence of an aggregated dataset means that itis not possible to meaningfully investigate, validate orrefute the analysis by communities of interest oracademics of public sector compensation built onother aggregate data sources such as Census data orthe Labour Force Survey. (See recommendation 1.4).

Page 25
BC Public Sector Compensation Review | October 2014
5. Talent management implications of recent trends in compensation
Summary of findings
While the variation between Core Government and other areas within the Province is of greatest concern, itis important to consider the talent management implications of freezes in compensation in the Core.
Data indicates that at the Strategic Leadership level, BC is not achieving its target philosophy of paying the50th percentile of the BC public sector. Analysis of compensation ranges of a sample of 10 other BC PublicSector entities suggests that the Core Government’s Strategic Leadership pay band is 25% lower than the50th percentile and as a result BC is the second lowest paying jurisdiction in Canada. The top of the bandwas never adjusted to 85% of the ADM range, and thus is too low to be competitive. While data indicatesthat this issue has not yet led to high levels of attrition, there is a risk that the Strategic Leadership groupcould be drawn to seek employment in the Broader Public Sector and Regional & Local Government as adirect result of compensation. The private sector, especially in the natural resource industries, is alsoconsidered to be an increasing draw for talent.
Data shows that compression between employees covered under the collective agreements and managersin the Provincial Government is real. Stakeholders commented many unionized employees are reluctant tobe promoted on the grounds that they will receive less compensation while being given additionalresponsibilities.
Executive holdbacks are poorly understood by the public, considered punitive by internal employees, andthere is increasing concern amongst stakeholders that they are not an effective means of driving desiredperformance outcomes.
0 50 100 150 200 250 300 350
Bargaining unit
Applied leadership
Business leadership
Strategic leadership
Assistant Deputy Minister Band A
Assistant Deputy Minister Band B
Assistant Deputy Minister Band C
Assistant Deputy Minister Band D
Deputy Minister
Deputy Minister of the Premier
Compensation ($’000)
Key issues mapped to prescribed salary ranges within the Core Government A
Issue #3: Compression exists between Bargaining unit andmanagement, created by lack of increase in managementcompensation from 2009 and restrictions on movement ofindividuals within management bands
Issue #2: Because the 2008 compensation philosophywas never implemented at Strategic Leadership level,the top end of this band is too low and thus pay isuncompetitive
Issue #1: The BCGovernment is notmaking full use of itsexisting compensationbands at DM/ADM level
The years of compensation freezes within the Core Government have led to a number oftalent management issuesInterviews with stakeholders suggested three “hot spots” with respect to talent issues in the CoreGovernment and to a lesser extent the Provincial Government. These issues are outlined and explored inmore detail below.
A No salary bands for Bargaining unit employees – data indicates range of actual compensation
Page 26
BC Public Sector Compensation Review | October 2014
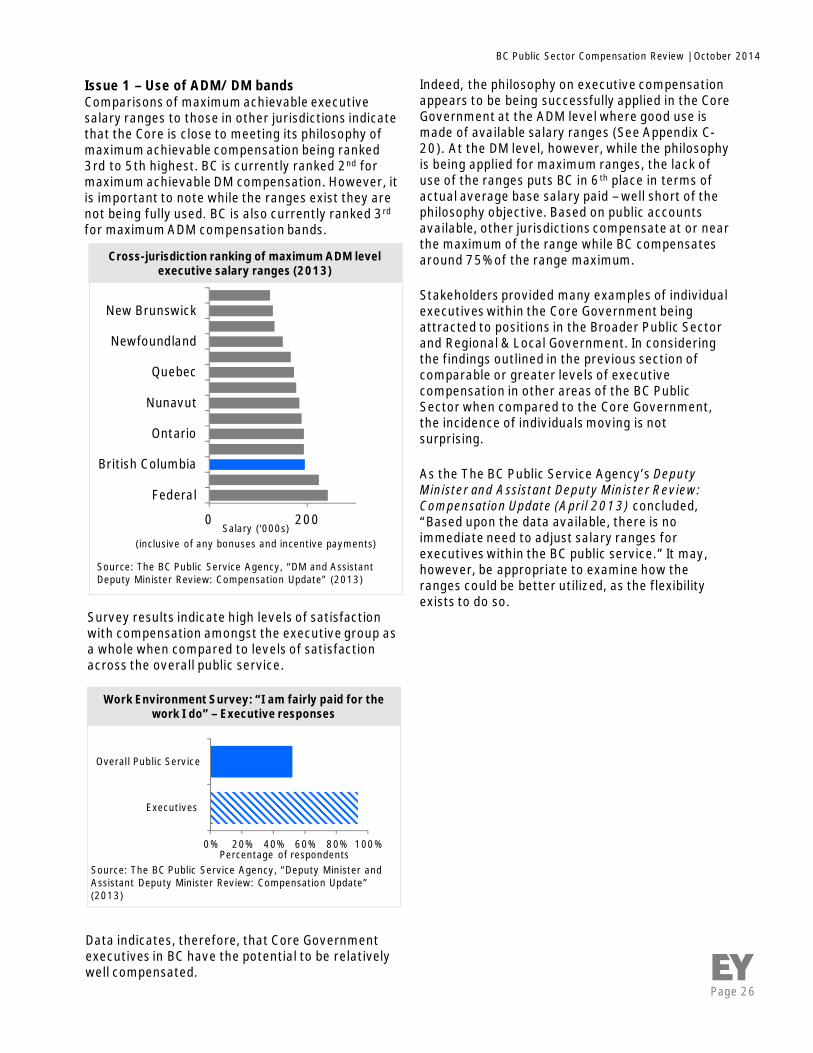
Issue 1 – Use of ADM/ DM bandsComparisons of maximum achievable executivesalary ranges to those in other jurisdictions indicatethat the Core is close to meeting its philosophy ofmaximum achievable compensation being ranked3rd to 5th highest. BC is currently ranked 2nd formaximum achievable DM compensation. However, itis important to note while the ranges exist they arenot being fully used. BC is also currently ranked 3rd
for maximum ADM compensation bands.
0 200
Federal
British Columbia
Ontario
Nunavut
Quebec
Newfoundland
New Brunswick
Cross-jurisdiction ranking of maximum ADM levelexecutive salary ranges (2013)
Source: The BC Public Service Agency, “DM and AssistantDeputy Minister Review: Compensation Update” (2013)
Salary (‘000s)(inclusive of any bonuses and incentive payments)
0% 20% 40% 60% 80% 100%
Executives
Overall Public Service
Work Environment Survey: “I am fairly paid for thework I do” – Executive responses
Percentage of respondentsSource: The BC Public Service Agency, “Deputy Minister andAssistant Deputy Minister Review: Compensation Update”(2013)
Indeed, the philosophy on executive compensationappears to be being successfully applied in the CoreGovernment at the ADM level where good use ismade of available salary ranges (See Appendix C-20). At the DM level, however, while the philosophyis being applied for maximum ranges, the lack ofuse of the ranges puts BC in 6th place in terms ofactual average base salary paid – well short of thephilosophy objective. Based on public accountsavailable, other jurisdictions compensate at or nearthe maximum of the range while BC compensatesaround 75% of the range maximum.
Stakeholders provided many examples of individualexecutives within the Core Government beingattracted to positions in the Broader Public Sectorand Regional & Local Government. In consideringthe findings outlined in the previous section ofcomparable or greater levels of executivecompensation in other areas of the BC PublicSector when compared to the Core Government,the incidence of individuals moving is notsurprising.
As the The BC Public Service Agency’s DeputyMinister and Assistant Deputy Minister Review:Compensation Update (April 2013) concluded,“Based upon the data available, there is noimmediate need to adjust salary ranges forexecutives within the BC public service.” It may,however, be appropriate to examine how theranges could be better utilized, as the flexibilityexists to do so.
Survey results indicate high levels of satisfactionwith compensation amongst the executive group asa whole when compared to levels of satisfactionacross the overall public service.
Data indicates, therefore, that Core Governmentexecutives in BC have the potential to be relativelywell compensated.
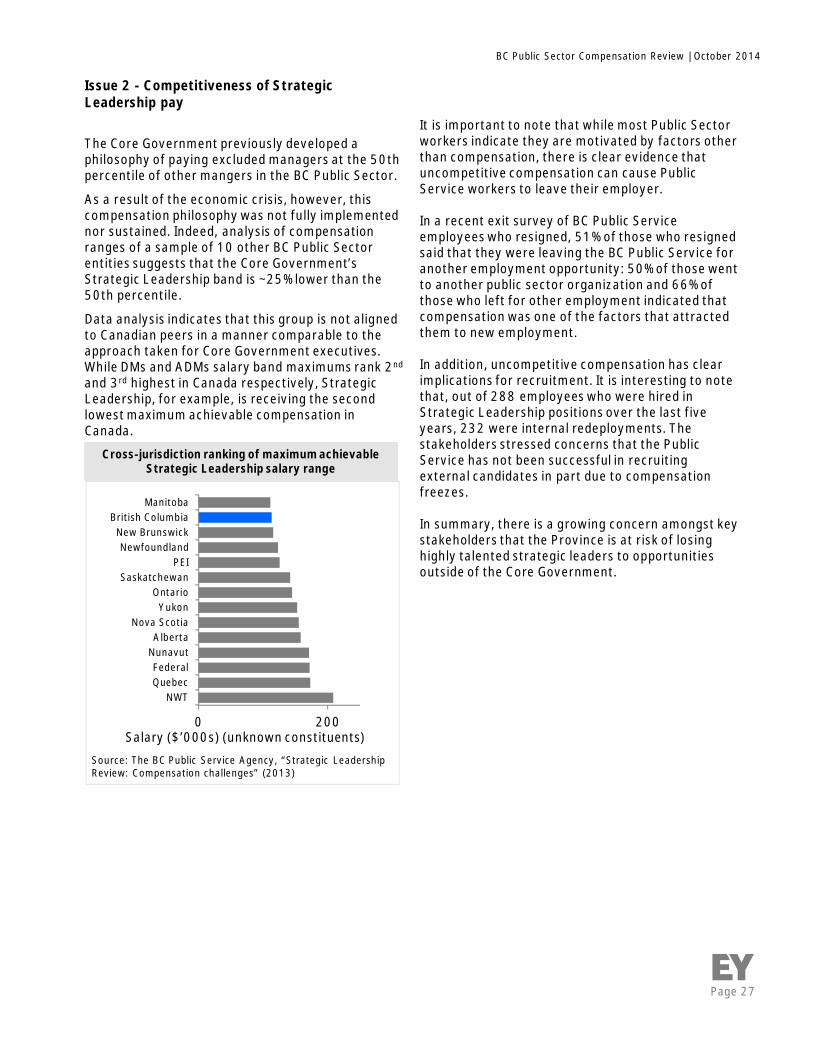
Page 27
BC Public Sector Compensation Review | October 2014
Issue 2 - Competitiveness of StrategicLeadership pay
The Core Government previously developed aphilosophy of paying excluded managers at the 50thpercentile of other mangers in the BC Public Sector.
As a result of the economic crisis, however, thiscompensation philosophy was not fully implementednor sustained. Indeed, analysis of compensationranges of a sample of 10 other BC Public Sectorentities suggests that the Core Government’sStrategic Leadership band is ~25% lower than the50th percentile.
Data analysis indicates that this group is not alignedto Canadian peers in a manner comparable to theapproach taken for Core Government executives.While DMs and ADMs salary band maximums rank 2nd
and 3rd highest in Canada respectively, StrategicLeadership, for example, is receiving the secondlowest maximum achievable compensation inCanada.
0 200
NWTQuebecFederal
NunavutAlberta
Nova ScotiaYukon
OntarioSaskatchewan
PEINewfoundland
New BrunswickBritish Columbia
Manitoba
Cross-jurisdiction ranking of maximum achievableStrategic Leadership salary range
Source: The BC Public Service Agency, “Strategic LeadershipReview: Compensation challenges” (2013)
Salary ($’000s) (unknown constituents)
It is important to note that while most Public Sectorworkers indicate they are motivated by factors otherthan compensation, there is clear evidence thatuncompetitive compensation can cause PublicService workers to leave their employer.
In a recent exit survey of BC Public Serviceemployees who resigned, 51% of those who resignedsaid that they were leaving the BC Public Service foranother employment opportunity: 50% of those wentto another public sector organization and 66% ofthose who left for other employment indicated thatcompensation was one of the factors that attractedthem to new employment.
In addition, uncompetitive compensation has clearimplications for recruitment. It is interesting to notethat, out of 288 employees who were hired inStrategic Leadership positions over the last fiveyears, 232 were internal redeployments. Thestakeholders stressed concerns that the PublicService has not been successful in recruitingexternal candidates in part due to compensationfreezes.
In summary, there is a growing concern amongst keystakeholders that the Province is at risk of losinghighly talented strategic leaders to opportunitiesoutside of the Core Government.
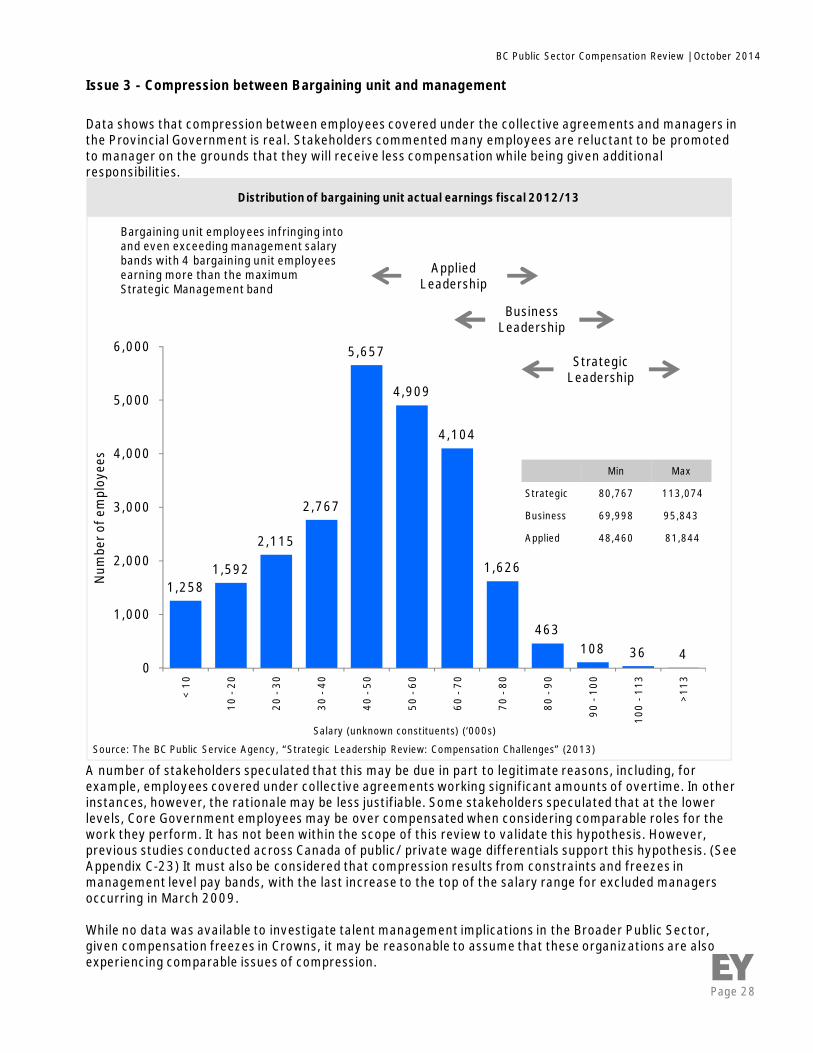
Page 28
BC Public Sector Compensation Review | October 2014
Issue 3 - Compression between Bargaining unit and management
Data shows that compression between employees covered under the collective agreements and managers inthe Provincial Government is real. Stakeholders commented many employees are reluctant to be promotedto manager on the grounds that they will receive less compensation while being given additionalresponsibilities.
1,2581,592
2,115
2,767
5,657
4,909
4,104
1,626
463108 36 4
0
1,000
2,000
3,000
4,000
5,000
6,000
<10
10-2
0
20-3
0
30-4
0
40-5
0
50-6
0
60-7
0
70-8
0
80-9
0
90-1
00
100
-113
>113
Salary (unknown constituents) (‘000s)
Min Max
Strategic 80,767 113,074
Business 69,998 95,843
Applied 48,460 81,844
Distribution of bargaining unit actual earnings fiscal 2012/13
Bargaining unit employees infringing intoand even exceeding management salarybands with 4 bargaining unit employeesearning more than the maximumStrategic Management band
Num
bero
fem
ploy
ees
BusinessLeadership
AppliedLeadership
StrategicLeadership
A number of stakeholders speculated that this may be due in part to legitimate reasons, including, forexample, employees covered under collective agreements working significant amounts of overtime. In otherinstances, however, the rationale may be less justifiable. Some stakeholders speculated that at the lowerlevels, Core Government employees may be over compensated when considering comparable roles for thework they perform. It has not been within the scope of this review to validate this hypothesis. However,previous studies conducted across Canada of public/ private wage differentials support this hypothesis. (SeeAppendix C-23) It must also be considered that compression results from constraints and freezes inmanagement level pay bands, with the last increase to the top of the salary range for excluded managersoccurring in March 2009.
While no data was available to investigate talent management implications in the Broader Public Sector,given compensation freezes in Crowns, it may be reasonable to assume that these organizations are alsoexperiencing comparable issues of compression.
Source: The BC Public Service Agency, “Strategic Leadership Review: Compensation Challenges” (2013)
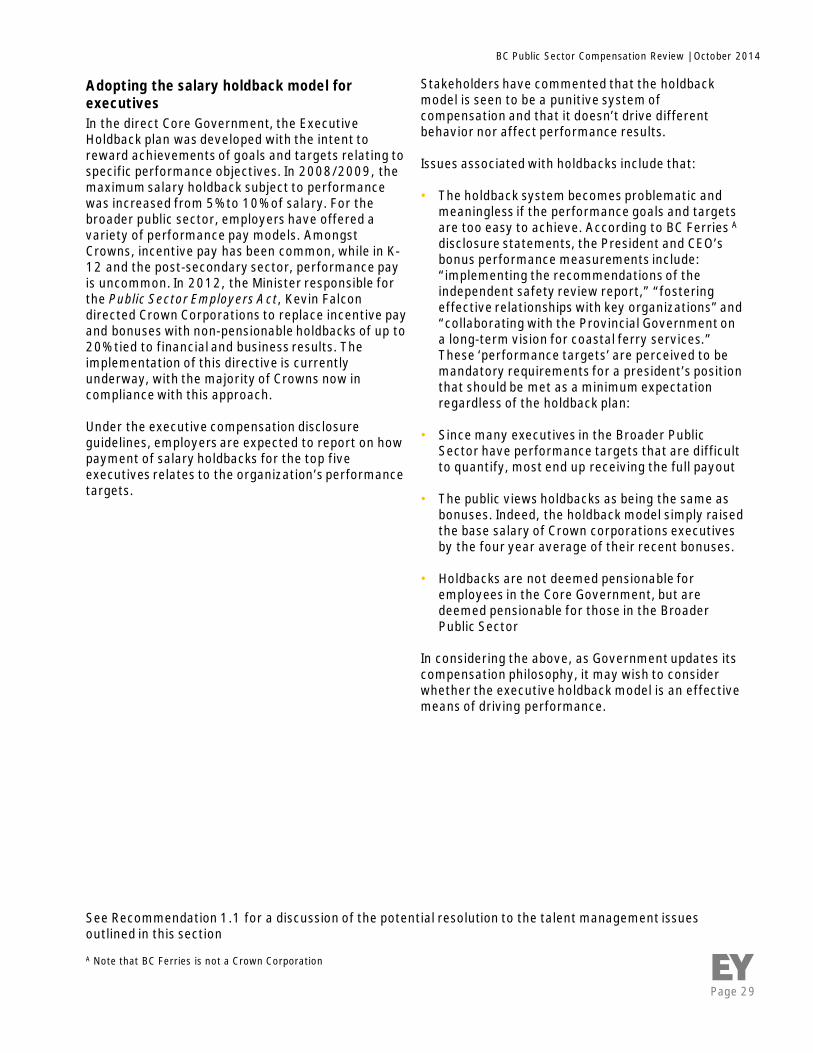
Page 29
BC Public Sector Compensation Review | October 2014
Adopting the salary holdback model forexecutivesIn the direct Core Government, the ExecutiveHoldback plan was developed with the intent toreward achievements of goals and targets relating tospecific performance objectives. In 2008/2009, themaximum salary holdback subject to performancewas increased from 5% to 10% of salary. For thebroader public sector, employers have offered avariety of performance pay models. AmongstCrowns, incentive pay has been common, while in K-12 and the post-secondary sector, performance payis uncommon. In 2012, the Minister responsible forthe Public Sector Employers Act, Kevin Falcondirected Crown Corporations to replace incentive payand bonuses with non-pensionable holdbacks of up to20% tied to financial and business results. Theimplementation of this directive is currentlyunderway, with the majority of Crowns now incompliance with this approach.
Under the executive compensation disclosureguidelines, employers are expected to report on howpayment of salary holdbacks for the top fiveexecutives relates to the organization’s performancetargets.
Stakeholders have commented that the holdbackmodel is seen to be a punitive system ofcompensation and that it doesn’t drive differentbehavior nor affect performance results.
Issues associated with holdbacks include that:
• The holdback system becomes problematic andmeaningless if the performance goals and targetsare too easy to achieve. According to BC Ferries A
disclosure statements, the President and CEO’sbonus performance measurements include:“implementing the recommendations of theindependent safety review report,” “fosteringeffective relationships with key organizations” and“collaborating with the Provincial Government ona long-term vision for coastal ferry services.”These ‘performance targets’ are perceived to bemandatory requirements for a president’s positionthat should be met as a minimum expectationregardless of the holdback plan:
• Since many executives in the Broader PublicSector have performance targets that are difficultto quantify, most end up receiving the full payout
• The public views holdbacks as being the same asbonuses. Indeed, the holdback model simply raisedthe base salary of Crown corporations executivesby the four year average of their recent bonuses.
• Holdbacks are not deemed pensionable foremployees in the Core Government, but aredeemed pensionable for those in the BroaderPublic Sector
In considering the above, as Government updates itscompensation philosophy, it may wish to considerwhether the executive holdback model is an effectivemeans of driving performance.
See Recommendation 1.1 for a discussion of the potential resolution to the talent management issuesoutlined in this section
A Note that BC Ferries is not a Crown Corporation
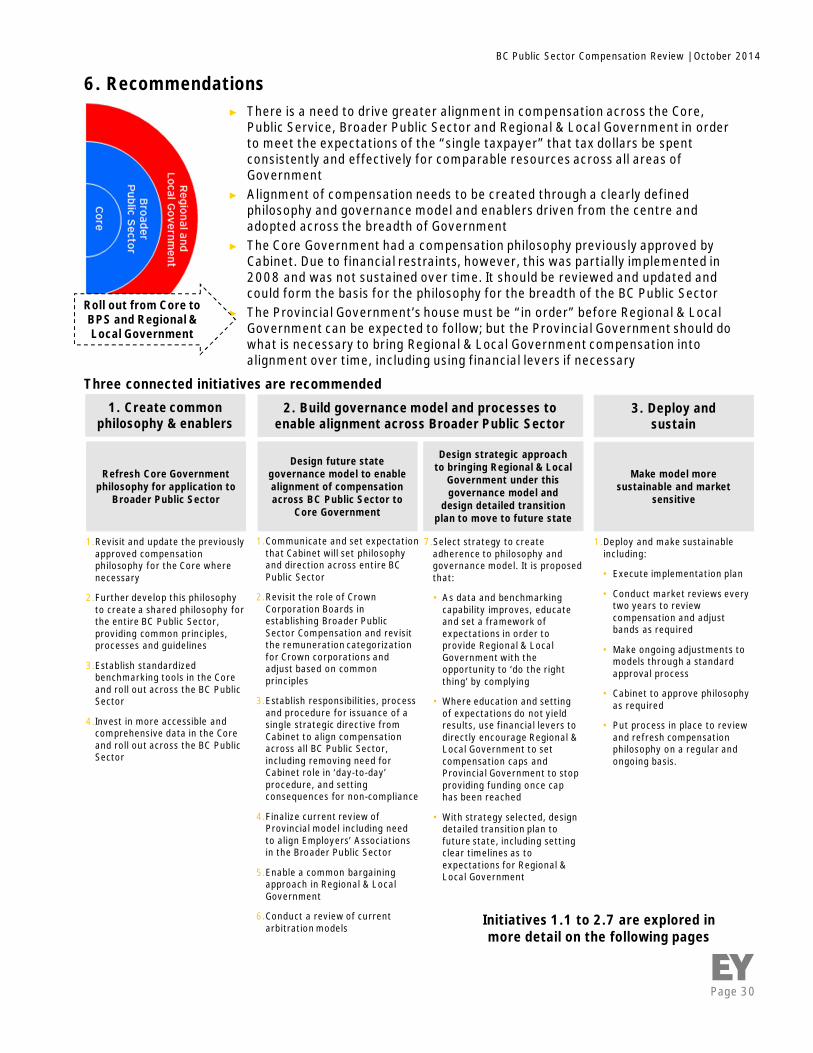
Page 30
BC Public Sector Compensation Review | October 2014
► There is a need to drive greater alignment in compensation across the Core,Public Service, Broader Public Sector and Regional & Local Government in orderto meet the expectations of the “single taxpayer” that tax dollars be spentconsistently and effectively for comparable resources across all areas ofGovernment
► Alignment of compensation needs to be created through a clearly definedphilosophy and governance model and enablers driven from the centre andadopted across the breadth of Government
► The Core Government had a compensation philosophy previously approved byCabinet. Due to financial restraints, however, this was partially implemented in2008 and was not sustained over time. It should be reviewed and updated andcould form the basis for the philosophy for the breadth of the BC Public Sector
► The Provincial Government’s house must be “in order” before Regional & LocalGovernment can be expected to follow; but the Provincial Government should dowhat is necessary to bring Regional & Local Government compensation intoalignment over time, including using financial levers if necessary
6. Recommendations
Roll out from Core toBPS and Regional &Local Government
Three connected initiatives are recommended
Initiatives 1.1 to 2.7 are explored inmore detail on the following pages
Make model moresustainable and market
sensitive
Design future stategovernance model to enablealignment of compensationacross BC Public Sector to
Core Government
Refresh Core Governmentphilosophy for application to
Broader Public Sector
3. Deploy andsustain
2. Build governance model and processes toenable alignment across Broader Public Sector
1. Create commonphilosophy & enablers
Design strategic approachto bringing Regional & Local
Government under thisgovernance model and
design detailed transitionplan to move to future state
1.Deploy and make sustainableincluding:
• Execute implementation plan
• Conduct market reviews everytwo years to reviewcompensation and adjustbands as required
• Make ongoing adjustments tomodels through a standardapproval process
• Cabinet to approve philosophyas required
• Put process in place to reviewand refresh compensationphilosophy on a regular andongoing basis.
1.Communicate and set expectationthat Cabinet will set philosophyand direction across entire BCPublic Sector
2.Revisit the role of CrownCorporation Boards inestablishing Broader PublicSector Compensation and revisitthe remuneration categorizationfor Crown corporations andadjust based on commonprinciples
3.Establish responsibilities, processand procedure for issuance of asingle strategic directive fromCabinet to align compensationacross all BC Public Sector,including removing need forCabinet role in ‘day-to-day’procedure, and settingconsequences for non-compliance
4.Finalize current review ofProvincial model including needto align Employers’ Associationsin the Broader Public Sector
5.Enable a common bargainingapproach in Regional & LocalGovernment
6.Conduct a review of currentarbitration models
7.Select strategy to createadherence to philosophy andgovernance model. It is proposedthat:
• As data and benchmarkingcapability improves, educateand set a framework ofexpectations in order toprovide Regional & LocalGovernment with theopportunity to ‘do the rightthing’ by complying
• Where education and settingof expectations do not yieldresults, use financial levers todirectly encourage Regional &Local Government to setcompensation caps andProvincial Government to stopproviding funding once caphas been reached
• With strategy selected, designdetailed transition plan tofuture state, including settingclear timelines as toexpectations for Regional &Local Government
1.Revisit and update the previouslyapproved compensationphilosophy for the Core wherenecessary
2.Further develop this philosophyto create a shared philosophy forthe entire BC Public Sector,providing common principles,processes and guidelines
3.Establish standardizedbenchmarking tools in the Coreand roll out across the BC PublicSector
4.Invest in more accessible andcomprehensive data in the Coreand roll out across the BC PublicSector

Page 31
BC Public Sector Compensation Review | October 2014
Recommendations > Principles used to select options
Principles underpinning recommendations
There are a number of recommendations that are offered to support the closer alignment of compensationacross the BC Public Sector and to put in place a sustainable model going forward. The following principlesunderpinned the recommendations:
• Recommendations must respect the objectives of the Core Review that Government operate asconsistently and effectively as possible – i.e. there should be alignment in compensation across the BCPublic Sector
• Recommendations must respect the Core Review objective of ensuring public sector management wagelevels are appropriate while recognizing the need for leaders who can positively impact the effectivenessof and productivity of public sector agencies - i.e. compensation costs should be kept to reasonable levelswhile enabling the Public Sector to be adequately resourced
• Organizations should be given the opportunity to do “the right thing” and Government should considerthat “sunlight is the best disinfectant”, but where historical actions suggest such an approach won’t work,more centralized directives should be applied
• Existing reviews should be finalized
• Make use of existing entities and practices to the greatest extent possible
• Where adequate information is not currently available, collect additional information before making adecision
Page 32
BC Public Sector Compensation Review | October 2014
Recommendations > 1. Create common philosophy & enablers1.1. Refresh the compensation philosophy for the Core where necessary and make itapplicable to share with Broader Public Sector
Recommended actions:
• Review and update as necessary the Corephilosophy, which was approved by the Cabinetin 2008
• Develop communication approach for keystakeholders highlighting issues and challengesof current compensation framework
• Conduct market based review of current totalcompensation within the Core Governmentagainst other Canadian provincial and federaljurisdictions by level using revisited philosophy
• Based on review results, revise as necessarymanagement compensation within the CoreGovernment: including re-evaluation of paybands and adjust where current pay is above/below market (e.g. consider increasing $113kcap for Strategic Leadership band) (SeeAppendix C-20)
• Consider whether holdbacks should be thepreferred model for the Core Government,considering in particular that holdbacks arepunitive and removal would provide greaterflexibility without needing to increase ranges
• Allow employees to move through bands basedon performance rather than tenure
• Consider using the flexibility that the Provincecurrently has in terms of utilizing the breadth ofexisting executive pay bands
• Define process for regular adjustments based onmarket data
Implications
• Based on the market reviews, it is possible thatsome of the lower levels (e.g. administrativepositions) may be above market and couldrequire “adjustment down” over time. This is anassumption not based on analysis of BC data buton a literature review of typical public/ privatebenchmarking in Canada, and comments fromstakeholders in BC. For example, a study byWatson Wyatt and Hay associates, found higherpay for lower classifications but lower pay at theexecutive level of the federal public service,compared to the private sector(See Appendix C-23)
• It is believed that the Strategic Leadership groupand other key management roles arecompensated at a lower level than Canadian andFederal peers, and it is therefore anticipated thatbands would need to be adjusted up
• The issue of executive holdbacks as aperformance management tool is generallypoorly understood, but needs to be handled withsensitivity nonetheless
• The role of Cabinet in compensation decisionsneeds to be carefully considered. If BC movedtowards a standard market based process, withno exceptions, it would enable Cabinet to largelyremove itself from day to day decision making.Cabinet would retain authority over approvingthe philosophy, framework and processes
While the variation between Core Government and other areas within the Province is of greater concern, itis important to consider how to first resolve any issues within the Core in order to enable sustainablealignment to other areas going forward.

Page 33
BC Public Sector Compensation Review | October 2014
Recommendations > 1. Create common philosophy & enablers1.2. Further develop the Core philosophy to create a shared philosophy for the entireBC Public Sector
Good work was done several years ago on defining a common compensation philosophy for the CoreGovernment. We would recommend revisiting this and refreshing it as necessary. This philosophy would thenbe expanded and built out to create a common compensation philosophy across the BC Public Sector,including the Broader Public Sector and Regional & Local Government.
During this exercise, Government may wish to consider some of the following questions:
• How is alignment reached across BPS through the use of caps?
• Is the current categorization of remuneration categories for Crown Corporations appropriate?
• If leadership compensation is tied to the Federal Government, how is ‘ability to pay’ factored in?
• Can bargaining unit employees make more than management level?
• Caps in benefits as a percentage of base salary?
• How to ensure a ‘no exceptions’ culture?
• How to balance / align compensation against varying local market conditions (e.g. labour rates inVancouver vs. Smithers)?
• Should Broader Public Sector/ local leaders be paid more than most senior Core Government leaders (e.g.CEO vs. DM compensation)?
• Consider linkages to GDP forecast?
Page 34
BC Public Sector Compensation Review | October 2014
Recommendations > 1. Create common philosophy & enablers1.3. Establish benchmarking guidelines in the Core, and roll out across Broader PublicSector and Regional & Local Government
There is no clear and consistent framework orguidance for benchmarking methodology andapproach across either the Provincial Governmentor Regional & Local Government
Recommendation: Create standardizedbenchmarking processes and guidelines on howcomparators should be selected and design “rule ofthumb” tool to enable comparison of similaroccupations (considering, for example, span ofcontrol, responsibilities, etc.). Communicate clearexpectations for compliance.
• Implication: This would create greater alignmentin compensation but would require training andimplementation support
Page 35
BC Public Sector Compensation Review | October 2014
Recommendations > 1. Create common philosophy & enablers1.4. Invest in more accessible and comprehensive data in the Core, and roll out acrossthe Broader Public Sector and Regional & Local Government
The BC Government does not currently use allavailable sources of information to gain a picture ofcompensation across the breadth of Government. Itshould also be noted that the current legislatedsources of data cannot feasibly provide the BCGovernment with the means to understandvariation in total compensation across the arms ofthe Provincial and Regional & Local Government. Itwill also ensure the various Government entitieshave access to comparable data to support theirdecision making. The following actions arerecommended:
1. Build, analyze and use a single compensationdataset that covers the BC Public Sector based ontotal compensation (e.g. use at the bargainingtable; in designing trade-offs; improvetransparency to the public). Core Governmentwould be the stewards of this data.
2. Require the regular electronic reporting ofcompensation of all BC Public Sector employees,including information on all elements of totalcompensation, full time equivalency and jobdescriptions by individual employee.
3. Develop processes and expectations to supportsharing data and best practices across the BCPublic Sector, including the Broader Public Sectorand Regional & Local Government.
4. Consistently collect and analyse exit interviewdata to enable identification of talent managementrisks.
• This would require an investment in processesand systems to develop this capability for theProvince. Communications will be important toensure consistent inputting and utilization
Page 36
BC Public Sector Compensation Review | October 2014
Recommendations > 2. Build governance model to enable alignment2.1. Establish a model for establishing a harmonized compensation philosophy forRegional & Local Government
In the Regional and Local model, no one party setsthe rules around executive compensation andcollective bargaining mandates across the entiresector. This power is fragmented, with eachGovernment having responsibility for their ownjurisdiction. The following options were considered:
Option 1: Provincial Government to issue generalcompensation guidelines and share expectationsaround a common philosophy that Regional & LocalGovernment are expected to adhere to.
• Provide standard benchmarking guidelines,associated tools and processes and access todata to support a consistent approach
• There is no enforcement mechanism for noncompliance
Option 2: Empower and create a Regional & LocalGovernment compensation ‘Cabinet’ includingrepresentatives from Regional and LocalGovernment and representation from the ProvincialGovernment to establish a consistent compensationphilosophy.
• This Regional & Local GovernmentCompensation ‘Cabinet’ may believe and end upacting on the belief that it has greater powersand prerogative beyond the scope of settingcompensation directives that would ultimatelycreate conflict with the Provincial Government
• It would be challenging to determine equitablemeans for selection of this ‘Cabinet’
• No certainty that philosophy would reflect andalign with that in the Core Government andBroader Public Sector
Option 3: Establish responsibilities for developmentand issuance of single philosophy by ProvincialCabinet to align compensation to the greatestextent possible across the entire BC Public Sectorat all levels with associated consequences for non-compliance.
• Provide standard benchmarking guidelines,associated tools and processes and access todata to support a consistent approach
• The mandated framework would requireenforcement mechanisms as well as oversightthrough a body such as the Auditor General forLocal Government
• This would require significant levels of changeand would face material resistance fromRegional & Local Government and unions – tothe extent that it might not be feasible toimplement such an option without strongpolitical will
• Enforcement could be implemented through theuse of budget caps or other financial levers ifeducation wasn’t effective
Recommendation:Option 1 is recommended followed by Option 3 if Regional & Local Government doesn’t adopt theprovincial approach. We believe that providing information, data, tools and setting expectationsfor a common approach will motivate most municipalities to comply, without requiring a heavyhanded approach. It allows those leaders a chance to do the right thing.
Page 37
BC Public Sector Compensation Review | October 2014
Recommendations > 2. Build governance model to enable alignment2.2. Revisit the role of Crown Corporation boards in establishing Broader Public Sectorcompensation
Recommendation:The Government may wish to start with Option 2 with the clear potential to move to Option 3 ifthere is a lack of compliance / co-operation from the system
The boards of Crown Corporations lack a consistentapproach and discipline in establishingcompensation, particularly for the executive ranks.There may be a lack of understanding in terms oftheir mandate and direction on behalf of theshareholder.
The compensation classification categories thatwere established in 2007 need to be revisited andupdated.
Option 1: Establish good governance practices forboards in setting compensation and providemandatory onboarding for all new board membersand retraining of existing boards in terms of theirresponsibility to the shareholder and compensationframework (See Appendix C-21)
• Given the mix of current director experience,this approach lacks enforceability
Option 2: In addition to onboarding and expectationsetting process, deploy clear directives around ashared compensation framework and philosophyand provide tools and access to data to support theboards in their duties. This includes independentreview and enforcement processes
• Boards will still be seen as involved incompensation decisions. There areconsequences for non-conformance
Option 3: Give Crown Corporation compensationresponsibilities to an independent wage board (e.g.PSEC), removing it from board responsibilities
• This will remove issue of challenges faced byboards in knowing how to set compensation andreduce risk of ‘board capture’ from executives
• This reduces power of boards and independenceof organizations and would require moresignificant change management
• This relies on the assumption of being able toestablish an independent and effective wageboard
Page 38
BC Public Sector Compensation Review | October 2014
Recommendations > 2. Build governance model to enable alignment2.3. Establish a consistent framework to support the implementation and enforcementof compensation philosophy in Regional and Local Government
Recommendation:Option 2 is recommended. It is preferable to provide Regional & Local Government with thechance to do the right thing. If there isn’t the expected cooperation, a more directive choicecould be considered.
The Regional and Local model does not have acomparable PSEC or the BC Public Service Agencyto provide strategic advice, co-ordination andenforcement. BC is the only Canadian jurisdiction tohave an AGLG. This initiative has been widelyapplauded, but some parties suggest that the AGLGcould be mandated to focus on compensation, andto go beyond validating if policy has been applied,to investigating whether outcomes are fair andequitable. The following options were considered:
Option 1: Encourage the AGLG to reviewcompensation and provide it with ‘greater teeth’ interms of enforcement
• This could encourage greater conservatism incompensation but would not necessarily createalignment
• It is still ‘early days’ for the AGLG and may bepremature to make significant changes to itsmandate
• This would face significant opposition from LocalGovernment and unions
Option 2: Empower and create a PSEC equivalentbody covering Regional & Local Government toprovide strategic advice, coordination andenforcement of a common compensationframework
• Provide access to data, tools and commonprocess frameworks
• This might encourage greater alignment ofcompensation
• However, without central Government oversight,there is no certainty that this entity wouldenforce alignment and without robustgovernance could be pressured by Regional andLocal Government
Option 3: Establish centralized responsibilities,process and procedures for implementation andenforcement of a coordinated directive byProvincial Cabinet to align compensation to thegreatest extent possible across Regional & LocalGovernment (e.g. through extending PSEC to coverRegional & Local Government and considering useof Pay Czar) (See Appendix C-22)
• This would create alignment and consistency inapproach to compensation
• This would require significant levels of changeand would face resistance from Regional & LocalGovernment and unions
Page 39
BC Public Sector Compensation Review | October 2014
Recommendations > 2. Build governance model to enable alignment2.4. Simplify governance by aligning Employers’ Associations in the Broader PublicSector
Recommendation:Before taking any action, finalize current review of Provincial governance model. We believethere is an opportunity to streamline and simplify the current structure.
While Employers’ Associations provide sector co-ordination in response to organized labour in theProvincial Government, there is currentlyduplication of mandate and a lack of coordinationand knowledge transfer
Option 1: Encourage closer coordination andknowledge sharing between all Employers’Associations and other entities
Option 2: Collapse the current Employers’Associations into a single body if possible, or atleast a smaller number
• We recognize that there are other initiativesexamining the overall governance modelsaffecting compensation. We would encouragethis review to look for ways to simplify andstreamline the structure, ideally reducing thenumber of discrete organizations involved
Page 40
BC Public Sector Compensation Review | October 2014
Recommendations > 2. Build governance model to enable alignment2.5. Enable a common bargaining approach in Regional & Local Government
Recommendation:Complete current review of governance model and look for opportunities to simplify and alignacross jurisdictions.
Regional & Local Government’s approach tocollective bargaining is highly fragmented andinefficient. There is an opportunity to betterstreamline and coordinate these processes. Thefollowing options were considered:
Option 1: Expand existing entities (LabourRelations Department of Metro Vancouver andGreater Victoria Labour Relations Association)to cover all Regional & Local Government
• Current trend is one of fragmentation ratherthan consolidation and growth – this would needto be turned around. This would maintainmunicipal autonomy and thereby increasemunicipal buy in. If the Provincial EAs are to beconsolidated, however, this results in afragmented system
Option 2: Provincial Government to provideoptional Employers’ Association services toRegional & Local Government
• Unlikely to be taken up among Regional & LocalGovernment given sense of autonomy
Option 3: Provincial Government to mandate use ofeither Regional and Local EA services or use ofProvincial provider
• Greater coordination in response to organizedlabour
• Risk of creating a divided system
Option 4: Provincial Government to mandate use ofProvincial Employers’ Associations / consolidatedfunction
• Creates coordination in response to organizedlabour. If the Provincial EAs are to beconsolidated, this option would result in onesingle organization which could ensurecoordination across the entire BC Public Sector
• Loss of control over compensation by Regional &Local Government will be strongly resisted, eventhough it means removing duplicated costs andinefficiencies from the system. Strongcommunications with both internal and externalwill be required
Page 41
BC Public Sector Compensation Review | October 2014
Recommendations > 2. Build governance model to enable alignment2.6. Evaluate collective bargaining models for Regional & Local Government
Recommendation:Before taking any action, conduct a more detailed review of the current arbitration models.Option 1 is then recommended with the potential to move to a more drastic change if there isn’tcooperation.
There is a mixed approach to collective bargainingacross the Province, with some pockets ofarbitration for Police and Fire which stakeholdersbelieve may be resulting in compensationescalation
Option 1: Allow arbitration exceptions to continuebut make greater use of ability of Core Governmentto provide specific terms of reference for anarbitration in order to align outcomes to Provincialmandates
• This would create greater compensationalignment to Provincial mandates
• Subject to legal opinion, it is believed that thiswould require no change in existing legislation
Option 2: Eliminate the arbitration process andbring Police and Fire under the same framework asthe Broader Public Sector or potentially an‘adjudication’ model
• This would create greater compensationalignment to Provincial mandates
• This would require significant changes inlegislation and would create greater resistancefrom the Police and Fire services and theirunions
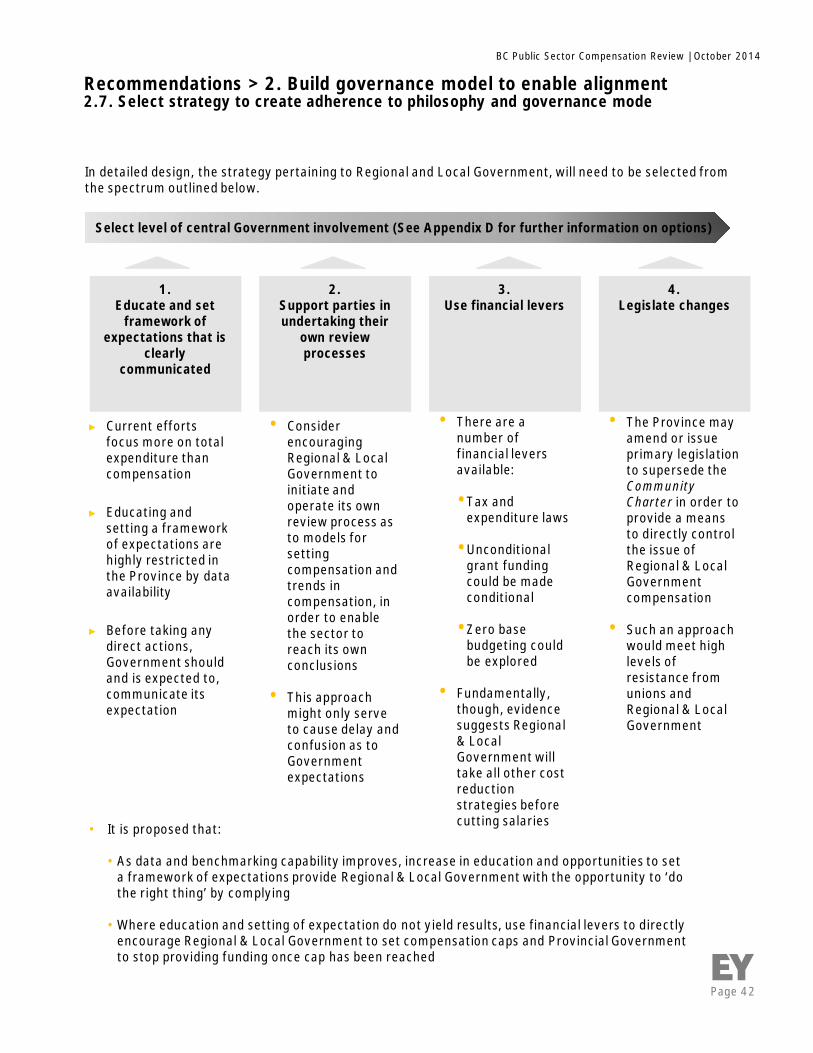
Page 42
BC Public Sector Compensation Review | October 2014
Recommendations > 2. Build governance model to enable alignment2.7. Select strategy to create adherence to philosophy and governance mode
In detailed design, the strategy pertaining to Regional and Local Government, will need to be selected fromthe spectrum outlined below.
Select level of central Government involvement (See Appendix D for further information on options)
1.Educate and set
framework ofexpectations that is
clearlycommunicated
2.Support parties inundertaking their
own reviewprocesses
3.Use financial levers
4.Legislate changes
► Current effortsfocus more on totalexpenditure thancompensation
► Educating andsetting a frameworkof expectations arehighly restricted inthe Province by dataavailability
► Before taking anydirect actions,Government shouldand is expected to,communicate itsexpectation
• ConsiderencouragingRegional & LocalGovernment toinitiate andoperate its ownreview process asto models forsettingcompensation andtrends incompensation, inorder to enablethe sector toreach its ownconclusions
• This approachmight only serveto cause delay andconfusion as toGovernmentexpectations
• There are anumber offinancial leversavailable:
•Tax andexpenditure laws
•Unconditionalgrant fundingcould be madeconditional
•Zero basebudgeting couldbe explored
• Fundamentally,though, evidencesuggests Regional& LocalGovernment willtake all other costreductionstrategies beforecutting salaries
• The Province mayamend or issueprimary legislationto supersede theCommunityCharter in order toprovide a meansto directly controlthe issue ofRegional & LocalGovernmentcompensation
• Such an approachwould meet highlevels ofresistance fromunions andRegional & LocalGovernment
• It is proposed that:
• As data and benchmarking capability improves, increase in education and opportunities to seta framework of expectations provide Regional & Local Government with the opportunity to ‘dothe right thing’ by complying
• Where education and setting of expectation do not yield results, use financial levers to directlyencourage Regional & Local Government to set compensation caps and Provincial Governmentto stop providing funding once cap has been reached

Page 43
BC Public Sector Compensation Review | October 2014
7. Limitations
This report is confidential. It has been prepared byErnst & Young LLP, Canada (“EY”) solely for theGovernment of British Columbia for the purposestated and should not be used for any otherpurpose. This Report is subject to the terms andconditions outlined in the engagement letterbetween EY and the Government of BritishColumbia.
This report should not be provided to any otherthird party without the prior written consent of EY.
None of EY, Ernst & Young Global Limited, anyother member of the global network of Ernst &Young, nor their subcontractors, members,shareholders or directors, officers, partners,principals or employees (collectively “EY persons”)will accept any responsibility for loss occasioned toany person acting or refraining from action as aresult of any material in this report.
All the information and data we have received fromthe Government of British Columbia or itsrepresentatives is the responsibility of theGovernment of British Columbia. We have notsought to establish the reliability of informationgiven to us except as specifically stated in thisreport.
We wish to place on record the assistance we havereceived from stakeholders within the BC PublicSector in preparing this report.
Page 44
BC Public Sector Compensation Review | October 2014
App
endi
ces
D Spectrum of strategies for Regional & LocalGovernment
A Approach to building the evidence base
B Total Public Sector wages
C Supplementary evidence
45
49
51
81
APPENDICES
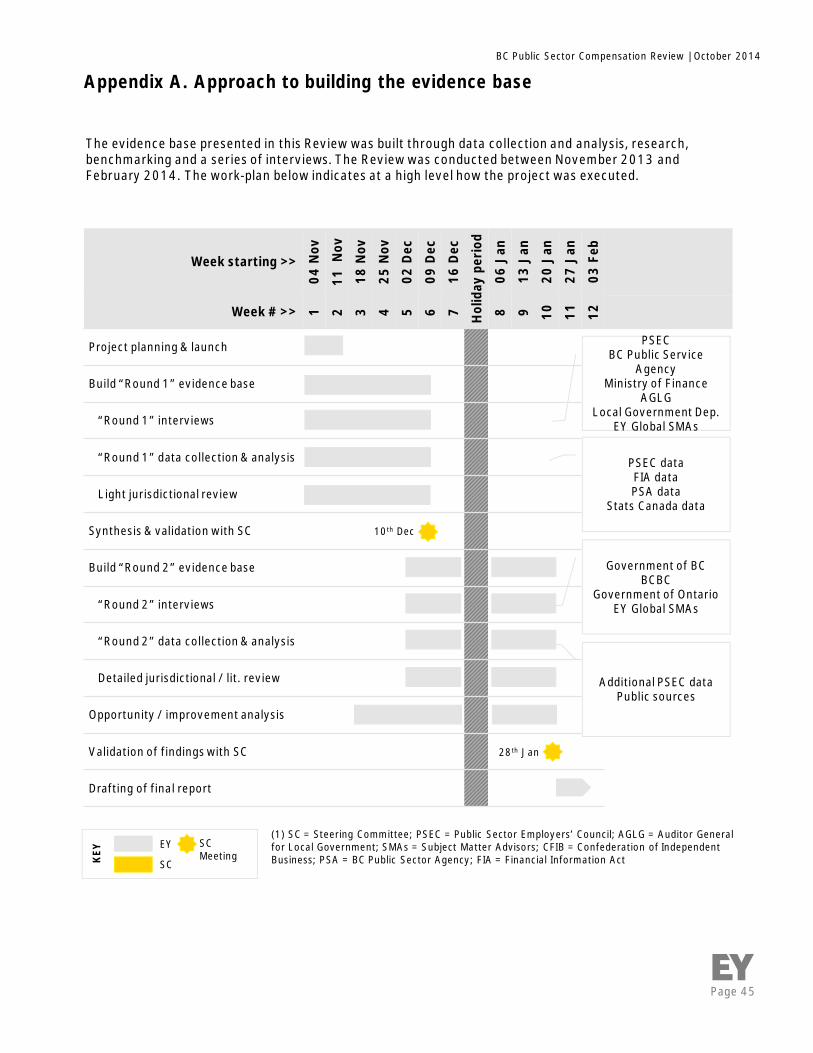
Page 45
BC Public Sector Compensation Review | October 2014
Week starting >>
04N
ov
11N
ov
18N
ov
25N
ov
02D
ec
09D
ec
16D
ec
Hol
iday
peri
od
06Ja
n
13Ja
n
20Ja
n
27Ja
n
03Fe
b
Week # >> 1 2 3 4 5 6 7 8 9 10 11 12
Project planning & launch
Build “Round 1” evidence base
“Round 1” interviews
“Round 1” data collection & analysis
Light jurisdictional review
Synthesis & validation with SC
Build “Round 2” evidence base
“Round 2” interviews
“Round 2” data collection & analysis
Detailed jurisdictional / lit. review
Opportunity / improvement analysis
Validation of findings with SC
Drafting of final report
Appendix A. Approach to building the evidence base
The evidence base presented in this Review was built through data collection and analysis, research,benchmarking and a series of interviews. The Review was conducted between November 2013 andFebruary 2014. The work-plan below indicates at a high level how the project was executed.
10th Dec
28th Jan
EY
SCKEY
(1) SC = Steering Committee; PSEC = Public Sector Employers’ Council; AGLG = Auditor Generalfor Local Government; SMAs = Subject Matter Advisors; CFIB = Confederation of IndependentBusiness; PSA = BC Public Sector Agency; FIA = Financial Information Act
PSECBC Public Service
AgencyMinistry of Finance
AGLGLocal Government Dep.
EY Global SMAs
PSEC dataFIA dataPSA data
Stats Canada data
Government of BCBCBC
Government of OntarioEY Global SMAs
Additional PSEC dataPublic sources
SCMeeting
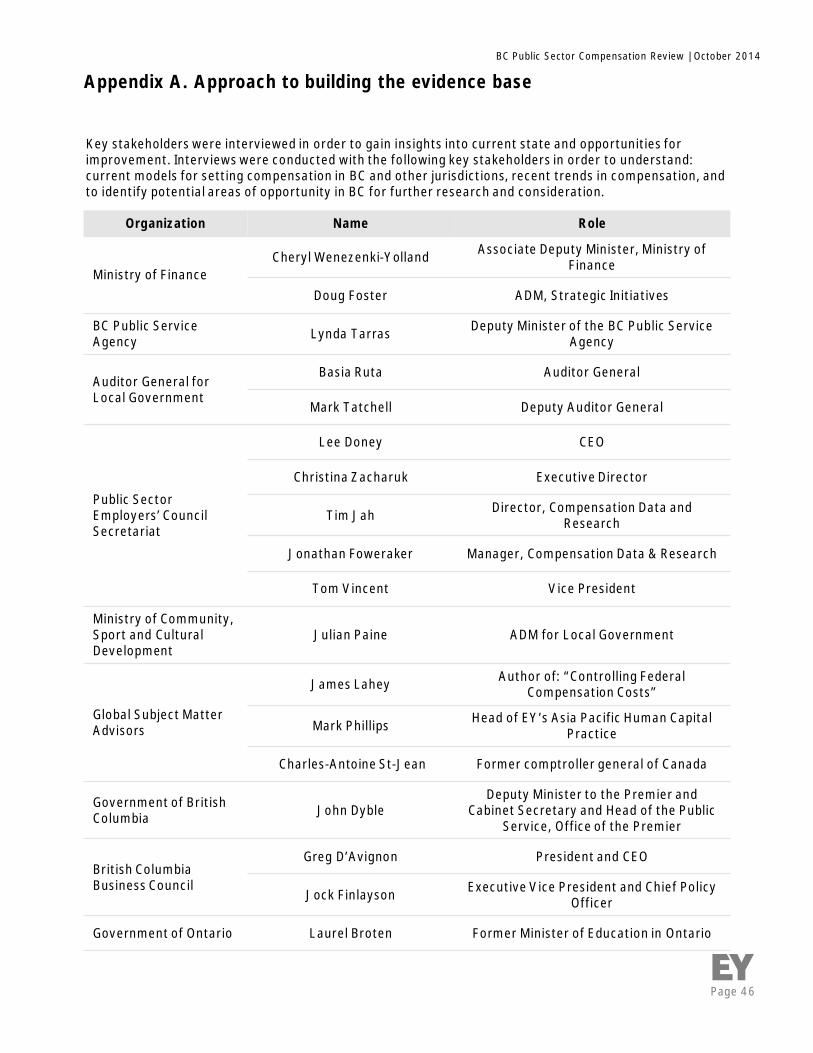
Page 46
BC Public Sector Compensation Review | October 2014
Appendix A. Approach to building the evidence base
Key stakeholders were interviewed in order to gain insights into current state and opportunities forimprovement. Interviews were conducted with the following key stakeholders in order to understand:current models for setting compensation in BC and other jurisdictions, recent trends in compensation, andto identify potential areas of opportunity in BC for further research and consideration.
Organization Name Role
Ministry of FinanceCheryl Wenezenki-Yolland Associate Deputy Minister, Ministry of
Finance
Doug Foster ADM, Strategic Initiatives
BC Public ServiceAgency Lynda Tarras Deputy Minister of the BC Public Service
Agency
Auditor General forLocal Government
Basia Ruta Auditor General
Mark Tatchell Deputy Auditor General
Public SectorEmployers’ CouncilSecretariat
Lee Doney CEO
Christina Zacharuk Executive Director
Tim Jah Director, Compensation Data andResearch
Jonathan Foweraker Manager, Compensation Data & Research
Tom Vincent Vice President
Ministry of Community,Sport and CulturalDevelopment
Julian Paine ADM for Local Government
Global Subject MatterAdvisors
James Lahey Author of: “Controlling FederalCompensation Costs”
Mark Phillips Head of EY’s Asia Pacific Human CapitalPractice
Charles-Antoine St-Jean Former comptroller general of Canada
Government of BritishColumbia John Dyble
Deputy Minister to the Premier andCabinet Secretary and Head of the Public
Service, Office of the Premier
British ColumbiaBusiness Council
Greg D’Avignon President and CEO
Jock Finlayson Executive Vice President and Chief PolicyOfficer
Government of Ontario Laurel Broten Former Minister of Education in Ontario
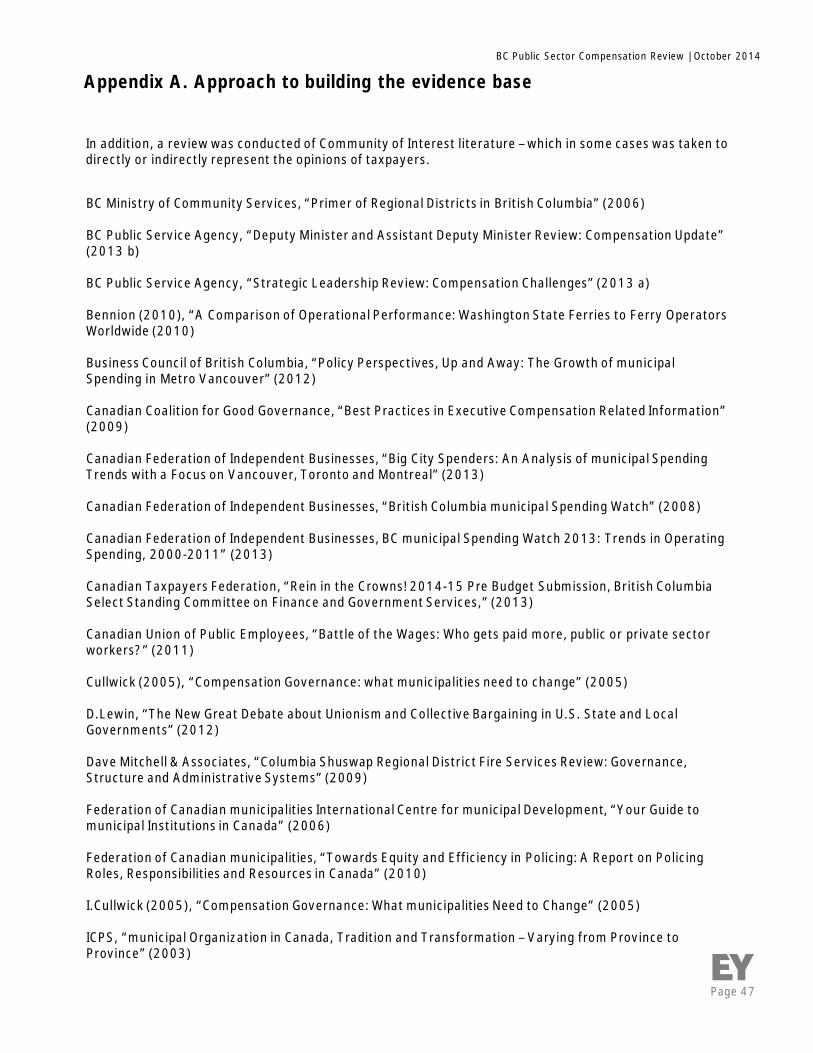
Page 47
BC Public Sector Compensation Review | October 2014
BC Ministry of Community Services, “Primer of Regional Districts in British Columbia” (2006)
BC Public Service Agency, “Deputy Minister and Assistant Deputy Minister Review: Compensation Update”(2013 b)
BC Public Service Agency, “Strategic Leadership Review: Compensation Challenges” (2013 a)
Bennion (2010), “A Comparison of Operational Performance: Washington State Ferries to Ferry OperatorsWorldwide (2010)
Business Council of British Columbia, “Policy Perspectives, Up and Away: The Growth of municipalSpending in Metro Vancouver” (2012)
Canadian Coalition for Good Governance, “Best Practices in Executive Compensation Related Information”(2009)
Canadian Federation of Independent Businesses, “Big City Spenders: An Analysis of municipal SpendingTrends with a Focus on Vancouver, Toronto and Montreal” (2013)
Canadian Federation of Independent Businesses, “British Columbia municipal Spending Watch” (2008)
Canadian Federation of Independent Businesses, BC municipal Spending Watch 2013: Trends in OperatingSpending, 2000-2011” (2013)
Canadian Taxpayers Federation, “Rein in the Crowns! 2014-15 Pre Budget Submission, British ColumbiaSelect Standing Committee on Finance and Government Services,” (2013)
Canadian Union of Public Employees, “Battle of the Wages: Who gets paid more, public or private sectorworkers?” (2011)
Cullwick (2005), “Compensation Governance: what municipalities need to change” (2005)
D.Lewin, “The New Great Debate about Unionism and Collective Bargaining in U.S. State and LocalGovernments” (2012)
Dave Mitchell & Associates, “Columbia Shuswap Regional District Fire Services Review: Governance,Structure and Administrative Systems” (2009)
Federation of Canadian municipalities International Centre for municipal Development, “Your Guide tomunicipal Institutions in Canada” (2006)
Federation of Canadian municipalities, “Towards Equity and Efficiency in Policing: A Report on PolicingRoles, Responsibilities and Resources in Canada” (2010)
I.Cullwick (2005), “Compensation Governance: What municipalities Need to Change” (2005)
ICPS, “municipal Organization in Canada, Tradition and Transformation – Varying from Province toProvince” (2003)
Appendix A. Approach to building the evidence base
In addition, a review was conducted of Community of Interest literature – which in some cases was taken todirectly or indirectly represent the opinions of taxpayers.
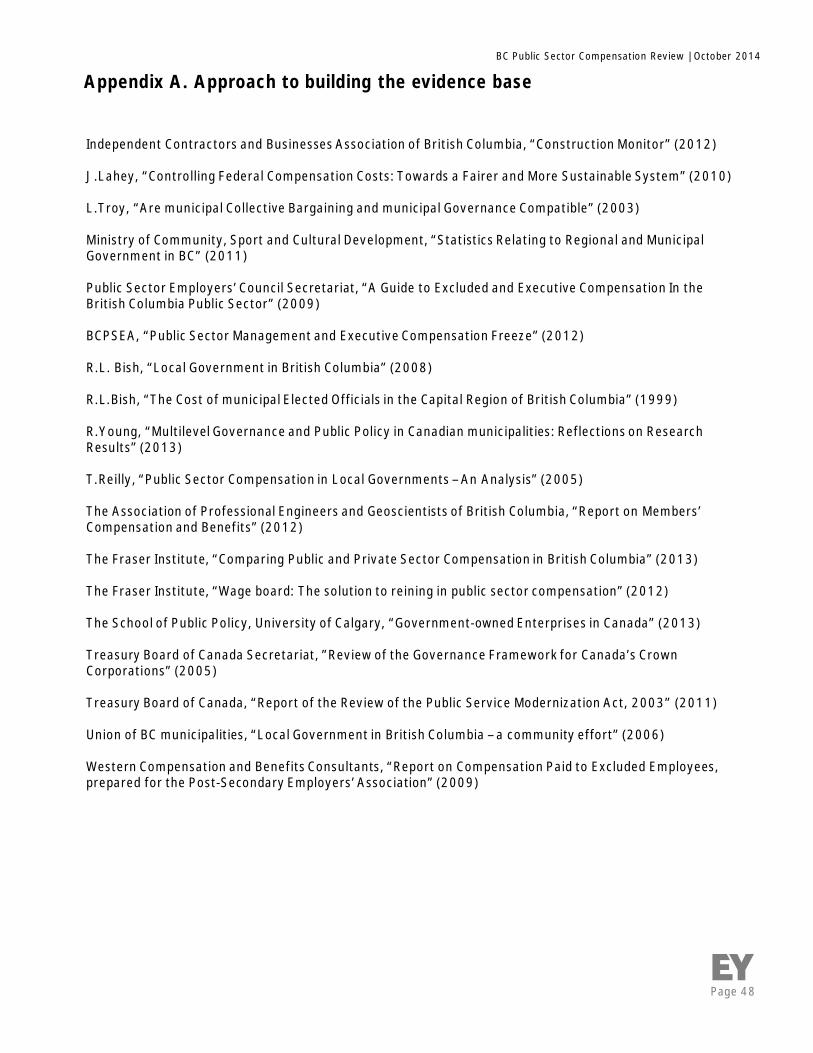
Page 48
BC Public Sector Compensation Review | October 2014
Independent Contractors and Businesses Association of British Columbia, “Construction Monitor” (2012)
J.Lahey, “Controlling Federal Compensation Costs: Towards a Fairer and More Sustainable System” (2010)
L.Troy, “Are municipal Collective Bargaining and municipal Governance Compatible” (2003)
Ministry of Community, Sport and Cultural Development, “Statistics Relating to Regional and MunicipalGovernment in BC” (2011)
Public Sector Employers’ Council Secretariat, “A Guide to Excluded and Executive Compensation In theBritish Columbia Public Sector” (2009)
BCPSEA, “Public Sector Management and Executive Compensation Freeze” (2012)
R.L. Bish, “Local Government in British Columbia” (2008)
R.L.Bish, “The Cost of municipal Elected Officials in the Capital Region of British Columbia” (1999)
R.Young, “Multilevel Governance and Public Policy in Canadian municipalities: Reflections on ResearchResults” (2013)
T.Reilly, “Public Sector Compensation in Local Governments – An Analysis” (2005)
The Association of Professional Engineers and Geoscientists of British Columbia, “Report on Members’Compensation and Benefits” (2012)
The Fraser Institute, “Comparing Public and Private Sector Compensation in British Columbia” (2013)
The Fraser Institute, “Wage board: The solution to reining in public sector compensation” (2012)
The School of Public Policy, University of Calgary, “Government-owned Enterprises in Canada” (2013)
Treasury Board of Canada Secretariat, ”Review of the Governance Framework for Canada’s CrownCorporations” (2005)
Treasury Board of Canada, “Report of the Review of the Public Service Modernization Act, 2003” (2011)
Union of BC municipalities, “Local Government in British Columbia – a community effort” (2006)
Western Compensation and Benefits Consultants, “Report on Compensation Paid to Excluded Employees,prepared for the Post-Secondary Employers’ Association” (2009)
Appendix A. Approach to building the evidence base
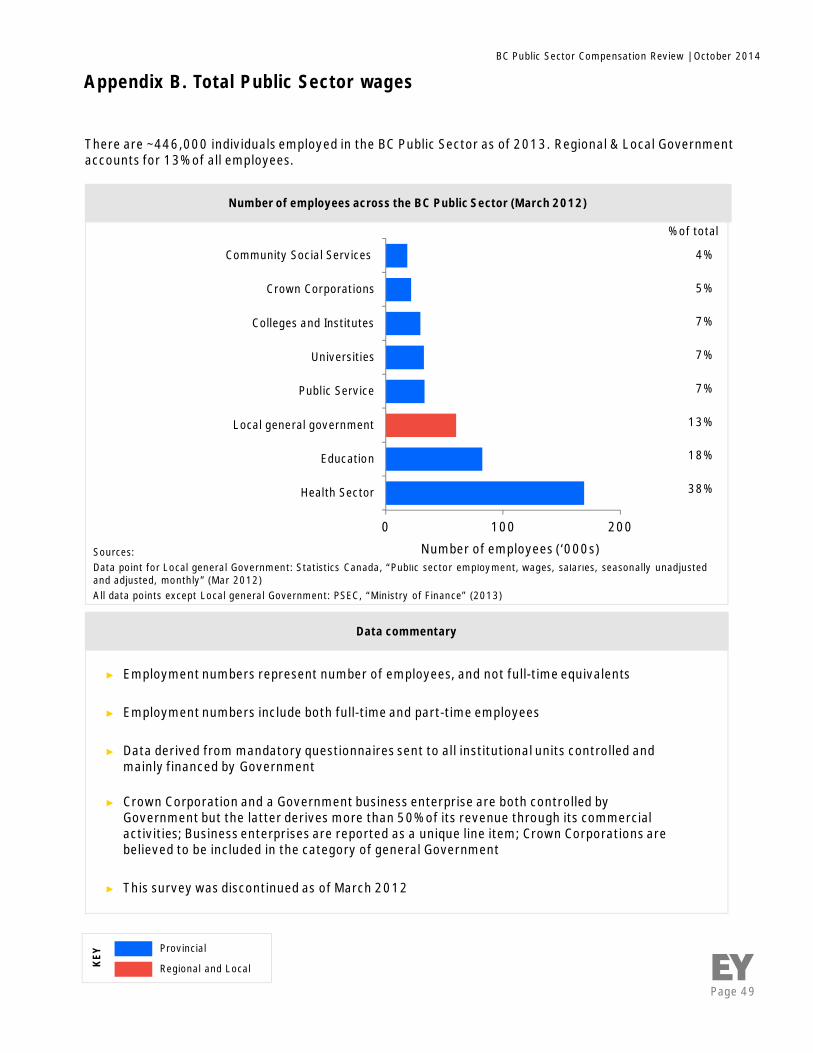
Page 49
BC Public Sector Compensation Review | October 2014
Appendix B. Total Public Sector wages
Sources:Data point for Local general Government: Statistics Canada, “Public sector employment, wages, salaries, seasonally unadjustedand adjusted, monthly” (Mar 2012)All data points except Local general Government: PSEC, “Ministry of Finance” (2013)
► Employment numbers represent number of employees, and not full-time equivalents
► Employment numbers include both full-time and part-time employees
► Data derived from mandatory questionnaires sent to all institutional units controlled andmainly financed by Government
► Crown Corporation and a Government business enterprise are both controlled byGovernment but the latter derives more than 50% of its revenue through its commercialactivities; Business enterprises are reported as a unique line item; Crown Corporations arebelieved to be included in the category of general Government
► This survey was discontinued as of March 2012
Data commentary
Number of employees across the BC Public Sector (March 2012)
0 100 200
Health Sector
Education
Local general government
Public Service
Universities
Colleges and Institutes
Crown Corporations
Community Social Services
Thousands
4%
5%
7%
7%
7%
13%
18%
38%
There are ~446,000 individuals employed in the BC Public Sector as of 2013. Regional & Local Governmentaccounts for 13% of all employees.
Number of employees (‘000s)
% of total
Provincial
Regional and LocalKEY
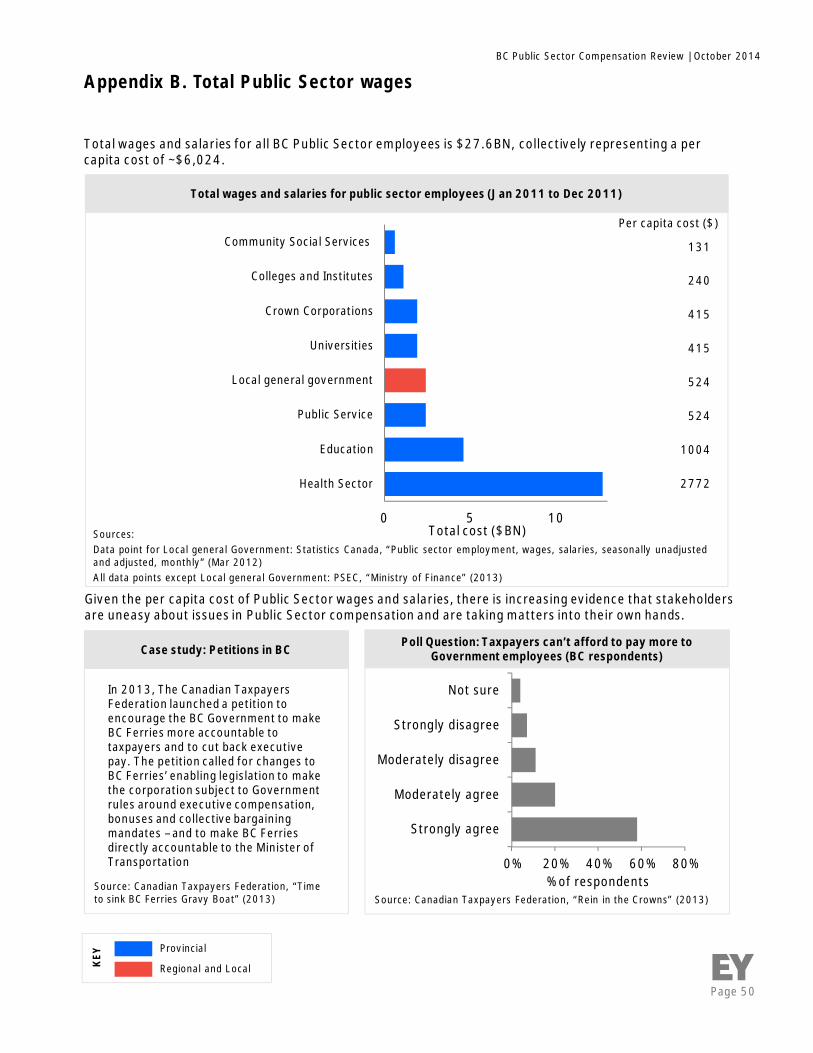
Page 50
BC Public Sector Compensation Review | October 2014
Appendix B. Total Public Sector wages
Source: Canadian Taxpayers Federation, “Rein in the Crowns” (2013)
Given the per capita cost of Public Sector wages and salaries, there is increasing evidence that stakeholdersare uneasy about issues in Public Sector compensation and are taking matters into their own hands.
Poll Question: Taxpayers can’t afford to pay more toGovernment employees (BC respondents)
0 5 10
Health Sector
Education
Public Service
Local general government
Universities
Crown Corporations
Colleges and Institutes
Community Social Services
Source: Canadian Taxpayers Federation, “Timeto sink BC Ferries Gravy Boat” (2013)
Case study: Petitions in BC
In 2013, The Canadian TaxpayersFederation launched a petition toencourage the BC Government to makeBC Ferries more accountable totaxpayers and to cut back executivepay. The petition called for changes toBC Ferries’ enabling legislation to makethe corporation subject to Governmentrules around executive compensation,bonuses and collective bargainingmandates – and to make BC Ferriesdirectly accountable to the Minister ofTransportation
Total wages and salaries for public sector employees (Jan 2011 to Dec 2011)
131
240
415
415
524
524
1004
2772
Per capita cost ($)
Total cost ($BN)
Total wages and salaries for all BC Public Sector employees is $27.6BN, collectively representing a percapita cost of ~$6,024.
0% 20% 40% 60% 80%
Strongly agree
Moderately agree
Moderately disagree
Strongly disagree
Not sure
% of respondents
Provincial
Regional and LocalKEY
Sources:Data point for Local general Government: Statistics Canada, “Public sector employment, wages, salaries, seasonally unadjustedand adjusted, monthly” (Mar 2012)All data points except Local general Government: PSEC, “Ministry of Finance” (2013)
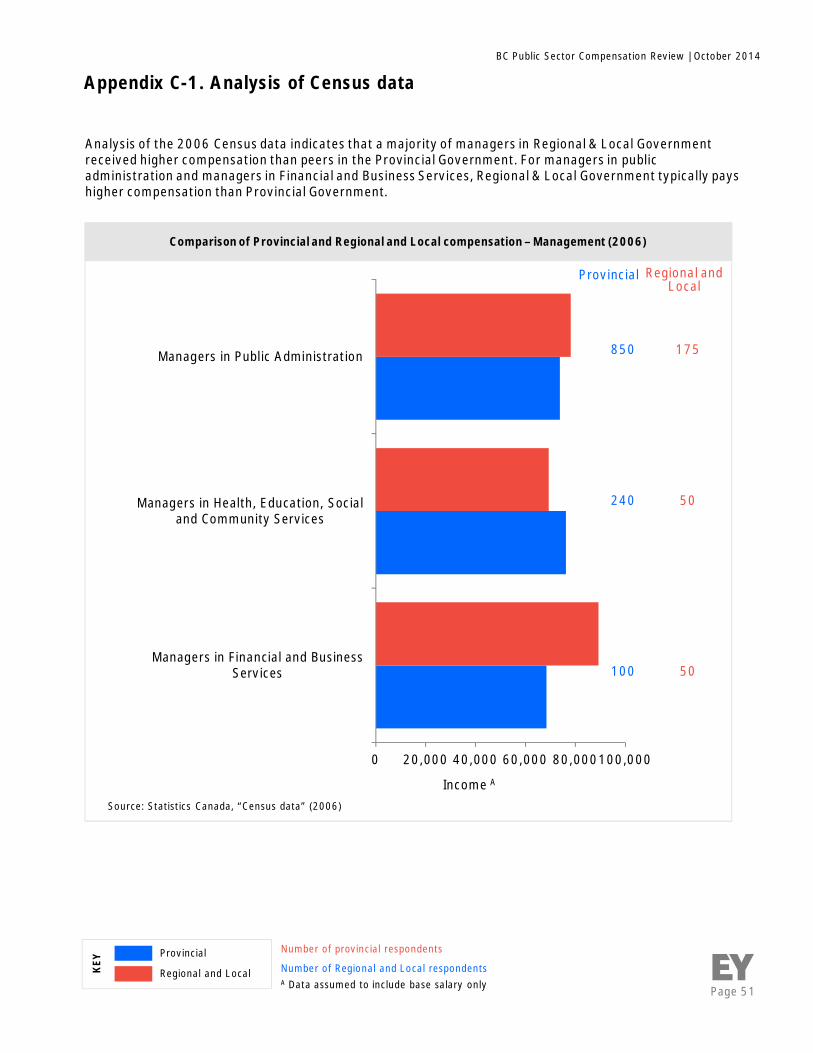
Page 51
BC Public Sector Compensation Review | October 2014
0 20,000 40,000 60,000 80,000100,000
Managers in Financial and BusinessServices
Managers in Health, Education, Socialand Community Services
Managers in Public Administration
Comparison of Provincial and Regional and Local compensation – Management (2006)
Source: Statistics Canada, “Census data” (2006)
Income A
850 175
240 50
100 50
Appendix C-1. Analysis of Census data
Analysis of the 2006 Census data indicates that a majority of managers in Regional & Local Governmentreceived higher compensation than peers in the Provincial Government. For managers in publicadministration and managers in Financial and Business Services, Regional & Local Government typically payshigher compensation than Provincial Government.
Provincial Regional andLocal
Number of provincial respondents
Number of Regional and Local respondentsA Data assumed to include base salary only
Provincial
Regional and LocalKEY
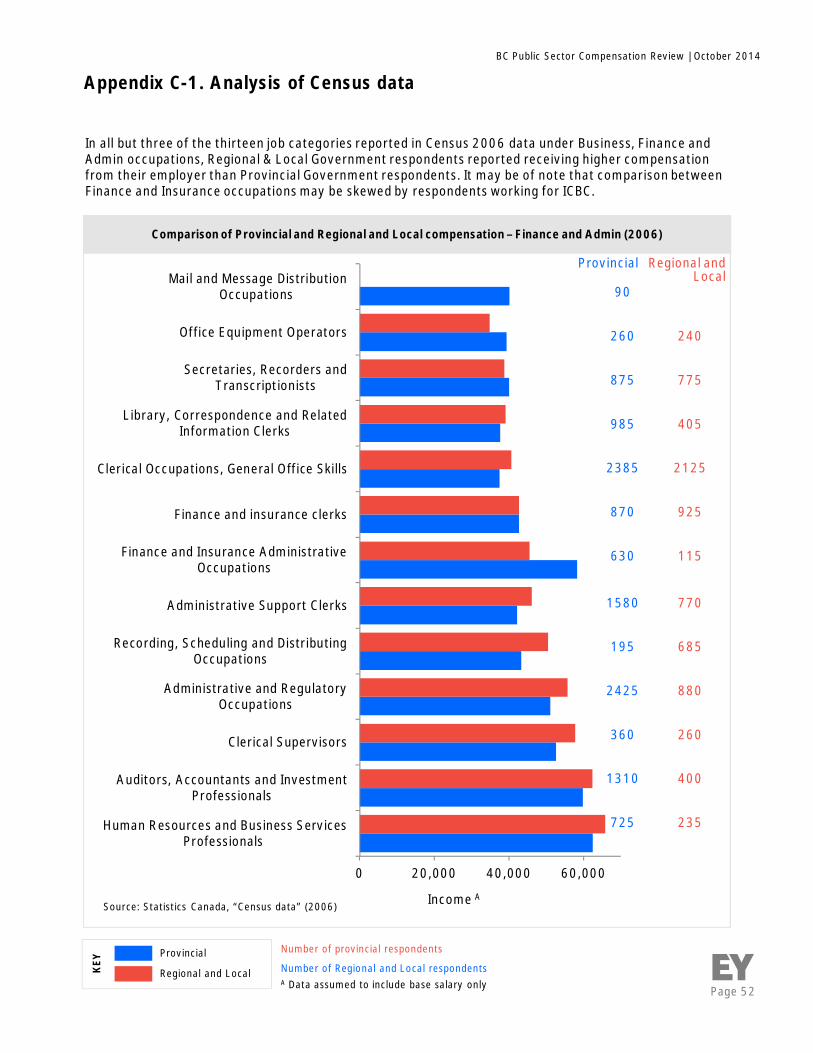
Page 52
BC Public Sector Compensation Review | October 2014
0 20,000 40,000 60,000
Human Resources and Business ServicesProfessionals
Auditors, Accountants and InvestmentProfessionals
Clerical Supervisors
Administrative and RegulatoryOccupations
Recording, Scheduling and DistributingOccupations
Administrative Support Clerks
Finance and Insurance AdministrativeOccupations
Finance and insurance clerks
Clerical Occupations, General Office Skills
Library, Correspondence and RelatedInformation Clerks
Secretaries, Recorders andTranscriptionists
Office Equipment Operators
Mail and Message DistributionOccupations
Comparison of Provincial and Regional and Local compensation – Finance and Admin (2006)
Source: Statistics Canada, “Census data” (2006) Income A
90
260 240
875 775
985 405
2385 2125
870 925
630 115
1580 770
195 685
2425 880
360 260
1310 400
725 235
Provincial Regional andLocal
In all but three of the thirteen job categories reported in Census 2006 data under Business, Finance andAdmin occupations, Regional & Local Government respondents reported receiving higher compensationfrom their employer than Provincial Government respondents. It may be of note that comparison betweenFinance and Insurance occupations may be skewed by respondents working for ICBC.
Number of provincial respondents
Number of Regional and Local respondentsA Data assumed to include base salary only
Provincial
Regional and LocalKEYAppendix C-1. Analysis of Census data
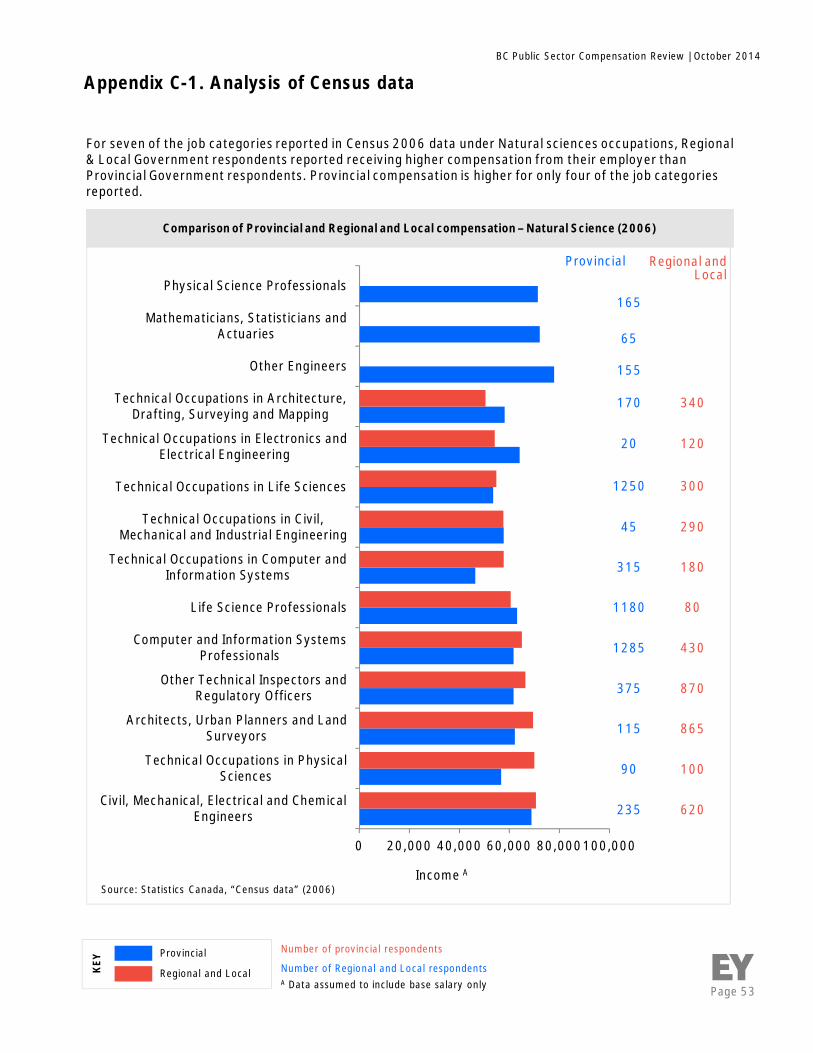
Page 53
BC Public Sector Compensation Review | October 2014
Comparison of Provincial and Regional and Local compensation – Natural Science (2006)
0 20,000 40,000 60,000 80,000100,000
Civil, Mechanical, Electrical and ChemicalEngineers
Technical Occupations in PhysicalSciences
Architects, Urban Planners and LandSurveyors
Other Technical Inspectors andRegulatory Officers
Computer and Information SystemsProfessionals
Life Science Professionals
Technical Occupations in Computer andInformation Systems
Technical Occupations in Civil,Mechanical and Industrial Engineering
Technical Occupations in Life Sciences
Technical Occupations in Electronics andElectrical Engineering
Technical Occupations in Architecture,Drafting, Surveying and Mapping
Other Engineers
Mathematicians, Statisticians andActuaries
Physical Science Professionals
Source: Statistics Canada, “Census data” (2006)
165
65
155
170 340
20 120
1250 300
45 290
315 180
1180 80
1285 430
375 870
115 865
90 100
235 620
Income A
Provincial Regional andLocal
For seven of the job categories reported in Census 2006 data under Natural sciences occupations, Regional& Local Government respondents reported receiving higher compensation from their employer thanProvincial Government respondents. Provincial compensation is higher for only four of the job categoriesreported.
Number of provincial respondents
Number of Regional and Local respondentsA Data assumed to include base salary only
Provincial
Regional and LocalKEYAppendix C-1. Analysis of Census data
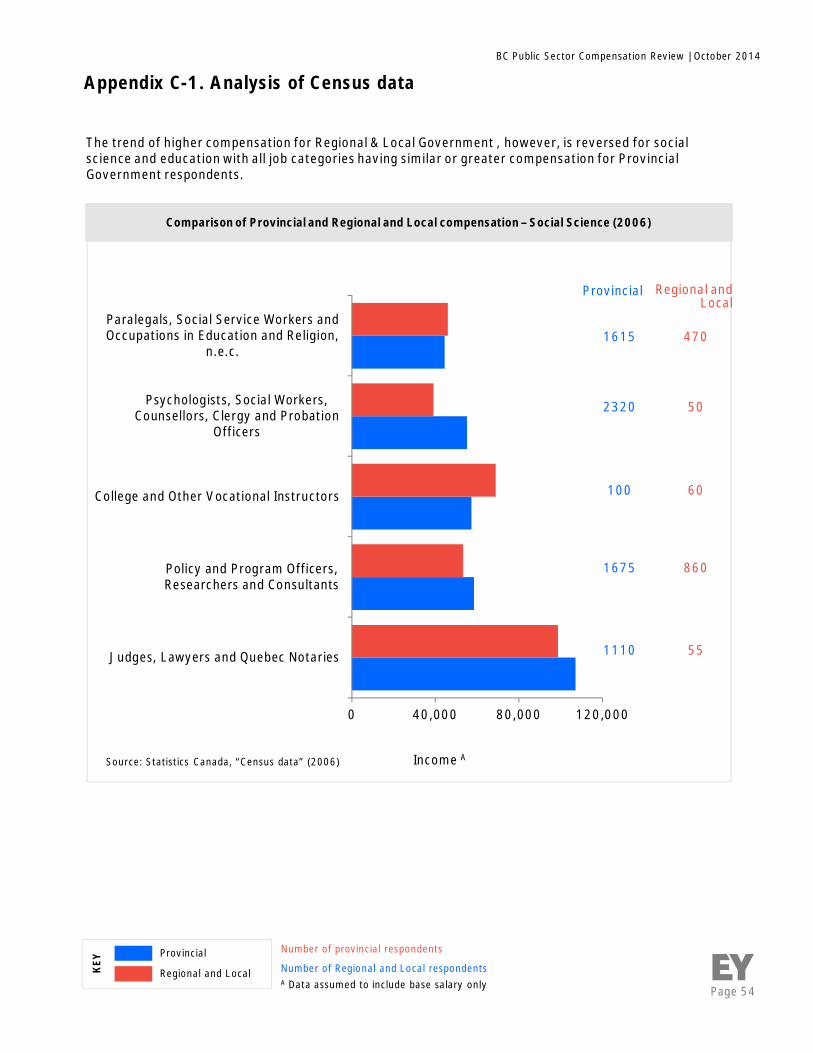
Page 54
BC Public Sector Compensation Review | October 2014
0 40,000 80,000 120,000
Judges, Lawyers and Quebec Notaries
Policy and Program Officers,Researchers and Consultants
College and Other Vocational Instructors
Psychologists, Social Workers,Counsellors, Clergy and Probation
Officers
Paralegals, Social Service Workers andOccupations in Education and Religion,
n.e.c.
Comparison of Provincial and Regional and Local compensation – Social Science (2006)
Source: Statistics Canada, “Census data” (2006) Income A
1615 470
2320 50
100 60
1675 860
1110 55
The trend of higher compensation for Regional & Local Government , however, is reversed for socialscience and education with all job categories having similar or greater compensation for ProvincialGovernment respondents.
Provincial Regional andLocal
Number of provincial respondents
Number of Regional and Local respondentsA Data assumed to include base salary only
Provincial
Regional and LocalKEYAppendix C-1. Analysis of Census data
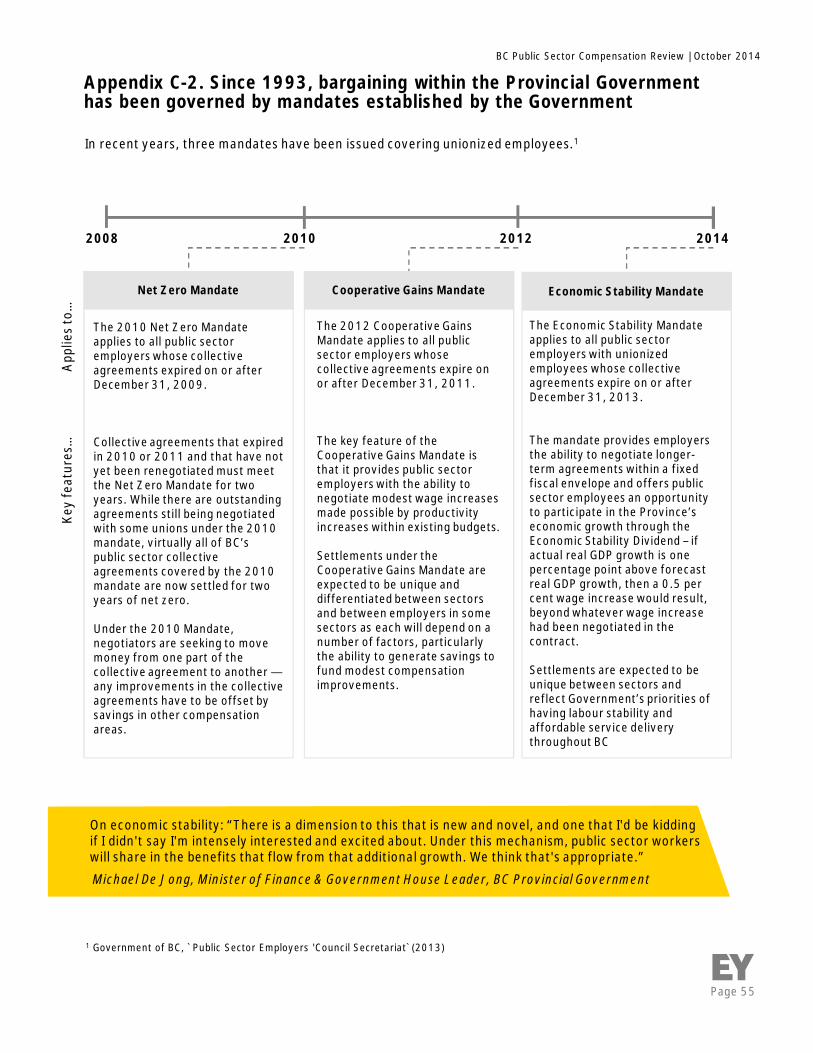
Page 55
BC Public Sector Compensation Review | October 2014
Appendix C-2. Since 1993, bargaining within the Provincial Governmenthas been governed by mandates established by the Government
2008 2010 2012 2014
The 2010 Net Zero Mandateapplies to all public sectoremployers whose collectiveagreements expired on or afterDecember 31, 2009.
Collective agreements that expiredin 2010 or 2011 and that have notyet been renegotiated must meetthe Net Zero Mandate for twoyears. While there are outstandingagreements still being negotiatedwith some unions under the 2010mandate, virtually all of BC’spublic sector collectiveagreements covered by the 2010mandate are now settled for twoyears of net zero.
Under the 2010 Mandate,negotiators are seeking to movemoney from one part of thecollective agreement to another —any improvements in the collectiveagreements have to be offset bysavings in other compensationareas.
The 2012 Cooperative GainsMandate applies to all publicsector employers whosecollective agreements expire onor after December 31, 2011.
The key feature of theCooperative Gains Mandate isthat it provides public sectoremployers with the ability tonegotiate modest wage increasesmade possible by productivityincreases within existing budgets.
Settlements under theCooperative Gains Mandate areexpected to be unique anddifferentiated between sectorsand between employers in somesectors as each will depend on anumber of factors, particularlythe ability to generate savings tofund modest compensationimprovements.
The Economic Stability Mandateapplies to all public sectoremployers with unionizedemployees whose collectiveagreements expire on or afterDecember 31, 2013.
The mandate provides employersthe ability to negotiate longer-term agreements within a fixedfiscal envelope and offers publicsector employees an opportunityto participate in the Province’seconomic growth through theEconomic Stability Dividend – ifactual real GDP growth is onepercentage point above forecastreal GDP growth, then a 0.5 percent wage increase would result,beyond whatever wage increasehad been negotiated in thecontract.
Settlements are expected to beunique between sectors andreflect Government’s priorities ofhaving labour stability andaffordable service deliverythroughout BC
Net Zero Mandate Cooperative Gains Mandate Economic Stability Mandate
App
lies
to…
Key
feat
ures
…
In recent years, three mandates have been issued covering unionized employees.1
On economic stability: “There is a dimension to this that is new and novel, and one that I'd be kiddingif I didn't say I'm intensely interested and excited about. Under this mechanism, public sector workerswill share in the benefits that flow from that additional growth. We think that's appropriate.”
Michael De Jong, Minister of Finance & Government House Leader, BC Provincial Government
1 Government of BC, `Public Sector Employers 'Council Secretariat`(2013)
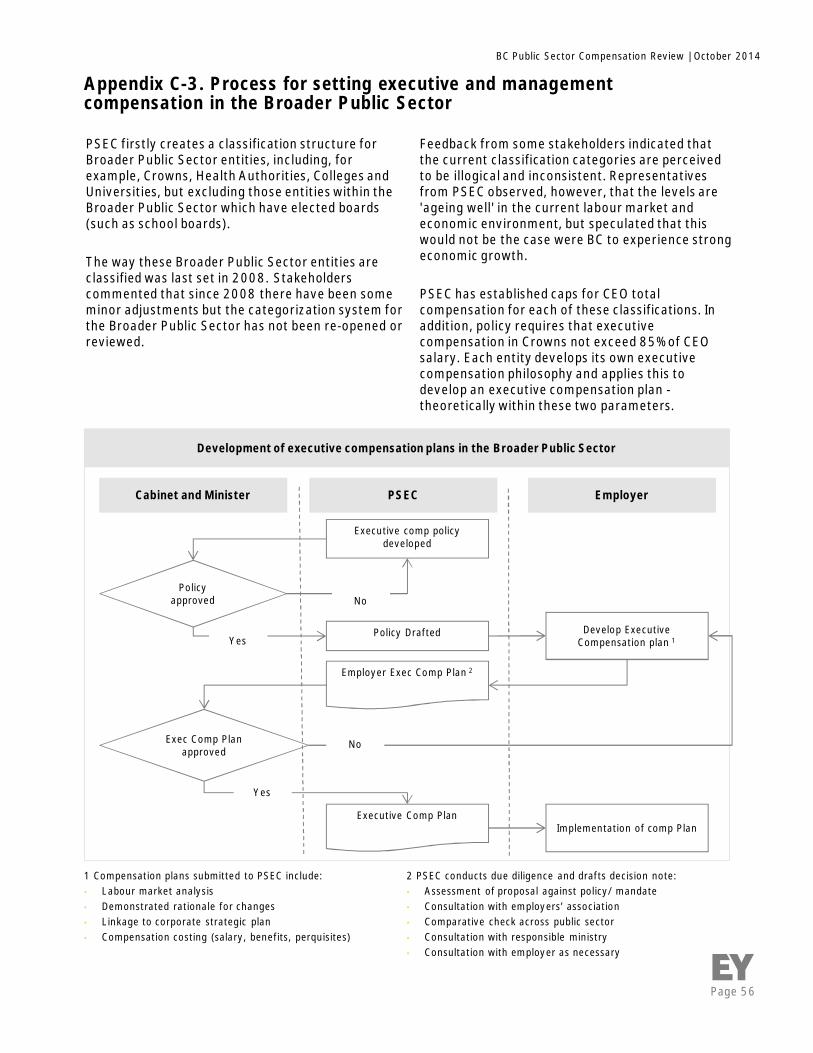
Page 56
BC Public Sector Compensation Review | October 2014
PSEC firstly creates a classification structure forBroader Public Sector entities, including, forexample, Crowns, Health Authorities, Colleges andUniversities, but excluding those entities within theBroader Public Sector which have elected boards(such as school boards).
The way these Broader Public Sector entities areclassified was last set in 2008. Stakeholderscommented that since 2008 there have been someminor adjustments but the categorization system forthe Broader Public Sector has not been re-opened orreviewed.
Appendix C-3. Process for setting executive and managementcompensation in the Broader Public Sector
Development of executive compensation plans in the Broader Public Sector
Cabinet and Minister PSEC Employer
Policyapproved
Executive comp policydeveloped
Policy Drafted
Employer Exec Comp Plan 2
No
Exec Comp Planapproved
Executive Comp Plan
Develop ExecutiveCompensation plan 1
Yes
No
Yes
Implementation of comp Plan
1 Compensation plans submitted to PSEC include:• Labour market analysis• Demonstrated rationale for changes• Linkage to corporate strategic plan• Compensation costing (salary, benefits, perquisites)
2 PSEC conducts due diligence and drafts decision note:• Assessment of proposal against policy/ mandate• Consultation with employers’ association• Comparative check across public sector• Consultation with responsible ministry• Consultation with employer as necessary
Feedback from some stakeholders indicated thatthe current classification categories are perceivedto be illogical and inconsistent. Representativesfrom PSEC observed, however, that the levels are'ageing well' in the current labour market andeconomic environment, but speculated that thiswould not be the case were BC to experience strongeconomic growth.
PSEC has established caps for CEO totalcompensation for each of these classifications. Inaddition, policy requires that executivecompensation in Crowns not exceed 85% of CEOsalary. Each entity develops its own executivecompensation philosophy and applies this todevelop an executive compensation plan -theoretically within these two parameters.
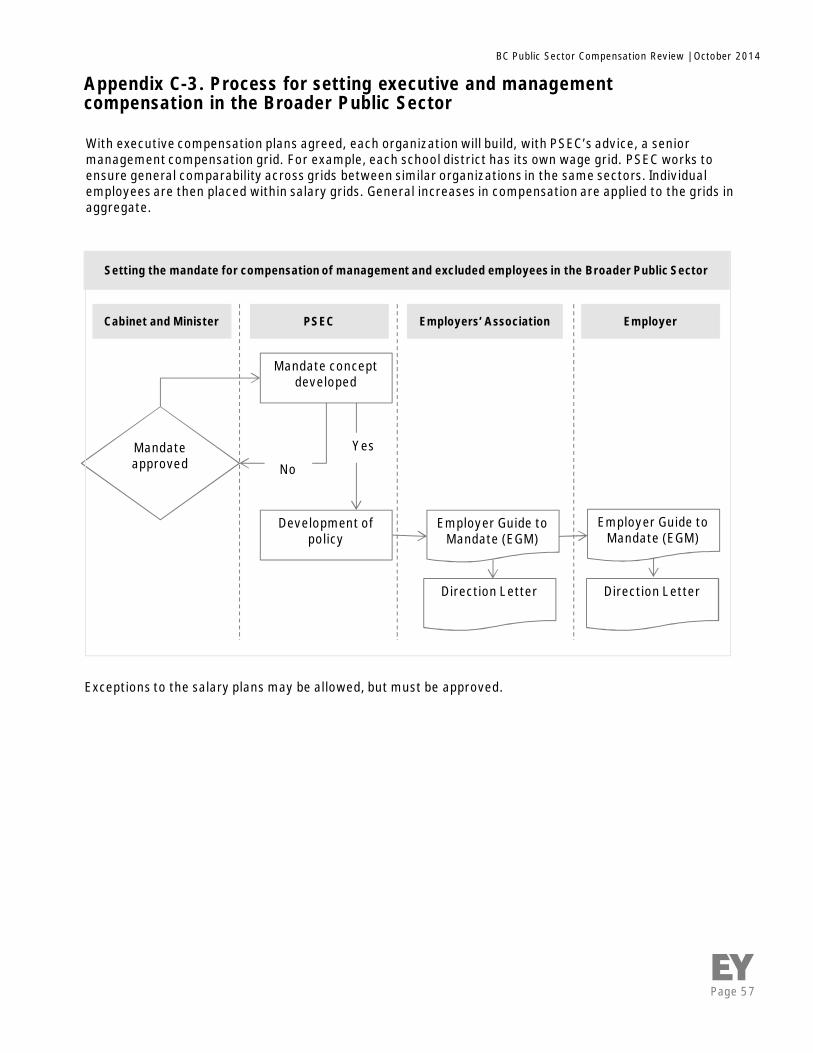
Page 57
BC Public Sector Compensation Review | October 2014
Mandateapproved
Mandate conceptdeveloped
Development ofpolicy
Employer Guide toMandate (EGM)
Employer Guide toMandate (EGM)
No
Yes
Direction Letter Direction Letter
Cabinet and Minister PSEC Employer
Setting the mandate for compensation of management and excluded employees in the Broader Public Sector
Employers’ Association
Exceptions to the salary plans may be allowed, but must be approved.
With executive compensation plans agreed, each organization will build, with PSEC’s advice, a seniormanagement compensation grid. For example, each school district has its own wage grid. PSEC works toensure general comparability across grids between similar organizations in the same sectors. Individualemployees are then placed within salary grids. General increases in compensation are applied to the grids inaggregate.
Appendix C-3. Process for setting executive and managementcompensation in the Broader Public Sector

Page 58
BC Public Sector Compensation Review | October 2014
Appendix C-4. Process for setting compensation for employees coveredunder collective agreements in the Broader Public Sector
Cabinet andMinister PSEC Employer
Setting the mandate for unionized bargaining in the Broader Public Sector
Employers’Association
Mandateapproved
Mandate conceptdeveloped
Development ofpolicy
Employer Guide toMandate (EGM)
Employer Guide toMandate (EGM)
Bargaining Plan DevelopBargaining Plan
DevelopBargaining Plan
NoYes
Barg.Plan
Approved
BargainingDirection Letter
BargainingDirection Letter
BargainingCommences
BargainingCommences
No No
Yes
Yes
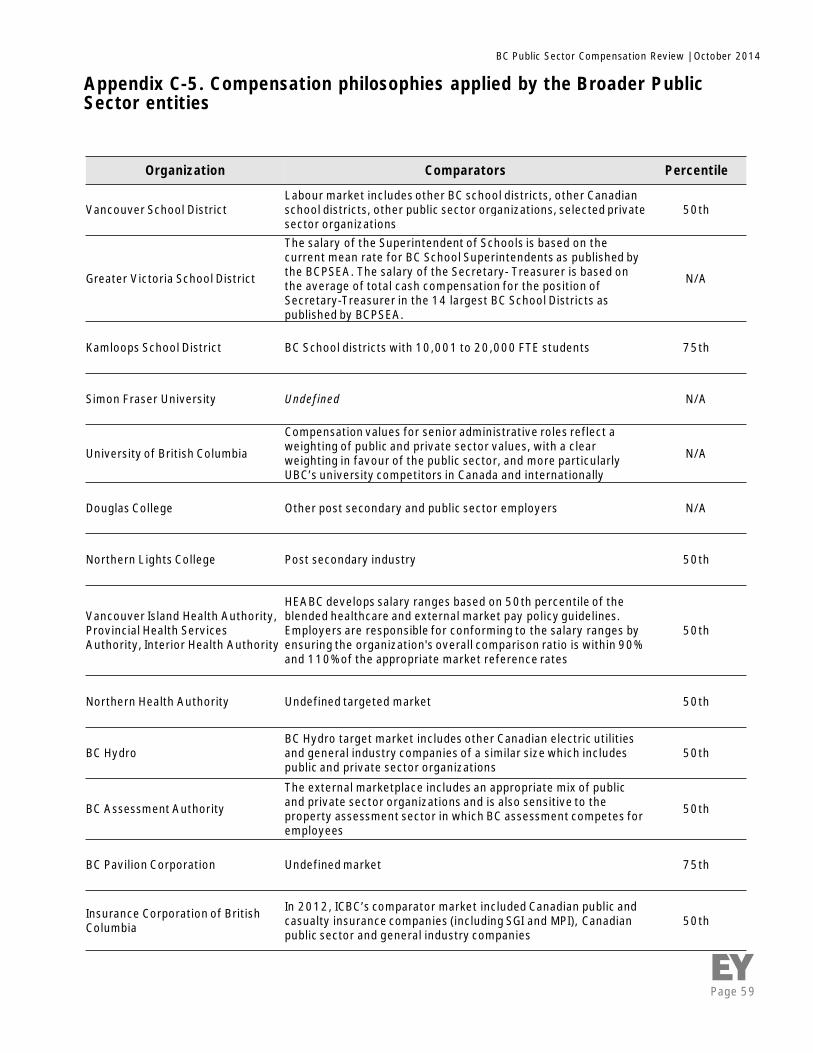
Page 59
BC Public Sector Compensation Review | October 2014
Appendix C-5. Compensation philosophies applied by the Broader PublicSector entities
Organization Comparators Percentile
Vancouver School DistrictLabour market includes other BC school districts, other Canadianschool districts, other public sector organizations, selected privatesector organizations
50th
Greater Victoria School District
The salary of the Superintendent of Schools is based on thecurrent mean rate for BC School Superintendents as published bythe BCPSEA. The salary of the Secretary- Treasurer is based onthe average of total cash compensation for the position ofSecretary-Treasurer in the 14 largest BC School Districts aspublished by BCPSEA.
N/A
Kamloops School District BC School districts with 10,001 to 20,000 FTE students 75th
Simon Fraser University Undefined N/A
University of British Columbia
Compensation values for senior administrative roles reflect aweighting of public and private sector values, with a clearweighting in favour of the public sector, and more particularlyUBC’s university competitors in Canada and internationally
N/A
Douglas College Other post secondary and public sector employers N/A
Northern Lights College Post secondary industry 50th
Vancouver Island Health Authority,Provincial Health ServicesAuthority, Interior Health Authority
HEABC develops salary ranges based on 50th percentile of theblended healthcare and external market pay policy guidelines.Employers are responsible for conforming to the salary ranges byensuring the organization's overall comparison ratio is within 90%and 110% of the appropriate market reference rates
50th
Northern Health Authority Undefined targeted market 50th
BC HydroBC Hydro target market includes other Canadian electric utilitiesand general industry companies of a similar size which includespublic and private sector organizations
50th
BC Assessment Authority
The external marketplace includes an appropriate mix of publicand private sector organizations and is also sensitive to theproperty assessment sector in which BC assessment competes foremployees
50th
BC Pavilion Corporation Undefined market 75th
Insurance Corporation of BritishColumbia
In 2012, ICBC’s comparator market included Canadian public andcasualty insurance companies (including SGI and MPI), Canadianpublic sector and general industry companies
50th
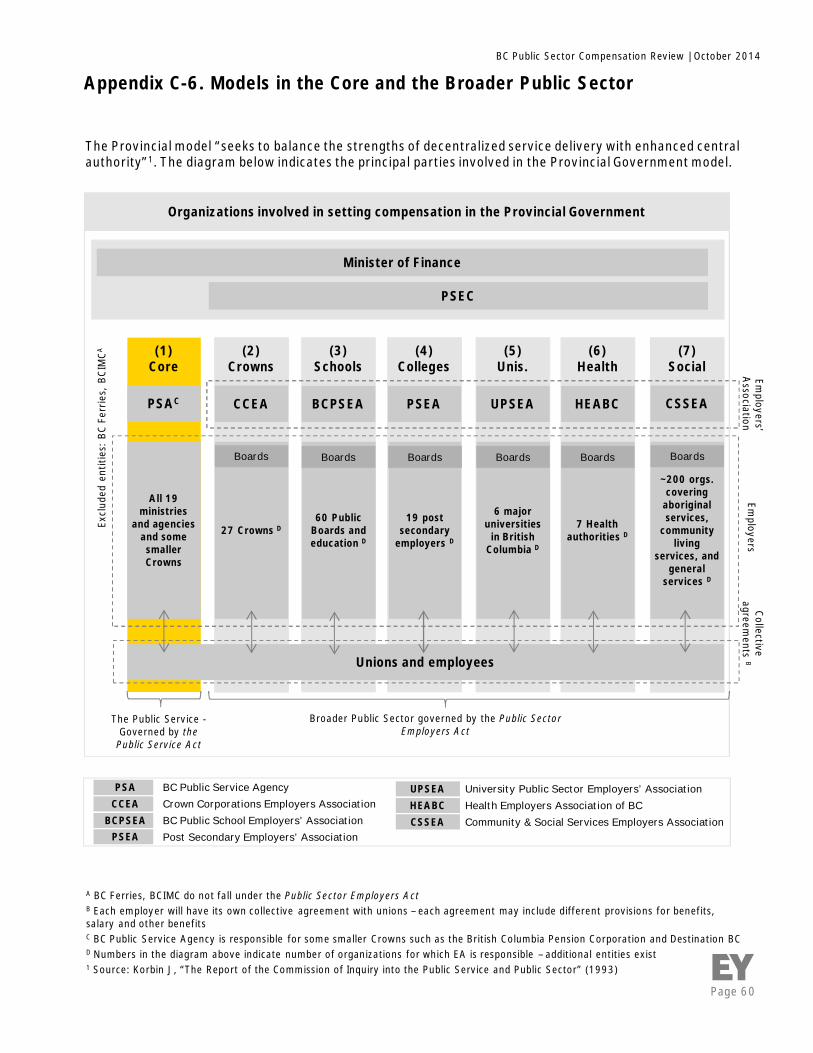
Page 60
BC Public Sector Compensation Review | October 2014
The Provincial model “seeks to balance the strengths of decentralized service delivery with enhanced centralauthority”1. The diagram below indicates the principal parties involved in the Provincial Government model.
Appendix C-6. Models in the Core and the Broader Public Sector
Organizations involved in setting compensation in the Provincial Government
(1)Core
PSAC
Minister of Finance
PSEC
(2)Crowns
CCEA
(3)Schools
BCPSEA
(4)Colleges
PSEA
(5)Unis.
UPSEA
(6)Health
HEABC
(7)Social
CSSEA
All 19ministries
and agenciesand somesmallerCrowns
27 Crowns D60 Public
Boards andeducation D
19 postsecondary
employers D
6 majoruniversities
in BritishColumbia D
7 Healthauthorities D
~200 orgs.covering
aboriginalservices,
communityliving
services, andgeneral
services D
Unions and employees
PSACCEA
PSEABCPSEA
BC Public Service AgencyCrown Corporations Employers Association
Post Secondary Employers’ AssociationBC Public School Employers’ Association
A BC Ferries, BCIMC do not fall under the Public Sector Employers ActB Each employer will have its own collective agreement with unions – each agreement may include different provisions for benefits,salary and other benefitsC BC Public Service Agency is responsible for some smaller Crowns such as the British Columbia Pension Corporation and Destination BCD Numbers in the diagram above indicate number of organizations for which EA is responsible – additional entities exist1 Source: Korbin J, “The Report of the Commission of Inquiry into the Public Service and Public Sector” (1993)
Broader Public Sector governed by the Public SectorEmployers Act
The Public Service -Governed by the
Public Service Act
UPSEAHEABCCSSEA
University Public Sector Employers’ AssociationHealth Employers Association of BCCommunity & Social Services Employers Association
Excl
uded
entit
ies:
BCFe
rrie
s,BC
IMCA
Employers’
Association
Employers
Collectiveagreem
entsB
Boards Boards Boards Boards Boards Boards
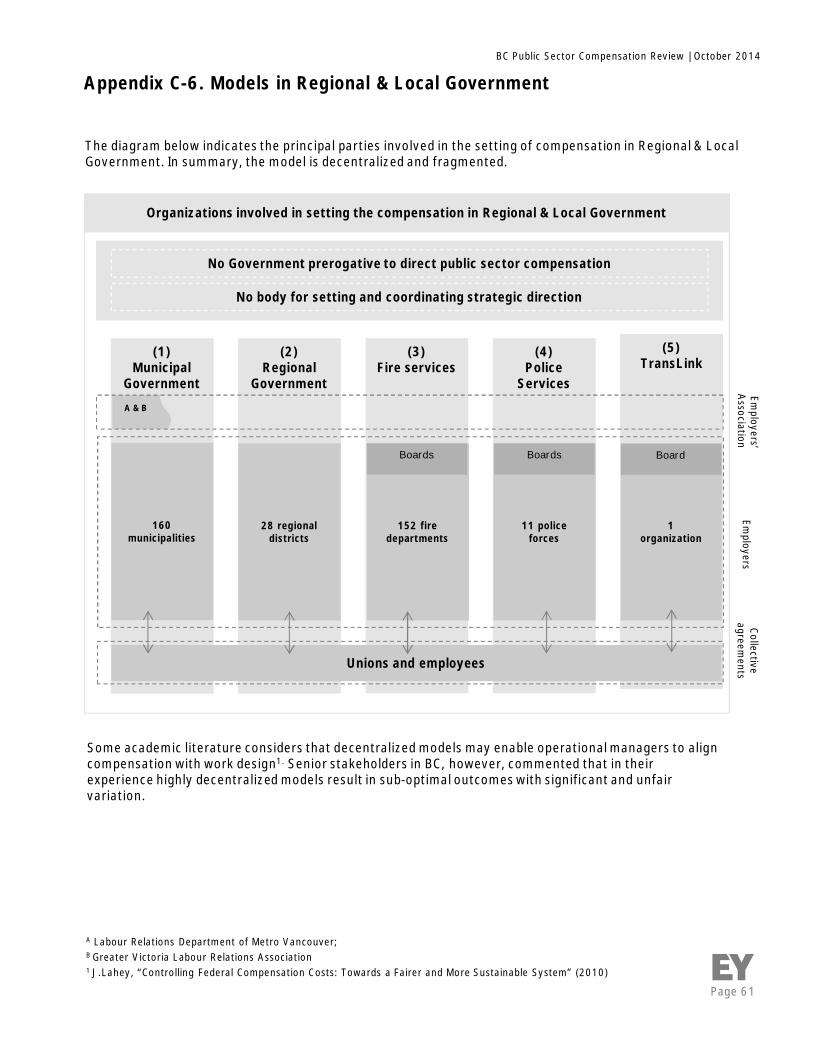
Page 61
BC Public Sector Compensation Review | October 2014
The diagram below indicates the principal parties involved in the setting of compensation in Regional & LocalGovernment. In summary, the model is decentralized and fragmented.
Organizations involved in setting the compensation in Regional & Local Government
(1)Municipal
Government
No Government prerogative to direct public sector compensation
No body for setting and coordinating strategic direction
(2)Regional
Government
(3)Fire services
(4)Police
Services
160municipalities
11 policeforces
(5)TransLink
A & B
1organization
152 firedepartments
28 regionaldistricts
Unions and employees
BoardsBoards Board
Employers’
Association
Employers
Collectiveagreem
ents
A Labour Relations Department of Metro Vancouver;B Greater Victoria Labour Relations Association1 J.Lahey, “Controlling Federal Compensation Costs: Towards a Fairer and More Sustainable System” (2010)
Some academic literature considers that decentralized models may enable operational managers to aligncompensation with work design1. Senior stakeholders in BC, however, commented that in theirexperience highly decentralized models result in sub-optimal outcomes with significant and unfairvariation.
Appendix C-6. Models in Regional & Local Government
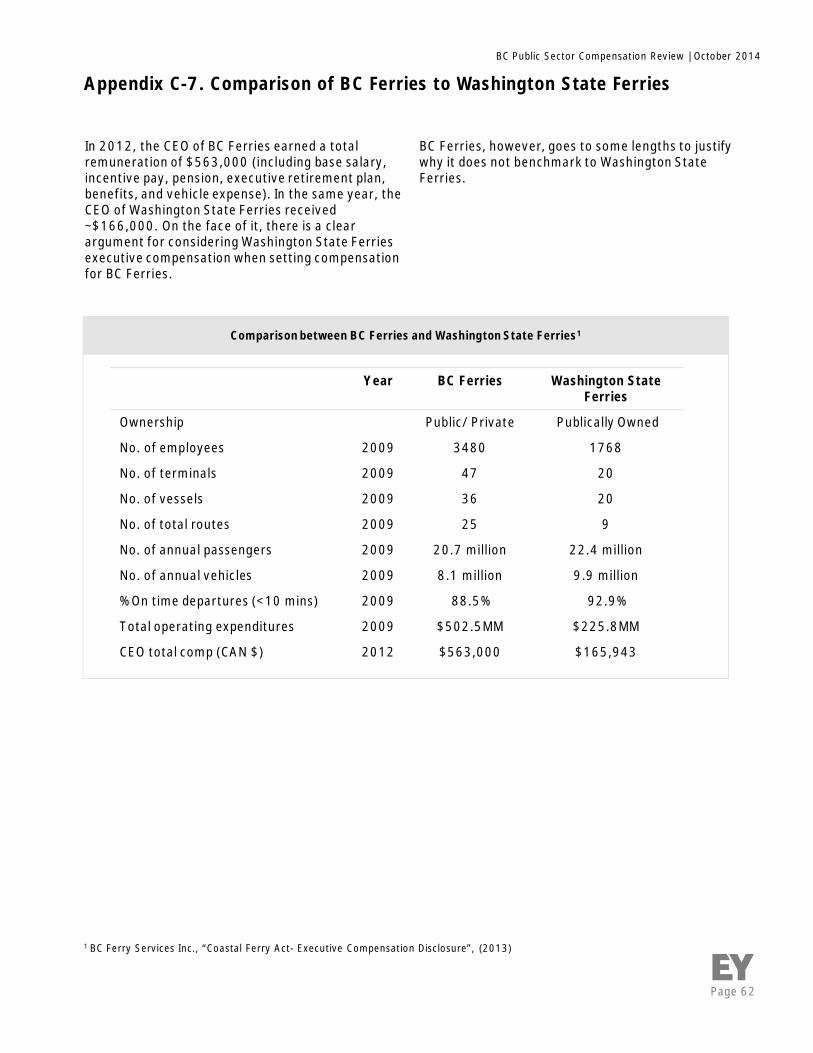
Page 62
BC Public Sector Compensation Review | October 2014
In 2012, the CEO of BC Ferries earned a totalremuneration of $563,000 (including base salary,incentive pay, pension, executive retirement plan,benefits, and vehicle expense). In the same year, theCEO of Washington State Ferries received~$166,000. On the face of it, there is a clearargument for considering Washington State Ferriesexecutive compensation when setting compensationfor BC Ferries.
Appendix C-7. Comparison of BC Ferries to Washington State Ferries
Comparison between BC Ferries and Washington State Ferries1
Year BC Ferries Washington StateFerries
Ownership Public/ Private Publically Owned
No. of employees 2009 3480 1768
No. of terminals 2009 47 20
No. of vessels 2009 36 20
No. of total routes 2009 25 9
No. of annual passengers 2009 20.7 million 22.4 million
No. of annual vehicles 2009 8.1 million 9.9 million
% On time departures (<10 mins) 2009 88.5% 92.9%
Total operating expenditures 2009 $502.5MM $225.8MM
CEO total comp (CAN $) 2012 $563,000 $165,943
BC Ferries, however, goes to some lengths to justifywhy it does not benchmark to Washington StateFerries.
1 BC Ferry Services Inc., “Coastal Ferry Act- Executive Compensation Disclosure”, (2013)
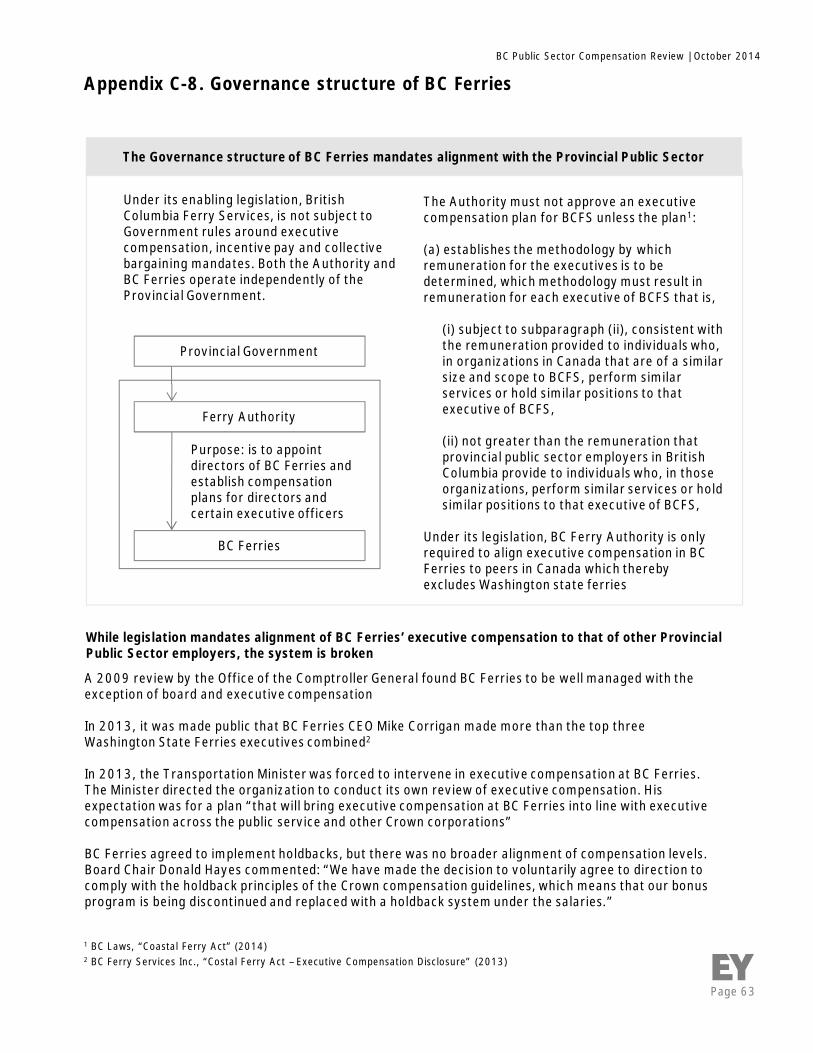
Page 63
BC Public Sector Compensation Review | October 2014
Appendix C-8. Governance structure of BC Ferries
The Authority must not approve an executivecompensation plan for BCFS unless the plan1:
(a) establishes the methodology by whichremuneration for the executives is to bedetermined, which methodology must result inremuneration for each executive of BCFS that is,
(i) subject to subparagraph (ii), consistent withthe remuneration provided to individuals who,in organizations in Canada that are of a similarsize and scope to BCFS, perform similarservices or hold similar positions to thatexecutive of BCFS,
(ii) not greater than the remuneration thatprovincial public sector employers in BritishColumbia provide to individuals who, in thoseorganizations, perform similar services or holdsimilar positions to that executive of BCFS,
Under its legislation, BC Ferry Authority is onlyrequired to align executive compensation in BCFerries to peers in Canada which therebyexcludes Washington state ferries
Under its enabling legislation, BritishColumbia Ferry Services, is not subject toGovernment rules around executivecompensation, incentive pay and collectivebargaining mandates. Both the Authority andBC Ferries operate independently of theProvincial Government.
Provincial Government
Ferry Authority
BC Ferries
Purpose: is to appointdirectors of BC Ferries andestablish compensationplans for directors andcertain executive officers
A 2009 review by the Office of the Comptroller General found BC Ferries to be well managed with theexception of board and executive compensation
In 2013, it was made public that BC Ferries CEO Mike Corrigan made more than the top threeWashington State Ferries executives combined2
In 2013, the Transportation Minister was forced to intervene in executive compensation at BC Ferries.The Minister directed the organization to conduct its own review of executive compensation. Hisexpectation was for a plan “that will bring executive compensation at BC Ferries into line with executivecompensation across the public service and other Crown corporations”
BC Ferries agreed to implement holdbacks, but there was no broader alignment of compensation levels.Board Chair Donald Hayes commented: “We have made the decision to voluntarily agree to direction tocomply with the holdback principles of the Crown compensation guidelines, which means that our bonusprogram is being discontinued and replaced with a holdback system under the salaries.”
1 BC Laws, “Coastal Ferry Act” (2014)2 BC Ferry Services Inc., “Costal Ferry Act – Executive Compensation Disclosure” (2013)
While legislation mandates alignment of BC Ferries’ executive compensation to that of other ProvincialPublic Sector employers, the system is broken
The Governance structure of BC Ferries mandates alignment with the Provincial Public Sector
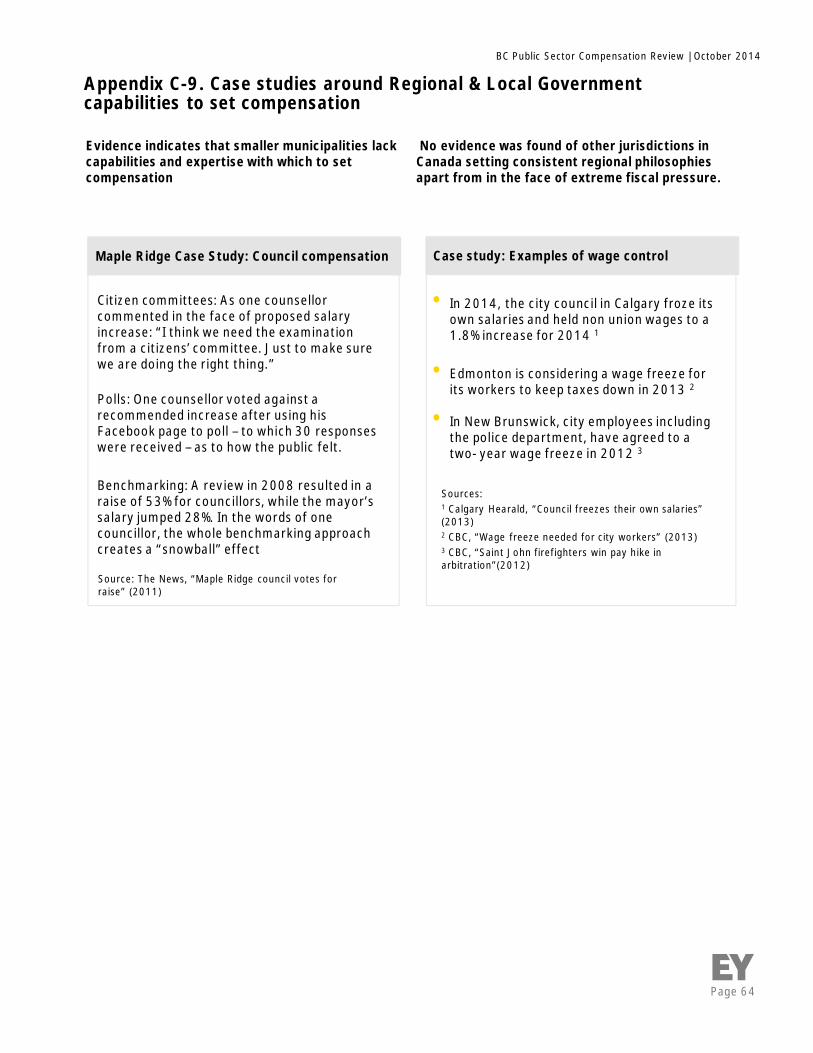
Page 64
BC Public Sector Compensation Review | October 2014
Appendix C-9. Case studies around Regional & Local Governmentcapabilities to set compensation
Source: The News, “Maple Ridge council votes forraise” (2011)
Maple Ridge Case Study: Council compensation
Citizen committees: As one counsellorcommented in the face of proposed salaryincrease: “I think we need the examinationfrom a citizens’ committee. Just to make surewe are doing the right thing.”
Polls: One counsellor voted against arecommended increase after using hisFacebook page to poll – to which 30 responseswere received – as to how the public felt.
Benchmarking: A review in 2008 resulted in araise of 53% for councillors, while the mayor’ssalary jumped 28%. In the words of onecouncillor, the whole benchmarking approachcreates a “snowball” effect
Case study: Examples of wage control
• In 2014, the city council in Calgary froze itsown salaries and held non union wages to a1.8% increase for 2014 1
• Edmonton is considering a wage freeze forits workers to keep taxes down in 2013 2
• In New Brunswick, city employees includingthe police department, have agreed to atwo- year wage freeze in 2012 3
Sources:1 Calgary Hearald, “Council freezes their own salaries”(2013)2 CBC, “Wage freeze needed for city workers” (2013)3 CBC, “Saint John firefighters win pay hike inarbitration”(2012)
No evidence was found of other jurisdictions inCanada setting consistent regional philosophiesapart from in the face of extreme fiscal pressure.
Evidence indicates that smaller municipalities lackcapabilities and expertise with which to setcompensation

Page 65
BC Public Sector Compensation Review | October 2014
Appendix C-10. PSEC, and the BC Public Service Agency provide advice, co-ordination and enforcement in the Provincial Government & AGLG audits ofLocal Government
1 Government of BC, “Public Sector Employers Act” (2013)2 BC Laws, “Auditor General for Local Government Act” (2013)
Public Sector Employers’ Council1: PSEC consists ofthe Minister, who chairs the Council, and thefollowing members appointed by the LieutenantGovernor in Council:
► Not more than 7 persons each of whom iseither a member of the Executive Council or adeputy minister;
► A person nominated by each of the employers'associations
► The head of the BC Public Service Agency
The functions of the Council are to:
► Set and coordinate strategic directions inhuman resource management and labourrelations
► Advise the Government on human resourceissues with respect to the public sector
► Provide a forum to enable public sectoremployers to plan solutions to human resourceissues consistent with cost efficient andeffective delivery of services in the publicsector
Under the terms of the Public Sector Employers Act,PSEC’s responsibilities apply to all public sectoremployers, where public sector employers aredefined as:
► The Government► Crown corporations► School Boards► Colleges► Universities► Health care employers► Social services employers
BC Public Service Agency: Under a provisionpertaining to “personnel management in the publicservice,” the Public Sector Act defines the BC PublicService Agency’s responsibilities as includingadvising the Minister respecting personnel policies;recruiting, selecting and appointing employees;overseeing staff training and carrying out researchon compensation.
Indeed the original vision for the BC Public ServiceAgency as defined in the Commission’s 1993 reportwas for it to have responsibility for “Strategic HumanResources.”
AGLG: The office of the Auditor General for LocalGovernment (“AGLG”) was established in April 2012through the Auditor General for Local GovernmentAct.
This Act states that the purpose of the AGLG is to“conduct performance audits of the operations oflocal Governments in order to provide LocalGovernments with objective information and relevantadvice that will assist them in their accountability totheir communities for the stewardship of publicassets and the achievement of value for money in theoperations”.
The AGLG, like its federal and provincialcounterparts, will be limited in that it will not“question the merits of policy decisions or objectivesof a local Government”. The AGLG will therefore onlycomment on the quality of policy implementation.The AGLG will also provide non-bindingrecommendations to the audited local Governmentsthrough publically released reports.2
While the AGLG plans to conduct a performance auditof “Managing the Inherent Risks of Limited HumanResources within Small Local Governments”, it doesnot currently have a publicly stated plan to reviewcompensation as a specific issue.
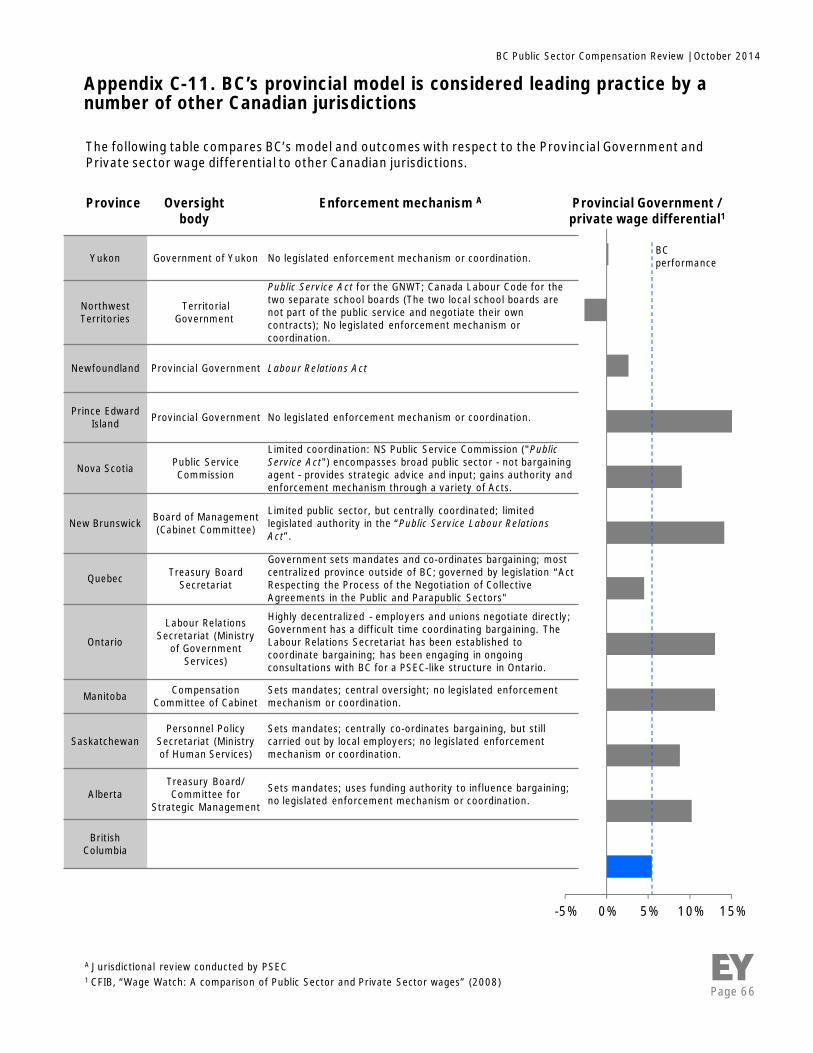
Page 66
BC Public Sector Compensation Review | October 2014
Oversightbody
Province Enforcement mechanism A Provincial Government /private wage differential1
Yukon Government of Yukon No legislated enforcement mechanism or coordination.
NorthwestTerritories
TerritorialGovernment
Public Service Act for the GNWT; Canada Labour Code for thetwo separate school boards (The two local school boards arenot part of the public service and negotiate their owncontracts); No legislated enforcement mechanism orcoordination.
Newfoundland Provincial Government Labour Relations Act
Prince EdwardIsland Provincial Government No legislated enforcement mechanism or coordination.
Nova Scotia Public ServiceCommission
Limited coordination: NS Public Service Commission ("PublicService Act") encompasses broad public sector - not bargainingagent - provides strategic advice and input; gains authority andenforcement mechanism through a variety of Acts.
New Brunswick Board of Management(Cabinet Committee)
Limited public sector, but centrally coordinated; limitedlegislated authority in the “Public Service Labour RelationsAct”.
Quebec Treasury BoardSecretariat
Government sets mandates and co-ordinates bargaining; mostcentralized province outside of BC; governed by legislation “ActRespecting the Process of the Negotiation of CollectiveAgreements in the Public and Parapublic Sectors"
Ontario
Labour RelationsSecretariat (Ministry
of GovernmentServices)
Highly decentralized - employers and unions negotiate directly;Government has a difficult time coordinating bargaining. TheLabour Relations Secretariat has been established tocoordinate bargaining; has been engaging in ongoingconsultations with BC for a PSEC-like structure in Ontario.
Manitoba CompensationCommittee of Cabinet
Sets mandates; central oversight; no legislated enforcementmechanism or coordination.
SaskatchewanPersonnel Policy
Secretariat (Ministryof Human Services)
Sets mandates; centrally co-ordinates bargaining, but stillcarried out by local employers; no legislated enforcementmechanism or coordination.
AlbertaTreasury Board/Committee for
Strategic Management
Sets mandates; uses funding authority to influence bargaining;no legislated enforcement mechanism or coordination.
BritishColumbia
Appendix C-11. BC’s provincial model is considered leading practice by anumber of other Canadian jurisdictions
-5% 0% 5% 10% 15%
BCperformance
A Jurisdictional review conducted by PSEC1 CFIB, “Wage Watch: A comparison of Public Sector and Private Sector wages” (2008)
The following table compares BC’s model and outcomes with respect to the Provincial Government andPrivate sector wage differential to other Canadian jurisdictions.
Page 67
BC Public Sector Compensation Review | October 2014
Appendix C-12. The Minister has set policy to create a more rigorousapproach to executive compensation in Crowns
► Set maximum caps for CEOs and ensure allother executive salaries are less than that ineach Crown
► Eliminate bonuses. Implement salaryholdbacks within a maximum base salary
► Executive salaries frozen in CrownCorporations
► Where bonuses are now present, animplementation plan to move to holdbacks tobe provided to PSEC secretariat
► When a new staff or newly promoted staffmoves to an executive position, whichcurrently has bonus, a holdback to amaximum of 20% of max base salary will beemployed
► Performance criteria will be established byagreement between the Board and theMinister responsible for the CrownCorporation and will reflect Governmentpriorities as outlined in the shareholders'letters of expectations
► Holdbacks should be phased out belowexecutive level. In general holdbacks shouldbe used for executive only
1 Crown Corporation Executive Compensation Policy (2012)
Stakeholders from PSEC commented that over the last two years, a plan has been designed andimplemented to resolve the issue of repeated breaching of CEO compensation caps, and reported thatgood progress had been made. In particular, in early 2012, a working group of Crown Corporation BoardChairs was formed at the request of Government to propose revisions to the framework guiding executivecompensation in Crown Corporations. The Government, in its role as shareholder, was concerned aboutlevels of bonuses available in some Crown Corporations, variations in their administration, and the numberof executives in some Crown Corporations. 1
Objectives of the review
► Limit generic perquisites to transportationallowances and only provide such anallowance where appropriate
► Organizational design, including the numberof executives and number of organizationallayers that is satisfactory to Government
Outcome of the review
► However, the policy states, 'elimination ofbonuses and holdbacks where they apply tounionized staff is a bargaining issue and notwithin the scope of the policy
► Perquisites will be discontinued. Policystates that perquisites will be discontinuedfor new employees or newly appointedemployees. For existing employees, they willbe eliminated as quickly as possible withinthe bounds of employment law. A plan forthe removal of perquisites is to be providedto PSEC
► Transportation allowances are permitted
► If executives to a CEO earn more than 85%of the CEOs total compensation, a plan toeliminate compression will be developed byCrown in consultation with PSEC
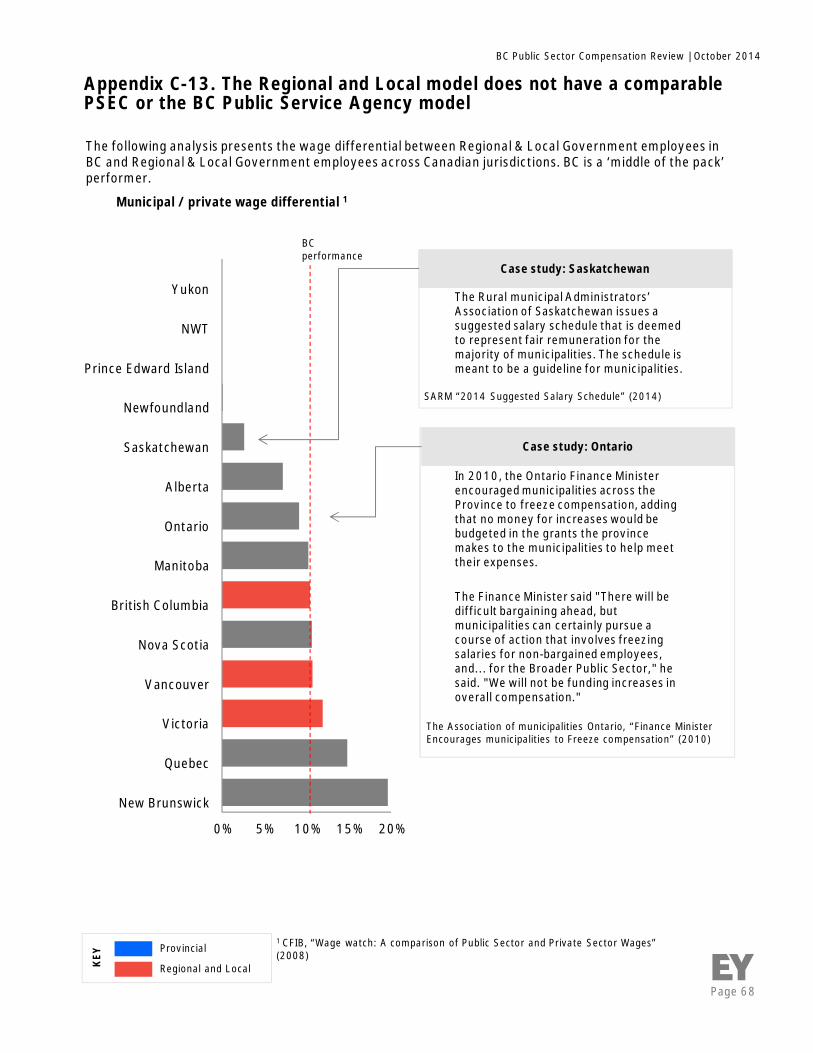
Page 68
BC Public Sector Compensation Review | October 2014
Appendix C-13. The Regional and Local model does not have a comparablePSEC or the BC Public Service Agency model
The following analysis presents the wage differential between Regional & Local Government employees inBC and Regional & Local Government employees across Canadian jurisdictions. BC is a ‘middle of the pack’performer.
0% 5% 10% 15% 20%
New Brunswick
Quebec
Victoria
Vancouver
Nova Scotia
British Columbia
Manitoba
Ontario
Alberta
Saskatchewan
Newfoundland
Prince Edward Island
NWT
Yukon
BCperformance
Municipal / private wage differential 1
In 2010, the Ontario Finance Ministerencouraged municipalities across theProvince to freeze compensation, addingthat no money for increases would bebudgeted in the grants the provincemakes to the municipalities to help meettheir expenses.
The Finance Minister said "There will bedifficult bargaining ahead, butmunicipalities can certainly pursue acourse of action that involves freezingsalaries for non-bargained employees,and... for the Broader Public Sector," hesaid. "We will not be funding increases inoverall compensation."
Case study: Ontario
The Rural municipal Administrators’Association of Saskatchewan issues asuggested salary schedule that is deemedto represent fair remuneration for themajority of municipalities. The schedule ismeant to be a guideline for municipalities.
Case study: Saskatchewan
The Association of municipalities Ontario, “Finance MinisterEncourages municipalities to Freeze compensation” (2010)
SARM “2014 Suggested Salary Schedule” (2014)
1 CFIB, “Wage watch: A comparison of Public Sector and Private Sector Wages”(2008)
Provincial
Regional and LocalKEY
Page 69
BC Public Sector Compensation Review | October 2014
Appendix C-14. Employers’ Association – Regional & Local Governmentlacks entities to provide coordination in response to organized labour
Vancouver and Victoria have built more co-ordinated responses to organized labour
The Lower Mainland and Victoria have bothendeavoured to build more co-ordinated responsesto organized labour in the form of the LabourRelations department of Metro Vancouver and theGreater Victoria Labour Relations Association.
In the Lower Mainland, for example, as early as the1960s, it became evident that the municipal tradeunions’ increasingly sophisticated approach tocollective bargaining was consistently producingsettlement levels in the Lower Mainlandmunicipalities which “could not be justified byreference to either the public or private sectors.”
In response, the City of Vancouver, the City of NewWestminster and the District of Burnabyestablished the Joint Liaison Committee on LabourRelations in order to formalize consultation andcollaboration in collective bargaining matters. In afurther effort to enhance levels of consultation andco-ordination, in 1965 the municipal LabourRelations Bureau (“MLRB”) was formed to providecommon negotiating, research, and advisoryservices to its members. By 1982, the MLRB joinedthe Labour Relations Function of the GreaterVancouver Regional District (now known as “MetroVancouver”).
Today, the labour relations department of MetroVancouver provides labour relations and ancillaryservices to Metro Vancouver's 15 municipalities, 1regional district, and 16 related employers. Onbehalf of its members, the Labour Relationsdepartment:
► Negotiates collective agreements
► Evaluates and re-classifies jobs
► Researches key collective bargaininginformation like pay in the market place
► Other related labour relations services
However, the co-ordination of labour relations inthe Lower Mainland is increasingly fragmented
Municipalities within metro Vancouver can choosewhether they want to be participating members ofthe Bureau. The Bureau has never had Surrey as afull participant and has been hit by a series ofwithdrawals or notification of intent to leave inrecent years including Richmond and Coquitlam,Burnaby, Vancouver, Delta, and West Vancouver.One stakeholder speculated that some of thesedepartures were due to union pressure on citymayors and councillors.
“Municipalities have acted at and away fromcollective bargaining table in ways that have
surprised and aggravated others.”
James Dorsey, “Sustainable or Spent Force: Review of MetroVancouver Labour Relations Function” (2011)
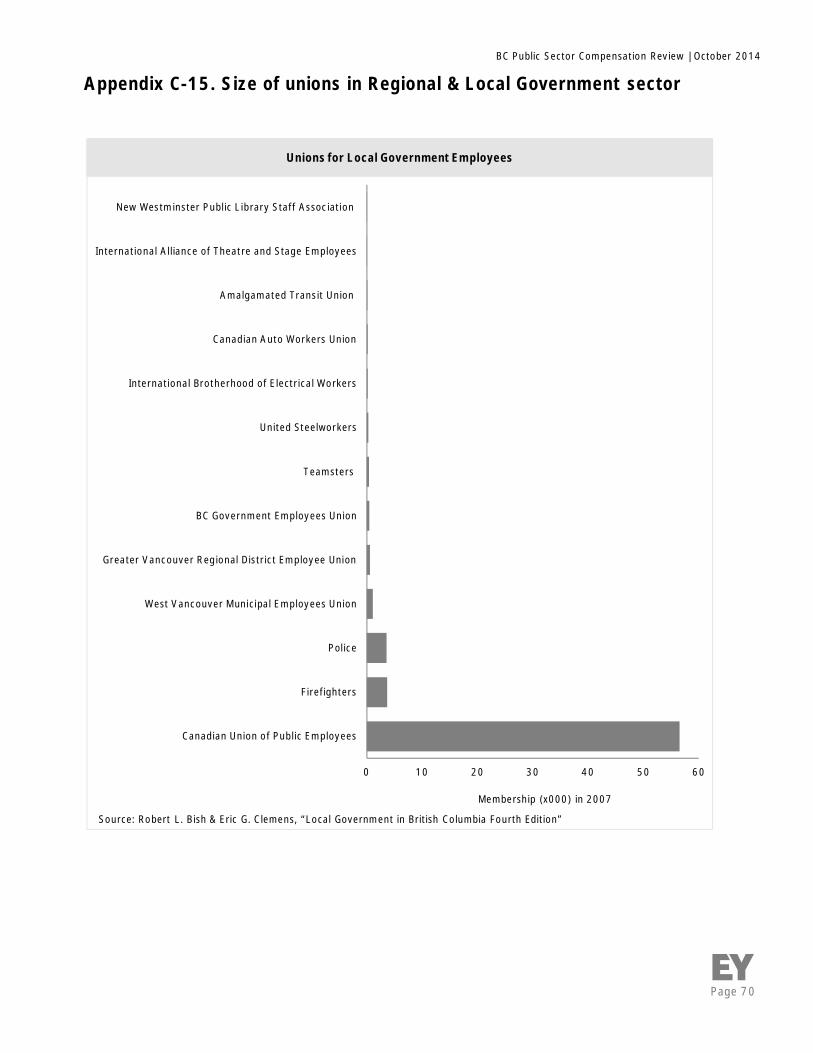
Page 70
BC Public Sector Compensation Review | October 2014
Appendix C-15. Size of unions in Regional & Local Government sector
0 10 20 30 40 50 60
Canadian Union of Public Employees
Firefighters
Police
West Vancouver Municipal Employees Union
Greater Vancouver Regional District Employee Union
BC Government Employees Union
Teamsters
United Steelworkers
International Brotherhood of Electrical Workers
Canadian Auto Workers Union
Amalgamated Transit Union
International Alliance of Theatre and Stage Employees
New Westminster Public Library Staff Association
Unions for Local Government Employees
Membership (x000) in 2007
Source: Robert L. Bish & Eric G. Clemens, “Local Government in British Columbia Fourth Edition”
Page 71
BC Public Sector Compensation Review | October 2014
Appendix C-16. Collective bargaining models and processes – There is amixed approach to collective bargaining process across the Province
Influence of strikes on political players
In the private sector when work ceases, customerscan procure substitutes from alternative suppliers –generally with little inconvenience and with no ‘outof pocket’ cost. When work ceases in the publicsector, however, the associated services – such asgarbage collection or public transit – cease to beavailable. In many cases this causes significantinconvenience for citizens while they generallycontinue to pay for or subsidize these servicesthrough taxation which continues to be collectedduring work-stoppages. The inconvenience maypotentially cause the electorate to withhold supportor deliberately vote against elected officials inpower at the time of the work-stoppage at futureelections.
In the Province certain modifications have beenmade to the private-sector labour relations model,including legislation to prevent stoppage ofessential services such as fire or police services andthe arbitration of disputes involving such services.However, in many other non-essential serviceareas, when the public is injured or inconveniencedby a cessation of public service, Governmentemployers have no more authority to end thestoppage than a private employer despite thefundamentally different implications. Given theimplications of work-stoppage, there may be agreater willingness to concede to union demands inthe municipalities, on the hope that tax payers willnot react as vehemently to a marginal increase intaxation than they would do to a stoppage inservices. Given the size of municipalities and thenature of the services provided, some observershave speculated that this impact is accentuated atthe municipal level.
Political influence of unions
In addition, it must also be considered that PublicSector union members may be active politicalparticipants1. As Bish observes, union membersmay contribute to campaigns or work on behalf ofelected officials who promise to provide them withmore generous settlements or to increase servicesand may work against those who promise to cuttaxes or reduce services. Unions political supportcomes in numerous kinds:
► Cash
► In kind
► Free labour time: electioneering services
► Information: newspapers, magazines
1 The Fraser Institute, “Wage board: The solution to reining in public sector compensation” (2012)

Page 72
BC Public Sector Compensation Review | October 2014
Appendix C-17. Arbitration system in Fire and Police services
1 The Nelson Daily, ‘Mayor wants to change process for bargainingwith police and fire unions’ (2013); NNL, ‘Big 12 Police ServicesBoards call for arbitration fix’ (2011)2 Labour Relations Board BC, “Guide to the Labour Relations CodeProvince of BC (2014)3 D. Lewin, “The New Great Debate about unionism and Collectivebargaining in U.S. State and Local Governments” (2012)
US Case Study: Impact of arbitration
In the US some states are governed by arbitrationlaws and others are not. 2 A nationwide US studyexamined the effects of arbitration on police andfirefighter wages, and concluded that:
1. Wages of police and firefighters covered byarbitration statutes were not significantly differentfrom wages for police and firefighters in states inwhich collective bargaining does not includearbitration but typically includes mediation, fact-finding, or both.
2. Wage growth for police and firefighters in stateswith bargaining laws that include arbitration didnot differ from wage growth in states withbargaining laws that do not include arbitration.
3. There were no significant differences betweenwage increases awarded to police and firefightersin arbitration and wage increases resulting fromnegotiations without the use of arbitration
These results are not surprising, because mostarbitration statutes in the US require arbitrators tocompare wages and other terms of employmenttogether with cost of living, ability to pay, andother objective factors among comparablejurisdictions in shaping their awards. 3
Academic studies suggest that if arbitration is setup to consider a range of factors, it will havecomparable outcomes to mediation
A number of parties are attempting to change thecurrent arbitration system
1) Nelson City’s mayor commented that theprocesses for negotiation for Fire and Police servicesare biased in favour of the unions. He has called fora change in the way negotiating is done with them.
2) A majority of the Big 12 Police Services Boardsrecently endorsed a resolution requesting that theProvince of Ontario amend the interest arbitrationsystem to ensure that arbitrators apply localeconomic criteria and consider the financial impactof salary and benefits on the municipality and itstaxpayer.
Case Studies 1
The BC Government may already specify specificterms of reference for arbitration. This could beused to limit the range of outcomes
Arbitration under the Fire and Police ServicesCollective Bargaining Act
If the Minister directs that a dispute be resolved byarbitration, the parties may, by agreement, makearrangements for the appointment of an arbitrator.The arbitrator may encourage settlement of thedispute and may use mediation or other proceduresto encourage settlement at any time during thearbitral proceedings. In rendering a decision underthe Act, the arbitrator must consider:
► Terms and conditions of employment foremployees doing similar work
► The need to maintain internal consistencyand equity amongst employees
► Terms and conditions of employment forother groups of employees who areemployed by the employer
► The need to establish terms and conditions ofemployment that are fair and reasonable inrelation to the qualifications required, thework performed, the responsibility assumedand the nature of the services rendered
► The interest and welfare of the communityserved by the employer and the employeesas well as any factors affecting thecommunity
► Any other factor that the arbitrator orarbitration board considers relevant
► In addition, The minister may specify termsof reference for an arbitration.
Page 73
BC Public Sector Compensation Review | October 2014
Appendix C-18. Data limitations have implication for controllingcompensation
There are legislated requirements for the public reporting of public sector compensation in BritishColumbia
We present a brief discussion of the data available to conduct analysis of public sector compensation inBritish Columbia. In particular, two acts mandate the public disclosure of public sector compensation in theprovince: the Public Sector Employers Act and the Financial Information Act. A number of additionalsources on public sector compensation are also potentially at the disposal of the BC Government.
1. Under the Public Sector Employers Act,Provincial Government employers have tworeporting obligations:
► All Provincial Government organizationscovered by the Act must publishcompensation information for the CEO andthe next four highest paid/ranking executivesearning a base salary of at least $125,000.School Districts must publish compensationinformation for all Superintendents,regardless of their salary. This disclosure, or‘Statement of Executive Compensation’, mustinclude information about base salary,benefits, pension contributions, and anyperformance payments
► All public sector employers are also requiredto make available for inspection duringnormal business hours contracts ofemployment for senior employees (defined asany employee earning a base salary of$125,000 or more) 1
2. The Financial Information Act requires all publicsector employers to disclose the total amount ofremuneration and expenses of all employees with abase salary over $75,000 as part of their FinancialStatements made in accordance with the FIA,where remuneration includes any form or salary,wages, performance incentives, gratuities, taxablebenefits, payment into trust or any form of incomedeferral paid by the corporation to the employee,and does not include anything payable under aseverance agreement 2
1 PSEA, “A Guide to Excluded and Executive Compensation in the BC Public Sector” (2009)2 Financial Information Act (1993)
Stakeholders interviewed observed thatBritish Columbia is considered to have oneof if not the most stringent legislateddisclosure requirements for compensationin North America
Case study: Surrey School district
FIA data does not provide a totalcompensation view. For example, a formerassociation superintendent in the Surreyschool district received $614,382 incompensation in 2009-10.
His base salary was $117,095 but he alsoreceived $486,650 in “vehicle allowance,unused vacation, retiring allowance andseverance payout”. There was also a pensioncontribution of $9,637 and another $1,000unaccounted for.
His compensation under FIA disclosure wasreported as $332,224 in 2009-10.
Vancouver Sun, “Surrey gets a record $614,382compensation” (2010)
Page 74
BC Public Sector Compensation Review | October 2014
Appendix C-18. Data limitations have implication for controllingcompensation
There are also a number of aggregate datasources available from Statistics Canada
1. Settlement agreements covering the outcomes ofcollective bargaining are also reported publically,and are available through a number of sourcesincluding:
► The Negotech database, a repository ofcollective agreements which is available as acourtesy via the Human Resources and SkillsDevelopment Canada website1
► The BC Bargaining database as maintained bythe Business Council of British Columbia 2
2. Census data – note that where in previous yearscensus reporting was mandatory, reporting for the2011 census was voluntary and may thereforeimpact results. Data is not publically available at anadequate level of detail to support analysis ofcompensation differentials, but can be purchasedfrom Statistics Canada. PSEC has traditionallypurchased this information
3. Labour Force Survey (LFS) – The Labour ForceSurvey is a monthly survey of approximately56,000 Canadian households. This source is notcurrently leveraged by the BC Government
The BC Government has made initial efforts to usethese sources to begin to understand variation incompensation across the arms of the Public Sector
► PSEC collects detailed compensation data acrossthe broader Provincial Public Sector prior to eachbargaining round through electronic submissions.This data covers wages, wage impacted benefits,non-wage impacted benefits, headcount and FTEnumbers, by bargaining unit or grouping, for allProvincial Government employers and employees.PSEC does not have the legislated authority tocollect similar data from local Governments.
► Data reported under the Financial Information Actis not currently collected, aggregated oranalysed, by the Government. While the data maybe available on organizations’ respectivewebsites, to collect this data would takeconsiderable time and effort. This is compoundedby the fact that many organizations report theirdata in scanned ‘hard copy’, limiting the ability toextract and manipulate data. It is worth notingthat the Vancouver Sun has collected andaggregated this data in electronic format over thelast six years, through Freedom of Informationrequests submitted to individual organizationsacross both the Provincial and Municipalities. Thisdataset is, in turn, made available in searchableform to the public
► The BC Government does collect data oncollective wage settlements in electronic formatfrom Human Resources and DevelopmentCanada. PSEC is in the process of building acomprehensive dataset of public sector collectiveagreements
► PSEC has traditionally purchased census datafrom Statistics Canada but not LFS data
This Review represents an early step by the BCGovernment to build on its own existing work.
1 Human Resources and Skills Development Canada, “Negotech” (2013)2 BC Bargaining Database (2013)
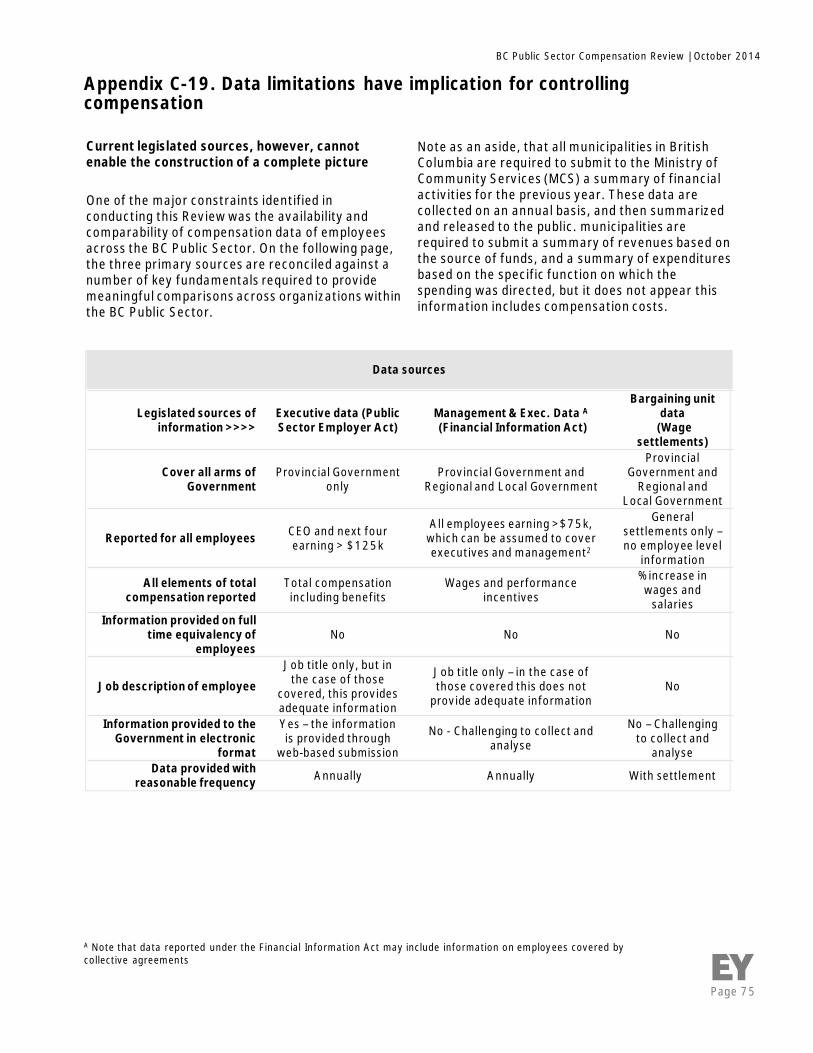
Page 75
BC Public Sector Compensation Review | October 2014
Appendix C-19. Data limitations have implication for controllingcompensation
Current legislated sources, however, cannotenable the construction of a complete picture
One of the major constraints identified inconducting this Review was the availability andcomparability of compensation data of employeesacross the BC Public Sector. On the following page,the three primary sources are reconciled against anumber of key fundamentals required to providemeaningful comparisons across organizations withinthe BC Public Sector.
Note as an aside, that all municipalities in BritishColumbia are required to submit to the Ministry ofCommunity Services (MCS) a summary of financialactivities for the previous year. These data arecollected on an annual basis, and then summarizedand released to the public. municipalities arerequired to submit a summary of revenues based onthe source of funds, and a summary of expendituresbased on the specific function on which thespending was directed, but it does not appear thisinformation includes compensation costs.
A Note that data reported under the Financial Information Act may include information on employees covered bycollective agreements
Legislated sources ofinformation >>>>
Executive data (PublicSector Employer Act)
Management & Exec. Data A
(Financial Information Act)
Bargaining unitdata(Wage
settlements)
Cover all arms ofGovernment
Provincial Governmentonly
Provincial Government andRegional and Local Government
ProvincialGovernment and
Regional andLocal Government
Reported for all employees CEO and next fourearning > $125k
All employees earning >$75k,which can be assumed to coverexecutives and management2
Generalsettlements only –no employee level
information
All elements of totalcompensation reported
Total compensationincluding benefits
Wages and performanceincentives
% increase inwages and
salariesInformation provided on full
time equivalency ofemployees
No No No
Job description of employee
Job title only, but inthe case of those
covered, this providesadequate information
Job title only – in the case ofthose covered this does not
provide adequate informationNo
Information provided to theGovernment in electronic
format
Yes – the informationis provided through
web-based submission
No - Challenging to collect andanalyse
No – Challengingto collect and
analyseData provided with
reasonable frequency Annually Annually With settlement
Data sources
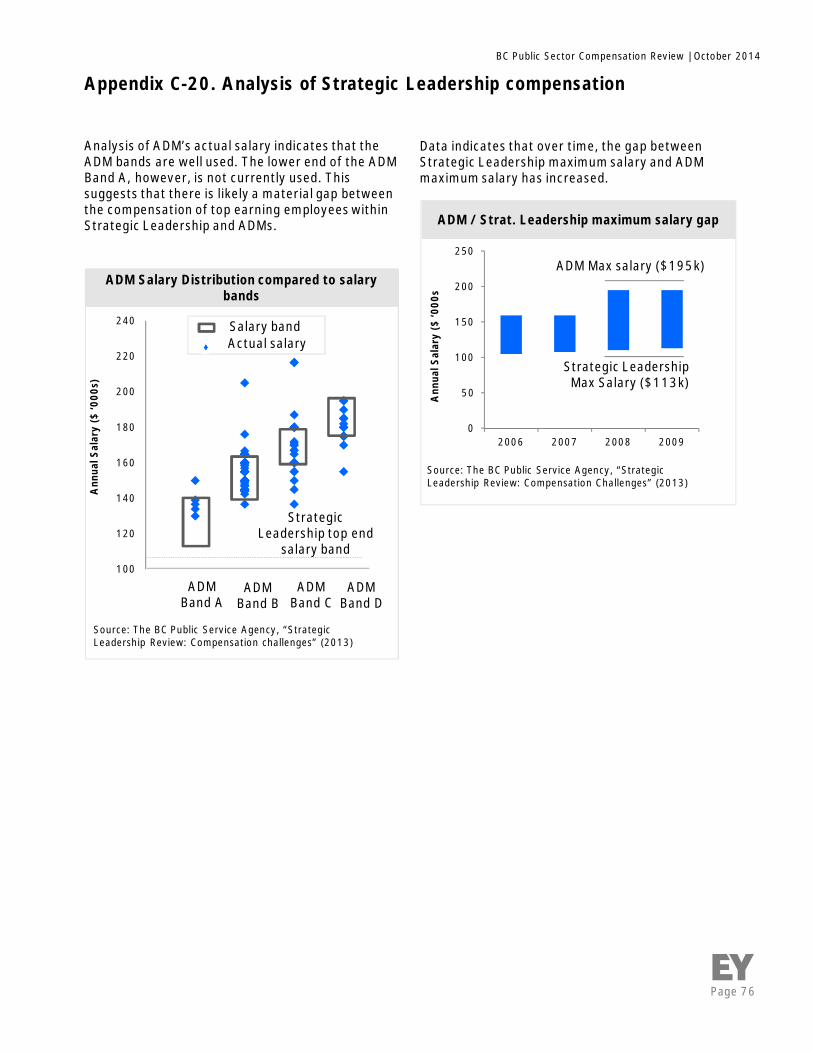
Page 76
BC Public Sector Compensation Review | October 2014
Data indicates that over time, the gap betweenStrategic Leadership maximum salary and ADMmaximum salary has increased.
ADM / Strat. Leadership maximum salary gap
0
50
100
150
200
250
2006 2007 2008 2009A
nnua
lSal
ary
($‘0
00s
ADM Max salary ($195k)
Strategic LeadershipMax Salary ($113k)
Source: The BC Public Service Agency, “StrategicLeadership Review: Compensation Challenges” (2013)
Source: The BC Public Service Agency, “StrategicLeadership Review: Compensation challenges” (2013)
100
120
140
160
180
200
220
240
Ann
ualS
alar
y($
‘000
s)
ADMBand D
ADMBand C
ADMBand B
ADM Salary Distribution compared to salarybands
Salary bandActual salary
StrategicLeadership top end
salary band
Analysis of ADM’s actual salary indicates that theADM bands are well used. The lower end of the ADMBand A, however, is not currently used. Thissuggests that there is likely a material gap betweenthe compensation of top earning employees withinStrategic Leadership and ADMs.
ADMBand A
Appendix C-20. Analysis of Strategic Leadership compensation

Page 77
BC Public Sector Compensation Review | October 2014
The Canadian Coalition for Good Governance bestpractices1 are worth considering.
The first requirement is to build an independentcompensation committee:
1. Selecting committee members
► Do not have current company CEO on thecompensation committee (to keep thecommittee independent)
► Choose committee members with diverseprofessional backgrounds that includespecific expertise in executive compensation
► Limit committee membership to no morethan one-third sitting CEOs
2. Establish a committee work plan
3. Hold in camera meetings
A recent review by the Canadian Coalition for GoodGovernance of over 150 Canadian companiesidentified that the majority of companies adhere tothese standards and have an independentcompensation committee of solely independentdirectors
Appendix C-21. The Canadian Coalition for Good Governance best practices
1 Canadian Coalition for Good Governance, “Best practices in executive compensation – related information” (2009)
“Municipal councils need to have a human resources standing committee that has a mandate toprovide oversight on an enterprise-wide total compensation strategy, senior management
performance, accountability and total compensation productivity and performance, includingtotal cost. Human resources (or compensation) committees are a recognized and standard
governance mechanism in the private sector, and are increasingly become standard practice inthe public and para-public sectors.”
Cullwick, “Compensation Governance: what municipalities need to change” (2005)

Page 78
BC Public Sector Compensation Review | October 2014
Appendix C-22. Global steps are being taken to control CEO compensation
► The US created a pay "Czar" inresponse to high private sector CEOcompensation (in federallysupported institutions)
► The Czar has authority to overseepay for the 100 highest paidemployees at those companies
► Kenneth Feinberg, theadministration’s new “specialmaster for compensation” said thathe will follow certain principles inmaking his decisions, including“whether compensation: rewardsrisk, allows a firm to remaincompetitive, is comparable topeers, tied to long-termperformance and contributes to thevalue of the firm”1
► The US has recently experienced amove to “Say on Pay”; the UK haspreviously legislated on 'Say on Pay‘;and the Canadian private sector is alsoconsidering moving to such a model
► In October 2009, the CanadianCoalition for Good Governance (CCGG)released its Model “Say on Pay” Policyfor private sector Board of Directorsfor public comment
► CCGG recommends that boardsvoluntarily add to each annual meetingagenda a shareholder advisory vote onthe company’s report on executivecompensation2
Case study: Pay Czar Case study: International move to say on Pay
1 The Wall Street Journal, “Pay Czar gets broad authority over executive compensation” (2009)2 Canadian Coalition for Good Governance, “Best Practices in Executive Compensation Related Information” (2009)
The Government of BC has moved to control executive compensation in the Broader Public Sector at atime when the private sector is also grappling with this issue including through the creation of pay Czarsand the move to ‘Say on pay’.
"CCGG members believe that institutional shareholders should have regular, constructiveengagement with the boards and board compensation committees of public companies to explain
their perspectives on governance, compensation and disclosure practices, and to provide detailedcomments on the company’s practices to the board"
Canadian Coalition for Good Governance, “Best Practices in Executive Compensation Related Information” (2009)
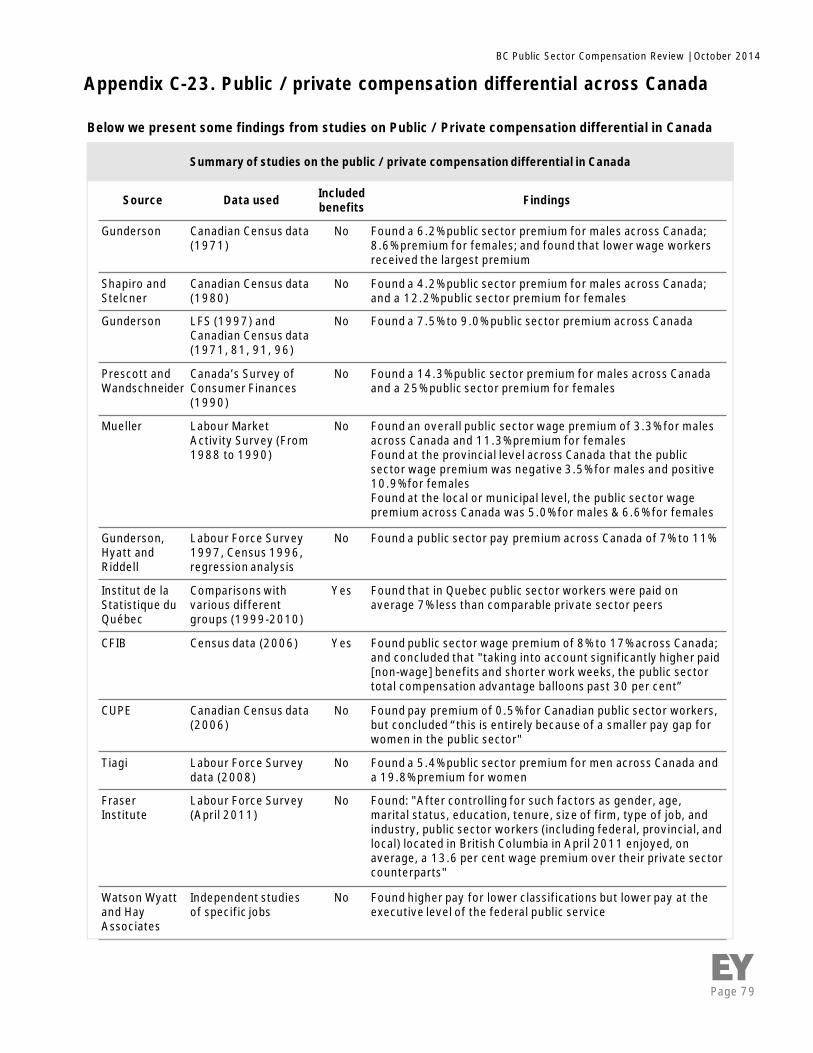
Page 79
BC Public Sector Compensation Review | October 2014
Source Data used Includedbenefits Findings
Gunderson Canadian Census data(1971)
No Found a 6.2% public sector premium for males across Canada;8.6% premium for females; and found that lower wage workersreceived the largest premium
Shapiro andStelcner
Canadian Census data(1980)
No Found a 4.2% public sector premium for males across Canada;and a 12.2% public sector premium for females
Gunderson LFS (1997) andCanadian Census data(1971, 81, 91, 96)
No Found a 7.5% to 9.0% public sector premium across Canada
Prescott andWandschneider
Canada’s Survey ofConsumer Finances(1990)
No Found a 14.3% public sector premium for males across Canadaand a 25% public sector premium for females
Mueller Labour MarketActivity Survey (From1988 to 1990)
No Found an overall public sector wage premium of 3.3% for malesacross Canada and 11.3% premium for femalesFound at the provincial level across Canada that the publicsector wage premium was negative 3.5% for males and positive10.9% for femalesFound at the local or municipal level, the public sector wagepremium across Canada was 5.0% for males & 6.6% for females
Gunderson,Hyatt andRiddell
Labour Force Survey1997, Census 1996,regression analysis
No Found a public sector pay premium across Canada of 7% to 11%
Institut de laStatistique duQuébec
Comparisons withvarious differentgroups (1999-2010)
Yes Found that in Quebec public sector workers were paid onaverage 7% less than comparable private sector peers
CFIB Census data (2006) Yes Found public sector wage premium of 8% to 17% across Canada;and concluded that "taking into account significantly higher paid[non-wage] benefits and shorter work weeks, the public sectortotal compensation advantage balloons past 30 per cent”
CUPE Canadian Census data(2006)
No Found pay premium of 0.5% for Canadian public sector workers,but concluded “this is entirely because of a smaller pay gap forwomen in the public sector"
Tiagi Labour Force Surveydata (2008)
No Found a 5.4% public sector premium for men across Canada anda 19.8% premium for women
FraserInstitute
Labour Force Survey(April 2011)
No Found: "After controlling for such factors as gender, age,marital status, education, tenure, size of firm, type of job, andindustry, public sector workers (including federal, provincial, andlocal) located in British Columbia in April 2011 enjoyed, onaverage, a 13.6 per cent wage premium over their private sectorcounterparts"
Watson Wyattand HayAssociates
Independent studiesof specific jobs
No Found higher pay for lower classifications but lower pay at theexecutive level of the federal public service
Appendix C-23. Public / private compensation differential across Canada
Summary of studies on the public / private compensation differential in Canada
Below we present some findings from studies on Public / Private compensation differential in Canada

Page 80
BC Public Sector Compensation Review | October 2014
Analysis of management salary bands indicates that there is material variation in pay bands across the BC PublicSector, with the Public Service being the lowest paying in all cases.
Appendix C-24. Comparison of the salary bands of comparable roles in theStrategic Leadership level across BC Public Sector
0 100,000 200,000
Public Service
BC Hydro
BC Lotteries
BCIT
HEABC
UVic
BC Transit
Director of Information Technology salary rangesacross the BC Public Sector
Source: Provided by PSEC
0 50,000 100,000 150,000 200,000
Public Service
BC Lotteries
BCIT
HEABC
BC Transit
Executive Director of Policy salary ranges acrossthe BC Public Sector
Source: Provided by PSEC
0 50,000 100,000 150,000 200,000
Public Service
BC Hydro
BC Lotteries
BCIT
HEABC
UVic
Director of Total compensation salary ranges acrossthe BC Public Sector
Source: Provided by PSEC
0 50,000 100,000 150,000 200,000
Public Service
BC Hydro
BC Lotteries
HEABC
Regional Director salary ranges across the BC PublicSector
Source: Provided by PSEC

Page 81
BC Public Sector Compensation Review | October 2014
Appendix D. Spectrum of strategies for Regional & Local GovernmentSelect strategy to create adherence to philosophy and governance mode
In detailed design, the strategy pertaining to Regional & Local Government , will need to be selected fromthe spectrum outlined below.
• It is proposed that:
• As data and benchmarking capability improves, increase in education and opportunities to seta framework of expectations provide Regional & Local Government with the opportunity to ‘dothe right thing’ by complying
• Where education and setting of expectation do not yield results, use financial levers to directlyencourage Regional & Local Government to set compensation caps and Provincial Governmentto stop providing funding once cap has been reached
Select level of central Government involvement (See Appendix D for further information on options)
1.Educate and set
framework ofexpectations that is
clearlycommunicated
2.Support parties inundertaking their
own reviewprocesses
3.Use financial levers
4.Legislate changes
► Current effortsfocus more on totalexpenditure thancompensation
► Educating andsetting a frameworkof expectations arehighly restricted inthe Province by dataavailability
► Before taking anydirect actions,Government shouldand is expected to,communicate itsexpectation
• ConsiderencouragingRegional & LocalGovernment toinitiate andoperate its ownreview process asto models forsettingcompensation andtrends incompensation, inorder to enablethe sector toreach its ownconclusions
• This approachmight only serveto cause delay andconfusion as toGovernmentexpectations
• There are anumber offinancial leversavailable:
•Tax andexpenditure laws
•Unconditionalgrant fundingcould be madeconditional
•Zero basebudgeting couldbe explored
• Fundamentally,though, evidencesuggests Regional& LocalGovernment willtake all other costreductionstrategies beforecutting salaries
• The Province mayamend or issueprimary legislationto supersede theCommunityCharter in order toprovide a meansto directly controlthe issue ofRegional & LocalGovernmentcompensation
• Such an approachwould meet highlevels ofresistance fromunions andRegional & LocalGovernment
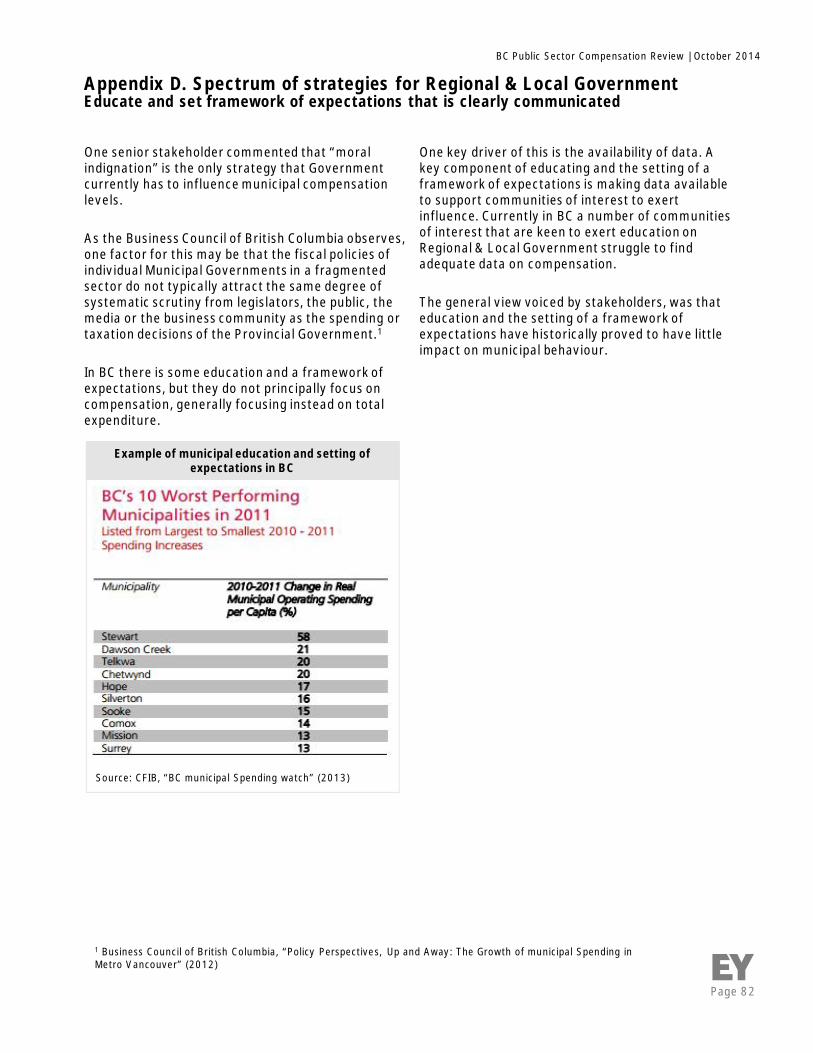
Page 82
BC Public Sector Compensation Review | October 2014
Source: CFIB, “BC municipal Spending watch” (2013)
Appendix D. Spectrum of strategies for Regional & Local GovernmentEducate and set framework of expectations that is clearly communicated
One senior stakeholder commented that “moralindignation” is the only strategy that Governmentcurrently has to influence municipal compensationlevels.
As the Business Council of British Columbia observes,one factor for this may be that the fiscal policies ofindividual Municipal Governments in a fragmentedsector do not typically attract the same degree ofsystematic scrutiny from legislators, the public, themedia or the business community as the spending ortaxation decisions of the Provincial Government.1
In BC there is some education and a framework ofexpectations, but they do not principally focus oncompensation, generally focusing instead on totalexpenditure.
1 Business Council of British Columbia, “Policy Perspectives, Up and Away: The Growth of municipal Spending inMetro Vancouver” (2012)
Example of municipal education and setting ofexpectations in BC
One key driver of this is the availability of data. Akey component of educating and the setting of aframework of expectations is making data availableto support communities of interest to exertinfluence. Currently in BC a number of communitiesof interest that are keen to exert education onRegional & Local Government struggle to findadequate data on compensation.
The general view voiced by stakeholders, was thateducation and the setting of a framework ofexpectations have historically proved to have littleimpact on municipal behaviour.
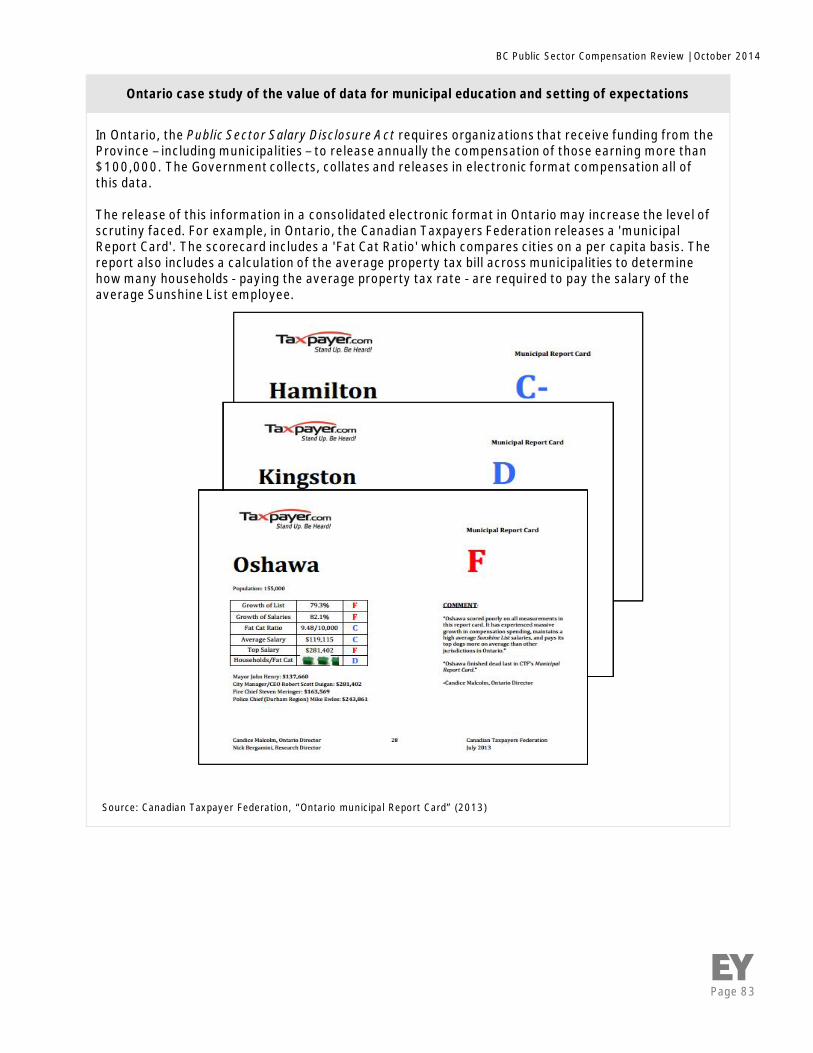
Page 83
BC Public Sector Compensation Review | October 2014
Ontario case study of the value of data for municipal education and setting of expectations
Source: Canadian Taxpayer Federation, “Ontario municipal Report Card” (2013)
In Ontario, the Public Sector Salary Disclosure Act requires organizations that receive funding from theProvince – including municipalities – to release annually the compensation of those earning more than$100,000. The Government collects, collates and releases in electronic format compensation all ofthis data.
The release of this information in a consolidated electronic format in Ontario may increase the level ofscrutiny faced. For example, in Ontario, the Canadian Taxpayers Federation releases a 'municipalReport Card'. The scorecard includes a 'Fat Cat Ratio' which compares cities on a per capita basis. Thereport also includes a calculation of the average property tax bill across municipalities to determinehow many households - paying the average property tax rate - are required to pay the salary of theaverage Sunshine List employee.
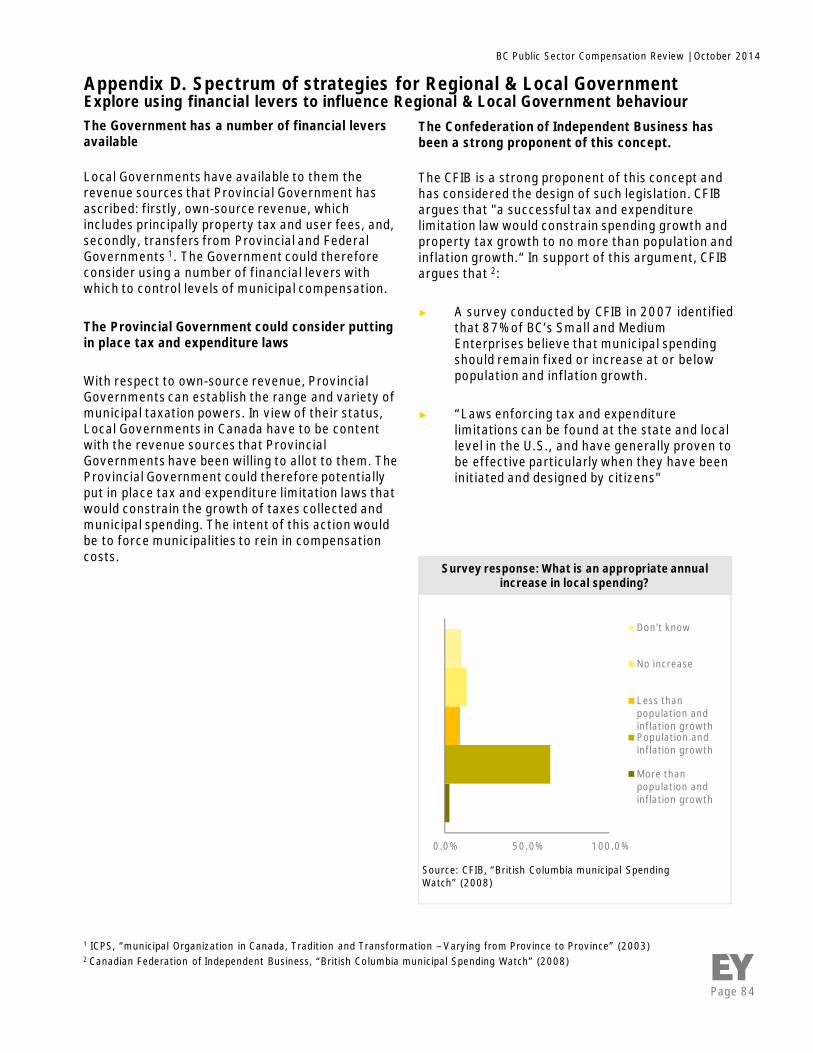
Page 84
BC Public Sector Compensation Review | October 2014
Appendix D. Spectrum of strategies for Regional & Local GovernmentExplore using financial levers to influence Regional & Local Government behaviourThe Government has a number of financial leversavailable
Local Governments have available to them therevenue sources that Provincial Government hasascribed: firstly, own-source revenue, whichincludes principally property tax and user fees, and,secondly, transfers from Provincial and FederalGovernments 1. The Government could thereforeconsider using a number of financial levers withwhich to control levels of municipal compensation.
The Provincial Government could consider puttingin place tax and expenditure laws
With respect to own-source revenue, ProvincialGovernments can establish the range and variety ofmunicipal taxation powers. In view of their status,Local Governments in Canada have to be contentwith the revenue sources that ProvincialGovernments have been willing to allot to them. TheProvincial Government could therefore potentiallyput in place tax and expenditure limitation laws thatwould constrain the growth of taxes collected andmunicipal spending. The intent of this action wouldbe to force municipalities to rein in compensationcosts.
The Confederation of Independent Business hasbeen a strong proponent of this concept.
The CFIB is a strong proponent of this concept andhas considered the design of such legislation. CFIBargues that "a successful tax and expenditurelimitation law would constrain spending growth andproperty tax growth to no more than population andinflation growth.“ In support of this argument, CFIBargues that 2:
► A survey conducted by CFIB in 2007 identifiedthat 87% of BC’s Small and MediumEnterprises believe that municipal spendingshould remain fixed or increase at or belowpopulation and inflation growth.
► “Laws enforcing tax and expenditurelimitations can be found at the state and locallevel in the U.S., and have generally proven tobe effective particularly when they have beeninitiated and designed by citizens"
1 ICPS, “municipal Organization in Canada, Tradition and Transformation – Varying from Province to Province” (2003)2 Canadian Federation of Independent Business, “British Columbia municipal Spending Watch” (2008)
0.0% 50.0% 100.0%
Don't know
No increase
Less thanpopulation andinflation growthPopulation andinflation growth
More thanpopulation andinflation growth
Source: CFIB, “British Columbia municipal SpendingWatch” (2008)
Survey response: What is an appropriate annualincrease in local spending?

Page 85
BC Public Sector Compensation Review | October 2014
Unconditional grant funding could be madeconditional
British Columbia’s Local Government divisionadministers a general program offeringunconditional grants to local municipalities inconformity with the Local Government Grants Act(as at 2003) 1. Each municipality receives apredetermined basic amount based on the relativefiscal wealth of the municipality 1.
The Provincial Government could consider makingthis grant funding conditional on Local Governmentachieving certain performance indicators pertainingto the control of municipal compensation.
Grant funding is not a significant contributor tomunicipal revenues, but is growing
It is worth noting, however, that transfers fromGovernment only constitute a small share ofmunicipal revenues. CFIB analysis in 2006,indicated that in BC only 7.4% of revenues camefrom transfers from other Governments
However, municipal grants are also one of thefastest growing sources of revenue for MunicipalGovernments. Between 2000 and 2006, CFIBestimates that contributions to municipalities fromsenior levels of Government more than doubled,increasing by 110 per cent 2.
1 ICPS, “municipal Organization in Canada, Tradition and Transformation – Varying from Province to Province” (2003)2 Canadian Federation of Independent Businesses, “British Columbia municipal Spending Watch” (2008)
0% 20% 40% 60%
Disposition of Assets
DevelopContributions
Transfers fromother governments
Sale of Services
Own PurposeTaxation
0% 50% 100% 150%
Population andInflation
Own PurposeTaxation
Total Revenue
Sale of Services
GovernmentTransfers
Source: CFIB, “BC municipal Spending Watch” (2008)
Aggregate BC municipal operating revenue growth(2000-2006)
Source: CFIB, “BC municipal Spending Watch” (2008)
Aggregate BC municipal operating revenues, 2006,by source
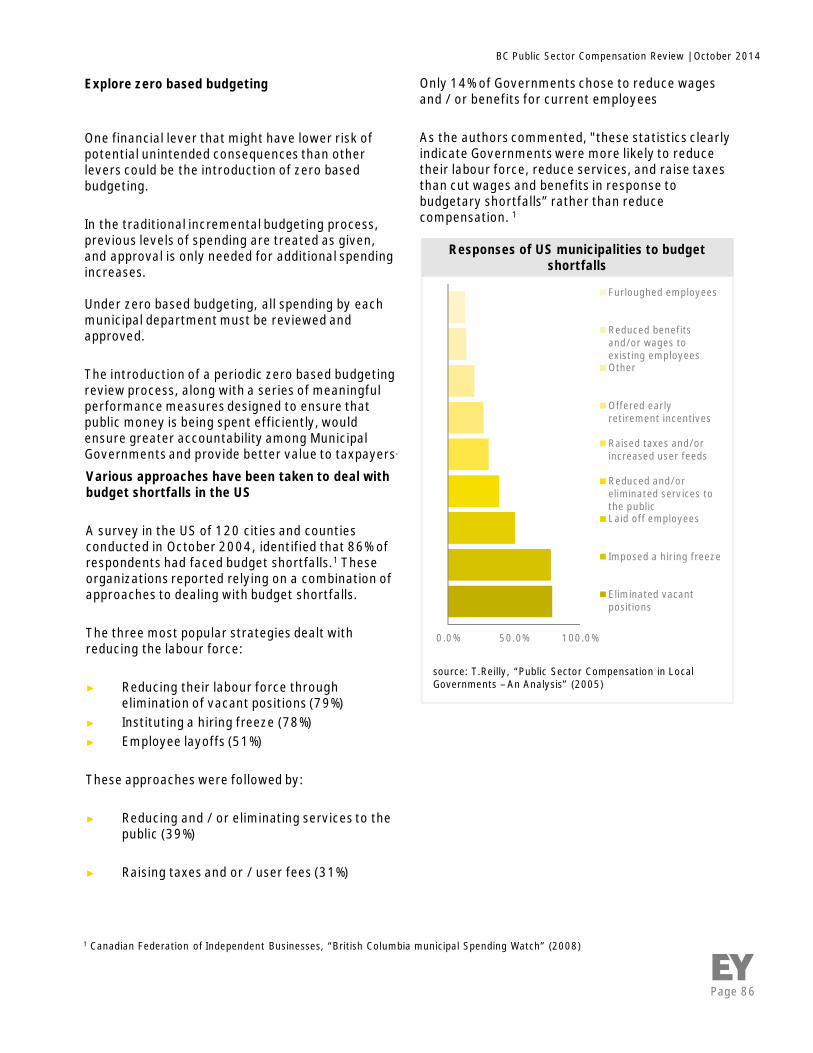
Page 86
BC Public Sector Compensation Review | October 2014
Explore zero based budgeting
One financial lever that might have lower risk ofpotential unintended consequences than otherlevers could be the introduction of zero basedbudgeting.
In the traditional incremental budgeting process,previous levels of spending are treated as given,and approval is only needed for additional spendingincreases.
Under zero based budgeting, all spending by eachmunicipal department must be reviewed andapproved.
The introduction of a periodic zero based budgetingreview process, along with a series of meaningfulperformance measures designed to ensure thatpublic money is being spent efficiently, wouldensure greater accountability among MunicipalGovernments and provide better value to taxpayers.
1 Canadian Federation of Independent Businesses, “British Columbia municipal Spending Watch” (2008)
Various approaches have been taken to deal withbudget shortfalls in the US
A survey in the US of 120 cities and countiesconducted in October 2004, identified that 86% ofrespondents had faced budget shortfalls.1 Theseorganizations reported relying on a combination ofapproaches to dealing with budget shortfalls.
The three most popular strategies dealt withreducing the labour force:
► Reducing their labour force throughelimination of vacant positions (79%)
► Instituting a hiring freeze (78%)► Employee layoffs (51%)
These approaches were followed by:
► Reducing and / or eliminating services to thepublic (39%)
► Raising taxes and or / user fees (31%)
Only 14% of Governments chose to reduce wagesand / or benefits for current employees
As the authors commented, "these statistics clearlyindicate Governments were more likely to reducetheir labour force, reduce services, and raise taxesthan cut wages and benefits in response tobudgetary shortfalls” rather than reducecompensation. 1
0.0% 50.0% 100.0%
Furloughed employees
Reduced benefitsand/or wages toexisting employeesOther
Offered earlyretirement incentives
Raised taxes and/orincreased user feeds
Reduced and/oreliminated services tothe publicLaid off employees
Imposed a hiring freeze
Eliminated vacantpositions
Responses of US municipalities to budgetshortfalls
source: T.Reilly, “Public Sector Compensation in LocalGovernments – An Analysis” (2005)
Page 87
BC Public Sector Compensation Review | October 2014
Appendix D. Spectrum of strategies for Regional & Local GovernmentLegislate changes
1 R.L. Bish, “Local Government in British Columbia” (2008)2 ICPS, “Municipal Organization in Canada, Tradition and Transformation – Varying from Province to Province” (2003)
Local Governments are “creatures of theProvince” and can be directed by the ProvincialGovernment.
The Community Charter and the Local GovernmentAct are built on the principle of Local Governmentbeing responsible and accountable.1 If the ProvincialGovernment has strong evidence that LocalGovernment has failed to act in a financiallyresponsible manner, and that there is inadequateresponse to; education, setting a framework ofexpectation, or attempts to discuss or mediate theissue of control of compensation, Government maywish to raise the possibility of infringement uponlocal autonomy.
As stated in section 92(8) of the CanadianConstitution, municipal affairs come under theexclusive jurisdiction of the Provinces. LocalGovernments are created by Provincial legislationand it is Provincial legislation that defines what theycan do, how they are managed, and their sources ofrevenue. “In short, from a strictly legal viewpoint,the very existence of municipalities depends on thegoodwill of the Provincial Governments,”2and if theProvincial Government so wishes it may amend orissue primary legislation to supersede theCommunity Charter or Local Government Act inorder to provide a means to directly control theissue of Local Government compensation.
In particular, the Provincial Government might electto threaten to establish – or, in the event ofinadequate response, actually establish – the rightof a Minister to set rules and mandates for LocalGovernment sector compensation and powers toenable a new or existing entity with a similarmandate as PSEC to provide strategic direction toemployers in the sector. Mandates could, forexample, constrain growth in compensation to nomore than population and inflation growth, or mightmandate alignment of compensation to the Core.
Page 88
BC Public Sector Compensation Review | October 2014
Ernst & Young LLP
Assurance | Tax | Transactions | Advisory
About EYEY is a global leader in assurance, tax, transactionand advisory services. Worldwide, our 167,000people are united by our shared values ofunwavering commitment to quality. We make adifference by helping our people, our clients and ourwider communities achieve their potential.
For more information about our organization,please visit ey.com/ca
© 2014 Ernst & Young LLP. All rights reserved.A member firm of Ernst & Young Global Limited.