bd biosciences application note note cell cycle analysis using the bd brdu fitc assay on the bd...
TRANSCRIPT

Application Note
Cell Cycle Analysis Using the BD BrdU FITC Assay on the BD FACSVerse™ System
BD Biosciences
August 2011
Application Note
Cell Cycle Analysis Using the BD BrdU FITC Assay on the BD FACSVerse™ SystemJanelle Crane, Dev Mittar, Deena Soni, and Catherine McIntyreBD Biosciences
Contents
1 Summary
2 Introduction
3 Objective
3 Methods
6 Results and Discussion
12 Conclusions
12 References
12 Tips and Tricks
SummaryAssessment of cell proliferation has widespread applications in basic and drug discovery research. Direct measurement of new DNA synthesis by using nucleoside analogs is a well established method. The BD Pharmingen™ FITC BrdU flow kit, based on the incorporation of BrdU into newly synthesized DNA strands of actively proliferating cells, is the method of choice compared to traditional 3H-thymidine incorporation assays, which are slow, labor intensive, and involve hazardous radioactive materials. When BrdU incorporation assays are combined with DNA dyes such as 7-AAD, it is possible to resolve cell cycle phases in a given cell population into G0/G1, S, and G2/M phases. In addition, other markers of cell cycle progression can be multiplexed with the FITC BrdU flow kit, thereby providing additional multiparametric analysis of the cell cycle using flow cytometry.
BD FACSVerse™ systems include the cytometer, BD FACSuite™ software for acquisition and analysis, and BD FACSuite research assays for use with specific reagent kits. The combination of the FITC BrdU flow kit and the BrdU FITC assay in BD FACSuite software provides a quick and easy method to perform cell cycle analysis using flow cytometry. This application note describes the use of the FITC BrdU flow kit and the BrdU FITC assay to quickly acquire data from Jurkat cells that have been pulsed and unpulsed with BrdU, and generate a report. In addition, a user-defined assay was created in BD FACSuite software to demonstrate the dose-dependent effects of the DNA polymerase inhibitor aphidicolin on different phases of the cell cycle and on DNA damage. Finally, a BrdU pulse-chase experiment was performed to demonstrate the turnover of the label with cell cycle progression.
Application Note
Cell Cycle Analysis Using the BD BrdU FITC Assay on the BD FACSVerse™ System
BD Biosciences
August 2011
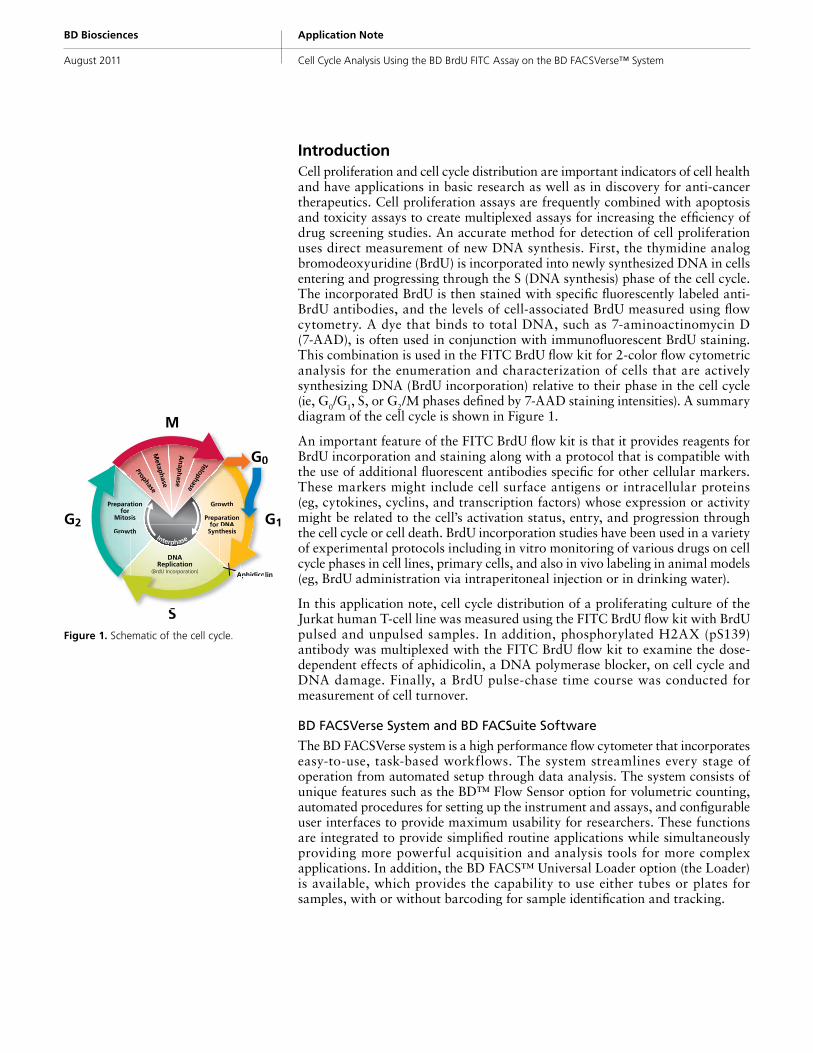
IntroductionCell proliferation and cell cycle distribution are important indicators of cell health and have applications in basic research as well as in discovery for anti-cancer therapeutics. Cell proliferation assays are frequently combined with apoptosis and toxicity assays to create multiplexed assays for increasing the efficiency of drug screening studies. An accurate method for detection of cell proliferation uses direct measurement of new DNA synthesis. First, the thymidine analog bromodeoxyuridine (BrdU) is incorporated into newly synthesized DNA in cells entering and progressing through the S (DNA synthesis) phase of the cell cycle.The incorporated BrdU is then stained with specific fluorescently labeled anti-BrdU antibodies, and the levels of cell-associated BrdU measured using flow cytometry. A dye that binds to total DNA, such as 7-aminoactinomycin D (7-AAD), is often used in conjunction with immunofluorescent BrdU staining. This combination is used in the FITC BrdU flow kit for 2-color flow cytometric analysis for the enumeration and characterization of cells that are actively synthesizing DNA (BrdU incorporation) relative to their phase in the cell cycle (ie, G0/G1, S, or G2/M phases defined by 7-AAD staining intensities). A summary diagram of the cell cycle is shown in Figure 1.
An important feature of the FITC BrdU flow kit is that it provides reagents for BrdU incorporation and staining along with a protocol that is compatible with the use of additional fluorescent antibodies specific for other cellular markers. These markers might include cell surface antigens or intracellular proteins (eg, cytokines, cyclins, and transcription factors) whose expression or activity might be related to the cell’s activation status, entry, and progression through the cell cycle or cell death. BrdU incorporation studies have been used in a variety of experimental protocols including in vitro monitoring of various drugs on cell cycle phases in cell lines, primary cells, and also in vivo labeling in animal models (eg, BrdU administration via intraperitoneal injection or in drinking water).
In this application note, cell cycle distribution of a proliferating culture of the Jurkat human T-cell line was measured using the FITC BrdU flow kit with BrdU pulsed and unpulsed samples. In addition, phosphorylated H2AX (pS139) antibody was multiplexed with the FITC BrdU flow kit to examine the dose- dependent effects of aphidicolin, a DNA polymerase blocker, on cell cycle and DNA damage. Finally, a BrdU pulse-chase time course was conducted for measurement of cell turnover.
BD FACSVerse System and BD FACSuite Software
The BD FACSVerse system is a high performance flow cytometer that incorporates easy-to-use, task-based workflows. The system streamlines every stage of operation from automated setup through data analysis. The system consists of unique features such as the BD™ Flow Sensor option for volumetric counting, automated procedures for setting up the instrument and assays, and configurable user interfaces to provide maximum usability for researchers. These functions are integrated to provide simplified routine applications while simultaneously providing more powerful acquisition and analysis tools for more complex applications. In addition, the BD FACS™ Universal Loader option (the Loader) is available, which provides the capability to use either tubes or plates for samples, with or without barcoding for sample identification and tracking.
Figure 1. Schematic of the cell cycle.
Interphase
Preparationfor
Mitosis Preparationfor DNA
SynthesisGrowth
Telophase
ProphaseM
etaph
ase
An
aph
ase
Growth
DNAReplication
(BrdU Incorporation) Aphidicolin
G2 G1
G0
M
S
Prreparafor
Mitos
Growt
TelopPro
Metap
h
An
aph
Aphidico
onaratioDNADNAthesis
howth
G0
Replication(BrdU Incorporation) A
S
A
GG
G
00
n
Application Note
Cell Cycle Analysis Using the BD BrdU FITC Assay on the BD FACSVerse™ System
BD Biosciences
August 2011
Page 3
The BrdU FITC assay in BD FACSuite software is a specific module based on the FITC BrdU flow kit. The module contains all the acquisition, analysis, and reporting functions necessary for generating data to determine cell cycle phase distribution.
Pre-defined assays such as the BrdU FITC assay can also be used as a starting point for creating custom experiments and assays to suit the needs of researchers. These user-defined assays can then be run in a worklist and deployed to other BD FACSVerse cytometers within the laboratory or to an external site.
ObjectiveThe objectives of this application note are to show proof of principle experiments that demonstrate:
• The ease of use of the FITC BrdU flow kit and the BrdU FITC assay in conjunction with the BD FACSVerse system for assessment of cell cycle in a proliferating culture of Jurkat cells
• Multiplexing of the phosphorylated H2AX marker with the FITC BrdU flow kit to examine the dose-dependent effect of aphidicolin on cell cycle and DNA damage in Jurkat cells using a user-defined assay
• Time course of a BrdU pulse-chase experiment to monitor progression of BrdU labeled cells through the cell cycle
Methods
Kits
Antibodies
Reagents and Materials
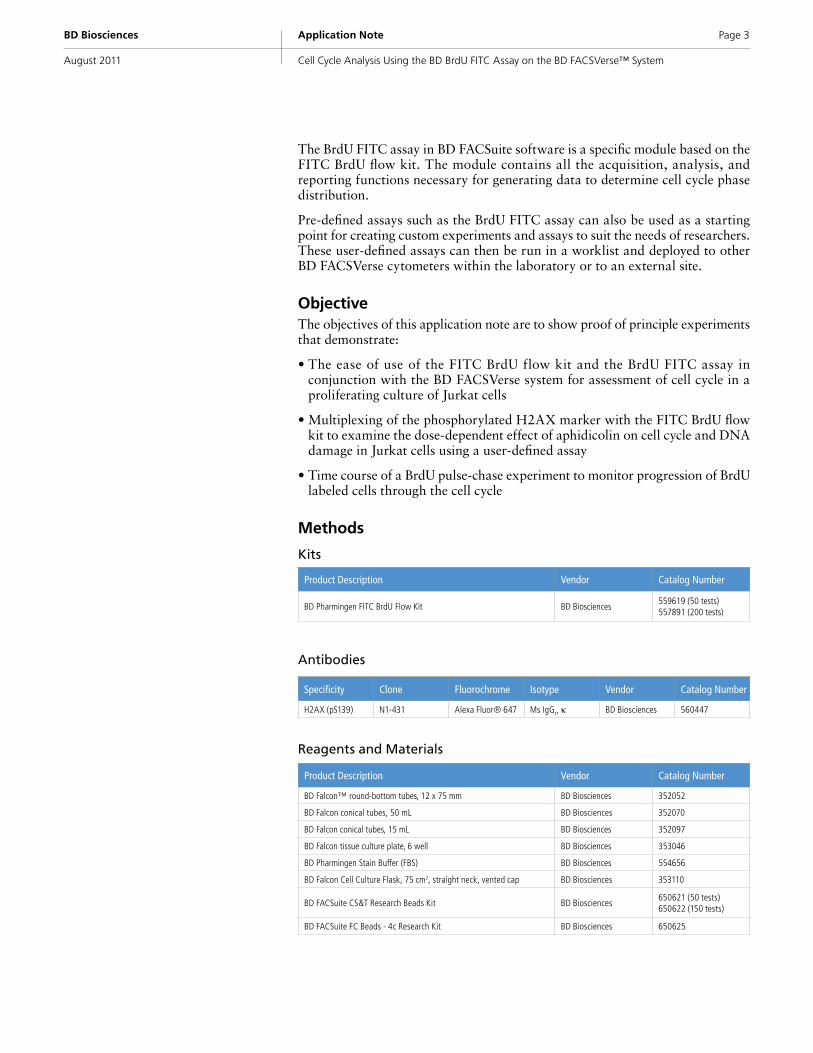
Product Description Vendor Catalog Number
BD Pharmingen FITC BrdU Flow Kit BD Biosciences559619 (50 tests)557891 (200 tests)
Product Description Vendor Catalog Number
BD Falcon™ round-bottom tubes, 12 x 75 mm BD Biosciences 352052
BD Falcon conical tubes, 50 mL BD Biosciences 352070
BD Falcon conical tubes, 15 mL BD Biosciences 352097
BD Falcon tissue culture plate, 6 well BD Biosciences 353046
BD Pharmingen Stain Buffer (FBS) BD Biosciences 554656
BD Falcon Cell Culture Flask, 75 cm2, straight neck, vented cap BD Biosciences 353110
BD FACSuite CS&T Research Beads Kit BD Biosciences650621 (50 tests)650622 (150 tests)
BD FACSuite FC Beads - 4c Research Kit BD Biosciences 650625
Specificity Clone Fluorochrome Isotype Vendor Catalog Number
H2AX (pS139) N1-431 Alexa Fluor® 647 Ms IgG1, k BD Biosciences 560447
Application Note
Cell Cycle Analysis Using the BD BrdU FITC Assay on the BD FACSVerse™ System
BD Biosciences
August 2011
Cell Lines
BD FACSVerse Instrument Configuration
Software
Methods
Preparation of Cells1. Jurkat cells were maintained in the culture medium containing RPMI 1640
(ATCC, No. 30-2001) supplemented with 10% FBS (ATCC, No. 30-2020).
2. Jurkat cells, in log phase of growth, were harvested from a culture flask. Cells were centrifuged at 300g for 5 min at room temperature (RT).
3. The supernatant was discarded and the cells were resuspended at a concentration between 2 x 10⁵ and 2 x 10⁶ cells/mL in culture medium and used for aphidicolin dose-response and BrdU pulse-chase time course experiments.
Aphidicolin Dose Response1. Jurkat cells prepared as described previously were added to 6-well plates
(5 mL/well, ~107 cells per well).
2. A 5-mg/mL stock solution of aphidicolin (Sigma-Aldrich, No. A-0781) was prepared in DMSO (Sigma-Aldrich, No. D-2650) and diluted into the culture medium at final concentrations of 0, 0.01, 0.03, 0.1, 0.3, 1.0, 3.0, 10, and 30 μg/mL. DMSO (control) was diluted into the medium of control wells at equivalent concentrations to those in the experimental wells. Cells were incubated at 37ºC with 5% CO2 in air for 3 hours.
3. BrdU was diluted to a 1-mM concentration with 1X DPBS (Mediatech, No. 21-031-CV) according to the BD Pharmingen BrdU Flow Kits Instruction Manual.1
4. BrdU (50 μL/well of 1-mM stock) was added to all wells (final concentration of 10 μM of BrdU) except to the unpulsed control well.
5. Cells were incubated at 37°C with 5% CO2 in air for 1 hour.
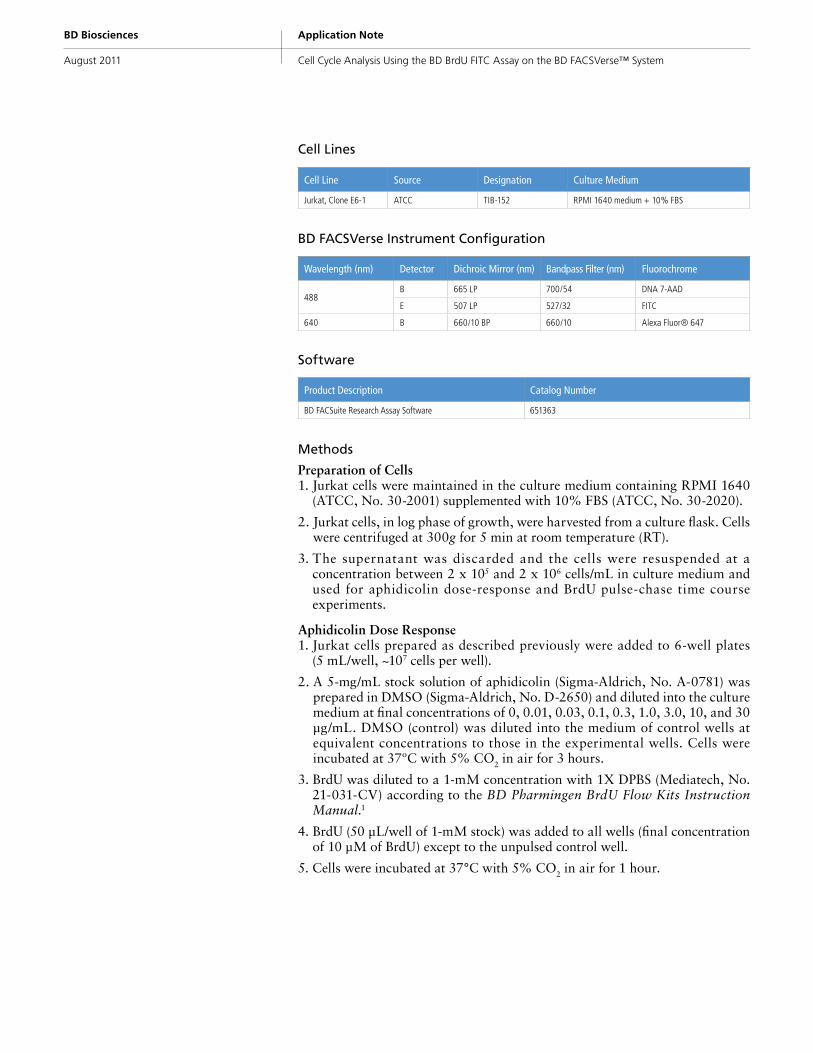
Cell Line Source Designation Culture Medium
Jurkat, Clone E6-1 ATCC TIB-152 RPMI 1640 medium + 10% FBS
Wavelength (nm) Detector Dichroic Mirror (nm) Bandpass Filter (nm) Fluorochrome
488B 665 LP 700/54 DNA 7-AAD
E 507 LP 527/32 FITC
640 B 660/10 BP 660/10 Alexa Fluor® 647
Product Description Catalog Number
BD FACSuite Research Assay Software 651363
Application Note
Cell Cycle Analysis Using the BD BrdU FITC Assay on the BD FACSVerse™ System
BD Biosciences
August 2011
Page 5
BrdU Pulse-Chase Time Course1. BrdU was diluted to a 1-mM concentration with 1X DPBS according to the
BD Pharmingen BrdU Flow Kits Instruction Manual.1
2. Two hundred fifty microliters of 1-mM BrdU was added to 25 mL of Jurkat cell suspension, prepared as described previously in a 50-mL conical tube, to achieve a final concentration of 10 μM of BrdU. Five milliliters of cell suspension was kept aside as an unplused control tube.
3. Cells were incubated at 37°C with 5% CO2 in air for 1 hour. After 1 hour of pulse, cells were washed (300g, 5 min, RT) twice in the culture medium and once in the 1X HBSS (Mediatech, No. 21-023-CV) to remove unincorportaed BrdU, and then resuspended in 25 mL of fresh medium.
4. At each time point (0, 3, 6, 9, and 24 h after BrdU incubation), 5 mL of cells was pipetted into a fresh tube, washed with 1X HBSS, fixed using BD Cytofix/Cytoperm™ buffer, washed, and stored at 4ºC.
5. Cells from all time points were concurrently stained.
FITC BrdU Flow Kit Staining ProtocolThe staining protocol from the BD Pharmingen BrdU Flow Kits Instruction Manual1 was followed for staining the samples. The Alexa Fluor® 647 H2AX (pS139) antibody was diluted according to the antibody TDS and incubated with the cells at the same time as the anti-BrdU FITC antibody.
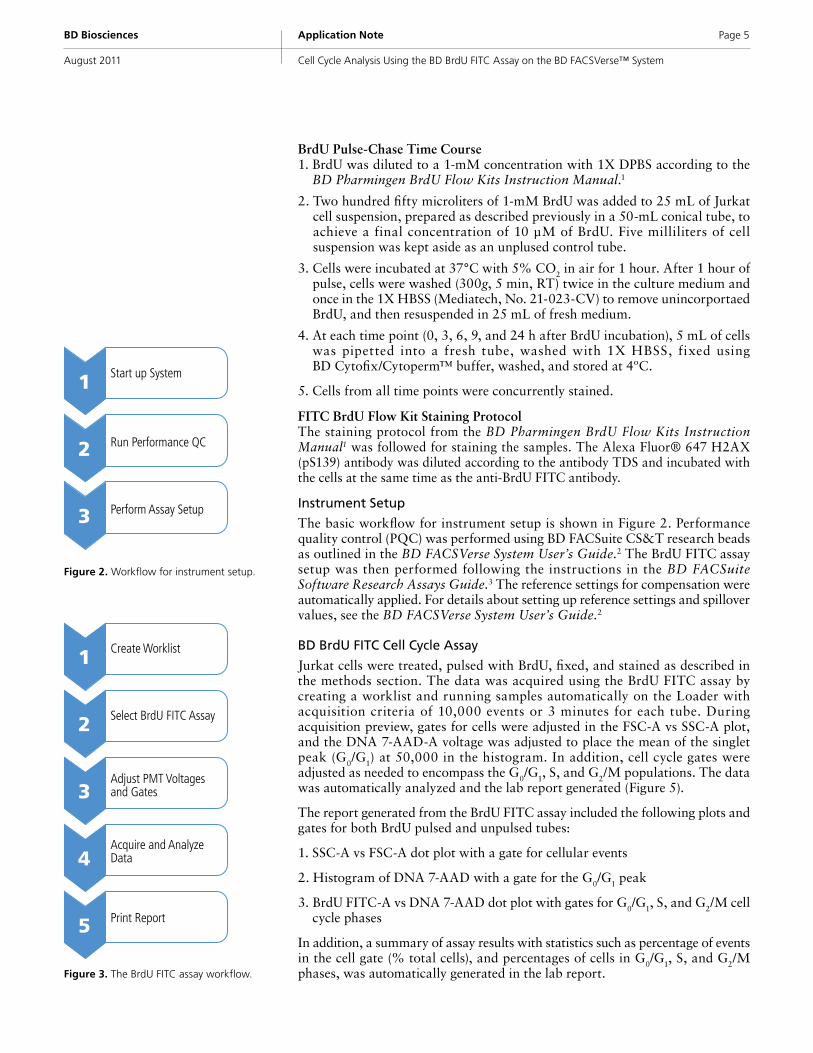
Instrument Setup
The basic workflow for instrument setup is shown in Figure 2. Performance quality control (PQC) was performed using BD FACSuite CS&T research beads as outlined in the BD FACSVerse System User’s Guide.2 The BrdU FITC assay setup was then performed following the instructions in the BD FACSuite Software Research Assays Guide.3 The reference settings for compensation were automatically applied. For details about setting up reference settings and spillover values, see the BD FACSVerse System User’s Guide.2
BD BrdU FITC Cell Cycle Assay
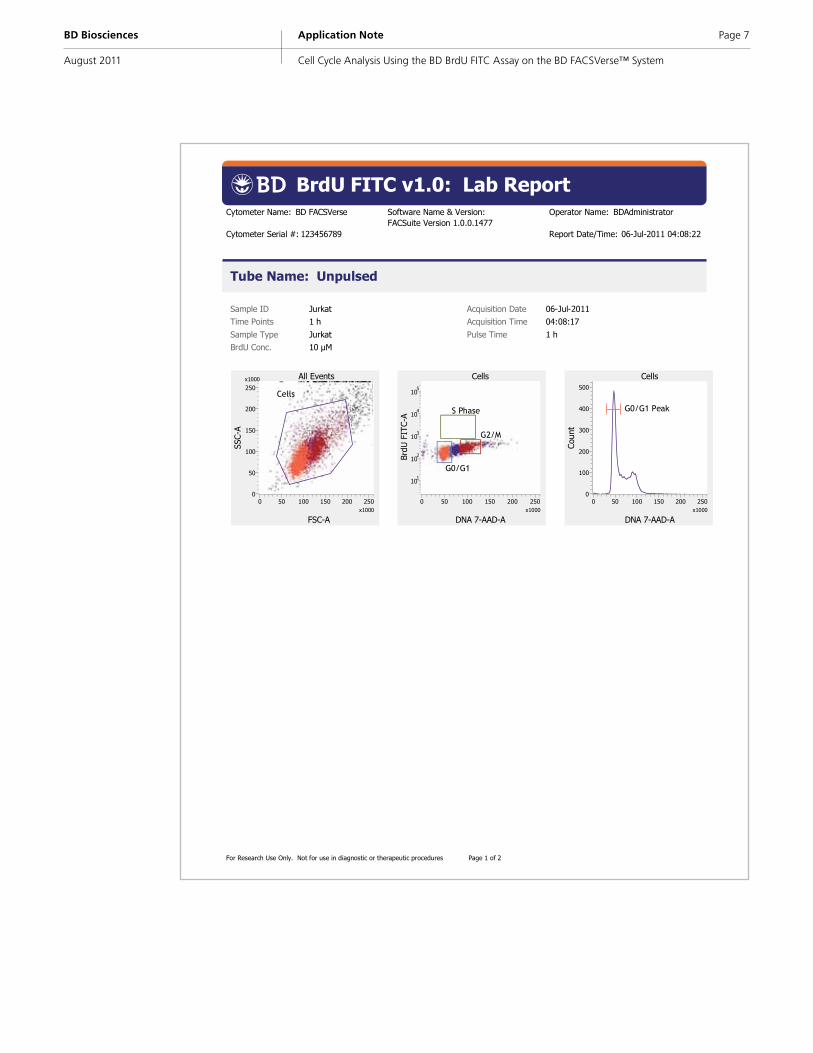
Jurkat cells were treated, pulsed with BrdU, fixed, and stained as described in the methods section. The data was acquired using the BrdU FITC assay by creating a worklist and running samples automatically on the Loader with acquisition criteria of 10,000 events or 3 minutes for each tube. During acquisition preview, gates for cells were adjusted in the FSC-A vs SSC-A plot, and the DNA 7-AAD-A voltage was adjusted to place the mean of the singlet peak (G0/G1) at 50,000 in the histogram. In addition, cell cycle gates were adjusted as needed to encompass the G0/G1, S, and G2/M populations. The data was automatically analyzed and the lab report generated (Figure 5).
The report generated from the BrdU FITC assay included the following plots and gates for both BrdU pulsed and unpulsed tubes:
1. SSC-A vs FSC-A dot plot with a gate for cellular events
2. Histogram of DNA 7-AAD with a gate for the G0/G1 peak
3. BrdU FITC-A vs DNA 7-AAD dot plot with gates for G0/G1, S, and G2/M cell cycle phases
In addition, a summary of assay results with statistics such as percentage of events in the cell gate (% total cells), and percentages of cells in G0/G1, S, and G2/M phases, was automatically generated in the lab report.
Figure 2. Workflow for instrument setup.
Start up System1
Run Performance QC2
Perform Assay Setup3
Figure 3. The BrdU FITC assay workflow.
Create Worklist1
Select BrdU FITC Assay2
Adjust PMT Voltagesand Gates3
Acquire and AnalyzeData4
Print Report5
Application Note
Cell Cycle Analysis Using the BD BrdU FITC Assay on the BD FACSVerse™ System
BD Biosciences
August 2011
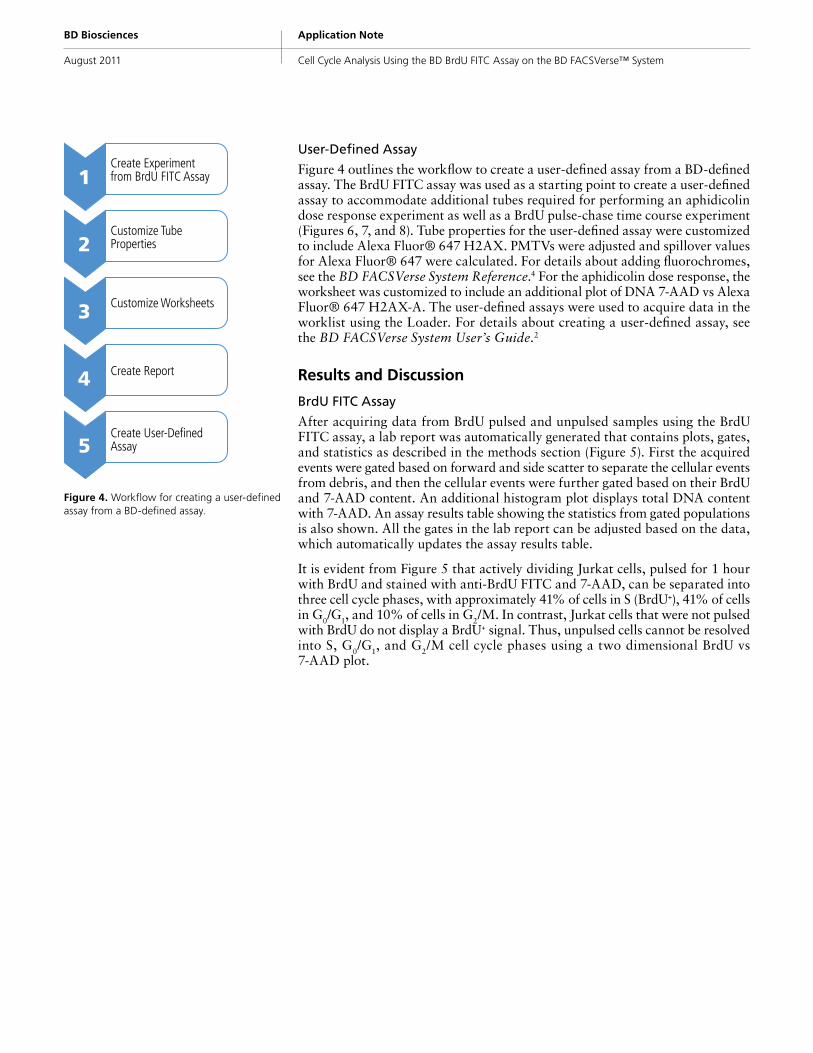
User-Defined Assay
Figure 4 outlines the workflow to create a user-defined assay from a BD-defined assay. The BrdU FITC assay was used as a starting point to create a user-defined assay to accommodate additional tubes required for performing an aphidicolin dose response experiment as well as a BrdU pulse-chase time course experiment (Figures 6, 7, and 8). Tube properties for the user-defined assay were customized to include Alexa Fluor® 647 H2AX. PMTVs were adjusted and spillover values for Alexa Fluor® 647 were calculated. For details about adding fluorochromes, see the BD FACSVerse System Reference.4 For the aphidicolin dose response, the worksheet was customized to include an additional plot of DNA 7-AAD vs Alexa Fluor® 647 H2AX-A. The user-defined assays were used to acquire data in the worklist using the Loader. For details about creating a user-defined assay, see the BD FACSVerse System User’s Guide.2
Results and Discussion
BrdU FITC Assay
After acquiring data from BrdU pulsed and unpulsed samples using the BrdU FITC assay, a lab report was automatically generated that contains plots, gates, and statistics as described in the methods section (Figure 5). First the acquired events were gated based on forward and side scatter to separate the cellular events from debris, and then the cellular events were further gated based on their BrdU and 7-AAD content. An additional histogram plot displays total DNA content with 7-AAD. An assay results table showing the statistics from gated populations is also shown. All the gates in the lab report can be adjusted based on the data, which automatically updates the assay results table.
It is evident from Figure 5 that actively dividing Jurkat cells, pulsed for 1 hour with BrdU and stained with anti-BrdU FITC and 7-AAD, can be separated into three cell cycle phases, with approximately 41% of cells in S (BrdU+), 41% of cells in G0/G1, and 10% of cells in G2/M. In contrast, Jurkat cells that were not pulsed with BrdU do not display a BrdU+ signal. Thus, unpulsed cells cannot be resolved into S, G0/G1, and G2/M cell cycle phases using a two dimensional BrdU vs 7-AAD plot.
Figure 4. Workflow for creating a user-defined assay from a BD-defined assay.
Create Experimentfrom BrdU FITC Assay1
Customize TubeProperties2
Customize Worksheets3
Create Report4
Create User-DefinedAssay5
Application Note
Cell Cycle Analysis Using the BD BrdU FITC Assay on the BD FACSVerse™ System
BD Biosciences
August 2011
Page 7
BrdU FITC v1.0: Lab ReportCytometer Name: BD FACSVerse
Cytometer Serial #: 123456789
Software Name & Version: FACSuite Version 1.0.0.1477
Operator Name: BDAdministrator
Report Date/Time: 06-Jul-2011 04:08:22
For Research Use Only. Not for use in diagnostic or therapeutic procedures Page 1 of 2
Cells
Coun
t
DNA 7-AAD-A
G0/G1 Peak
0 50 100 150 200 250x1000
0
100
200
300
400
500
Cells
BrdU
FIT
C-A
DNA 7-AAD-A
S Phase
G2/M
G0/G1
0 50 100 150 200 250x1000
101
102
103
104
105
All Events
SSC-
A
FSC-A
Cells
0 50 100 150 200 250x1000
0
50
100
150
200
250x1000
Tube Name: Unpulsed
Sample ID Jurkat Acquisition Date 06-Jul-2011Time Points 1 h Acquisition Time 04:08:17
Sample Type Jurkat Pulse Time 1 hBrdU Conc. 10 µM
Application Note
Cell Cycle Analysis Using the BD BrdU FITC Assay on the BD FACSVerse™ System
BD Biosciences
August 2011
Cytometer Name: BD FACSVerse
Cytometer Serial #: 123456789
Software Name & Version: FACSuite Version 1.0.0.1477
Operator Name: BDAdministrator
Report Date/Time: 06-Jul-2011 04:08:22
All Events
SSC-
A
FSC-A
Cells
0 50 100 150 200 250x1000
0
50
100
150
200
250x1000
For Research Use Only. Not for use in diagnostic or therapeutic procedures Page 2 of 2
Cells
Coun
t
DNA 7-AAD-A
G0/G1 Peak
0 50 100 150 200 250x1000
0
100
200
300
400
500Cells
BrdU
FIT
C-A
DNA 7-AAD-A
S Phase
G2/M
G0/G1
0 50 100 150 200 250x1000
101
102
103
104
105
Results Summary
Label Unpulsed Pulsed
Events Acquired 10000 10000
% Cells 94.1 94.6
% G0/G1 61.9 41.5
% S Phase (BrdU+) 0.0 40.8
% G2/M 20.2 10.1
Tube Name: Pulsed
Sample ID Jurkat Acquisition Date 06-Jul-2011
Time Points 1 h Acquisition Time 04:08:58Sample Type Jurkat Pulse Time 1 hBrdU Conc. 10 µM
Figure 5. BrdU FITC assay report showing cell cycle distribution of unpulsed and BrdU pulsed Jurkat cells.
Application Note
Cell Cycle Analysis Using the BD BrdU FITC Assay on the BD FACSVerse™ System
BD Biosciences
August 2011
Page 9
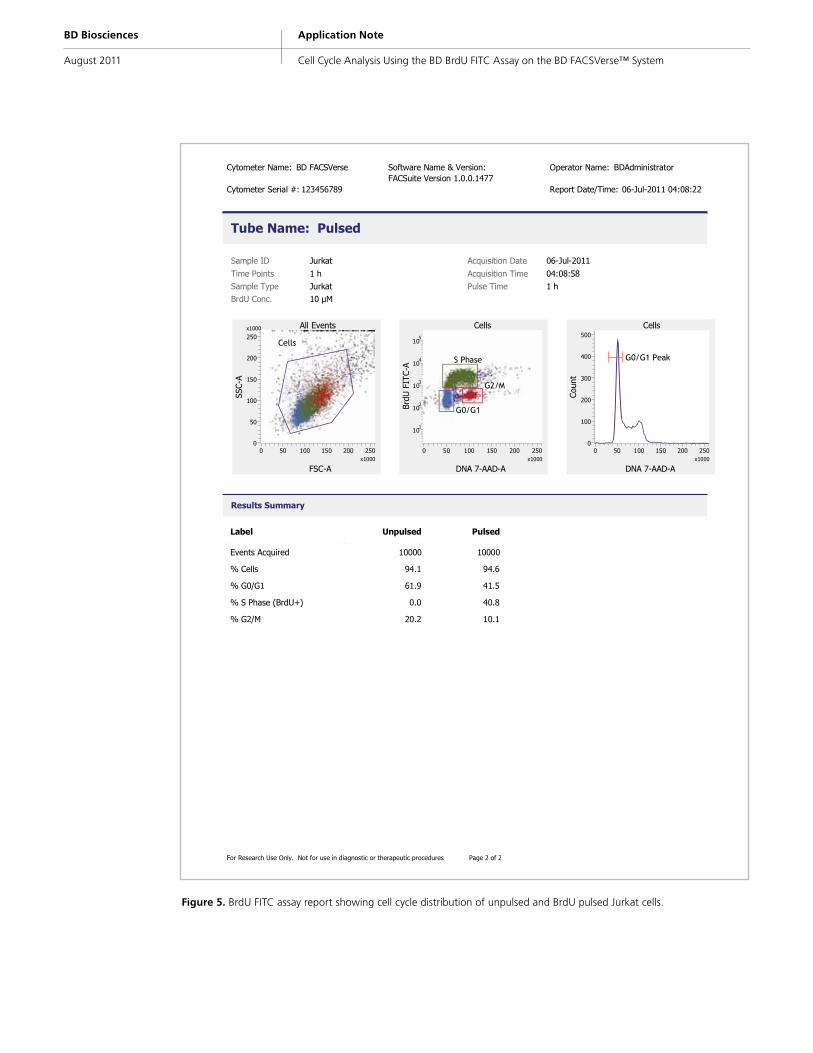
Dose-dependent Effects of Aphidicolin on BrdU Incorporation and DNA Damage
Aphidicolin is a known cell cycle inhibitor of eukaryotic cells. It specifically inhibits DNA polymerase by effectively blocking cells from DNA replication and can arrest the cell cycle at the G1/S phase boundary as marked in Figure 1.5 Furthermore, at higher concentrations, aphidicolin has been reported to induce chromosome aberrations in human lymphocytes by creating DNA breaks and gaps.6 Data from a representative experiment showing the dose-dependent effects of aphidocolin on Jurkat cells is presented in Figure 6. When BrdU pulsed Jurkat cells were treated with increasing concentrations of aphidicolin, the percentage of cells in the S phase decreased from 38% to 0%, while the percentage of cells in G0/G1 and G2/M phases increased from 45% to 60% and 10% to 28%, respectively. Figure 6, panel A shows the decreasing S-phase population and increasing G0/G1 and G2/M-phase populations in density plots for selected representative concentrations of aphidicolin. Further, the statistical data (percentage of cells in each cell cycle phase gate) was plotted against the aphidicolin concentrations, and a dose response curve was created (Figure 6, panel B).
Figure 6. Dose-dependent effects of aphidicolin (4-hour incubation) on cell cycle phase distribution.Jurkat cells were treated with various concentrations of aphidicolin and pulsed with BrdU for one hour followed by staining with anti-BrdU FITC and 7-AAD. Panel A. Representative BrdU FITC-A vs DNA 7-AAD-A plots (FSC-A vs SSC-A gated cell population) showing G
0/G
1, S, and G
2/M gates from
four concentrations of aphidicolin. Panel B. Dose response curve of aphidicolin showing the percentages of cells in G0/G
1, S, and G
2/M phases along
with DMSO controls (gated as shown in panel A). Data from triplicates is shown as Mean ±SEM.
Aphidicolin
0.0 μg/mLS Phase
G0/G1
G2/M
105
104
103
102
00 50 100 150 200 250
x1000
0.03 μg/mLS Phase
G0/G1
G2/M
105
104
103
102
00 50 100 150 200 250
x1000
Brd
U F
ITC
-A
DNA 7-AAD-A
0.3 μg/mLS Phase
G0/G1
G2/M
105
104
103
102
00 50 100 150 200 250
x1000
3.0 μg/mLS Phase
G0/G1
G2/M
105
104
103
102
00 50 100 150 200 250
x1000
Concentration (μg/mL)
% C
ells
0.01
80
70
60
50
40
30
20
10
00.1 1 10 100
Aphidicolin G2/M DMSO G2/MAphidicolin G0/G1 DMSO G0/G1
Aphidicolin S Phase DMSO S Phase
A
B
Application Note
Cell Cycle Analysis Using the BD BrdU FITC Assay on the BD FACSVerse™ System
BD Biosciences
August 2011
Concentration (μg/mL)
MFI
of
H2A
X+
Po
pu
lati
on
0.01
4000
3000
2000
1000
00.01 0.1 1 10 100
DMSOAphidicolin
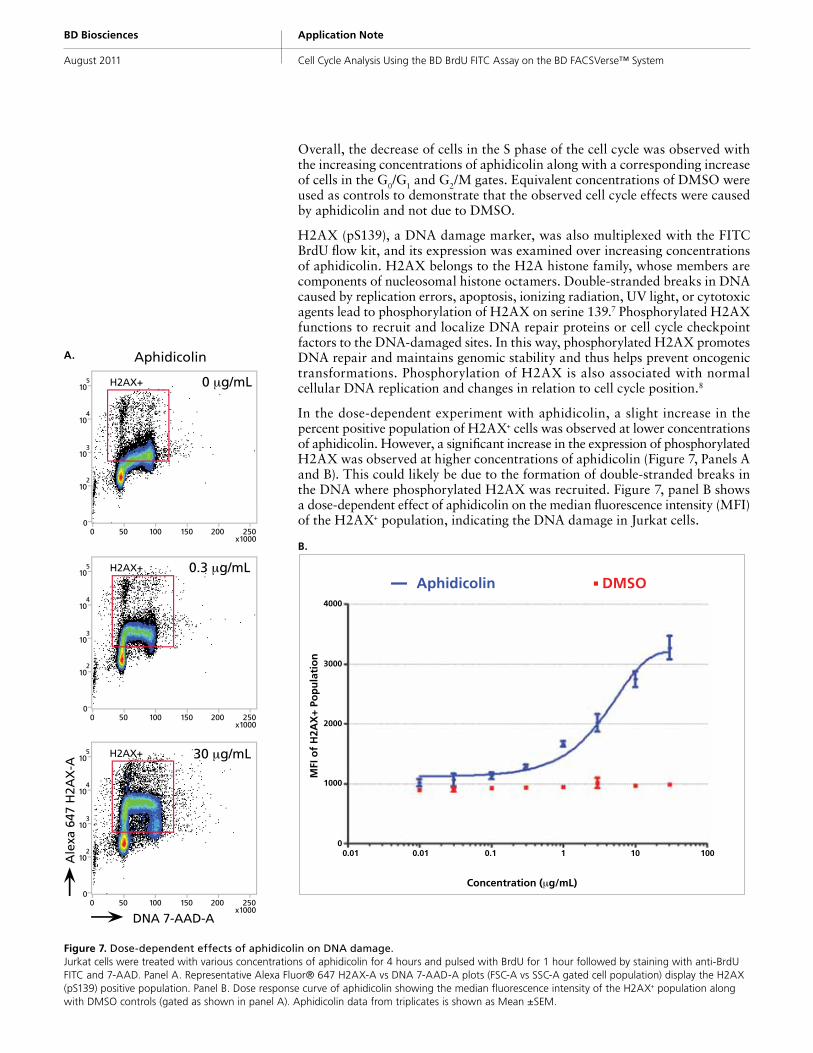
Overall, the decrease of cells in the S phase of the cell cycle was observed with the increasing concentrations of aphidicolin along with a corresponding increase of cells in the G0/G1 and G2/M gates. Equivalent concentrations of DMSO were used as controls to demonstrate that the observed cell cycle effects were caused by aphidicolin and not due to DMSO.
H2AX (pS139), a DNA damage marker, was also multiplexed with the FITC BrdU flow kit, and its expression was examined over increasing concentrations of aphidicolin. H2AX belongs to the H2A histone family, whose members are components of nucleosomal histone octamers. Double-stranded breaks in DNA caused by replication errors, apoptosis, ionizing radiation, UV light, or cytotoxic agents lead to phosphorylation of H2AX on serine 139.7 Phosphorylated H2AX functions to recruit and localize DNA repair proteins or cell cycle checkpoint factors to the DNA-damaged sites. In this way, phosphorylated H2AX promotes DNA repair and maintains genomic stability and thus helps prevent oncogenic transformations. Phosphorylation of H2AX is also associated with normal cellular DNA replication and changes in relation to cell cycle position.8
In the dose-dependent experiment with aphidicolin, a slight increase in the percent positive population of H2AX+ cells was observed at lower concentrations of aphidicolin. However, a significant increase in the expression of phosphorylated H2AX was observed at higher concentrations of aphidicolin (Figure 7, Panels A and B). This could likely be due to the formation of double-stranded breaks in the DNA where phosphorylated H2AX was recruited. Figure 7, panel B shows a dose-dependent effect of aphidicolin on the median fluorescence intensity (MFI) of the H2AX+ population, indicating the DNA damage in Jurkat cells.
Figure 7. Dose-dependent effects of aphidicolin on DNA damage.Jurkat cells were treated with various concentrations of aphidicolin for 4 hours and pulsed with BrdU for 1 hour followed by staining with anti-BrdU FITC and 7-AAD. Panel A. Representative Alexa Fluor® 647 H2AX-A vs DNA 7-AAD-A plots (FSC-A vs SSC-A gated cell population) display the H2AX (pS139) positive population. Panel B. Dose response curve of aphidicolin showing the median fluorescence intensity of the H2AX+ population along with DMSO controls (gated as shown in panel A). Aphidicolin data from triplicates is shown as Mean ±SEM.
B.
Aphidicolin
0 μg/mLH2AX+105
104
103
102
00 50 100 150 200 250
x1000
Ale
xa 6
47 H
2AX
-A
DNA 7-AAD-A
0.3 μg/mLH2AX+105
104
103
102
00 50 100 150 200 250
x1000
30 μg/mLH2AX+105
104
103
102
00 50 100 150 200 250
x1000
A.
Application Note
Cell Cycle Analysis Using the BD BrdU FITC Assay on the BD FACSVerse™ System
BD Biosciences
August 2011
Page 11
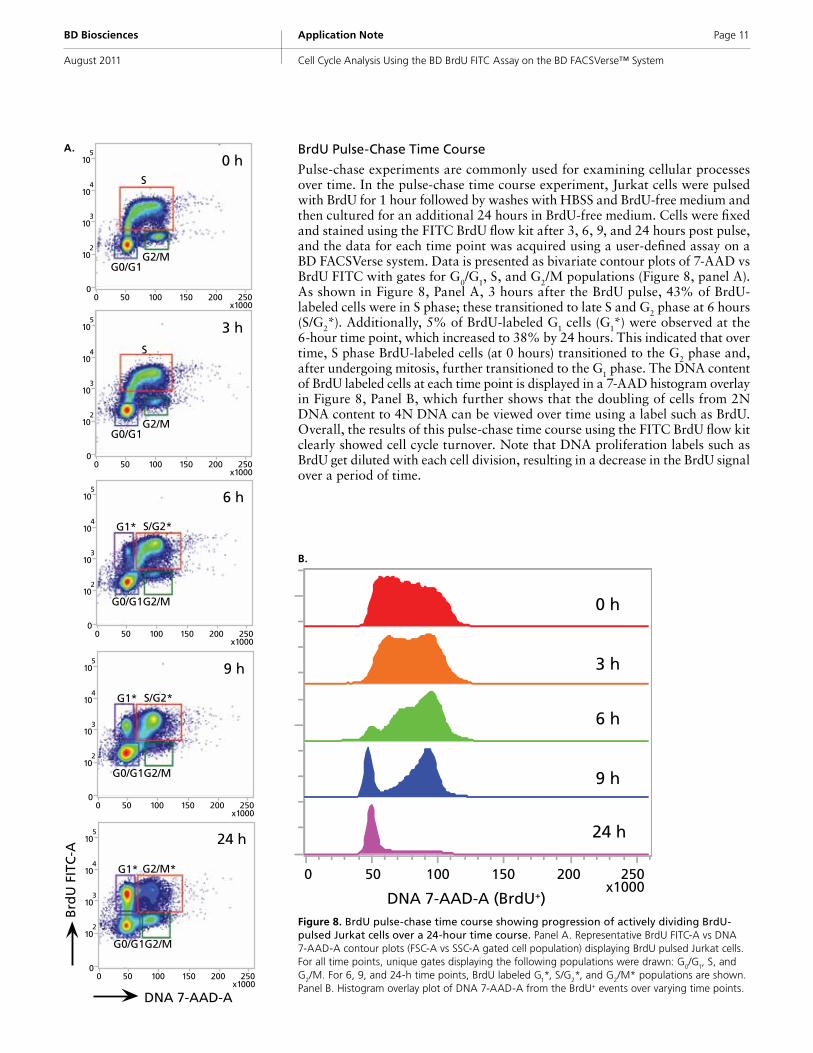
BrdU Pulse-Chase Time Course
Pulse-chase experiments are commonly used for examining cellular processes over time. In the pulse-chase time course experiment, Jurkat cells were pulsed with BrdU for 1 hour followed by washes with HBSS and BrdU-free medium and then cultured for an additional 24 hours in BrdU-free medium. Cells were fixed and stained using the FITC BrdU flow kit after 3, 6, 9, and 24 hours post pulse, and the data for each time point was acquired using a user-defined assay on a BD FACSVerse system. Data is presented as bivariate contour plots of 7-AAD vs BrdU FITC with gates for G0/G1, S, and G2/M populations (Figure 8, panel A). As shown in Figure 8, Panel A, 3 hours after the BrdU pulse, 43% of BrdU-labeled cells were in S phase; these transitioned to late S and G2 phase at 6 hours (S/G2*). Additionally, 5% of BrdU-labeled G1 cells (G1*) were observed at the 6-hour time point, which increased to 38% by 24 hours. This indicated that over time, S phase BrdU-labeled cells (at 0 hours) transitioned to the G2 phase and, after undergoing mitosis, further transitioned to the G1 phase. The DNA content of BrdU labeled cells at each time point is displayed in a 7-AAD histogram overlay in Figure 8, Panel B, which further shows that the doubling of cells from 2N DNA content to 4N DNA can be viewed over time using a label such as BrdU. Overall, the results of this pulse-chase time course using the FITC BrdU flow kit clearly showed cell cycle turnover. Note that DNA proliferation labels such as BrdU get diluted with each cell division, resulting in a decrease in the BrdU signal over a period of time.
Figure 8. BrdU pulse-chase time course showing progression of actively dividing BrdU-pulsed Jurkat cells over a 24-hour time course. Panel A. Representative BrdU FITC-A vs DNA 7-AAD-A contour plots (FSC-A vs SSC-A gated cell population) displaying BrdU pulsed Jurkat cells. For all time points, unique gates displaying the following populations were drawn: G
0/G
1, S, and
G2/M. For 6, 9, and 24-h time points, BrdU labeled G
1*, S/G
2*, and G
2/M* populations are shown.
Panel B. Histogram overlay plot of DNA 7-AAD-A from the BrdU+ events over varying time points.
Brd
U F
ITC
-A
DNA 7-AAD-A
24 h
G0/G1G2/M
G1* G2/M*
105
104
103
102
00 50 100 150 200 250
x1000
9 h
G0/G1G2/M
G1* S/G2*
105
104
103
102
00 50 100 150 200 250
x1000
6 h
G0/G1G2/M
G1* S/G2*
105
104
103
102
00 50 100 150 200 250
x1000
3 h
G0/G1G2/M
S
105
104
103
102
00 50 100 150 200 250
x1000
0 h
G0/G1G2/M
S
105
104
103
102
00 50 100 150 200 250
x1000
A.
DNA 7-AAD-A (BrdU+)
250x1000
200150100500
0 h
3 h
6 h
9 h
24 h
B.
Application Note
Cell Cycle Analysis Using the BD BrdU FITC Assay on the BD FACSVerse™ System
BD Biosciences
August 2011
For Research Use Only. Not for use in diagnostic or therapeutic procedures.
Class 1 Laser Product.
Alexa Fluor is a registered trademark of Molecular Probes, Inc.
BD, BD Logo and all other trademarks are property of Becton, Dickinson and Company. © 2011 BD
23-13028-00
Tips and Tricks• Many cell cycle inhibitor
compounds are not soluble in water, and therefore DMSO is used as a solvent. To ensure the effect of a compound on a cell population, we recommend that an appropriate DMSO control, without the test compound, be used.
• For consistent 7-AAD staining across samples:
– The number of cells in each sample should be accurate and equal.
– Dilute the 7-AAD solution in stain buffer (20 μL of 7-AAD solution per 500 μL of stain buffer) and then add the final resuspension volume to the pellet of cells from each tube.
– If the samples are too concentrated during acquisition, run at a lower sample flow rate. Do not dilute the cells with additional stain buffer, since this will dilute the 7-AAD and therefore decrease the 7-AAD signal.
– It is necessary to allow samples with DNA dyes to equilibrate. Preview a few samples and observe the linear 7-AAD fluorescence over time. Determine an ideal preview time before acquiring that is appropriate for the cytometer and samples (typically between 10 to 40 seconds) before the 7-AAD signal is stable.
ConclusionsThe FITC BrdU flow kit and the BrdU FITC assay in BD FACSuite software provide a fast and easy workflow to assess the cell cycle distribution of a population of cells. Unpulsed and BrdU pulsed Jurkat cells were analyzed in a worklist on a BD FACSVerse system, and a laboratory report was automatically generated with plots, gates, and statistics for assessment of cells in G0/G1, S, and G2/M phases. The BD-defined assay was then used to create a user-defined assay for monitoring the dose-dependent effect of aphidicolin on the cell cycle, which revealed a decrease in the S phase and increase in G0/G1 and G2/M populations with increasing doses. The FITC BrdU flow kit was also multiplexed with the DNA damage marker H2AX (pS139), and an increase in expression of H2AX (pS139) was observed with the increasing concentration of aphidicolin. In addition, a BrdU pulse-chase time course experiment was conducted to monitor progression of the cell cycle over a period of 24 hours. Overall, the proof of principle data presented in this application note shows that the FITC BrdU flow kit combined with the BrdU FITC assay can be used as a quick and easy way to assess the cell cycle, and can also be customized for advanced dose response and time course experiments with multiple tubes. These experiments can be run automatically in a worklist using the Loader.
References1. BD Pharmingen™ BrdU Flow Kits Instruction Manual. 03-8100055-1C. 2008.
2. BD FACSVerse System User’s Guide. 23-11463-00 Rev. 01.
3. BD FACSuite Software Research Assays Guide. 23-11470-00 Rev. 01.
4. BD FACSVerse System Reference. 23-11879-00 Rev. 01.
5. Spadari S, Sala F, Pedrali-Noy G. Aphidicolin: a specific inhibitor of nuclear DNA replication in eukaryotes. Trends Biochem Sci. 1982;7:29-32.
6. Glover TW, Berger C, Coyle J, Echo B. DNA polymerase α inhibition by aphidicolin induces gaps and breaks at common fragile sites in human choromosomes. Hum Genet. 1984;67:136-142.
7. Burma S, Chen BP, Murphy M, Kurimasa A, Chen DJ. ATM phosphorylates histone H2AX in response to DNA double-strand breaks. J Biol Chem. 2001;276:42462-42467.
8. Huang X, Darzynkiewicz Z. Cytometric assessment of histone H2AX phosphorylation: a reporter of DNA damage. Methods Mol Biol. 2006;314:73-80.
BD Biosciences2350 Qume DriveSan Jose, CA 95131US Orders: 877.232.8995Technical Service: [email protected]