b.e., karnataka university, india, 1984 ... - open collections
TRANSCRIPT

WAVE SLAMMING ON AHORIZONTAL PLATE
by
SHANKAR SUBRAYA BHAT
B.E., Karnataka University, India, 1984M.Tech., Mangalore University, 1986
A THESIS SUBMflED IN PARTIAL FULFILLMENT OF
THE REQUIREMENTS FOR THE DEGREE OF
MASTER OF APPLIED SCIENCE
in
THE FACULTY OF GRADUATE STUDIES
DEPARTMENT OF CIVIL ENGINEERING
We accept this thesis as conforming
to the required standard
THE UNIVERSITY OF BRITISH COLUMBIA
August, 1994
© Shankar S. Bhat, 1994

In presenting this thesis in partial fulfillment of therequirements for an advanced degree at the University of BritishColumbia, I agree that the Library shall make it freely availablefor reference and study. I further agree that permission forextensive copying of this thesis for scholarly purposes may begranted by the head of my department or by his or herrepresentatives. It is understood that copying or publication ofthis thesis for financial gain shall not be allowed without mywritten permission.
(Signature)
Department of_________________
The University of British ColumbiaVancouver, Canada
Date___________

II
Abstract
The design of coastal and offshore structures requires a thorough understanding of
environmental loading, particularly due to waves. Structural elements such as decks
located in the splash zone encounter intermittent contact with the water, and the loads
associated with the water impact may be several times larger than those experienced by
elements when fully submerged. These forces may give rise to localized damage and to
fatigue problems.
Such structures should clearly be designed to account for wave impact, in addition to
more general wave loading. Several studies have reported the related problems of ship
bottom slamming, missile entry and sea plane landing. Although previous studies have
contributed to an improved understanding of wave impact, there is still considerable
uncertainty in the estimation of impact loads on structural elements near the water surface.
In this context, the present study has been carried out to examine the wave loads on a fixed
horizontal plate located near the still water level.
Experiments were conducted in the wave flume of the Hydraulics Laboratory of the
Department of Civil Engineering at the University of British Columbia. A plate, 60.0 cm
long, 20.0 cm wide and 6.25 mm thick, was instrumented with load-cells to measure the
vertical force on the plate due to waves. The plate was supported by two vertical rods
through the load-cells which were connected to a cross shaft mounted on bearings at the
ends.
Tests were conducted over a range of wave periods and wave heights in combination
with different plate clearances above the still water level. The vertical reactions at the two
supports were measured, and the time histories of vertical force and its line of action are

ifi
thereby obtained. The wave surface elevations at the leading and rear end of the plate were
measured with the plate absent. Results are presented in the form of force time histories,
their lines of action and the associated water surface elevation. An analysis of these time
histories is carried out to obtain various parameters of wave impact which include, the peak
upward and downward force, their lines of action and times of occurrence, and the
associated wetted lengths. The influence of incident wave parameters on these is
investigated. Video images are studied to understand the impact process and to identify the
difficulties involved in the investigation. An attempt is also made to predict the vertical
force based on the hydrodynamic impact, drag and buoyancy forces.

iv
Table of Contents
Page
Abstract
Table of Contents.iv
List of Tables vii
List of Figures viii
List of Symbols xii
Acknowledgments xv
Chapter 1 Introduction 1
1.1 General 1
1.2 Literature Review 2
1.2.1 Water Entry Problem 2
1.2.2 Horizontal Cylinder 4
1.2.3 Horizontal Plate 5
1.3 Scope of the Present Investigation 7
Chapter 2 Theoretical Development 8
2.1 Dimensional Analysis 8

V
2.2 Vertical Force Formulation 10
2.2.1 Wave Theory and Associated Kinematics 14
2.2.2 Superposition of Force Components 16
2.3 Dynamic Response of SDOF System 19
Chapter 3 Experimental Investigation 21
3.1 Introduction 21
3.2 The Plate 21
3.3 Wave Flume and Generator 22
3.4 Control and Data Acquisition 23
3.5 Measurements 23
3.6 Experimental Procedures 24
3.7 Dynamic Characteristics of the Assembly 25
3.8 Data Processing 27
Chapter 4 Results and Discussion 29
4.1 Vertical Force 30
4.2 Vertical Force and Incident Waves 32
4.3 Video Records 34
4.4 Force Predictions 35

vi
Chapter 5 Conclusions and Recommendations 38
References 40
Appendix A Static Analysis 42

List of Tables
Table 2.1 Added mass constant for a thin rectangular plate.
Table 3.1 Regular wave parameters used in experiments.
Table 4.1 Summary of test conditions and principal results.
Table 4.2 Computed values of the factor a. in selected tests.
vii
vifi
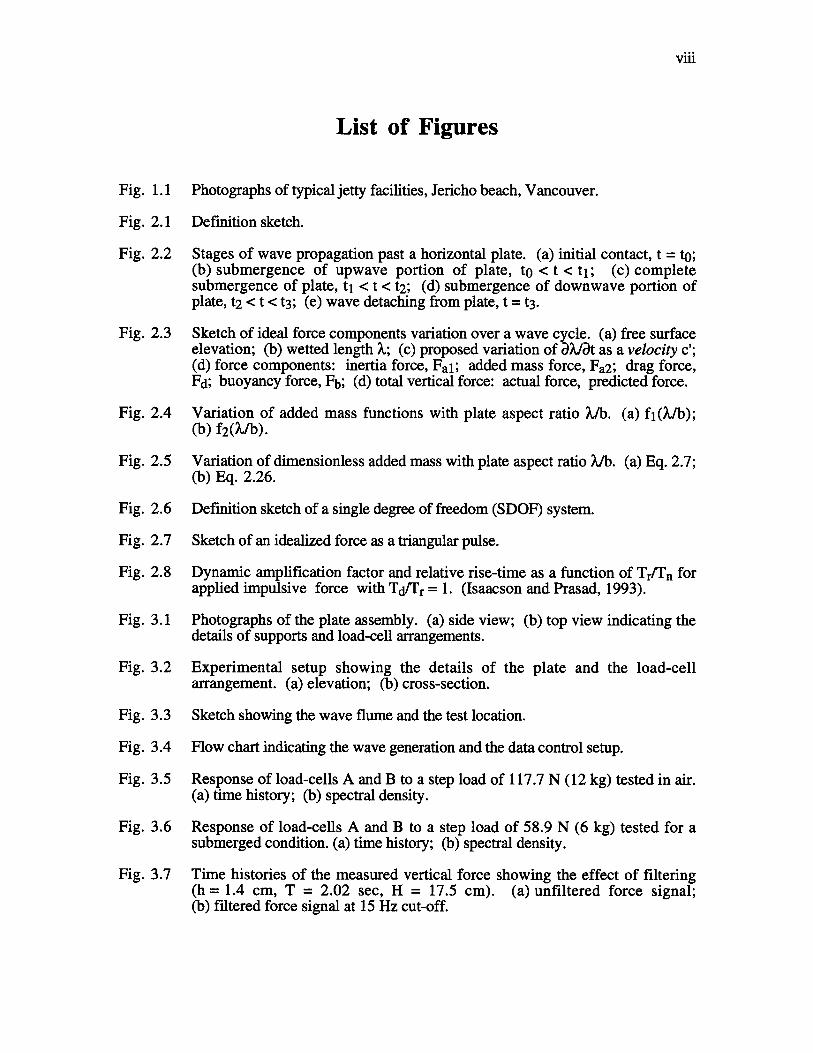
List of Figures
Fig. 1.1 Photographs of typical jetty facilities, Jericho beach, Vancouver.
Fig. 2.1 Defmition sketch.
Fig. 2.2 Stages of wave propagation past a horizontal plate. (a) initial contact, t = to;(b) submergence of upwave portion of plate, to <t <t1; (c) completesubmergence of plate, t1 <t < t2; (d) submergence of downwave portion ofplate, t2 <t < t3; (e) wave detaching from plate, t = t3.
Fig. 2.3 Sketch of ideal force components variation over a wave cycle. (a) free surfaceelevation; (b) wetted length ; (c) proposed variation of iAJat as a velocity c’;(d) force components: inertia force, Fal; added mass force, Fa2; drag force,Fd; buoyancy force, Fb; (d) total vertical force: actual force, predicted force.
Fig. 2.4 Variation of added mass functions with plate aspect ratio 2fb. (a)f1(Jb);(b)f2(Ib).
Fig. 2.5 Variation of dimensionless added mass with plate aspect ratio ?Jb. (a) Eq. 2.7;(b) Eq. 2.26.
Fig. 2.6 Definition sketch of a single degree of freedom (SDOF) system.
Fig. 2.7 Sketch of an idealized force as a triangular pulse.
Fig. 2.8 Dynamic amplification factor and relative rise-time as a function of Tr/Tn forapplied impulsive force with Td/Tr = 1. (Isaacson and Prasad, 1993).
Fig. 3.1 Photographs of the plate assembly. (a) side view; (b) top view indicating thedetails of supports and load-cell arrangements.
Fig. 3.2 Experimental setup showing the details of the plate and the load-cellarrangement. (a) elevation; (b) cross-section.
Fig. 3.3 Sketch showing the wave flume and the test location.
Fig. 3.4 Flow chart indicating the wave generation and the data control setup.
Fig. 3.5 Response of load-cells A and B to a step load of 117.7 N (12 kg) tested in air.(a) time history; (b) spectral density.
Fig. 3.6 Response of load-cells A and B to a step load of 58.9 N (6 kg) tested for asubmerged condition. (a) time history; (b) spectral density.
Fig. 3.7 Time histories of the measured vertical force showing the effect of filtering(h = 1.4 cm, T = 2.02 see, H = 17.5 cm). (a) unfiltered force signal;(b) filtered force signal at 15 Hz cut-off.

ix
Fig. 3.8 Time histories of total vertical force and its line of action showing the effect offiltering (h = 1.4 cm, T = 2.02 sec, H = 17.5 cm). (a) unfiltered force(b) filtered force with 15 Hz cut-off.
Fig. 3.9 Time histories of (a) free surface elevation; (b) vertical force and its line ofaction. (h = 1.4 cm, T = 2.02 sec, H = 17.5 cm).
Fig. 3.10 Flow chart indicating the sequence of analysis of the measured force and waveelevation time histories.
Fig. 4.1 Time histories of free surface elevation, wetted length, vertical force measuredat the supports, total vertical force and the associated line of action during onewave cycle for h = 0.8 cm, T = 1.68 sec, H = 14.2 cm. (a) free surfaceelevation and wetted length; (b) vertical force; (c) total vertical force and line ofaction.
Fig. 4.2 Time histories of free surface elevation, wetted length, vertical force measuredat the supports, total vertical force and the associated line of action during onewave cycle for h = 0.8 cm, T = 1.70 sec, H = 10.5 cm. (a) free surfaceelevation and wetted length; (b) vertical force; (c) total vertical force and line ofaction.
Fig. 4.3 Time histories of free surface elevation, wetted length, vertical force measuredat the supports, total vertical force and the associated line of action during onewave cycle for h = 0.8 cm, T = 1.70 sec, H = 6.80 cm. (a) free surfaceelevation and wetted length; (b) vertical force; (c) total vertical force and line ofaction.
Fig. 4.4 Time histories of free surface elevation, wetted length, vertical force measuredat the supports, total vertical force and the associated line of action during onewave cycle for h = 1.4 cm, T = 1.68 sec, H = 14.2 cm. (a) free surfaceelevation and wetted length; (b) vertical force; (c) total vertical force and line ofaction.
Fig. 4.5 Time histories of free surface elevation, wetted length, vertical force measuredat the supports, total vertical force and the associated line of action during onewave cycle for h = 1.4 cm, T = 1.68 sec, H = 10.5 cm. (a) free surfaceelevation and wetted length; (b) vertical force; (c) total vertical force and line ofaction.
Fig. 4.6 Time histories of free surface elevation, wetted length, vertical force measuredat the supports, total vertical force and the associated line of action during onewave cycle for h = 0 cm, T = 2.02 sec, H = 17.5 cm. (a) free surface elevationand wetted length; (b) vertical force; (c) total vertical force and line of action.
Fig. 4.7 Time histories of free surface elevation, wetted length, vertical force measuredat the supports, total vertical force and the associated line of action during onewave cycle for h = 1.4 cm, T = 2.02 sec, H = 17.5 cm. (a) free surfaceelevation and wetted length; (b) vertical force; (c) total vertical force and line ofaction.

x
Fig. 4.8 Time histories of free surface elevation, wetted length, vertical force measuredat the supports, total vertical force and the associated line of action during onewave cycle for h = 2.5 cm, T = 2.02 sec, H = 17.5 cm. (a) free surfaceelevation and wetted length; (b) vertical force; (c) total vertical force and line ofaction.
Fig. 4.9 Maximum upward force coefficient F/pgbHe as a function of relative plateclearance h/H and relative plate length VL. (a) 0.016 < H/L <0.020; (b) 0.026<H/L < 0.030; (c) 0.035 <HJL < 0.041.
Fig. 4.10 Maximum downward force coefficient Fm/pgbHL as a function of relative plateclearance h/H and relative plate length LJL. (a) 0.0 16 <H/L < 0.020; (b) 0.026<HIL < 0.030; (c) 0.035 <H/L < 0.041.
Fig. 4.11 Non-dimensionalised duration of plate’s partial submergence TIT as a functionof relative plate clearance h/H and relative plate length L/L. (a) 0.0 16 <H/L <0.020; (b) 0.026 < HJL < 0.030; (c) 0.035 <HJL <0.041.
Fig. 4.12 Non-dimensionalised duration of plate’s complete submergence T/T as afunction of relative plate clearance h/H and relative plate length L/L. (a) 0.016 <H/L <0.020; (b) 0.026 < HIL <0.030; (c) 0.035 <HIL < 0.04 1.
Fig. 4.13 Non-dimensionalised rise-time TIT of peak vertical force as a function ofrelative plate clearance h/H and relative plate length L/L. (a) 0.016 <HIL <0.020; (b) 0.026 < HIL < 0.030; (c) 0.035 <H/L <0.041.
Fig. 4.14 Non-dimensionalised time of occurrence TmIf of maximum downward force asa function of relative plate clearance h/H and relative plate length L1t. (a) 0.0 16<HJL <0.020; (b) 0.026 <H/L < 0.030; (c) 0.035 <H/L <0.041.
Fig. 4.15 Non-dimensionalised line of action Spit of maximum upward force as afunction of relative plate clearance h/H and relative plate length Lit. (a) 0.016 <H/L <0.020; (b) 0.026 < H/L <0.030; (c) 0.035 <Hit < 0.041.
Fig. 4.16 Non-dimensionalised line of action Smit of maximum downward force as afunction of relative plate clearance h/H and relative plate length Lit. (a) 0.016 <HIL < 0.020; (b) 0.026 <H/L <0.030; (c) 0.035 <H/L < 0.041.
Fig. 4.17 Non-dimensionalised wetted length fL corresponding to maximum upwardforce as a function of relative plate clearance h/H and relative plate length Lit.(a) 0.016 <H/L < 0.020; (b) 0.026 <H/L < 0.030; (c) 0.035 <HIL < 0.04 1.
Fig. 4.18 Non-dimensionalised wetted length m/L corresponding to maximumdownward force as a function of relative plate clearance h/H and relative platelength Lit. (a) 0.0 16 <H/L <0.020; (b) 0.026 <FI/L < 0.030; (c) 0.035 <Hit < 0.041.
Fig. 4.19 Photographs of wave impact. (a) instant of complete submergence; (b) waterdrainage following the submergence.
Fig. 4.20 Video images indicating various stages of wave impact during one wave cycle.(a) partial submergence; (b) complete submergence; (c) wave recession;(d) water drainage.

x
Fig. 4.21 Variation of normalized free surface elevation and predicted vertical force basedon Eq. 2.23 for H/L = 0.04, £/L = 0.146 with two different plate clearances.(a) free surface elevation; (b) vertical force for h/H = 0; (c) vertical force forh/H = 0.15.
Fig. 4.22 Variation of normalized free surface elevation and predicted vertical force basedon Eq. 2.27 for HIL 0.04, //L = 0.146 with two different plate clearances.(a) free surface elevation; (b) vertical force for h/H = 0; (c) vertical force forh/H = 0.15.
Fig. 4.23 Comparison of vertical force predicted by analytical models with experimentalobservation for h = 0 cm, T = 2.02 sec, H = 17.5 cm. (a) free surface elevationand the wetted length; (b) vertical force.
Fig. 4.24 Comparison of vertical force predicted by analytical models with experimentalobservation for h = 0 cm, T = 1.68 sec, H = 14.2 cm. (a) free surface elevationand the wetted length; (b) vertical force.
Fig. 4.25 Comparison of vertical force predicted by analytical models with experimentalobservation for h = 1.4 cm, T = 2.02 sec, H = 17.5 cm. (a) free surfaceelevation and the wetted length; (b) vertical force.
Fig. Al Free body diagram of the plate indicating the support forces and the line ofaction of the vertical force.

xii
List of Symbols
b = width of the plate
C = damping of the measuring system
c = wave celerity
c’ = wave front velocity
Cd = drag coefficient
Cs = slamming coefficient
D = cylinder diameter
d = water depth
F = vertical force due to wave action on the plate
FA = reaction measured at support A (see Fig. Al)
Fa = hydrodynamic force
Fai = inertia force
F = added mass force
FB = reaction measured at support B (see Fig. Al)
Fd = drag force
F = peak downward force
F0 = peak force
F = peak upward force
Ft = measured vertical force
g = gravitational constant
H = wave height
h = plate clearance above the still water level
K = stiffness
k = wave number, 2nfL

XIII
k1 = stiffness of support A
k2 = stiffness of support B
L = wave length
£ = length of the cylinder or plate
M = mass of measuring system
m = added mass per unit width of the plate
Pm = amplitude of the free vibration force trace measured after m cycles
q = half wetted length of the plate
s = line of action of F
= line of action associated with Fm
= line of action associated with F
T = wave period
= time
to = instant at initial impact
t1 = instant at complete submergence
t2 = instant at which leading edge of the horizontal plate located at aclearance h just emerges out of wave
t3 = instant at which horizontal plate located at a clearance hcompletely out of water.
T = duration for plate’s partial submergence (= ti - to)
Td = decay-time
Tm = time of occurrence associated with Fm
tm = average of times ti and t2
Tr = rise-time associated with applied force
T = duration of plate’s complete submergence (= t2 - t1)
Tt = measured rise-time associated with Fp
u = displacement of the measuring system
v = vertical velocity of the free surface
xiv
w = plate thickness
x = horizontal coordinate in wave direction
= vertical force per unit width
u = acceleration of the measuring system
= velocity of the measuring system
= vertical acceleration of the free surface profile
= added mass correction factor
= free surface elevation
TI() = free surface elevation at x =0
= free surface elevation at x =
ij = vertical particle acceleration of the free surface profile
= vertical particle velocity of the free surface profile
£ = plate length
= wetted length
= wetted length associated with F
= wetted length associated with Fp
p = fluid density
= wave angular frequency, 2it/T
= damped frequency of the measuring system
= natural frequency of the measuring system
= damping ratio

xv
Acknowledgments
The author would like to thank his supervisor Dr. Michael Isaacson for his guidance and
encouragement throughout the preparation of this thesis. The author would like to express
his gratitude to Kurt Nielson for his help in building the model and other facilities
associated with the experimental investigation; to John Wong for his help relating to
electronic parts for the experiments; and to Sundar Prasad for his help relating to the
experimental setup, computing and the wave generator facilities. Also, Amal Phadke, Neal
Whiteside and Henry Kandioh are thanked for their help in running the experiments. The
author would also like to thank the Director, National Institute of Oceanography, Goa,
India, (Council for Scientific and Industrial Research), for granting a study leave to pursue
higher education, and also the Ministry of Human Resources Development, Government of
India, for being selected for the Canadian Commonwealth Scholarship Plan. Finally,
financial support in the form of a Scholarship from the Canadian Commonwealth
Fellowship Plan, Canadian Bureau for International Education, Government of Canada, is
gratefully acknowledged.
1
Chapter 1
Introduction
1.1 General
The design of coastal and offshore structures requires a thorough understanding of
environmental loads which are primarily due to waves. Structural elements such as decks,
which are located in the splash zone (i.e. at elevations which cause them to be intermittently
submerged), may be subjected to impulsive loads that can be several times larger than those
experienced by continuously submerged elements. These impulsive forces may give rise to
fatigue and to localized damage.
There are various examples of structural damage due to wave impact. For example,
Denson and Priest (1971) described the inspection of structural damage due to hurricanes
along the Gulf Coast, which revealed that horizontal floors, decks and platforms are
susceptible to severe damage by wave action. Da Costa and Scott (1988) reported that a
moderate storm on Lake Michigan in 1987 moved partially constructed concrete slabs at the
Jones Island East Dock. Another example is the case of the Ekofisk platform whose deck
was exposed to severe wave impact (Broughton and Horn, 1987).
Figure 1.1 provides a view of a typical jetty with its deck structure above the mean water
level. Clearly, such structures should be designed for local stresses due to wave impact in
addition to the design for overall loads. Even so, decks need to be sufficiently high above
the water surface in order to avoid unduly severe wave impact. Besides the phenomenon
of wave impact on decks, other situations such as seaplane landing, ship bow slamming,
2
platform bracings situated in the splash zone, and liquid sloshing in tanks also require
design with respect to hydrodynamic impact. It is therefore important to have a good
understanding of the wave slamming process on the basis of theoretical and/or experimental
investigations. Although previous work has contributed to the understanding of the wave
impact nature, there is still considerable uncertainty in the estimation of impact loads on
structural elements near the water surface. In this context, the present study has been
carried out to address the problem of wave loads on a fixed horizontal plate located near the
still water level.
1.2 Literature Review
The Morison equation is commonly used to calculate the wave force on fully submerged
slender structural members of different cross sections. However, structural members
which are located in the splash zone, such as the deck of a wharf, are intermittently
submerged and experience a large vertical force which cannot be predicted by the Morison
equation. These vertical forces are highly dynamic and characterized by large magnitudes
with short duration.
Although, problems relating to water entry and wave impact on flat bottom ships have
been the subject of numerous theoretical and experimental studies for many years, wave
impact forces on horizontal decks has received attention only since the early sixties. In the
following sections, a brief review of available theoretical and experimental investigations
relating to water impact and entry problem is presented.
1.2.1 Water Entry Problem
Hydrodynamic impact refers to the early stages of the entry of a body into water.
Approaches to describing this have generally been based on potential flow theory for an
incompressible fluid with a free surface. The solution of such problems may be related to

3
the determination of a variable added mass associated with the body as it enters the fluid.
In a classical paper, von Kármán (1929) presented a physical picture of the impact of a
wedge on a still water surface, intended to represent the impact process for the case of a
seaplane landing. On the basis of von Kármán’s approach, Wagner (1932) provided a
mathematical treatment of forces acting on a seaplane float. In this classical approach, no
consideration has been given to the effects of entrapped air or water compressibility.
Nevertheless, Wagner’s theoretical values show reasonable agreement with experimental
results obtained for two-dimensional models (Chuang, 1967).
The above approach is based on potential flow theory and provides an estimate of the
impact force on the impacting member during the initial stage of water entry. Beyond this
stage, the member also experiences inertia and drag forces. An extensive review of the
subject has been given by Szebehely (1966), emphasizing the principles involved in
different kinds of wave impact. Also, Faltinsen (1990) has summarized recent
developments of the water impact and entry problem.
A number of experimental studies on a flat bottom plate striking normal to a smooth
water surface have been reported. The magnitude of the maximum impact pressure is
theoretically equal to the acoustic pressure, which is the product of the velocity of sound in
the fluid, the fluid density and the velocity of the striking body. The results of drop tests
on models with flat bottoms have, however, shown that peak pressures are usually much
lower than the acoustic pressure because of the air entrapped between the body and the
water surface. Verhagen (1967) developed a theory to predict the impact pressures by
considering the influence of the compressed air between the plate and water surface. He
also investigated the phenomenon experimentally and showed that the predicted values are
in good agreement with the observed values obtained from two-dimensional tests of a body
having a completely flat bottom. Recently, Chan et al. (1991) emphasized the influence of

4
trapped air on impulsive pressure and examined the process of wave impact relating to
vertical plates on the basis of a simplified one-dimensional model.
In the following sections, the related situation of a horizontal circular cylinder is
considered, followed by experimental investigations of wave action on a horizontal plate.
1.2.2 Horizontal Cylinder
The impact force on a cylinder is given by the rate of change of fluid momentum which is a
function of the cylinder’s added mass that varies with the submergence. From a number of
past theoretical and experimental investigations on circular cylindrical horizontal members,
the slamming force F is considered to be proportional to the square of the wave impact
velocity and is expressed as:
F5 = (C5) (pv2) (De) (1.1)
where Cs is a slamming coefficient, £ is the cylinder length, D is the cylinder diameter,
p is the fluid density, and v is water particle velocity normal to the member surface. There
has been considerable debate on the choice of a proper value of C, typically ranging from
It to 2n (e.g. Kaplan and Silbert, 1976, Sarpkaya, 1978, Sarpkaya and Isaacson, 1981,
Armand and Cointe, 1987, Greenhow and Li, 1987, Chan and Melville, 1989,
Chan, et at. 1991, Isaacson and Prasad, 1992). Although the slamming force is
associated with the rate of change of momentum during the early stages of impact,
extending such a formulation beyond the initial stages gives rise to a number of
complications. These are mainly attributed to the water level variations in the vicinity of the
partially submerged member and the subsequent onset of drag forces. In addition to the
above, the buoyancy force and the inertia force also form significant components of the
vertical force on the cylinder. The associated force coefficients also vary with the
submergence, member size and flow kinematics. Also, the problem of wave action on a

5
cylinder may involve splashing and air entrapment, and partial and/or complete
submergence.
1.2.3 Horizontal Plate
The following paragraphs give a brief account of previous studies relating to wave action
on a horizontal plate.
El Ghamry (1963) carried out an early experimental study on the vertical force due to
non-breaking and breaking regular waves slamming on a horizontal plate. He indicated that
the vertical force is characterized by an initial peak of considerable magnitude and short
duration, followed by a slowly varying force of smaller magnitude extending over the
remaining period of submergence. He proposed a theoretical description of the force based
on a potential flow past a rigid fixed flat plate, incorporating suitable correction factors
relating to the deck length, wave length and water depth.
Furudoi and Murita (1966) studied experimentally the total vertical force on a horizontal
plate extending seaward from a vertical wall and noted a sharp impulsive force as indicated
by El Ghamry, with the average pressure head on the platform ranging from 1 to 8 times
the incident wave height.
Wang (1967) carried out experiments on a horizontal pier model subjected to slamming
by progressive and standing waves. He derived simple theoretical values for peak
pressures, by adapting an approximate analysis based on the fluid momentum principle,
and related the peak pressure to the celerity of the wave and the velocity of the fluid element
near the wave front. The slowly varying pressure head was simply taken as the pressure in
the undeformed wave at the deck elevation.
French (1969) carried out an extensive laboratory study and confirmed the nature of the
impact force to be similar to that observed by El Ghamry. He predicted the impact force

6
magnitude on the basis of a momentum conservation and energy equation. Denson and
Priest (1971) carried out a laboratory study to identify the influence of relative wave
height, relative plate clearance, relative plate width and relative plate length on the pressure
distribution under a thick horizontal plate. Tanimoto and Takahashi (1979) reported on an
experimental investigation to obtain the horizontal and vertical forces on a rigid platform
due to periodic waves. The uplift pressure was expressed as the sum of a shock pressure
component and a static pressure component. They developed an empirical shock pressure
term as a function of the contact angle between the undisturbed wave surface and the
bottom of the horizontal platform. More recently, Toumazis et al. (1989) investigated
experimentally wave impact pressures on both horizontal and vertical plates. Pressure
measurements in conjunction with observations using video records were adopted to study
the impact loading behaviour.
Irajpanah (1983) studied wave uplift pressures on horizontal platforms and presented a
finite element method to investigate the hydrodynamic loads on a horizontal platform.
Also, Lai and Lee (1989) developed a potential flow model using the finite element method,
and predicted the vertical forces of large amplitude waves on docks. They used a Galerkin
finite element method and studied the interaction of finite amplitude nonlinear water waves
with platforms. Their results compared reasonably well with the experimental results of
French (1969).
Kaplan (1992) extended the hydrodynamic theory of ship slamming to study wave action
on a deck slab. He proposed the time varying vertical force as a combination of a
hydrodynamic impact force and a drag force. The drag force was computed from a
constant force coefficient and assumed to act over a complete slamming event. Although he
did not compare the predicted vertical force with experimental results, in his re-examination
of hydrodynamic impact theory, he briefly assessed the features of time histories of the

7
predicted force with respect to field data. The time histories of force indicated that the
magnitudes were comparable during the initial stages of impact. However, the variation
showed a large discontinuity at the instant of complete submergence of the structure.
1.3 Scope of the Present Investigation
The primary aim of the present investigation is to study experimentally hydrodynamic
aspects of the vertical force on a fixed rigid horizontal plate. Despite the considerable
importance of this problem, a literature review reveals little information regarding the
estimation of the slamming force. On the basis of the studies carried out by
El Gahmry (1963) and French (1969), an experimental investigation was carried out on an
instrumented horizontal plate located above the still water level and subjected to wave
action. Vertical reactions at the two plate supports were measured for different
combinations of incident wave conditions and plate elevations, and the vertical force and its
line of action was computed from the measured support reactions. The results are
presented in the form of time series of the force and its line of action. Also, an analysis of
the force records is made in order to obtain the peak upward and downward forces, their
times of occurrence and their lines of action. Video records of the experiments are studied
in order to identify the problems involved in the experimental investigations. Finally, an
attempt is also made to predict the slamming force on a theoretical basis.
8
Chapter 2
Theoretical Development
In this chapter, important parameters influencing the vertical force on a fixed horizontal
plate subjected to regular waves are identified and a theoretical description of the force is
presented.
2.1 Dimensional Analysis
Dimensional analysis provides an important preliminary step to any experimental
investigation and may be used to identify important dimensionless parameters of the
problem at hand. Figure 2.1 provides a simplified definition sketch indicating a
unidirectional regular progressive wave train in water of constant depth d propagating past
a horizontal plate of width b, thickness w and length £ located at a distance h above the
mean water level. The vertical force on the plate, denoted F, is of interest and is influenced
by a number of variables which include the following:
• wave height, H
• wave period, T
• water depth, d
• plate length, £
• plate width, b
• plate thickness, w
• plate elevation, h
• fluid density, p

9
• gravitational constant, g
• fluid viscosity, j.L
• time, t
Additional parameters such as surface roughness, surface tension, air and water
compressibility, and spray effects may also play significant role but are neglected here.
The width of the plate may be important since it influences the escape of air below the
plate as the wave advances. The deck thickness w is assumed to be small enough so that
its influence may be neglected. And finally, the effect of the fluid viscosity ji is also
neglected.
In view of the above simplifications, the vertical force may be expressed in the form:
F = f(p, g, H, T, d, h, £, b, t) (2.1)
where is the vertical force per unit width. A dimensional analysis provides
F fh H d £ b t’
pgHe= i’ r L’ ‘ i (2.2)
In engineering applications, the maximum force F0, is of particular interest and is given
as:
F0 (h H d b £‘, (2.3)
The parameter h/H defines the relative clearance such that there is no wave contact for
hJH> 0.5 if waves are assumed to be sinusoidal. HIL is the wave steepness, dJL is a
depth parameter, and £JL is a relative length parameter of the plate, analogous to a wave
diffraction parameter.

10
It is illustrative to consider the typical ranges of some of these parameters. Intermittent
submergence of the plate occurs for -0.5 <h/H <0.5. The depth parameter d/L should
have a negligible influence on the force for deep water conditions corresponding to d/L>
0.5. Based on stability considerations, the wave steepness varies up to 0.142 in deep
water. Typical wave conditions may include wave periods ranging from 5 to 20 sec so that
ilL may span a relatively wide range.
2.2 Vertical Force Formulation
The vertical force on a horizontal member subjected to intermittent submergence in waves is
generally taken to be made up of hydrodynamic impact, drag and buoyancy force
components. (Although the buoyancy force was omitted in Section 2.1, in typical
experiments it may not be negligible compared to the other force components.) Thus, the
vertical force expressed as:
F(t) = Fa(t) + Fd(t) + Fb(t) (2.4)
where Fa(t), Fd(t) and Fb(t) are hydrodynamic impact, drag and buoyancy force
components respectively. These components are briefly discussed in the sections to
follow. However, it is useful to consider initially the various stages of interaction during a
wave cycle.
Stages of Wave Interaction
Consider a wave train interacting with the plate during the course of one cycle. Figure 2.2
shows the various stages of the plate submergence in terms of the positions of water
surface relative to the plate, and the corresponding times of occurrence. Figure 2.2(a)
shows the instant at which a wave just makes contact with the leading edge of the plate. In
Fig. 2.2(b), the wave progresses further, partially wetting the plate. Figure 2.2(c) shows
11
the stage at which the plate is fully submerged. The plate remains submerged until the
downwave free surface reaches the leading edge of the plate. Figure 2.2(d) shows the
wave recession stage, during which the leading edge of the plate is exposed. Finally,
Fig. 2.2(e) shows the instant of complete detachment of the wave from the rear edge of the
plate.
Defining the intersection locations of the downwave and upwave free surfaces as x1 and
x2 respectively, along the length of the plate, with the origin at the leading edge of the
plate, and with the wetted length denoted as = x2 — xi, the above sequence for one cycle
may be summarized as follows.
• For t = xi = 0, X2 = 0,
• Forto<t<ti xi0, ?x2
• Fort1<t<t2 xj=0,
• Fort2<t <t3 0<xi <L, x= L,
• Fort=t3 x1=L,
In the present study, only the case ilL < 1 is considered so that there is no more than
one region of water contact at any instant.
Hydrodynamic Impact
A simplified hydrodynamic analysis similar to that for a cylinder, can be carried out to
provide an approximate formulation for the vertical force on the plate. It is assumed that
the fluid is incompressible and inviscid, the flow is irrotational, the body is rigid, and that
the surface tension is negligible. Following Kaplan (1992), the force component Fa due to

12
hydrodynamic impact may be expressed in terms of the rate of change fluid momentum
associated with the submerged portion of the plate:
Fa= a(mv)
(2.5)at
where m is the vertical added mass of the submerged portion of the plate, t is time, and v is
the vertical velocity of the fluid striking the plate. Equation 2.5 can be expanded to obtain
am .
Fa = m— + v— = my + v——— (2.6)at at aat
where is the wetted length of the plate and v is the vertical acceleration.
The primary difficulty with applying this equation relates to the use of a reliable
expression for the added mass, since the flow field around the plate is rather complex. A
suitable approach to estimating m is to equate this to the added mass of a fully submerged
plate in an infinite fluid. Thus, the required added mass m when submerged plate length is
? is considered to be equal to the added mass of a fully submerged plate length ?.
However, because of the uncertainty associated with this equivalence, it is appropriate to
introduce an unknown factor a. Thus the expression for added mass m is given by:
m = ap2b2f1(2Jb) (2.7)
where a replaces t/4 in Eq. 2.7 and the functionf1(Jb) is described in Sarpkaya and
Isaacson (1981). On the basis of Eq. 2.7, the hydrodynamic impact force a given by
Eq. 2.6 may be expressed as:
Fa = a p b2f1(?Jb) ‘ + a p b2 v f2(2Jb) (2.8)
where an overdot denotes a time derivative, the functionf2QJb) is given as:
f2QJb) = f1QJb) + (XJb)fQJb) (2.9)
13
and a prime denotes a derivative with respect to the argument. The first term in Eq. 2.8,
denoted Fai, is an inertia force associated with the fluid acceleration, and the second term,
denoted Fa2, is an added mass force associated with the rate of change of added mass.
It is also possible to formulate the impact force by considering instead the hydrodynamic
force, IS.Fa on an element of length zSx and integrating this over the instantaneous wetted
length of the plate.
iFa= a(Lm v)
(2.10)at
where zm is an infinitesimal added mass, given as zm = [ 4pvbq4q2- x2 j sx
(Lamb, 1932), x is the coordinate measured from the centre of the plat&s wetted length,
and q is half the wetted length of the plate. By integrating over the wetted length, the total
impact force may be obtained as:
Fa JAFadX (2.11)
where x and x2 are the intersection locations of the downwave and upwave limits of the
submerged plate length, measured here from the centre of this submerged plate length. An
analytical solution of the above integration is intractable, and this approach has not been
pursued since it may not lead to increased accuracy because of the various uncertainties in
the procedure.
Drag Force
The drag force Fd acting on the submerged potion of the plate is expressed in usual way in
terms of a drag coefficient Cd and is given by:
Fd=Cd1pbvIvI2. (2.12)

14
where Cd is the drag coefficient. The choice of Cd depends on various factors such as the
geometry and shape of the plate, and its orientation relative to the wave propagation
direction. The drag coefficient value during the early stages of the impact is unclear, but
has been chosen to be equal to 2.0, as for the plate when completely submerged.
Buoyancy Force
Although it is consistent to assume that the plate is very thin, in practice the submerged
volume of the plate may not be negligible, so that any comparison with the experimental
data should account for the buoyancy force associated with the finite volume of the plate,
the stiffeners and the submerged portion of the support system. Thus, the buoyancy force
is given as:
Fb = pgV (2.13)
where V is the submerged volume of the plate and submerged portion of the support
system. In the present study, Fb is assumed to vary sinusoidally with the time.
2.2.1 Wave Theory and Associated Kinematics
The hydrodynamic impact and drag forces discussed in the previous sections are expressed
in terms of the particle velocity and acceleration evaluated at the plate elevation. In the
present study, linear wave theory is used to determine the free surface elevation and
associated kinematics for application to these expressions.
For a regular progressive wave train, the water surface elevation TI is expressed as:
11 = cos (kx - 0t) (2.14)
15
where H is the wave height, k = 2icfL is the wave number, co = 2it/T is the wave angular
frequency, L is the wave length, and T is the wave period. The wave number and the wave
frequency are related by the linear dispersion relationship:
= ‘.Jgk tanh(kd) (2.15)
where d is the still water depth. On the basis of linear wave theory, the associated
kinematics are given as
coH sinh[k(d + z)]v
= 2 sinh(kd) sin(kx - cot) (2.16)
co2H sinh[k(d+z)]v =
- 2 sinh(kd) cos(kx - cot) (2.17)
with z measured upwards from still water level. In the present case z is set to the deck
elevation h. Several approaches have been proposed to evaluate water particle kinematics
near the instantaneous free surface (e.g. Gudmestad and Connor, 1986). The simplest of
these is to take z = 0, since this is consistent with the accuracy of linear wave theory. Thus
by substituting the approximation into Eqs. 2.16 and 2.17 we get
v r = sin(kx-cot) (2.18)
= cos(kx-cot) (2.19)
The wave kinematics vary along the submerged length of the plate, and are evaluated
here at the centre of the instantaneous submerged length of the plate.

16
2.2.2 Superposition of Force Components
Wetted Length
The wetted length and its time variation are important in the formulation of the vertical
force indicated by Eq. 2.8. Figure 2.3(a) is a sketch of the free surface elevation at the
leading and rear edges of the plate, denoted flo and i respectively. And Fig. 2.3(b) is a
sketch of the wetted length variation for a given wave form and plate clearance. At time to
(see also Fig. 2.2(a)), is zero and starts to increase as the wave progresses. At time t1,
the deck is completely submerged and 2. reaches the full plate length, ? = £. From t1 to t2
(see also Fig. 2.2(c)), the plate remains fully submerged. For t > t2, the wave recedes so
that A. decreases; and finally at t = t3, = 0. On the basis of linear theory, the wetted length
can be obtained by equating the wave surface elevation r to the plate clearance h and
solving for replacing x as:
h = cos(k - cot) (2.20)
Combinations
Following section 2.2 and Eq. 2.4, the force components may be superposed to obtain the
time variation of the vertical force:
FFa1+Fa2+Fd+Fb (2.21)
Also, as discussed in section 2.2.1, the plate clearance h is of the order of wave height
H, so that on the basis of linear wave theory the velocity v and acceleration v may be taken
as v r and v ij. Substituting the expressions for the force components and the above
simplification for wave kinematics in Eq. 2.21, we obtain:
F = cc p ? b2f1(2Jb) ij + a p b2 i f2(AJb)
+Cdpb?1l1I +pgV (2.22)

17
The magnitude of /at may be taken as the wave celerity c when the plate is partially
submerged, and zero when it is fully submerged or completely above the water surface.
However, this highlights a difficulty with the force formulation that has been proposed, in
that the corresponding term falling abruptly to zero as the plate becomes fully submerged
because of this abrupt change in /3t. In fact, the actual added mass is expected to vary
so as to give rise to a more gradual variation of this term. Based on the foregoing, the
variation F in Eq. 2.8 is modified by replacing JAJ& with a velocity c’ which is constant
and equal to wave celerity c during partial submergence (i.e. from to to t1); and then
assumed to fall linearly from c at time t1 to zero at time tm. This variation is sketched in
Fig. 2.3(c) and is introduced simply as a device to avoid the abrupt fall in F.
Then Eq. 2.22 may be re-written as
F = a p b2f1(X/b) T) + a p b2 i c’f2QJb)
+pgV (2.23)
where
c for to < t < t1; (i.e. ij > 0)
= c[t2 +t1- 2t]
for ti <t< (ti+t2)
(i.e. ij 0)
0 otherwise
A possible variation of the added mass force is sketched in Fig. 2.3(d) along with the
other three components. The total vertical force predicted resulting from the superposition
is shown in Fig. 2.3(e) along with the actual total vertical force.
In applying Eq. 2.23, some attention should be given to the determination of the
functions f1 () andf2Q. Tabulated values of the added mass for the three-dimensional case
of different length to width ratios are given by Sarpkaya and Isaacson (1981) and are
reported in Table 2.1. The two-dimensional limits of infinite width or length correspond
18
respectively tof1(?/b) - (?Jb) (so that m = o it b) as (?Jb) -4 0; andf1QJb) —> 1 (so
that m = x it ? b2) as (2Jb) — oo A suitable function f1() is fitted to this data and used in
Eq. 2.23. Thus, the function f1() and f2() are given by:
f1(X/b) = (XJb) exp [- 0.53 (AJb)088] + 0.1E[QJb) - 2.0] (2.24)
f2(A/b) = 2.0 - [0.53 ()O.88] f1(A/b) + 0.25 v[ (A/b) - 1.5] (2.25)
1 0 for (A/b) < 2.0where
L. 1 for (A/b) 2.0
for(A/b)<1.5
I. 1 for (A/b) 1.5.
Figure 2.4 is a plot indicating the variation of the added mass functions based on the
tabulated values of Table 2.1, and those based on Eqs. 2.24 and 2.25.
Due to the complicated flow around the plate and the associated uncertainty relating to
the use of Eq. 2.7 for the added mass, a simpler alternative based on the two-dimensional
case of infinite width may instead be adopted. The two-dimensional limit A/b —* 0
corresponds tof1(AIb) —* (A/b) so that Eq. 2.7 would be replaced by:
m = xpA2b (2.26)
This leads to Eq. 2.23 being replaced by:
F = cxp??bij + 2opAc’bi +1CdpAb1jIiI + pgV (2.27)
It is illustrative to consider the variation of added mass with the plate aspect ratio.
Fig. 2.5 indicates such a variation for arbitrary values of o, 1 and 3 for Eq. 2.23 and 0.5
and 0.7 for the simpler added mass model given by Eq. 2.26.

19
2.3 Dynamic Response of SDOF System
A formulation of the vertical force on a horizontal plate has been presented in the previous
section assuming that the plate and the load-cell assembly act as a fixed structure.
However, in almost all cases the dynamic response of the structure and its measuring
system occur to some extent, and influence the force that is measured, particularly under
impulsive loading. An estimation of the effect of this on the measured force is of interest
and may be made on the basis of a simple analysis of single degree of freedom (SDOF)
system subjected to impact loading (e.g. Isaacson and Prasad, 1993). The plate and load-
cell assembly is modelled as a SDOF system with a mass M, stiffness K and damping
coefficient C as indicated schematically in Fig. 2.6. The stiffness K is related to the
stiffnesses of each of the load-cells placed at two supports. The equation of motion of the
system when subjected to a time varying load F(t), is given as:
Mü+Cu+Ku=F(t) (2.28)
where u, i.t and ü are the instantaneous plate displacement, velocity and acceleration
respectively. The natural frequency o and the damping ratio of the system are defined
as o = J K/M and = C/2Mo. The response u(t) of the system starting from rest is
given by:
u(t) = $F(t) en(tt) sin[d(t-t)] dt (2.29)Moj
where 0d is the damped natural frequency of the assembly defined as 0d = w[i2, and t
is a variable of integration.
The force F(t) is the applied vertical force as given in either Eq. 2.23 or Eq. 2.27 and it
is composed of force components given in Eq. 2.21. However, the force transmitted Ft(t)

20
to the load-cell (i.e. measured by the load-cell) at the supports is proportional to the
stiffness of the load-cell, (with damping neglected) and is given by:
F(t) = K u(t) (2.30)
The SDOF system is now considered to be subjected to an idealized load, F(t) given as a
triangular function as indicated in Fig. 2.7. F(t) increases linearly to a peak value of F0 in a
rise-time Tr and then drops linearly to zero in a decay-time Td. The complete response
history of the system can be determined using the Eq. 2.29 for the given triangular pulse
load (e.g. Humar, 1990).
Isaacson and Prasad (1993) obtained a closed-form solution for the SDOF system
identifying the peak force F0 immediately after the impact and the associated rise time T as
important parameters, and presented a set of characteristic curves describing these as
indicated in Fig. 2.8. In the figure, Ft0 is the peak measured force, F0 is the peak applied
force, Tm is the rise-time associated with measured force, Tr is the rise-time associated with
the applied force, and T = 2ic/o1,is the natural period of the system. The influence of
dynamic characteristics on the peak measured force Ft0 and T can readily be estimated
from the figure.

21
Chapter 3
Experimental Investigation
3.1 Introduction
As mentioned earlier, objectives of the present investigation are to study the hydrodynamics
of the impact process and to relate the important parameters of the loading to those that
govern the process. To this end, a series of experiments was carried out at the Hydraulics
Laboratory of the Civil Engineering Department, University of British Columbia, and this
chapter gives a detailed account of the experimental investigation.
3.2 The Plate
An important aspect of the force measurement relates to the requirement of providing an
accurate measurement of the external force acting on the plate, without including any
extraneous effects due to the dynamic response of the test setup. Because of this
requirement, the plate and load-cell assembly should have a high natural frequency in
comparison to dominant loading frequencies. There are two principal modes of vibration
which may affect the force measurement; one corresponding to a first mode beam vibration
and the other to the whole assembly vibrating as a lumped mass supported by the load
cells. Because of this, the beam should be as stiff as possible, the overall mass supported
by the load-cells should be minimized, and the load-cell should be sufficiently stiff.
Bearing these considerations in mind, a plate model was designed to be stiff enough to
approximate a rigid body, and at the same time to be as thin as possible so as to simulate a

22
thin plate. Photographs of the test assembly are shown in Fig. 3.1, and a sketch of the
experimental set-up is provided in Fig. 3.2. The plate assembly was designed as a pinned
beam supported at two points and with a large overhang on the upwave side so as to
minimize the interference of the load-cells and plate supports during the initial
submergence. The plate is constructed of acrylic, and is 20 cm wide, 60 cm long and
6.25 mm thick. Two aluminum angles are fixed above the plate to increase its rigidity. A
small gap between the plate and the angles allows overtopped water to drain freely. Pinned
supports are made of two bearings attached to the inner face of the angle. Aluminum shafts
through these bearings connect the load-cell and support rod to the stiffener angles. These
supports are at 30.0 cm and 54.5 cm away from the leading edge of the plate. The
supporting rods are threaded and are fixed by nuts to a longitudinal steel box section 5 cm
high x 7.5 cm wide. The box section is aligned in such a way that its longitudinal centre-
line coincides with that of the flume. It is bolted to steel cross-channels which rested on the
top of the flume side-wall and was clamped to the flume walls. The level of the plate was
adjusted by lengthening or shortening the part of the rods between the supporting
longitudinal channel and the load-cell. By this arrangement, vertical forces were measured
by the load-cells at two supports. Since the plate is very thin, and the front end is beveled,
the horizontal wave force on the plate during wave impact is neglected.
3.3 Wave Flume and Generator
A sketch of the Hydraulics Laboratory wave flume is shown in Figure 3.3. The wave
flume measures 20 m long x 0.6 m wide x 0.75 m deep. An artificial beach is located at
one end to reduce wave reflection. Waves are generated by a single paddle wave actuator
located at the upwave end. The generator is controlled by a DEC VAXstation-3200
minicomputer using the GEDAP software package developed by the National Research
Council, Canada, (NRC). The generator is capable of producing wave heights up to 30 cm
23
and wave periods as low as 0.5 sec. In the present study, regular waves of heights ranging
from 3.0 to 17.5 cm and periods ranging from 0.8 to 2.0 sec. were used. During each of
these tests, water depth was maintained at 0.55 m.
3.4 Control and Data Acquisition
The GEDAP general purpose software package was used extensively during all stages of
the experimental investigation. This software package is available for the analysis and
management of laboratory data, including real-time experimental control and data-
acquisition functions. GEDAP is a fully-integrated, modular system which is linked
together by a common data file structure. GEDAP maintains a standard data file format so
that any GEDAP program is able to process data generated by any other GEDAP program.
This package also includes an extensive set of data analysis programs so that most
laboratory projects can be handled with little or no project-specific programming. An
attractive feature is the fully-integrated interactive graphics capability, such that results can
be conveniently examined at any stage of the data analysis process. It also includes an
extensive collection of utility packages, which consist of a data manipulation routine, a
frequency domain analysis routine, and statistical and time-domain analysis routines. In
particular, the program RTC_SIG generates the control signal necessary to drive the wave
generator, and the routine RTC_DAS reads the data acquisition unit channels and stores the
information in GEDAP binary format compatible with other GEDAP utility programs.
3.5 Measurements
The water surface elevation and the associated vertical force were required to be measured
for each test. The vertical forces at two supports were measured using load-cells. The
selection of the load-cells is based primarily on considerations of sensitivity, load range and
stiffness requirements. Two axial ‘S’ type load-cells (Interface SSM 500) have been used

24
in the present study. These work on the principle of flexure of the central limb of an ‘S’
sensed by precision strain gage circuitry. Each load-cell has a load capacity of 500 lb
(2.2 kN) and an axial stiffness of 4.9 kN/mm, with a sensitivity of 15 iVfN for an
excitation of 10 V. The output voltage of the load-cells are amplified by a Pacific
Instruments Model 8255 Transducer Condition Amplifier. An amplification of 1000 was
found to be adequate to obtain a reasonably good output to noise ratio. A low-pass filter
with a cut-off frequency of 1 kHz was also used. This amplified filtered signal was
transmitted to an analog-to-digital converter. Based on the Nyquist criterion, a sampling
rate of 2.5 kHz was selected.
Capacitance type ‘bow string’ probes were used to measure the water surface elevation.
Each probe is made up of a taut loop of wire on a light metal ‘C’ frame and has a linearity
better than 98.5% and a resolution better than 1 mm.
3.6 Experimental Procedures
The experiments were carried out in two parts. In the first part, waves were generated with
the plate absent, and water surface elevation measurements were carried out using probes
placed at two locations (x = 0 cm) and (x = 60 cm) along the centre-line of the plate. Due
to a limitation of the RTC_DAS package, a sampling rate of 2.5 kHz was used for both
force as well as water surface elevation data measurements. Previous tests have indicated
that the repeatability of a particular wave train over separate experiments is very good
(Isaacson & Prasad, 1993), so that the surface elevation with the plate absent and the forces
on the plate were measured in separate stages. In the second stage, the wave probes were
removed and the plate assembly was installed in the flume. Waves corresponding to the
same stored wave signals were repeated and the vertical forces on the plate were recorded at
a sampling rate of 2.5 kHz. A video record was also obtained for each experiment.
Experiments were carried out for five different elevations of plate from 0 to 25 mm, in

25
combination with three wave steepness values and four wave periods. A constant water
depth of 0.55 m was maintained during the experiment. Table 3.1 lists the different
incident wave conditions used in the investigation.
During the second part of this investigation, video records were obtained using a normal
speed camcorder. When the force data sampling was initiated, a switch was also triggered
to light up the light emitting diode at the same time instant so as to synchronize the time
base of the film with that of vertical force and the free surface elevation records.
The video records were used to study the impact process qualitatively and thereby to
access the effects of the assumptions made, and in particular to assess the importance of
wave profile deformation, air entrapment, wave overtopping effects, and water curtaining
problems due to drainage between each event of wave impact.
3.7 Dynamic Characteristics of the Assembly
After calibrating the load-cells for static loads, free vibration tests of the plate were
conducted both in air as well as for a fully submerged condition. In both cases, a step load
was applied to the plate assembly by the sudden release of a load carried by a thin steel
single stranded wire. This was achieved by cutting-off the wire using an acetylene torch.
The free vibration traces were recorded for both the load-cells A and B indicated in
Fig. 3.2. The recorded force time histories and the corresponding spectral densities for the
plate in air and fully submerged condition are shown in Fig. 3.5 and 3.6 respectively.
Figure 3.5 indicates that for vibrations in air the plate response has widely distributed
frequencies with a predominant frequency of approximately 125 Hz for both load-cells. It
is informative to study the initial stages of an impact event just after releasing the step load.
Consider the free vibration trace for the load-cell A as shown in Fig. 3.5(a). The first peak
is observed to occur 5 msec after the step load release, indicating the transient response

26
ability of the assembly. The high frequency component then disappears and lower
vibration amplitudes with a frequency of approximately 62.5 Hz become dominant, and
ultimately the load-cell stops vibrating after 0.6 sec since the release of the step load. The
damping ratio can be evaluated from the above trace using the following relation:
= D+42n2(3.1)
where Df = ifl[Pm/Pm+nl, and p and Pm+n are the amplitudes of the free vibration force
trace measured after n and (m+n) cycles respectively. The average damping ratio was
found to be 2.7% in air. Similar features were found from the analysis of the free vibration
trace for load-cell B.
Apart from free vibration tests in air, the plate and load-cell assembly were also tested
for free vibrations under a fully submerged situation so as to obtain similar characteristics
for step load releases (Fig. 3.6(a)). For both load-cells A and B, the traces are more or less
smooth and indicate a single dominant oscillation frequency. The first peak is observed at
10 msec and the system comes to rest 1.0 sec after the release of the load. The average
damping ratio for this submerged condition was found to be 5.3%. Figure 3.6(b) shows
the variance spectral density of the free vibration trace. It indicates that the natural
frequency for the submerged condition reduces to approximately 25 Hz.
As explained in Section 2.3, Fig. 2.8 may be used to estimate the influence of the
system characteristics on the measured force and associated rise-time. From the
preliminary experimental results, the minimum rise-time was found to be not less than 100
msec. And with the natural period of the system taken to be equal to 1/125 sec, there
appears to be no noticeable amplification in the peak value of the measured force and the
rise-time. The natural period of the system is taken to be the one that corresponds to the

27
tests conducted in air since the preliminary tests indicated that the impact occurs just before
complete submergence of the plate.
3.8 Data Processing
The first step in data analysis involves filtering the measured data to remove noise in the
records. One of the causes of noise may be due to electromagnetic frequency at 60 Hz.
Another would be due to the system response itself, as discussed in sections 3.2 and 3.7.
On the amplifier, a low-pass filter was used with a cut-off frequency of 1000 Hz. The
force data from two the load-cells were first plotted to observe the noise present in the
records. The GEDAP filtering program FILTW was used to filter the data. Several levels
of cut-off frequency ranging from 500 to as low as 5 Hz were used to examine the effect on
the peak force. Cut-off frequencies below 10 Hz show considerable smoothening of the
force peak and loss of information, and it was decided to set the cut-off frequency at 15
Hz. As an illustration of the low-pass filter that was adopted, Fig. 3.7 shows
corresponding unfiltered and filtered force records.
A static analysis was applied to obtain the vertical force and its line of action in the
manner indicated in Appendix A. Figure Al is a sketch of free body diagram of the plate
represented as pinned rigid beam. From this analysis, the total vertical force and its line of
action were obtained and are illustrated in Fig. 3.8 for the case of unfiltered signals and
filtered signals.
In a similar way, the wave records were filtered and resampled at 10 Hz since such a
high sampling rate is unnecessary for a slowly varying signal. The GEDAP routines,
FILTW and RESAMPLE2 were used to filter and resample the wave records. Once the
vertical force from the filtered records are available along with the resampled wave profile,
the remaining analysis was carried out as explained below. It was decided to study only
one slamming event for each test and therefore only one slamming cycle is selected from a

28
4 sec record as shown in Fig. 3.9. The instant of slamming to is determined from the
measured water surface elevation o and the known plate clearance. This method was
found to be consistent and reliable for all the experimental results. The wave kinematics
were evaluated half way along the instantaneous wetted length measured from the leading
edge of the plate, as mentioned in the Section 2.2.1. The buoyancy force was evaluated
based on the displaced volume of the water by the plate and load—cell assembly as discussed
in Section 2.2, and is assumed to vary sinusoidally for the duration of submergence with
the peak buoyancy force occurring at t = t. Various other parameters such as peak
upward and downward forces, their lines of action, times of occurrence and associated
wetted lengths were then determined. The vertical force was predicted based on the linear
wave theory for different wave conditions tested and a comparison of the measured and
observed force was carried out. A flow chart of the procedure is given in Fig. 3.10.

29
Chapter 4
Results and Discussion
The results of the experimental and analytical investigation are presented and discussed
in this chapter. The first part primarily describes the results from the tests with regular
non-breaking waves of different heights and periods, and different plate elevations. The
important parameters thereby estimated correspond to the maximum upward force, the
associated point of application, the rise-time, and the corresponding value of the wetted
length. Similar quantities relating to maximum downward force are also presented. A brief
qualitative analysis of the video records included is also presented, with a focus on the
physical process involved and the related departure of the theory in predicting the vertical
force is discussed.
The application of the two analytical models (Eqs. 2.23 and 2.27) for estimating the
vertical force is discussed, and associated discrepancies are identified. Finally, a correction
factor for the added mass associated with each of these model is introduced, and its range
for different incident wave conditions is presented.
A total of 69 tests were carried out, corresponding to 5 plate elevations, 5 wave periods,
and 3 wave steepness. (Some of the 75 combinations of these three do not give rise to
immersion of the plate.) The plate elevations ranged from h = 0 to h = 2.5 cm; wave
periods ranged from 0.8 to 2.0 sec; and the wave heights for each wave period were
selected to correspond to steepness Hit 0.02, 0.03, and 0.04, such that the wave heights
are in the range of 3 to 17 cm.

30
4.1 Vertical Force
Figures 4.1 to 4.8 show the time histories of the vertical forces measured at two support
locations FA and FB, the total vertical force F, and the corresponding water surface
elevations ‘rio and r, at the leading and rear edges of the plate. The figures correspond to
eight different test conditions characterized by changes in wave steepness and plate
clearance. In these figures, t is the time measured from an arbitrary origin. As an aid to
interpreting results, these figures include horizontal and vertical lines indicating the plate
elevation and the corresponding instants of impact and complete submergence. On this
basis, the variation of wetted length 2(t) is also obtained.
Figures 4.1, 4.2 and 4.3 correspond to a plate clearance h = 0.8 cm and waves with
T 1.70 sec and H = 14.2, 10.5 and 6.8 cm respectively. As a wave advances past the
plate, the force increases quite gradually from the instant of water contact, exhibits a fairly
sharp maximum, and then varies more gradually over the remainder of the cycle, passing
through a noticeable minimum during the later stages of the event. The noticeable
maximum downward (i.e. negative) force which is present during the later portion of the
wave cycle is due to a suction associated with the water surface receding below the plate,
together with the weight of some overtopped water remaining above the plate.
Similarly, Figs. 4.4 and 4.5 correspond to a plate clearance h = 1.4 cm and waves with
T 1.70 sec and H = 14.2 cm and H = 10.5 cm respectively. These figures indicate a
sharper rise in force than for the case h = 0.8 cm. Finally, Figs. 4.6, 4.7 and 4.8
correspond to different clearances, h = 0, 1.4 and 2.5 cm respectively, with the same wave
condition T = 2.02 sec and H = 17.5 cm.
It is useful to study the slamming process with respect to the free surface elevation.
As mentioned already, horizontal lines in Figs. 4.1(a) - 4.8(a) indicate the plate elevation,
and the vertical lines indicate the instants of initial wave contact, complete submergence, the

31
onset of wave recession and complete wave recession. The time between the two lower
vertical lines indicate the duration over which a wave is in contact with the plate. Extending
these line to the force time histories F(t), the observed instant of impact agrees reasonably
well with the instant at which the wetted length starts rising from zero. It may be noticed
that the total force F before and after these points is non-zero even though the plate is
entirely in air. This may be attributed to the overtopped water draining from the top of the
plate. It can be observed that the water drains out completely for the wave of period T =
2.02 sec, so that then the force F is nearly zero as indicated in the Fig. 4.6(c). The time
between the upper two vertical lines indicate the duration for which the plate is completely
submerged. The intersection of two wave profiles ‘rio and ie shows the symmetric wave
profile with respect to support A (mid span location) along the plate length for that instant.
The total force F is positive indicating that the plate experiences an upward force which
exceeds the weight of the water above the plate.
Another interesting feature included in Figs. 4.1 - 4.8 relates to the time histories of the
line of action, s(t). The sharp changes in s are associated with F(t) passing through zero.
The force’s line of action initially moves away from the leading edge of the plate as
expected, but does not span the whole wave cycle. It moves abruptly from the leading
edge to the rear edge just after the occurrence of the symmetric wave profile along the
length. And during the wave recession era, s(t) again commences at the leading edge and
travels smoothly up to the mid span approximately.
The noticeable negative (i.e. downward) force, which is present during the later portion
of the wave cycle, is due to a suction associated with the water surface receding below the
plate, together with the weight of some water remaining above the plate. The negative
force seems to start just before the wave surface leaves the plate’s leading edge i.e. just

32
before time t2. As the wave recession progresses, the force F reaches a negative maximum
just before time t3. After time t3, the plate is in air and the force F drops gradually to zero.
4.2 Vertical Force and Incident Waves
Results relating to the force parameters have been grouped according to the dimensional
analysis indicated earlier and are listed in Table 4.1. These include the maximum upward
force Fp, its time of occurrence T, its point of application s, and the corresponding
wetted length X. The table also includes the maximum downward force Fm, its time of
occurrence T, and point of application 5m as well as the wetted length 2. The variations
of these values are studied as functions of relative clearance h/H, for various values of
wave steepness HIL and relative plate length £fL.
Maximum Force
Figure 4.9 indicates the variation of the peak upward force coefficient F/pgHbe as a
function of relative clearance h/H for various values of the relative plate length £/L and for
various ranges of wave steepness. As the relative clearance h/H approaches 0.5 the force
coefficient F/pgHb/ approaches zero. Also, the force coefficient increases as the relative
plate length £/L increases. Although, there is no significant change in the force coefficient
for the range of wave steepness used in the tests (HJL 0.0 16 0.041), it may be seen that
the trend of the which shows F/pgHb.e to decrease linearly with h/H is no longer observed
for the case of steeper waves.
Figure 4.10 indicates similar plots for the peak downward force coefficient Fm/pgHbe.
Figures 4.10(a), 4.10(b) and 4.10(c) indicate no systematic relationship, although
Fm/pgHb apparently remains constant for any change in h/H.

33
Duration of Submergence
Figure 4.11 is a plot of a dimensionless duration of partial submergence, TIT where
T =t1-t0. This parameter is important since it indicates the time required for a wave to
completely submerge the plate at a known elevation above the mean water level, and
consequently influences the occurrence of the peak upward force predicted by the analytical
models presented. The figure shows a fairly constant value of T/T for increasing relative
plate clearance h/H. As the steepness decreases, (Figs. 4.11(a) - 4.11(c)), T)T decreases
for higher values of h/H.
Similarly, Fig. 4.12 is plot of a dimensionless duration relating to complete
submergence T/T, where T = t2 - ti. This parameter indicates the duration for which the
plate remains submerged and influences the span of gradual variation of the added mass
force Fa2. As expected, an increasing relative clearance h/H leads to a decreasing value of
T/T.
Times of Occurrence
Figure 4.13 shows the relative rise-time T/T associated with the peak upward force, and
Fig. 4.14 shows corresponding results relating to Tm/T. Figure 4.13 exhibits a fair degree
of scatter so that there are no particularly noticeable trend in there results. However, there
is some tendency for T/T to decrease with increasing h/H. On the other hand Fig. 4.14
shows a fairly clear trend for Tm/T to decrease with increasing h/H and with decreasing
ilL. The scatter in the rise-times may be attributed to factors such as air-entrapment, spray
and splash effects at the instant of impact, plate surface roughness and structural vibration.
Line of Action
Figure 4.15 shows the non-dimensionalised line of action of the peak upward force sIL
plotted against the relative clearance h/H for various values of relative plate length and

34
wave steepness. There is considerable scatter in the results once more such that the relative
plate length ilL and wave steepness H/L appear to have no significant influence on sfL,
except that s/L increases with an increasing h/H.
Figure 4.16 indicates corresponding results for Sm/L. In this case, it is interesting to
note that the for all ranges of steepness tested, there seems to be a linear trend between
SmIL and h/H.
Wetted Length
In Fig. 4.17, the dimensionless wetted length 2/L associated with the peak upward force
is plotted as a function of relative clearance hJH, with HIL and ilL as parameters. It is
observed that for lower value of the ilL, the seems to reduce as h/H increases.
Corresponding results for m/L are shown in Fig. 4.18 and indicate no particular
correlation.
From the above, it can be seen that in general as h/H increases all impact parameters
decrease. The effect of steepness is not noticeable, possibly because of the small range
considered in the tests.
4.3 Video Records
In order to complement the results presented in the previous section, a qualitative study of
the impact process of the flow past the plate has also been made on the basis of the video
records.
Figure 4.19 shows photographs indicating the wave flow past the plate associated with a
distortion in the shape of the wave profile. Figure 4.19(a) was taken at the instant of
complete submergence and shows some air entrapment at the rear end as the plate

35
completely submerges, and Figure 4.19(b) was taken just after the wave passes the plate
and shows the overtopped water draining from the plate.
The video records have been examined in order to assess further the interaction process,
and Fig. 20 shows several frames corresponding to various stages of slamming process.
In Fig. 4.20(a), the wave profile deforms considerably during the initial penetration of the
plate below the water surface. The wave progresses over the plate without too much
further disturbance to its profile until the plate is completely submerged [see Fig. 4.20(b)].
Figures 4.20(c) and 4.20(d) show successive views during the recession stage, during
which water drains from the plate including some disturbance to the wave profile. Air
entrainment between the plate and the water surface during this stage is noticeable.
The irregularities highlighted above in conjunction with uncontrollable parameters such
as the plate roughness, plate orientation, and structural vibrations, influence the force
measured and contribute to the scatter observed in the force results.
4.4 Force Predictions
In the present section, a comparison of the predictions of the two analytical models of the
vertical force given by Eq. 2.23 and Eq. 2.27 with the experimental measurements is
presented and discussed.
The steps involved in the computational aspects of the analytical models are as follows.
Eq. 2.23 is evaluated form the instant of initial contact until the instant of complete
submergence. This is followed by a computation of the force during complete
submergence. Finally, Eq. 2.23 is evaluated for the period of wave recession. Parameters
relating to this formulation, which are computed at each time step include the wetted length
2 and the wave kinematics i and ij. 2. is obtained by evaluating Eq. 2.20, and r and j are
determined at a point half way along the instantaneous wetted length on the basis of

36
Eqs. 2.18 and 2.19. A similar procedure is adopted for the simpler analytical model given
by Eq. 2.27.
Figures 4.21 and 4.22 show the variation of the dimensionless vertical force F/pgbHe
over one wave cycle for HJL = 0.04; ilL = 0.146 and for 2 two plate clearances, h/H = 0
and 0.15, and compare the predictions of the analytical models given by Eqs. 2.23 and
2.27. In evaluating these equations a range of suitable a values ranging from 1 to 3 for
Eq. 2.23 and 0.5 to 0.7 for Eq. 2.27 were assumed. From these figures it can be observed
that a noticeable difference of the force predicted by two models occur in the partially
submerged stage, with the model based on Eq. 2.23 indicating a faster rise than Eq. 2.27.
This is due to the different assumptions made in added mass variations with respect to
submergence [see also Fig. 2.51.
It is also of interest to consider the suitability of the analytical model in predicting the
vertical force variation, and a comparison of the force predicted on the basis of Eqs. 2.23
and 2.27 with a measured force record is made in following paragraphs. The added mass
constant a is selected so as to match the measured and predicted maximum forces.
Figure 4.23 provides a comparison of the measured and predicted force time histories
force the case h = 0 cm, T = 2.02 sec and H = 17.5 cm. The predicted force based on
Eq. 2.23 rises to a peak much earlier and drops to negative values faster then the observed
force. On the other hand, the force predicted on the basis of Eq. 2.27 reaches a maximum
during the partial submergence with a rise-time almost equal to the measured force and it
seems to follow the measured force reasonably well until the maximum force is reached.
Figure 4.24 compares the predicted and measured force for incident waves with
T = 1.68 sec, and H = 14.2 cm with the plate located at h = 0 cm. In this case, the rise
time of the predicted force based on Eq. 2.27 seems to be much smaller and significantly

37
deviates from the observed force. However, prediction based on Eq. 2.23 seems to deviate
more than that by Eq. 2.27.
Figure 4.25 is similar plot for the incident wave with T = 2.02 sec, H = 17.5 cm with
h = 1.4 cm. For the case of Eq. 2.27, although the predicted peak occurs slightly later
than that for the measured force, it follows the observed force reasonably well. The
prediction based on Eq. 2.23 does not show any improvement compared to that based on
Eq. 2.27.
Form all the three figures, it is observed that the predicted forces deviate significantly
from the observed force during the stage of complete submergence followed by wave
recession.
As mentioned earlier, the factor o of Eqs. 2.23 and 2.27 has been evaluated by
matching the measured and predicted maximum upward force. The results for a selected
number of tests are listed in Table 4.2. These correspond to 9 tests with h = 0, two tests
with h = 1.4 cm and one test with h = 2.5 cm. For all the 12 selected tests, the factor a is
in the range of 1.2 to 3.1 on the basis of Eq. 2.23, and is in the range of 0.5 to 0.7 on the
basis of Eq. 2.27. Thus, a based on Eq. 2.27 is approximately equal to irI4, which
corresponds to the theoretical value of a plate in an infinite flow situation, so that there is no
requirement of any reduction factor. On the other hand, the values of a based on Eq. 2.23
seem to exhibit considerable scatter.

38
Chapter 5
Conclusions and Recommendations
The primary objective of this study was to examine experimentally the vertical force due to
regular non-breaking waves interacting with a fixed horizontal plate located near the still
water level. Force time histories were analyzed to obtain peak upward and downward
forces, their times of occurrence, their lines of action and the associated wetted length of
the plate. Also, the free surface elevation at the leading and rear edges of the plate were
recorded for different wave conditions with the plate absent. Two analytical models based
on a varying added mass of the submerged portion of the plate together with a drag and
buoyancy forces were used to predict the force on the plate, and a comparison of these
predictions with the experimental results was made.
The dependence of the various characteristics of the maximum and minimum forces on
the relative plate clearance h/H, wave steepness H/L and relative plate length £/L have been
examined and are indicated. Even though there is a considerable degree of scatter in the
results, some general conclusions may be made. The maximum upward force decreases
with increasing relative clearance of the plate h/H. And the peak upward force is higher for
larger value of relative plate length Lit. In the present study the wave steepness HIL was in
the range of 0.016 to 0.041 and is observed not to influence the peak upward force
noticeably. The maximum downward force seems to remain constant for increasing
relative clearance h/H. However, it shows similar variation as that of the peak upward
force for changes in relative plate length Lit and in wave steepness Hit. The rise-time
associated with the peak upward force shows considerable scatter. However, it is
observed that three is some tendency for Tjf to decrease with increasing h/H. On the
39
other hand, the dimensionless time of occurrence TmIT showed a decreasing trend for
increasing values of plate clearance. Also, for higher relative lengths, £/L, a higher Tm/T
was observed. For relative line of action, associated with both the F and Fm indicated
increasing trend for steeper waves and remained constant for less steep waves.
Summarily, the analysis indicated that the peak forces F and F and associated times of
occurrence decrease some what linearly with the increasing plate clearance.
The maximum upward force and associated rise-time can be predicted reasonably well
on the basis of the simpler hydrodynamic model given by Eq. 2.27, with the factor cx
ranging from 0.5 to 0.7. However, the predicted force deviates significantly from the
measured force after the occurrence of the peak upward force. This indicates the need for a
clearer understanding of the wave interaction with the plate during complete submergence
and recession stages.
Several avenues of further study may be suggested. Improvements may be made to
analytical I numerical models to predict the vertical force; and experiments relating to
irregular and breaking waves also need to be carried out.

40
References
Armand J. L., and R. Cointe, (1987), “Hydrodynamic impact analysis of a cylinder,”J. Offshore Mechanics and Arctic Engineering, ASME, Vol. 109, pp. 237 - 243.
Broughton, P., and E. Horn, (1987), “Ekofisk platform 214C: re-analysis due tosubsidence,” Proc. Institution of Civil Engineers, Part 1, Vol. 82, pp. 949 - 979.
Chan, E. S., and W. K. Melville, (1989), “Plunging wave forces on surface-piercingstructures,” J. Offshore Mechanics and Arctic Engineering, ASME, Vol. 111, pp. 93-130.
Chan, E. S., H. F. Cheong, and K. Y. H. Gin, (1991), “Wave impact loads on horizontalstructures in the splash zone,” Proc. 1st International Offshore and Polar EngineeringConference, Vol. 3, pp. 203 - 209
Chuang, S. L., (1967), “Experiments on slamming of wedge-shaped bodies with variabledead rise angle,” J. Ship Research, SNAME, Vol. 11, No. 4, pp. 190-198.
De Costa, S. L., and J. L. Scott, (1988), “Wave impact forces on the Jones Island eastdock, Milwaukee, Wisconsin,” Oceans, IEEE, pp. 1231-1238.
Denson, K. H., and M. S. Priest, (1971), “Wave pressure on the underside of a horizontalplatform,” Proc. Offshore Technology Conference, Houston, Texas, Paper No.OTC 1385, Vol. 1, pp. 555 - 570.
El Ghamry, 0. A., (1963), “Wave forces on a dock,” Report no. HEL-9-1, Inst. of Engg.Research, Hydraulic Engg. Lab., University of California, Berkeley, California.
Faltinsen 0., (1990), “Sea loads on ships and offshore structures,” Cambridge OceanTechnology Series, Cambridge University Press, Cambridge, UK.
French, J. A., (1969), “Wave uplift pressures on horizontal platforms,” Report no. KH-R19, Division of Engineering and Applied Science, California Institute of Technology,Pasadena, California.
Furudoi, T., and A. Murota, (1966), “Wave induced uplift forces acting on quay-aprons,”Technology Reports of Osaka University, Vol. 16, No. 734, pp. 605 - 616.
Greenhow, M., and Y. Li, (1987), “Added mass for circular cylinders near or penetratingfluid boundaries - review extension, and application to water-entry, -exit, and slamming,”Ocean Engineering, Vol. 14, No. 4, pp. 325 - 348.
Gudmestad, 0. T., and J. J. Connor, (1986), “Engineering approximation to nonlineardeep water waves,” Applied Ocean Research, Vol. 8, No. 2, pp. 76 - 88.
Humar, J. L., (1990), “Dynamics of structures,” Prentice Hall, Englewood, New Jersey.
Irajpanah, K., (1983), “Wave uplift force on horizontal platform,” Ph. D. Thesis, Univ. ofSouthern California, Los Angeles, California.
41
Isaacson, M., and S. Prasad, (1992), “Wave slamming on a horizontal circular cylinder,”Proc. Civil Engineering in the Oceans V, ASCE, College Station, Texas, pp. 652 - 666.
Isaacson, M., and S. Prasad, (1993), “Wave slamming on a horizontal circular cylinder,”Proc. 3rd International Offshore and Polar Engineering Conference, Singapore, Vol. 3,pp. 274-281.
Kaplan, P., and N. Silbert, (1976), “Impact on platform horizontal members in the splashzone,” Proc. Offshore Technology Conference, Houston, Texas, Paper No. OTC 2498,Vol. 1, pp. 749 - 758.
Kaplan, P., (1992), “Wave impact forces on offshore structures: re-examination and newinterpretations,” Proc. Offshore Technology Conference, Houston, Texas, PaperNo. OTC 6814, Vol. 1, pp. 79-88.
Lai, C. P., and J. J. Lee, (1989), “Interaction of finite amplitude waves with platforms ordocks,” J. Waterways, Port, Coastal and Ocean Engineering, ASCE, Vol. 115, No. 1,pp. 19-39.
Lamb, H., (1932), “Hydrodynamics,” 6th edition, Dover Publications, Inc., New York,N.Y.
Sarpkaya, T., (1978), “Wave impact loads on cylinders,” Proc. Offshore TechnologyConference, Houston, Texas, Paper No. OTC 3065, pp. 169-176.
Sarpkaya, T., and M. Isaacson, (1981), “Mechanics of wave forces on offshorestructures,” Van Nostrand Reinhold, New York, N.Y.
Szebehely, V. G., and M. K. Ochi, (1966), “Hydrodynamic impact and water entry,”Applied Mechanics Survey, ed. H. N. Abramson, et al., Spartan Books, MacMillan &Co. Ltd., pp. 951-957.
Tanimoto, K., and S. Takahashi, (1979), “Wave forces on a horizontal platform,” Proc.5th International Ocean Development Conference, Tokyo, Japan, Vol. Dl, pp. 29 - 38.
Toumazis, A. D., W. K. Shih, and K. A. Anastasiou, (1989), “Wave impact loading onhorizontal and vertical plates,” Proc. 23rd Congress, International Association ofHydraulicResearch, Ottawa, Canada, Vol. C, pp. 209 - 216.
Verhagen, J. H. G., (1967), “The impact of flat plate on a water surface,” J. ShipResearch, SNAME, Vol. 11, No. 4, pp. 211-223.
von Kármán, T., (1929), “The impact on seaplane floats during landing,” NationalAdvisory Committee forAeronautics, Technical Note No. 321.
Wagner, H., (1932), “Landing of Seaplanes,” National Advisory Committee forAeronautics, Technical Note No. 622.
Wang, H., (1967), “Estimating wave pressures on a horizontal pier,” Naval CivilEngineering Laboratory, Port Heneme, California, Technical Report No. R-546.
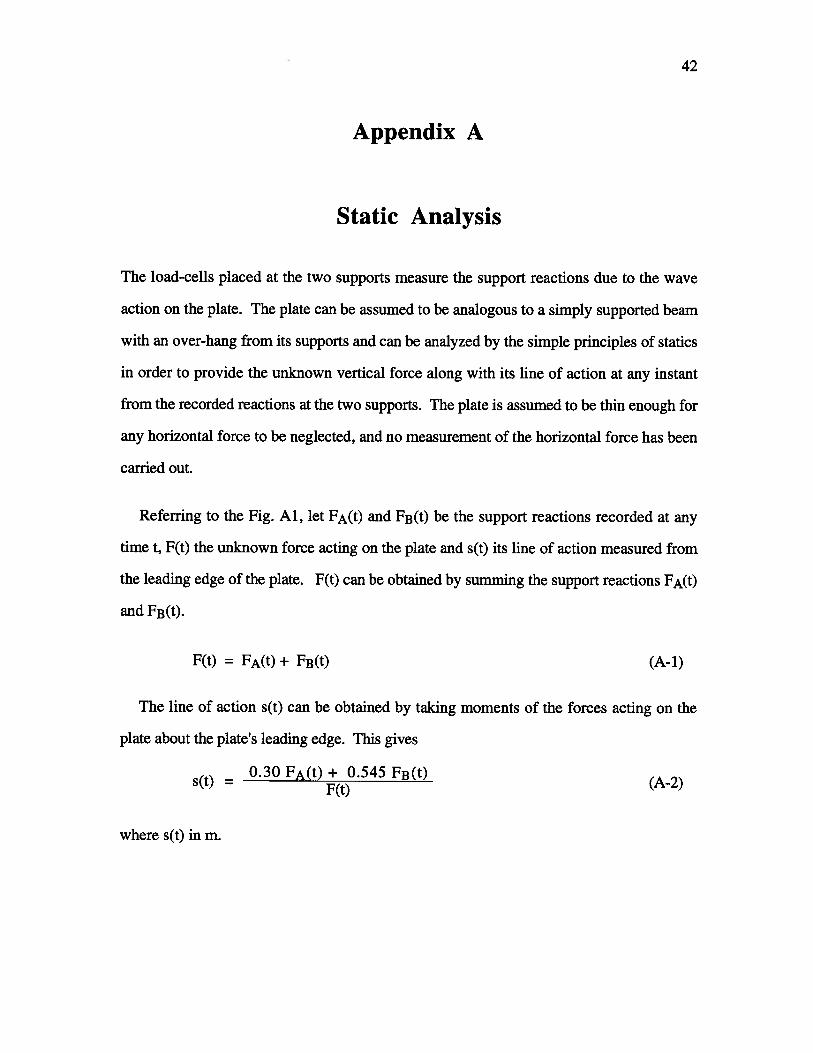
42
Appendix A
Static Analysis
The load-cells placed at the two supports measure the support reactions due to the wave
action on the plate. The plate can be assumed to be analogous to a simply supported beam
with an over-hang from its supports and can be analyzed by the simple principles of statics
in order to provide the unknown vertical force along with its line of action at any instant
from the recorded reactions at the two supports. The plate is assumed to be thin enough for
any horizontal force to be neglected, and no measurement of the horizontal force has been
carried out.
Referring to the Fig. Al, let FA(t) and FB(t) be the support reactions recorded at any
time t, F(t) the unknown force acting on the plate and s(t) its line of action measured from
the leading edge of the plate. F(t) can be obtained by summing the support reactions FA(t)
and FB(t).
F(t) = FA(t) + FB(t) (A-i)
The line of action s(t) can be obtained by taking moments of the forces acting on the
plate about the plate’s leading edge. This gives
— 0.30 FA(t) + 0.545 FB(t)A 2so
— F(t) —
where s(t) in m.

43
Table 2.1 Added mass constant for a thin rectangular plate.(Sarpkaya and Isaacson, 1981).
b/2. 131.00 0.579
1.25 0.642
1.59 0.704
2.00 0.757
2.50 0.801
4.00 0.872
5.00 0.897
8.00 0.934
10.00 0.94700 1.000
Flow past a thinrectangular plate
b -
m =
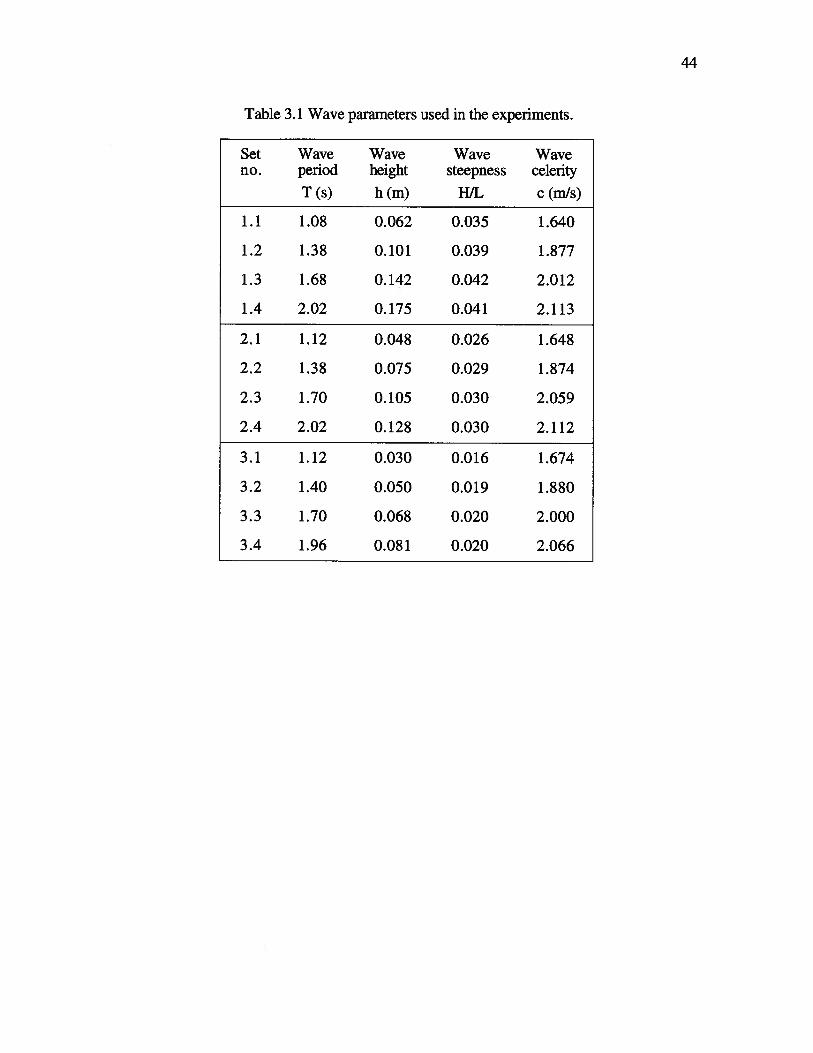
44
Table 3.1 Wave parameters used in the experiments.
Set Wave Wave Wave Waveno. period height steepness celerity
T(s) h(m) H/L c(mls)
1.1 1.08 0.062 0.035 1.640
1.2 1.38 0.101 0.039 1.877
1.3 1.68 0.142 0.042 2.012
1.4 2.02 0.175 0.041 2.113
2.1 1.12 0.048 0.026 1.648
2.2 1.38 0.075 0.029 1.874
2.3 1.70 0.105 0.030 2.059
2.4 2.02 0.128 0.030 2.112
3.1 1.12 0.030 0.016 1.674
3.2 1.40 0.050 0.019 1.880
3.3 1.70 0.068 0.020 2.000
3.4 1.96 0.081 0.020 2.066
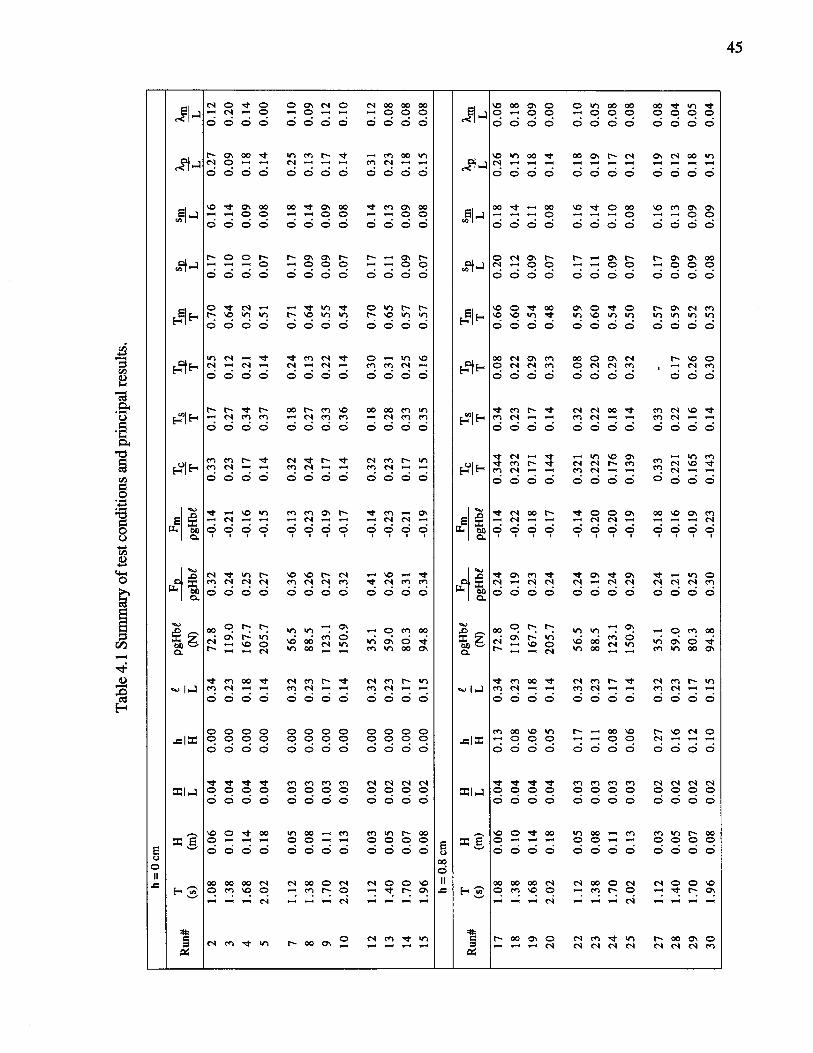
Tab
le4.
1Su
mm
ary
ofte
stco
nditi
ons
and
prin
cipa
lres
ults
.
h=
0cm
Run
#T
HH
h£
pgH
btF
Fm‘r
‘r
-j-
Sflj
(s)
(m)
LH
L(N
)pgH
bp
gH
bT
TT
TL
LL
L2
1.08
0.06
0.04
0.00
0.34
72.8
0.32
-0.1
40.
330.
170.
250.
700.
170.
160.
270.
12
31.
380.
100.
040.
000.
2311
9.0
0.24
-0.2
10.
230.
270.
120.
640.
100.
140.
090.
20
41.
680.
140.
040.
000.
1816
7.7
0.25
-0.1
60.
170.
340.
210.
520.
100.
090.
180.
14
52.
020.
180.
040.
000.
1420
5.7
0.27
-0.1
50.
140.
370.
140.
510.
070.
080.
140.
00
71.
120.
050.
030.
000.
3256
.50.
36-0
.13
0.32
0.18
0.24
0.71
0.17
0.18
0.25
0.10
81.
380.
080.
030.
000.
2388
.50.
26-0
.23
0.24
0.27
0.13
0.64
0.09
0.14
0.13
0.09
91.
700.
110.
030.
000.
1712
3.1
0.27
-0.1
90.
170.
330.
220.
550.
090.
090.
170.
12
102.
020.
130.
030.
000.
1415
0.9
0.32
-0.1
70.
140.
360.
140.
540.
070.
080.
140.
10
121.
120.
030.
020.
000.
3235
.10.
41-0
.14
0.32
0.18
0.30
0.70
0.17
0.14
0.31
0.12
131.
400.
050.
020.
000.
2359
.00.
26-0
.23
0.23
0.28
0.31
0.65
0.11
0.13
0.23
0.08
141.
700.
070.
020.
000.
1780
.30.
31-0
.21
0.17
0.33
0.25
0.57
0.09
0.09
0.18
0.08
151.
960.
080.
020.
000.
1594
.80.
34-0
.19
0.15
0.35
0.16
0,57
0.07
0.08
0.15
0.08
h=
0.8
cm
Run
#T
HH
h£
pgH
bl?
FFm
‘rc
rn(s
)(m
)L
HL
(N)
pgH
bpg
Hbe
TT
TT
LL
LL
171.
080.
060.
040.
130.
3472
.80.
24-0
.14
0.34
40.
340.
080.
660.
200.
180.
260.
06
181.
380.
100.
040.
080.
2311
9.0
0.19
-0.2
20.
232
0.23
0.22
0.60
0.12
0.14
0.15
0.18
191.
680.
140.
040.
060.
1816
7.7
0.23
-0.1
80.
171
0.17
0.29
0.54
0.09
0.11
0.18
0.09
202.
020.
180.
040.
050.
1420
5.7
0.24
-0.1
70.
144
0.14
0.33
0.48
0.07
0.08
0.14
0.00
221.
120.
050.
030.
170.
3256
.50.
24-0
.14
0.32
10.
320.
080.
590.
170.
160.
180.
10
231.
380.
080.
030.
110.
2388
.50.
19-0
.20
0.22
50.
220.
200.
600.
110.
140.
190.
05
241.
700.
110.
030.
080.
1712
3.1
0.24
-0.2
00.
176
0.18
0.29
0.54
0.09
0.10
0.17
0.08
252.
020.
130.
030.
060.
1415
0.9
0.29
-0.1
90.
139
0.14
0.32
0.50
0.07
0.08
0.12
0.08
271.
120.
030.
020.
270,
3235
.10.
24-0
.18
0.33
0.33
-0.
570.
170.
160.
190.
08
281.
400.
050.
020.
160.
2359
.00.
21-0
,16
0.22
10.
220.
170.
590.
090.
130.
120.
04
291.
700.
070.
020.
120.
1780
.30.
25-0
.19
0.16
50.
160.
260.
520.
090.
090.
180.
05
301.
960.
080.
020.
100.
1594
.80.
30-0
.23
0.14
30.
140.
300.
530.
080.
090.
150.
04
U’

Tab
le4.
1(c
ontd
.)Su
mm
ary
ofte
stco
nditi
ons
and
prin
cipa
lre
sults
.
h=
1.4
cm
Run
#T
HH
h£
pgH
bF
Fm‘r
(s)
(m)
LH
L(N
)p
gH
bpgH
bT
TT
TL
LL
321.
080.
060.
040.
230.
3472
.80.
20-0
.11
0.33
0.02
0.16
0.60
0.17
0.17
0.18
0.06
331.
380.
100.
040.
140.
2311
9.0
0.19
-0.1
80.
220.
180.
190.
570.
120.
150.
140.
16
341.
680.
140.
040.
100.
1816
7.7
0.25
-0.1
70.
180.
260.
150.
520.
090.
110.
160.
11
352.
020.
180.
040.
080.
1420
5.7
0.24
-0.1
70.
140.
310.
110.
460.
070.
080.
140.
00
371.
120.
050.
030.
290.
3256
.50.
19-0
.12
0.29
-0.
150.
540.
180.
170.
150.
09
381.
380.
080.
030.
190.
2388
.50.
15-0
.16
0.22
0.09
0.30
0.51
0.14
0.11
0.21
0.10
391.
700,
110.
030.
130.
1712
3.1
0,24
-0.1
80.
180.
240.
150.
490.
080.
090.
150.
09
402.
020.
130.
030.
110.
1415
0.9
0.24
-0.1
90.
140.
300.
120.
490.
070.
080.
120.
08
421.
400.
050.
020.
280.
2359
.00.
13-0
.13
0.23
0.09
0.28
0.52
0.13
0.14
0.23
0.00
431.
700.
070.
020.
210,
1780
.30.
21-0
.15
0.17
0.19
0.12
0.48
0.08
0.09
0.13
0.07
441.
960.
080.
020.
170.
1594
.80.
23-0
.21
0.15
0.24
0.13
0.50
0.08
0.09
0.14
0.04
h=
1.8c
m
Run
#T
HH
hpg
Hbi
FFm
‘riu
J2.
iU(s
)(m
)L
HL
(N)
pg
Hb
pgH
btT
TT
TL
LL
L
461.
080.
060.
040.
290.
3472
.80.
18-0
.09
0.31
-0.
150.
580.
190.
190.
080.
03
471.
380.
100.
040.
180.
2311
9.0
0.15
-0.1
70.
230.
150.
210.
550.
120.
150.
150.
16
492.
020.
180.
040.
100.
1420
5.7
0.21
-0.1
70.
130.
300.
110.
460.
070.
080.
140.
00
511.
120.
050.
030.
380.
3256
.50.
10-0
.12
0.23
-0.
120.
430.
190.
170.
110.
11
521.
380.
080.
030.
240.
2388
.50.
14-0
.14
0.25
0.09
0,23
0.50
0.13
0.13
0.22
0.08
531.
700.
110.
030.
170.
1712
3,1
0.24
-0.1
60.
160.
230.
150.
480.
090.
090.
150.
07
542.
020.
130.
030.
140.
1415
0.9
0.22
-0.2
00.
120.
270.
070.
470.
050.
080.
080.
08
561.
400.
050.
020.
360.
2359
.00.
09-0
.13
0.24
0.01
0.26
0.45
0.18
0.12
0.21
-
571.
700.
070.
020.
260.
1780
.30.
21-0
.13
0.18
0.16
0.12
0.43
0.09
0.09
0.14
0.06
581.
960.
080.
020.
220.
1594
.80.
20-0
.19
0.15
0.21
0.05
0.44
0.05
0.08
0.05
0.05

Tab
le4.
1(c
ontd
.)Su
mm
ary
ofte
stco
nditi
ons
and
prin
cipa
l res
ults
.
h=
2.5
cm
Run
#T
HH
hpgH
bF
FmI
rn(s
)(m
)L
HL
(N)
pgH
bpg
Hbe
TT
TT
LL
LL
601.
080.
060.
040.
400.
3472
.80.
07-0
.08
0.20
-0.
020.
39-
0.06
0.17
0.00
611.
380.
100.
040.
250.
2311
9.0
0.18
-0.1
40.
220.
100.
220.
470.
160.
150.
140.
1962
1.68
0.14
0.04
0.18
0.18
167.
70.
28-0
.15
0.17
0.23
0.15
0.46
0.16
0.10
0.10
0.10
632.
020.
180.
040.
140.
1420
5.7
0.20
-0.1
70.
130.
280.
050.
450.
110.
040,
090.
00
661.
380.
080.
030.
330.
2388
.50.
15-0
.12
0.23
0.04
0.25
0.46
0.23
0.17
0.13
0.06
671.
700.
110.
030.
240.
1712
3.1
0.21
-0.1
30.
180.
160.
140.
440.
130.
090.
090.
0868
2.02
0.13
0.03
0.20
0.14
150.
90.
20-0
.19
0.13
0.25
0.06
0.4
40.
050.
040.
080.
07
691.
960.
080.
020.
310,
1594
.80.
16-0
.14
0.15
0.15
0.05
0.41
0.02
0.05
0.08
0.05

48
Table 4.2 Computed values of the factor a in selected tests.
R Wave Wave F a aNo. (? (Eq. 2.23) (Eq. 2.27)
h = 0.0 cm
3 1.38 0.101 28.20 1.225 0.55
8 1.38 0.075 22.92 1.750 0.61
13 1.40 0.050 15.22 1.600 0.63
4 1.68 0.142 42.09 2.050 0.49
9 1.70 0.105 32.99 2.200 0.53
14 1.70 0.068 24.89 2.500 0.61
5 2.02 0.175 54.92 2.500 0.48
10 2.02 0.128 47.83 3.050 0.61
15 1.96 0.081 32.61 3.100 0.69
h= 1.4cm
35 2.02 0.175 48.54 2.400 0.53
34 1.68 0.142 41.59 2.350 0.68
h=2.5cm
63 2.02 0.175 41.55 2.200 0.57

•rI C C) CD CD C)

50
wave profile
d
Fig. 2.1 Definition sketch.

51
wavethrec
Ix0
Th
(a): t=t0
0
z
0Th
(C):t1<t<t2
Fig. 2.2 Stages of wave propagation past a horizontal plate. (a) initial contact, t = to;(b) submergence of upwave portion of plate, t0 <t <ti; (c) completesubmergence of plate, t1 <t < t; (d) submergence of downwave portion ofplate, t2 < t <t3; (e) wave detaching from plate, t = t3.
z (b): t0<t<t1
x T h
zh
z
(d):t2<t<t3
(e): t=t3
0x

52
r(t)
h
0
C
c’(t)
F(t)
F(t)
(b)
t
t
Fig. 2.3 Sketch of ideal force components variation over a wave cycle. (a) free surfaceelevation; (b) wetted length X; (c) proposed variation of AJat as a velocity c’;(d) force components: inertia force, Fai; added mass force, Fa2; drag force,Fd; buoyancy force, Fb; (d) total vertical force: actual force, predicted force.
11x=(a)
—----- 11x=
—
t
tt t tfl t2 t3
(c)
t
(d)
Fb
t
(e)

53
1.
0.75- -
0
0.50 -
fiOIb)
0.25 -
__________________________
— Sarpkaya and Isaacson (1981)
-- Eq. 2.24
(a)
I I I I I I
I I I I I
—
075 - -z
0.50 -
f2O/b)
0.25 -
___________________________
— Sarpkayaandlsaacson(1981)
—— Eq. 2.25
(b)I I I I I
0.00 0.50 1.00 1.50 2.00 2.50 3.00
Fig. 2.4 Variation of added mass functions with plate aspect ratio ?./b. (a) f1 (k/b);(b)f2(Ib).

54
[.0 I I I I I
(a)— cLl.O
0.8 - - - c=3.O
0.6
pb2
0.00.5 1.0 1.5 2.0 2.5 3.0
?Ib
1.0 I I I I I
— cz=05 (b)
0.8 --
0.6
0M
Oi 1.0 i 10 2 3.0
Fig. 2.5 Variation of dimensionless added mass with plate aspect ratio 2Jb. (a) Eq. 2.7;(b) Eq. 2.26.
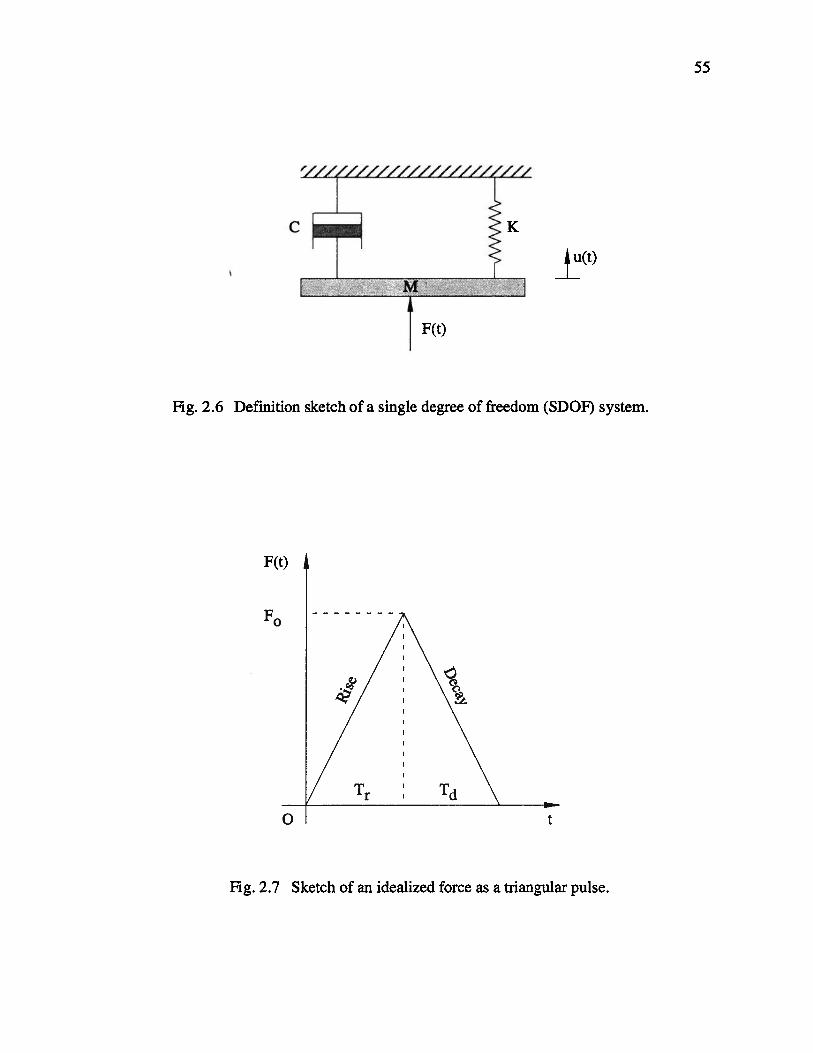
55
C
F(t)
Fig. 2.6 Definition sketch of a single degree of freedom (SDOF) system.
F(t)
F0
0 t
Fig. 2.7 Sketch of an idealized force as a triangular pulse.

56
1.6 . • • • • • • • • •• • • • . . • • • • • • • . .
_________
(a)1.4 : -
=O.O3
• .O6
F00.6 -
0.4
0.2 - -
0.0 • • I i . . . I . . . . I . . . I . . . . I i . i . I . i . . I . • . . I . . . . I . i i
14.0 . . . • . . • • • • • • • • • • . • • • • • • • • • • • • • •
(b)12.0
10.0
T 8.0-
T6.0
4.0
. liii..., 1.11.1.11.
0.0 1.0 2.0 3.0 4.0 5.0 6.0 7.0 8.0 9.0 10.0Tr IT
Fig. 2.8 Dynamic amplification factor and relative rise-time as a function of Tr/Tnfor applied impulsive force with Td/Tr = 1. (Isaacson and Prasad, 1993).

57
Fig. 3.1 Photographs of the plate assembly. (a) side view; (b) top view indicatingthe details of supports and load-cell arrangements.
(a)
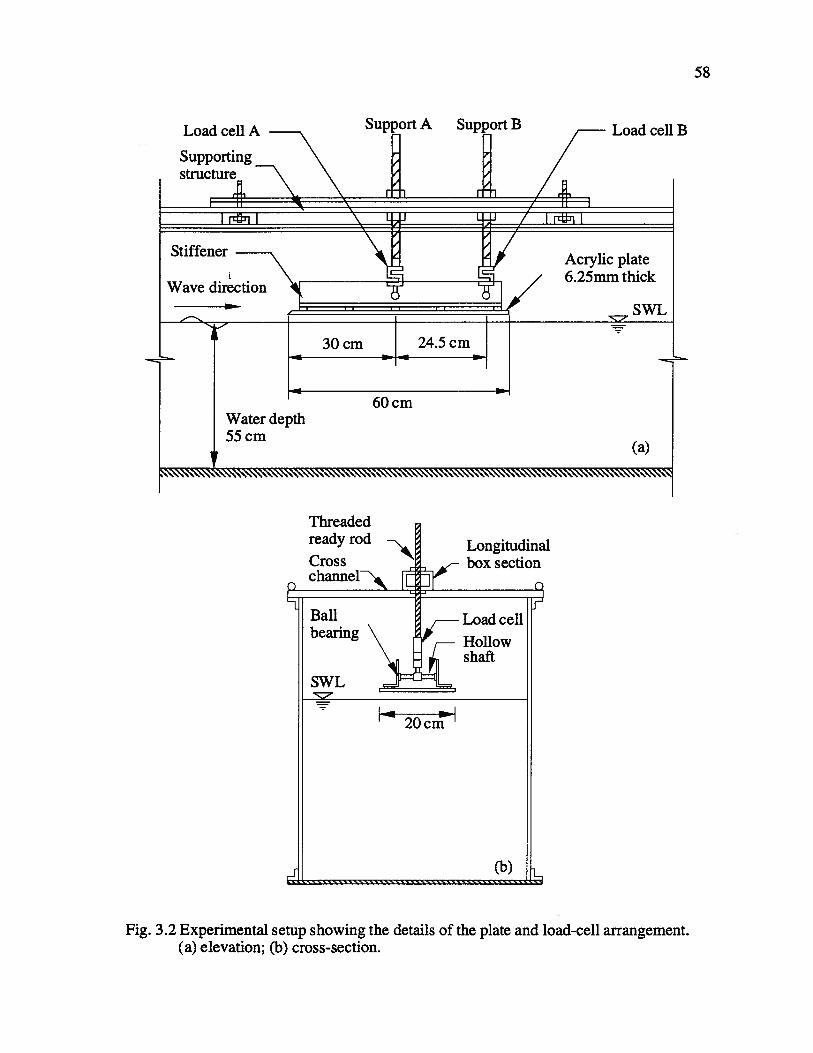
rr
CDi
-CD
CD
CD H 0_f CD CD 0 CD I
00

59
Wavegenerator
60cm
l0.35m20 m
CFig. 3.3 Sketch showing the wave flume and the test location.
VAXstation 3200 computer forwave generation & data control
(GEDAP software) D
________
I
CRTCDASD
Analog to digitalconverter
__________
CRTCSIG D
Digital to analogconverter
Low pass filter
Wave generator
4Amplifiers
and low-passfilter
I
_ _
4I I I I
Wave I Plate-load
probes I cell
__________
assembly
Fig. 3.4 Flow chart indicating the wave generation and the data control setup.

300.0
F (tO 0.0
F (N)
—300.0
200.0
Load ccli A1
(a)
60
‘
Load cell A
Load cell B
FI.
00.0 100.0 200.0 300.0
Fig. 3.5 Response of load-cells A and B to a step load of 117.7 N (12 kg) tested in air.(a) time histozy; (b) spectral density.
I I
Load cell B
—200.0
o.ojiw—
1.5 1.75 2.0 2.25 2.5
t (sec)
75.0
50.0
S (N2!!!2)
25.0
0.G
20.0
S (N’,/Hz)
10.0
0.
f (Hz)
400.0
(b)
500.0
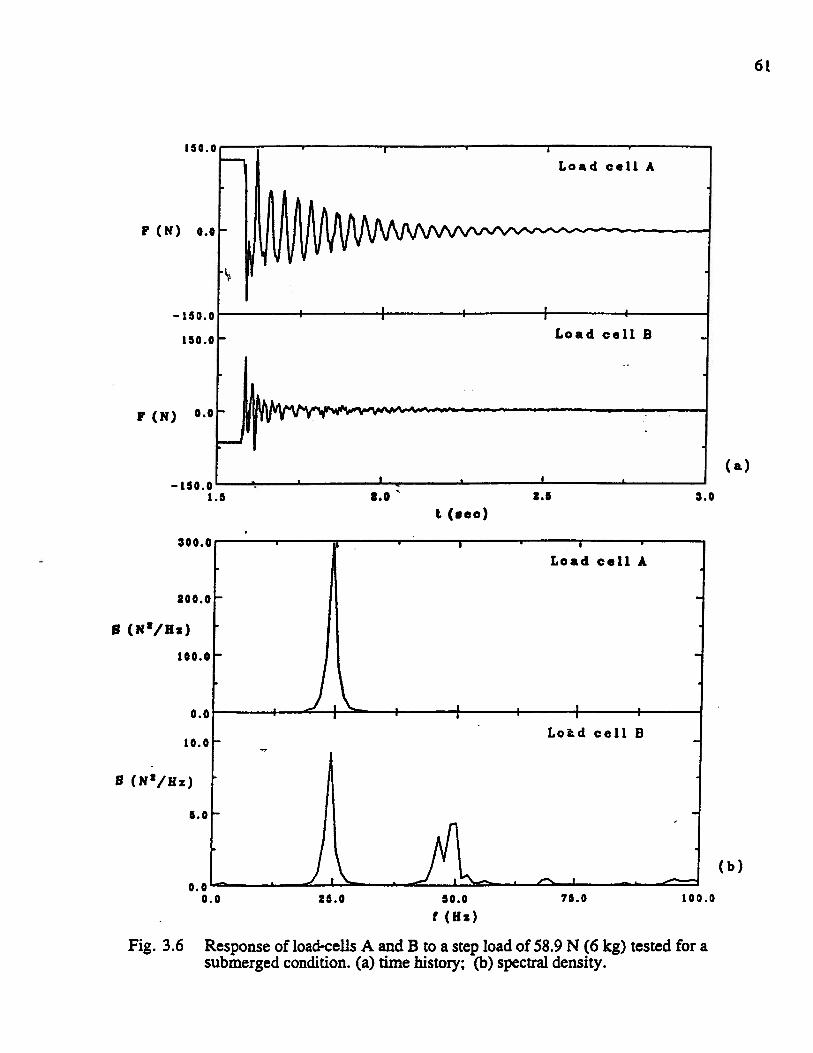
61
150.0 — •
Load cell A
F (N);.:
150.0 Load cell B
F (N) 0.0
(a)
—150.01
1.5 2.0 ‘ 2.6 3.0t (aec)
300.0 •
Load cell A
200.0 -
S (Ne/Hz)
100.0 -
0.0 I I I
Lod cell B10.0
S (N2/Hz)
:: .d1L0.0 25.0 50.0 76.0 100.0
((Hz)
Fig. 3.6 Response of load-cells A and B to a step load of 58.9 N (6 kg) tested for asubmerged condition. (a) time histoly; (b) spectral density.
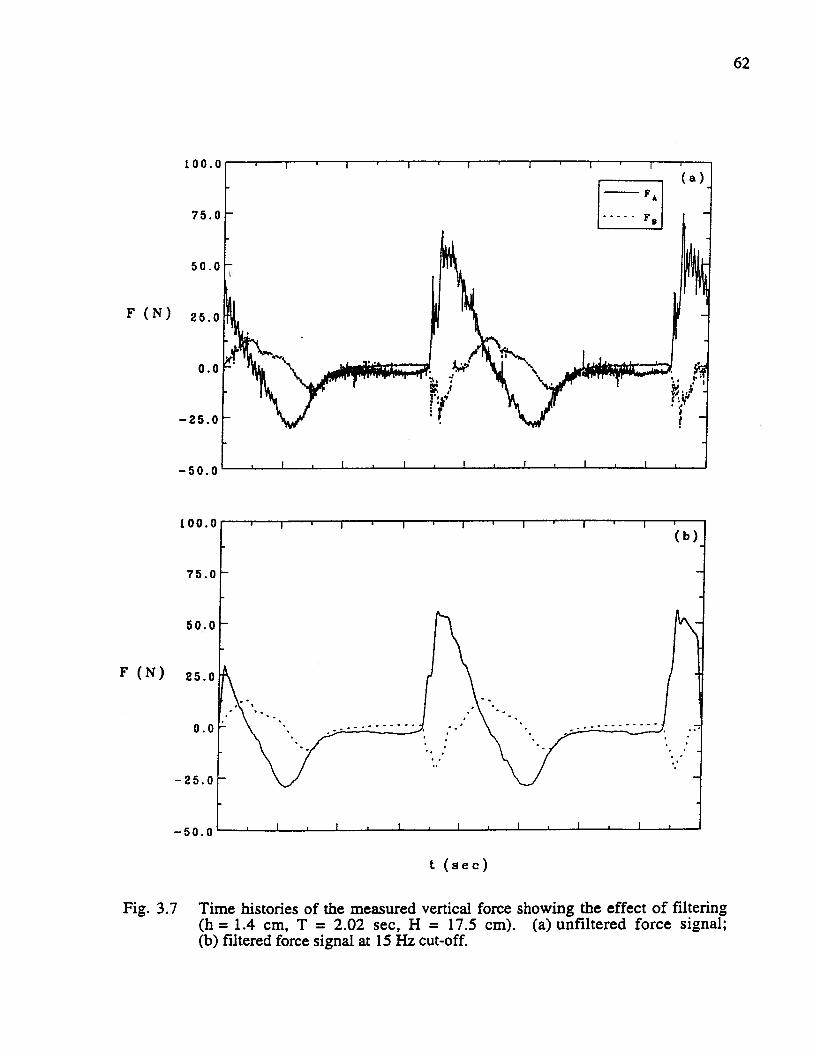
62
100.0
75.
50.0
F (N) 25.0
0.
—25.0
—50.0
100.0
75.0
50.0
F (N) 25.0
0.
—25.0
—50.0
Fig. 3.7 Time histories of the measured vertical force showing the effect of filtering(h = 1.4 cm, T = 2.02 see, H = 17.5 cm). (a) unfiltered force signal;(b) filtered force signal at 15 Hz cut-off.
I (sec)
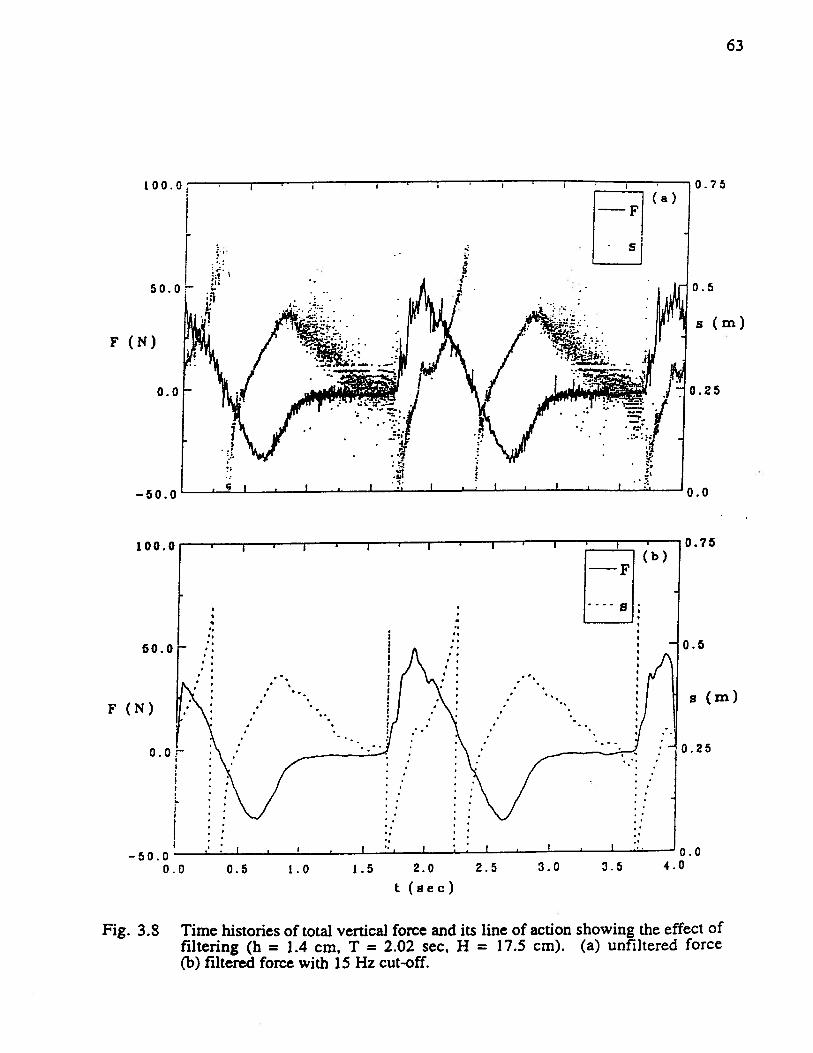
63
I
I I
(a)]
A1 s (m)F (N) / / .
It’ /- 41 / -
.1 --‘-- / .: •Jo.25
• ..‘ :
_50.0’iI I • I I •• I •‘0.0
100.0 ‘ i • • i • • • 0.75(b)
F
t (eec)
Fig. 3.8 Time histories of total vertical force and its line of action showing the effect offiltering (h = 1.4 cm, T = 2.02 sec, H = 17.5 cm). (a) unfiltered force(b) filtered force with 15 Hz cut-off.

i (m)
0.12
0.08
0.04
0.0
—0.04
—0.08
I I I I
. F
t (see)
Fig. 3.9 Time histories of (a) free surface elevation; (b) vertical force and its line ofaction. (h = 1.4 cm, T = 2.02 see, H = 17.5 cm).
64
I I I I I
////--\\c\\\\
(a)
-
‘,,.
....‘
x2
F (N)
100.0
50.0
0.0
—50.00.8
0.6
0.4
0.2
5(m)
1.2 1.6 2.0 2.4 2.8 3.20.0
3.6

65
Measurement of surfaceelevations, 110 and r at
2500 Hz.
Wave records filtered at 10 Hz.
Force time historiescompared and parameters .‘
stored.
Fig. 3.10 Flow chart indicating the sequence of analysis of the measured force and waveelevation time histories.
Measurement of vertical forcesFA and FB at 2500 Hz.
Force records filtered at 15 Hz.
Total vertical force F(t) andit’s line of action s(t)
computed.
Impact parameters obtainedfrom time histories of
vertical force.
Time t0, t1, t2 and t3 andwetted length (t) variation
obtained.
Force prediction based onanalytical models and a’s
determined.
H

Fig. 4.1 Time histories of free surface elevation, wetted length, vertical force measuredat the supports, total vertical force and the associated line of action during onewave cycle for h = 0.8 cm, T = 1.68 sec, H = 14.2 cm. (a) free surfaceelevation and wetted length; (b) vertical force; (c) total vertical force and line ofaction.
0.3
0.1
(m) 0.0
—0.1
60.0
30.0
F (N)
0.0
—30.0
60.0
30.0
F (N)
0.0
0.0
66
.6
A (m)
s(m)
0.6
.4
0.2
—30.01.0 1.5 2.0 2.5
t (sec)
0.03.0

67
Fig. 4.2 Time histories of free surface elevation, wetted length, vertical force measuredat the supports, total vertical force and the associated line of action during onewave cycle for h = 0.8 cm, T = 1.70 sec, H = 10.5 cm. (a) free surfaceelevation and wetted length; (b) vertical force; (c) total vertical force and line ofaction.
0.06
i (in) 0.0
—0.06
F (N)
F (N)
50.0
25.
0.0
—25.0
0.6
X (m)
0.3
0.0
0.6
0.4
s(m)
0.2
0.03.0
—25.01.0 1.5 2.0 2.5
t (sec)
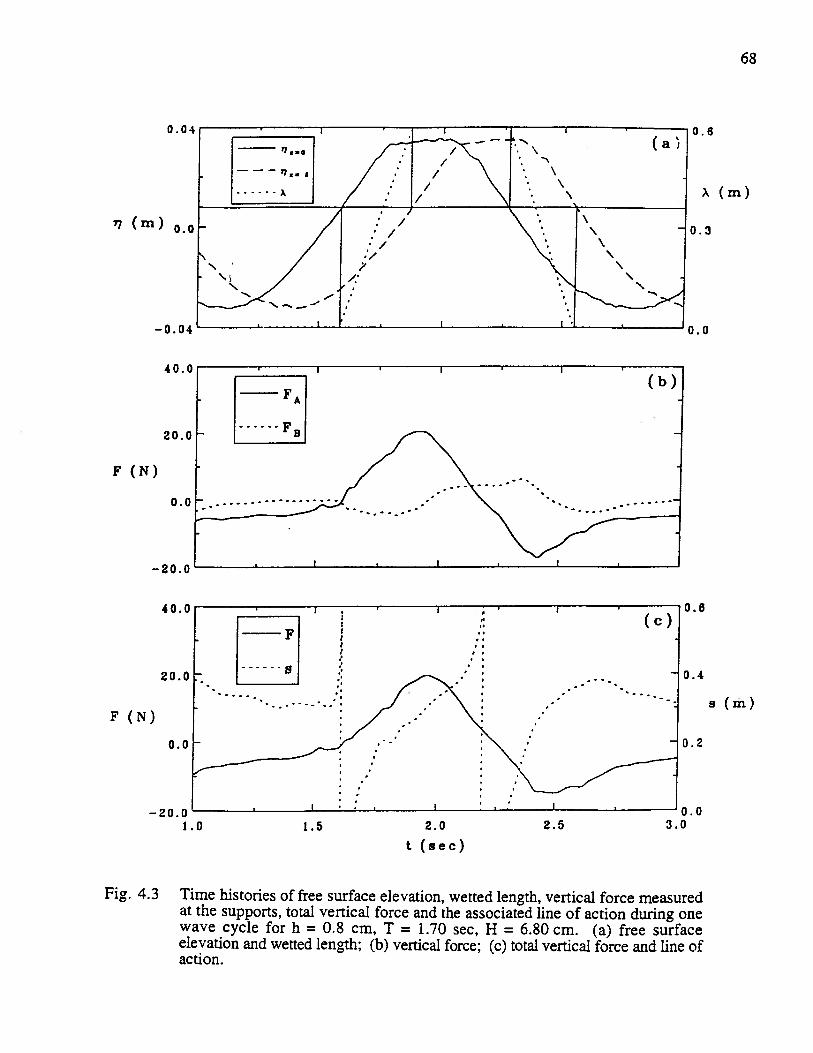
‘ (rn) 0.0
F (N)
F (N)
---::
___
t (see)
68
A (m)
s(rn)
Fig. 4.3 Time histories of free surface elevation, wetted length, vertical force measuredat the supports, total vertical force and the associated line of action during onewave cycle for h = 0.8 cm, T = 1.70 sec, H = 6.80 cm. (a) free surfaceelevation and wetted length; (b) vertical force; (c) total vertical force and line ofaction.
0.04 0.6
—0.04
40.0
20.0
0.
—20.0
40.0
20.0
0.0
—20.01.0
0.3
0.0
0.6
0.4
0.2
0.03.01.5 2.0 2.5

0.1
—0.1
60.0
30
—30.0
60.0
30.
0.0
—30.01.0
• /
0.6
0.3
0.0
0.6
0.03.0
Fig. 4.4 Time histories of free surface elevation, wetted length, vertical force measuredat the supports, total vertical force and the associated line of action during onewave cycle for h = 1.4 cm, T = 1.68 sec, H = 14.2 cm. (a) free surfaceelevation and wetted length; (b) vertical force; (c) total vertical force and line ofaction.
69
— —
— 7’x,.
A
(a)
i (rn)00
F (N)
0
x (in)
(in)F (N)
.4
2
1.4 1.6 2.2 2.6
t (see)

70
F (N)
Fig. 4.5 Time histories of free surface elevation, wetted length, vertical force measuredat the supports, total vertical force and the associated line of action during onewave cycle for h = 1.4 cm, T = 1.68 sec, H = 10.5 cm. (a) free surfaceelevation and wetted length; (b) vertical force; (c) total vertical force and line ofaction.
0.0
17 (m) 0.0
—0.08
60.0
30.0
0.0
—30.
60.0
0.6
A (m)
0.3
0.0
.6
0.4
s(m)
0.03.0
F (N)
30.0
0.
—30.01.0 1.4 1.8 2.2 2.6
t (sec)

71
0.12
0.0
—0.12
0.6
A (rn)
0.3
0.0
0.6
0.4
s(m)
0.2
7 (m)
F (N)
F (N)
3.2
Fig. 4.6 Time histories of free surface elevation, wetted length, vertical force measuredat the supports, total vertical force and the associated line of action during onewave cycle for h = 0 cm, T = 2.02 sec, H = 17.5 cm. (a) free surface elevationand wetted length; (b) vertical force; (c) total vertical force and line of action.
—40.01.2 1.6 2.0 2.4 2.8
t (sec)
0.0

72
F (N)
Fig. 4.7 Time histories of free surface elevation, wetted length, vertical force measuredat the supports, total vertical force and the associated line of action during onewave cycle for h = 1.4 cm, T = 2.02 sec, H = 17.5 cm. (a) free surfaceelevation and wetted length; (b) vertical force; (c) total vertical force and line ofaction.
0.12
(in)0.0
—0.12
F (N)
80.0
0.6
A (m)
0.3
0.0
.8
0.4
s (m)
2
0.03.2
40.0
0.
—40.0
80.0
40.0
0.0
—40.01.2 1.6 2.0 2.4 2.8
t (see)

Fig. 4.8 Time histories of free surface elevation, wetted length, vertical force measuredat the supports, total vertical force and the associated line of action during onewave cycle for h = 2.5 cm, T = 2.02 sec, H = 17.5 cm. (a) free surfaceelevation and wetted length; (b) vertical force; (c) total vertical force and line ofaction.
0.3
0
0.12
ii (m) 0.0
—0.12
80.0
40.0
F (N)
0.0
—40.0
80.0
40.0
F (N)
0.0
—40.01.2
73
0.6
X (m)
s (m)
6
4
2
0.03.21.6 2.0 2.4 2.8
t (sec)

I I I I I • I I I I I I I I 1 I I I I
(a)
:zzE.A.. . .....
.......
••...
-
I I I I I • • I • i i I • • • I I I I i • i
I I I I I I I I I I I I I I I I I I I I I I I I I: (b)
(c)
I I I I . . .
-0.1 0.0 0.1 0.2 0.3 0.4 0.5
Fig. 4.9 Maximum upward force coefficientF1,/pgbHe as a function of relative plate clearanceh/H and relative plate length ilL. (a) 0.0 16 <HIL <0.020; (b) 0.026 < HIL <0.030; (c) 0.035 <HIL < 0.041.
74
F
pgHbe
F
pgHbt?
F
pgHbe
0.5
0.4
0.3
0.2
0.1
0.0
0.5
0.4
0.3
0.2
0.1
0.0
0.5
0.4
0.3
0.2
0.1
0.0
h/H

75
Fig. 4.10 Maximum downward force coefficient Fm/pgbH.e as a function of relative plateclearance h/H and relative plate length £/L. (a) 0.0 16 <HIL <0.020; (b) 0.026 <HIL <0.030; (c) 0.035 <H/L <0.041.
FmpgHbe
FmpgHbe
FmpgHb.e
0.3
0.2
0.1
0.0
0.3
0.2
0.1
0.0
0.3
0.2
0.1
0.0
:I • •
(a)
: ...
-
L :..
I I I I I • • • • I • i • • I • • • • I • • • • I i • . •
I I I I I • • • I I I I • • • • I I I I I I
;::i3:;
—.
I I I I I . i • • I • • • • I • i i • I • i • • I • i • •
I I I I I I I I I I I I I I I I I I I I I I I I I I 1 I
(c)
- .......
k -
—--
I I I I I i • • • I • • • • I . • I • • . . I • • • •
-0.1 0.0 0.1 0.2 0.3 0.4 0.5h/H
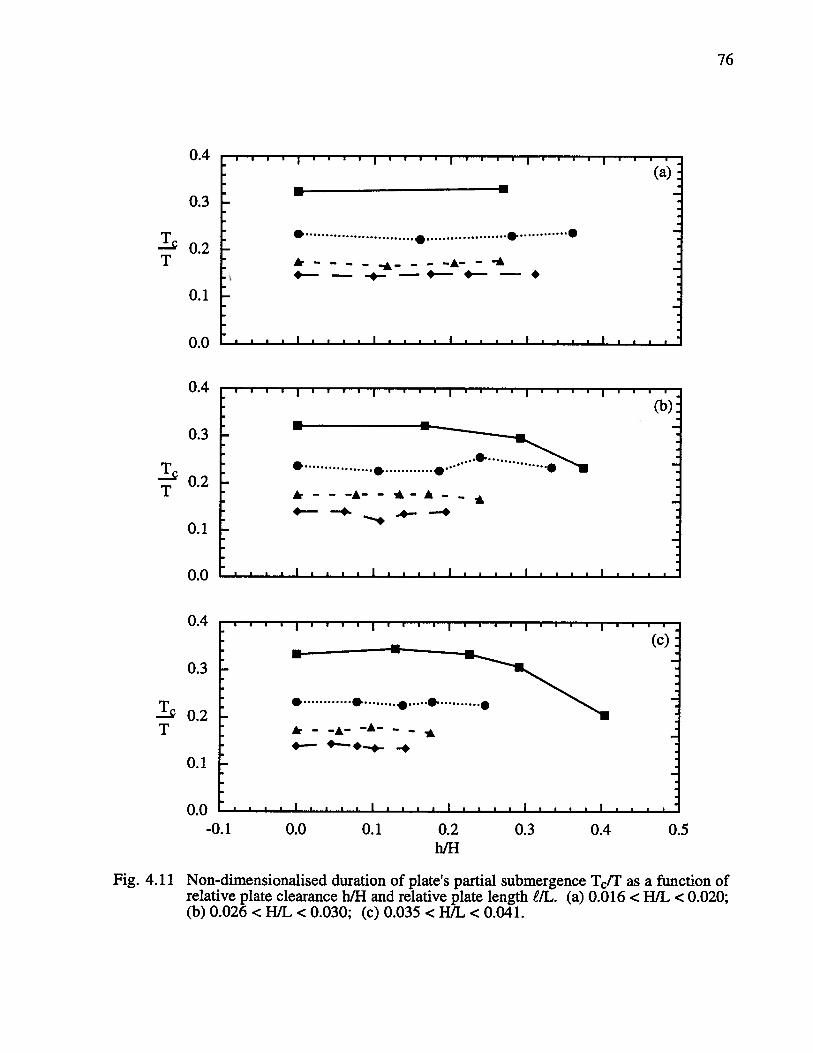
76
I I I I I I I I I • I I I I I I I I I I I I I I I I I
(a).-
-. H
. .
- -
— -.— —.——.—- —.
I I I I I . . i . I . i . i I . . i . I . i • i I . i I I
I I I I I I I I I I I I I I I I I I I I I I I I
(b)
:EZ..E+-
-.4- -.
I I I I I . I I I I • • • i I • • i • I I I I I I i I I I
I I I I I ‘ I I I I I I I I I I I I I I I I I
(c)
EEZ7.:4— •— •—•- -.
I I I I I • • • • I i i I • i • • I r I I I I • i
-0.1 0.0 0.1 0.2 0.3 0.4 0.5
0.4
0.3
102T
0.1
0.0
0.4
0.3
0.2T
0.1
0.0
0.4
0.3
10.2T
0.1
0.0
h/H
Fig. 4.11 Non-dimensionalised duration of plate’s partial submergence T/T as a function ofrelative plate clearance h/H and relative plate length ilL. (a) 0.0 16 <H/L < 0.020;(b) 0.026 <H/L <0.030; (c) 0.035 <HIL <0.041.

77
• • • I I I I • • • • I I I I I I
-
•••••.
AiI
-
•.............
-
. . • . . . . . . . . . . • . . . . .
I I I I I I I I I I I I I I I I I I I I I I I
,* (b)‘
- /S.. Th•
.....
...
. .1...,
I I I I I • I I I I I I I I I I I I I
(c)A*..
.
%
A..
:-0.1 0.0 0.1 0.2 0.3 0.4 0.5
Fig. 4.12 Non-dimensionalised duration of plate’s complete submergence T/T as a function ofrelative plate clearance h/H and relative plate length ilL. (a) 0.016 <H/L <0.020;(b) 0.026 <H/L < 0.030; (c) 0.035 <HIL < 0.041.
TT
TT
TT
0.4
0.3
0.2
0.1
0.0
0.4
0.3
0.2
0.1
0.0
0.4
0.3
0.2
0.1
0.0
h/H

78
0.4
0.3
— 0.2T
0.1
0.0
0.4
0.3
-p0.2T
0.1
0.0
0.4
0.3
IPO.2T
0.1
0.0
I I I I I I 1 1 I I I I 1 I ‘ ‘ I ‘ I I I I
(a)
:: -
\______.
I I I I I I I I I • • • • I • • • • I • i • I I • • • •
I I I I I I I I I I I I I I I
(c)
.I I I
I
II I I • • • . . I I
-0.1 0.0 0.1 0.2 0.3 0.4 0.5h/H
Fig. 4.13 Non-dimensionalised rise-time TIT of peak vertical force as a function of relativeplate clearance b/H and relative plate length £/L. (a) 0.016 < HJL <0.020; (b) 0.026<H/L < 0.030; (c) 0.035 <HJL <0.041.

, ..IuIIIII I I I I I I I I I I I I I IIII
. (a)
I I I I I . . . . I a • , I I i i i . I i • . I . . r I
I I I I I I I I I I I I I I I I I I I •
....
..........
- 7I I I I I . I I I I i . i . I . i . , I . i • . I i , i i
I I I I I I I I I I I I I • I I I I I I
(c)
:I I I I I r I I I I • i . I I , i r I I i . I I I I I I I
-0.1 0.0 0.1 0.2 0.3 0.4 0.5
Fig. 4.14 Non-dimensionalised time of occurrence Tm/T of maximum downward force as afunction of relative plate clearance h/H and relative plate length £/L. (a) 0.016 <HJL<0.020; (b) 0.026 <HJL <0.030; (c) 0.035 <H!L < 0.04 1.
79
0.8
0.7
0.6TmT 0.5
0.4
0.3
0.8
0.7
0.6
T 0.5
0.4
0.3
0.8
0.7
0.6
T 0.5
0.4
0.3
h/H

I I•
....e..ek — — ——A: — -+— —
E
, I I I I I . . . . I . . • I . . . i I i , . I . , •
I I I • I I I I I I I I I I I I I I I
(b)
N\A//
(c)
/\-0.1 0.0 0.1 0.2 0.3 0.4 0.5
80
-pL
L
-pL
0.20
0.15
0.10
0.05
0.00
0.25
0.20
0.15
0.10
0.05
0.00
0.30
0.25
0.20
0.15
0.10
0.05
0.00
hJH
Fig. 4.15 Non-dimensionalised line of action sIL of maximum upward force as a function ofrelative plate clearance h/H and relative plate length £fL. (a) 0.016 < H/L <0.020;(b) 0.026 <H/L < 0.030; (c) 0.035 <HIL <0.041.

I I I • I I I I I • I I I I I p I I I I
(a)
: .••
k - A4— —
A- - -
. 4——•
. I I I I I i . i i I i I I I I I I I I I • • I I I • • I I
I I I I J I I I I I I I I I I I I I I I I I I I • • I I
(b)
H-
, . . . . . . . . I I I I I I I • I I I
I I I I I I I I I I I I I I I I I I I I I I I I I I
(c)
... •
.....
A- -Ak4— •—•--• •
I I I I I . . , i I . i I I I • I I I I i • • • I i i i i
Fig. 4.16 Non-dimensionalised line of action Sm/L of maximum downward force as a functionof relative plate clearance hJH and relative plate length £/L. (a) 0.0 16 <HJL <0.020;(b) 0.026 <HIL <0.030; (c) 0.035 <HIL < 0.041.
81
0.20
0.15
- 0.10
0.05
0.00
0.25
0.20
0.15-wL 0.10
0.05
0.00
0.25
0.20
0.15-wL 0.10
0.05
0.00-0.1 0.0 0.1 0.2
h/H0.3 0.4 0.5

82
I I I I I I I I I I I I I I I I I I I I I I I I
: (a)
H::A....>”:
. ,. .
I I I I I I I I I I I I I I I I I I I I I I I I I I
(1D)
(c)
-0.1 0.0 0.1 0.2 0.3 0.4 0.5
L
L
L
0.4
0.3
0.2
0.1
0.0
0.4
0.3
0.2
0.1
0.0
0.4
0.3
0.2
0.1
0.0
h/H
Fig. 4.17 Non-dimensionalised wetted length fL corresponding to maximum upward forceas a function of relative plate clearance h/Fl and relative plate length ilL. (a) 0.016 <H/L <0.020; (b) 0.026 <H/L <0.030; (c) 0.035 <HIL <0.041.

83
:• I I I I I I I I j I I I I I I I I I I I
E— —. —4
+k_I•4C.
, I I I I I . . . . I . . , . I . I I I . . , ,
I I I I I I I I J I I I I I I I I I I I I I I I I
....
- A •
I I I I I . . i . I . i . i I . . i I i . . . I . . • .
I I I I I I I I I I • • I I I I I I I I I I I I I
(c)S..
- ........
.•.•.....
— .
-0.1 0.0 0.1 0.2 0.3 0.4 0.5
Fig. 4.18 Non-dimensionalised wetted length ?mfL corresponding to maximum downwardforce as a function of relative plate clearance h/H and relative plate length £/L. (a)0.016 <HIL <0.020; (b) 0.026 <H/L <0.030; (c) 0.035 <H/L <0.041.
0.15
0.10
L0.05
0.00
0.15
0.10
L0.05
0.00
0.20
0.15
0.10L
0.05
0.00
h/H

84
Fig. 4.19 Photographs of wave impact. (a) instant of complete submergence;(b) water drainage following submergence.

85
Fig. 4.20 Video images indicating various stages of wave impact during onewave cycle. (a) partial submergence; (b) complete submergence;(c) wave recession; (d) water drainage.
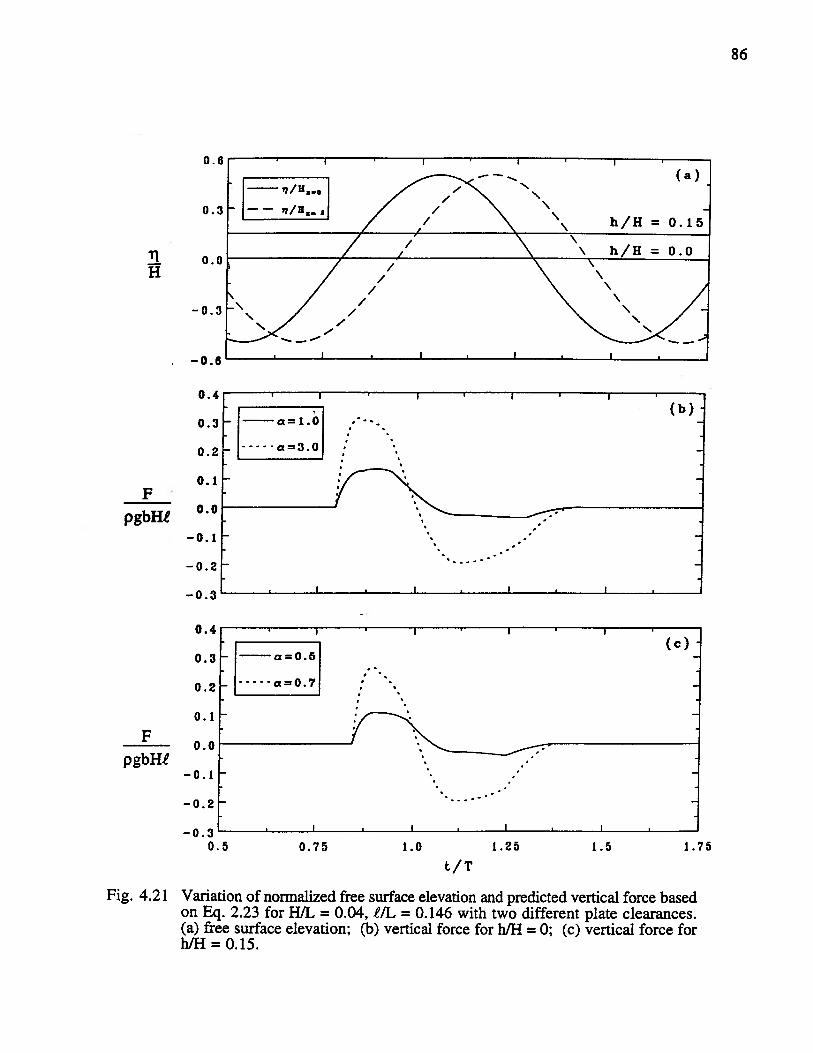
86
0.6
0.3
0.0H
—0.3
—0.6
0.4
0.3
0.2
____________
0.1F
pgbHe0.0
—0.1 -
—0.2 -
—0.3 -
0.4 -
0.3
0.2
____________
0.1
F
pgbH.e—0.1 -
—0.2 -
—0.3 —
0.5 0.75 1.0 1.25 1.5 1.75
Fig. 4.21 Variation of normalized free surface elevation and predicted vertical force basedon Eq. 2.23 for HIL = 0.04, £/L = 0.146 with two different plate clearances.(a) free surface elevation; (b) vertical force for h/H = 0; (c) vertical force forh/H = 0.15.
I • I • I
a1.O
a3.0
I I —
(b)
• I • I • I • I
____
(c)
a0.7
I • I •
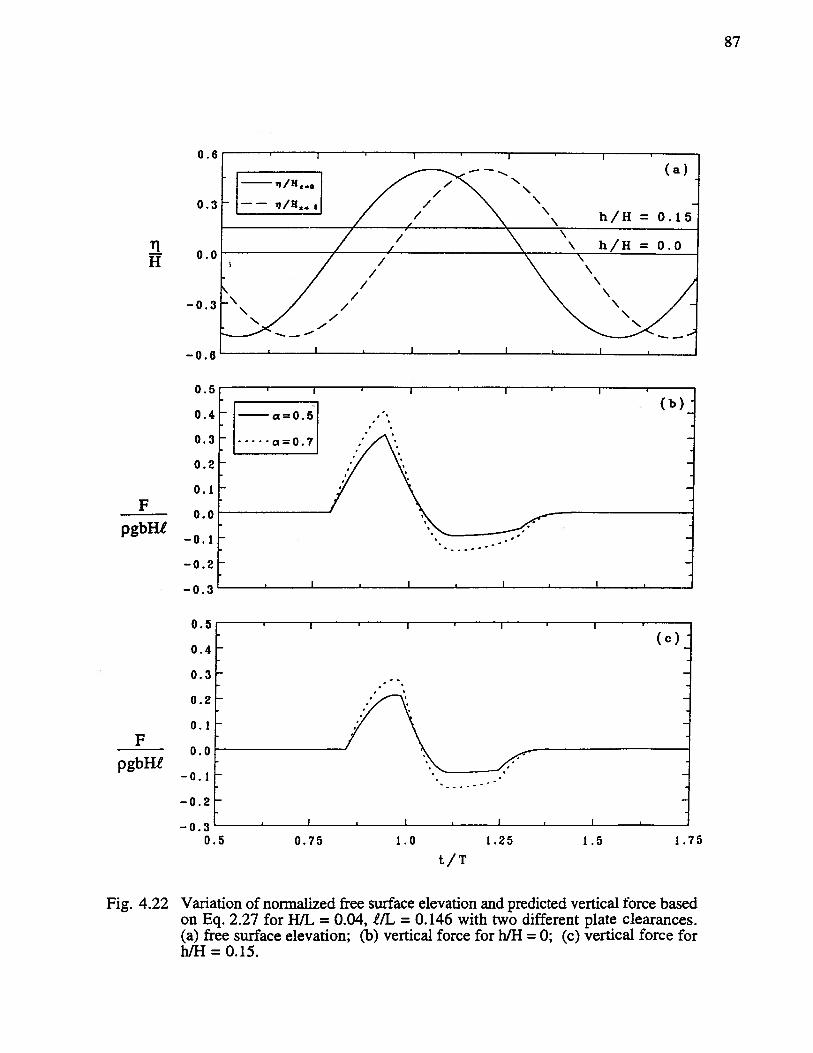
0.6
87
0
0
—0
—0.8
0.5
0.4
0.3
0.2
0.1
H
F
pgbHt
F
pgbHe
1.75
Fig. 4.22 Variation of normalized free surface elevation and predicted vertical force basedon Eq. 2.27 for HJL = 0.04, £/1. = 0.146 with two different plate clearances.(a) free surface elevation; (b) vertical force for h/H = 0; (c) vertical force forh/H = 0.15.
0
—0.1
—0.2
—0.3
0.5
0.4
0.3
0.2
0.1
0.0
—0.1
—0.2
—0.30.5 0.75 1.0 1.25 1.5
t/T

Fig. 4.23 Comparison of vertical force predicted by analytical modeis with experimentalobservation for h = 0 cm, T = 2.02 sec, H = 17.5 cm. (a) free surface elevationand the wetted length; (b) vertical force.
0.12
0.0
88
0.6
0.3 A (m)
0.0
‘1 (m)
F (N)
—0. 1
80
40.0
0.0
—40.01.2 1.6 2.0 2.4 2.8
t (see)3.2

89
Fig. 4.24 Comparison of vertical force predicted by analytical models with experimentalobservation for h = 0 cm, T = 1.68 sec. H = 14.2 cm. (a) free surface elevationand the wetted length; (b) vertical force.
0.6
A (m)
0.12
0.0
—0.12
80.
40.0
0.3(m)
F (N)
0.0
0.0
—40.01.2 1.6 2.0 2.4 2.8
t (see)3.2
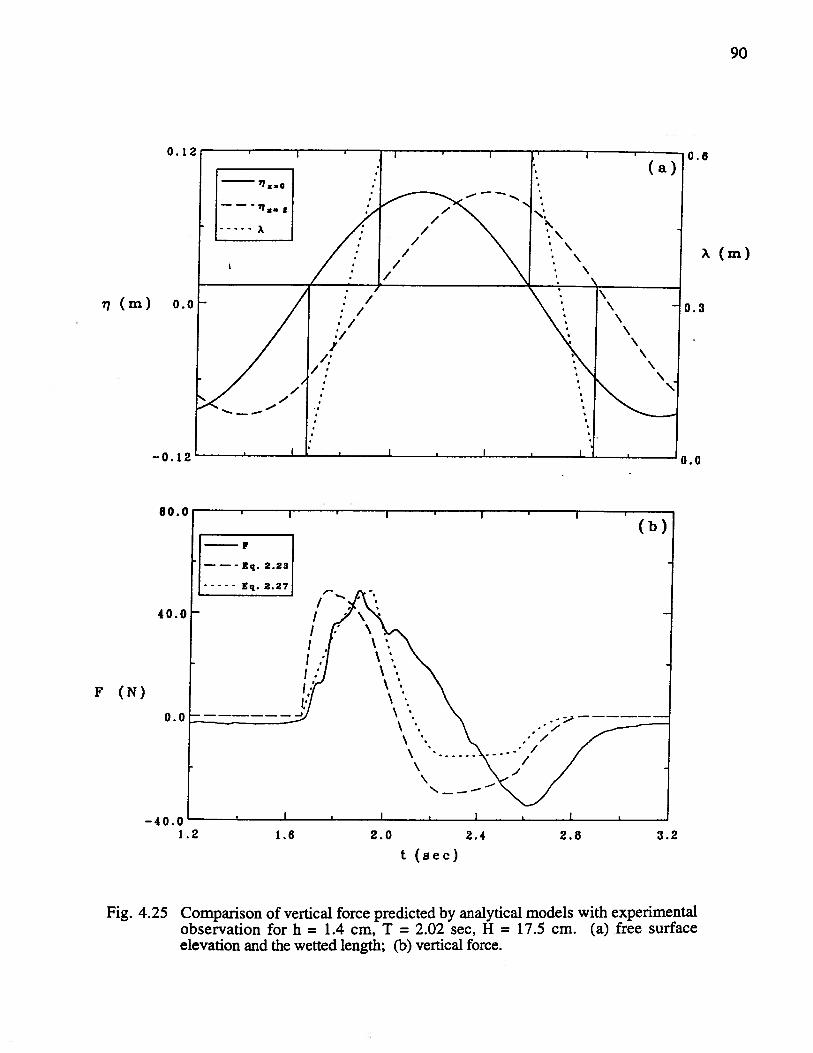
90
Fig. 4.25 Comparison of vertical force predicted by analytical models with experimentalobservation for h = 1.4 cm, T = 2.02 sec, H = 17.5 cm. (a) free surfaceelevation and the wetted length; (b) vertical force.
.6
A (m)
0.12
r(m) 0.
—0.12
F (N)
0.3
0.0
—40.01.2 1.6 2.0 2.4 2.8
t (see)
3.2

91
Load cell A Load cell B
Fig. Al Free body diagram of the plate indicating support forces and the line ofaction of the vertical force.
30cm 24.5 cm
S
Vertical force