beata d. kochut - terry college of business · beata d. kochut according to the most recent...
TRANSCRIPT
VOLUME 68, NUMBER 1 • THE UNIVERSITY OF GEORGIA • FIRST QUARTER 2008
Georgia’s still growing...and growingBeata D. Kochut
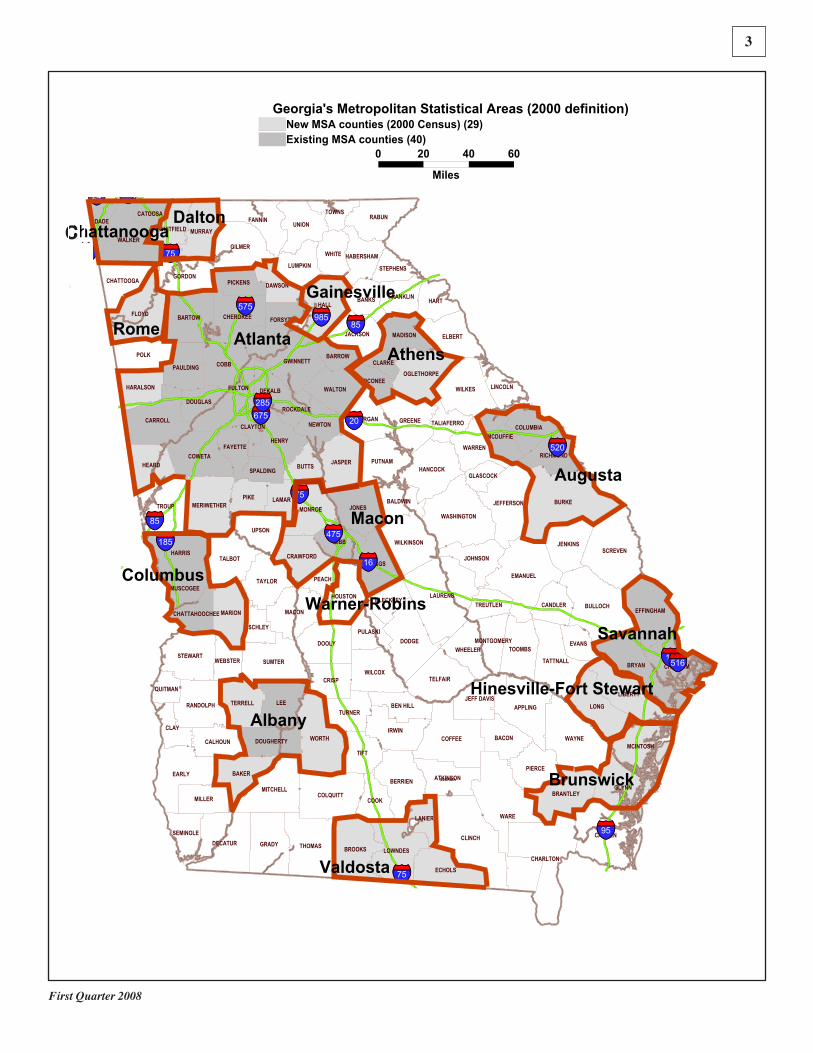
According to the most recent Metropolitan Statistical Area definitions, 70 counties in Georgia have qualified as parts of the 15 Metropolitan Statistical Areas, and 31 counties qualified as parts of the 24 Micropolitan Statistical Areas. The number of metropolitan statistical areas in Georgia almost doubled between 1990 and 2000, from 8 metro areas in 1990 to 15 in 2000. The number of metropolitan counties climbed from 42 in the 1990s to 70 in 2000. In 2006, over 90 percent of Georgia’s population lived in Core Based Statistical Areas (over 81 percent, or 7,596,253 people in metro areas, and over 10 percent or 963,460 people in micro areas), and only 9 percent (804,228) lived in non-Core Based Statistical Areas.
Core Based Statistical Areas are most concentrated across the northern half of the state, especially in the northwestern quarter, where most of the counties are classified as parts of either metropolitan or micropolitan areas. The Chattanooga and Atlanta Combined Statistical Areas span across state borders, and, together with the Dalton and Rome metro areas sandwiched between them, form an uninterrupted string of metropolitan area counties stretching westward from Athens and Gainesville into Tennessee and Alabama.
In eastern Georgia, the Augusta Metropolitan Area is separated from the contiguous metro areas of Savannah, Fort Stewart, and Brunswick by just one rural county. The Savan-nah and Hinesville-Fort Stewart MSAs now form a block of five metro counties classified as a Combined Statistical Area,
in place of just three counties (Bryan, Chatham, and Effing-ham) that were classified as metro counties in 1990. Directly south, and adjacent to the Savannah-Hinesville-Fort Stewart
Combined Statistical Area, three more counties have qualified as metro counties, and now form the Brunswick Metropolitan Area.
West from Brunswick, the string of Micropoli-tan Statistical Areas of Jesup, Waycross, Douglas, Fitzgerald, Tifton, Moultrie, and Thomasville roughly follows the South Georgia Parkway and connects to the new Valdosta Metropolitan Area
in the center of the state’s southern edge, and to the Albany MSA. Most of these micropolitan areas experienced a popu-lation increase of at least 13 percent in the last decade. The Americus Micropolitan Statistical Area connects the Albany and Columbus MSAs, which in turn touch the southern edge of the Atlanta MSA; and only one rural county separates it from the Macon-Warner Robins-Fort Valley Combined Statistical Area to the east.
Although the metropolitan area designation is related to the urban-rural classification, the two are not equivalent. In fact, metro counties that surround urban areas may themselves be rural, or suburban with large rural areas. Moreover, many metropolitan areas contain relatively small urban clusters and much larger rural areas that are bound to the urban core by commuting patterns. Metropolitan county designation may point both to the economic vitality of the urban core, but also to the lack of employment opportunities in the county itself.
2
Georgia Business and Economic Conditions
GEORGIA BUSINESS AND ECONOMIC CONDITIONS
First Quarter 2008 Volume 68, number 1
SELIG CENTER FOR ECONOMIC GROWTH
Robert T. Sumichrast Dean Jeffrey M. HumphreysDirector
Lorena M. Akioka Editor
Beata D. KochutResearch Analyst
Ian ArmitData Manager
GEORGIA BUSINESS AND ECONOMIC CONDITIONS (ISSN 0297-3857) is published quarterly by the Selig Center for Economic Growth, Terry College of Business, The Univer-sity of Georgia, as a service to the business and academic communities. Signed articles reflect the author’s opinion but not necessarily those of the Selig Center for Economic Growth, Terry College of Business, or The University of Georgia.
DEFINING METROPOLITAN AREAS
In 2000 the Office of Management and Budget an-nounced new guidelines for defining metropolitan areas. At the center of the new definitions is the concept of the Core Based Statistical Area (CBSA), defined as a county or group of counties associated with an urban core of at least 10,000 population by a “high degree of social and economic integra-tion, as measured through commuting ties.” An employment interchange between the urban area and a surrounding county has to reach at least 25 percent for the county to be classified as a part of the Core Based Statistical Area.
The definitions divide the CBSA into two groups, based on the size of the urban core: Metropolitan Areas are cen-tered around the core of at least 50,000 inhabitants, whereas Micropolitan Areas are centered around clusters of at least 10,000 population. Core Based Statistical Areas can be grouped together, based on economic ties, into Combined Statistical Areas (two or more Core Based Statistical Areas with employment interchange of at least 15 percent).
As metropolitan area designations tie together demo-graphic and economic patterns, they reveal the outlines of fast growing areas, which derive their economic vitality from a significant degree of integration with urban cores. With at least 25 percent of employment interchange with a core county, and a generally accepted multiplier effect of 2 to 3 jobs created by any one job in the metropolitan county, over 50 percent of income in metropolitan counties stems from the integration with surrounding areas.
Population
eorgia’s Metropolitan Statistical Areas range in size from the Atlanta MSA, home to over 5 mil-lion people, or over a half of the state’s population,
Gthrough Augusta (the Georgia portion only) and Savannah, each reporting populations of over 300,000, Columbus and Macon with populations in the 200,000 range, and smaller MSAs ranging from Athens (185,479) to Brunswick (100,613). Rome and Hinesville-Fort Stewart are the smallest of the state’s metropolitan areas, with populations under 100,000. Between 2000 and 2006 Atlanta—and the metropolitan areas to the northwest and northeast of it—together with the coastal metro areas were among the fastest growing metro- politan areas in the state. Warner Robins became the center
for population growth in the state’s midsection. Among Georgia’s metropolitan areas, Atlanta is, by far, the most populous and the most densely populated. The 28-county metro area had 5,138,223 inhabitants in 2006, and registered a 20 percent increase from 2000, the second largest percentage increase among the state’s MSAs. The adjacent, one-county Gainesville MSA’s population increased by 22.9 percent between 2000 and 2006, the steepest increase among the state’s metropolitan areas. On the northwest side of Atlanta, Dalton and Georgia’s part of the Chattanooga MSA increased their populations by 11.1 percent (Dalton) and 9.9 percent (Chattanooga), and rank 4 and 6, respectively, but the third fastest 2000-2006 population increase (14.6 percent) was registered by Warner Robins in middle Georgia. Bordering the Atlanta MSA on the northeast, Athens is the fifth fastest growing MSA in the state with an increase of 11.3 percent between 2000 and 2006. The coastal areas of Savannah and Brunswick increased their populations by 9 percent and 7.9 percent, respectively (and rank 7 and 8). Valdosta, Rome, Augusta, Albany, Macon, Hinesville, and Columbus increased their populations by between 5.6 percent (Valdosta) and 2.7 percent (Columbus). Among the metropolitan counties, Forsyth County in the north, Henry and Newton counties in the south, and Paulding County in the western part of the Atlanta MSA experienced the steepest growth between 2000 and 2006, with their popu-lation increases ranging from 50.1 percent to 45.3 percent. Also in the Atlanta MSA, Barrow and Cherokee counties grew by close to 36 percent. In the southern half of the state, Lee County (Albany MSA) registered 30.5 percent growth, and Effingham County in the Savannah MSA increased its
continued on page 7
3
First Quarter 2008
GEORGIA
FULTON DEKALB
COBB GWINNETT
CHATHAM
RICHMOND
CLAYTON
MUSCOGEE
BIBB
DOUGHERTY
HALL
CHEROKEE
HOUSTON
CLARKE
FLOYD
LOWNDES
WHITFIELD
CARROLL
DOUGLAS
COLUMBIA
GLYNN
FAYETTEHENRY
WALKER
BARTOW
TROUP
SPALDING
ROCKDALE
COWETA
LIBERTY
FORSYTH
BULLOCH
CATOOSA
NEWTON
PAULDING
LAURENS
BALDWIN
THOMAS
WALTON
COLQUITT
WARE
GORDON
TIFT
POLK
SUMTER
CAMDEN
JACKSON
BARROW
COFFEE
HABERSHAM
UPSON
MURRAY
EFFINGHAM
DECATUR
TOOMBS
STEPHENS
MERIWETHER
WAYNE
CHATTOOGA
HARALSON
PEACH
MADISON
JONESBURKE
EMANUEL
GRADY
MITCHELL
MCDUFFIE
CRISP
WORTH
HART
WASHINGTON
ELBERT
HARRIS
TATTNALL
OCONEE
DODGE
JEFFERSONMONROE
CHATTAHOOCHEE
FRANKLIN
LEE BEN HILL
FANNIN
APPLING
BRYAN
BROOKS
BUTTS
LUMPKIN
PICKENS
BERRIEN
PUTNAM
SCREVEN
COOK
GILMER
PIERCE
DADE
MACON
LAMAR
WHITE
MORGAN
JEFF DAVIS
UNION
EARLY
GREENE
RABUN
BRANTLEY
TELFAIR
TERRELL
WILKES
BLECKLEY
BANKS
WILKINSON
PIKE
DOOLY
TWIGGS
OGLETHORPE
BACON
DAWSON
SEMINOLE
CRAWFORD
HANCOCK
EVANS
TURNER
IRWIN
MCINTOSH
HEARD
CHARLTON
JASPER
JOHNSON
JENKINS
PULASKI
RANDOLPH
CANDLER
TAYLOR
LINCOLN
MONTGOMERY
WILCOX
TOWNS
TALBOT
MILLER
ATKINSON
LONG
CLINCH
WARREN
TREUTLEN
STEWART
MARION
LANIER
CALHOUN
WHEELER
BAKER
SCHLEY
CLAY
GLASCOCK
ECHOLS
WEBSTER
QUITMAN
TALIAFERRO
95
20
26
16
385
10
95
24
575
20
75
85
59 77
75
85
185
85
16
20 675
75
285
985
475
126
85F
520
585
516
24N
185
26N
124
277
ChattanoogaDalton
Athens
Augusta
Macon
Columbus
Albany
Valdosta
Brunswick
Hinesville-Fort Stewart
Savannah
AtlantaRome
Warner-Robins
Gainesville
0 20 40 60
Miles
Georgia's Metropolitan Statistical Areas (2000 definition)New MSA counties (2000 Census) (29)Existing MSA counties (40)
C
Georgia Business and Economic Conditions
4
Table 1
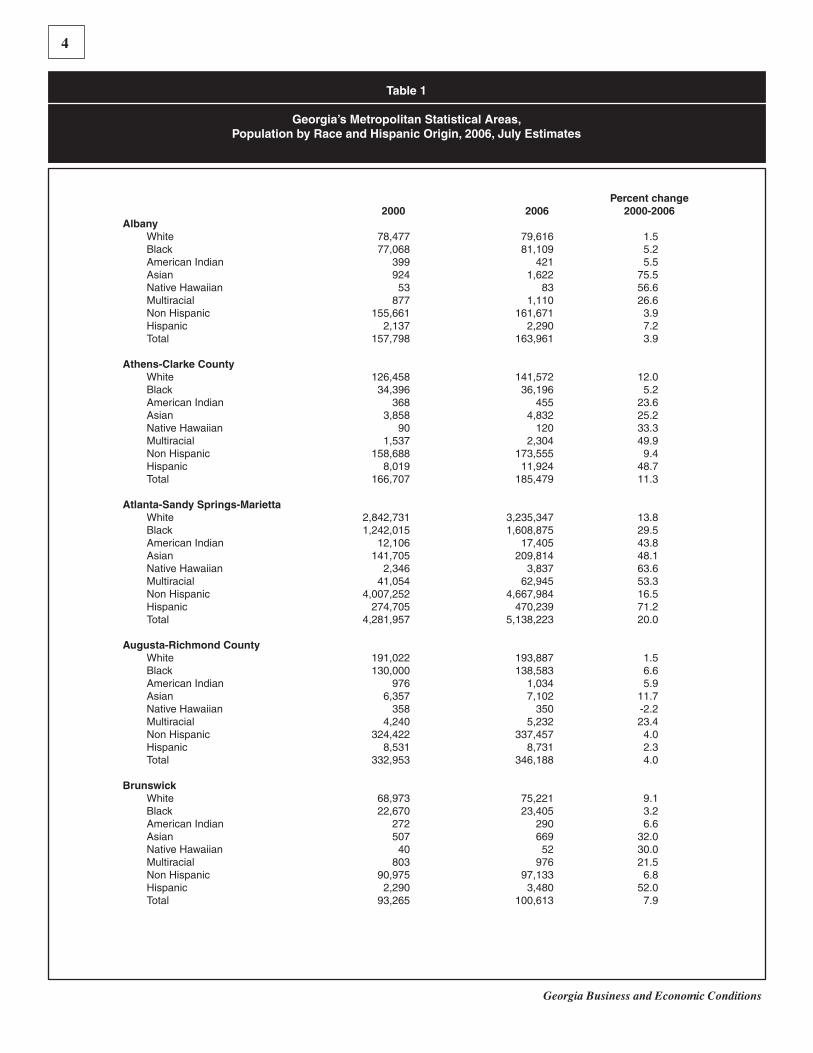
Georgia’s Metropolitan Statistical Areas, Population by Race and Hispanic Origin, 2006, July Estimates
Percent change 2000 2006 2000-2006Albany White 78,477 79,616 1.5 Black 77,068 81,109 5.2 American Indian 399 421 5.5 Asian 924 1,622 75.5 Native Hawaiian 53 83 56.6 Multiracial 877 1,110 26.6 Non Hispanic 155,661 161,671 3.9 Hispanic 2,137 2,290 7.2 Total 157,798 163,961 3.9
Athens-Clarke County White 126,458 141,572 12.0 Black 34,396 36,196 5.2 American Indian 368 455 23.6 Asian 3,858 4,832 25.2 Native Hawaiian 90 120 33.3 Multiracial 1,537 2,304 49.9 Non Hispanic 158,688 173,555 9.4 Hispanic 8,019 11,924 48.7 Total 166,707 185,479 11.3
Atlanta-Sandy Springs-Marietta White 2,842,731 3,235,347 13.8 Black 1,242,015 1,608,875 29.5 American Indian 12,106 17,405 43.8 Asian 141,705 209,814 48.1 Native Hawaiian 2,346 3,837 63.6 Multiracial 41,054 62,945 53.3 Non Hispanic 4,007,252 4,667,984 16.5 Hispanic 274,705 470,239 71.2 Total 4,281,957 5,138,223 20.0
Augusta-Richmond County White 191,022 193,887 1.5 Black 130,000 138,583 6.6 American Indian 976 1,034 5.9 Asian 6,357 7,102 11.7 Native Hawaiian 358 350 -2.2 Multiracial 4,240 5,232 23.4 Non Hispanic 324,422 337,457 4.0 Hispanic 8,531 8,731 2.3 Total 332,953 346,188 4.0
Brunswick White 68,973 75,221 9.1 Black 22,670 23,405 3.2 American Indian 272 290 6.6 Asian 507 669 32.0 Native Hawaiian 40 52 30.0 Multiracial 803 976 21.5 Non Hispanic 90,975 97,133 6.8 Hispanic 2,290 3,480 52.0 Total 93,265 100,613 7.9
First Quarter 2008
5
Georgia Business and Economic Conditions
Table 1 (Continued)
Georgia’s Metropolitan Statistical Areas, Population by Race and Hispanic Origin, 2006, July Estimates
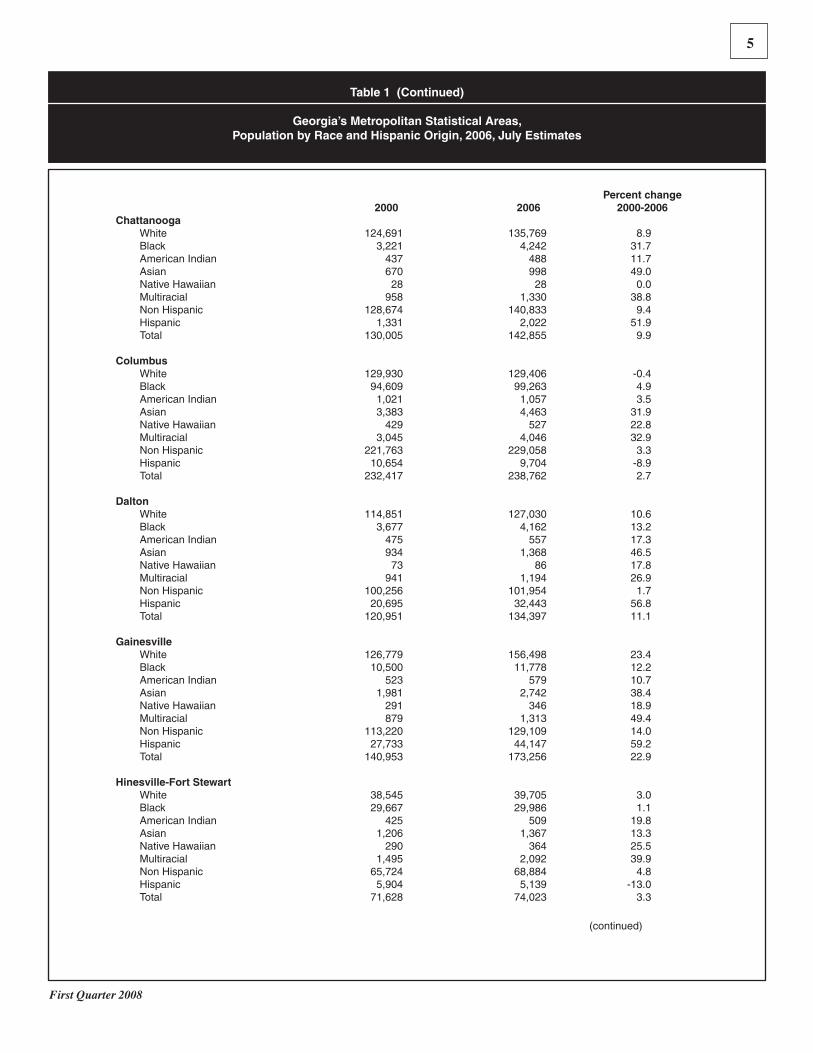
Percent change 2000 2006 2000-2006Chattanooga White 124,691 135,769 8.9 Black 3,221 4,242 31.7 American Indian 437 488 11.7 Asian 670 998 49.0 Native Hawaiian 28 28 0.0 Multiracial 958 1,330 38.8 Non Hispanic 128,674 140,833 9.4 Hispanic 1,331 2,022 51.9 Total 130,005 142,855 9.9
Columbus White 129,930 129,406 -0.4 Black 94,609 99,263 4.9 American Indian 1,021 1,057 3.5 Asian 3,383 4,463 31.9 Native Hawaiian 429 527 22.8 Multiracial 3,045 4,046 32.9 Non Hispanic 221,763 229,058 3.3 Hispanic 10,654 9,704 -8.9 Total 232,417 238,762 2.7
Dalton White 114,851 127,030 10.6 Black 3,677 4,162 13.2 American Indian 475 557 17.3 Asian 934 1,368 46.5 Native Hawaiian 73 86 17.8 Multiracial 941 1,194 26.9 Non Hispanic 100,256 101,954 1.7 Hispanic 20,695 32,443 56.8 Total 120,951 134,397 11.1
Gainesville White 126,779 156,498 23.4 Black 10,500 11,778 12.2 American Indian 523 579 10.7 Asian 1,981 2,742 38.4 Native Hawaiian 291 346 18.9 Multiracial 879 1,313 49.4 Non Hispanic 113,220 129,109 14.0 Hispanic 27,733 44,147 59.2 Total 140,953 173,256 22.9
Hinesville-Fort Stewart White 38,545 39,705 3.0 Black 29,667 29,986 1.1 American Indian 425 509 19.8 Asian 1,206 1,367 13.3 Native Hawaiian 290 364 25.5 Multiracial 1,495 2,092 39.9 Non Hispanic 65,724 68,884 4.8 Hispanic 5,904 5,139 -13.0 Total 71,628 74,023 3.3
(continued)
6
Georgia Business and Economic Conditions
Table 1 (Continued)
Georgia’s Metropolitan Statistical Areas, Population by Race and Hispanic Origin, 2006, July Estimates
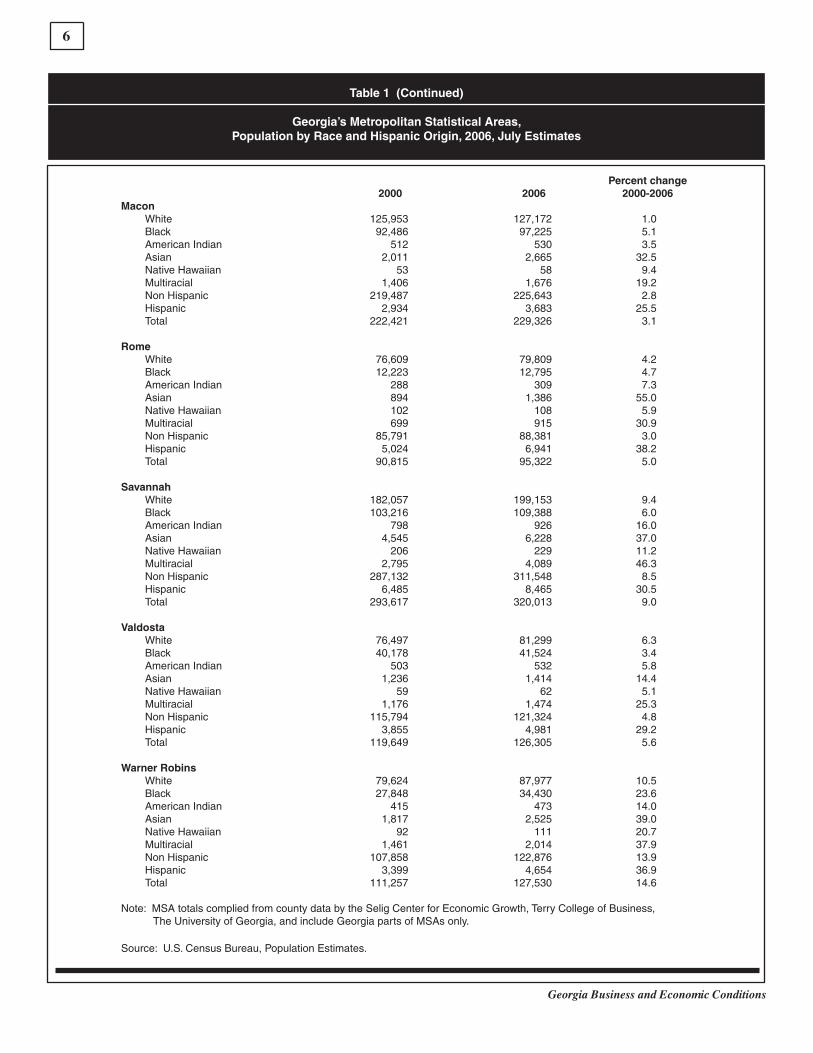
Percent change 2000 2006 2000-2006Macon White 125,953 127,172 1.0 Black 92,486 97,225 5.1 American Indian 512 530 3.5 Asian 2,011 2,665 32.5 Native Hawaiian 53 58 9.4 Multiracial 1,406 1,676 19.2 Non Hispanic 219,487 225,643 2.8 Hispanic 2,934 3,683 25.5 Total 222,421 229,326 3.1
Rome White 76,609 79,809 4.2 Black 12,223 12,795 4.7 American Indian 288 309 7.3 Asian 894 1,386 55.0 Native Hawaiian 102 108 5.9 Multiracial 699 915 30.9 Non Hispanic 85,791 88,381 3.0 Hispanic 5,024 6,941 38.2 Total 90,815 95,322 5.0
Savannah White 182,057 199,153 9.4 Black 103,216 109,388 6.0 American Indian 798 926 16.0 Asian 4,545 6,228 37.0 Native Hawaiian 206 229 11.2 Multiracial 2,795 4,089 46.3 Non Hispanic 287,132 311,548 8.5 Hispanic 6,485 8,465 30.5 Total 293,617 320,013 9.0
Valdosta White 76,497 81,299 6.3 Black 40,178 41,524 3.4 American Indian 503 532 5.8 Asian 1,236 1,414 14.4 Native Hawaiian 59 62 5.1 Multiracial 1,176 1,474 25.3 Non Hispanic 115,794 121,324 4.8 Hispanic 3,855 4,981 29.2 Total 119,649 126,305 5.6
Warner Robins White 79,624 87,977 10.5 Black 27,848 34,430 23.6 American Indian 415 473 14.0 Asian 1,817 2,525 39.0 Native Hawaiian 92 111 20.7 Multiracial 1,461 2,014 37.9 Non Hispanic 107,858 122,876 13.9 Hispanic 3,399 4,654 36.9 Total 111,257 127,530 14.6
Note: MSA totals complied from county data by the Selig Center for Economic Growth, Terry College of Business, The University of Georgia, and include Georgia parts of MSAs only.
Source: U.S. Census Bureau, Population Estimates.
7
First Quarter 2008
Table 2
Population of Georgia Metropolitan Statistical Areas, 2000 and 2006, in Order of Population Size, 2006
Percent change MSA 2000 2006 2000-2006
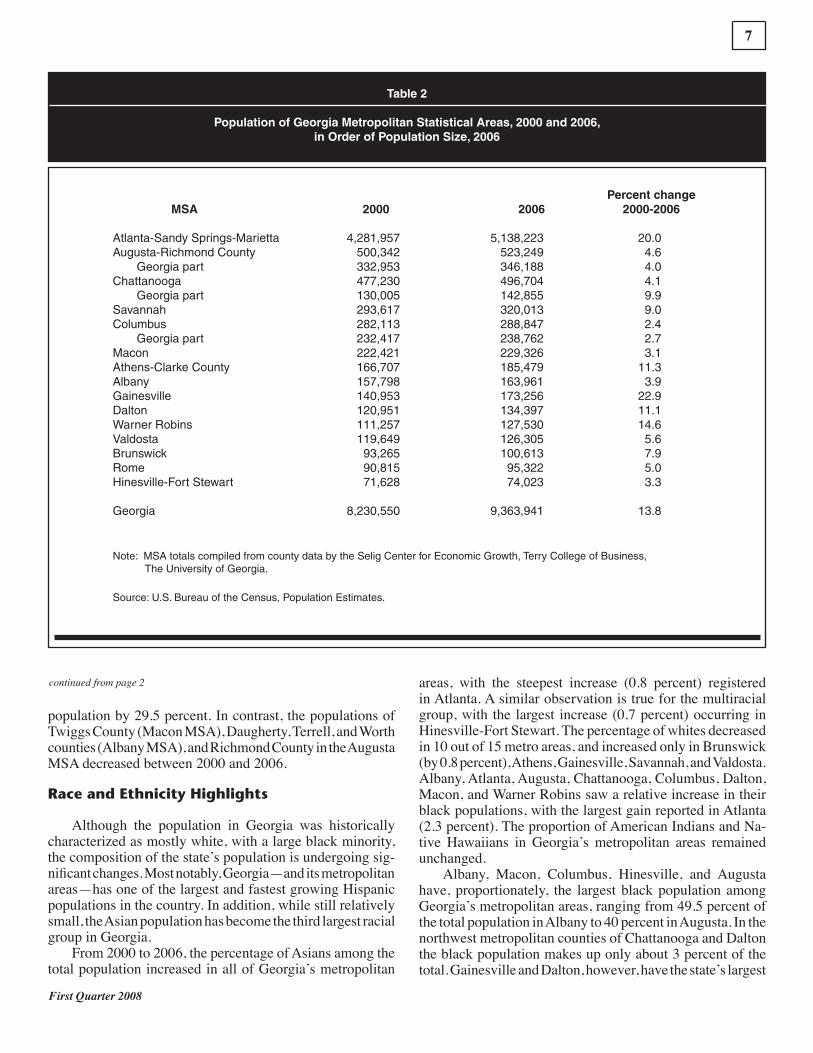
Atlanta-Sandy Springs-Marietta 4,281,957 5,138,223 20.0Augusta-Richmond County 500,342 523,249 4.6 Georgia part 332,953 346,188 4.0Chattanooga 477,230 496,704 4.1 Georgia part 130,005 142,855 9.9Savannah 293,617 320,013 9.0Columbus 282,113 288,847 2.4 Georgia part 232,417 238,762 2.7Macon 222,421 229,326 3.1Athens-Clarke County 166,707 185,479 11.3Albany 157,798 163,961 3.9Gainesville 140,953 173,256 22.9Dalton 120,951 134,397 11.1Warner Robins 111,257 127,530 14.6Valdosta 119,649 126,305 5.6Brunswick 93,265 100,613 7.9Rome 90,815 95,322 5.0Hinesville-Fort Stewart 71,628 74,023 3.3 Georgia 8,230,550 9,363,941 13.8
Note: MSA totals compiled from county data by the Selig Center for Economic Growth, Terry College of Business, The University of Georgia.
Source: U.S. Bureau of the Census, Population Estimates.
continued from page 2
population by 29.5 percent. In contrast, the populations of Twiggs County (Macon MSA), Daugherty, Terrell, and Worth counties (Albany MSA), and Richmond County in the Augusta MSA decreased between 2000 and 2006.
Race and Ethnicity Highlights
Although the population in Georgia was historically characterized as mostly white, with a large black minority, the composition of the state’s population is undergoing sig-nificant changes. Most notably, Georgia—and its metropolitan areas—has one of the largest and fastest growing Hispanic populations in the country. In addition, while still relatively small, the Asian population has become the third largest racial group in Georgia. From 2000 to 2006, the percentage of Asians among the total population increased in all of Georgia’s metropolitan
areas, with the steepest increase (0.8 percent) registered in Atlanta. A similar observation is true for the multiracial group, with the largest increase (0.7 percent) occurring in Hinesville-Fort Stewart. The percentage of whites decreased in 10 out of 15 metro areas, and increased only in Brunswick (by 0.8 percent), Athens, Gainesville, Savannah, and Valdosta. Albany, Atlanta, Augusta, Chattanooga, Columbus, Dalton, Macon, and Warner Robins saw a relative increase in their black populations, with the largest gain reported in Atlanta (2.3 percent). The proportion of American Indians and Na-tive Hawaiians in Georgia’s metropolitan areas remained unchanged. Albany, Macon, Columbus, Hinesville, and Augusta have, proportionately, the largest black population among Georgia’s metropolitan areas, ranging from 49.5 percent of the total population in Albany to 40 percent in Augusta. In the northwest metropolitan counties of Chattanooga and Dalton the black population makes up only about 3 percent of the total. Gainesville and Dalton, however, have the state’s largest
8
Georgia Business and Economic Conditions
The enormous economic clout of the nation’s Hispanics, African Americans, Asians, and Native Americans is detailed in the new 2007 edition of the popular and widely-quoted study of minority buying power. Developed by the Selig Center for Economic Growth, this definitive data series for 1990-2007 and the projections for 2008
through 2012 are essential to business analysts, marketing specialists, product developers, advertisers, and researchers. Completely revised
data are available for the U.S. and all fifty states; and county data are included for Georgia and Florida.
Used by companies nationwide, the Minority Buying Power data series is quoted in Business Week, The Wall Street Journal, The Financial Times and
USA TODAY.
The Multicultural EconomyMinority Buying Power in 2007
proportions of Hispanic population (25.5 percent of the total in Gainesville and 24.1 percent in Dalton). Atlanta, Athens, and Augusta, on the other hand, have the largest concentra-tions of Asians—4.1 percent in Atlanta, 2.6 percent in Athens, and 2.1 percent in Augusta. Warner Robins and Savannah follow closely with 2 and 1.9 percent, respectively. Georgia—and its metropolitan areas—has one of the larg-est and fastest growing Hispanic populations in the country. Between 2000 and 2006, the number of Hispanics in the Atlanta area increased by 71.2 percent, from 274,705 in 2000 to 470,239 in 2006. Today, Hispanics and Latinos make up over 9.2 percent of the population in the Atlanta metro area. The Hispanic population jumped by between 25.5 percent (Macon) and 59.2 percent (Gainesville) in most of the other metro areas in the state, except for Augusta and Albany, where these increased by a relatively modest 2.3 percent and 7.2 percent, respectively. Gainesville, Dalton, Atlanta, and Rome have the largest concentration of Hispanic population in the state, ranging from 25.5 percent and 24.1 percent in Gainesville and Dalton, to 9.2 percent and 7.3 percent in Atlanta and Rome.
Educational Attainment
Nationwide, 84.1 percent of residents over 24 years of age have completed high school. In 2006, only four of Georgia’s
metropolitan areas exceed this average: Warner Robins (87.9 percent), Hinesville-Fort Stewart (87.3 percent), Atlanta (85.8 percent), and Savannah (85.1 percent). Warner Robins and Atlanta, where close to 60 percent of residents over the age of 24 either attended or graduated from college, have the best educated labor force among the state’s metropolitan areas. Five other metro areas report that over 50 percent of their residents have at least some college education: Athens (53.8 percent), Hinesville (51.9 percent), Savannah (51.6 percent), Columbus (50.5 percent), and Augusta (50 percent). Albany followed closely with 49.3 percent. In Brunswick, Valdosta, and Macon, the percentage of residents with college experience or diplomas ranged from 46.7 percent (Brunswick) to 45.1 percent (Macon). Rome and Gainesville report close to 44 percent of their residents having at least some college education, with Dalton clocking in at 31.4 percent. While Atlanta and Warner Robins exceed the U.S. average (53.9 percent), Athens trails by a smidgen (0.1 percent). Atlanta, Athens, Savannah, and Warner Robins have the largest portions of population (age 25 and over) with college degrees. In these areas, the proportion of college graduates ranges from 33.3 percent (Atlanta) to 24.2 percent (Warner Robins). Athens has the highest proportion of residents with graduate-level education. In Warner Robins, Atlanta, and Savannah the proportion of residents with less than a high
9
First Quarter 2008
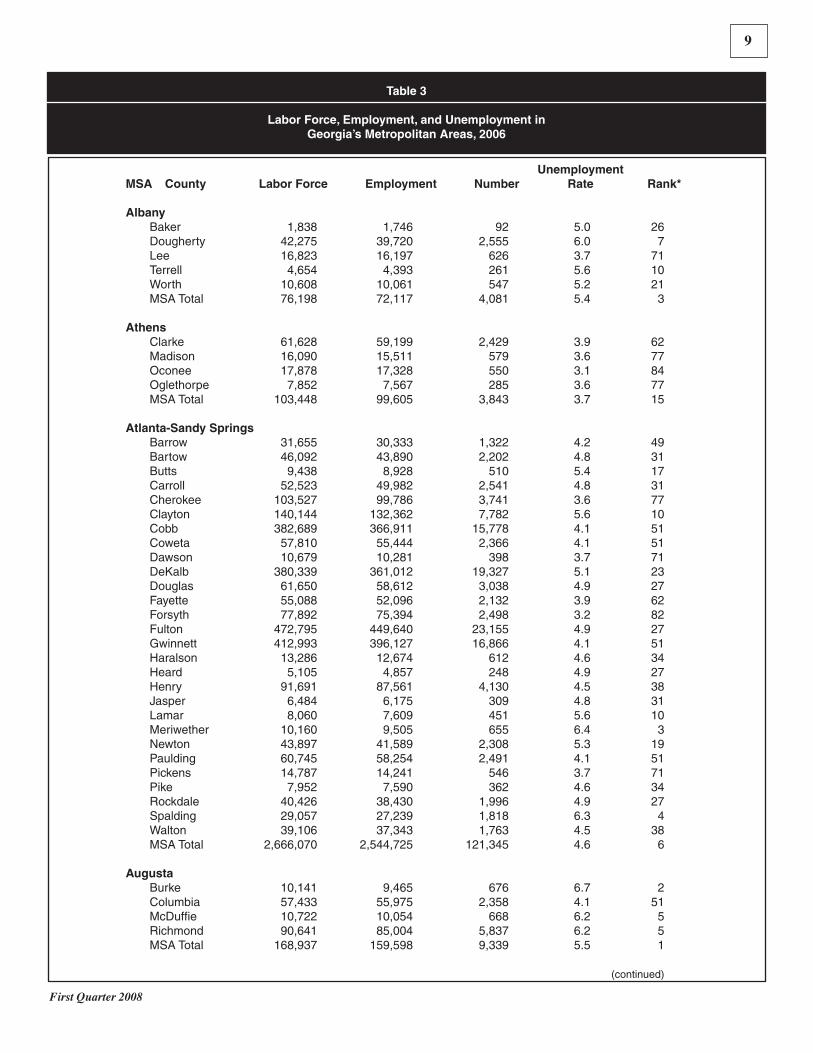
Table 3
Labor Force, Employment, and Unemployment in Georgia’s Metropolitan Areas, 2006
Unemployment MSA County Labor Force Employment Number Rate Rank*
Albany Baker 1,838 1,746 92 5.0 26 Dougherty 42,275 39,720 2,555 6.0 7 Lee 16,823 16,197 626 3.7 71 Terrell 4,654 4,393 261 5.6 10 Worth 10,608 10,061 547 5.2 21 MSA Total 76,198 72,117 4,081 5.4 3
Athens Clarke 61,628 59,199 2,429 3.9 62 Madison 16,090 15,511 579 3.6 77 Oconee 17,878 17,328 550 3.1 84 Oglethorpe 7,852 7,567 285 3.6 77 MSA Total 103,448 99,605 3,843 3.7 15
Atlanta-Sandy Springs Barrow 31,655 30,333 1,322 4.2 49 Bartow 46,092 43,890 2,202 4.8 31 Butts 9,438 8,928 510 5.4 17 Carroll 52,523 49,982 2,541 4.8 31 Cherokee 103,527 99,786 3,741 3.6 77 Clayton 140,144 132,362 7,782 5.6 10 Cobb 382,689 366,911 15,778 4.1 51 Coweta 57,810 55,444 2,366 4.1 51 Dawson 10,679 10,281 398 3.7 71 DeKalb 380,339 361,012 19,327 5.1 23 Douglas 61,650 58,612 3,038 4.9 27 Fayette 55,088 52,096 2,132 3.9 62 Forsyth 77,892 75,394 2,498 3.2 82 Fulton 472,795 449,640 23,155 4.9 27 Gwinnett 412,993 396,127 16,866 4.1 51 Haralson 13,286 12,674 612 4.6 34 Heard 5,105 4,857 248 4.9 27 Henry 91,691 87,561 4,130 4.5 38 Jasper 6,484 6,175 309 4.8 31 Lamar 8,060 7,609 451 5.6 10 Meriwether 10,160 9,505 655 6.4 3 Newton 43,897 41,589 2,308 5.3 19 Paulding 60,745 58,254 2,491 4.1 51 Pickens 14,787 14,241 546 3.7 71 Pike 7,952 7,590 362 4.6 34 Rockdale 40,426 38,430 1,996 4.9 27 Spalding 29,057 27,239 1,818 6.3 4 Walton 39,106 37,343 1,763 4.5 38 MSA Total 2,666,070 2,544,725 121,345 4.6 6
Augusta Burke 10,141 9,465 676 6.7 2 Columbia 57,433 55,975 2,358 4.1 51 McDuffie 10,722 10,054 668 6.2 5 Richmond 90,641 85,004 5,837 6.2 5 MSA Total 168,937 159,598 9,339 5.5 1
(continued)
Unemployment MSA County Labor Force Employment Number Rate Rank*
Brunswick Brantley 7,842 7,482 360 4.6 34 Glynn 40,447 38,904 1,543 3.8 68 McIntosh 5,407 5,182 225 4.2 49 MSA Total 53,696 51,568 2,128 4.0 11
Chattanooga Catoosa 35,902 34,573 1,329 3.7 71 Dade 8,686 8,335 351 4.0 58 Walker 33,884 32,399 1,485 4.4 43 MSA Total 78,472 75,307 3,165 4.0 10
Columbus Chattahoochee 2,687 2,433 254 9.5 1 Harris 15,574 14,990 584 3.7 71 Marion 3,460 3,307 153 4.4 43 Muscogee 86,121 81,409 4,712 5.5 14 MSA Total 107,842 102,139 5,703 5.3 4
Dalton Murray 21,771 20,841 930 4.3 45 Whitfield 47,226 45,117 2,109 4.5 38 MSA Total 68,997 65,958 3,039 4.4 7
Gainesville Hall 86,559 83,263 3,296 3.8 68 MSA Total 86,559 83,263 3,296 3.8 14
Hinesville-Fort Stewart Liberty 24,042 22,711 1,331 5.5 14 Long 6,035 5,811 224 3.7 71 MSA Total 30,077 28,522 1,555 5.2 5
Macon Bibb 74,190 69,960 4,230 5.7 9 Crawford 6,337 6,012 325 5.1 23 Jones 13,962 13,249 713 5.1 23 Monroe 12,861 12,276 585 4.5 38 Twiggs 4,683 4,410 273 5.8 8 MSA Total 112,033 105,907 6,126 5.5 2
Rome Floyd 51,711 49,494 2,217 4.3 45 MSA Total 51,711 49,494 2,217 4.3 9
Savannah Bryan 16,044 15,480 564 3.5 80 Chatham 130,632 125,385 5,247 4.0 58 Effingham 26,843 25,946 897 3.3 81 MSA Total 173,519 166,811 6,708 3.9 13
(continued)
Georgia Business and Economic Conditions
10
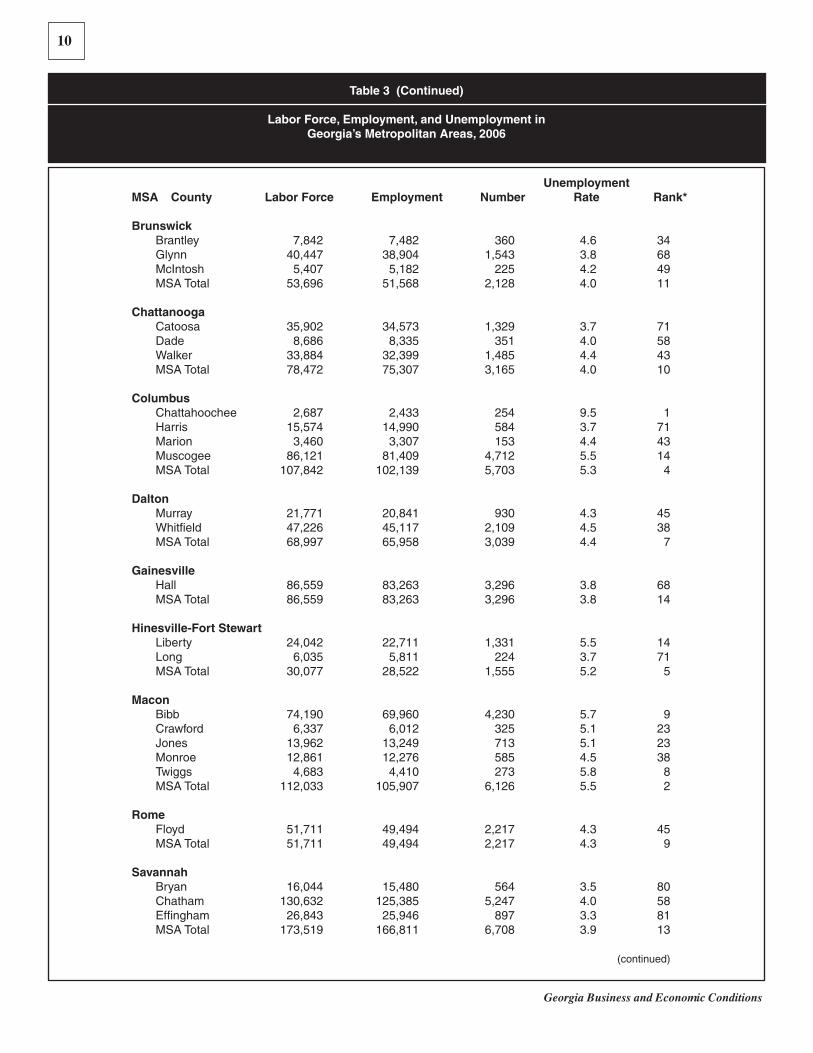
Table 3 (Continued)
Labor Force, Employment, and Unemployment in Georgia’s Metropolitan Areas, 2006
11
Georgia Business and Economic Conditions First Quarter 2008
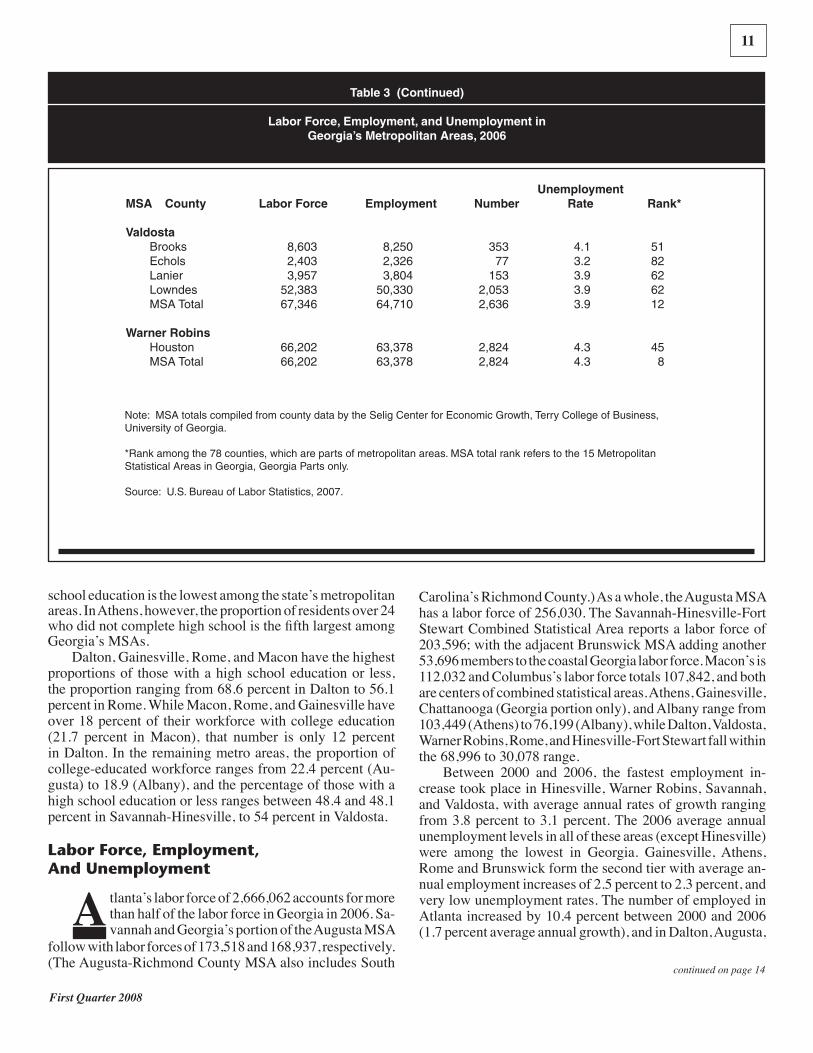
Table 3 (Continued)
Labor Force, Employment, and Unemployment in Georgia’s Metropolitan Areas, 2006
Unemployment MSA County Labor Force Employment Number Rate Rank*
Valdosta Brooks 8,603 8,250 353 4.1 51 Echols 2,403 2,326 77 3.2 82 Lanier 3,957 3,804 153 3.9 62 Lowndes 52,383 50,330 2,053 3.9 62 MSA Total 67,346 64,710 2,636 3.9 12
Warner Robins Houston 66,202 63,378 2,824 4.3 45 MSA Total 66,202 63,378 2,824 4.3 8
Note: MSA totals compiled from county data by the Selig Center for Economic Growth, Terry College of Business, University of Georgia. *Rank among the 78 counties, which are parts of metropolitan areas. MSA total rank refers to the 15 Metropolitan Statistical Areas in Georgia, Georgia Parts only.
Source: U.S. Bureau of Labor Statistics, 2007.
school education is the lowest among the state’s metropolitan areas. In Athens, however, the proportion of residents over 24 who did not complete high school is the fifth largest among Georgia’s MSAs. Dalton, Gainesville, Rome, and Macon have the highest proportions of those with a high school education or less, the proportion ranging from 68.6 percent in Dalton to 56.1 percent in Rome. While Macon, Rome, and Gainesville have over 18 percent of their workforce with college education (21.7 percent in Macon), that number is only 12 percent in Dalton. In the remaining metro areas, the proportion of college-educated workforce ranges from 22.4 percent (Au-gusta) to 18.9 (Albany), and the percentage of those with a high school education or less ranges between 48.4 and 48.1 percent in Savannah-Hinesville, to 54 percent in Valdosta.
Labor Force, Employment, And Unemployment
tlanta’s labor force of 2,666,062 accounts for more than half of the labor force in Georgia in 2006. Sa-vannah and Georgia’s portion of the Augusta MSA A
follow with labor forces of 173,518 and 168,937, respectively. (The Augusta-Richmond County MSA also includes South
Carolina’s Richmond County.) As a whole, the Augusta MSA has a labor force of 256,030. The Savannah-Hinesville-Fort Stewart Combined Statistical Area reports a labor force of 203,596; with the adjacent Brunswick MSA adding another 53,696 members to the coastal Georgia labor force. Macon’s is 112,032 and Columbus’s labor force totals 107,842, and both are centers of combined statistical areas. Athens, Gainesville, Chattanooga (Georgia portion only), and Albany range from 103,449 (Athens) to 76,199 (Albany), while Dalton, Valdosta, Warner Robins, Rome, and Hinesville-Fort Stewart fall within the 68,996 to 30,078 range.
Between 2000 and 2006, the fastest employment in-crease took place in Hinesville, Warner Robins, Savannah, and Valdosta, with average annual rates of growth ranging from 3.8 percent to 3.1 percent. The 2006 average annual unemployment levels in all of these areas (except Hinesville) were among the lowest in Georgia. Gainesville, Athens, Rome and Brunswick form the second tier with average an-nual employment increases of 2.5 percent to 2.3 percent, and very low unemployment rates. The number of employed in Atlanta increased by 10.4 percent between 2000 and 2006 (1.7 percent average annual growth), and in Dalton, Augusta,
continued on page 14
12
Georgia Business and Economic Conditions
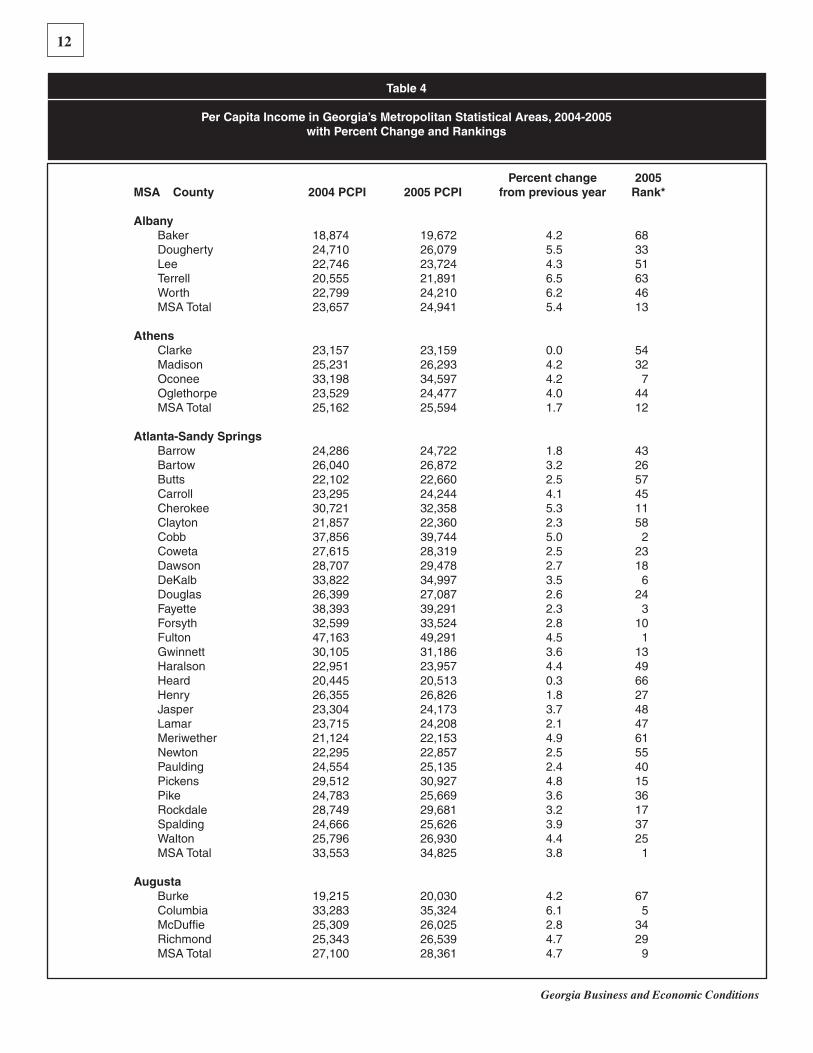
Table 4
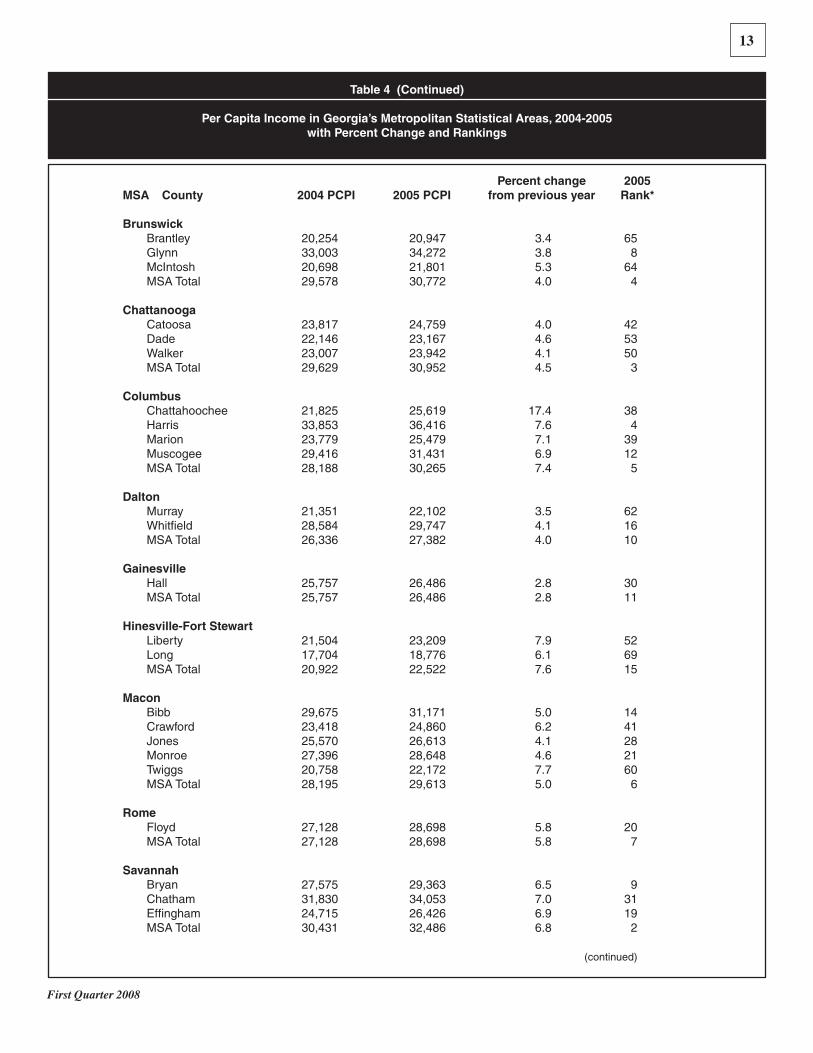
Per Capita Income in Georgia’s Metropolitan Statistical Areas, 2004-2005 with Percent Change and Rankings
Percent change 2005 MSA County 2004 PCPI 2005 PCPI from previous year Rank*
Albany Baker 18,874 19,672 4.2 68 Dougherty 24,710 26,079 5.5 33 Lee 22,746 23,724 4.3 51 Terrell 20,555 21,891 6.5 63 Worth 22,799 24,210 6.2 46 MSA Total 23,657 24,941 5.4 13
Athens Clarke 23,157 23,159 0.0 54 Madison 25,231 26,293 4.2 32 Oconee 33,198 34,597 4.2 7 Oglethorpe 23,529 24,477 4.0 44 MSA Total 25,162 25,594 1.7 12
Atlanta-Sandy Springs Barrow 24,286 24,722 1.8 43 Bartow 26,040 26,872 3.2 26 Butts 22,102 22,660 2.5 57 Carroll 23,295 24,244 4.1 45 Cherokee 30,721 32,358 5.3 11 Clayton 21,857 22,360 2.3 58 Cobb 37,856 39,744 5.0 2 Coweta 27,615 28,319 2.5 23 Dawson 28,707 29,478 2.7 18 DeKalb 33,822 34,997 3.5 6 Douglas 26,399 27,087 2.6 24 Fayette 38,393 39,291 2.3 3 Forsyth 32,599 33,524 2.8 10 Fulton 47,163 49,291 4.5 1 Gwinnett 30,105 31,186 3.6 13 Haralson 22,951 23,957 4.4 49 Heard 20,445 20,513 0.3 66 Henry 26,355 26,826 1.8 27 Jasper 23,304 24,173 3.7 48 Lamar 23,715 24,208 2.1 47 Meriwether 21,124 22,153 4.9 61 Newton 22,295 22,857 2.5 55 Paulding 24,554 25,135 2.4 40 Pickens 29,512 30,927 4.8 15 Pike 24,783 25,669 3.6 36 Rockdale 28,749 29,681 3.2 17 Spalding 24,666 25,626 3.9 37 Walton 25,796 26,930 4.4 25 MSA Total 33,553 34,825 3.8 1
Augusta Burke 19,215 20,030 4.2 67 Columbia 33,283 35,324 6.1 5 McDuffie 25,309 26,025 2.8 34 Richmond 25,343 26,539 4.7 29 MSA Total 27,100 28,361 4.7 9
13
First Quarter 2008
Table 4 (Continued)
Per Capita Income in Georgia’s Metropolitan Statistical Areas, 2004-2005 with Percent Change and Rankings
Percent change 2005 MSA County 2004 PCPI 2005 PCPI from previous year Rank*
Brunswick Brantley 20,254 20,947 3.4 65 Glynn 33,003 34,272 3.8 8 McIntosh 20,698 21,801 5.3 64 MSA Total 29,578 30,772 4.0 4
Chattanooga Catoosa 23,817 24,759 4.0 42 Dade 22,146 23,167 4.6 53 Walker 23,007 23,942 4.1 50 MSA Total 29,629 30,952 4.5 3
Columbus Chattahoochee 21,825 25,619 17.4 38 Harris 33,853 36,416 7.6 4 Marion 23,779 25,479 7.1 39 Muscogee 29,416 31,431 6.9 12 MSA Total 28,188 30,265 7.4 5
Dalton Murray 21,351 22,102 3.5 62 Whitfield 28,584 29,747 4.1 16 MSA Total 26,336 27,382 4.0 10
Gainesville Hall 25,757 26,486 2.8 30 MSA Total 25,757 26,486 2.8 11
Hinesville-Fort Stewart Liberty 21,504 23,209 7.9 52 Long 17,704 18,776 6.1 69 MSA Total 20,922 22,522 7.6 15
Macon Bibb 29,675 31,171 5.0 14 Crawford 23,418 24,860 6.2 41 Jones 25,570 26,613 4.1 28 Monroe 27,396 28,648 4.6 21 Twiggs 20,758 22,172 7.7 60 MSA Total 28,195 29,613 5.0 6
Rome Floyd 27,128 28,698 5.8 20 MSA Total 27,128 28,698 5.8 7
Savannah Bryan 27,575 29,363 6.5 9 Chatham 31,830 34,053 7.0 31 Effingham 24,715 26,426 6.9 19 MSA Total 30,431 32,486 6.8 2
(continued)
14
Georgia Business and Economic Conditions
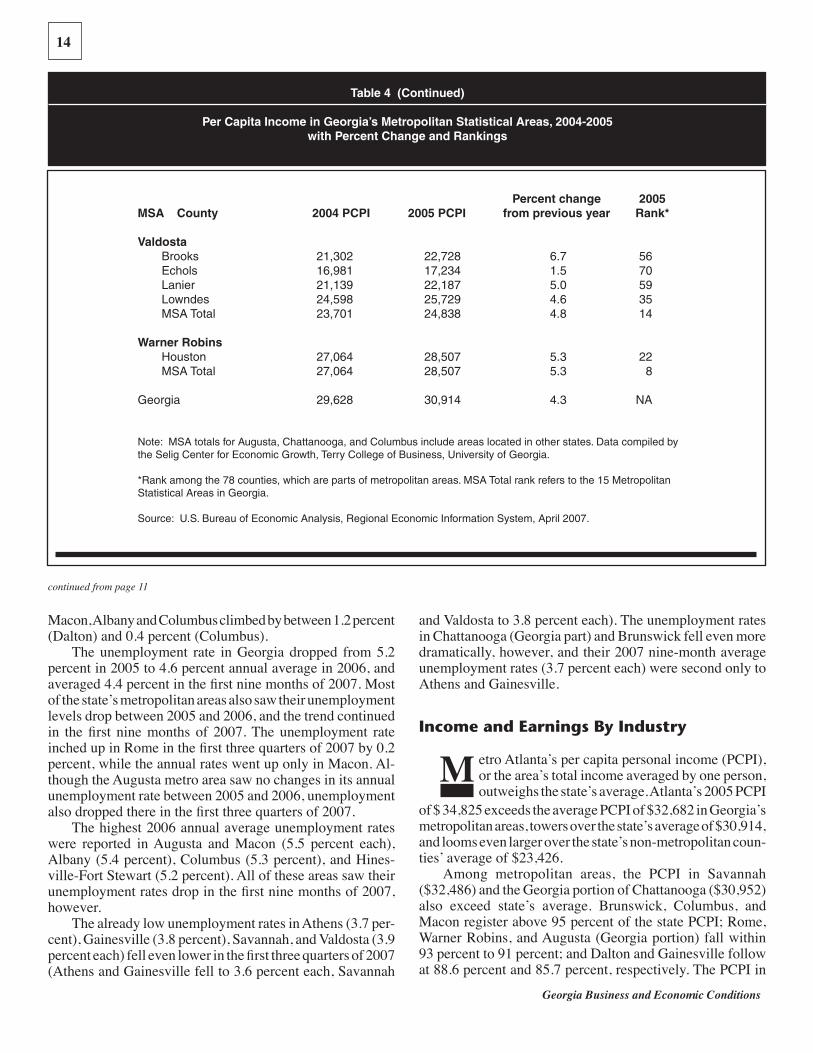
Table 4 (Continued)
Per Capita Income in Georgia’s Metropolitan Statistical Areas, 2004-2005 with Percent Change and Rankings
Percent change 2005 MSA County 2004 PCPI 2005 PCPI from previous year Rank*
Valdosta Brooks 21,302 22,728 6.7 56 Echols 16,981 17,234 1.5 70 Lanier 21,139 22,187 5.0 59 Lowndes 24,598 25,729 4.6 35 MSA Total 23,701 24,838 4.8 14
Warner Robins Houston 27,064 28,507 5.3 22 MSA Total 27,064 28,507 5.3 8 Georgia 29,628 30,914 4.3 NA
Note: MSA totals for Augusta, Chattanooga, and Columbus include areas located in other states. Data compiled by the Selig Center for Economic Growth, Terry College of Business, University of Georgia. *Rank among the 78 counties, which are parts of metropolitan areas. MSA Total rank refers to the 15 Metropolitan Statistical Areas in Georgia.
Source: U.S. Bureau of Economic Analysis, Regional Economic Information System, April 2007.
Macon, Albany and Columbus climbed by between 1.2 percent (Dalton) and 0.4 percent (Columbus).
The unemployment rate in Georgia dropped from 5.2 percent in 2005 to 4.6 percent annual average in 2006, and averaged 4.4 percent in the first nine months of 2007. Most of the state’s metropolitan areas also saw their unemployment levels drop between 2005 and 2006, and the trend continued in the first nine months of 2007. The unemployment rate inched up in Rome in the first three quarters of 2007 by 0.2 percent, while the annual rates went up only in Macon. Al-though the Augusta metro area saw no changes in its annual unemployment rate between 2005 and 2006, unemployment also dropped there in the first three quarters of 2007.
The highest 2006 annual average unemployment rates were reported in Augusta and Macon (5.5 percent each), Albany (5.4 percent), Columbus (5.3 percent), and Hines-ville-Fort Stewart (5.2 percent). All of these areas saw their unemployment rates drop in the first nine months of 2007, however.
The already low unemployment rates in Athens (3.7 per-cent), Gainesville (3.8 percent), Savannah, and Valdosta (3.9 percent each) fell even lower in the first three quarters of 2007 (Athens and Gainesville fell to 3.6 percent each, Savannah
continued from page 11
and Valdosta to 3.8 percent each). The unemployment rates in Chattanooga (Georgia part) and Brunswick fell even more dramatically, however, and their 2007 nine-month average unemployment rates (3.7 percent each) were second only to Athens and Gainesville.
Income and Earnings By Industry
etro Atlanta’s per capita personal income (PCPI), or the area’s total income averaged by one person, outweighs the state’s average. Atlanta’s 2005 PCPI
Mof $ 34,825 exceeds the average PCPI of $32,682 in Georgia’s metropolitan areas, towers over the state’s average of $30,914, and looms even larger over the state’s non-metropolitan coun-ties’ average of $23,426. Among metropolitan areas, the PCPI in Savannah ($32,486) and the Georgia portion of Chattanooga ($30,952) also exceed state’s average. Brunswick, Columbus, and Macon register above 95 percent of the state PCPI; Rome, Warner Robins, and Augusta (Georgia portion) fall within 93 percent to 91 percent; and Dalton and Gainesville follow at 88.6 percent and 85.7 percent, respectively. The PCPI in
Athens, Albany, and Valdosta falls within 82.8 percent to 80.3 percent of the state average, while Hinesville-Fort Stewart’s PCPI amounts to 72.9 percent of the state’s PCPI. Even though Hinesville’s per capita income falls behind both state and other MSAs averages, the area’s 28.5 percent (or 6.5 percent annual average) PCPI increase between 2001 and 2005 exceeds increases in all other metro areas. The relatively high PCPIs in Savannah and Brunswick have also exhibited some of the fastest increases: per capita income in these areas, together with Columbus and Rome, increased by a 4.5 percent (Columbus) to 3.9 percent (Rome) annual average between 2001 and 2005. During the same period, Augusta, Chattanooga, Valdosta, Dalton, Warner Robins, Macon, and Albany saw their PCPIs climb by 3.4 to 2.9 percent annually. Per capita personal income increased at the slowest pace in Athens, Gainesville, and Atlanta (2.1 percent to 1.1 percent average 2001-2005 annual growth). In comparison, the 2001-2005 annual average increase in the Consumer Price Index in the South amounted to 2.3 percent. Therefore, incomes in most of the areas, except for the coast and Columbus (where incomes increased more rapidly) managed to keep ahead of inflation only by very small margins, while incomes in Athens, Gainesville, and Atlanta actually fell behind. Total personal income is derived from three main cat-egories: earnings; dividends, interest, and rent; and transfer payments. An increase in an area’s personal income can be explained, for example, by rising proprietors’ incomes, ris-ing employment, or higher earnings. A large proportion of income derived from investments and property (dividends, interest, and rent) points to a relatively large group of affluent residents, or retirees. A significant proportion of income sup-plied by transfer payments indicates recipients of government payments, such as military retirement, disability, Medicare, Medicaid, unemployment insurance, income maintenance, and student loans. Compared to other MSAs in Georgia, the largest portion of personal income in Atlanta comes from earnings, and a relatively small part comes from government payments; therefore, the area’s income responds quickly to the employ-ment market’s ups and downs. Atlanta’s earnings are remark-ably evenly distributed among several large sectors, with a relatively small government sector providing 11.9 percent of earnings, professional and technical services providing 11.1 percent, and manufacturing, information, financial services, trade, health care, social assistance, and construction each providing between 8.6 percent and 6.5 percent of earnings. Earnings climbed in all of Atlanta’s industry sectors, with the exception of transportation, where earnings shrank in 2005 compared to 2004. Albany, Athens, Macon, Rome, and Savannah are char-acterized by a large portion of earnings provided by the gov-ernment, manufacturing, and health care sectors, with Rome distinguished among this group by large portions of earnings provided by the manufacturing and health service sectors (28.7 percent and 18.6 percent, respectively). Compared to the other MSAs, in 2005 Rome derived the second highest portion of its personal income from transfer payments.
The Athens MSA derives 33.1 percent of its earnings from government employment. Although its relatively low PCPI ranks 12 among the metropolitan areas, the area enjoys consistently low unemployment—3.7 percent average in 2006. Personal income in Athens includes the state’s third largest portion provided by dividends, interest, and rent, which include payments by retirement plans and other investment and property income. The portion provided by transfer pay-ments is relatively low. Albany, which ranks 13 in per capita personal income, has the third highest unemployment rate among Georgia’s metropolitan areas, and derives a major part of its income (21 percent) from transfer payments. In contrast, Savannah’s and Macon’s PCPIs rank sec-ond and sixth, respectively, among Georgia’s MSAs. While Savannah’s unemployment rates are consistently well below the state average, the 5.5 percent average annual unemploy-ment rate in Macon in 2006 is noticeably above the state average of 4.6 percent. While the dividends, interest, and rent portion of personal income in Savannah is the second highest in the state, trailing after Brunswick, the portion of income provided by earnings is also relatively high, and the percentage of income derived from transfer payments is one of the lowest among Georgia’s MSAs. In Macon, earnings provide smaller part of income than in Savannah, and the percentage derived from transfer payments is the fourth largest in the state. A relatively large portion of income (sixth among the metropolitan areas) is derived from property (dividends, interest, and rent). Hinesville and Warner Robins are notable because a large part of their metropolitan areas’ earnings come from the government—80.1 percent and 59.8 percent, respectively. In addition to government, Warner Robins derives a relatively large portion (8 percent) of its earnings from professional and technical services. While Warner Robins’ PCPI of $28,507 ranks eighth among the MSAs, Hinesville is dead last at $22,522, well below the state, metro, and even non-metro area average. Earnings constitute the second and third highest portions of income in Hinesville and Warner Robins, compared to other metropolitan areas in Georgia. While unemployment in Warner Robins fell below the state average in the first nine months of 2007, the unemployment rate in Hinesville-Fort Stewart inched above the state average by 0.4 percent in 2007. Relatively small portions of income in both areas are derived from property and transfer payments, although Warner Robins reports a much lower percentage derived from transfer payments than Hinesville. In fact, Warner Robins has the second lowest portion of income derived from current transfer payments among Georgia’s metropolitan areas. Manufacturing provides the largest portion of earnings in Dalton, Rome, and Gainesville (43.9 percent, 28.7 percent, and 26 percent, respectively). Average weekly wages in manufacturing are relatively low in Dalton and Gainesville, however. On the other hand, Dalton follows Atlanta with the second highest portion of earnings derived from the well-paid professional and technical services sector, while Gainesville’s government and healthcare sectors each provide 13 percent of the area’s earnings. Dalton and Gainesville rank 10 and
15
First Quarter 2008
11, respectively, in PCPI among the state’s 15 metropolitan areas. The 2006 unemployment rate in Gainesville (3.8 per-cent) belonged to the lowest in the state, and Dalton’s stayed slightly below the state average. Both Dalton and Gainesville derive relatively large portions of income from earnings (rank 4 and 6, respectively, among Georgia’s MSAs), and significant portions of their income come from dividends, interest, and rent (rank 8 and 5, respectively). Relatively small portions come from current transfer payments. In contrast, Rome’s current transfer payments supply the second highest portion of income among Georgia’s MSAs, and the portion of income derived from earnings ranks next to last. Columbus’s large government sector provides 36.1 percent of earnings, and the manufacturing sector provides 11.1 percent. Finance and insurance provides 6.2 percent of earnings—the third highest portion among the state’s MSAs—and the percentage of earnings from the growing information sector is second in relative size only to Atlanta’s. Columbus’s professional and technical services sector pro-vides almost 5.2 percent of earnings, also a relatively large portion among metropolitan statistical areas. The relative increase of government sector earnings and of the earnings derived from health care, social assistance, and accommoda-tion, food services and entertainment are the most striking changes since 2001. The area’s PCPI ranks fifth in the state, but the 2006 average unemployment level of 5.3 percent (Georgia part only) is fourth highest among Georgia’s MSAs. A relatively large portion of income in Columbus comes from property income (ranks fourth in the state). Columbus ranks tenth among Georgia’s metropolitan areas in the relative size of income derived from earnings, and eighth in income from transfer payments. Like Columbus, Augusta’s government sector provides a relatively large—28.5 percent—portion of earnings. Manu-facturing provides nearly 13 percent of earnings, and admin-istrative and waste services, by far the largest among MSAs, total nearly 11.4 percent of earnings. Augusta’s distribution of earnings has remained relatively stable since 2001, with the drop in manufacturing earnings, and a relatively large increase in earnings derived from government jobs and healthcare notable exceptions. The MSA’s PCPI ranks ninth among the state’s 15 metropolitan areas. Augusta’s Columbia County, however, has one of the state’s highest per capita personal incomes. Conversely, the Georgia part of the MSA had the
highest unemployment rate among the state’s metropolitan areas in 2006. The Augusta MSA has the fifth largest portion of income supplied by transfer payments, and ranks ninth among the 15 MSAs in the percentage of income derived from earnings and dividends, interest, and rent. In Brunswick and Valdosta, a relatively large portion of earnings is derived from government employment (27.6 percent in Brunswick and 34.7 percent in Valdosta), and the rest of earnings comes from a diverse set of industries, with manufacturing, retail, and health care providing from 12 percent to 8 percent of earnings each, and the smaller sectors supplying the rest. Valdosta’s PCPI ranks fourteenth among the metropolitan areas in Georgia, up one spot from the previous year. Relatively small percentages of income in Valdosta come from earnings and dividends and rent. Transfer payments, on the other hand, provide the third largest por-tion of income, compared to other metropolitan areas in the state. As is typical for an area in which government is the major employer, Valdosta’s unemployment rate stays well below the state average. The unemployment rate stayed at 3.9 percent in 2005 and in 2006, but dropped to 3.8 percent between January and September of 2007. The low unem-ployment rate and high percentage of income derived from current transfer payments may be due to the large group of government retirees residing in the area. Brunswick, the capital of the Golden Isles, derives over 9 percent of earnings from the accommodations and food services sector, by far the highest proportion among metropolitan areas in Georgia. In 2005, the area’s construc-tion sector provided over 7 percent of the area’s non-farm earnings, the second highest portion among Georgia’s metro-politan areas. Brunswick has the fourth highest PCPI among Georgia’s MSAs, but, compared to other areas, derives the smallest portion of income from earnings. Property-based income (dividends, interest, and rent) provides the highest proportion of personal income in Brunswick, compared to other metropolitan areas in the state. The portion of income derived from transfer payments is also relatively high, however. The unemployment rate in the Brunswick MSA is relatively low (4 percent average in 2006). While the PCPI in Brantley and McIntosh counties is below the state—and even non-metropolitan area—average, per capita income in Glynn County is among the highest in Georgia.
Georgia Business and Economic Conditions
16
17
______ copy of The Multicultural Economy 2007 @ $125
ORDER FORM
Georgia residents ADD your applicable county tax
Check enclosed
County tax rate x purchase price
TOTAL
Name
Address
City State ZIP
payable to Selig Center, UGA
Mail or fax to: Selig Center for Economic Growth, Terry College of Business The University of Georgia P.O. Box 1764 Athens, GA 30603-1764
Phone (706) 425-2961 FAX (706) 425-2965
VISA MasterCard❏ ❏ ❏
Credit Card Number Expiration Date
Name on Card
Phone
American Express
❏
First Quarter 2008